
2025-09-12
Informational purposes only. The content in this report, including allocations, analysis, and commentary, is provided solely for informational and educational purposes. It does not constitute financial advice, investment advice, trading advice, or any other type of advice. Past performance does not guarantee future results. Always conduct your own research and consult a qualified financial professional before making investment decisions.
Weekly Allocation
| Ticker | Category | Weight | Role |
|---|---|---|---|
| FBTC | 50% | Overlay | |
| COPX | Industrial Metals | 10% | Top-2 (10%) |
| AIQ | AI | 10% | Top-2 (10%) |
| GLD | Precious Metals | 5% | Tier-2 (5%) |
| URNM | Nuclear Energy | 5% | Tier-2 (5%) |
| CIBR | Technology | 5% | Tier-2 (5%) |
| PAVE | Utilities & Infrastructure | 5% | Tier-2 (5%) |
| XAR | Defense & Aerospace | 5% | Tier-2 (5%) |
| ILF | Emerging Markets | 5% | Tier-2 (5%) |
Trade Instructions — Monday Open
Sell the tranche from 2025-08-15 (completing its 4-week hold). Buy the new tranche. Instructions show net portfolio changes — same-asset positions cancel, weight changes show the delta.
| Action | Ticker | Instruction |
|---|---|---|
| SELL | NLR | Sell entire NLR position (2.50% of portfolio) |
| SELL | BOTZ | Sell entire BOTZ position (1.25% of portfolio) |
| SELL | IGF | Sell 33% of IGF position (reduce 3.75% → 2.50%) |
| SELL | GDX | Sell 50% of GDX position (reduce 2.50% → 1.25%) |
| SELL | ITA | Sell 50% of ITA position (reduce 2.50% → 1.25%) |
| SELL | XLK | Sell 33% of XLK position (reduce 3.75% → 2.50%) |
| SELL | MOO | Sell entire MOO position (1.25% of portfolio) |
| BUY | URNM | Buy URNM — 12.50% of freed cash (adds 1.25% to portfolio) |
| BUY | GLD | Buy GLD — 12.50% of freed cash (adds 1.25% to portfolio) |
| BUY | AIQ | Buy AIQ — 25.00% of freed cash (adds 2.50% to portfolio) |
| BUY | XAR | Buy XAR — 12.50% of freed cash (adds 1.25% to portfolio) |
| BUY | PAVE | Buy PAVE — 12.50% of freed cash (adds 1.25% to portfolio) |
| BUY | CIBR | Buy CIBR — 12.50% of freed cash (adds 1.25% to portfolio) |
| BUY | ILF | Buy ILF — 12.50% of freed cash (adds 1.25% to portfolio) |
Current Portfolio After Trade
Combined holdings across all 4 active tranches. Each tranche is 25% of the portfolio.
| Ticker | % of Portfolio | Weight Bar |
|---|---|---|
| FBTC | 50.00% | |
| COPX | 7.50% | |
| URNM | 6.25% | |
| GLD | 5.00% | |
| AIQ | 5.00% | |
| XLE | 3.75% | |
| XAR | 3.75% | |
| IGF | 2.50% | |
| XLK | 2.50% | |
| REMX | 2.50% | |
| PAVE | 2.50% | |
| CIBR | 2.50% | |
| ILF | 2.50% | |
| GDX | 1.25% | |
| ITA | 1.25% | |
| SMH | 1.25% |
Macro Regime — Transition / Mixed
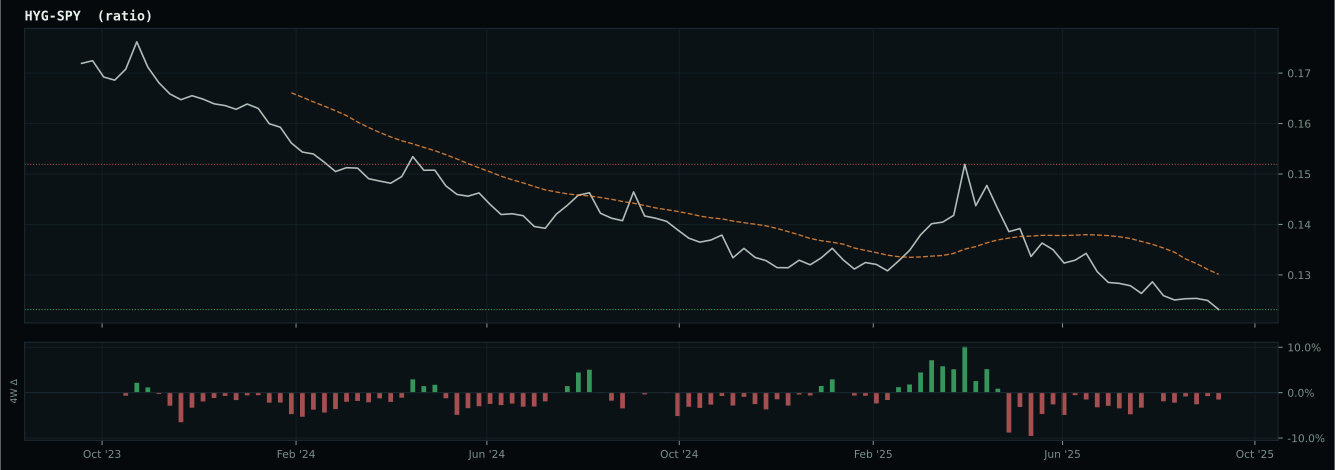
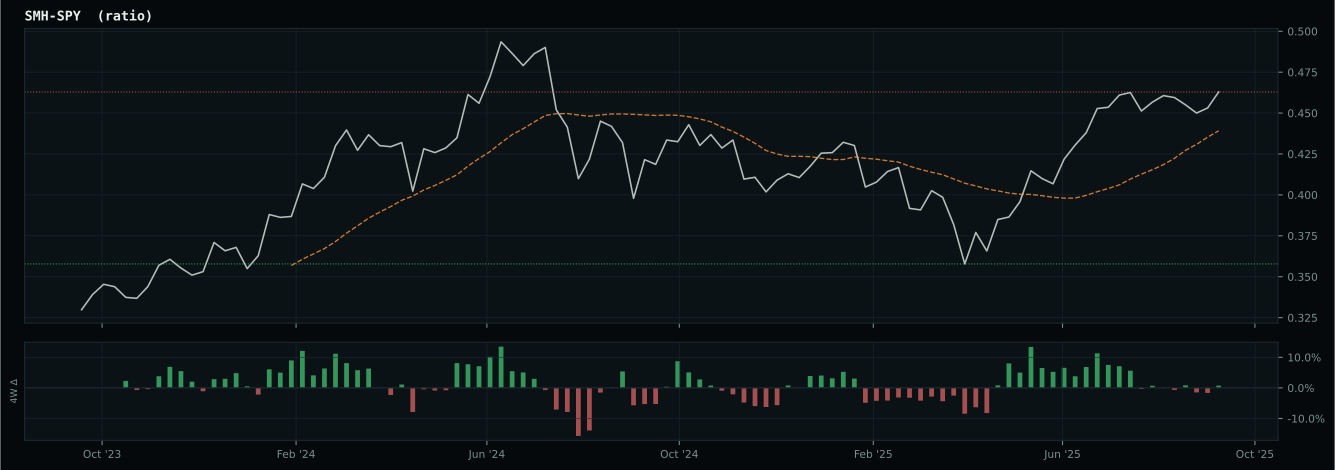
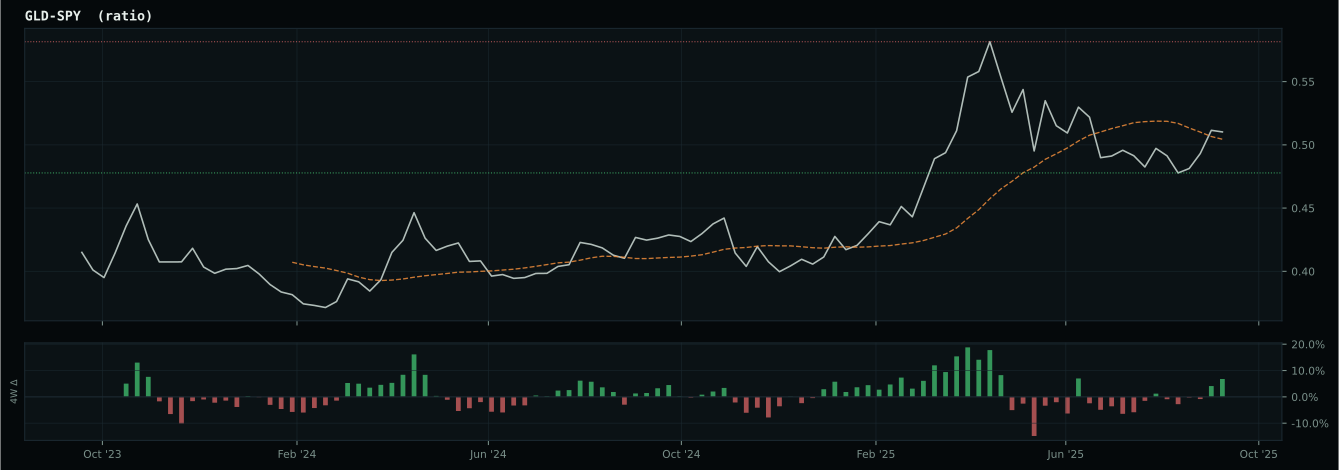
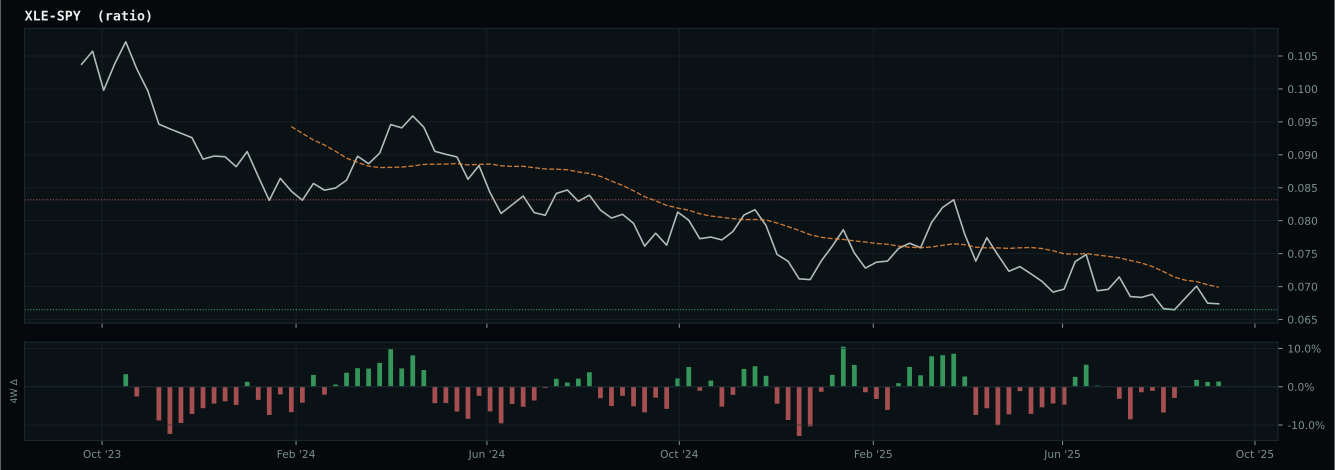
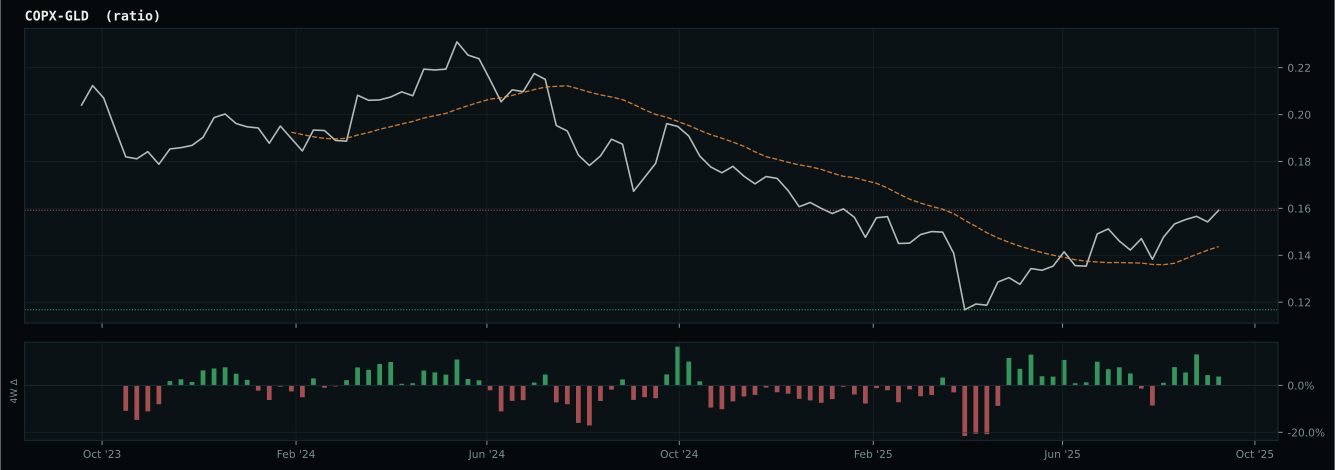
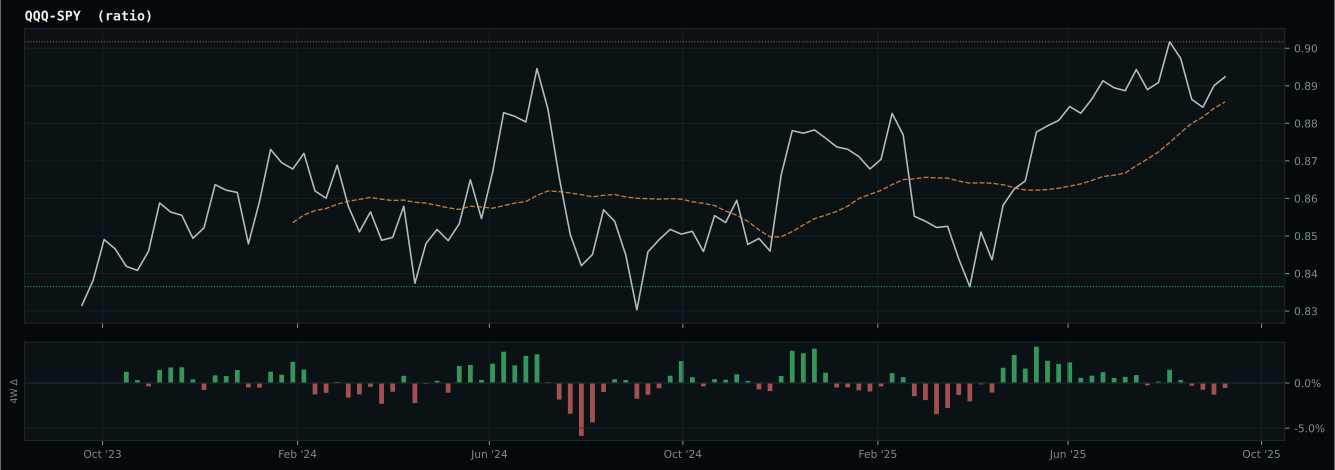
Macro Evidence Charts
Market-implied signals behind the macro regime scores. Each ratio compares two assets; the direction and slope of the ratio is what the macro engine reads.
Crypto Regime — TrendBTC
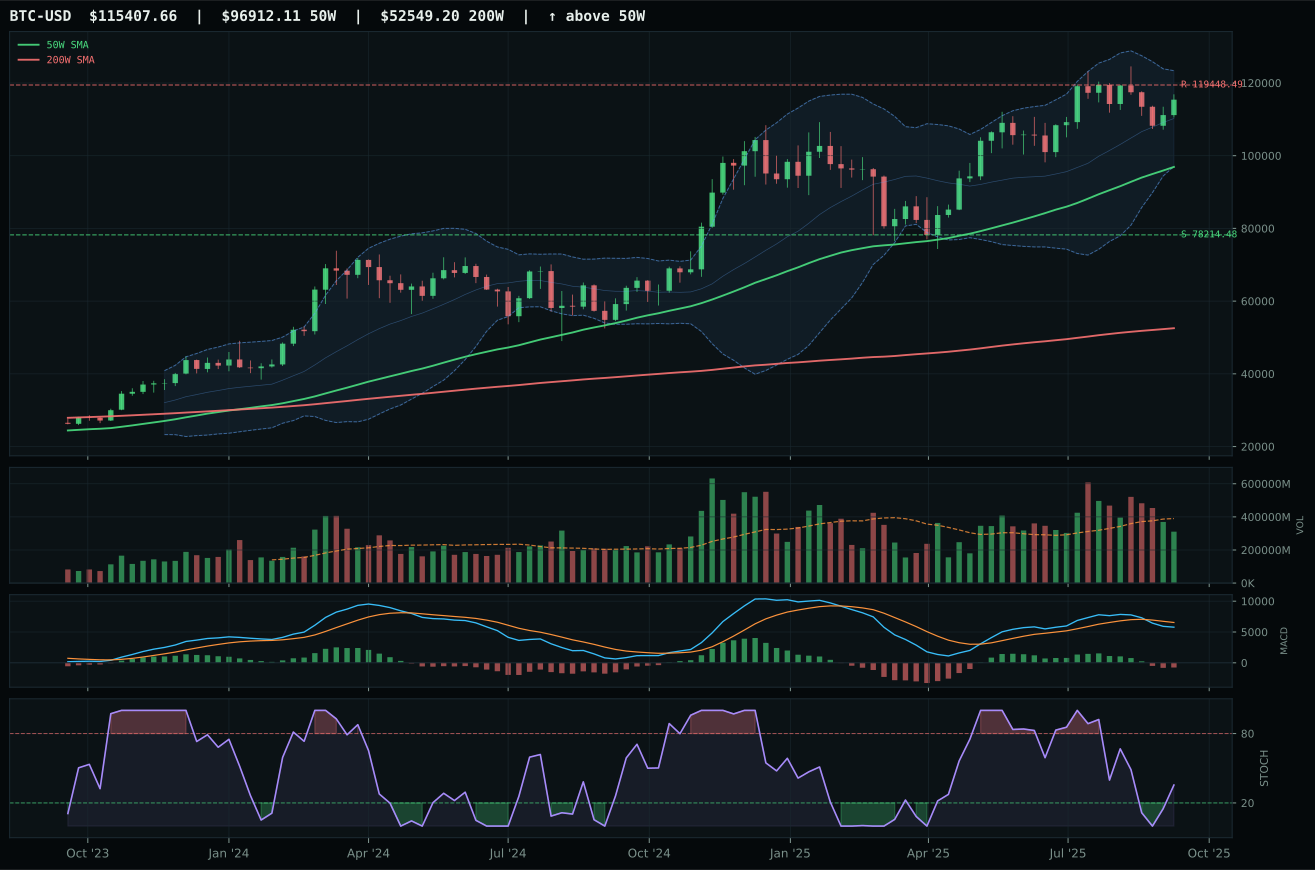
ValueBTC not armed: BTC has not made the first post-breakdown touch of the 200W buy zone after losing the 50W
TrendBTC confirmed: 2 consecutive closes above rising/flat 50W SMA
one or more available conditions failed
Category Rankings
| Rank | Category | Winner | Score | Alloc | 4W Ret | Peers (4W) |
|---|---|---|---|---|---|---|
| 1 | Industrial Metals | COPX | 70.2 | 20% | +18.42% | REMX +25.0% · PICK +8.2% |
| 2 | AI | AIQ | 62.6 | 20% | +5.46% | SMH +11.1% · BOTZ +6.8% |
| 3 | Precious Metals | GLD | 59.8 | 10% | +11.95% | GDX +12.7% · SLV +22.6% |
| 4 | Nuclear Energy | URNM | 57.9 | 10% | +22.35% | URA +29.3% · NLR +23.9% |
| 5 | Technology | CIBR | 53.7 | 10% | +2.29% | XLK +4.9% · IGV +1.0% |
| 6 | Utilities & Infrastructure | PAVE | 52.3 | 10% | +0.36% | XLU +5.6% · IGF +0.2% |
| 7 | Defense & Aerospace | XAR | 50.3 | 10% | +8.73% | ITA +4.0% · ROKT +8.2% |
| 8 | Emerging Markets | ILF | 41.1 | 10% | -1.64% | IEMG +1.3% · INDA -0.7% |
| 9 | Traditional Energy | XLE | 28.1 | 0% | -3.27% | XOP -3.1% · FCG -4.1% |
| 10 | Agriculture & Livestock | MOO | 24.8 | 0% | -3.94% | VEGI -4.2% · WEAT -5.0% |
Industrial Metals — COPX
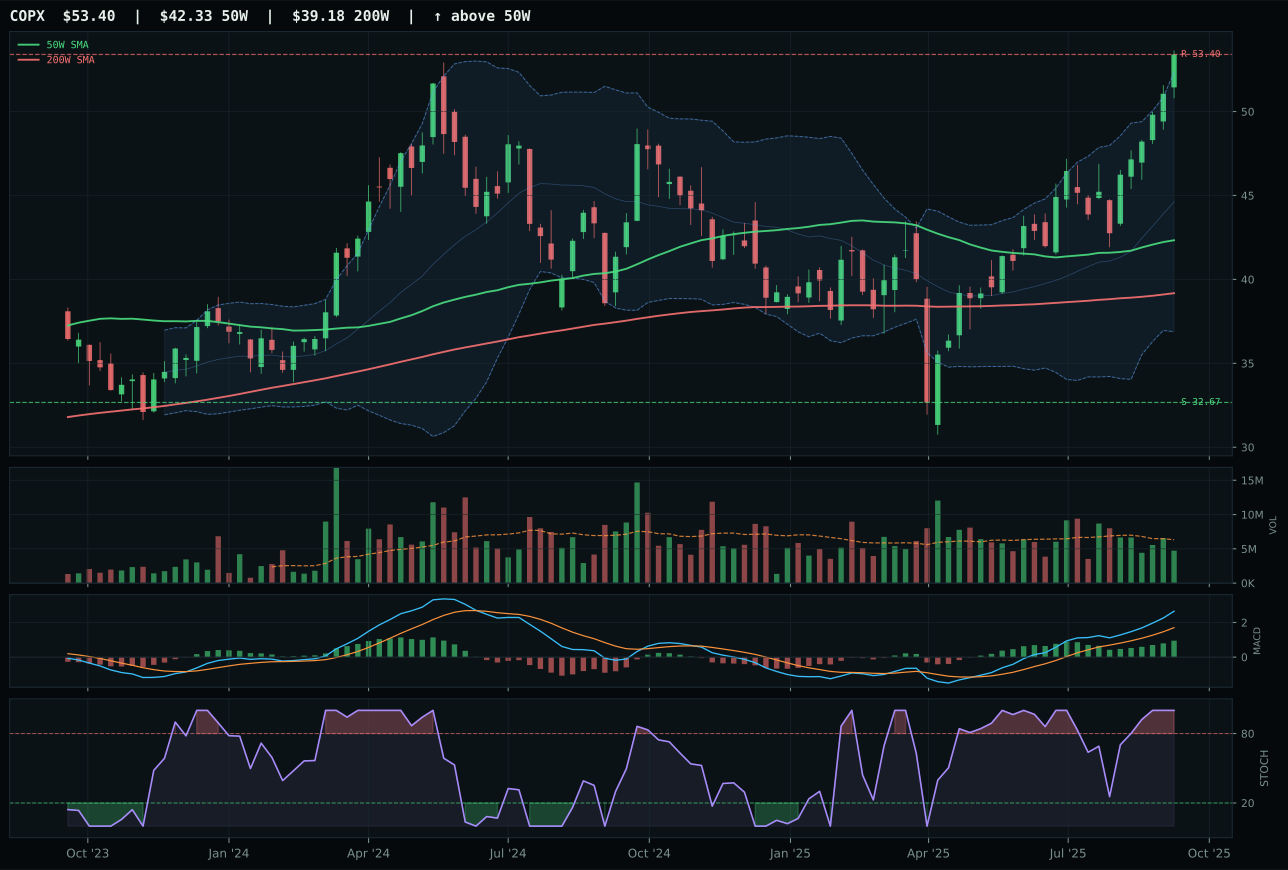
COPX has a vertical extension profile with 14.4% 13-week relative strength versus SPY.
A failed hold above support would weaken the setup.
Actionable but governed by invalidation levels.
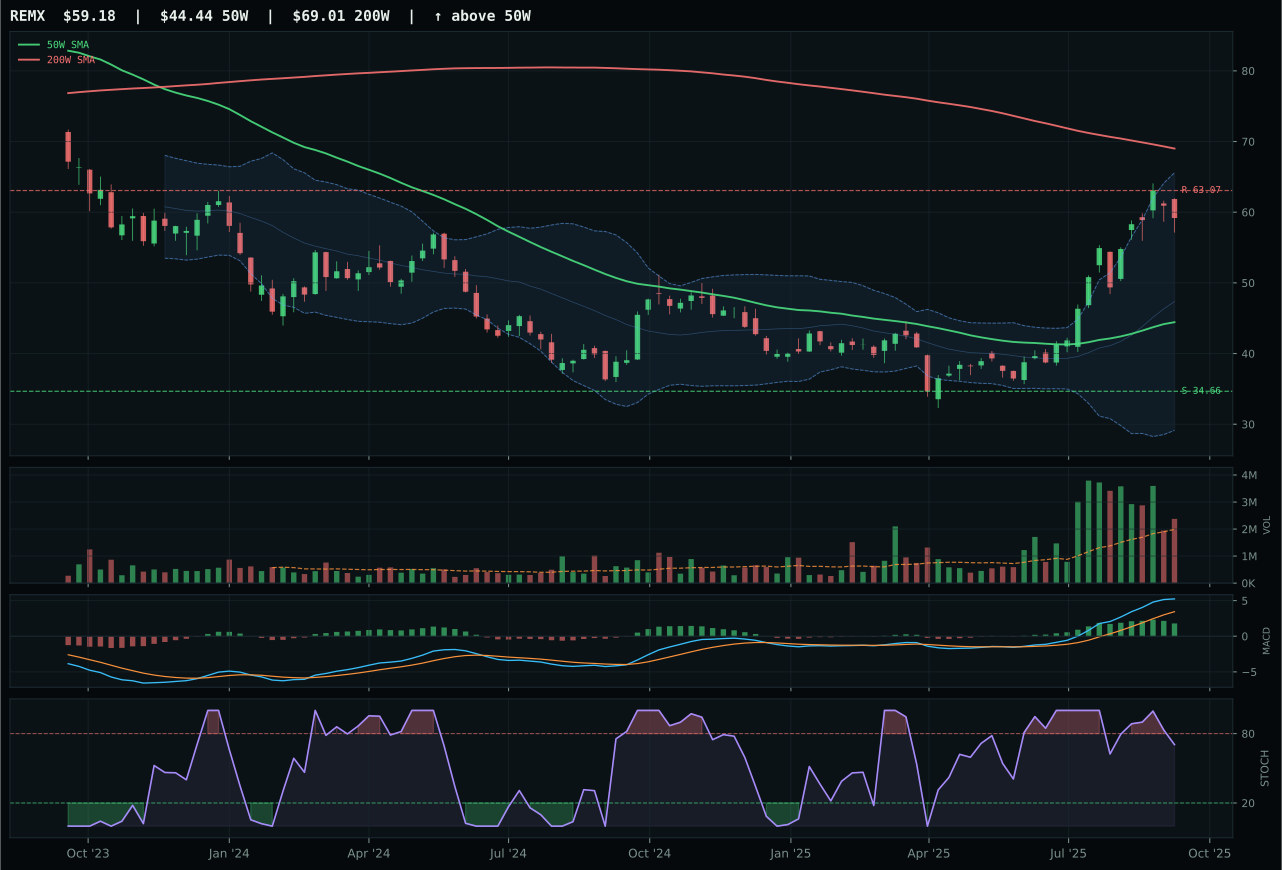
REMX has a vertical extension profile with 39.2% 13-week relative strength versus SPY.
A failed hold above support would weaken the setup.
Actionable but governed by invalidation levels.
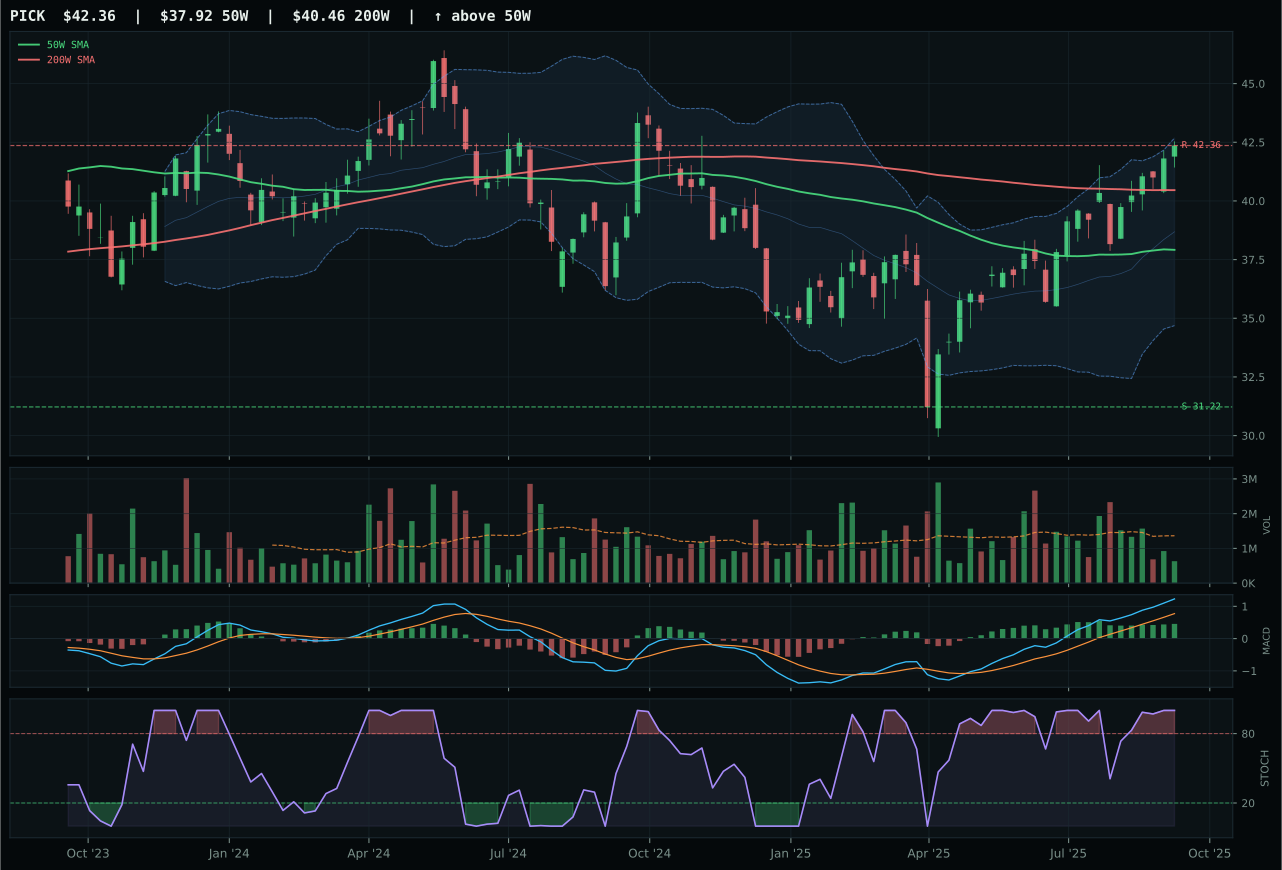
PICK has a neutral structure profile with 3.0% 13-week relative strength versus SPY.
A failed hold above support would weaken the setup.
Actionable but governed by invalidation levels.
COPX wins a decisive 4.6-point victory over REMX by delivering superior trend confirmation and MACD quality despite REMX's vastly superior 13W return and SPY-relative performance (49.3% and 39.2% versus 24.5% and 14.4%). The decision hinges on one technical inflection: COPX's MACD is bullish and improving while REMX's is bullish but flattening, and at the extremes of overbought momentum (both near 1.00 stochastic RSI), that MACD divergence signals which move has authentic sponsor energy. COPX's 100.0 momentum confirmation score and 100.0 trend score reflect a setup where every indicator is aligned without fatigue, whereas REMX's falling/neutral stochastic RSI despite its extreme 13W return indicates technical deterioration masquerading as strength. COPX's extension at 26.1% from the 50W is tighter than REMX's 33.2%, meaning entry risk is lower. Volume tells the story: COPX's thin 0.75x participation suggests selective institutional buying into strength, while REMX's above-average 0.86x volume suggests the move has attracted retail and passive flows. In a metals category driven by scarcity narratives, COPX's copper-specific thesis (industrial demand, supply constraints) is more durable than REMX's rare-earth volatility.
Industrial Metals ranks as the second-highest category at 70.2 and earns a full 10% top-2 allocation, reflecting both robust technical scores and strong macro tailwinds. The 65.0 category-level macro fit is the highest in the portfolio outside of crypto, driven by active descriptors: metals scarcity at +14, commodity breadth positive at +10, and real asset sponsorship at +6 all aligned in a Transition/Mixed regime that is currently risk-on. COPX's 58.2 technical evidence combined with 62.0 macro fit creates a compound case for overweight exposure: the trend is intact (100.0), momentum is undiminishing (100.0), and the category narrative (industrial cycle renewal, EV transition, supply constraints) has macro conviction behind it. The thin volume participation at 0.75x the 20W average is a warning flag, not a disqualifier—it suggests that COPX's move has not yet attracted the full institutional complex, which offers optionality if liquidity stress eases. The 10% allocation reflects conviction that this category will outperform in a regime where real assets are in structural demand. For this allocation to compress, either metals scarcity descriptor would need to reverse (signaling supply fears are overblown) or credit stress would need to activate sharply (signaling demand destruction).
AI — AIQ
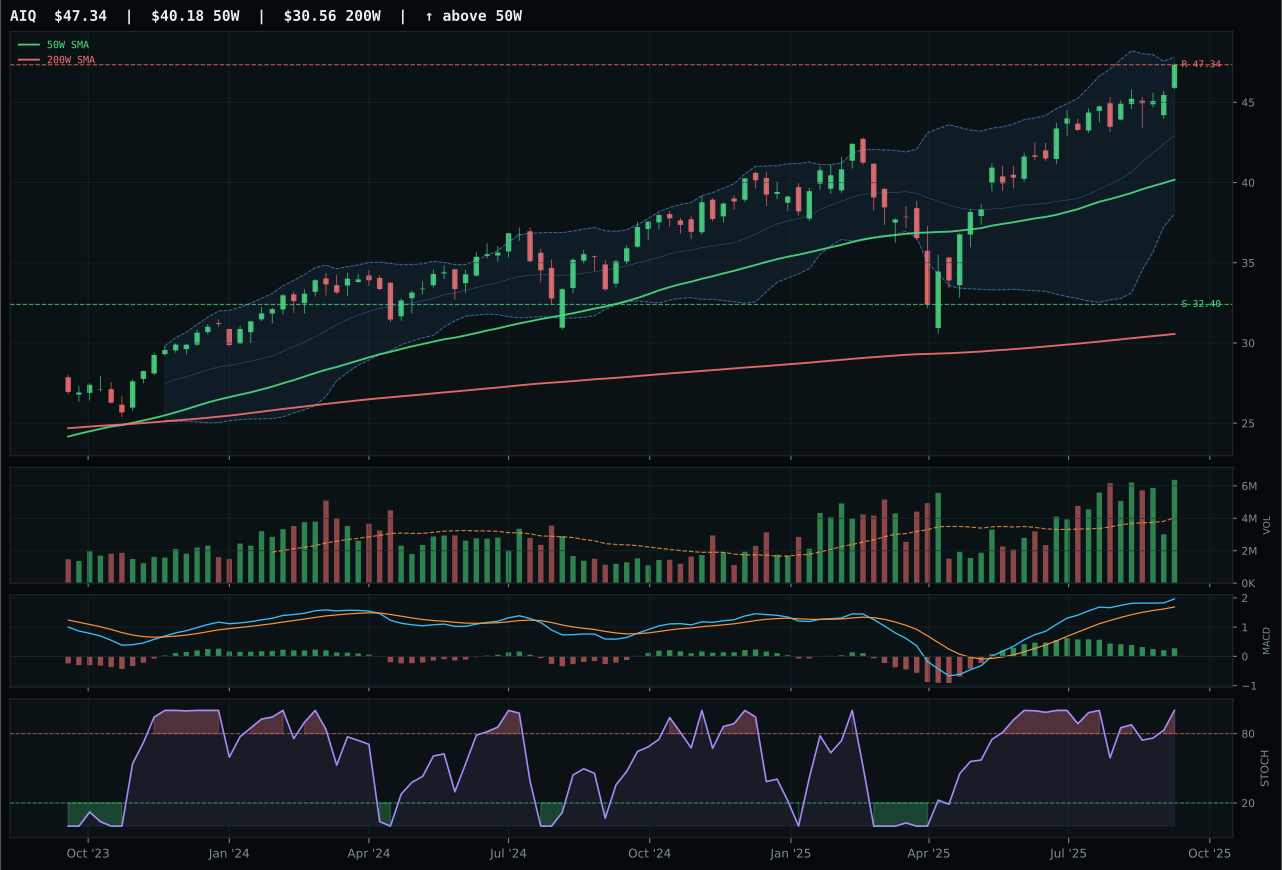
AIQ has a vertical extension profile with 3.7% 13-week relative strength versus SPY.
A failed hold above support would weaken the setup.
Actionable but governed by invalidation levels.
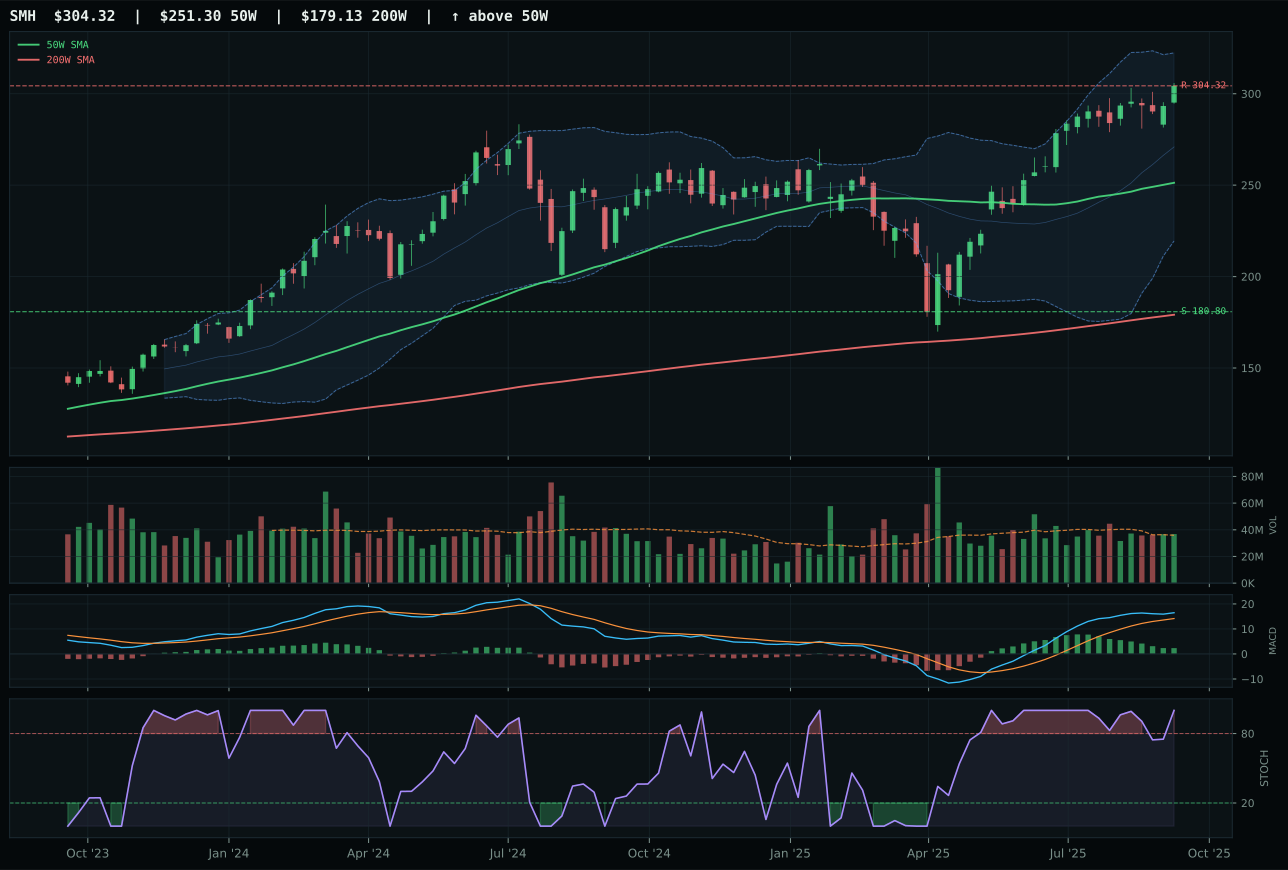
SMH has a vertical extension profile with 8.3% 13-week relative strength versus SPY.
A failed hold above support would weaken the setup.
Actionable but governed by invalidation levels.
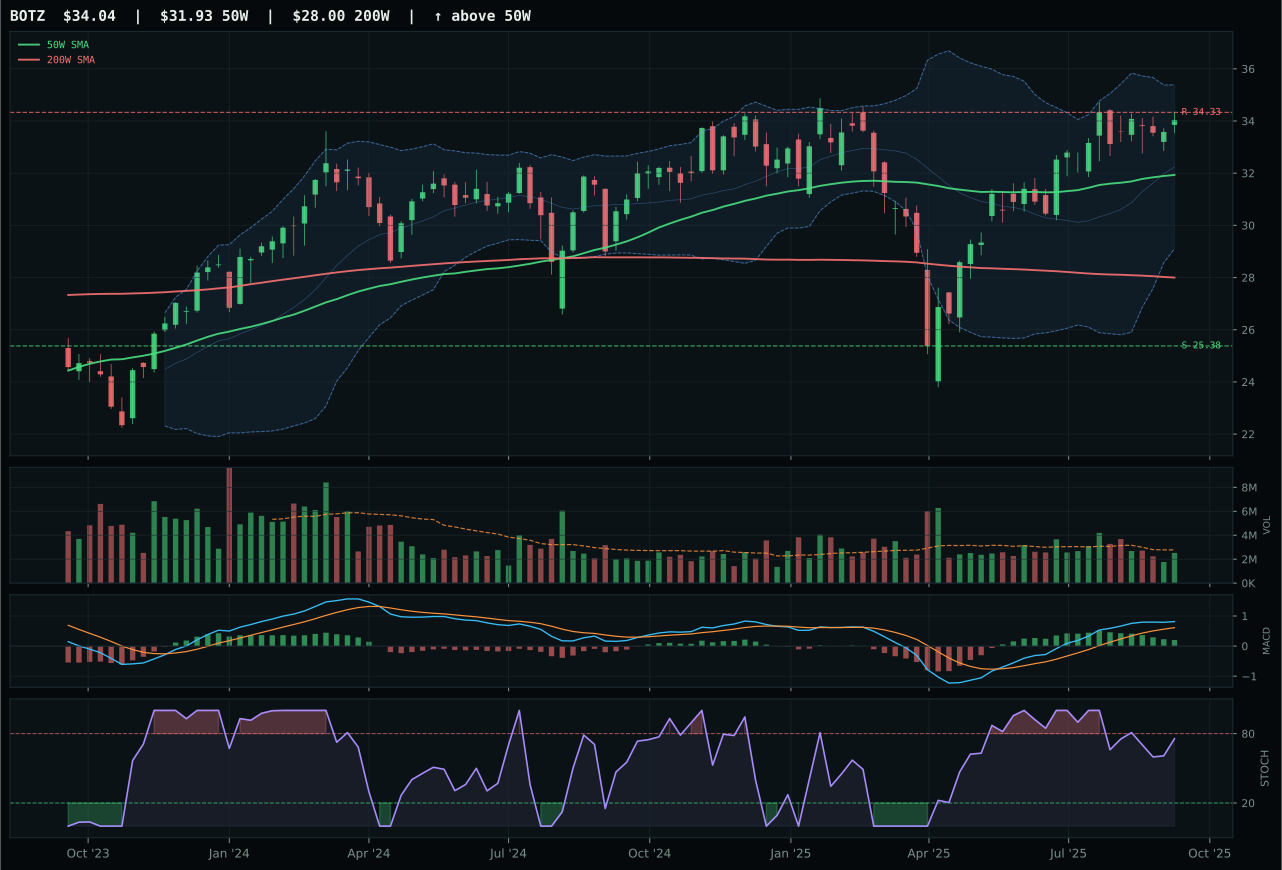
BOTZ has a neutral structure profile with 0.0% 13-week relative strength versus SPY.
A failed hold above support would weaken the setup.
Actionable but governed by invalidation levels.
AIQ wins a near-identical decision over SMH (0.1-point gap) by delivering superior risk/reward and volume confirmation despite SMH's superior 13W return at 18.4% versus 13.8%. Price is 17.8% extended above the 50W with perfect trend scoring at 100.0, but the setup is penalized for timing: MACD bullish but flattening and stochastic RSI overbought at 1.00 signal late-stage momentum. AIQ's accumulation/confirmation volume at 1.58x the 20W average beats SMH's neutral participation, and that sponsorship translates to a 45.1 risk/reward score versus 39.1—meaning downside to support is manageable at 46.1% rather than SMH's more exposed 39.1%. Category-relative strength at 0.0% matches perfectly, but AIQ's cleaner 86.4 structure score and superior volume-price confirmation (82.3 vs 73) reveal which buying is real. SMH's compute and semiconductor leadership carries higher macro tailwinds (AI growth sponsorship +14 vs +10), but technical execution at the margin goes to the ETF with institutional accumulation.
AI ranks among the portfolio's two highest category scores at 62.6, earning 10% allocation as a top-2 overweight in a regime where risk appetite positive and AI growth sponsorship are both actively supporting equities. This positioning reflects not euphoric momentum but rather deterministic technical evidence: AIQ's 85.1 technical score combined with 54.0 category-level macro fit creates an asymmetry where the 3/2/1 weighted basket (AIQ/SMH/BOTZ at 69.3 base) retests above 62.6 after quality and persistence filters. The vertical extension and overbought momentum readings are real timing risks, but the Transition/Mixed macro state is permissive enough to tolerate near-term pullback risk in favor of the longer-term sponsorship profile. Liquidity stress and credit stress remain headwinds, but their aggregate negative impact (-12 and -8 respectively) is outweighed by the structural tailwind from AI growth (+14) and risk appetite (+10). This allocation will compress if macro descriptors shift toward tighter liquidity or broader credit stress.
Precious Metals — GLD
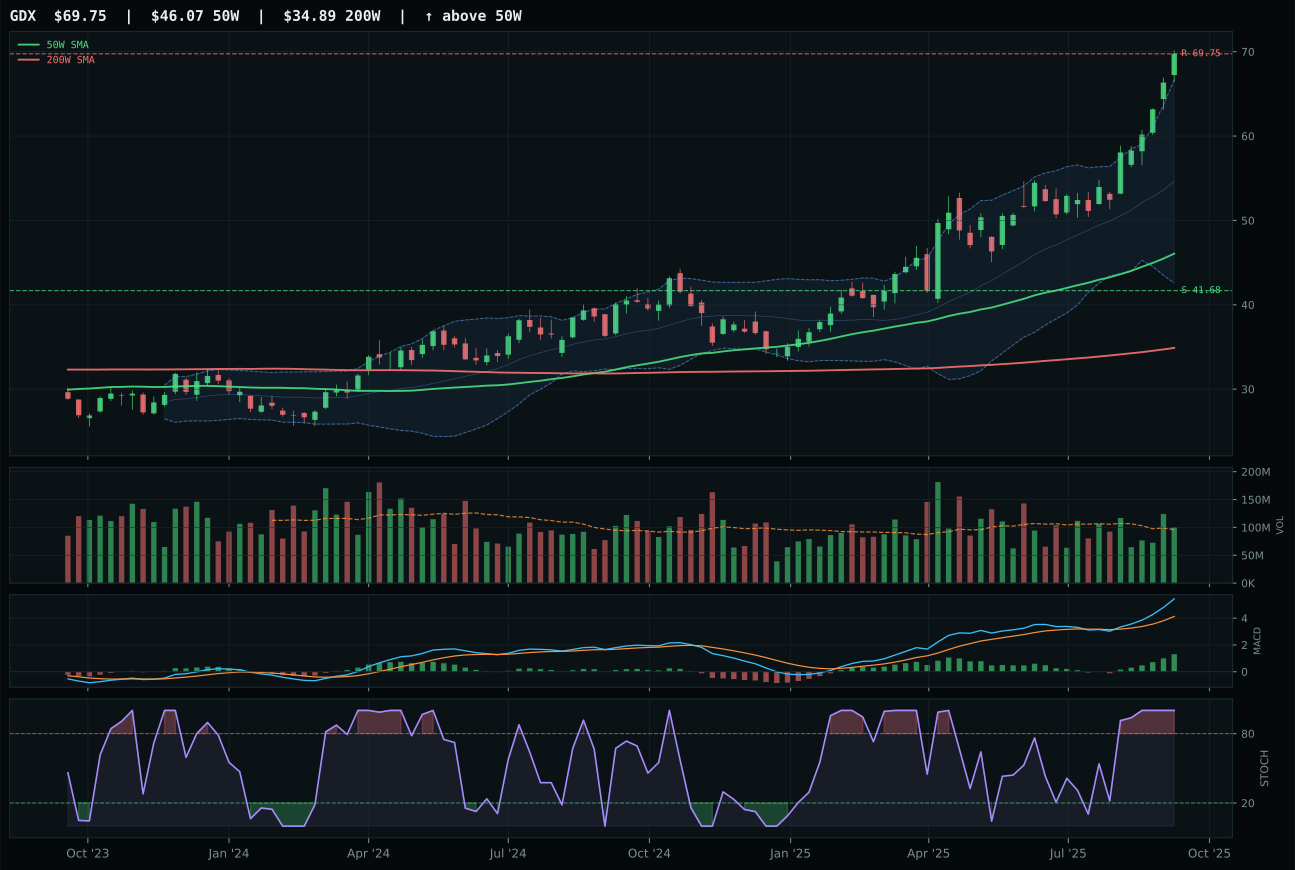
GDX has a vertical extension profile with 18.0% 13-week relative strength versus SPY.
A failed hold above support would weaken the setup.
Actionable but governed by invalidation levels.
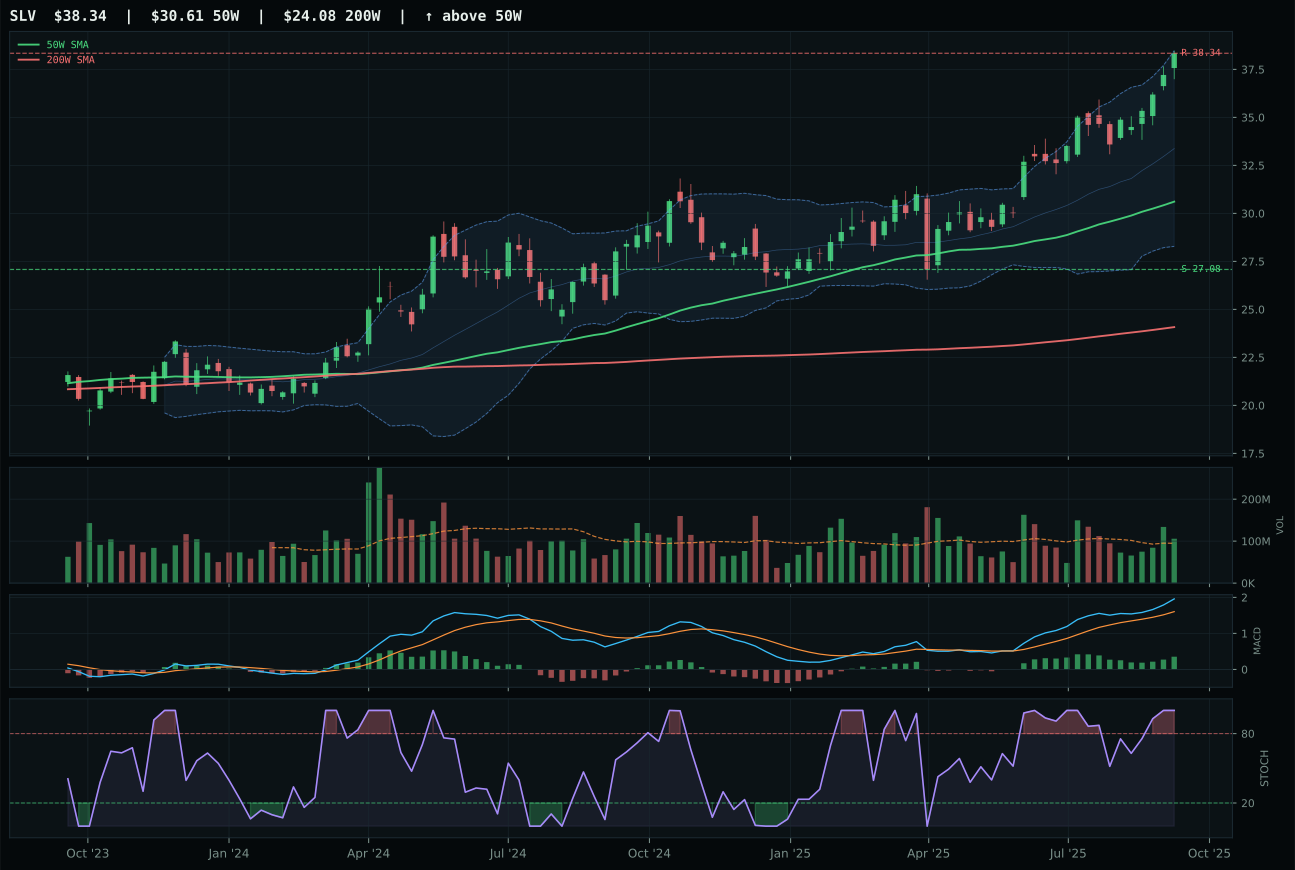
SLV has a vertical extension profile with 6.2% 13-week relative strength versus SPY.
A failed hold above support would weaken the setup.
Actionable but governed by invalidation levels.
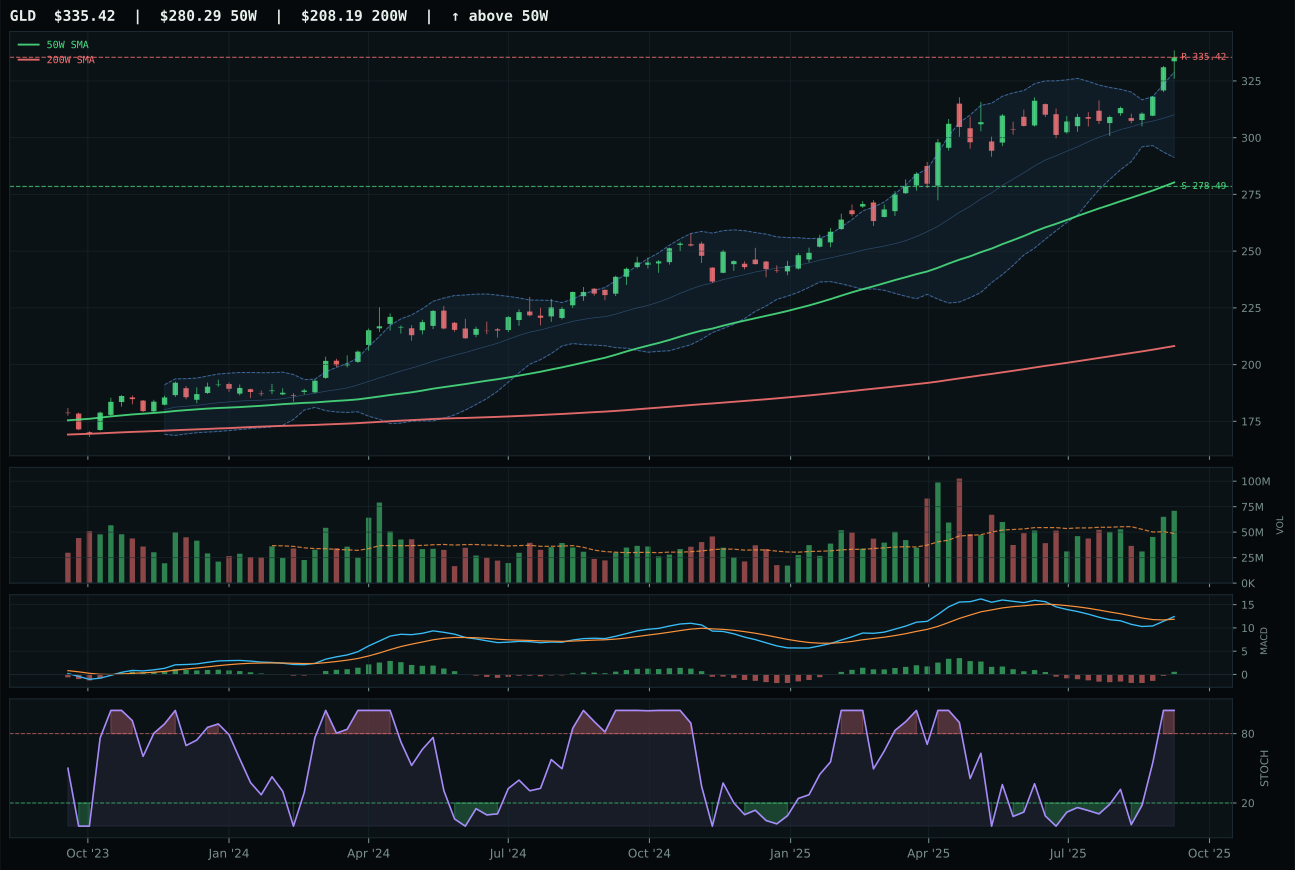
GLD has a vertical extension profile with -4.1% 13-week relative strength versus SPY.
A failed hold above support would weaken the setup.
Actionable but governed by invalidation levels.
GLD wins over GDX by a 1.7-point gap that reflects timing and volume discipline rather than momentum intensity. Both sit in vertical extension near 52W highs with bullish-and-improving MACD and overbought stochastic RSI, but GLD's 19.7% extension is tighter than GDX's brutal 51.4% stretch, which penalizes GDX immediately for entry risk. GLD's 44.0 risk/reward score reflects 0.0% upside to resistance but a manageable 20.4% downside cushion, while GDX's 39.1 risk/reward blows that cushion to 41.68/69.75 support, meaning downside exposure is nearly 2x wider. The critical technical differentiator is volume: GLD's above-average participation at 1.45x the 20W average indicates institutional accumulation even into the extension, whereas GDX's neutral volume suggests passive momentum with no fresh buying. GLD's 13W return of 6.0% trails GDX's 28.1%, but that relative underperformance actually becomes a feature—it means GLD has climbed with better sponsorship and less euphoria. Category-relative strength of -10.2% is a weakness, but it is a consistent weakness across both silver and gold, not a discriminator between them.
Precious Metals earns 5% allocation as a tier-2 holding in a macro regime where risk appetite positive is active but delivering a -4 descriptor impact, creating a damping effect on traditional hedges. The 59.8 category score reflects 70.1 technical evidence paired with 46.0 macro fit, which is a disconnect: technicals are strong (trend 93.9, structure 80.8) but macro narrative is weak. GLD's improving MACD and above-average volume participation suggest real institutional accumulation, not just passive hedging, which justifies holding the allocation despite the negative macro winds. The 19.7% extension from the 50W is manageable in the context of a 6.0% 13W return—meaning the climb has been gradual and supported—but it leaves little room for new buyers to enter at better prices. For Precious Metals to upgrade to top-2 status, the category would need to see credit stress or liquidity stress activate as serious descriptors (currently both are muted) or witness a sharp decline in extension with re-accumulation on the dip. Currently, the 5% slot reflects a tactical view that gold offers volatility protection in a mixed regime, but not yet conviction that the uptrend is accelerating.
Nuclear Energy — URNM
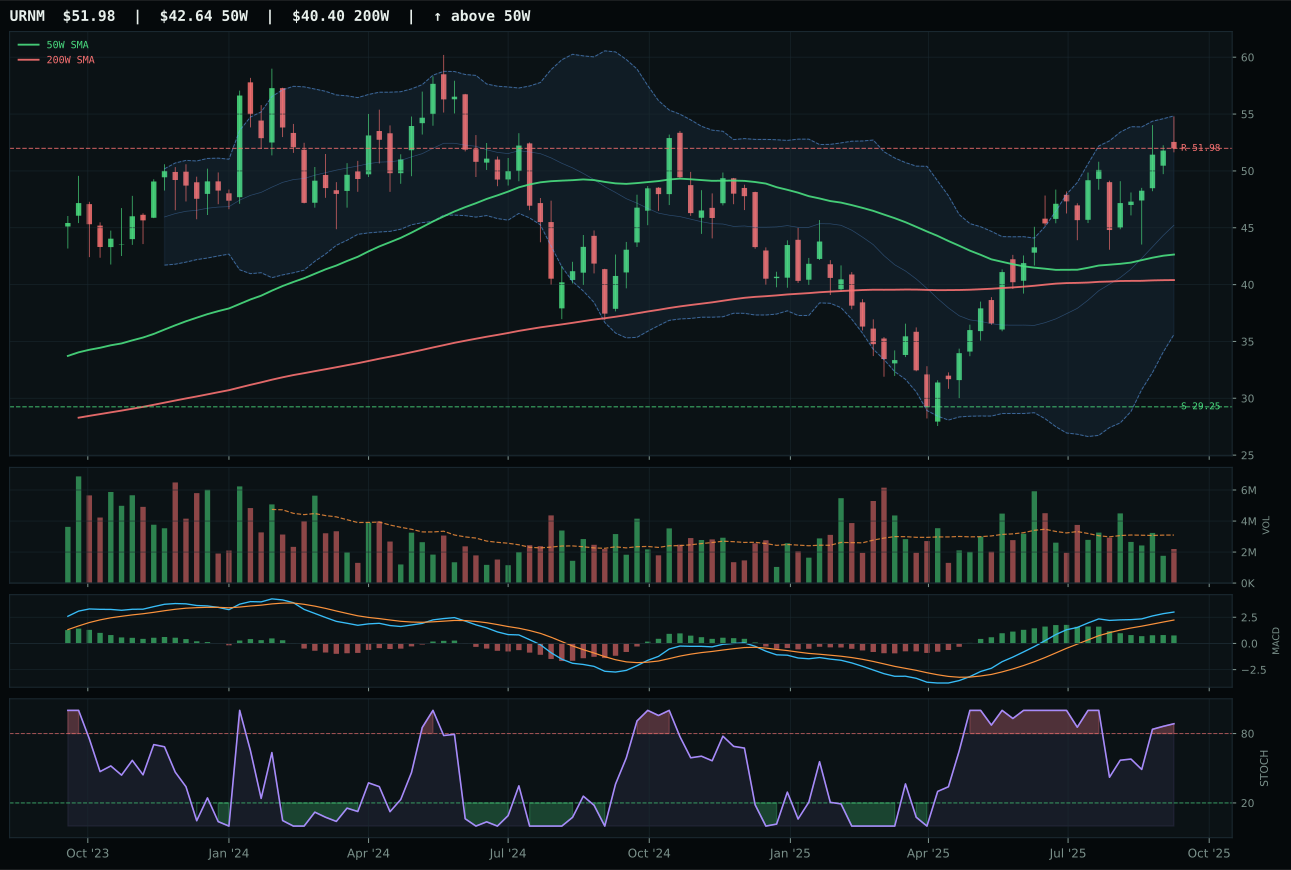
URNM has a vertical extension profile with 10.0% 13-week relative strength versus SPY.
A failed hold above support would weaken the setup.
Actionable but governed by invalidation levels.
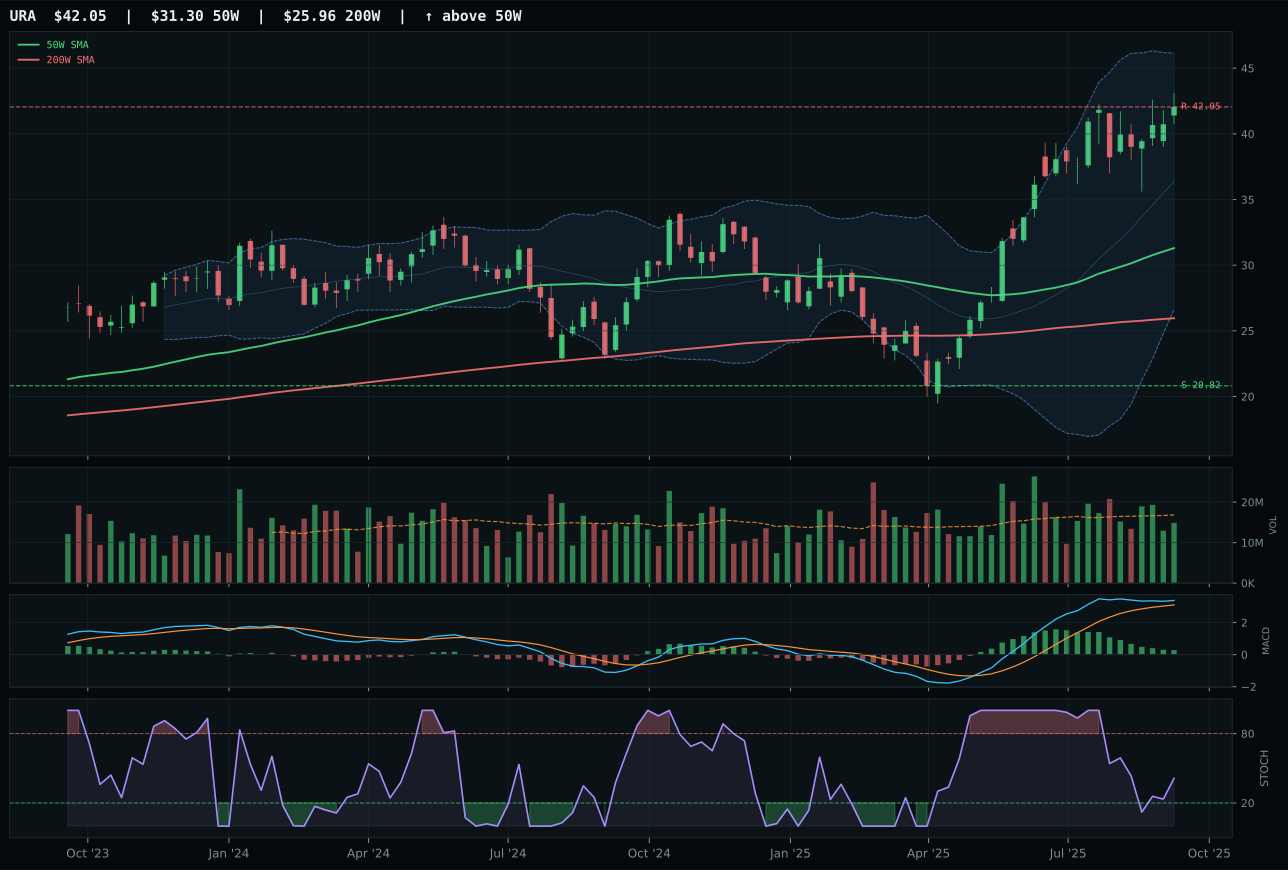
URA has a vertical extension profile with 6.3% 13-week relative strength versus SPY.
A failed hold above support would weaken the setup.
Actionable but governed by invalidation levels.
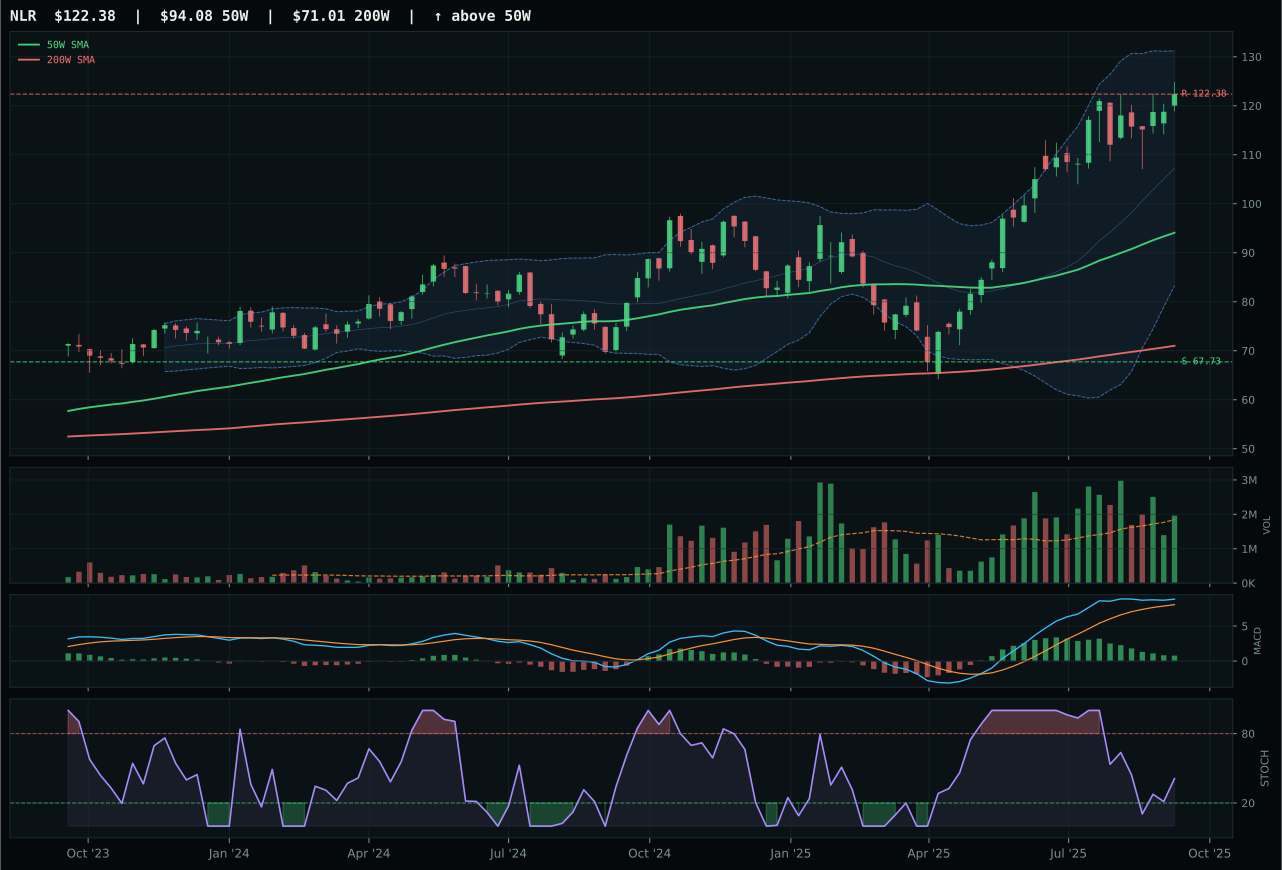
NLR has a vertical extension profile with 6.4% 13-week relative strength versus SPY.
A failed hold above support would weaken the setup.
Actionable but governed by invalidation levels.
URNM wins a decisive 8.4-point victory over URA by combining clean structure with sustainable momentum in a stretched market. Price is 21.9% above the 50W, which is extended but not extreme, and sits in the upper retracement/momentum zone of the Fibonacci sequence—a setup that can support further continuation if volume holds. URNM's 100.0 momentum confirmation score reflects a 20.1% 13W return paired with 3.6% category-relative strength and thin 0.71x volume participation, indicating that institutional buyers are present but selective. URA's 34.4% extension from the 50W is nearly 50% more stretched than URNM's, which immediately signals higher entry risk and lower asymmetry for new buyers. URNM's structure cleanliness at 83.3 exceeds URA's 73.0, reflecting fewer overhead resistance tests. Both have bullish-but-flattening MACD, but URNM's 76.3 structure score captures a tighter compression zone (64.1) that has more capacity for expansion before hitting overhead resistance at 51.98. The uranium-miner scarcity thesis is more explicitly captured in URNM's focused mandate than URA's broader ETF expression.
Nuclear Energy earns 5% allocation as a tier-2 holding in a macro regime where real asset sponsorship and AI growth sponsorship are both active tailwinds, though at modest levels (+7 and +5 respectively). The 57.9 category score reflects 59.0 technical evidence paired with 49.0 macro fit, creating a balanced case rather than a conviction overweight. URNM's 100.0 trend score and 100.0 momentum confirmation reveal clean technical setup, but the 40.0 timing score penalizes the 21.9% extension and overbought stochastic RSI—meaning entry risk is real and near-term volatility is likely. The 5% allocation reflects a tactical view that nuclear demand will remain supported by AI data-center load and decarbonization policy, even as near-term technicals show extension. Liquidity stress and credit stress are both active (-8 and -5 respectively), which constrains position sizing despite the narrative tailwind. For Nuclear Energy to upgrade to top-2 status, the category would need to either see URNM pull back to the 38–40 price zone with re-accumulation at better entry, or witness a marked improvement in the macro environment, specifically a reduction in liquidity stress. Currently, the thin volume at 0.71x suggests institutional buyers are present but cautious, which justifies a modest allocation without capitulating to full conviction.
Technology — CIBR
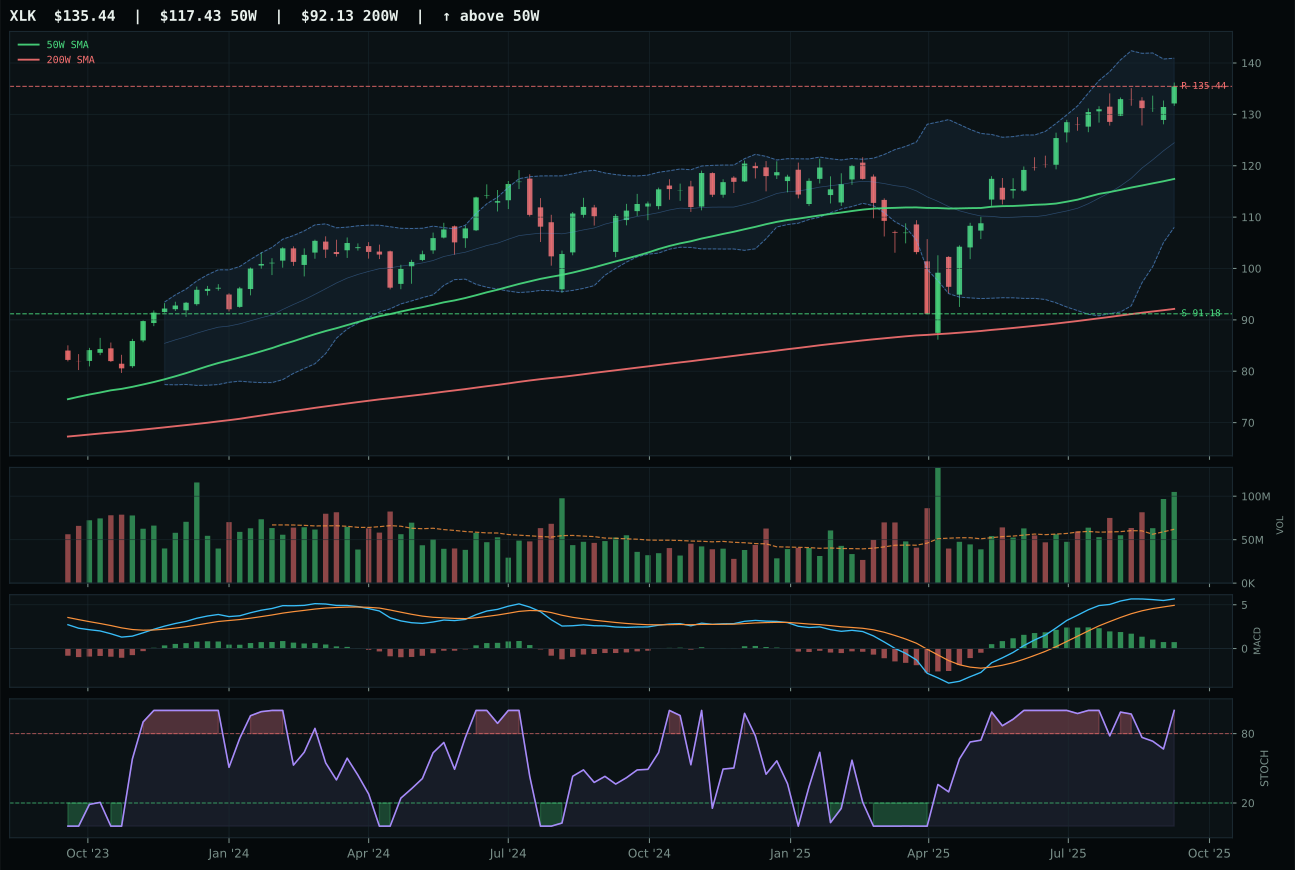
XLK has a vertical extension profile with 3.1% 13-week relative strength versus SPY.
A failed hold above support would weaken the setup.
Actionable but governed by invalidation levels.
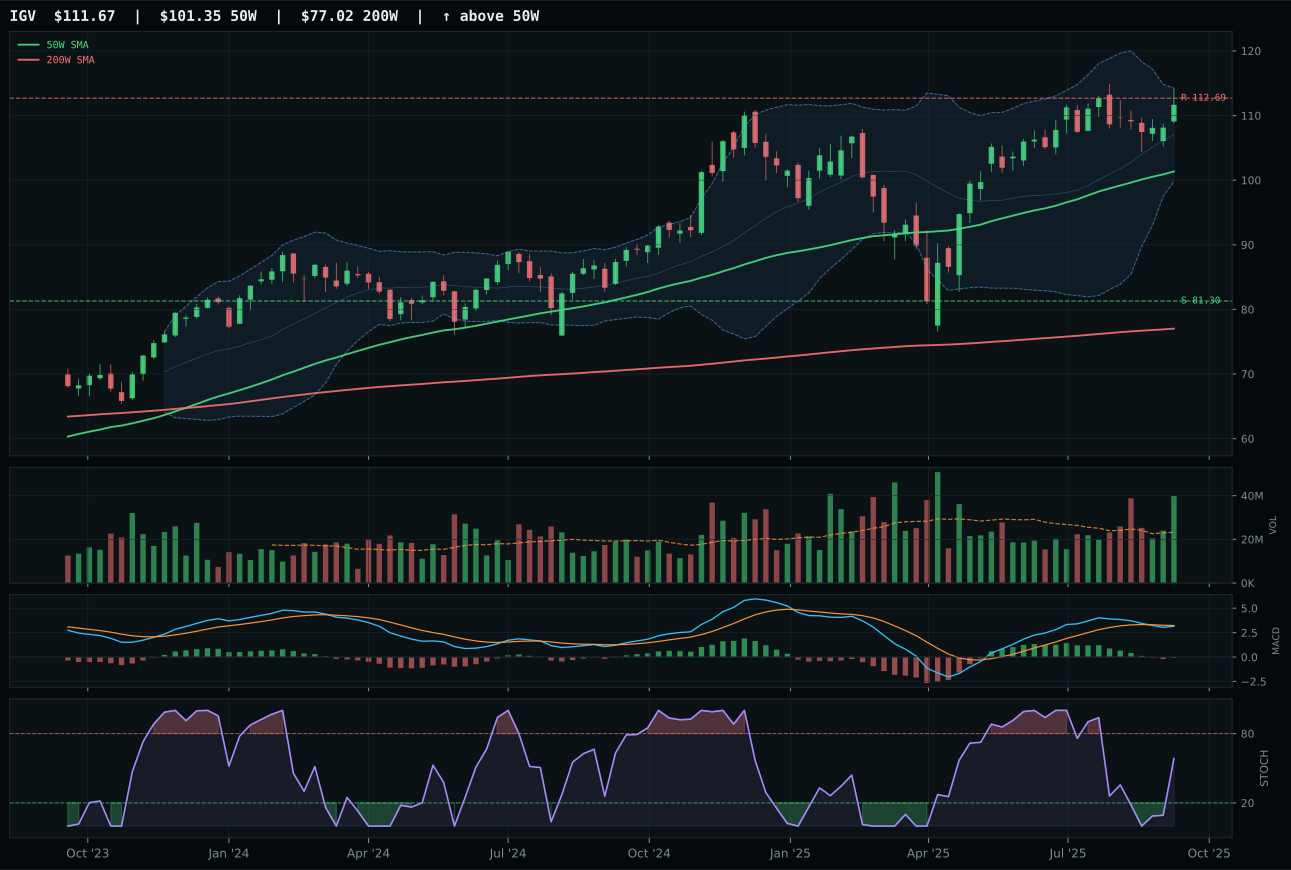
IGV has a neutral structure profile with -5.0% 13-week relative strength versus SPY.
A failed hold above support would weaken the setup.
Actionable but governed by invalidation levels.
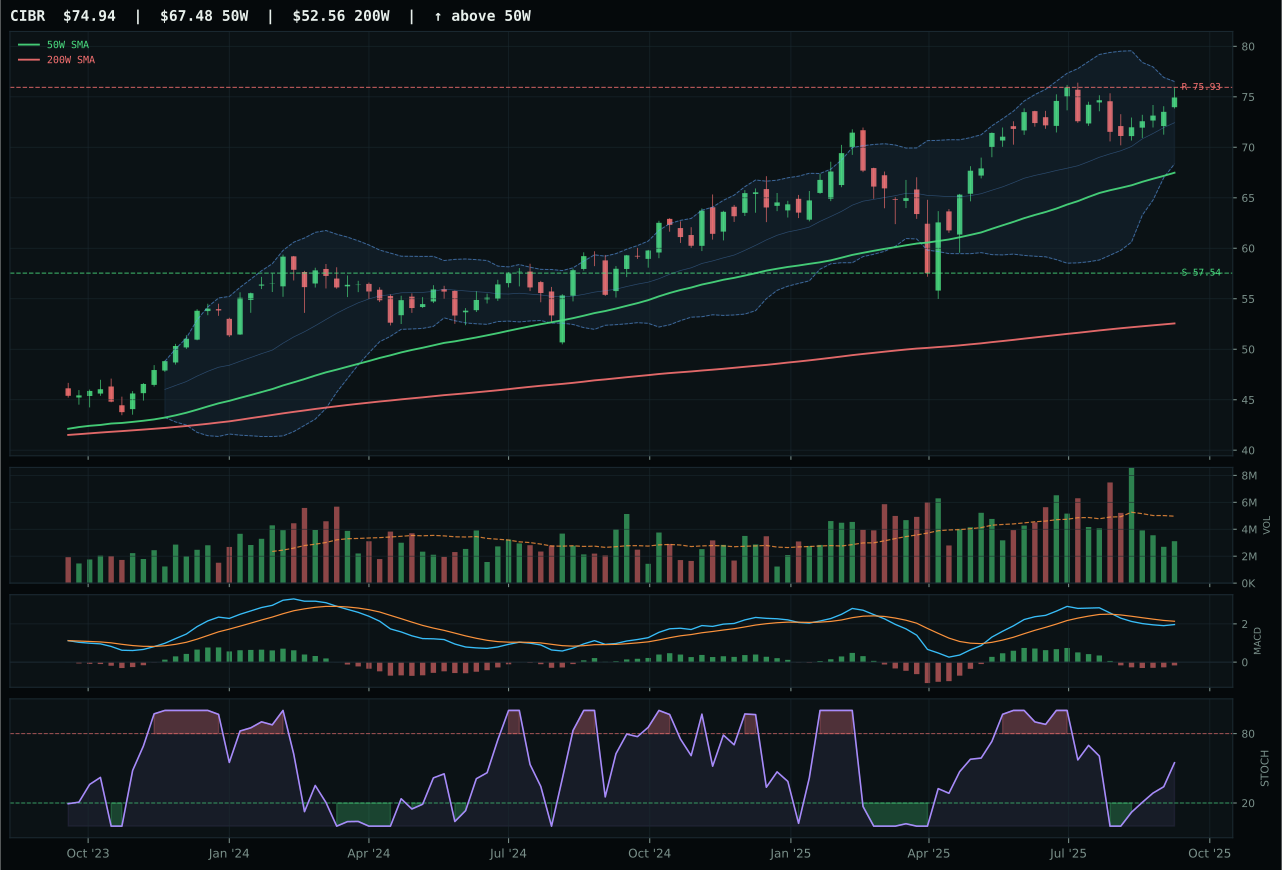
CIBR has a neutral structure profile with -6.6% 13-week relative strength versus SPY.
A failed hold above support would weaken the setup.
Actionable but governed by invalidation levels.
CIBR wins the category by defensive positioning rather than momentum strength. Price sits above both the 50W and 200W with a neutral setup, 11.1% extension, and critically, a MACD that is bearish but improving—a signal that sellers are losing conviction without buyers yet fully committed. Its stochastic RSI rising through mid-zone at 0.55 contrasts sharply with XLK's overbought momentum at the same timing score of 75.0, meaning CIBR has better entry risk even though XLK has posted triple the 13W return at 13.3% versus 3.5%. Volume tells the story: CIBR's thin 0.63x participation suggests accumulation into weakness, while XLK's robust accumulation/confirmation is happening at an extended peak. The 2.5-point score gap reflects a structural choice: cybersecurity's steadier theme with improving internals beats broad tech's vertical extension and flattening MACD despite superior relative strength.
Technology earns 5% allocation as a tier-2 holding in a Transition/Mixed regime where liquidity stress and credit stress are both active headwinds. The 48.0 category-level macro fit penalizes this sector because risk appetite positive and AI growth sponsorship—both active—cannot fully offset the structural drains from tightening conditions. CIBR's improving MACD and mid-zone stochastic setup offer a technical respite, but the allocation reflects restraint: this is not a conviction overweight. For Technology to reclaim top-2 status, the category would need either a decisive break above resistance with confirming volume or a meaningful shift in the macro descriptor profile, specifically a reduction in credit stress intensity. Currently, the setup works defensively but lacks the momentum sponsorship that would justify moving this exposure beyond a modest tactical sleeve.
Utilities & Infrastructure — PAVE
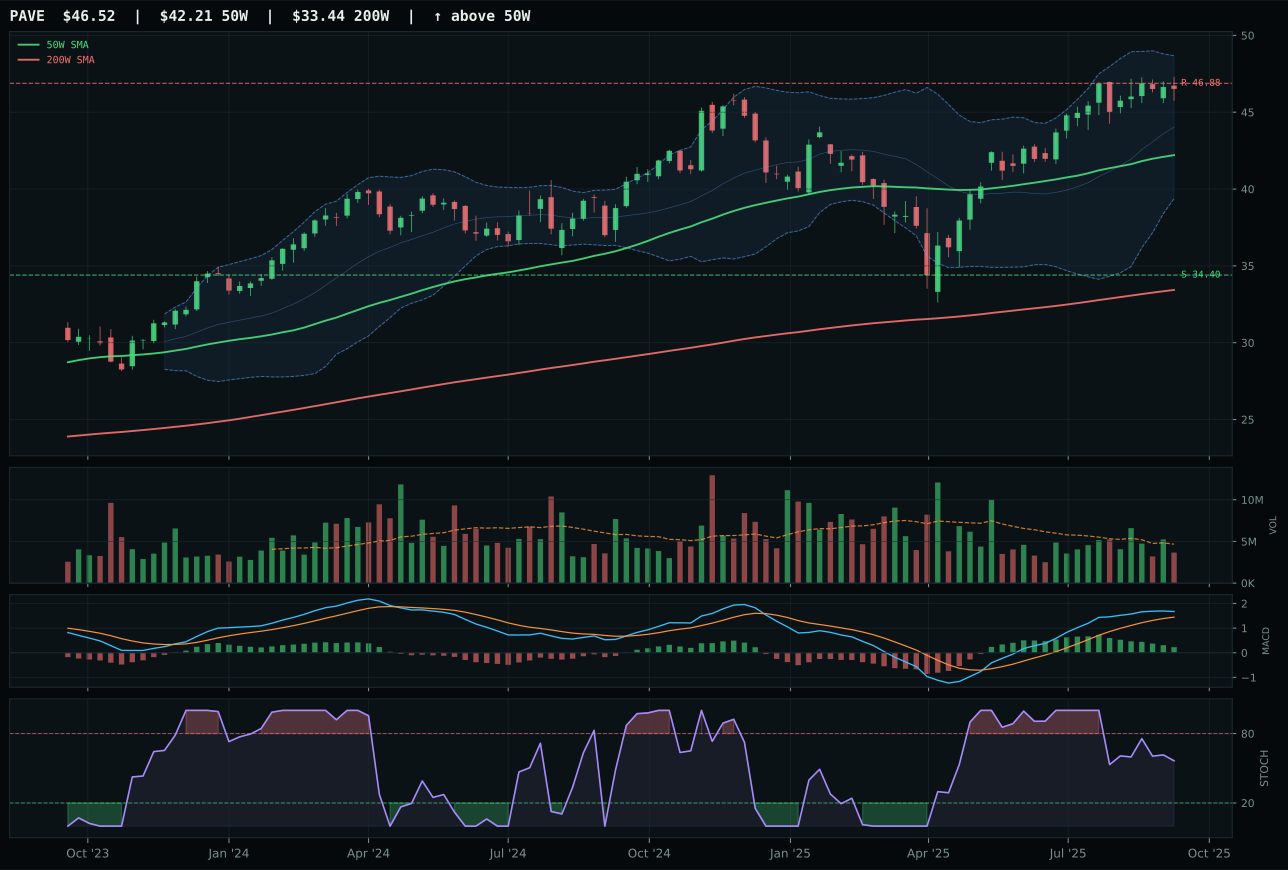
PAVE has a neutral structure profile with 0.7% 13-week relative strength versus SPY.
A failed hold above support would weaken the setup.
Actionable but governed by invalidation levels.
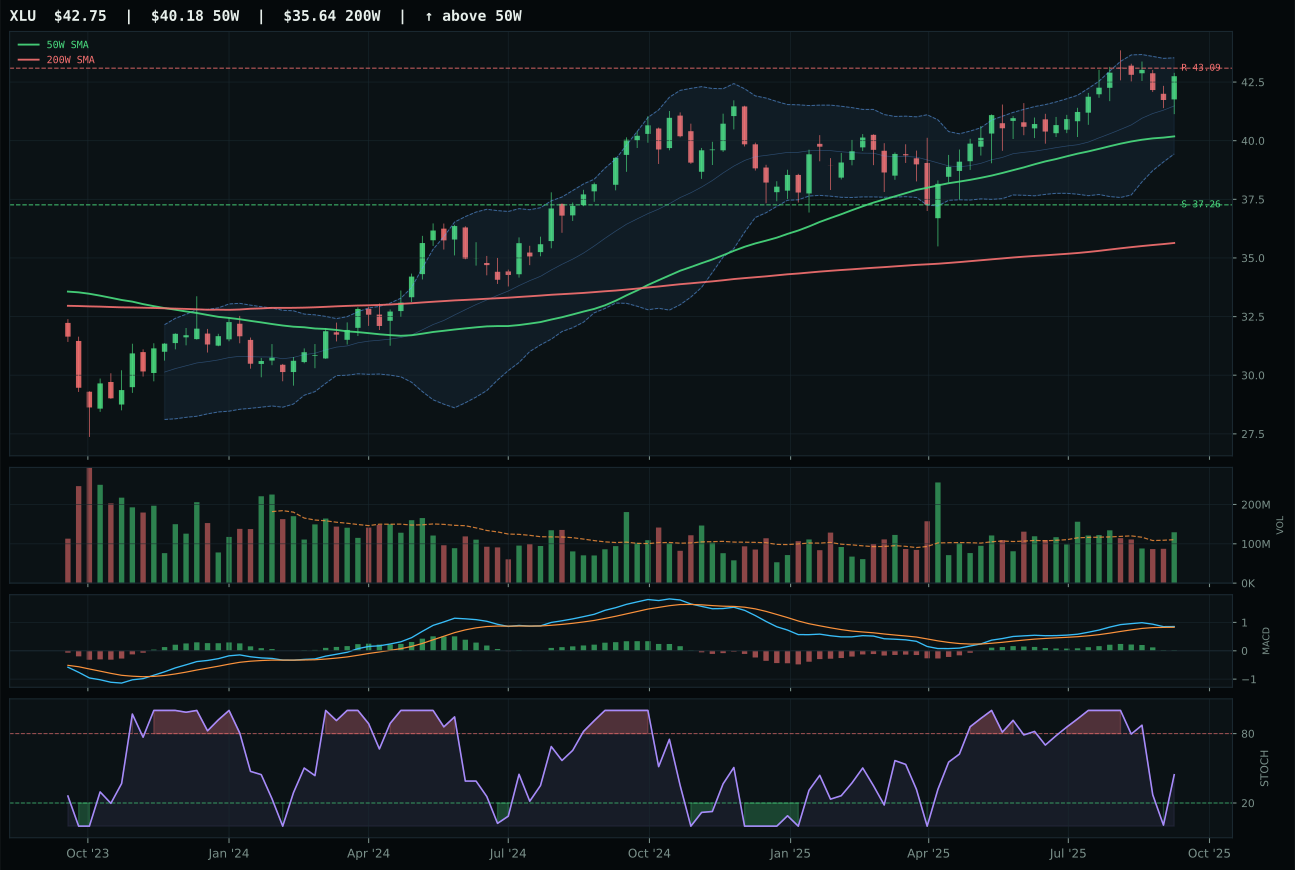
XLU has a neutral structure profile with -5.1% 13-week relative strength versus SPY.
A failed hold above support would weaken the setup.
Actionable but governed by invalidation levels.
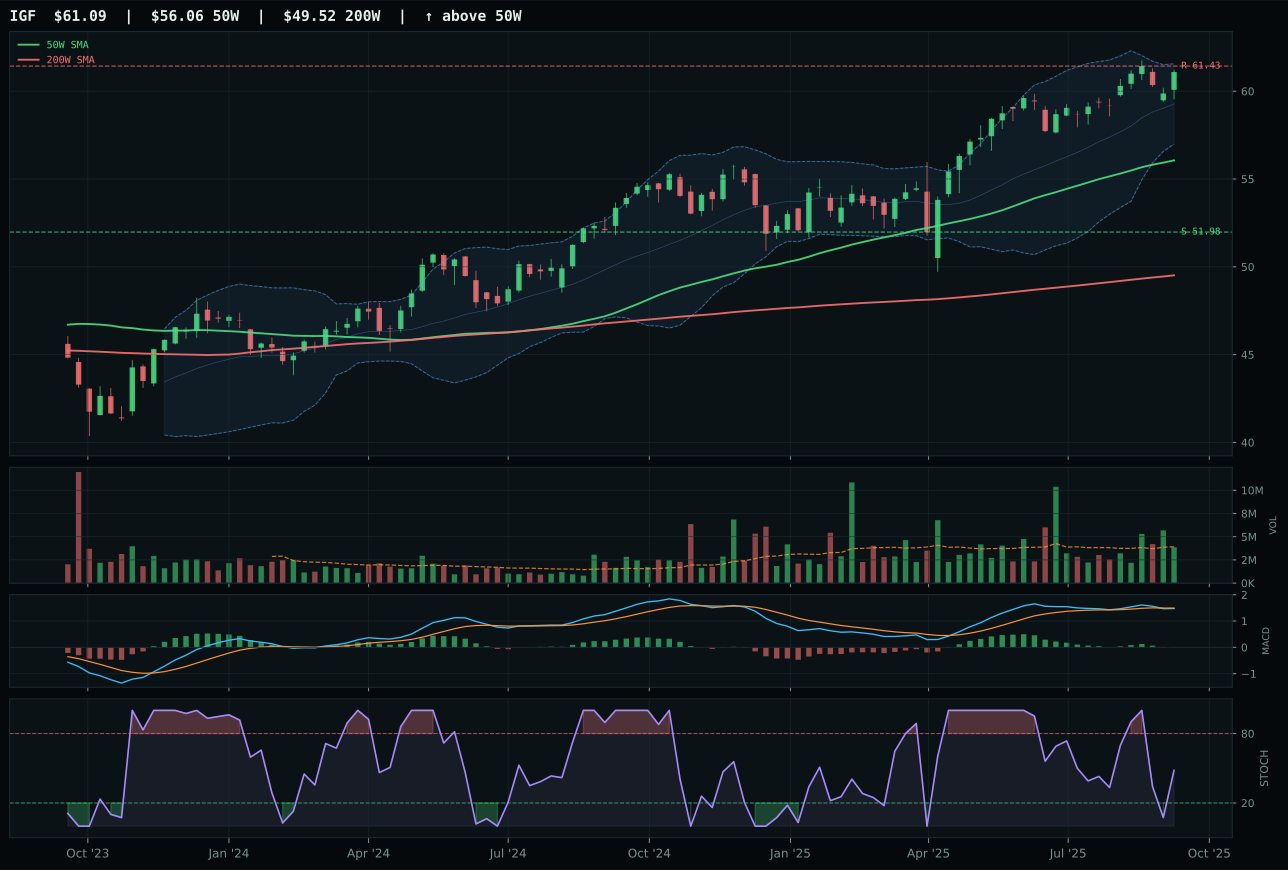
IGF has a neutral structure profile with -7.3% 13-week relative strength versus SPY.
A failed hold above support would weaken the setup.
Actionable but governed by invalidation levels.
PAVE wins a decisive 3.0-point victory over XLU by delivering superior category-relative strength (5.9% vs 0.0%) in a setup where both ETFs are structurally and technically similar. Price is 10.2% above the 50W for PAVE and lower for XLU, both in neutral structure with clean compression and bullish-but-flattening MACD. The timing score of 62.0 for PAVE exceeds XLU's 70.0, which seems backward until relative performance is weighted: PAVE's infrastructure focus with 5.9% category-relative strength indicates institutional buyers are accumulating this specific thematic, not just the category, while XLU's 0.0% relative strength suggests it is moving with the category median and receiving no premium. Momentum confirmation for PAVE is 78.8 versus XLU's 57, reflecting PAVE's 10.9% 13W return supporting the outperformance narrative. Structure cleanliness for PAVE at 79.8 versus XLU's unnamed specific score (but clearly lower composite at 72) reflects a tighter, less-tested uptrend. Both have neutral volume, so the decider is breadth: PAVE's 1.1% 4W return paired with 10.9% 13W return shows acceleration into strength, whereas XLU's 5.0% 13W return is merely consolidating.
Utilities & Infrastructure earns 5% allocation as a tier-2 holding in a Transition/Mixed regime where risk appetite and commodity breadth are modestly positive but liquidity stress and credit stress are both present as headwinds. The 52.3 category score reflects 72.9 technical evidence paired with 47.0 macro fit, creating an asymmetry where technicals support but macro context constrains. PAVE's infrastructure and capex-beta exposure benefits from the Transition/Mixed macro boost (+4) and commodity breadth positive (+4), making it a barbell position that owns capex beneficiaries while avoiding pure utility defensiveness. The 10.2% extension from the 50W is tight enough to allow incremental institutional participation without requiring a reset, and the neutral volume suggests dry powder remains to be deployed if uptrend confirmation persists. For this category to earn top-2 status, either Transition/Mixed would need to accelerate into clear expansion mode (and descriptors would shift to confirm it), or credit stress would need to ease materially (currently -5 headwind). Currently, 5% allocation reflects a tactical view that infrastructure spending will remain supported by policy tailwinds even in a mixed macro environment, but not conviction that the category is leading the portfolio cycle. Utilities defensiveness is held in reserve rather than overweighted, preserving flexibility if risk appetite deteriorates.
Defense & Aerospace — XAR
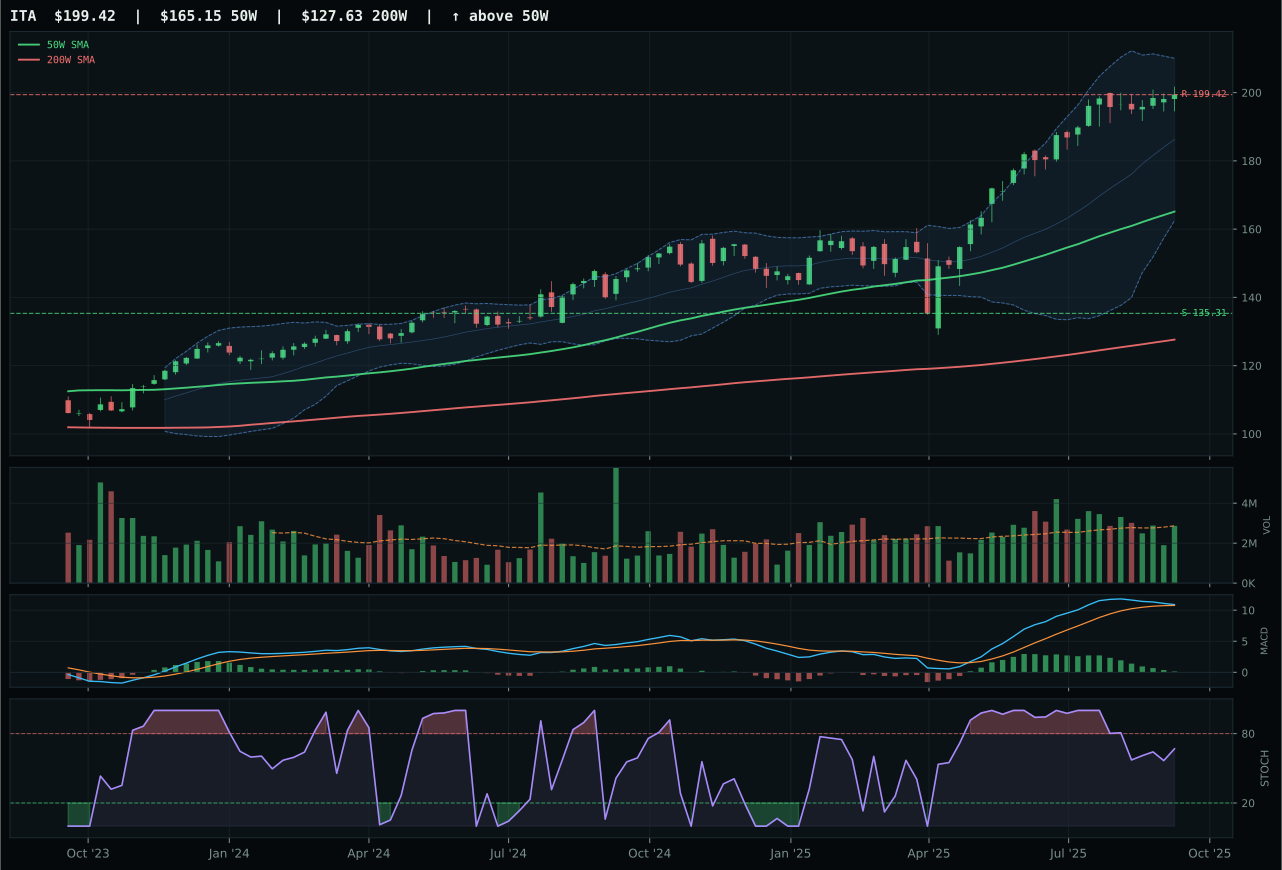
ITA has a vertical extension profile with 0.5% 13-week relative strength versus SPY.
A failed hold above support would weaken the setup.
Actionable but governed by invalidation levels.
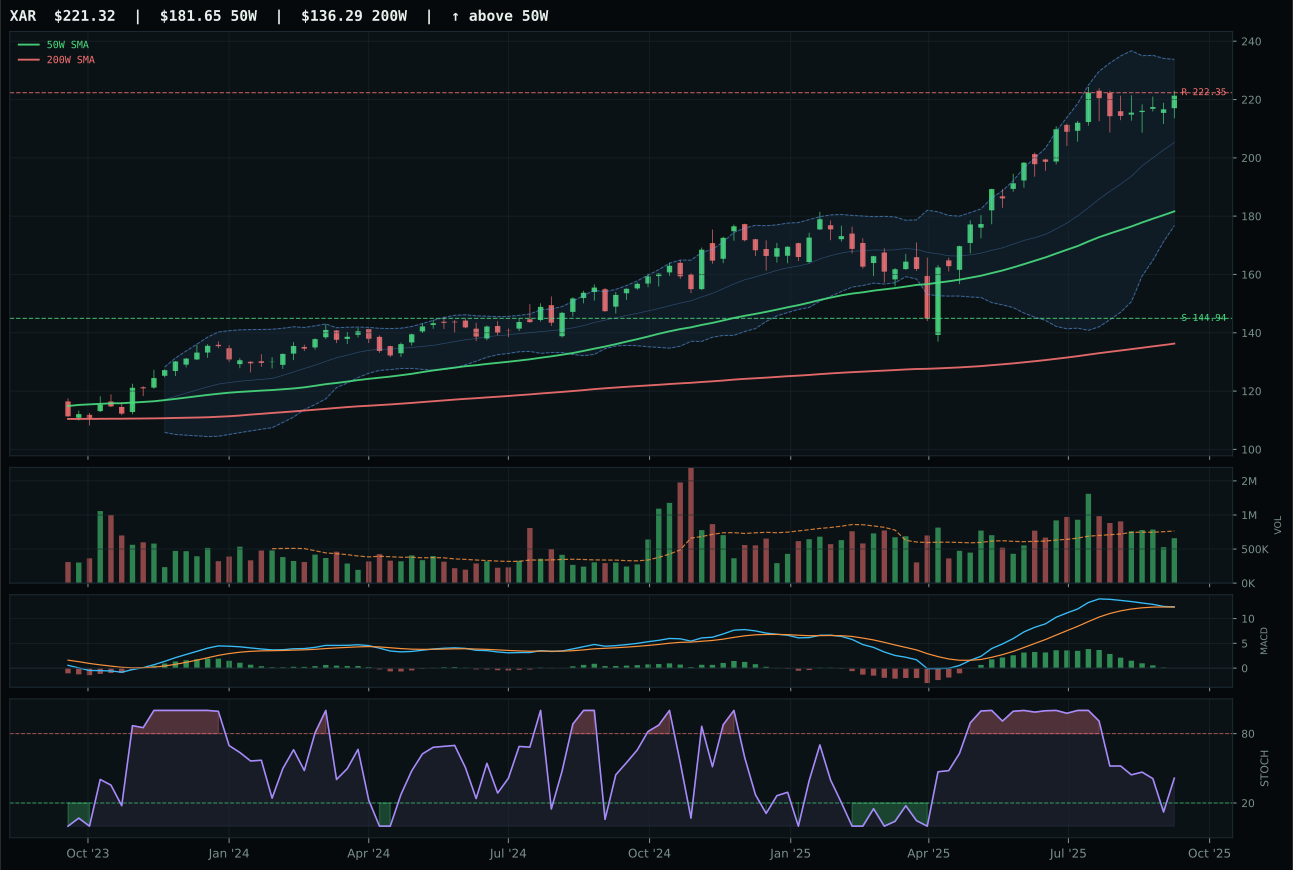
XAR has a vertical extension profile with 1.8% 13-week relative strength versus SPY.
A failed hold above support would weaken the setup.
Actionable but governed by invalidation levels.
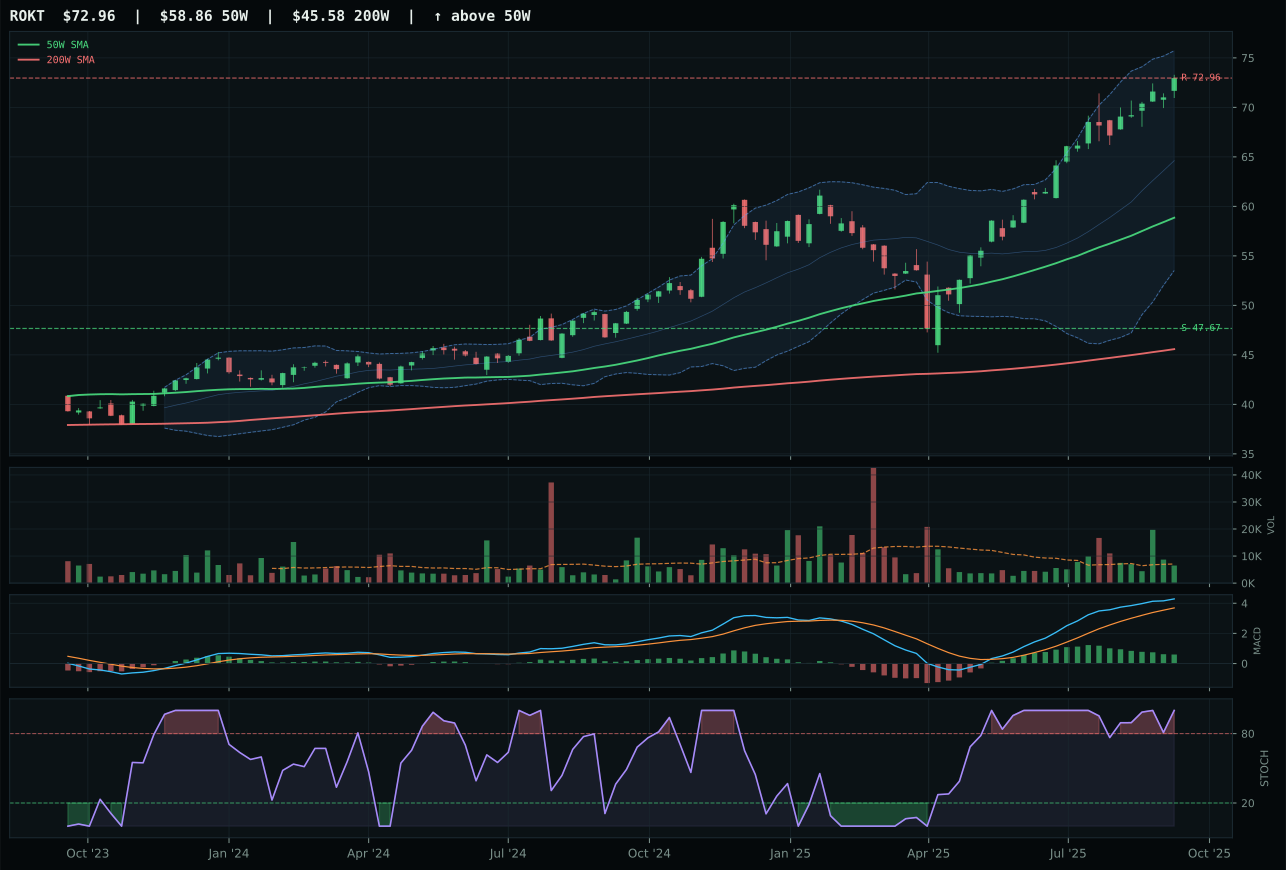
ROKT has a vertical extension profile with 9.1% 13-week relative strength versus SPY.
A failed hold above support would weaken the setup.
Tracked, but not top-2 eligible because: .
XAR wins a razor-thin decision over ITA by category-relative strength: 0.0% versus -1.2%, which is the margin in a near-identical technical setup. Both sit in vertical extension 21–22% above the 50W, both have bullish-but-flattening MACD and neutral-to-falling stochastic RSI, and both offer similar risk/reward profiles around 37–40. XAR's trend score of 99 versus ITA's 97, and its falling/neutral stochastic versus ITA's rising mid-zone, suggest XAR has momentum that is just barely holding above the zero line, which is preferable to momentum that is returning to neutral from above. Volume is neutral for both, so the tie-breaker is breadth: XAR's category-relative strength of exactly 0.0% means it is keeping pace with peer medians while moving up, whereas ITA's -1.2% indicates lagging participation. The score gap is only 0.3 points, reflecting two ETFs that are nearly equivalent in setup quality but separated by a small edge in relative performance confirmation.
Defense & Aerospace ranks as a tier-2 category at 50.3 with 5% allocation, held back by weak macro fit (51.0) in a Transition/Mixed regime where no category-specific descriptors apply. Credit stress and liquidity stress are both active negatives, and the category-level macro reasoning notes that Transition/Mixed helps by only +3 points—a minimal boost. XAR's technical evidence score of 58.0 is solid and driven by strong trend (98.6), but the timing penalty of 40.0 reflects the 21.8% extension and falling stochastic RSI, which means upside momentum is decelerating into resistance. The allocation reflects a balanced view: the sector has rally confirmation from bullish MACD and solid technical structure, but the macro environment is neutral-to-headwind and valuations are extended. For this category to earn a top-2 slot, defense equities would need either a significant contraction in credit stress severity or a meaningful decrease in extension from current levels that would allow fresh institutional accumulation on the pullback. Currently it is tactically held as a barbell against duration risk in rates.
Emerging Markets — ILF
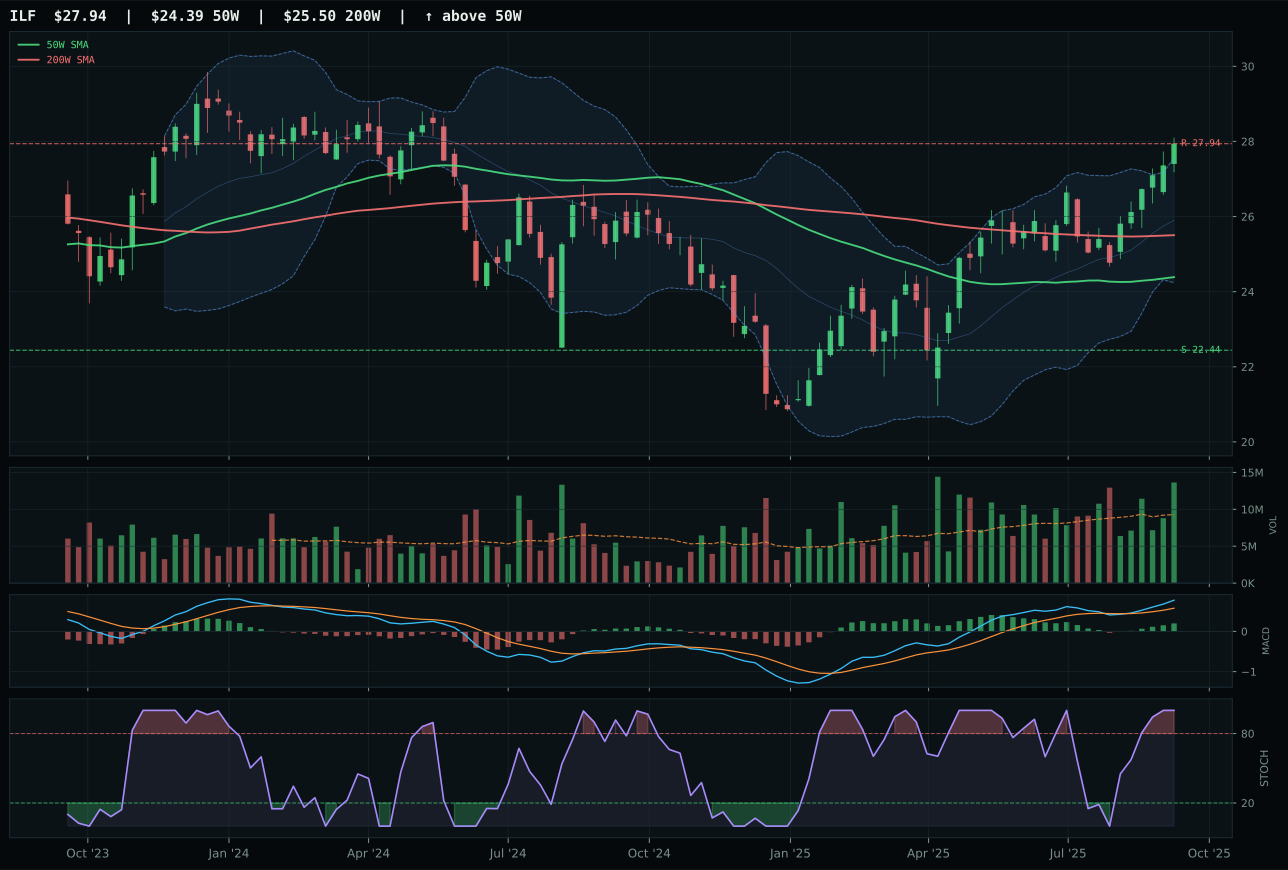
ILF has a neutral structure profile with -2.2% 13-week relative strength versus SPY.
A failed hold above support would weaken the setup.
Actionable but governed by invalidation levels.
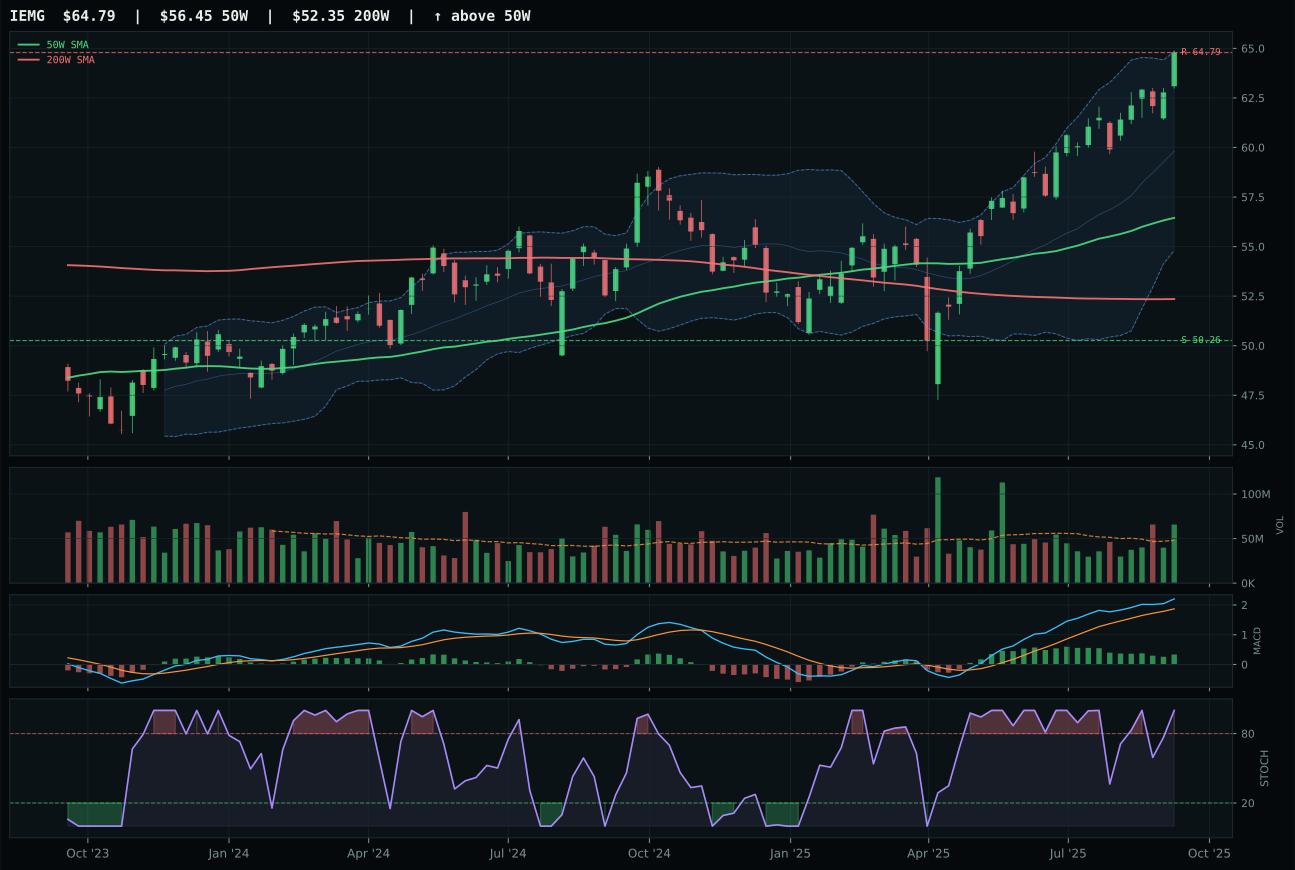
IEMG has a neutral structure profile with 0.2% 13-week relative strength versus SPY.
A failed hold above support would weaken the setup.
Actionable but governed by invalidation levels.
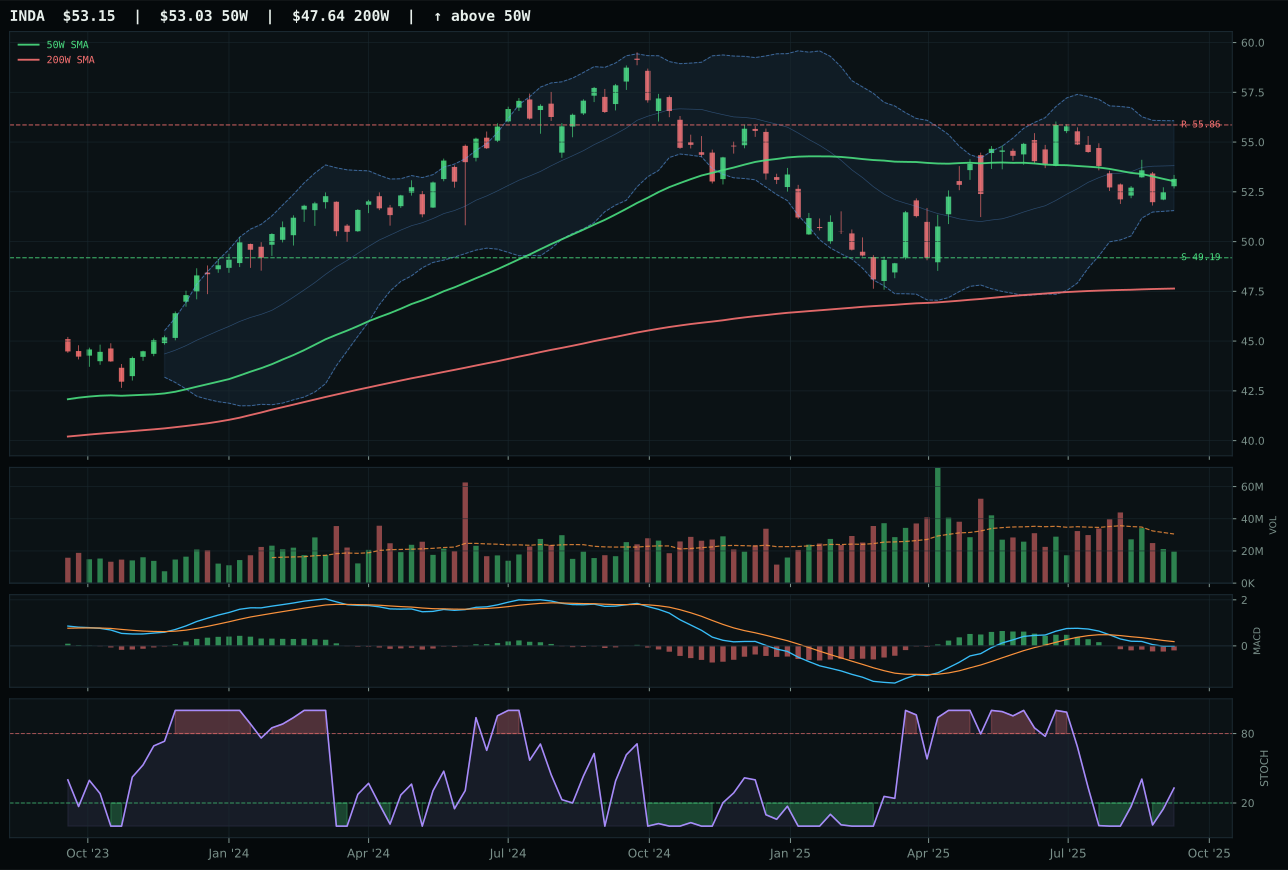
INDA has a compression near 50W profile with -11.8% 13-week relative strength versus SPY.
A failed hold above support would weaken the setup.
Actionable but governed by invalidation levels.
ILF wins by a narrow 0.8-point margin over IEMG by delivering superior MACD quality and timing precision in a stretched market environment. Both sit in neutral structure with 14.6% and similar extension levels above the 50W, and both have overbought stochastic RSI signaling momentum fatigue. ILF's MACD is bullish and improving, which is the critical technical edge over IEMG's bullish but flattening reading—at the peak of momentum moves, improving versus flattening MACD tells the difference between sustainable sponsorship and early-stage fatigue. ILF's timing score of 59.0 exceeds IEMG's 54.0 because the distance-to-50W is tighter (14.6% vs similar) but the MACD confirmation is cleaner. Volume confirmation at 1.47x for both is strong and nearly identical, so the separation comes from structure: ILF's 82.6 structure score reflects a more compact chart compression (83.5) that has more overhead room before hitting resistance at 27.94. IEMG is evaluated as broad emerging-market beta, which carries inherent dilution; ILF's Latin America commodity and value focus is more focused and less subject to rotational flows.
Emerging Markets earns 5% allocation as a tier-2 holding despite weak category-level macro fit of only 38.0 in a Transition/Mixed regime where credit stress and liquidity stress are both -10 headwinds. ILF's strong technical evidence of 81.9 carries the allocation because institutional participation is above-average and MACD is improving, creating a rare technical bright spot in a macro-challenged category. The 41.1 category score reflects a 62.0 3/2/1 weighted basket that tests down to 41.1 after accounting for volume-price sponsorship and persistence quality—indicating the technicals are real but conditional. The allocation reflects a tactical oversold bounce in emerging markets rather than a conviction that structural conditions have improved. Commodity breadth positive and metals scarcity are active tailwinds, but credit stress at -10 is the dominant macro force, constraining position size. For Emerging Markets to earn a top-2 upgrade, either ILF would need to consolidate in the 24–25 zone with volume spike confirmation (resetting entry risk), or credit stress descriptor would need to show early signs of easing. Currently, the 5% slot is a barbell position: it captures a technical setup that is working while protecting against macro deterioration by avoiding overweight exposure to an unfavorable macro regime.
Traditional Energy — XLE
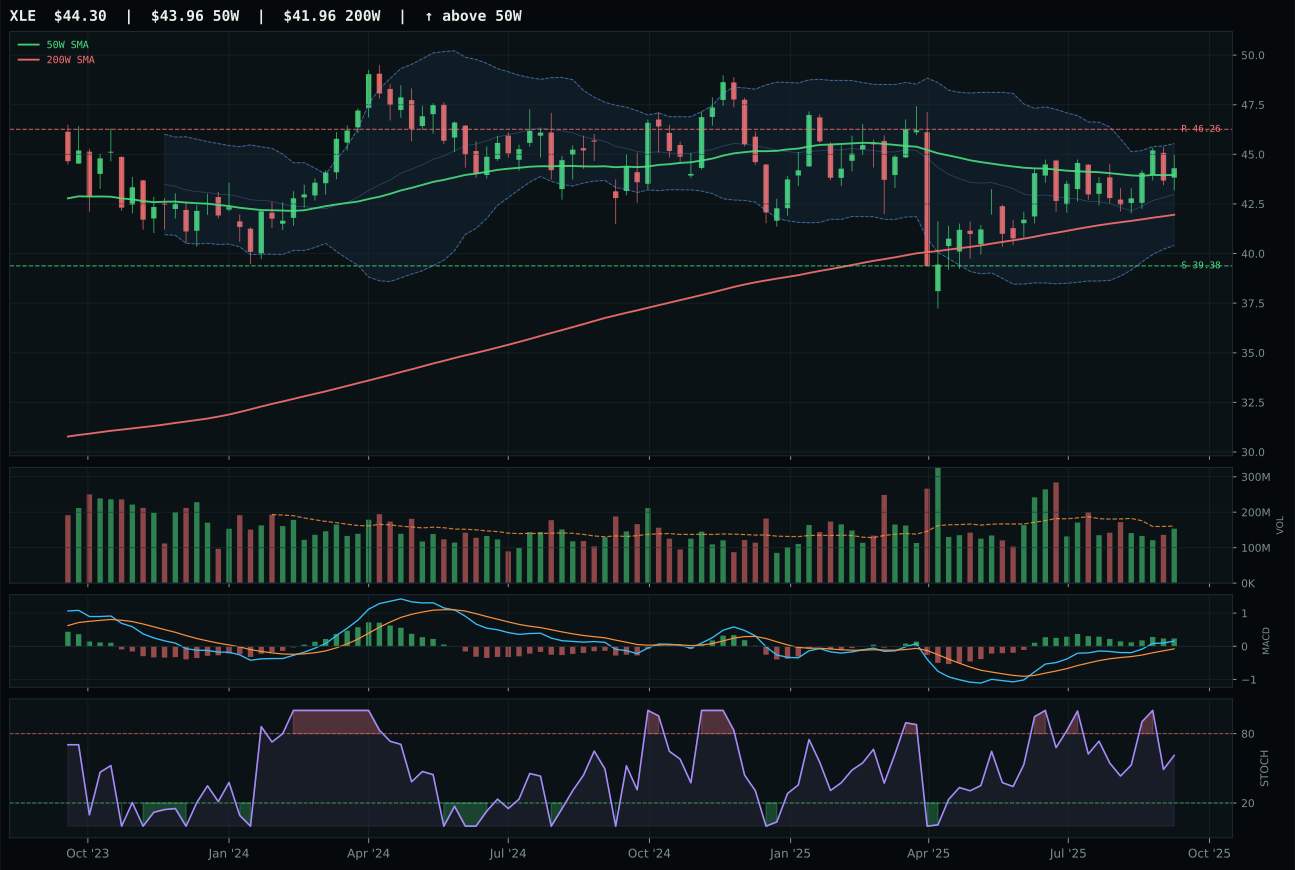
XLE has a compression near 50W profile with -9.6% 13-week relative strength versus SPY.
A failed hold above support would weaken the setup.
Actionable but governed by invalidation levels.
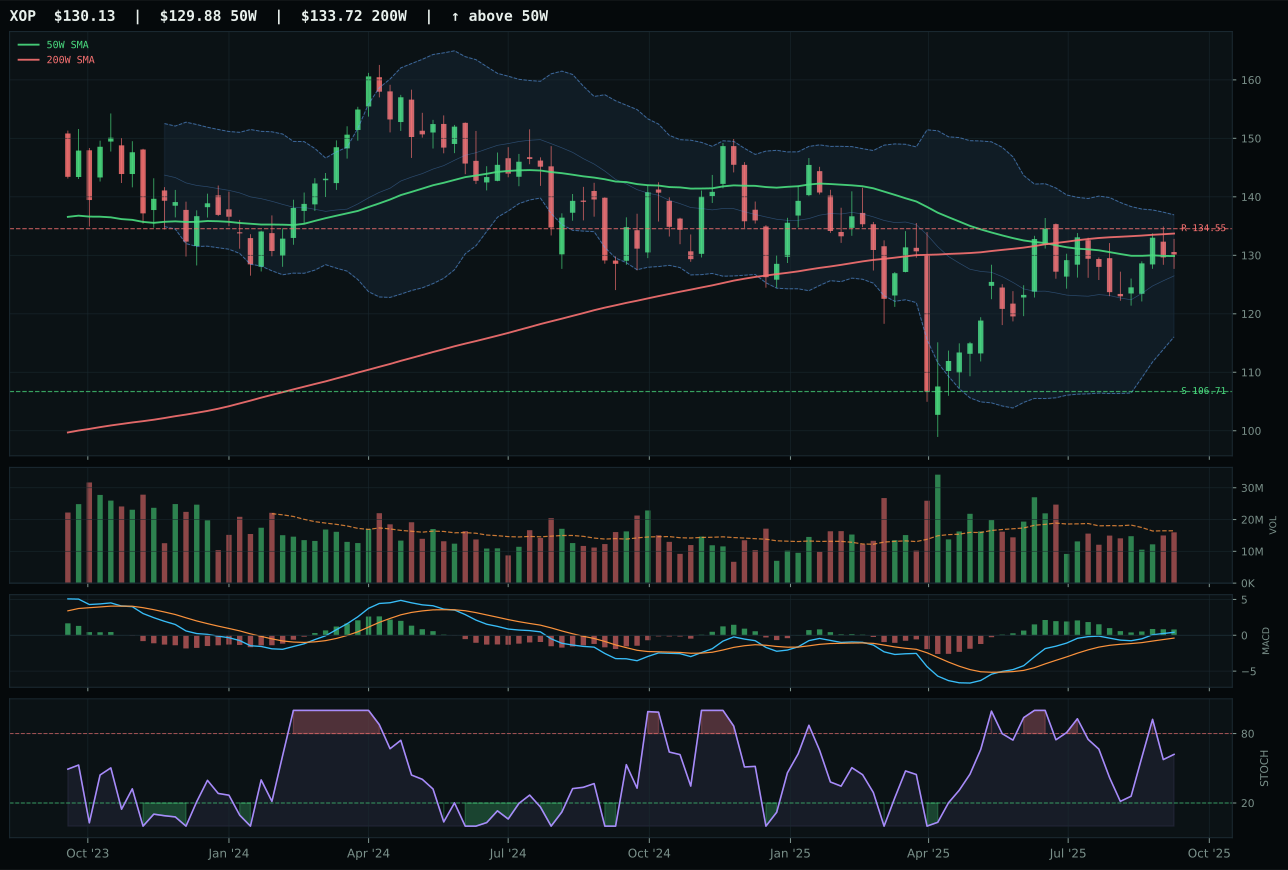
XOP has a compression near 50W profile with -12.1% 13-week relative strength versus SPY.
A failed hold above support would weaken the setup.
Actionable but governed by invalidation levels.
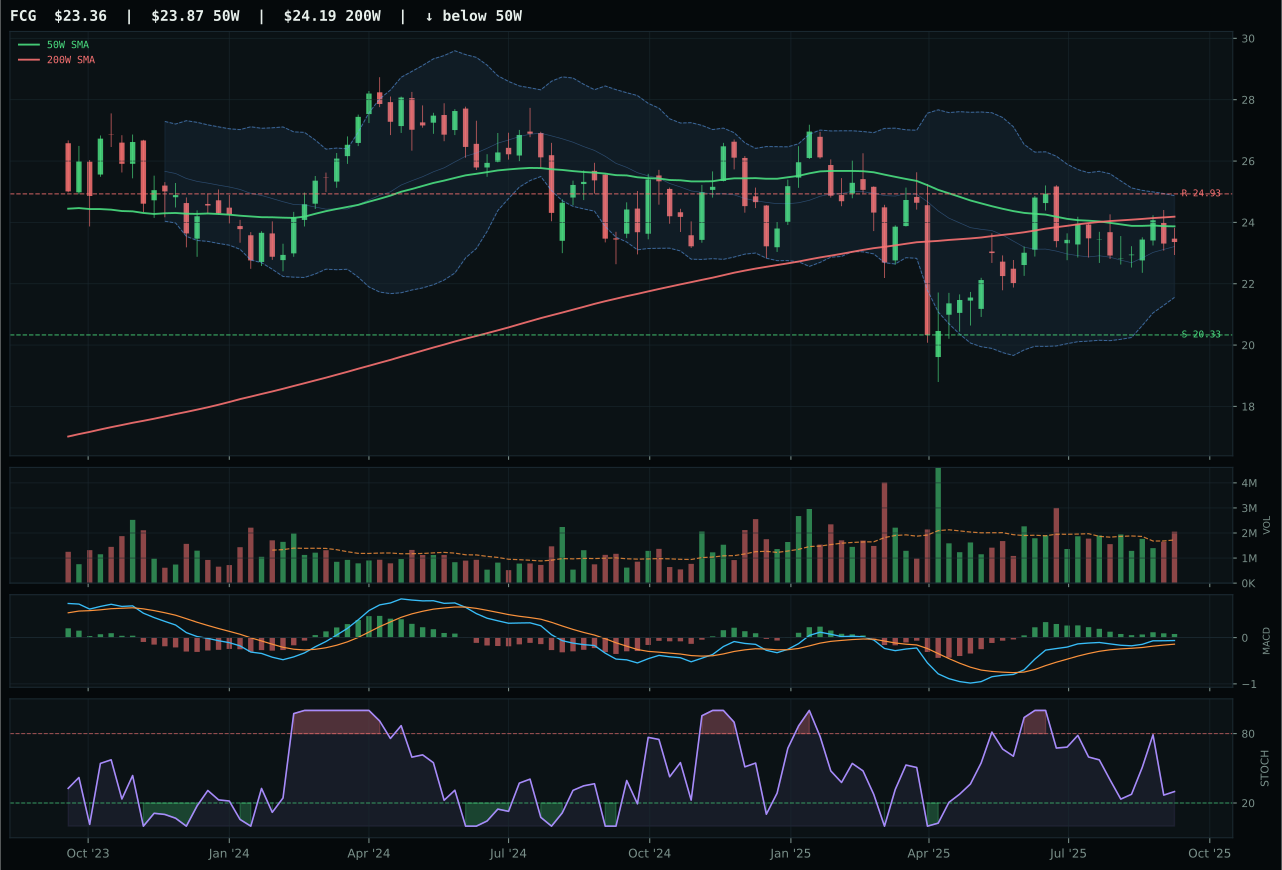
FCG has a compression near 50W profile with -16.0% 13-week relative strength versus SPY.
Extension and support failure are the main tactical risks.
Tracked, but not top-2 eligible because: structurally broken.
XLE wins a decisive 12.2-point victory over XOP by offering timing precision rather than momentum magnitude. Both sit near their 50W moving averages (XLE at 0.8%, XOP at similar compression), and both have bullish-and-improving MACD with stochastic RSI signals that differ subtly: XLE's falling/neutral at 0.61 versus XOP's rising mid-zone. The timing score for XLE is a perfect 100.0 because the Fibonacci zone is middle retracement/decision, meaning new buyers have a technical inflection point to defend and sellers have a line to capitulate below. XOP's stochastic rising mid-zone from that same compressed position is less clear directionally—it could be early-stage accumulation or simply neutral oscillation. Risk/reward favors XLE at 59.1 versus 55.7 because the compression setup offers better downside-to-support definition. Volume is neutral for both at 0.95x, ruling out accumulation as a tie-breaker. Structure cleanliness at 74.1 versus 70.5 reflects XLE's broader integrated cash-flow story—it is easier for institutions to accumulate steady dividend earners than exploration beta. The 13W return spread (0.6% vs -2.0%) confirms XLE's durability.
Traditional Energy receives 0% allocation this week, excluded entirely from the portfolio as a category ranked 9th or 10th despite XLE's perfect timing score. The 28.1 final category score is dragged down by weak technical evidence across the basket (XLE 77.6, XOP 66.0, FCG 36.2) paired with weak macro fit of only 43.0. The macro environment is actively hostile: liquidity stress and credit stress are both -7 descriptors, while real asset sponsorship at +7 and Transition/Mixed at neutral cannot overcome the structural headwinds. XLE's compression near the 50W offers a technically cleaner entry than the extended positions in Technology or AI, but compression is not momentum—it is consolidation that could easily reverse lower if risk appetite deteriorates further. The category's 13W return of 0.6% on SPY-relative performance of -9.6% indicates structural underperformance that macro tailwinds have not yet reversed. For Traditional Energy to earn a 5% allocation, XLE would need to break decisively above the 46.26 resistance level with confirming volume while descriptors like credit stress show early signs of easing. Currently, holding zero allocation preserves dry powder for higher-conviction themes like Industrial Metals and avoids a defensive catch that has no near-term catalyst.
Agriculture & Livestock — MOO
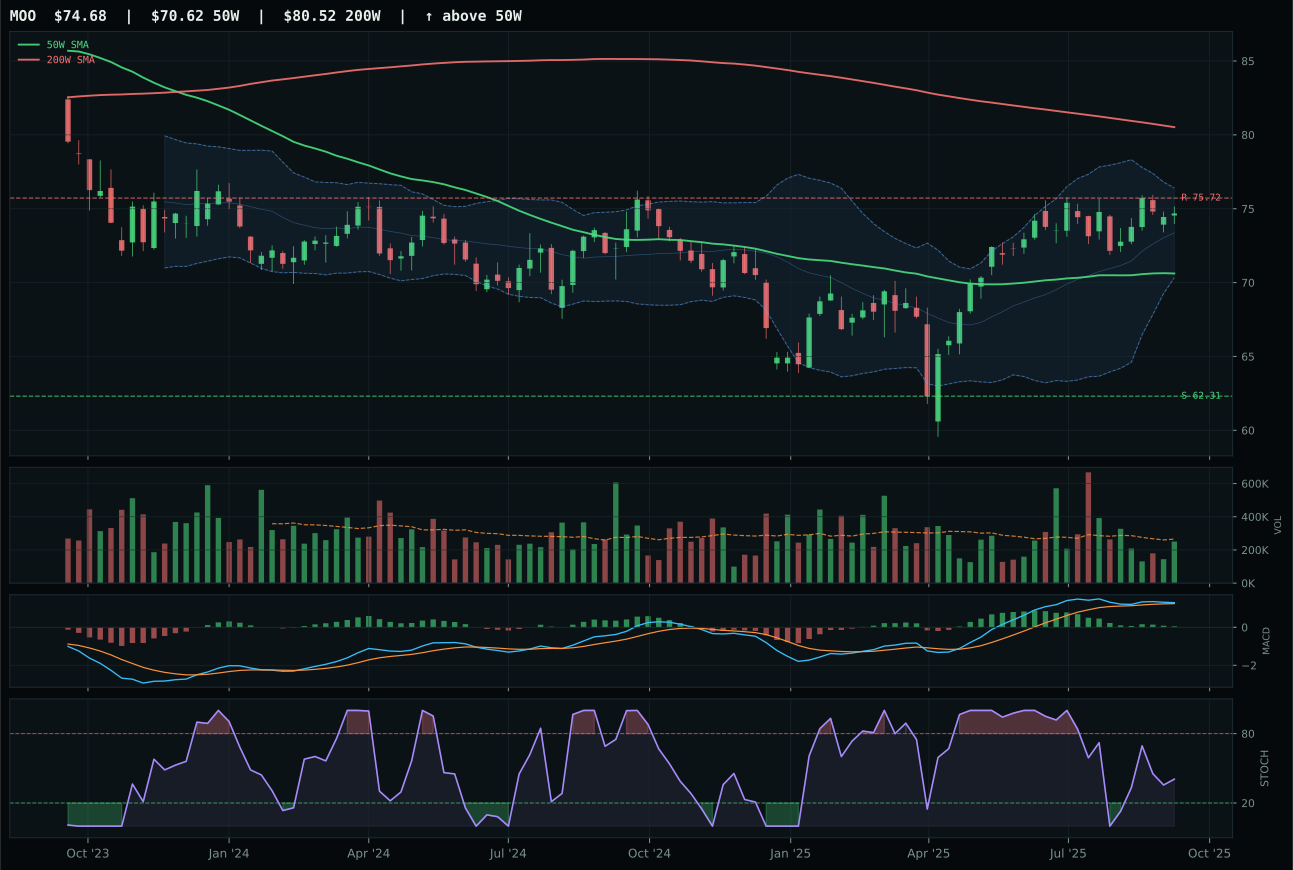
MOO has a neutral structure profile with -9.5% 13-week relative strength versus SPY.
A failed hold above support would weaken the setup.
Actionable but governed by invalidation levels.
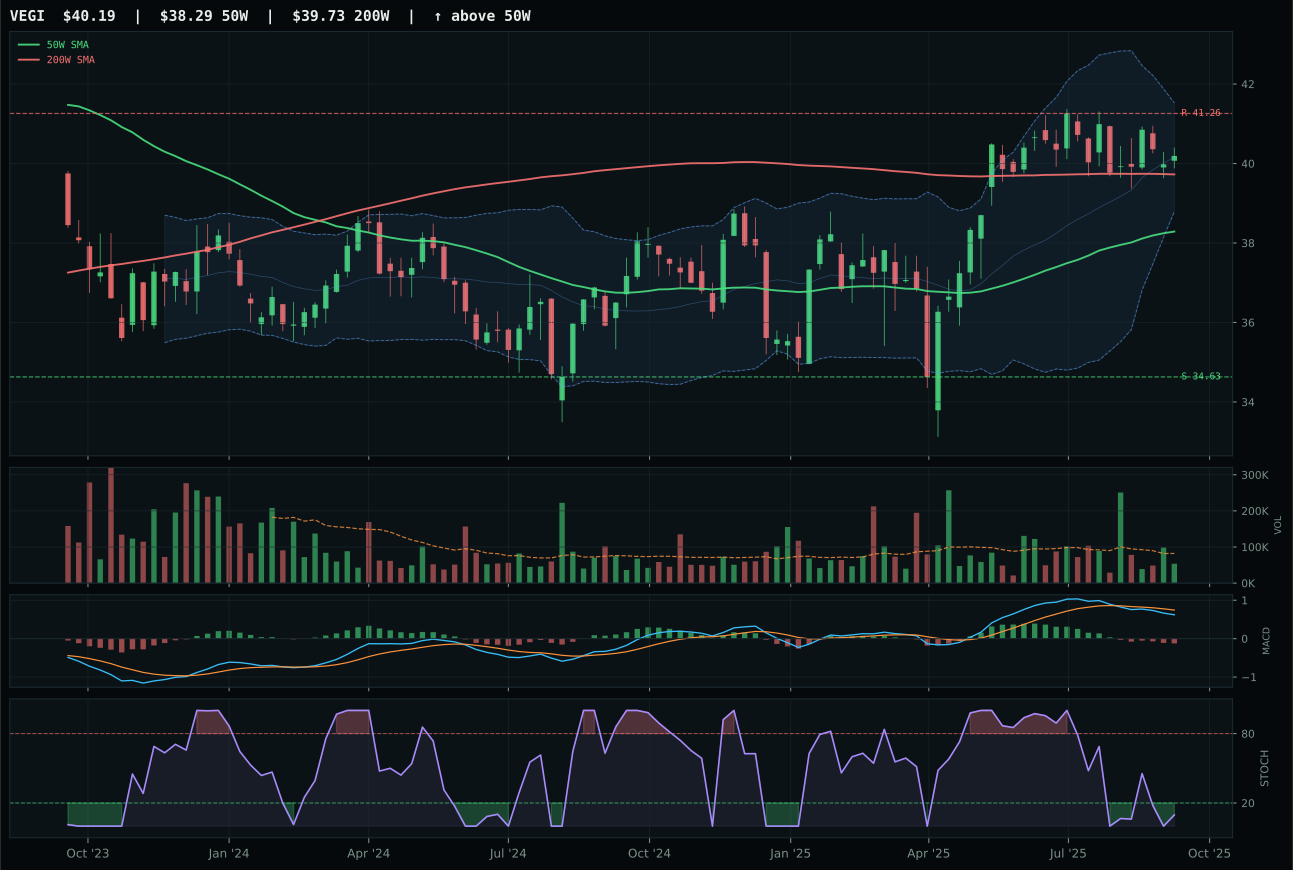
VEGI has a neutral structure profile with -11.3% 13-week relative strength versus SPY.
A failed hold above support would weaken the setup.
Tracked, but not top-2 eligible because: .
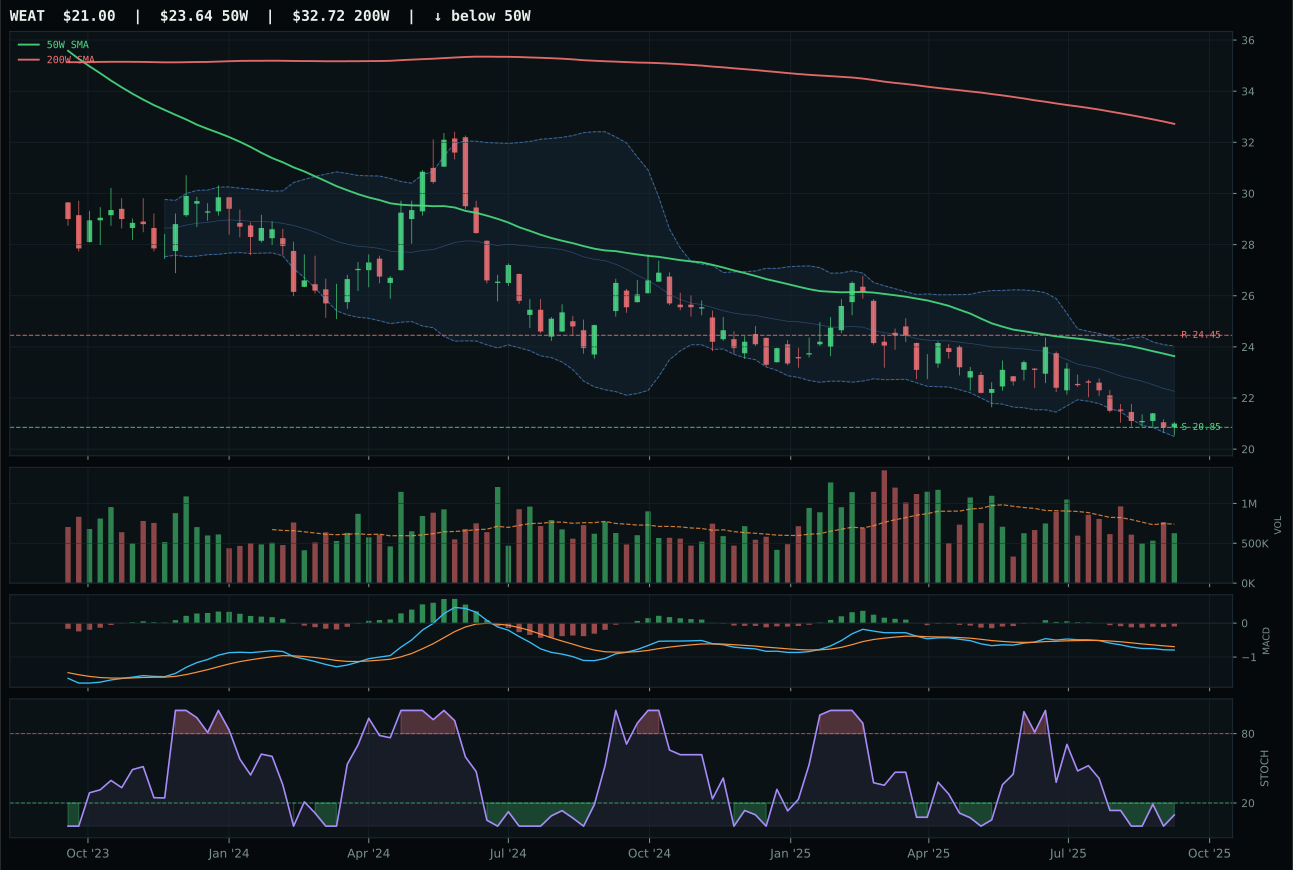
WEAT has a pullback into support profile with -19.2% 13-week relative strength versus SPY.
Extension and support failure are the main tactical risks.
Tracked, but not top-2 eligible because: structurally broken.
MOO wins by the narrowest margin that still yields a clear category victory: 20.5 points over VEGI. The winner's score of 52.4 technical evidence is anchored by a neutral structure with acceptable timing (70.0) despite price being only 5.8% above the 50W, which means the setup still has room to compress before breaking lower. MOO's MACD is bullish but flattening and its stochastic RSI is falling/neutral at 0.41, confirming that momentum is waning but not yet negative. Category-relative strength of 1.8% suggests MOO is slightly outpacing the median peer, while VEGI posts 0.0% and carries a -11.3% SPY-relative loss that indicates structural headwinds. The critical difference: MOO's structure cleanliness at 50.0 versus VEGI's 69.2 seems backward until volume context is added—MOO's neutral 0.94x participation is honest capital, while VEGI's thin 0.63x participation on a bearish/weakening MACD signals capitulation selling rather than accumulation. MOO's 20.5-point victory is not a vote of confidence; it is simply the least-bad option in a deeply wounded category.
Agriculture & Livestock receives 0% allocation this week, ranked 9th or 10th among the ten categories, and excluded entirely from the portfolio. The 24.8 final category score reflects technical evidence of only 52.4 and macro fit of 55.0, both of which fail to clear the threshold for tier-2 consideration even under the softened 50% overlay regime. The category-level macro fit of 59.0 initially appears supportive—real asset sponsorship and commodity breadth positive are both active—but these tailwinds collapse when tested against the actual ETF technical profiles: MOO's 13W return of 0.7%, SPY-relative performance of -9.5%, and falling momentum all indicate that the macro case has not yet translated into price action. Liquidity stress is active and dragging the category down -4 points, while credit stress remains neutral. The exclusion is justified because waiting for this category to show upticks in volume and momentum confirmation would be a lower-conviction trade than deploying capital to categories like Industrial Metals (70.2) or AI (62.6). For Agriculture to earn a 5% allocation slot, MOO would need to show a stochastic RSI turn from falling neutral into rising mid-zone with above-average volume confirmation, which would signal institutional re-entry rather than institutional exit.