
2025-09-05
Informational purposes only. The content in this report, including allocations, analysis, and commentary, is provided solely for informational and educational purposes. It does not constitute financial advice, investment advice, trading advice, or any other type of advice. Past performance does not guarantee future results. Always conduct your own research and consult a qualified financial professional before making investment decisions.
Weekly Allocation
| Ticker | Category | Weight | Role |
|---|---|---|---|
| FBTC | 50% | Overlay | |
| COPX | Industrial Metals | 10% | Top-2 (10%) |
| GLD | Precious Metals | 10% | Top-2 (10%) |
| URNM | Nuclear Energy | 5% | Tier-2 (5%) |
| AIQ | AI | 5% | Tier-2 (5%) |
| PAVE | Utilities & Infrastructure | 5% | Tier-2 (5%) |
| XAR | Defense & Aerospace | 5% | Tier-2 (5%) |
| CIBR | Technology | 5% | Tier-2 (5%) |
| ILF | Emerging Markets | 5% | Tier-2 (5%) |
Trade Instructions — Monday Open
Sell the tranche from 2025-08-08 (completing its 4-week hold). Buy the new tranche. Instructions show net portfolio changes — same-asset positions cancel, weight changes show the delta.
| Action | Ticker | Instruction |
|---|---|---|
| SELL | REMX | Sell 50% of REMX position (reduce 5.00% → 2.50%) |
| SELL | NLR | Sell 50% of NLR position (reduce 5.00% → 2.50%) |
| SELL | BOTZ | Sell 50% of BOTZ position (reduce 2.50% → 1.25%) |
| SELL | ITA | Sell 33% of ITA position (reduce 3.75% → 2.50%) |
| SELL | XLU | Sell entire XLU position (1.25% of portfolio) |
| SELL | XLK | Sell 25% of XLK position (reduce 5.00% → 3.75%) |
| SELL | XLE | Sell 25% of XLE position (reduce 5.00% → 3.75%) |
| BUY | GLD | Buy GLD — 11.11% of freed cash (adds 1.25% to portfolio) |
| BUY | COPX | Buy COPX — 22.22% of freed cash (adds 2.50% to portfolio) |
| BUY | URNM | Buy URNM — 11.11% of freed cash (adds 1.25% to portfolio) |
| BUY | AIQ | Buy AIQ — 11.11% of freed cash (adds 1.25% to portfolio) |
| BUY | XAR | Buy XAR — 11.11% of freed cash (adds 1.25% to portfolio) |
| BUY | PAVE | Buy PAVE — 11.11% of freed cash (adds 1.25% to portfolio) |
| BUY | CIBR | Buy CIBR — 11.11% of freed cash (adds 1.25% to portfolio) |
| BUY | ILF | Buy ILF — 11.11% of freed cash (adds 1.25% to portfolio) |
Current Portfolio After Trade
Combined holdings across all 4 active tranches. Each tranche is 25% of the portfolio.
| Ticker | % of Portfolio | Weight Bar |
|---|---|---|
| FBTC | 50.00% | |
| COPX | 7.50% | |
| URNM | 5.00% | |
| XLK | 3.75% | |
| GLD | 3.75% | |
| XLE | 3.75% | |
| IGF | 3.75% | |
| ITA | 2.50% | |
| REMX | 2.50% | |
| NLR | 2.50% | |
| GDX | 2.50% | |
| AIQ | 2.50% | |
| XAR | 2.50% | |
| BOTZ | 1.25% | |
| MOO | 1.25% | |
| SMH | 1.25% | |
| PAVE | 1.25% | |
| CIBR | 1.25% | |
| ILF | 1.25% |
Macro Regime — Transition / Mixed
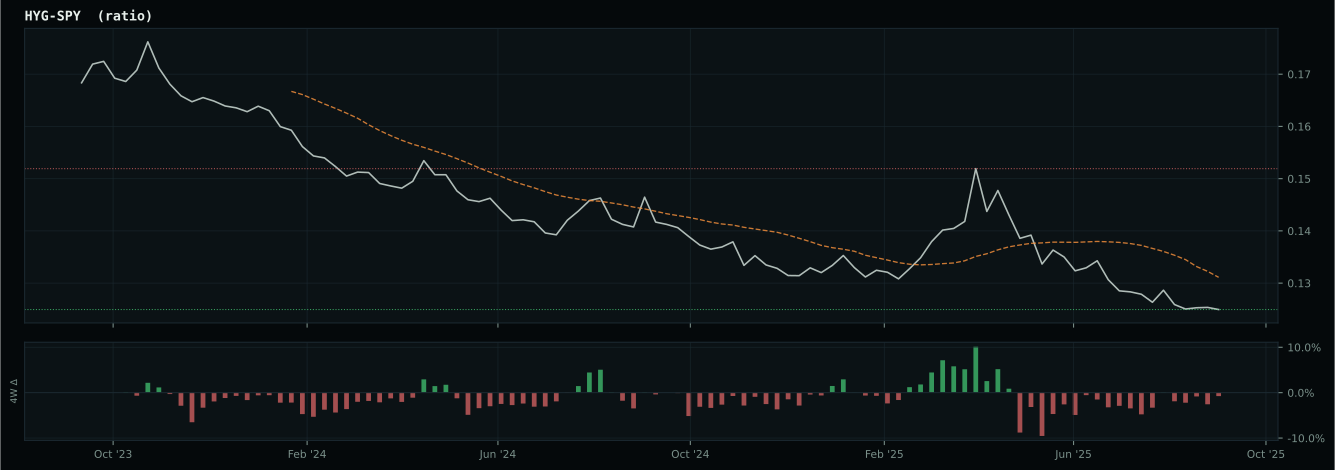
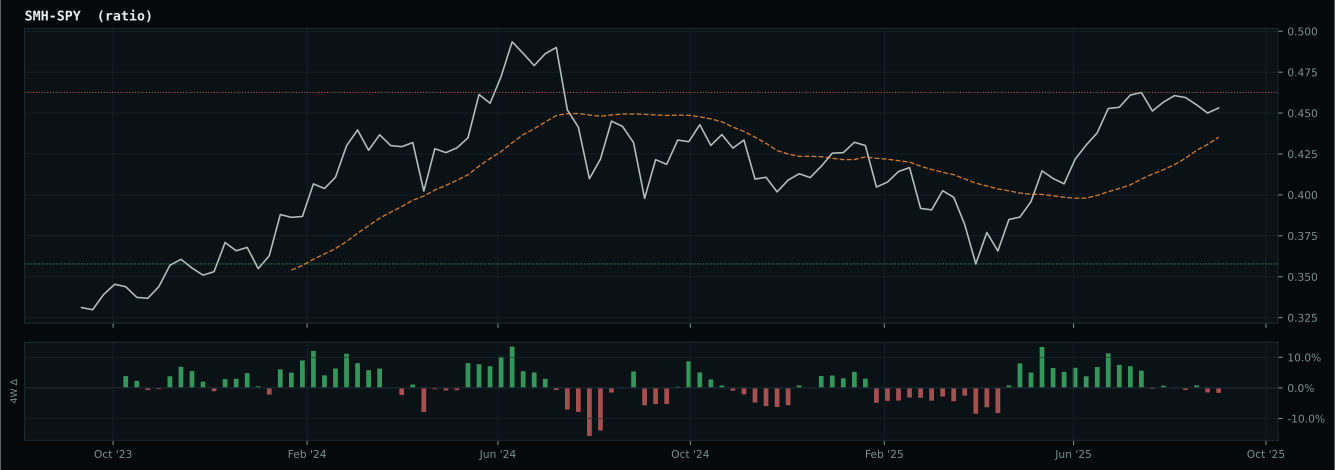
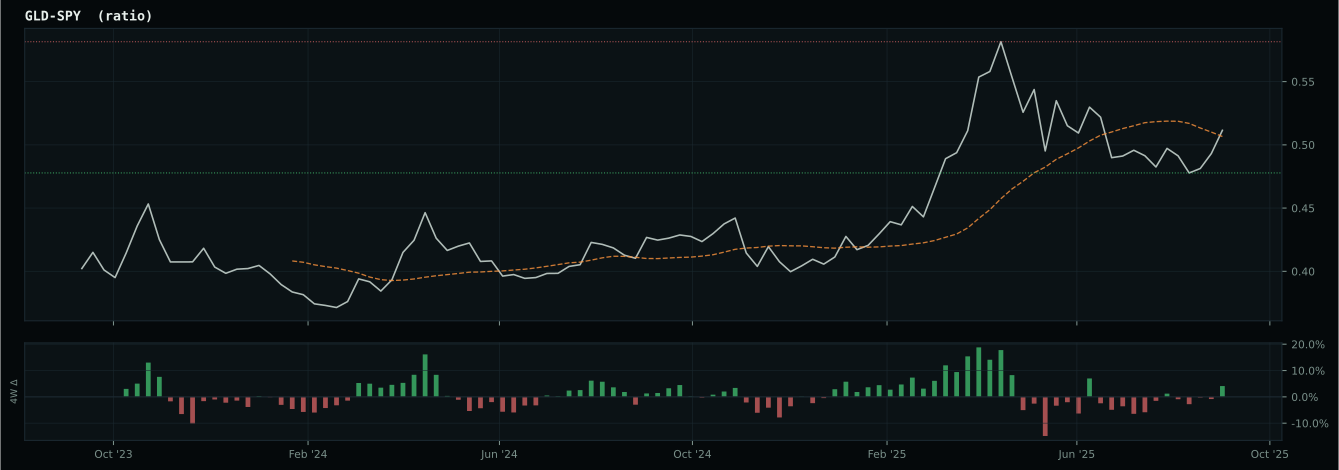
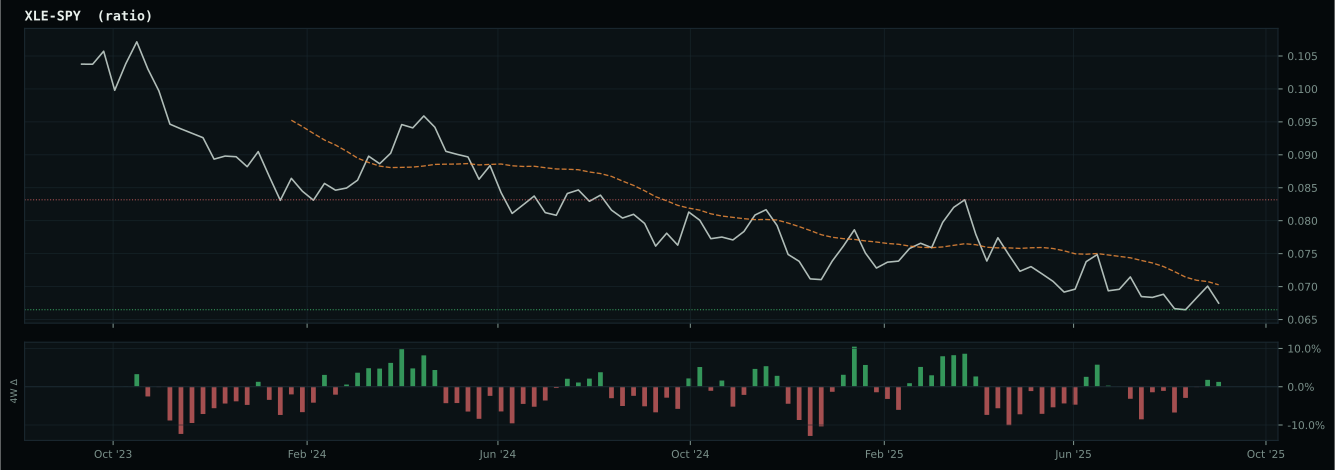
Macro Evidence Charts
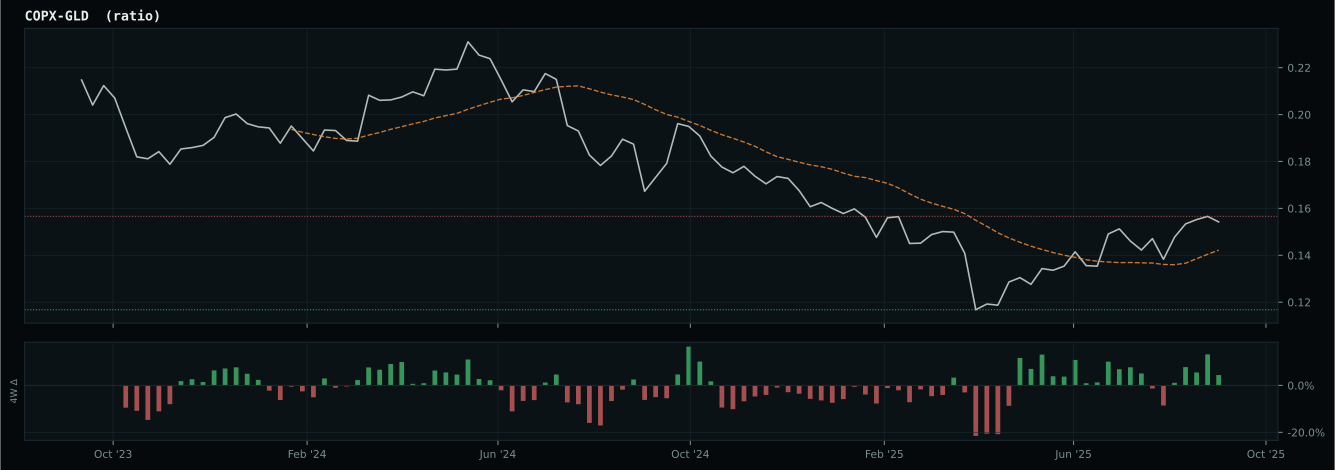
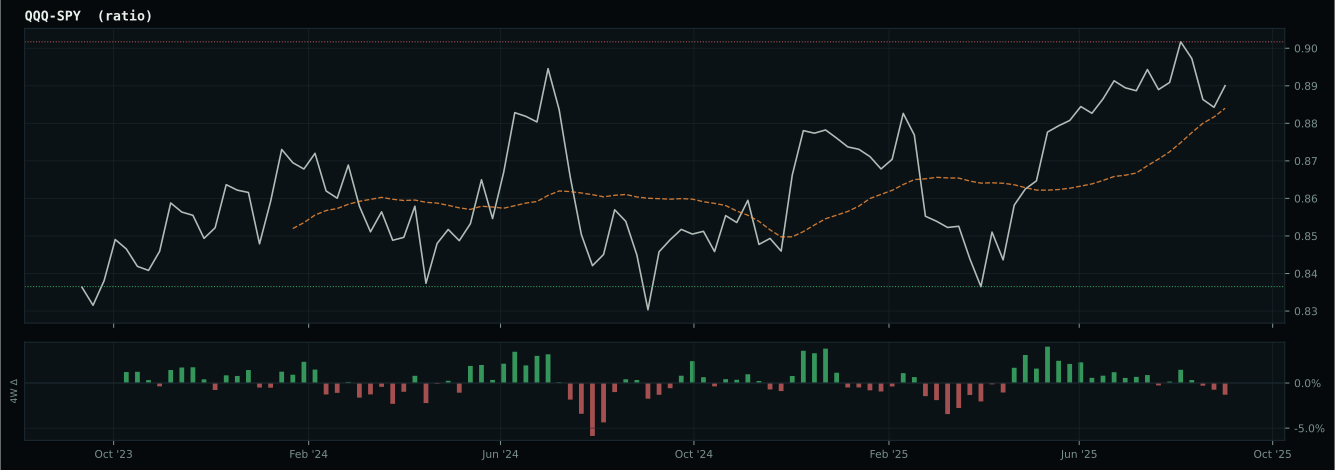
Market-implied signals behind the macro regime scores. Each ratio compares two assets; the direction and slope of the ratio is what the macro engine reads.
Crypto Regime — TrendBTC
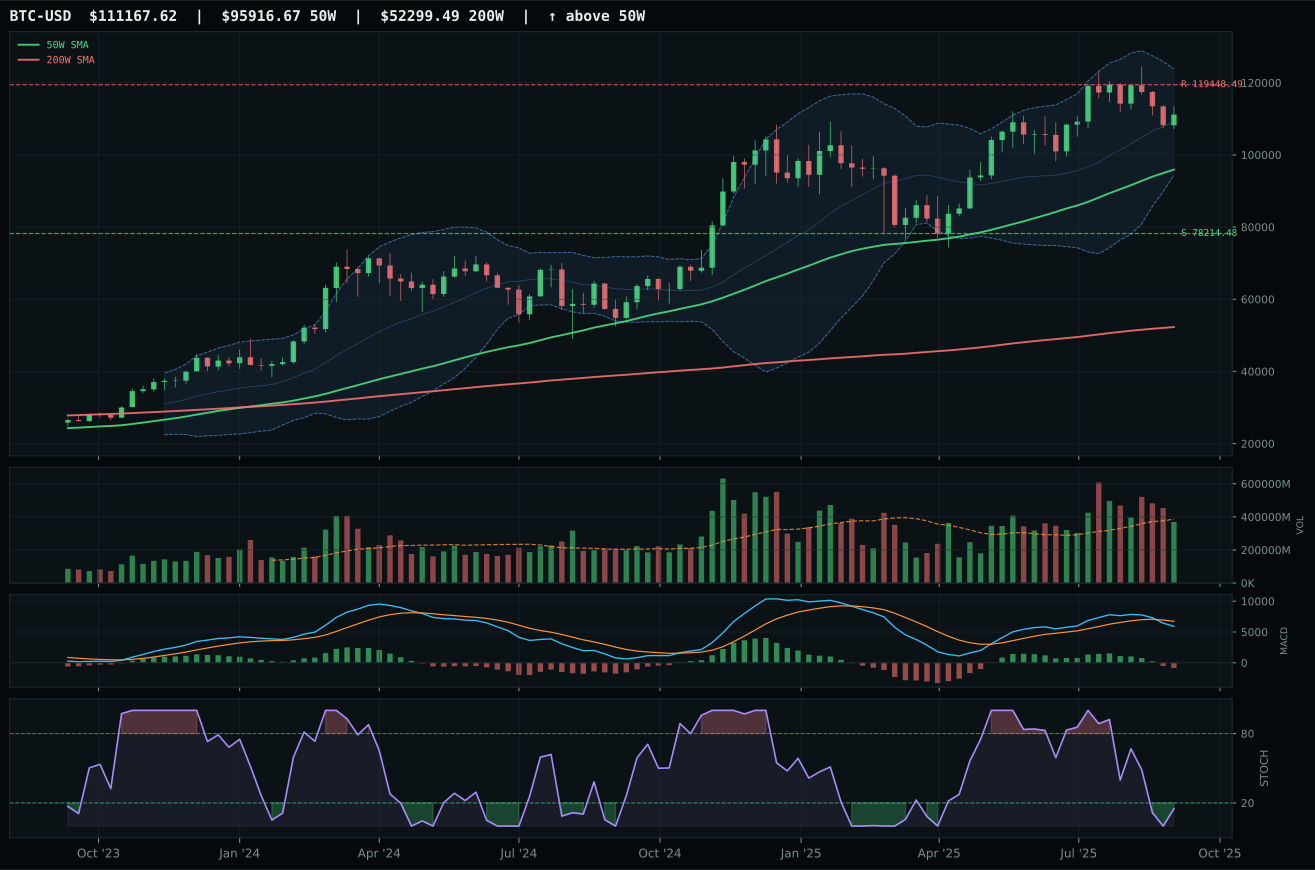
ValueBTC not armed: BTC has not made the first post-breakdown touch of the 200W buy zone after losing the 50W
TrendBTC confirmed: 2 consecutive closes above rising/flat 50W SMA
one or more available conditions failed
Category Rankings
| Rank | Category | Winner | Score | Alloc | 4W Ret | Peers (4W) |
|---|---|---|---|---|---|---|
| 1 | Industrial Metals | COPX | 69.0 | 20% | +20.82% | REMX +21.7% · PICK +9.3% |
| 2 | Precious Metals | GLD | 62.1 | 20% | +8.54% | GDX +16.1% · SLV +17.1% |
| 3 | Nuclear Energy | URNM | 57.4 | 10% | +15.24% | NLR +20.3% · URA +22.5% |
| 4 | AI | AIQ | 57.3 | 10% | +11.53% | SMH +17.0% · BOTZ +10.5% |
| 5 | Utilities & Infrastructure | PAVE | 52.0 | 10% | +3.05% | XLU +7.1% · IGF +2.6% |
| 6 | Defense & Aerospace | XAR | 49.0 | 10% | +11.95% | ITA +6.4% · ROKT +11.2% |
| 7 | Technology | CIBR | 43.4 | 10% | +4.22% | XLK +9.2% · IGV +6.1% |
| 8 | Emerging Markets | ILF | 36.3 | 10% | +3.76% | IEMG +6.3% · INDA +0.0% |
| 9 | Traditional Energy | XLE | 29.0 | 0% | +2.08% | XOP +2.7% · FCG +1.5% |
| 10 | Agriculture & Livestock | MOO | 25.6 | 0% | -0.98% | VEGI -1.7% · WEAT -0.2% |
Industrial Metals — COPX
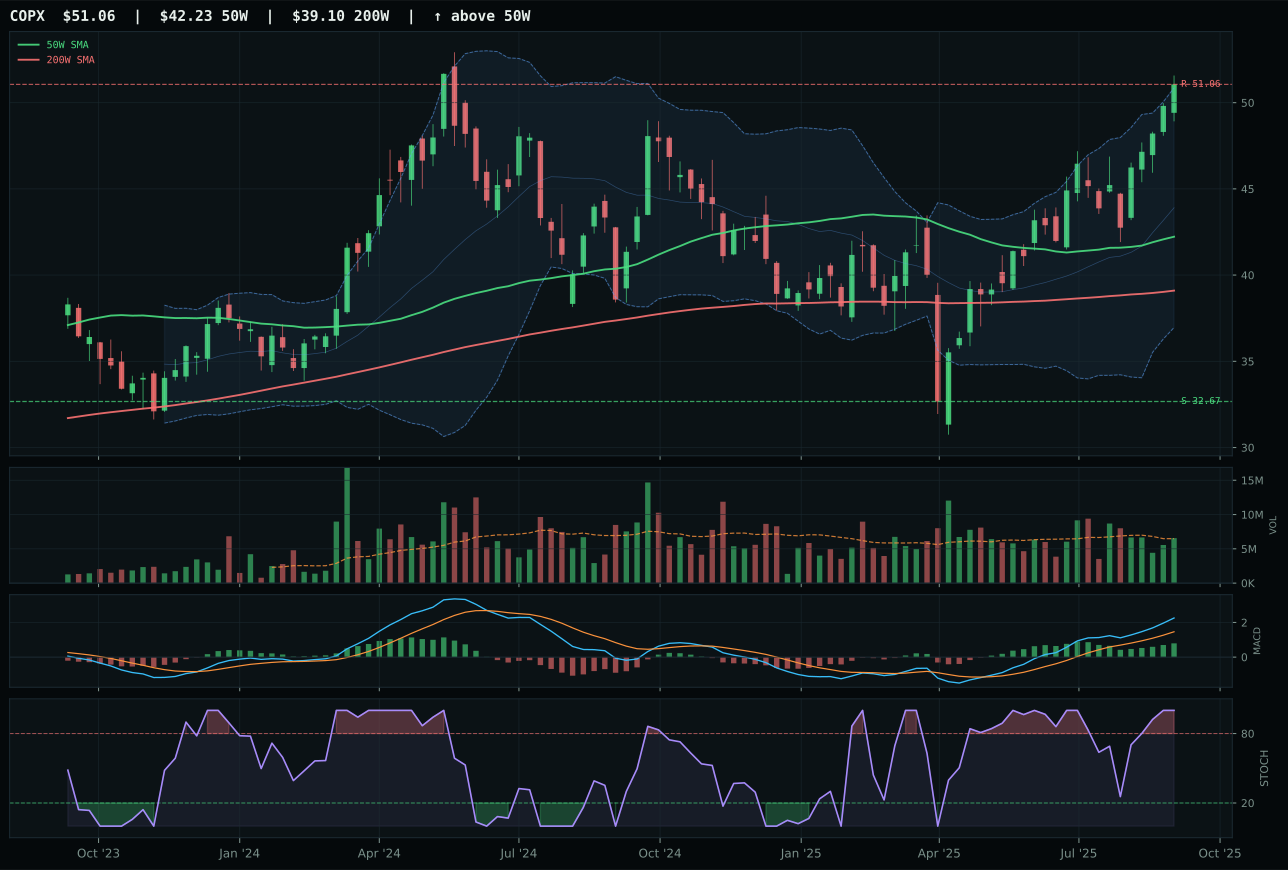
COPX has a vertical extension profile with 10.2% 13-week relative strength versus SPY.
A failed hold above support would weaken the setup.
Actionable but governed by invalidation levels.
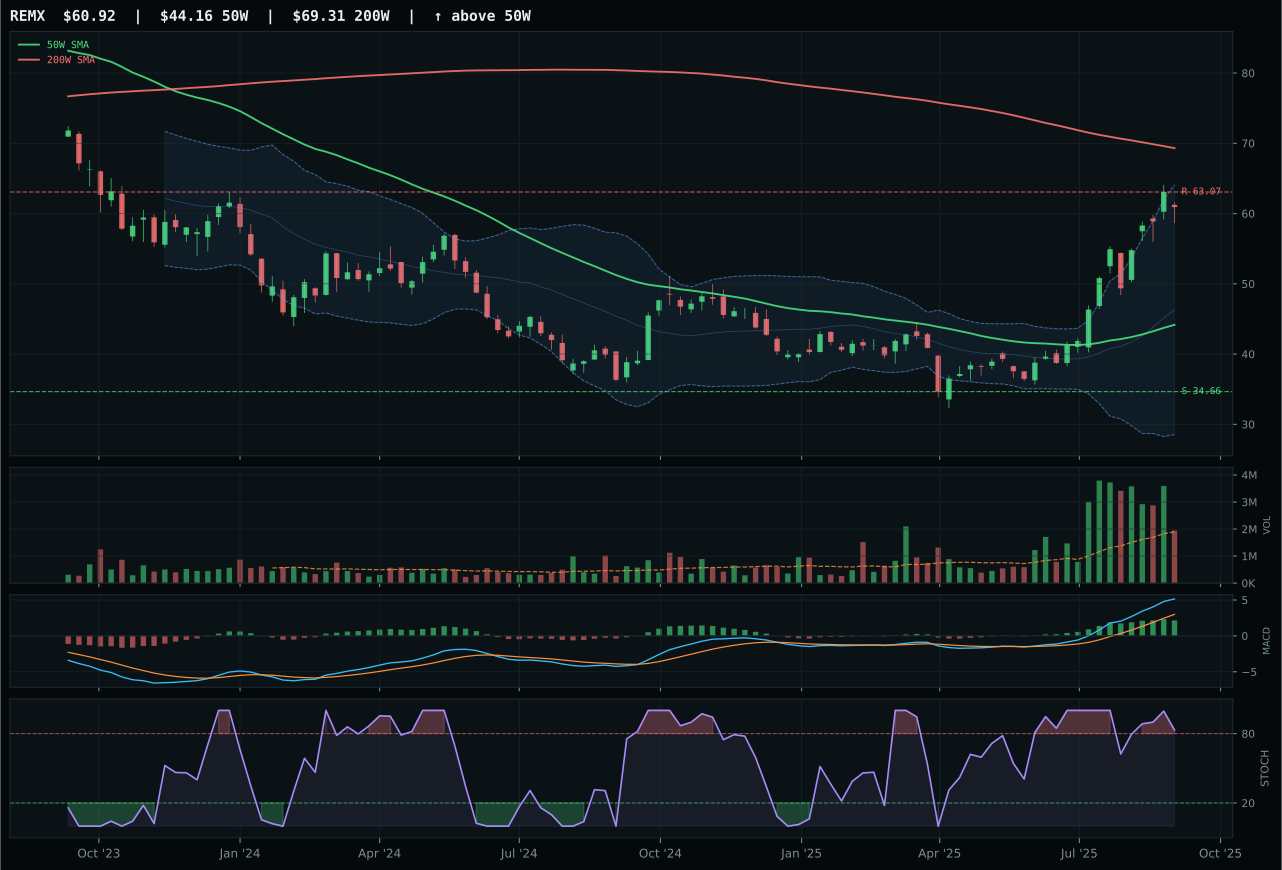
REMX has a vertical extension profile with 49.1% 13-week relative strength versus SPY.
A failed hold above support would weaken the setup.
Actionable but governed by invalidation levels.
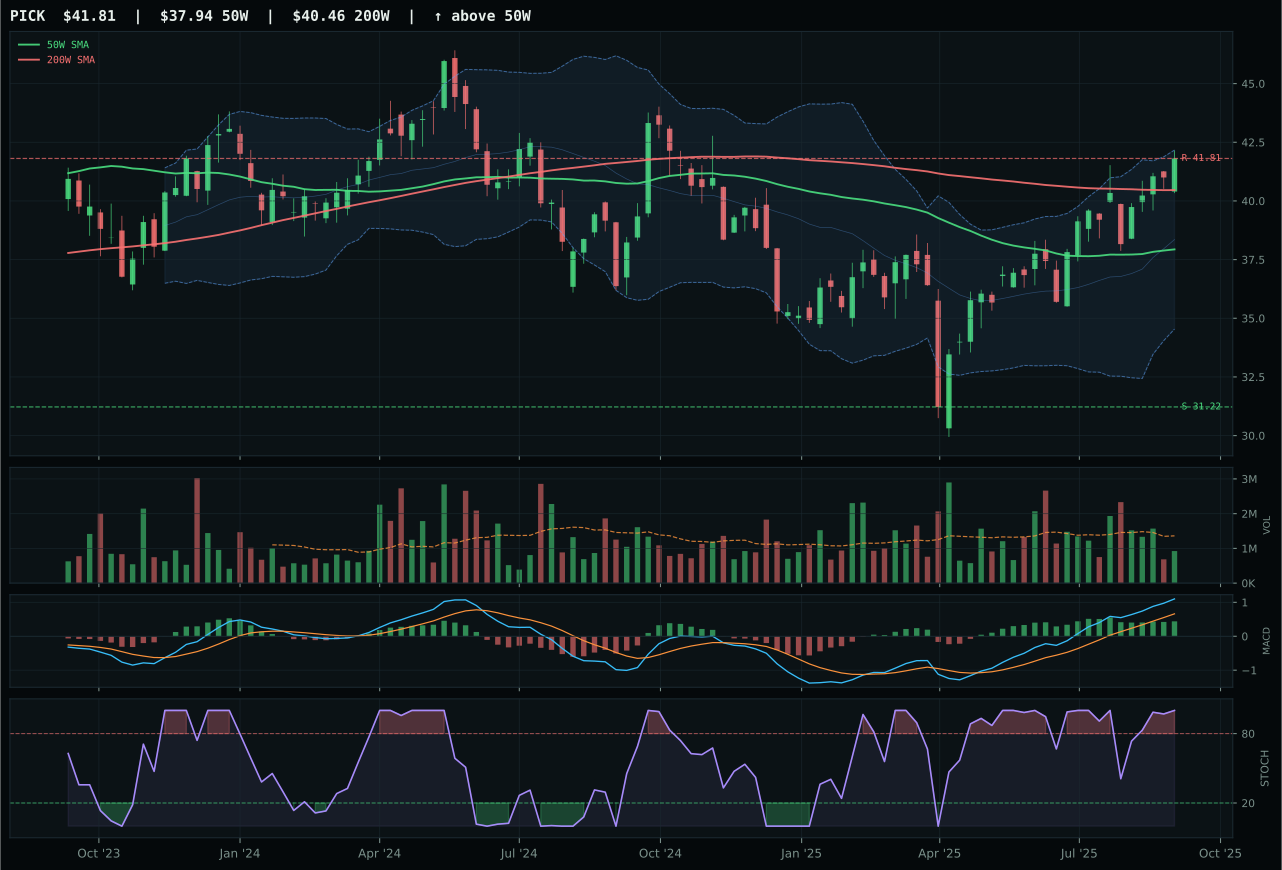
PICK has a neutral structure profile with 2.7% 13-week relative strength versus SPY.
A failed hold above support would weaken the setup.
Actionable but governed by invalidation levels.
COPX wins and claims the second top-2 slot with a flawless technical structure: 100.0 trend score from 10.2% relative strength versus SPY, 100.0 momentum confirmation from 18.2% thirteen-week return and bullish-improving MACD, and persistent volume-price sponsorship averaging 72.0 confirmation and 70.7 persistence. REMX's 49.1% relative strength advantage looks superficially superior, but that massive edge is precisely why its timing score collapses to 27.0 versus COPX's 37.0—REMX is extended to the point of exhaustion at 37.9% above the 50-week moving average with stochastic rolling over. COPX sits 20.9% extended with stochastic at peak momentum 1.00, a cleaner setup for either continuation or controlled pullback. The 15.1-point score gap is decisive: COPX's neutral volume at 1.01x versus REMX's identical neutral volume shows no volume advantage exists, but COPX's risk/reward at 39.6 versus REMX's 37.8 reflects that the extended-move risk is lower. This is a category where the winner has perfect technical alignment across trend, momentum, and timing—rare and worth noting.
Industrial Metals scores 69.0 and earns the first top-2 overweight allocation slot at 10%, cementing it as the portfolio's highest-conviction opportunity. The category's macro fit is exceptional at 65.0: metals scarcity active at +14, commodity breadth positive at +10, and real asset sponsorship at +6 create +30 base macro support despite -8 liquidity stress and -7 credit stress. The Transition / Mixed regime contributes no explicit boost, but the category proof order (REMX 71.0, COPX 69.5, PICK 64.6) shows depth—three legitimate candidates rather than a narrow concentration. COPX's selection as representative reflects the allocation layer's preference for setup cleanliness over backward momentum; the reasoner weighted technical evidence at 62% and macro fit at 38%, and the macro case is nearly as strong as the technical one. For Industrial Metals to sustain its 10% allocation, COPX must defend support at 32.67 and volume must remain near its current neutral levels; a deterioration of MACD to bullish-flattening and a drop in volume participation would demote the category within the tier-2 sleeve. The 69.0 score represents the highest-conviction macro and technical convergence in this week's portfolio.
Precious Metals — GLD
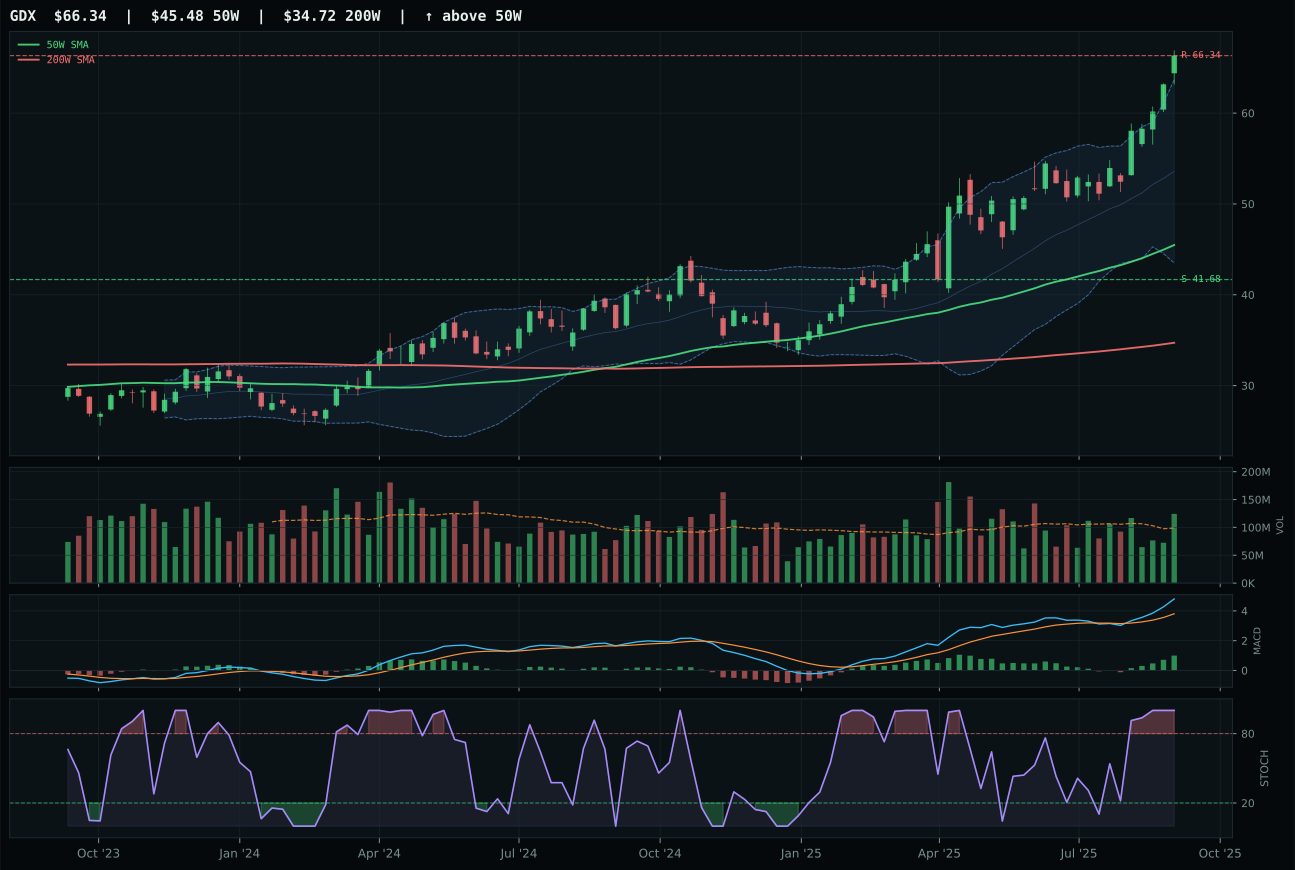
GDX has a vertical extension profile with 20.5% 13-week relative strength versus SPY.
A failed hold above support would weaken the setup.
Actionable but governed by invalidation levels.
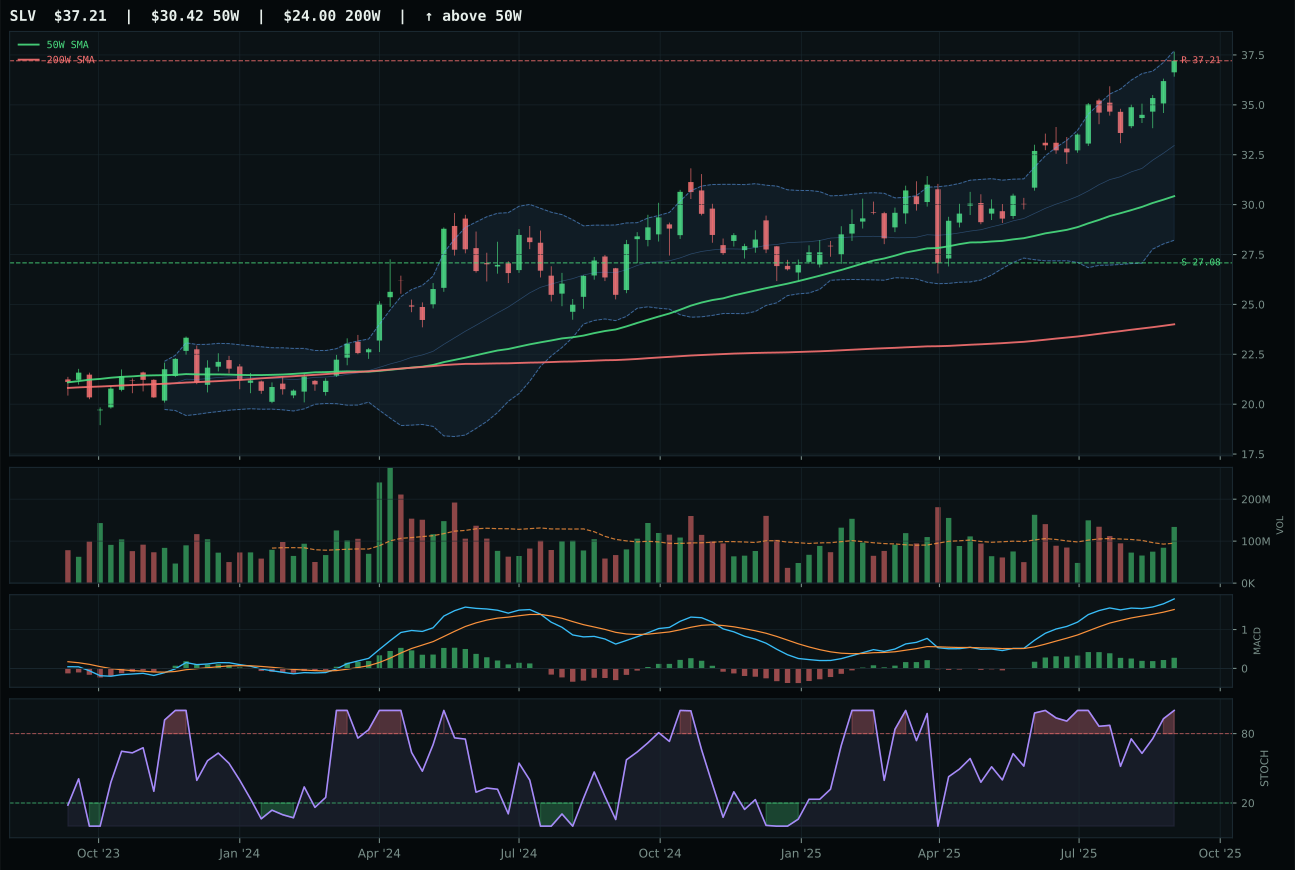
SLV has a vertical extension profile with 5.8% 13-week relative strength versus SPY.
A failed hold above support would weaken the setup.
Actionable but governed by invalidation levels.
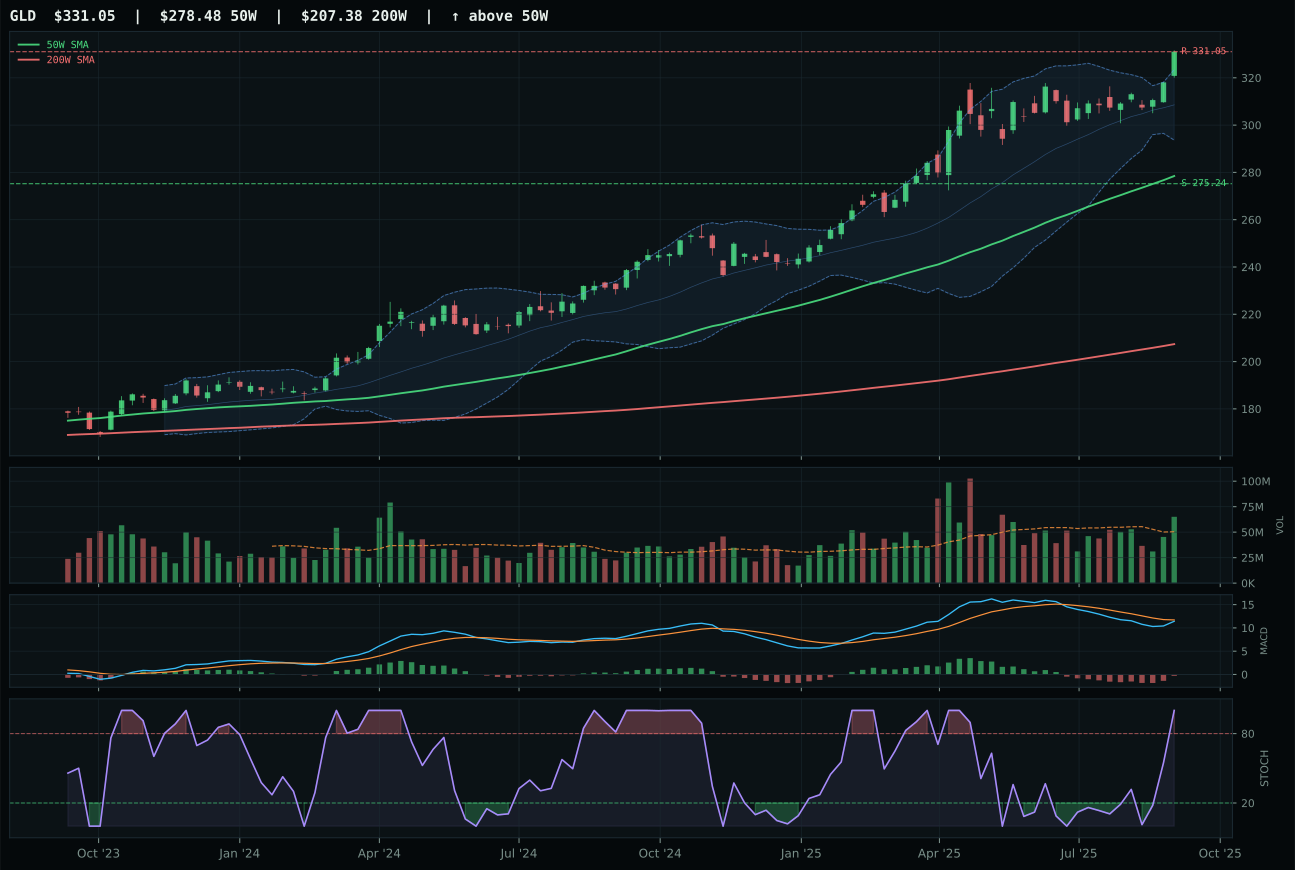
GLD has a vertical extension profile with 0.4% 13-week relative strength versus SPY.
A failed hold above support would weaken the setup.
Actionable but governed by invalidation levels.
GLD wins the category and earns top-2 status despite trailing GDX in both technical evidence and raw momentum because it trades with better risk/reward geometry and lower absolute extension from its 50-week moving average. GDX's 28.5% thirteen-week return and 20.5% relative strength versus SPY are compelling, but that 45.9% extension from the 50-week moving average means every new buyer is buying into a fully realized move; GLD sits at 18.9% extension with identical MACD signals (bullish but flattening for GLD, bullish and improving for GDX—a slight edge to the runner-up). GLD's risk/reward of 44.1 versus GDX's 39.4 reflects that gold itself offers more downside cushion to support at 20.3% away, while GDX miners face 24.9% downside to their support level. The category reasoner's proof order places SLV first at 73.1, GDX second at 72.7, then GLD at 59.8—a sequence that shows the reasoner prefers larger moves—but the final scoring layer values setup quality and entry risk asymmetry over backward-looking momentum, elevating GLD to the representative slot. This is a case where the cleanest technical setup wins despite not being the hottest performer.
Precious Metals scores 62.1 and earns top-2 overweight allocation at 10%, making it one of only two categories receiving that tier. The category's ranking reflects strong technical evidence—the 70.7 base 3/2/1 score and the SLV/GDX depth—combined with a macro environment where only risk appetite is actively penalizing it at -4. The Transition / Mixed regime itself is neutral; no active macro descriptor helps or hurts Precious Metals beyond the risk appetite drag. What elevates this category to top-2 is the convergence of three forces: metals scarcity is not an active descriptor, but the category scoring implicitly values real asset sponsorship; commodity breadth positive supports the entire basket; and Precious Metals sits at a natural technical inflection where GLD shows above-average volume participation at 1.29x, suggesting accumulation into extension. The 62.1 score edges out Utilities & Infrastructure at 52.0 and Defense & Aerospace at 49.0, landing the category in the top two by technical rank and macro coherence. For Precious Metals to maintain its allocation, GLD must hold above support at 275.24 and volume must persist; a break of that level with falling volume would shift the category logic downward within weeks.
Nuclear Energy — URNM
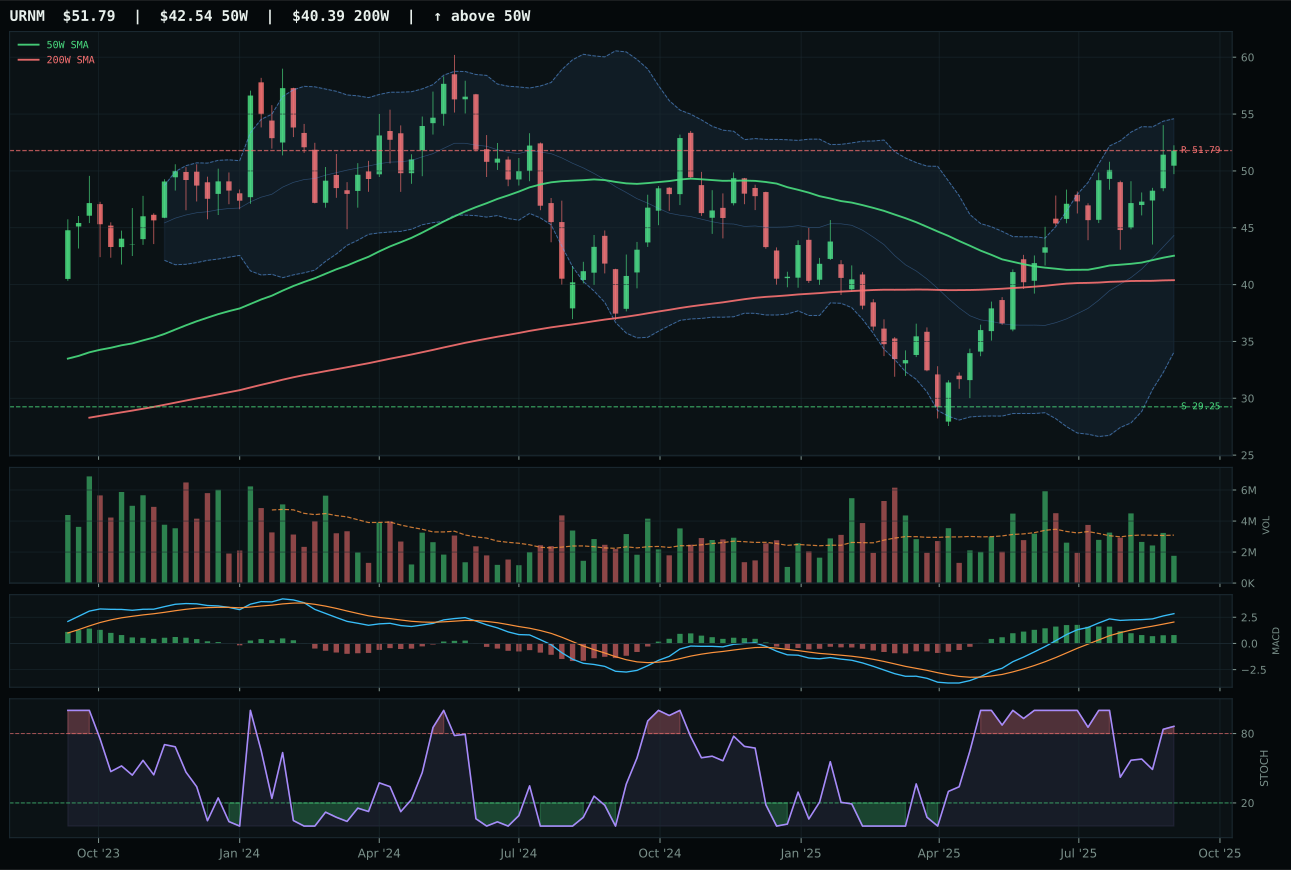
URNM has a vertical extension profile with 15.6% 13-week relative strength versus SPY.
A failed hold above support would weaken the setup.
Actionable but governed by invalidation levels.
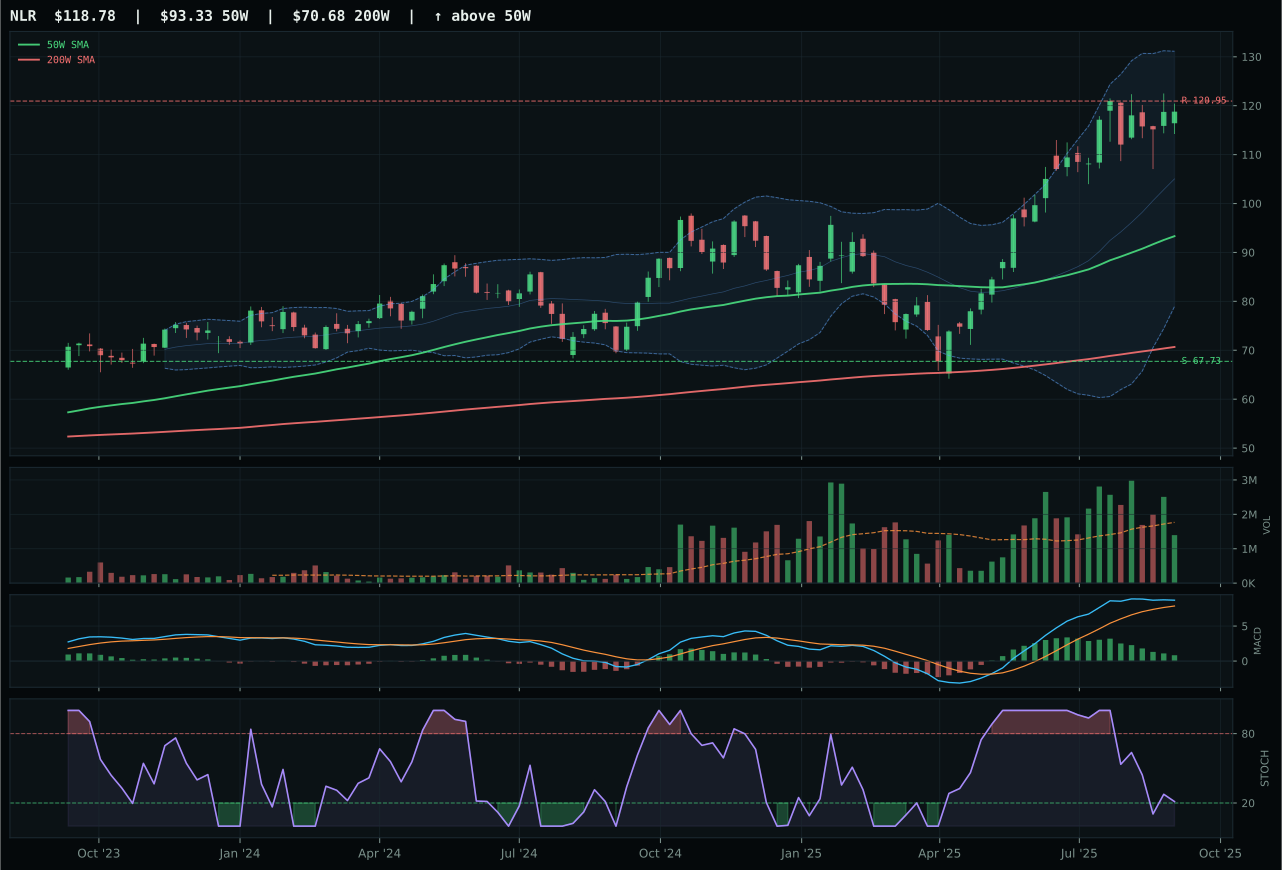
NLR has a vertical extension profile with 11.2% 13-week relative strength versus SPY.
A failed hold above support would weaken the setup.
Actionable but governed by invalidation levels.
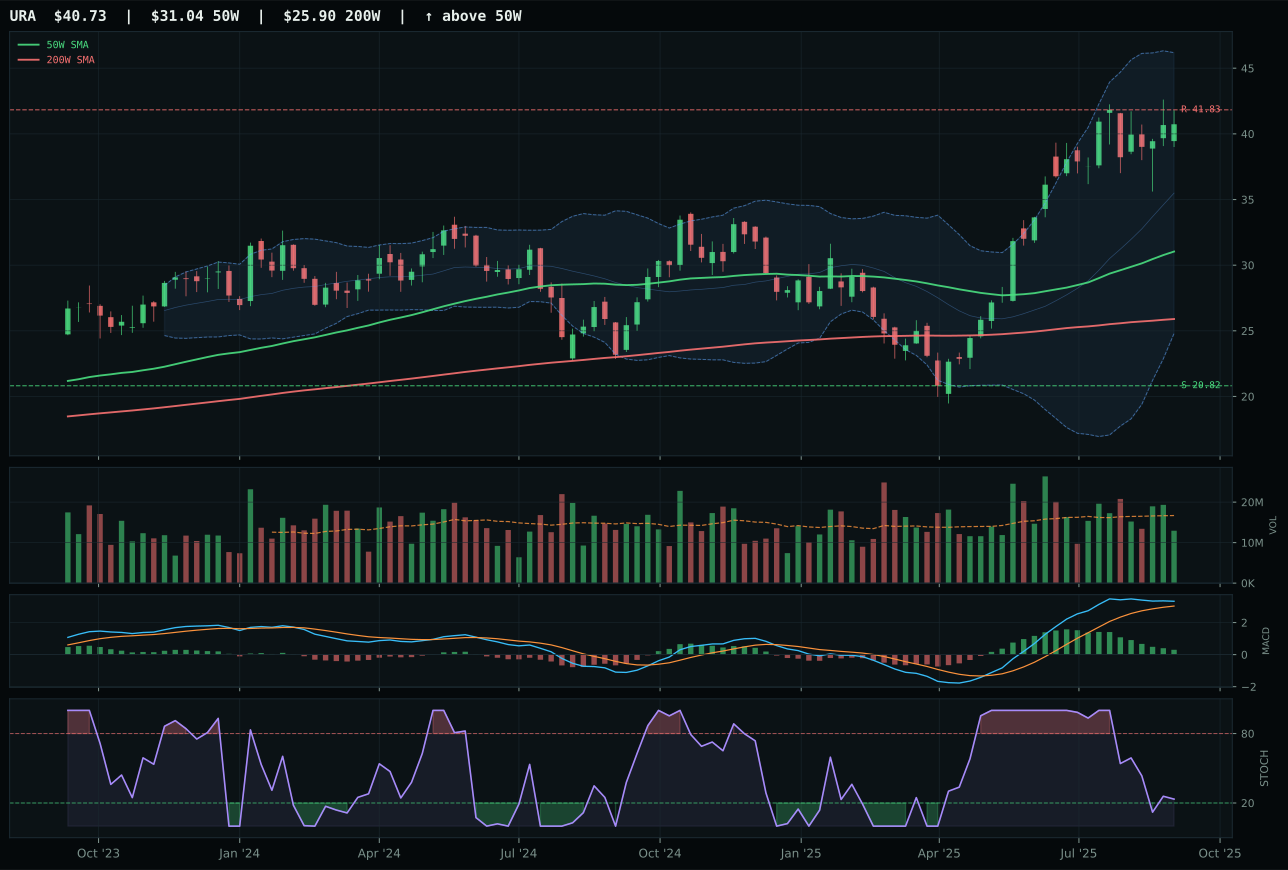
URA has a vertical extension profile with 13.0% 13-week relative strength versus SPY.
A failed hold above support would weaken the setup.
Actionable but governed by invalidation levels.
URNM wins with the highest absolute momentum scores in the entire ten-category dataset: 100.0 trend from 15.6% relative strength versus SPY, 100.0 momentum confirmation from 23.6% thirteen-week return and bullish-improving MACD, and 80.3 persistence showing sustained volume-price sponsorship. NLR trails on timing (40.0 vs 32.0 for URNM) because it is more extended from the 50-week moving average at 27.3% versus URNM's 21.7%, though both sit near 52-week highs. NLR's stochastic RSI is falling neutral at 0.43 while URNM's is at peak momentum 0.86, creating a momentum divergence that favors continuation for URNM but adds whipsaw risk. URNM's thin participation at 0.57x its 20-week average is weaker than ideal, but the persistence score of 80.3 suggests volume is confirming each new high despite low absolute volume—a sign of institutional accumulation rather than retail chasing. The 8.2-point score gap reflects URNM's clear technical leadership, though both candidates deserve scrutiny given their vertical extension from key moving averages.
Nuclear Energy scores 57.4 and earns tier-2 allocation at 5%, not a top-2 slot despite its exceptional momentum readings. The category macro fit is 50.0—dead center between support and headwind—with real asset sponsorship at +7 and AI growth sponsorship at +5 balancing -7 liquidity stress and -5 credit stress. The Transition / Mixed regime contributes no boost. What keeps Nuclear from top-2 is timing: while URNM's trend score is perfect, its timing score of 32.0 is low due to its 21.7% extension from the 50-week moving average; the reasoner correctly identified that momentum and extension have diverged and that entry risk has risen. URA sits first in the proof order at 57.6 versus URNM's 55.9, showing the reasoner prefers slightly less stretched setups even when momentum is similar. For Nuclear to reach top-2 status, URNM would need to consolidate into the upper 30s and build a coil structure while maintaining volume, lowering extension and improving timing scores; alternatively, AI growth sponsorship would need to shift from +5 to a higher lever if applied descriptors changed. At 5%, Nuclear represents conviction on long-term energy transition thematic, but not the highest-conviction entry geometry.
AI — AIQ
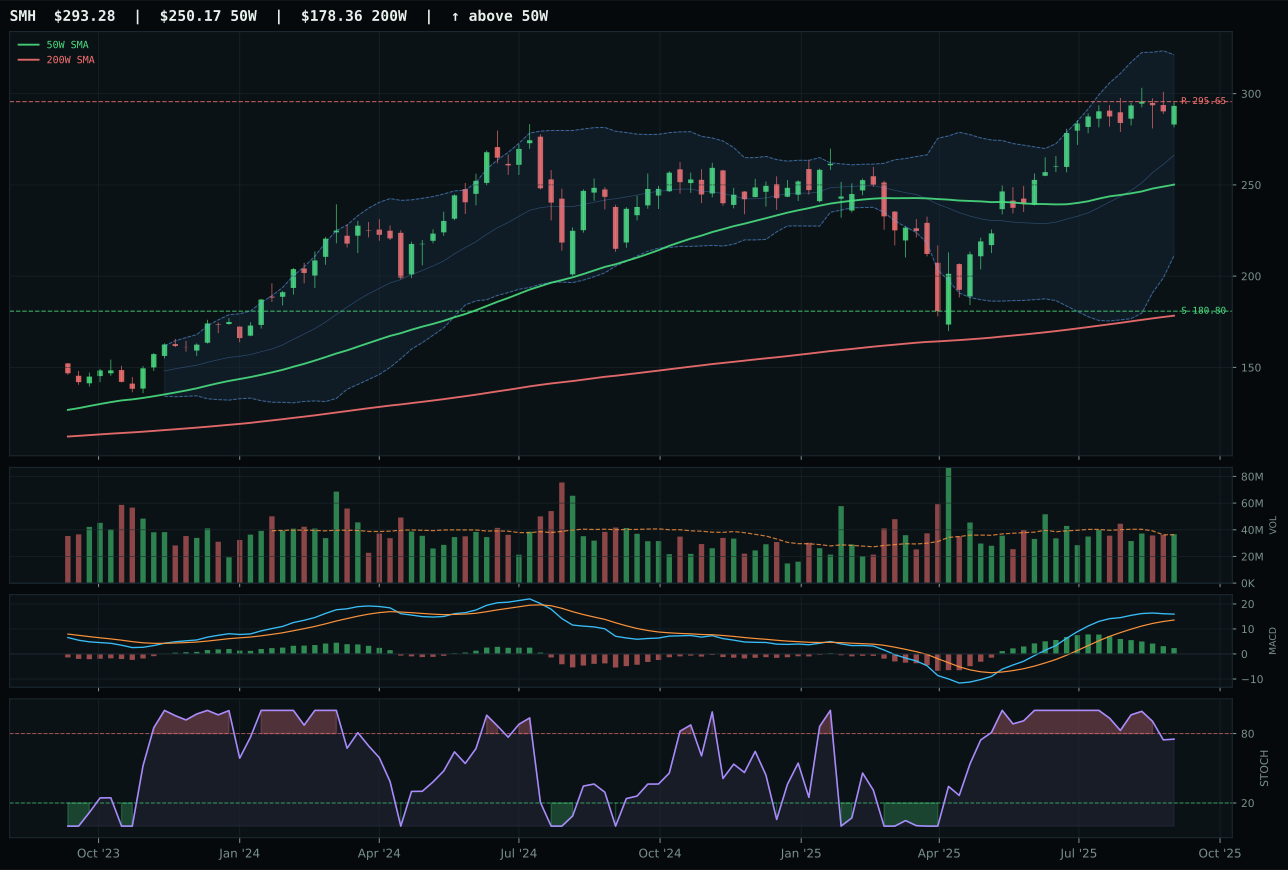
SMH has a vertical extension profile with 8.0% 13-week relative strength versus SPY.
A failed hold above support would weaken the setup.
Actionable but governed by invalidation levels.
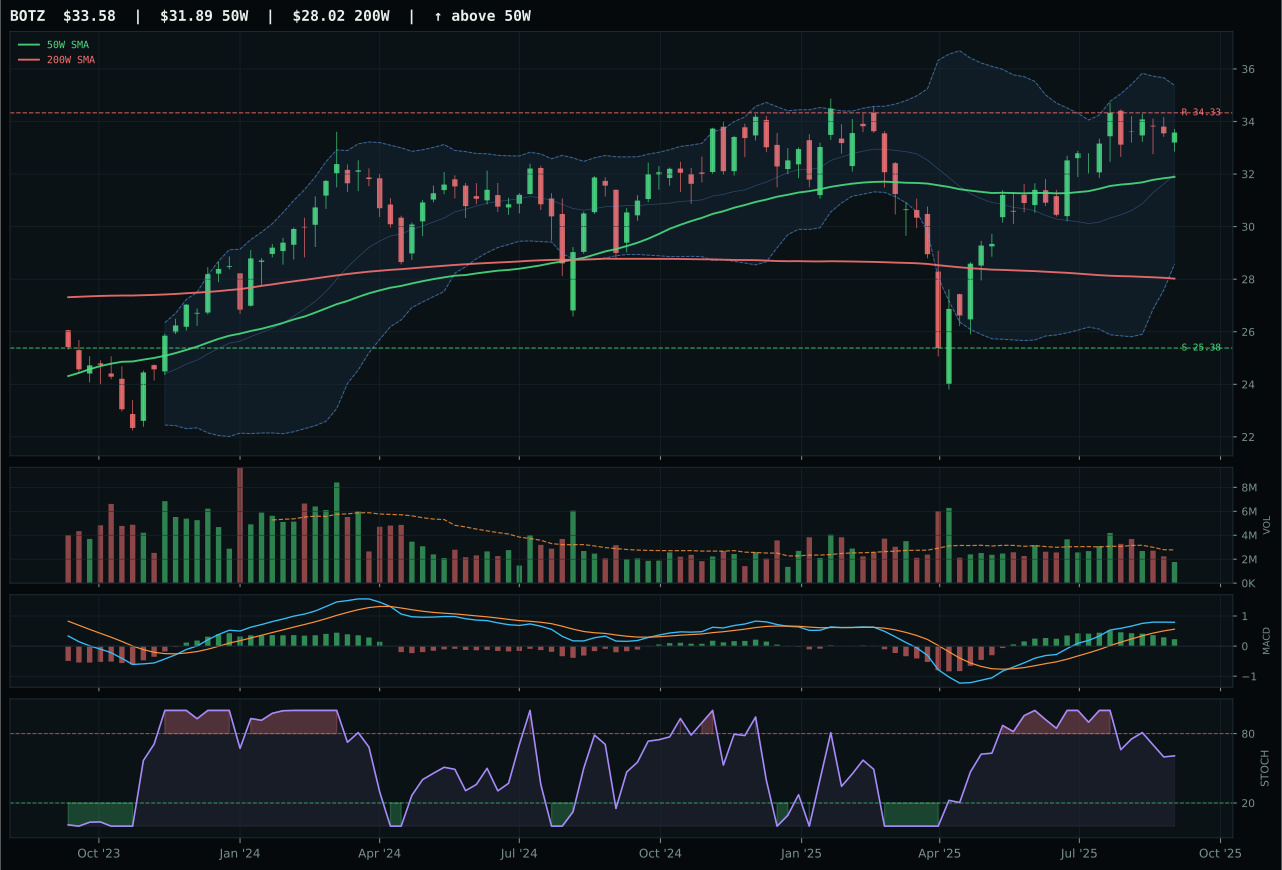
BOTZ has a neutral structure profile with -1.1% 13-week relative strength versus SPY.
A failed hold above support would weaken the setup.
Actionable but governed by invalidation levels.
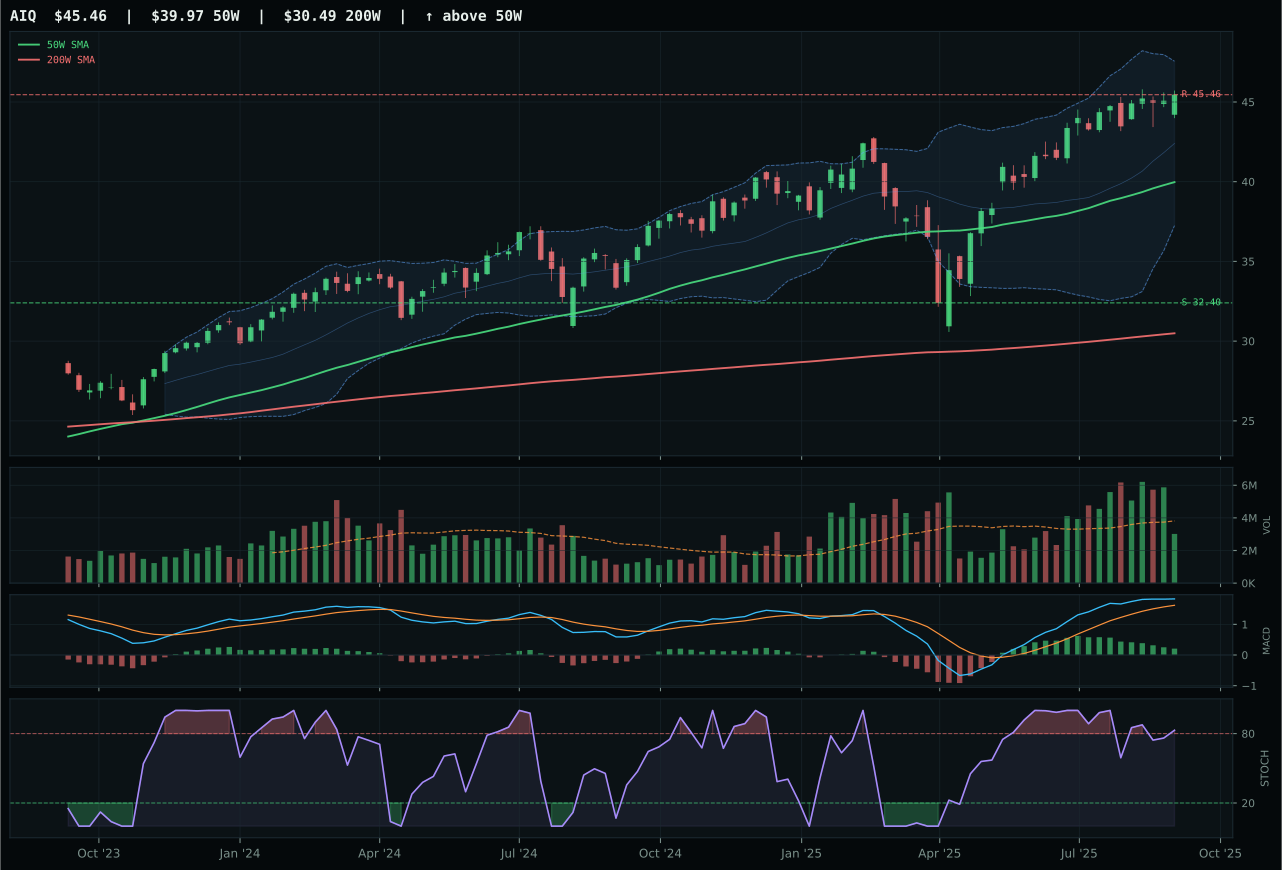
AIQ has a neutral structure profile with 1.2% 13-week relative strength versus SPY.
A failed hold above support would weaken the setup.
Actionable but governed by invalidation levels.
AIQ edges out SMH by a razor-thin 0.7-point margin because it trades at a lower extension and offers better risk/reward despite identical bullish-but-flattening MACD and near-identical macro sponsorship. AIQ sits 13.7% from its 50-week moving average with overbought stochastic RSI rolling over at 0.83, while SMH is even more stretched at a vertical extension with stochastic falling neutral—the technical difference is that AIQ's rollover is at peak momentum rather than mid-fade, creating a cleaner pullback signal if support breaks. SMH's 16.0% thirteen-week return and 8.0% relative strength versus SPY are superior to AIQ's 9.2% and 1.2% respectively, but that outperformance is precisely why its 40.0 timing score trails AIQ's 44.0; SMH has already run far ahead of the category median and absorbed most near-term buyers. Both are tight on structure quality and both carry thin participation or neutral volume, but AIQ's risk/reward of 40.6 versus SMH's 37.2 reflects the geometric reality that SMH's larger edge leaves less room for follow-through. This is not a conviction win—it is a process win based on positioning and entry asymmetry.
AI ranks third among the ten categories with a final score of 57.3 but receives only tier-2 allocation at 5%, not top-2 status. The category won strong technical evidence from its three-ETF basket (60.5 base after 3/2/1 weighting) and solid macro fit at 54.0, driven by active AI growth sponsorship at +14 and risk appetite at +10. Yet two other categories scored higher in the final reasoning layer, and that rank matters in a zero-sum allocation framework. The key tension is timing: yes, AIQ shows 97.8 trend strength and 61.5 momentum confirmation, but its 44.0 timing score and 40.6 risk/reward signal that the move is extended relative to its support structure. Macro environment matters too—liquidity stress at -12 and credit stress at -8 mean this category is swimming against two active headwinds despite positive risk appetite. For AI to reclaim a top-2 slot, either the category would need to consolidate and form a cleaner base (shifting timing scores upward) or macro stress would need to ease. Today, 5% reflects the paradox of owning a structurally sound category in a regime that is punishing extended leadership.
Utilities & Infrastructure — PAVE
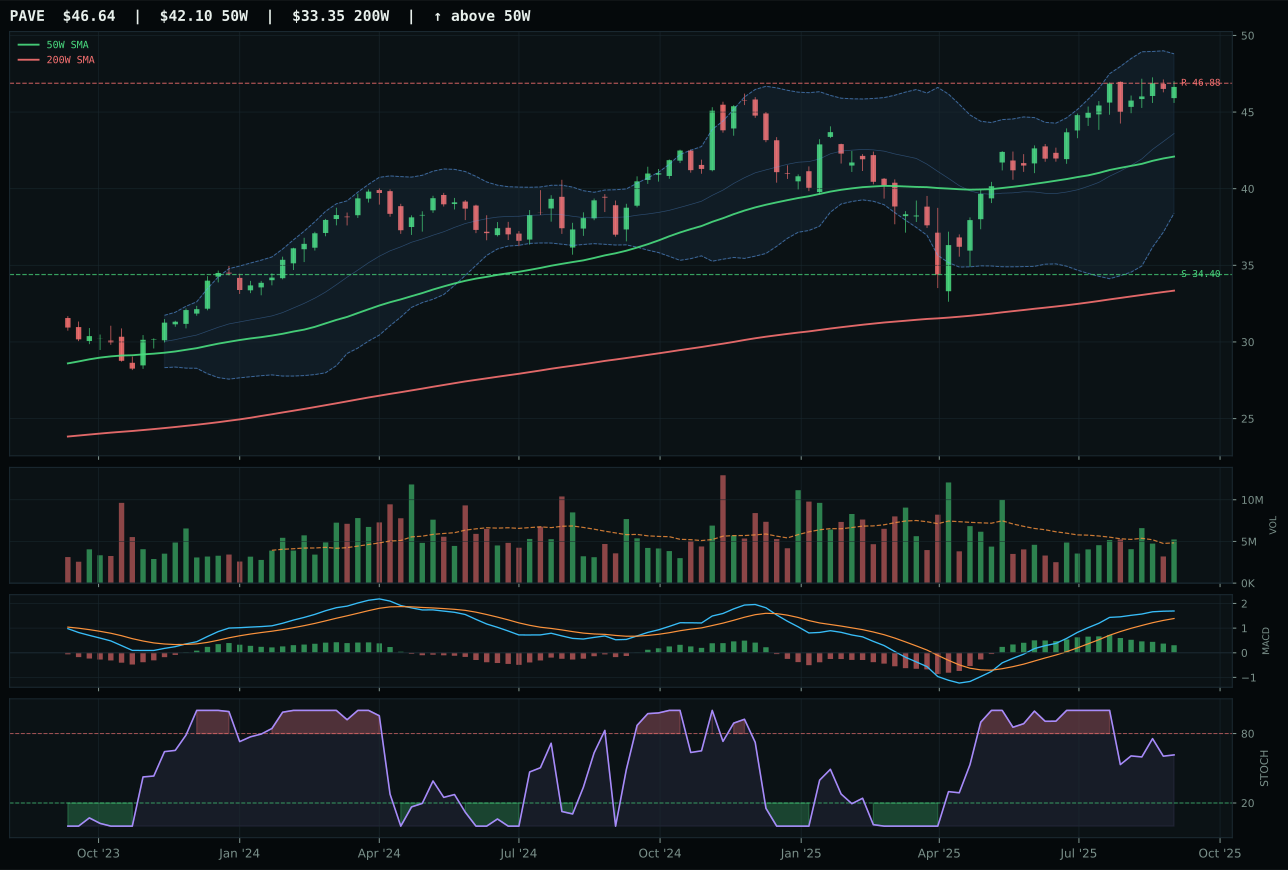
PAVE has a neutral structure profile with 1.4% 13-week relative strength versus SPY.
A failed hold above support would weaken the setup.
Actionable but governed by invalidation levels.
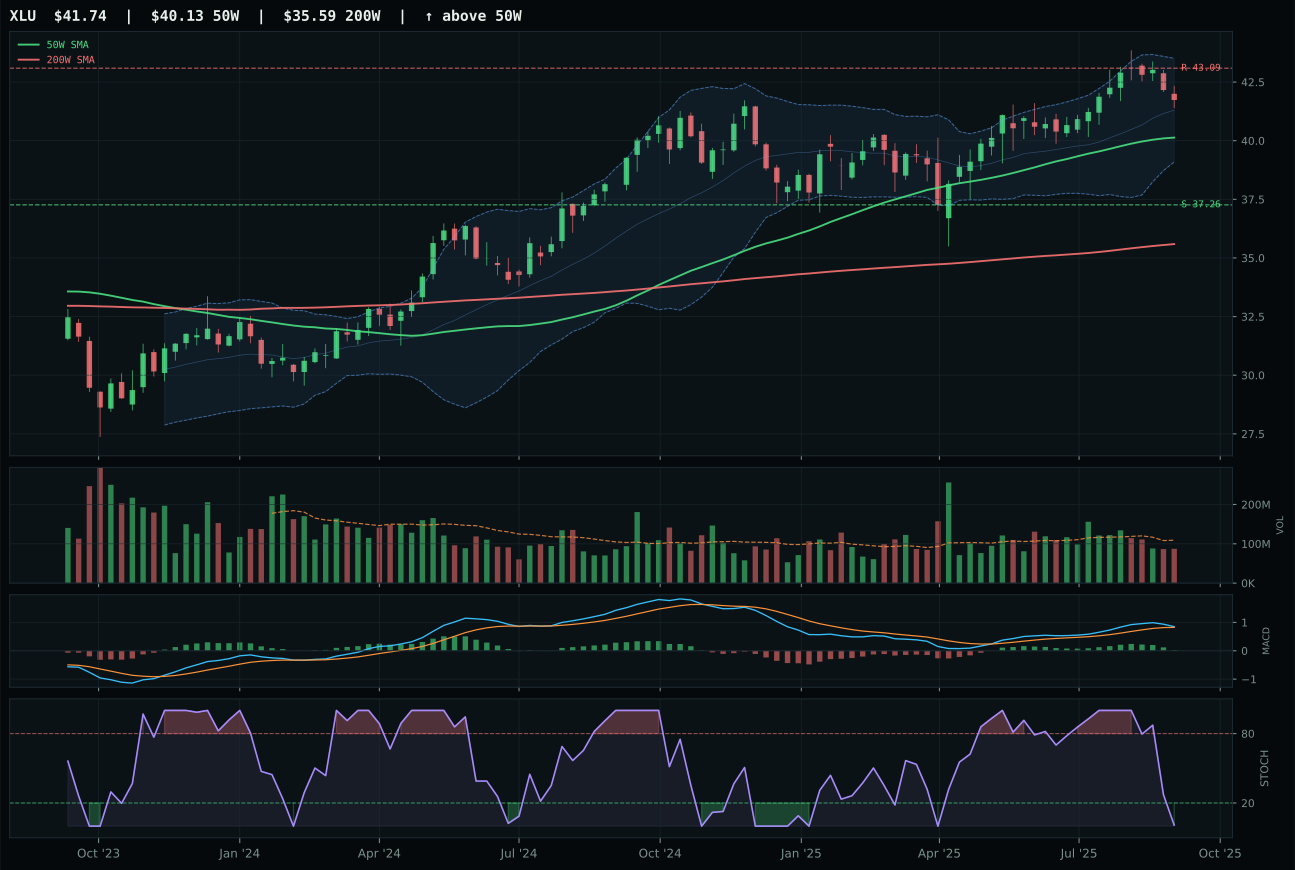
XLU has a neutral structure profile with -5.2% 13-week relative strength versus SPY.
A failed hold above support would weaken the setup.
Actionable but governed by invalidation levels.
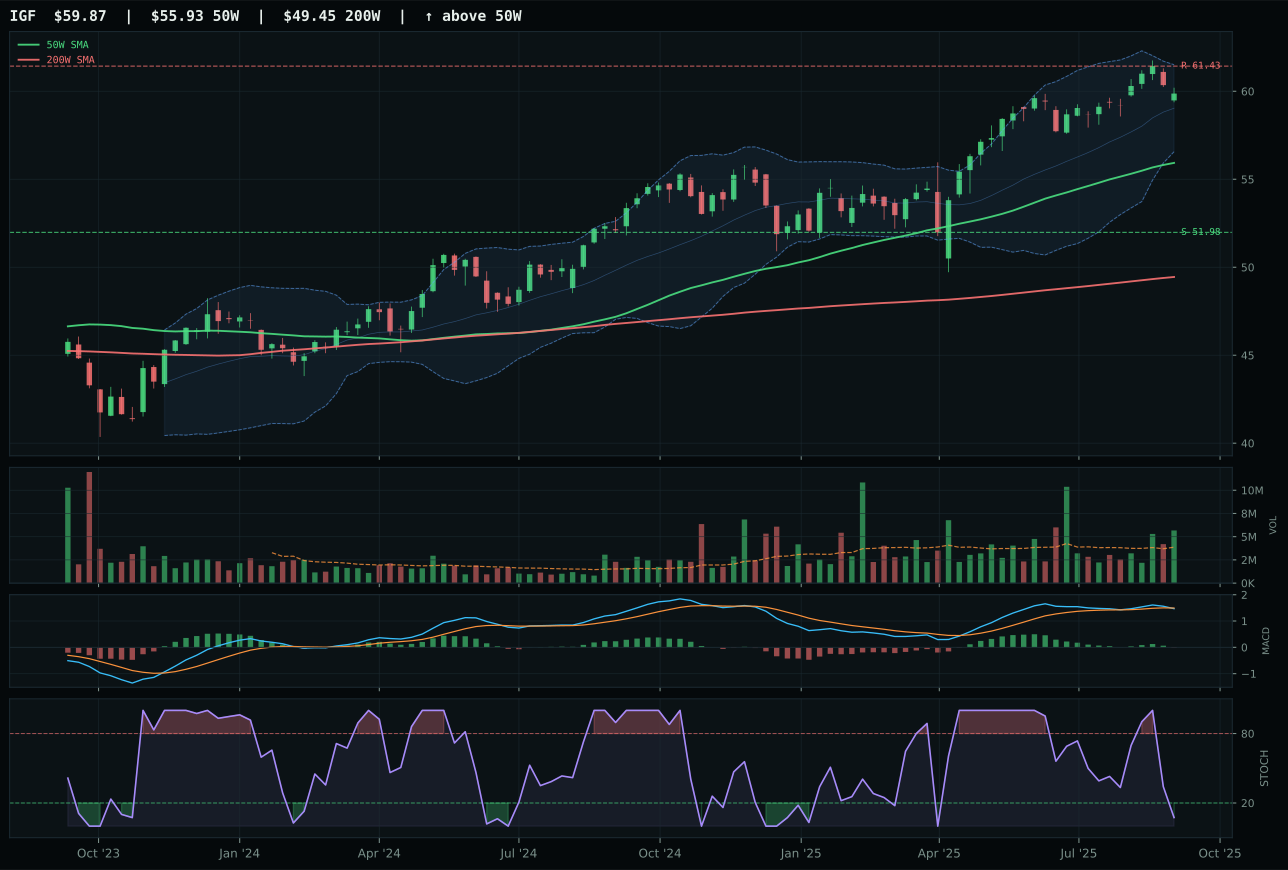
IGF has a neutral structure profile with -7.6% 13-week relative strength versus SPY.
A failed hold above support would weaken the setup.
Actionable but governed by invalidation levels.
PAVE wins by combining the highest technical evidence score in the category at 78.7 with superior category-relative strength and MACD confirmation. PAVE's 98.1 trend score reflects price well above both moving averages with positive 50-week slope; its 70.0 timing score and rising stochastic RSI at 0.62 offer better entry geometry than XLU's oversold 0.27 stochastic reading. XLU's -5.2% relative strength versus SPY lags PAVE's 1.4%, and more importantly, PAVE's 6.6% category-relative strength tower over XLU's 0.0%, indicating PAVE is the category leader within its own basket. Both show bullish-but-flattening MACD, but PAVE's rising stochastic RSI suggests momentum is refreshing while XLU's falling stochastic implies momentum is fading. PAVE's 81.2 momentum confirmation versus XLU's 45.0 reflects that PAVE has 9.4% thirteen-week return with 6.6% category relative strength while XLU has only 2.8% thirteen-week return. The 5.2-point gap is decisive for a category where the economic thesis is defensive but the technical momentum can shift allocator preference.
Utilities & Infrastructure scores 52.0 and earns tier-2 allocation at 5%, a mid-tier slot that reflects decent technical evidence clouded by marginal macro fit. Macro fit stands at 49.0, barely above neutral, with the Transition / Mixed regime adding +4 but -3 liquidity stress and -2 risk appetite drag offsetting that gain. The category proof order places PAVE at 69.5, a solid reasoned score, but XLU at 57.7 and IGF at 37.0 show the category lacks the depth of Industrial Metals or Precious Metals. PAVE's 52.0 final score reflects that the category is technically sound but not macro-tailored for the current regime—utilities and infrastructure are neither growth engines nor defensive havens in a Transition / Mixed environment. For Utilities & Infrastructure to earn top-2 status, the macro regime would need to shift toward explicit deflation fears or credit stress reversal, which would make defensive regulated utilities and infrastructure capex the preferred positioning. Currently, at 5%, the category represents exposure to domestic capex and infrastructure themes without overcommitting to a sector that macro stress is not particularly favoring. PAVE's strong technical setup within the category warrants the slot, but portfolio-wide, two other categories offer better risk-adjusted returns.
Defense & Aerospace — XAR
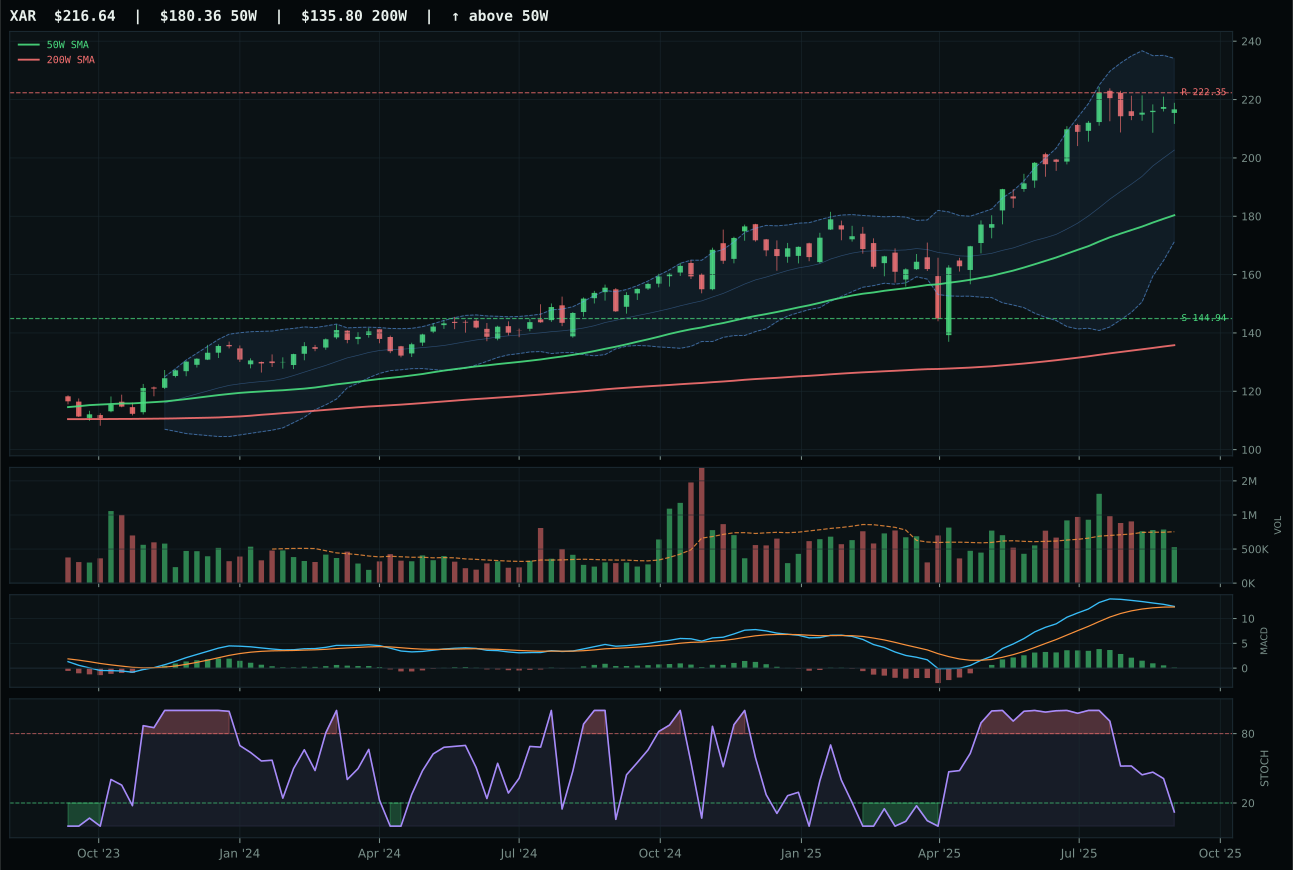
XAR has a vertical extension profile with 1.2% 13-week relative strength versus SPY.
A failed hold above support would weaken the setup.
Actionable but governed by invalidation levels.
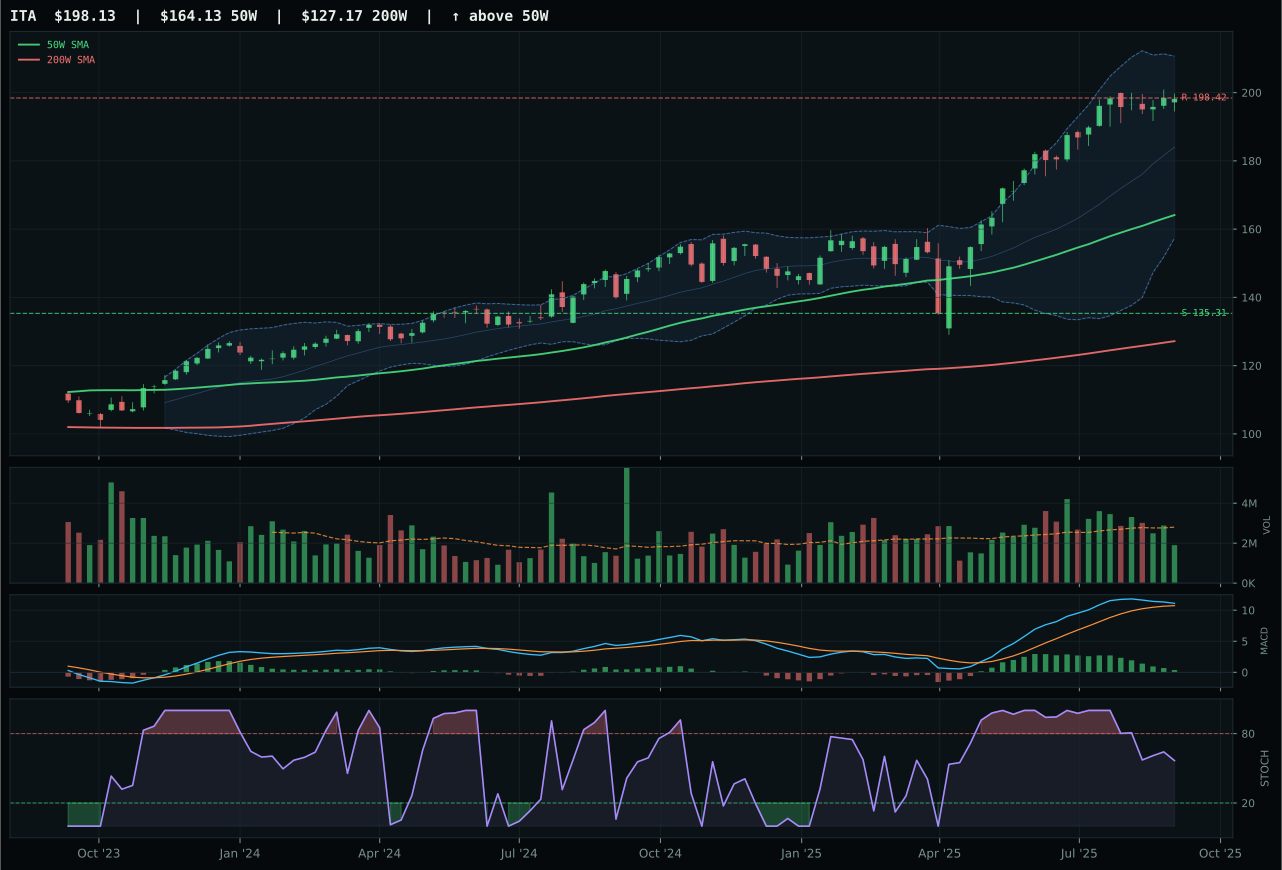
ITA has a vertical extension profile with 0.9% 13-week relative strength versus SPY.
A failed hold above support would weaken the setup.
Actionable but governed by invalidation levels.
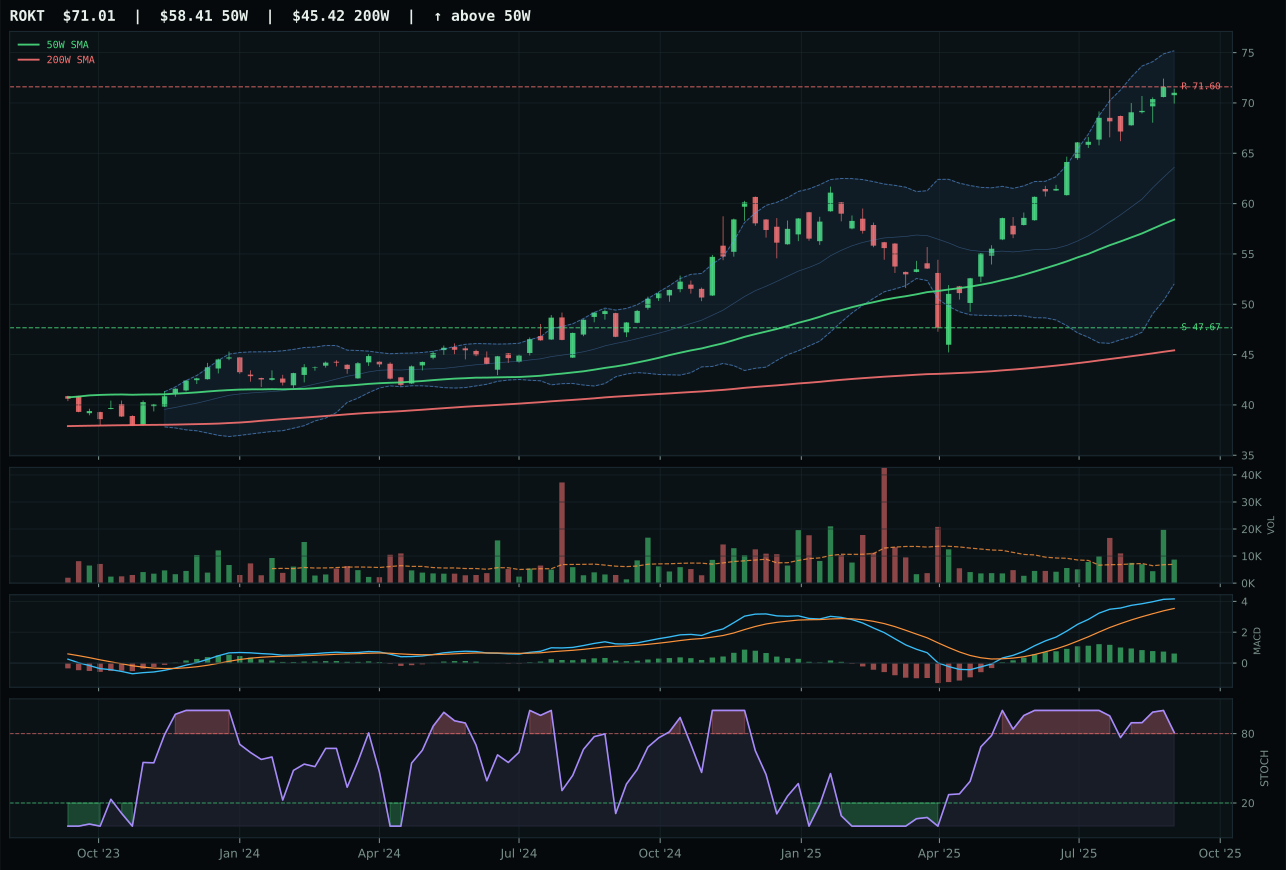
ROKT has a vertical extension profile with 9.0% 13-week relative strength versus SPY.
A failed hold above support would weaken the setup.
Tracked, but not top-2 eligible because: .
XAR wins by the narrowest margin—just 0.4 points over ITA—because it maintains marginally better structure cleanliness and category-relative strength in a setup where both contenders are genuinely stretched. Both sit in vertical extension 20%+ above their 50-week moving averages, both carry thin participation, and both post identical 9.2% thirteen-week returns. XAR's stochastic RSI is oversold at 0.12 while ITA's is falling neutral; in an extended setup, oversold extremes can sometimes signal consolidation rather than capitulation, giving XAR a fractional edge on timing. Category-relative strength proves decisive: XAR posts exactly 0.0% versus its category median while ITA lags by 0.3%, a small but measurable difference in a clustered peer set. Risk/reward barely separates them at 37.9 versus 37.1, both penalizing entry at these levels. The real story is that Defense & Aerospace has run hard and neither XAR nor ITA offers a clean setup—this is a category where all three candidates (XAR, ITA, and ROKT) are already extended, making the category win more about avoiding the worst setup than finding the best one.
Defense & Aerospace scores 49.0 and earns tier-2 allocation at 5%, not a top-2 spot. The category benefited from a Transition / Mixed macro regime that added +3 to its reasoning layer, and credit stress was marginally helpful at +2, but liquidity stress cost -4. Category-level macro fit stands at 51.0, barely above neutral. The deeper issue is setup quality: the 3/2/1 weighted basket started at 51.8, and the final score of 49.0 reflects the reasoner penalizing the category for vertical extension, thin volume participation, and asymmetric risk/reward where upside to resistance is nearly flat while downside to support spans 49.5%. This is a category owned for its macro defensive properties—defense equities perform when geopolitical risk rises—but the technical setup shows the trade is already crowded and priced. To earn top-2 status, XAR would need to consolidate closer to its 50-week moving average, improving timing from its current 40.0 score, or credit stress would need to reverse such that the macro case strengthens. At 5%, Defense & Aerospace represents a tactical hedge rather than core conviction.
Technology — CIBR
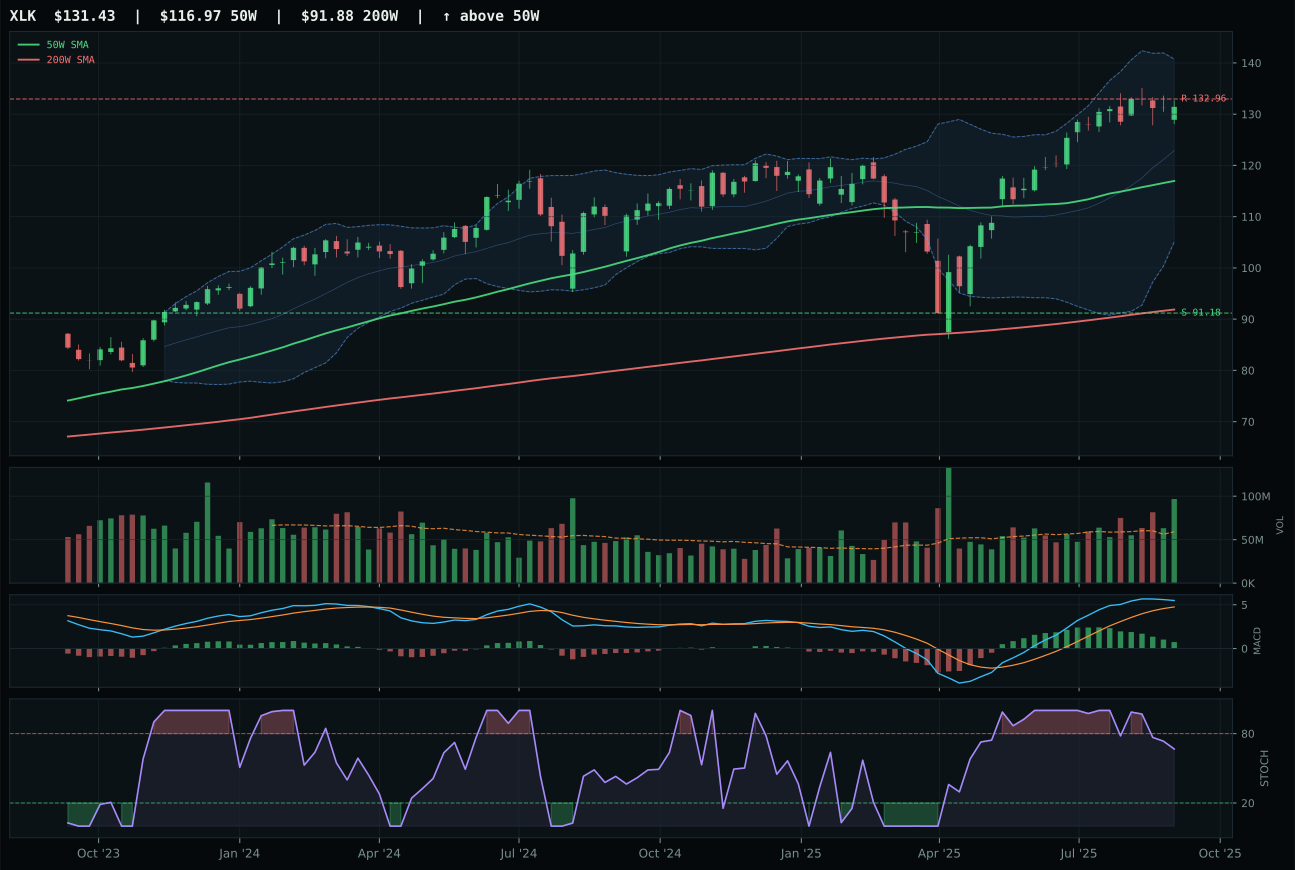
XLK has a neutral structure profile with 2.3% 13-week relative strength versus SPY.
A failed hold above support would weaken the setup.
Actionable but governed by invalidation levels.
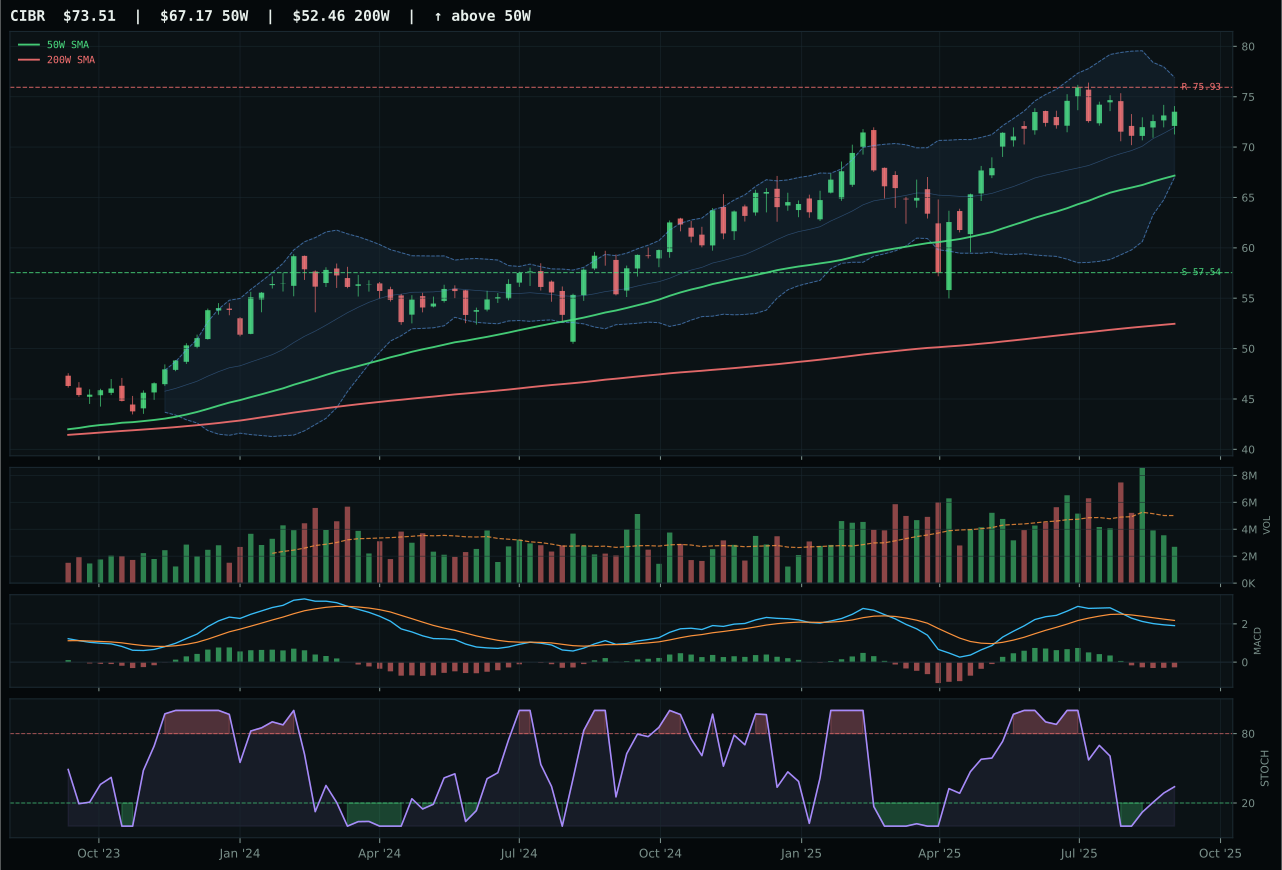
CIBR has a neutral structure profile with -8.0% 13-week relative strength versus SPY.
A failed hold above support would weaken the setup.
Actionable but governed by invalidation levels.
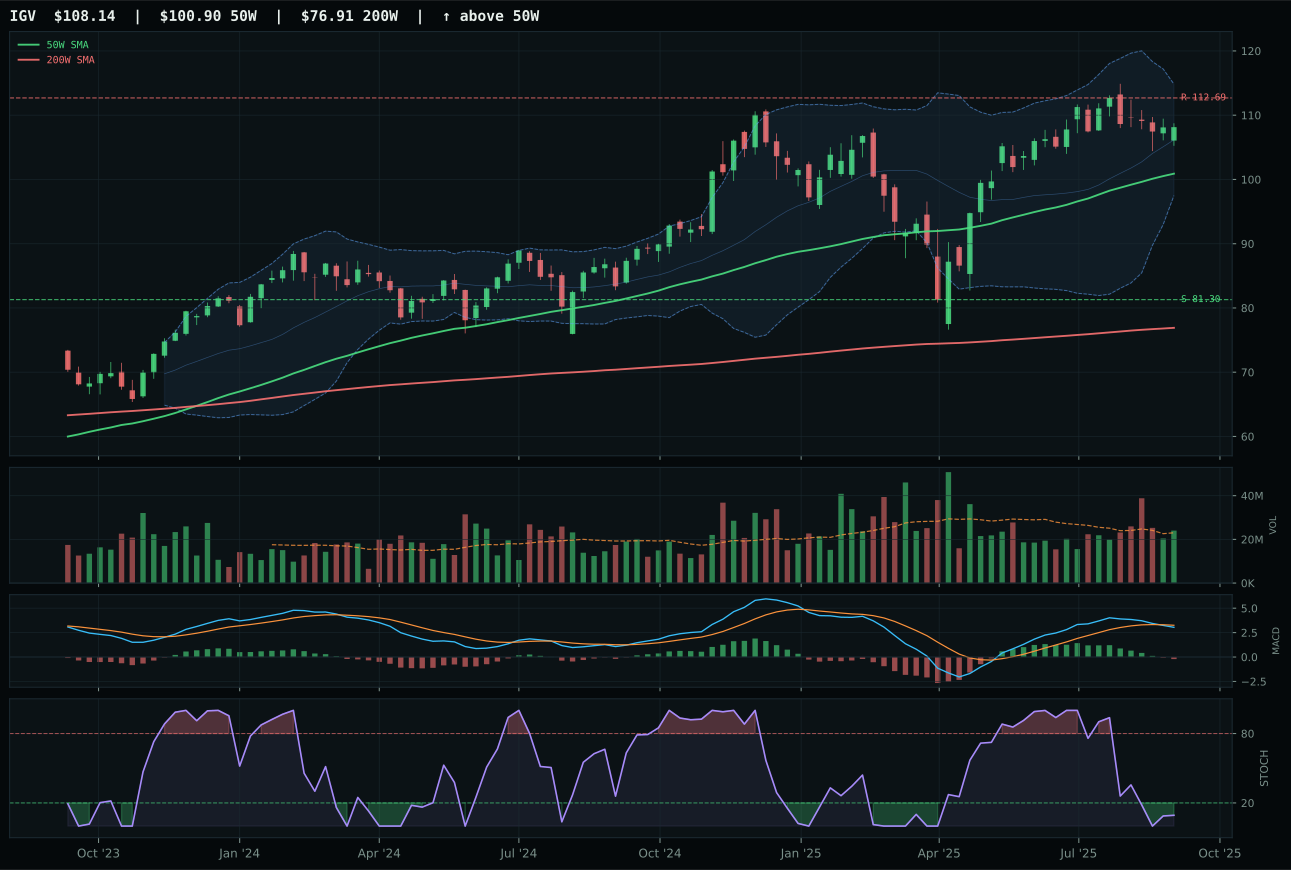
IGV has a neutral structure profile with -6.0% 13-week relative strength versus SPY.
A failed hold above support would weaken the setup.
Actionable but governed by invalidation levels.
CIBR wins the category despite trailing XLK in absolute trend strength because its timing setup is materially superior—a rising stochastic RSI mid-zone at 0.34 versus XLK's falling/neutral reading provides better entry geometry on a pullback. XLK's 10.3% thirteen-week return and 2.3% relative strength versus SPY look attractive on paper, but that outperformance has already pushed the chart 8.2% ahead of its three-ETF category median; CIBR's flat 0.0% thirteen-week return and -2.0% category-relative weakness actually position it as the less exhausted candidate. The critical distinction: XLK's MACD is bullish but flattening with stochastic RSI falling—a momentum divergence warning that new buyers are late to a crowded trade. CIBR's MACD weakness is offset by rising stochastic momentum, suggesting a coil before potential expansion rather than a fade after a run. Both sit in neutral structure with support well below, but CIBR's 78.0 timing score versus XLK's 62.0 reflects a setup where risk/reward has not yet inverted against fresh accumulation.
Technology ranks fifth among the ten categories this week and receives a tier-2 allocation of 5%. The category's 43.4 final score reflects genuine technical evidence clouded by a macro environment that actively penalizes it—risk appetite remains positive and AI growth sponsorship is live, but liquidity stress and credit stress together strip -16 points from category-level macro fit. The Transition / Mixed regime itself is neutral to this exposure. What holds Technology back from top-tier status is the absence of relative strength leadership: even the category winner trails SPY-relative performance and the basket median, meaning this is a defensive rebalance into a weakening complex rather than a breakout into new demand. For Technology to earn a top-2 slot, the category's reasoned ETF proof order would need to reverse—currently XLK leads at 73.7 versus CIBR's 39.3—or macro descriptors would need to shift such that credit stress flips off and liquidity normalizes. Until then, 5% represents appropriate exposure to the technical setup without overcommitting to a category facing structural headwinds.
Emerging Markets — ILF
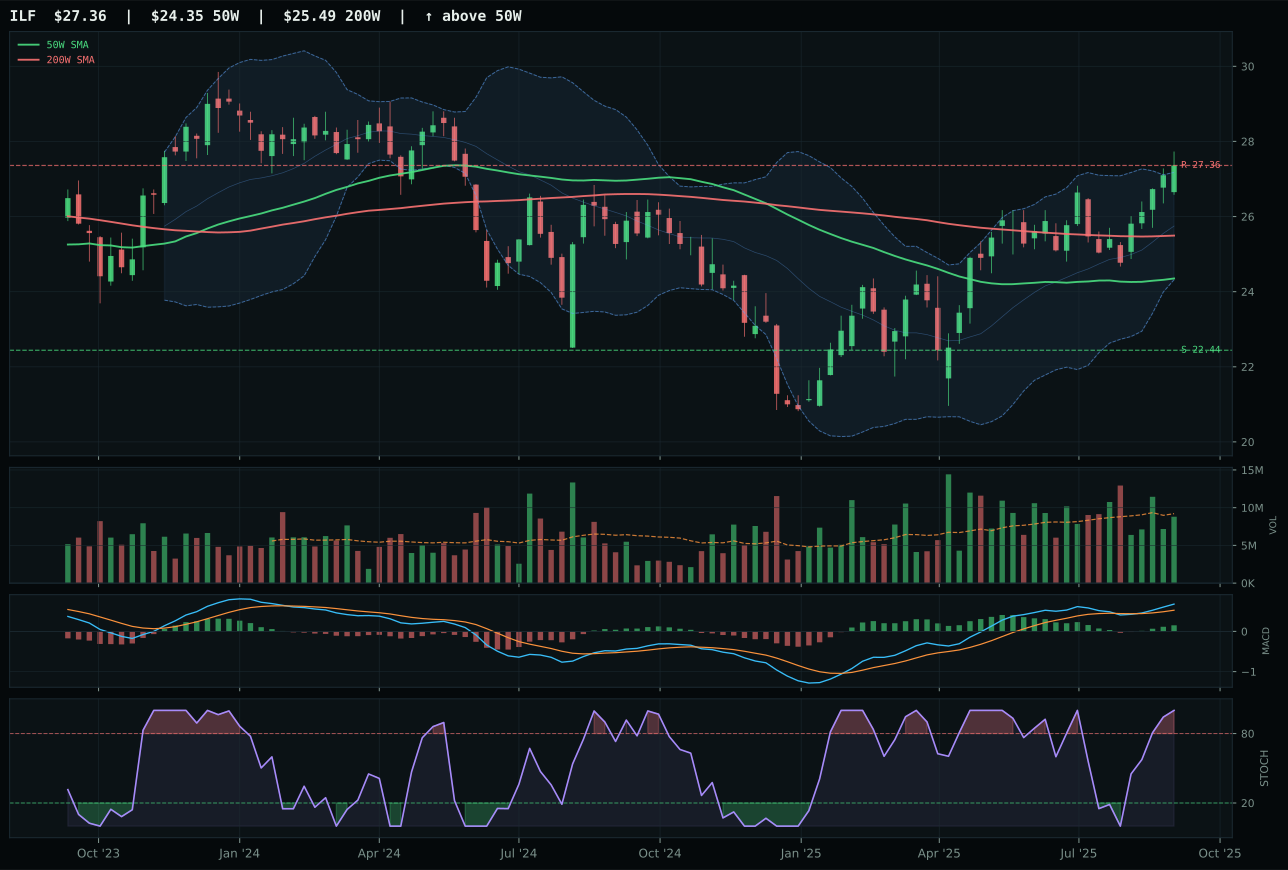
ILF has a neutral structure profile with -1.2% 13-week relative strength versus SPY.
A failed hold above support would weaken the setup.
Actionable but governed by invalidation levels.
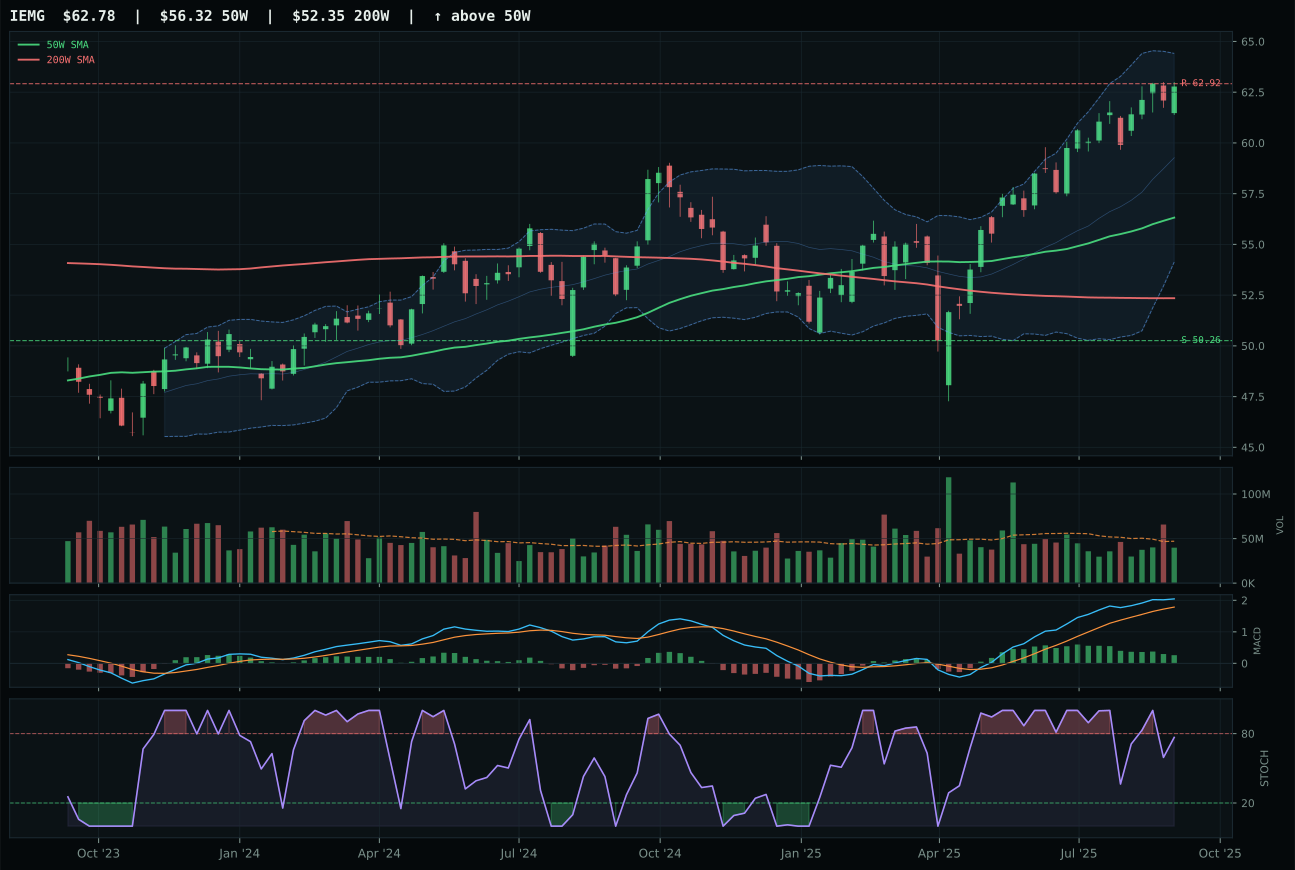
IEMG has a neutral structure profile with -0.7% 13-week relative strength versus SPY.
A failed hold above support would weaken the setup.
Actionable but governed by invalidation levels.
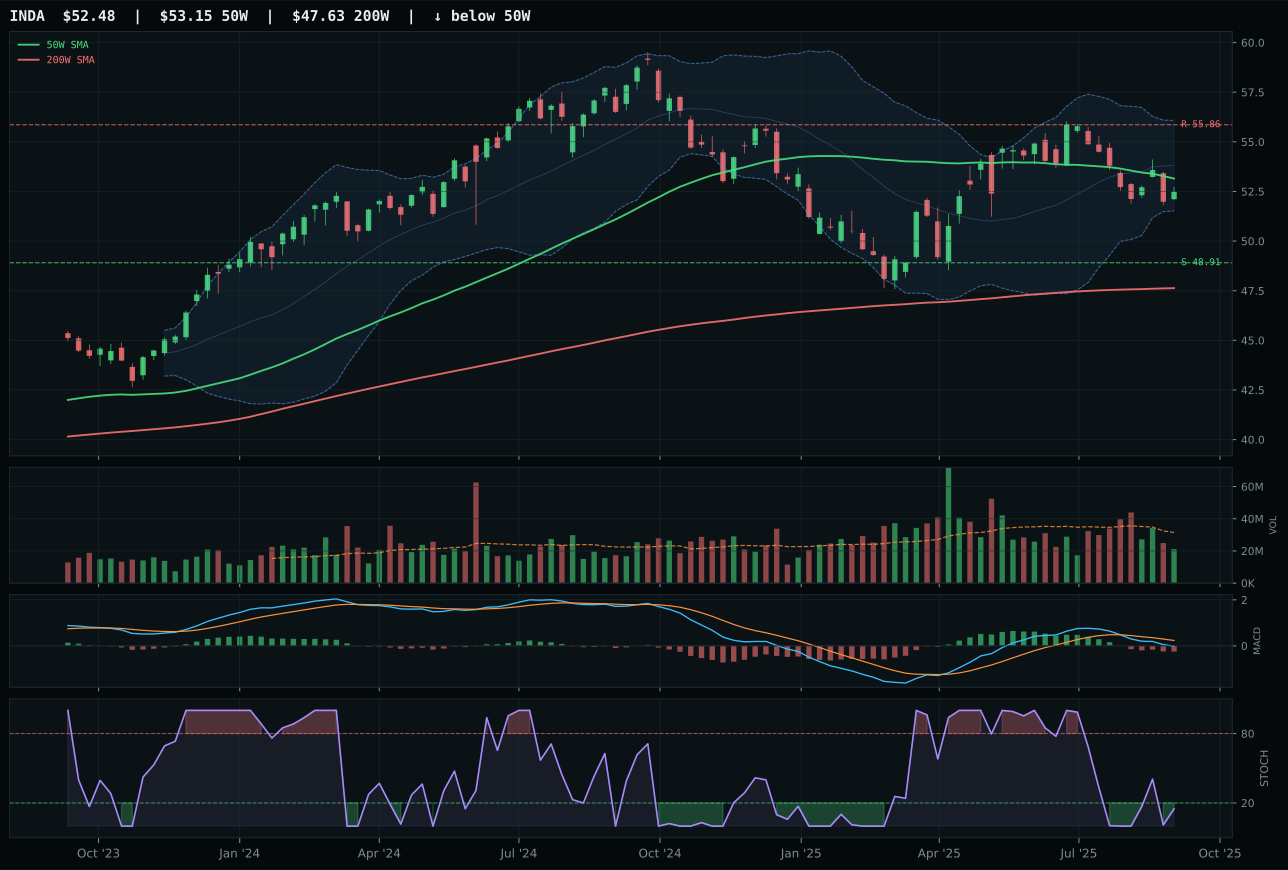
INDA has a compression near 50W profile with -12.5% 13-week relative strength versus SPY.
A failed hold above support would weaken the setup.
Actionable but governed by invalidation levels.
ILF wins a soft category by delivering the only combination of clean trend, improving MACD, and above-average momentum confirmation. ILF's 98.2 trend score reflects price above both 50-week and 200-week moving averages with positive 50-week slope; its 59.0 timing score benefits from 12.4% distance to the 50-week moving average and overbought stochastic momentum at 1.00. IEMG loses to ILF on two specific technical details: ILF's MACD is bullish and improving while IEMG's is bullish but flattening, a momentum divergence that matters in trending markets; ILF's stochastic RSI is overbought momentum versus IEMG's falling neutral, giving ILF better continuation signal. ILF's category-relative strength of 0.0% matches IEMG's 0.5% near-equivalently, but ILF's 76.9 momentum confirmation (driven by 6.8% thirteen-week return and improving MACD) exceeds IEMG's 67, reflecting cleaner follow-through. The 2.8-point margin is narrow, indicating both are viable candidates; ILF's win stems from momentum breadth rather than dominance.
Emerging Markets scores 36.3 and earns tier-2 allocation at 5%, a mid-tier slot reflecting genuine technical weakness in a macro environment that is actively punishing the category. Macro fit stands at only 38.0, dragged down by -10 credit stress and -10 liquidity stress despite +8 risk appetite providing modest offset. The category proof order (ILF 67.0, IEMG 58.6, INDA 12.8) shows depth in the first two candidates but a cliff to the third, suggesting the category is viable but not deep. ILF's 76.4 technical evidence score cannot overcome a macro regime where emerging-market correlations are rising and risk-off stress is escalating. For Emerging Markets to graduate to a higher-tier allocation, either credit stress would need to reverse or ILF would need to show relative strength acceleration versus SPY; currently, at -1.2% relative strength, ILF is not participating in SPY strength and therefore not earning outsized capital allocation. The 5% slot represents exposure to the Latin America commodity thesis without overcommitting to a category that macro headwinds are actively suppressing.
Traditional Energy — XLE
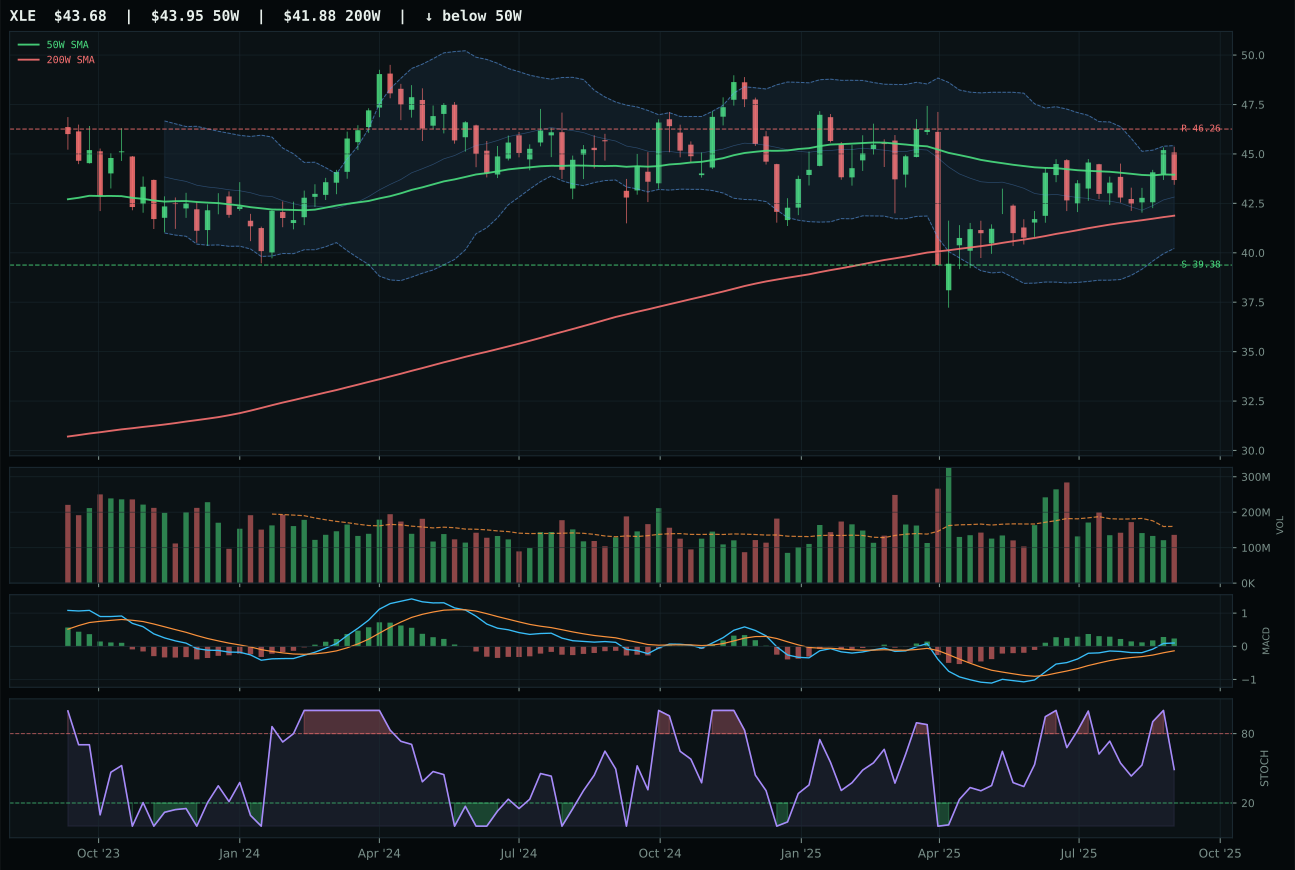
XLE has a compression near 50W profile with -3.3% 13-week relative strength versus SPY.
A failed hold above support would weaken the setup.
Actionable but governed by invalidation levels.
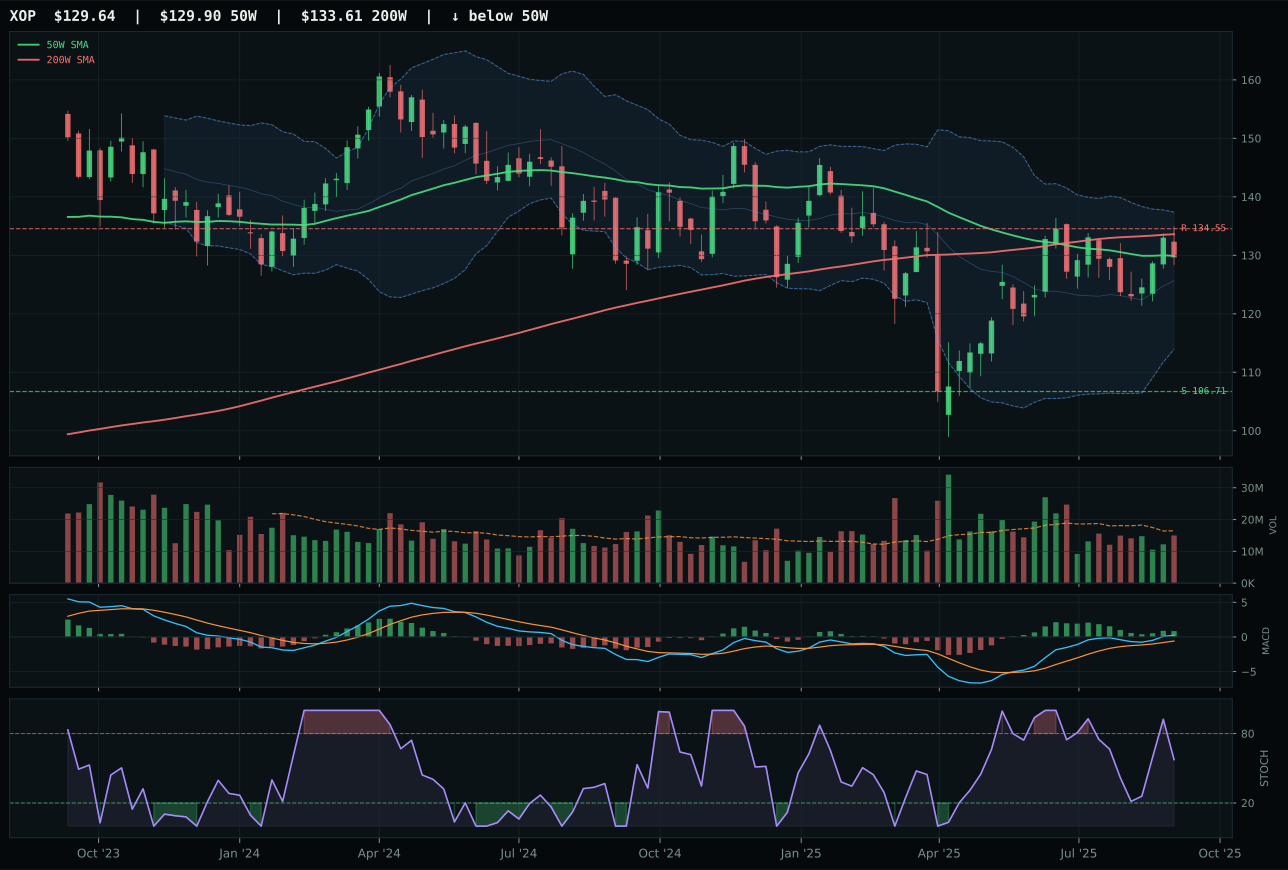
XOP has a compression near 50W profile with -2.8% 13-week relative strength versus SPY.
Extension and support failure are the main tactical risks.
Tracked, but not top-2 eligible because: structurally broken.
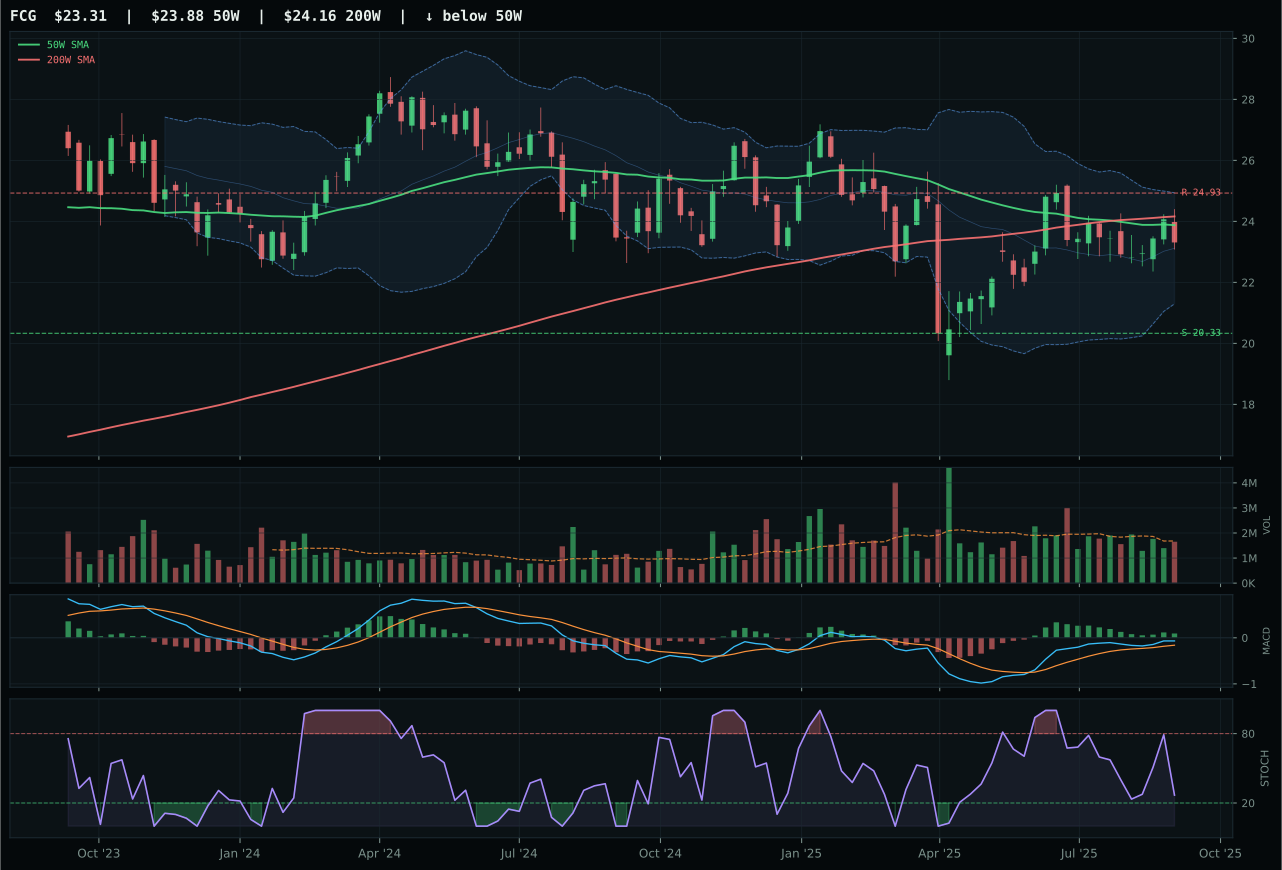
FCG has a compression near 50W profile with -6.7% 13-week relative strength versus SPY.
Extension and support failure are the main tactical risks.
Tracked, but not top-2 eligible because: structurally broken.
XLE wins a weak category by default: it is the only ETF in the basket with a clean technical excuse for ownership. XLE trades below the 50-week moving average but above the 200-week, a reset structure that allows the allocator to frame entry as defensive accumulation rather than chasing extension. Its -0.6% distance to the 50-week moving average creates a 100.0 timing score—the price is sitting on decision—while MACD is bullish and improving and stochastic RSI is falling neutral at 0.49, a setup that can expand if support holds or roll over if it breaks. XOP lost to XLE on structural integrity: XOP is marked as structurally broken, and that hard filter drove its technical evidence down to 42.0; XLE's 69.4 technical score reflects a cleaner consolidation. Both are extension candidates if energy demand stays supported, but XLE offers entry near key support while XOP is already extended. The category winner is not an attractive trade—it is merely the least impaired option in a category that macro stress is actively punishing.
Traditional Energy scores 29.0 and receives 0% allocation this week, excluded from the portfolio entirely. Ranked ninth or tenth alongside Agriculture & Livestock, Energy ranks among the two weakest categories. The 52.5 base 3/2/1 score was penalized sharply by the reasoner: macro fit stands at only 43.0, dragged down by -7 credit stress and -7 liquidity stress despite +7 real asset sponsorship providing minimal relief. Even XLE's 100.0 timing score cannot compensate for a category where trend evidence is weak (60.1 for the winner), momentum confirmation is neutral (65.8), and risk/reward on the best setup is merely adequate at 62.2. The Transition / Mixed regime offers no tailwind; energy is neither a growth play in transition nor a defensive anchor. For Traditional Energy to earn tier-2 allocation at 5%, XLE would need to break back above its 50-week moving average with volume confirmation and SPY-relative strength would need to turn positive. Currently, energy is trapped in a regime where real asset sponsorship cannot offset credit and liquidity stress, making it one of only two categories worth zero capital commitment this week.
Agriculture & Livestock — MOO
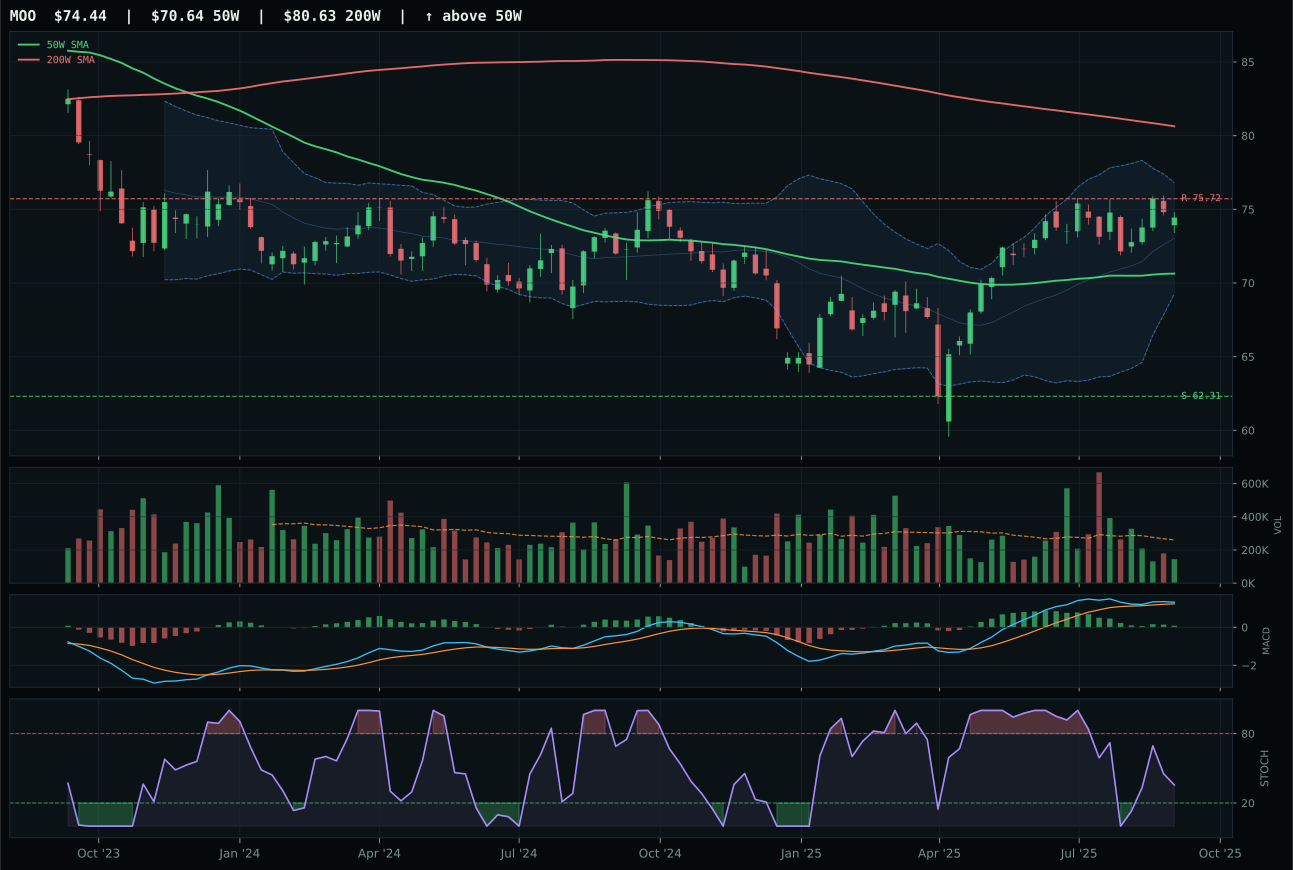
MOO has a neutral structure profile with -6.0% 13-week relative strength versus SPY.
A failed hold above support would weaken the setup.
Actionable but governed by invalidation levels.
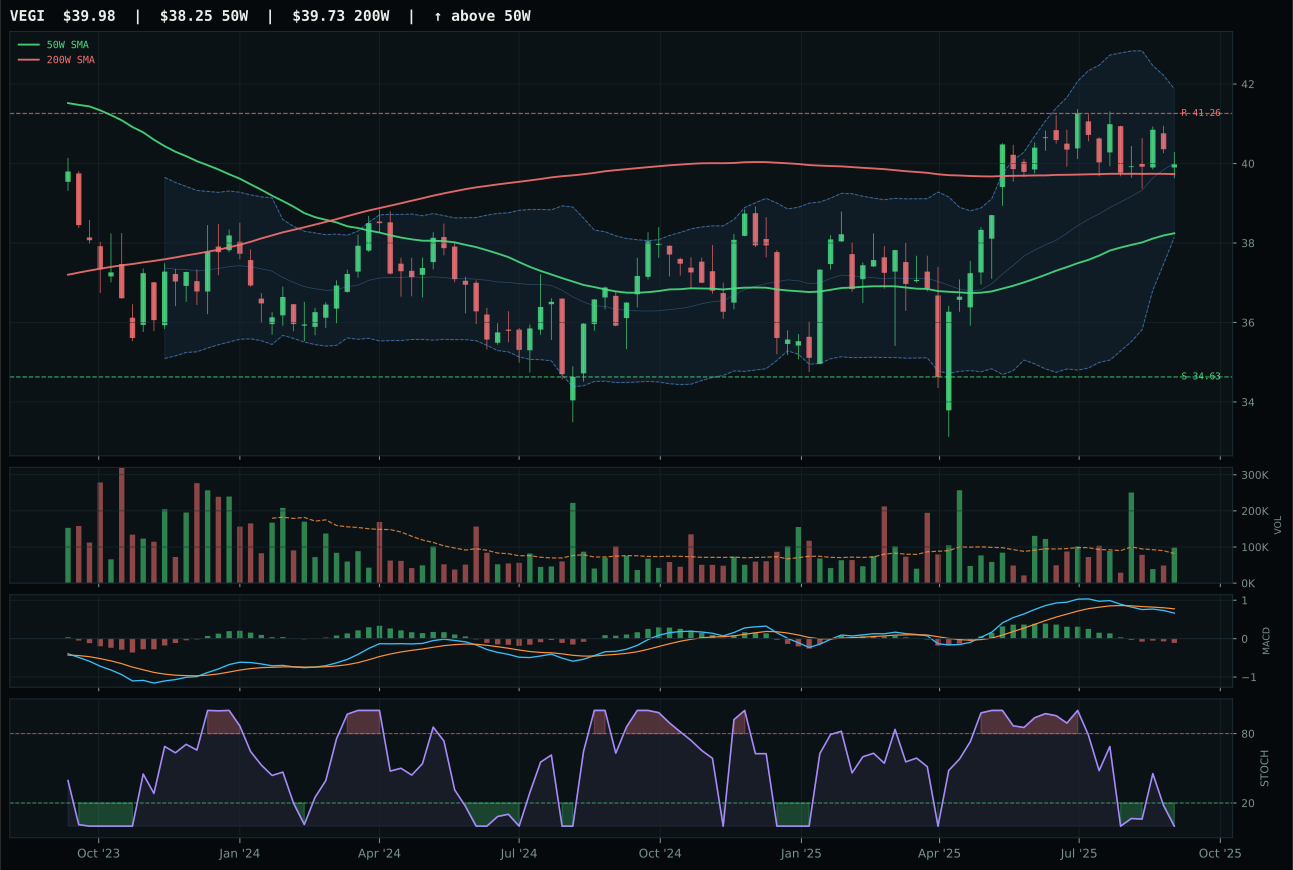
VEGI has a neutral structure profile with -9.1% 13-week relative strength versus SPY.
A failed hold above support would weaken the setup.
Tracked, but not top-2 eligible because: .
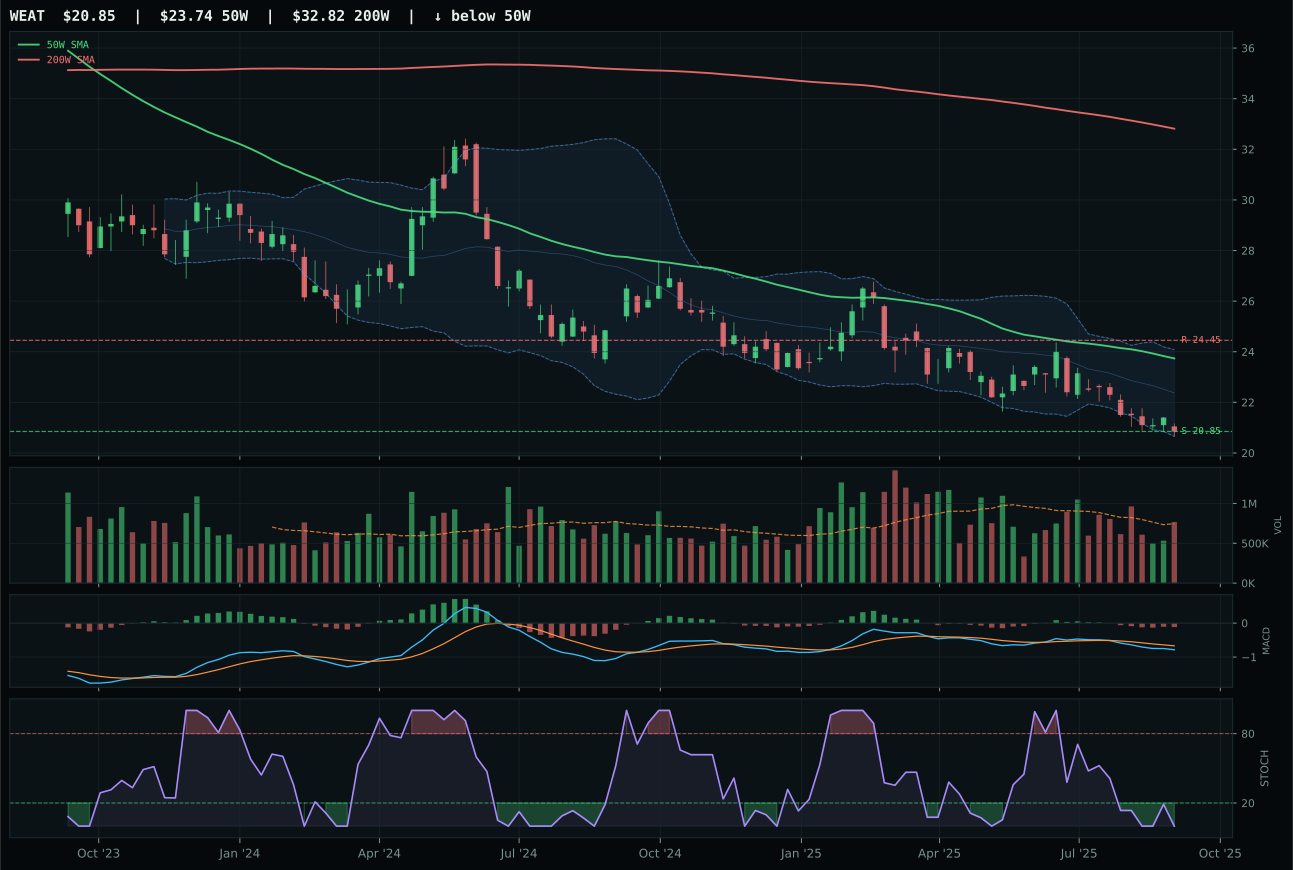
WEAT has a pullback into support profile with -18.9% 13-week relative strength versus SPY.
Extension and support failure are the main tactical risks.
Tracked, but not top-2 eligible because: structurally broken.
MOO wins a weak category because it trades with bullish-but-flattening MACD confirmation and rising stochastic RSI mid-zone, whereas VEGI shows bearish-weakening MACD and oversold stochastic—a clear momentum divergence in VEGI's favor on paper until volume is examined. MOO's thin participation at 0.55x its 20-week average is less of a negative than VEGI's above-average participation, which suggests volume is entering on weakness rather than confirming strength. MOO's category-relative strength of 3.1% towers over VEGI's 0.0%, despite both posting weak thirteen-week returns of 2.1% and -1.0% respectively. The setup is neutral structure for both, but MOO sits just 5.4% from its 50-week moving average in the upper retracement zone, offering better entry geometry than VEGI's oversold stochastic at 0.13. The 25.3-point score gap—the largest in this dataset—tells the true story: Agriculture is a deeply wounded category where the winner barely qualifies as a setup and the runner-up is actively broken. This is not a conviction trade; it is category process working through a field of impaired candidates.
Agriculture & Livestock scores 25.6 and receives 0% allocation this week, excluded entirely from the portfolio. The category ranks ninth or tenth, making it one of two categories with no capital commitment. The reasoner tested the 47.1 base 3/2/1 basket score against leadership, persistence, and risk/reward and penalized it sharply—the final score of 25.6 reflects a setup where no ETF has credible momentum, relative strength is uniformly weak, and macro fit at 59.0 cannot compensate for technical deterioration. Even with active real asset sponsorship at +8 and commodity breadth positive at +5, the -4 liquidity stress penalty and the baseline weakness of the category's proof order (MOO 61.0, VEGI 41.8, WEAT 16.5) created a category too damaged to justify capital. For Agriculture to earn tier-2 allocation at 5%, MOO would need to break above its 200-week moving average, post relative strength versus SPY, and attract volume confirmation. The current regime treats Agriculture as a commodity proxy rather than a growth or defensive asset class, and that positioning leaves it structurally disadvantaged against the categories commanding 10% and 5% allocations.