
2025-08-29
Informational purposes only. The content in this report, including allocations, analysis, and commentary, is provided solely for informational and educational purposes. It does not constitute financial advice, investment advice, trading advice, or any other type of advice. Past performance does not guarantee future results. Always conduct your own research and consult a qualified financial professional before making investment decisions.
Weekly Allocation
| Ticker | Category | Weight | Role |
|---|---|---|---|
| FBTC | 50% | Overlay | |
| REMX | Industrial Metals | 10% | Top-2 (10%) |
| XLE | Traditional Energy | 10% | Top-2 (10%) |
| URNM | Nuclear Energy | 5% | Tier-2 (5%) |
| AIQ | AI | 5% | Tier-2 (5%) |
| IGF | Utilities & Infrastructure | 5% | Tier-2 (5%) |
| GDX | Precious Metals | 5% | Tier-2 (5%) |
| XAR | Defense & Aerospace | 5% | Tier-2 (5%) |
| XLK | Technology | 5% | Tier-2 (5%) |
Trade Instructions — Monday Open
Sell the tranche from 2025-08-01 (completing its 4-week hold). Buy the new tranche. Instructions show net portfolio changes — same-asset positions cancel, weight changes show the delta.
| Action | Ticker | Instruction |
|---|---|---|
| SELL | BOTZ | Sell 50% of BOTZ position (reduce 5.00% → 2.50%) |
| SELL | NLR | Sell 33% of NLR position (reduce 7.50% → 5.00%) |
| SELL | XLU | Sell 50% of XLU position (reduce 2.50% → 1.25%) |
| SELL | COPX | Sell 20% of COPX position (reduce 6.25% → 5.00%) |
| SELL | ITA | Sell 25% of ITA position (reduce 5.00% → 3.75%) |
| SELL | GLD | Sell 33% of GLD position (reduce 3.75% → 2.50%) |
| SELL | MOO | Sell 50% of MOO position (reduce 2.50% → 1.25%) |
| BUY | REMX | Buy REMX — 22.22% of freed cash (adds 2.50% to portfolio) |
| BUY | XLE | Buy XLE — 22.22% of freed cash (adds 2.50% to portfolio) |
| BUY | IGF | Buy IGF — 11.11% of freed cash (adds 1.25% to portfolio) |
| BUY | GDX | Buy GDX — 11.11% of freed cash (adds 1.25% to portfolio) |
| BUY | URNM | Buy URNM — 11.11% of freed cash (adds 1.25% to portfolio) |
| BUY | AIQ | Buy AIQ — 11.11% of freed cash (adds 1.25% to portfolio) |
| BUY | XAR | Buy XAR — 11.11% of freed cash (adds 1.25% to portfolio) |
Current Portfolio After Trade
Combined holdings across all 4 active tranches. Each tranche is 25% of the portfolio.
| Ticker | % of Portfolio | Weight Bar |
|---|---|---|
| FBTC | 50.00% | |
| NLR | 5.00% | |
| XLK | 5.00% | |
| COPX | 5.00% | |
| REMX | 5.00% | |
| XLE | 5.00% | |
| ITA | 3.75% | |
| IGF | 3.75% | |
| URNM | 3.75% | |
| GLD | 2.50% | |
| BOTZ | 2.50% | |
| GDX | 2.50% | |
| XLU | 1.25% | |
| MOO | 1.25% | |
| SMH | 1.25% | |
| AIQ | 1.25% | |
| XAR | 1.25% |
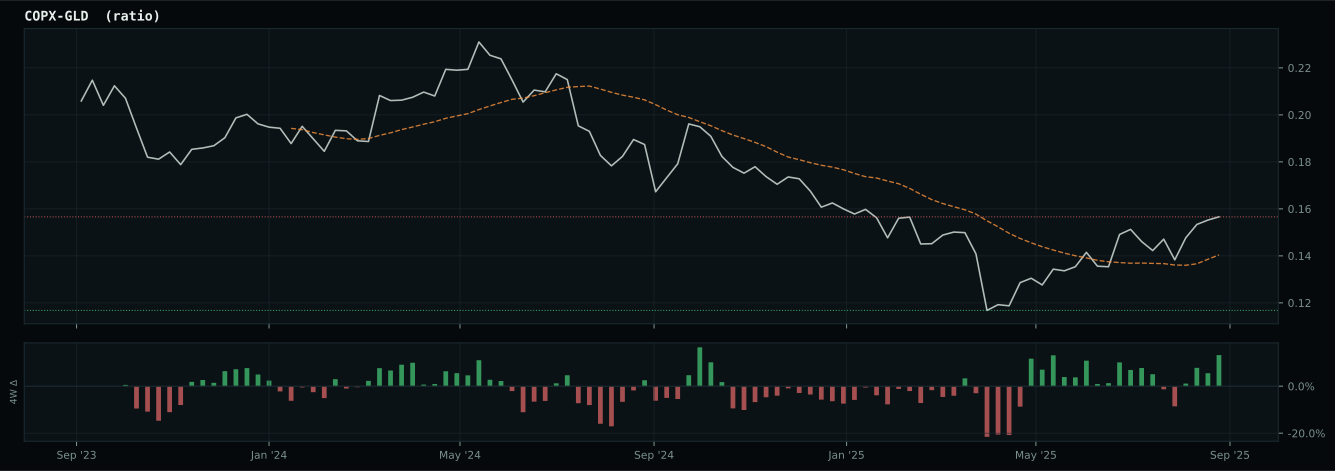
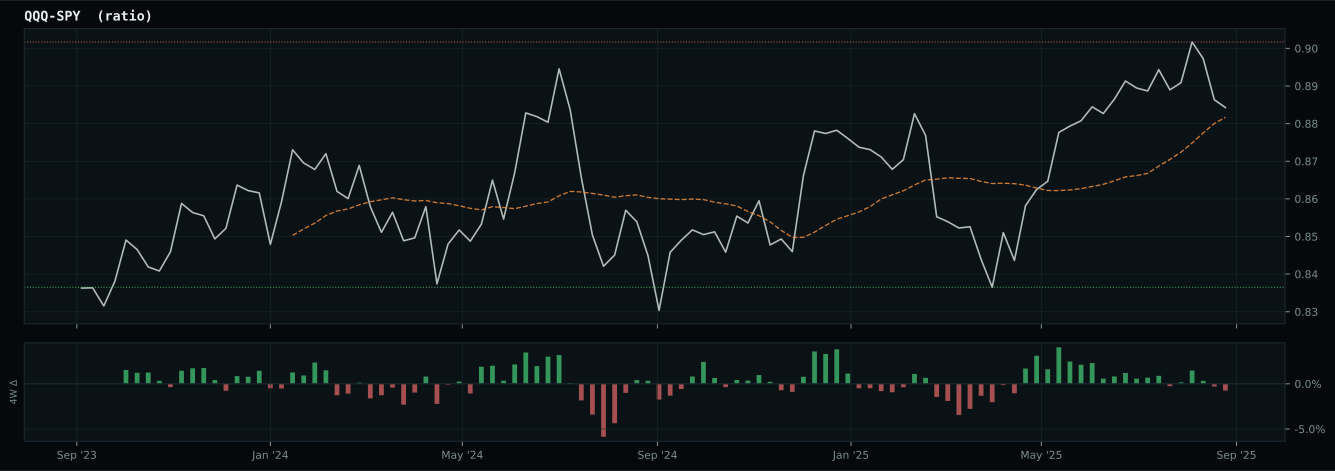
Macro Regime — Late-Cycle Reflation
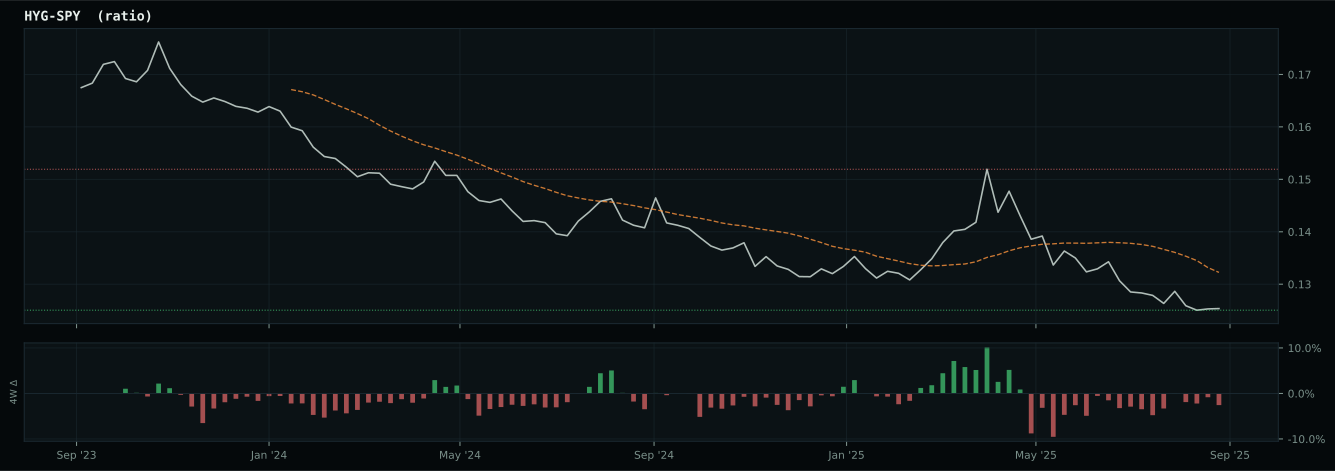
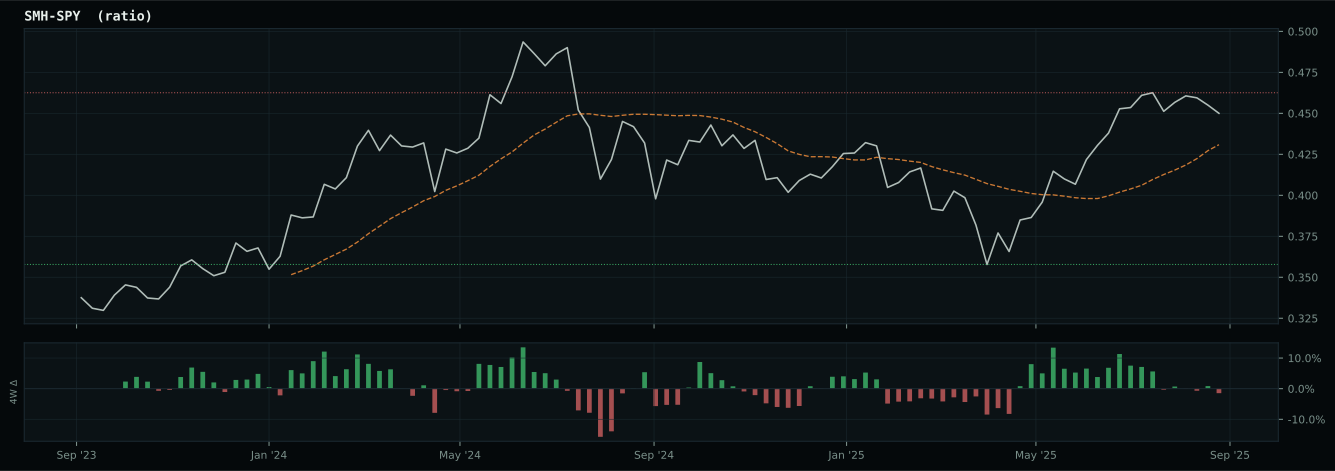
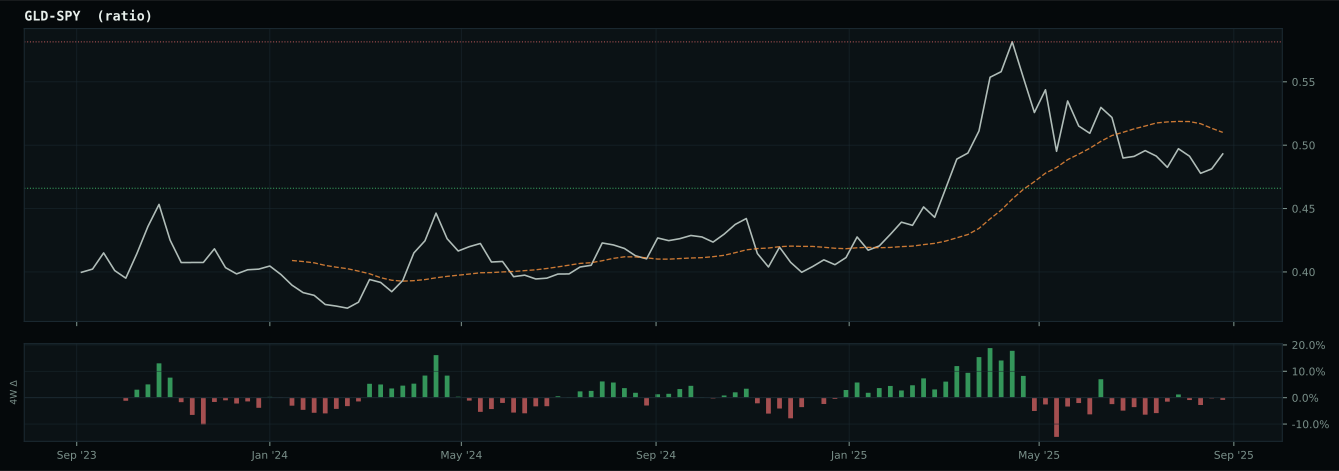
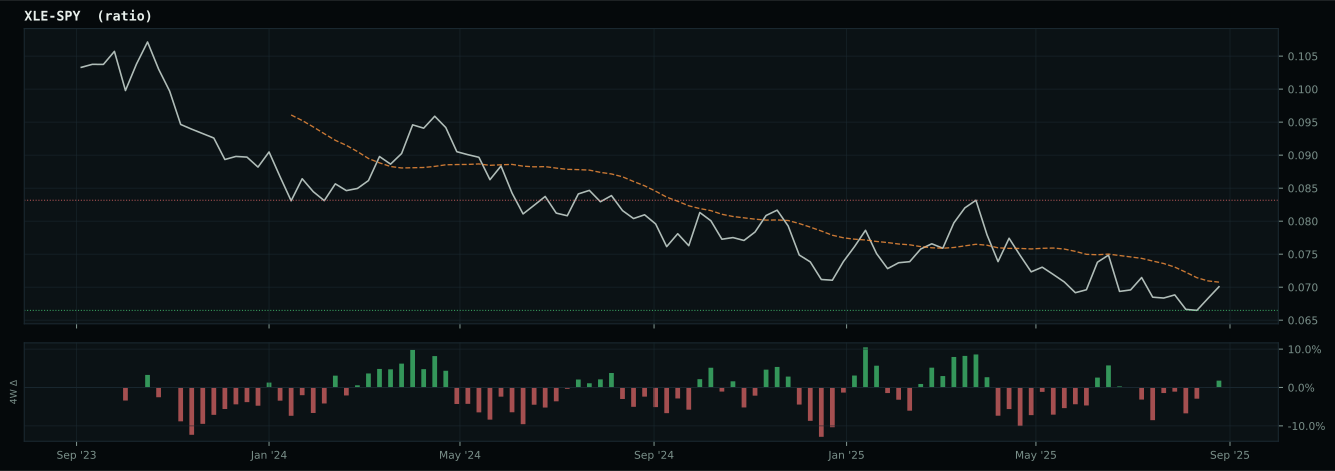
Macro Evidence Charts
Market-implied signals behind the macro regime scores. Each ratio compares two assets; the direction and slope of the ratio is what the macro engine reads.
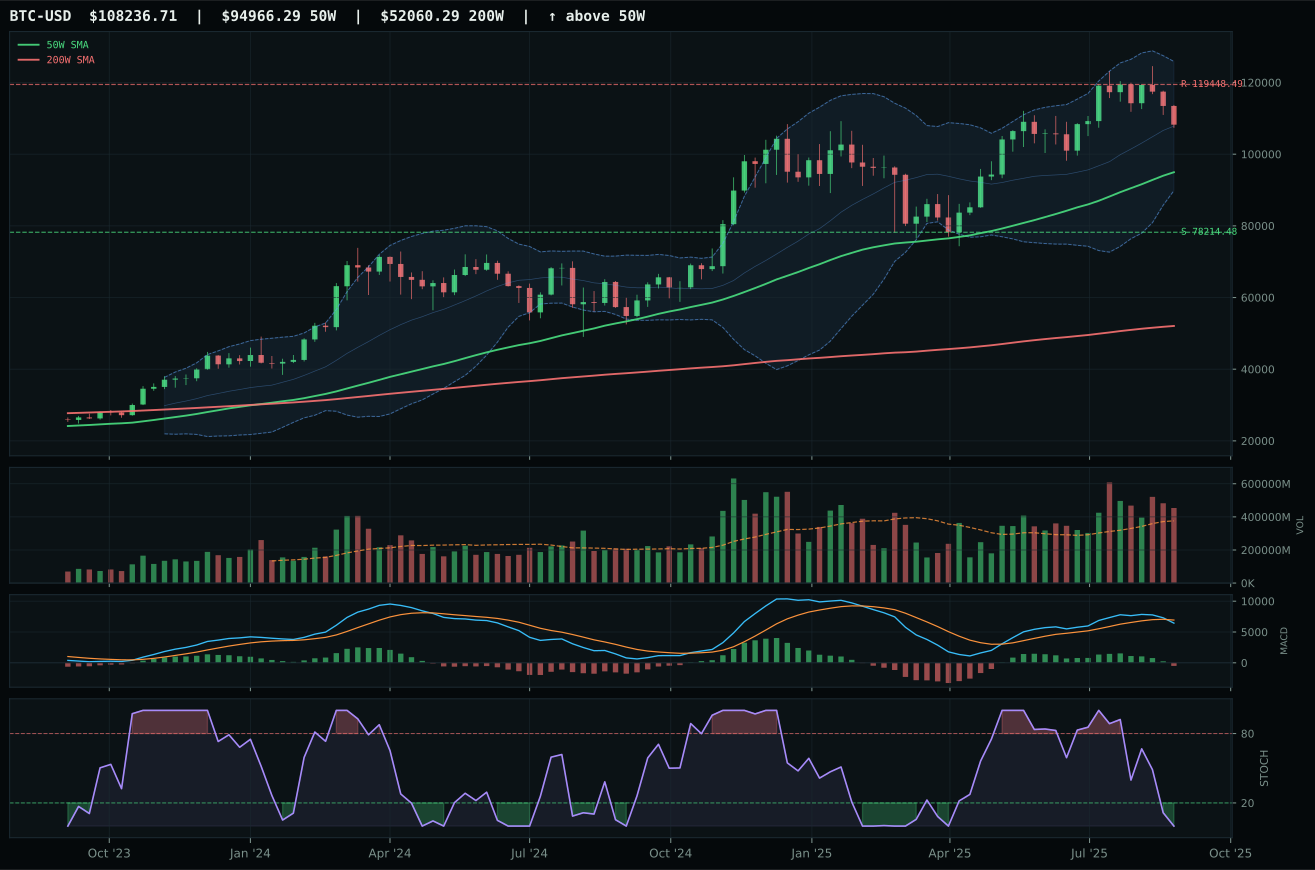
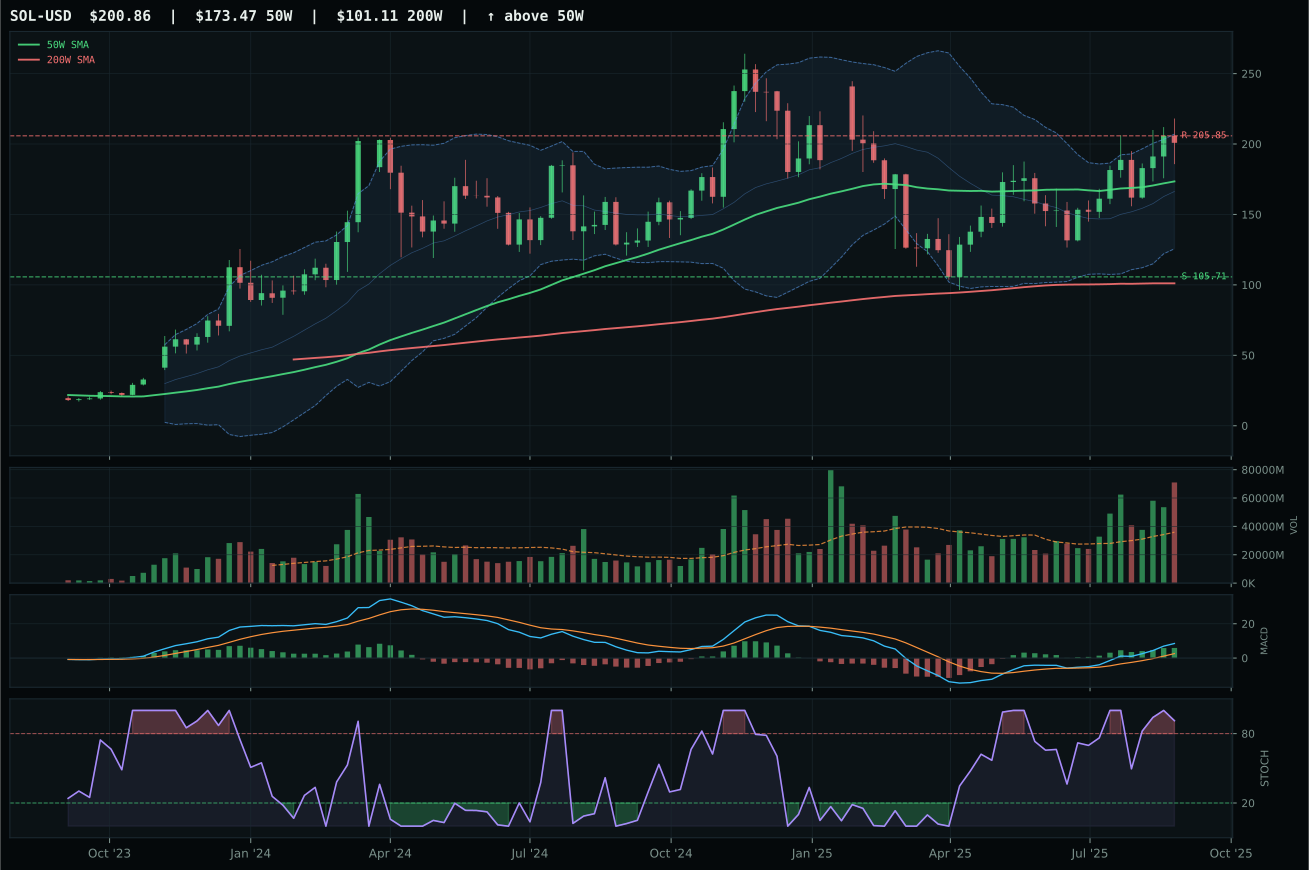
Crypto Regime — TrendBTC
ValueBTC not armed: BTC has not made the first post-breakdown touch of the 200W buy zone after losing the 50W
TrendBTC confirmed: 2 consecutive closes above rising/flat 50W SMA
one or more available conditions failed
Category Rankings
| Rank | Category | Winner | Score | Alloc | 4W Ret | Peers (4W) |
|---|---|---|---|---|---|---|
| 1 | Industrial Metals | REMX | 78.6 | 20% | +8.90% | COPX +18.2% · PICK +9.0% |
| 2 | Traditional Energy | XLE | 77.5 | 20% | +1.33% | XOP +2.9% · FCG +0.8% |
| 3 | Nuclear Energy | URNM | 74.5 | 10% | +21.47% | NLR +19.3% · URA +25.4% |
| 4 | AI | AIQ | 63.0 | 10% | +11.66% | SMH +14.7% · BOTZ +5.6% |
| 5 | Utilities & Infrastructure | IGF | 54.1 | 10% | +2.66% | PAVE +3.3% · XLU +3.3% |
| 6 | Precious Metals | GDX | 48.4 | 10% | +18.93% | SLV +15.9% · GLD +9.7% |
| 7 | Defense & Aerospace | XAR | 47.8 | 10% | +8.45% | ITA +5.7% · ROKT +6.9% |
| 8 | Technology | XLK | 42.3 | 10% | +8.78% | CIBR +5.9% · IGV +9.0% |
| 9 | Agriculture & Livestock | MOO | 37.9 | 0% | -0.38% | VEGI -0.7% · WEAT -0.5% |
| 10 | Emerging Markets | ILF | 37.6 | 0% | +8.52% | IEMG +7.0% · INDA +0.2% |
Industrial Metals — REMX
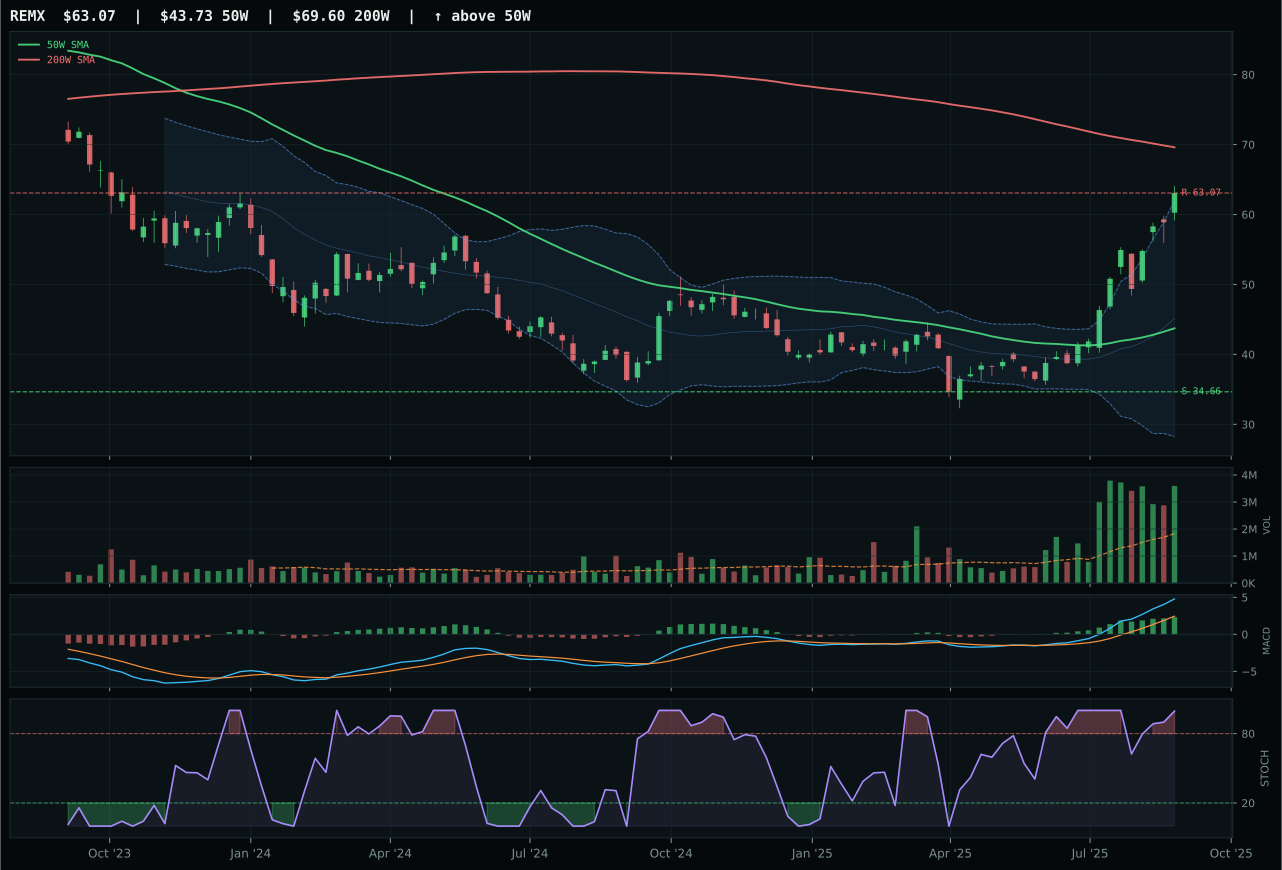
REMX has a vertical extension profile with 63.5% 13-week relative strength versus SPY.
A failed hold above support would weaken the setup.
Actionable but governed by invalidation levels.
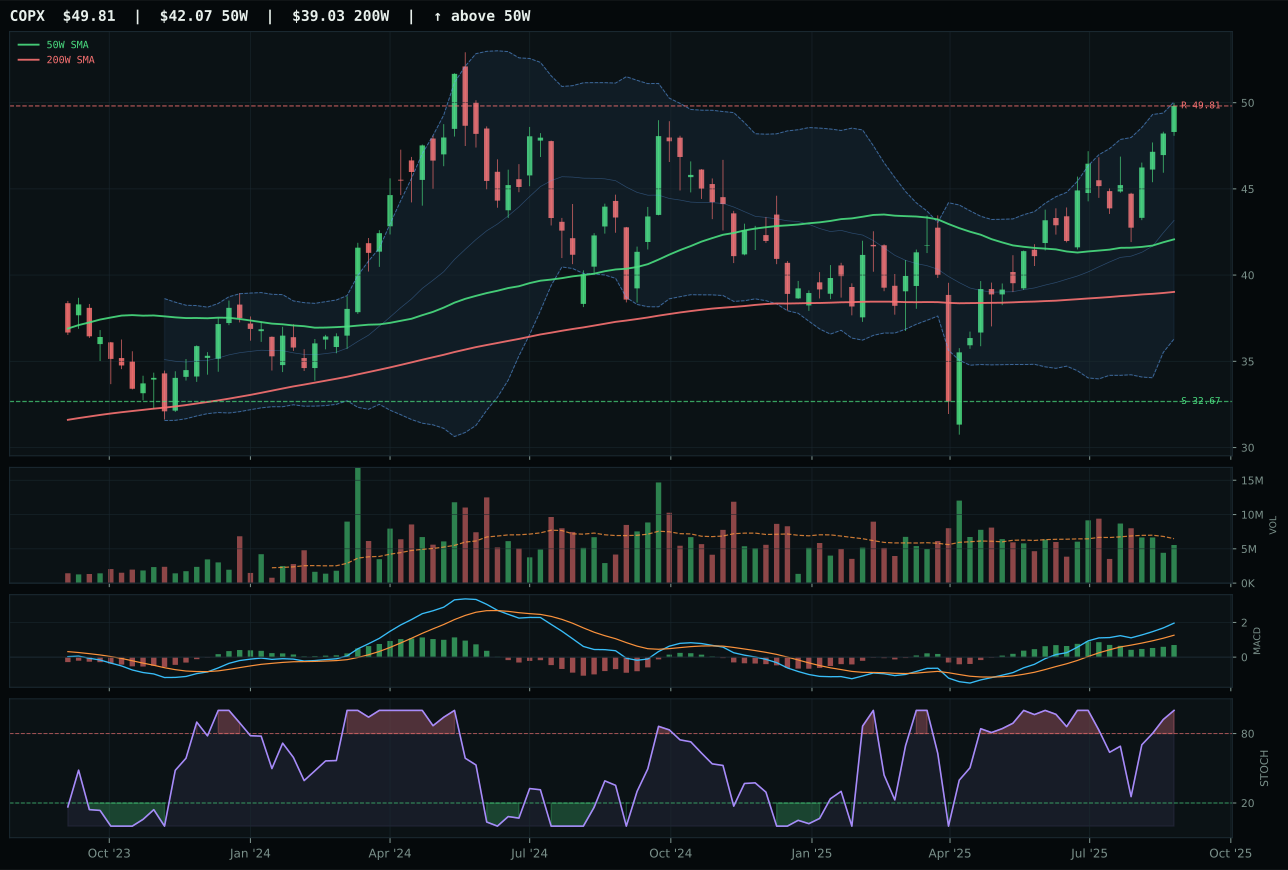
COPX has a vertical extension profile with 11.7% 13-week relative strength versus SPY.
A failed hold above support would weaken the setup.
Actionable but governed by invalidation levels.
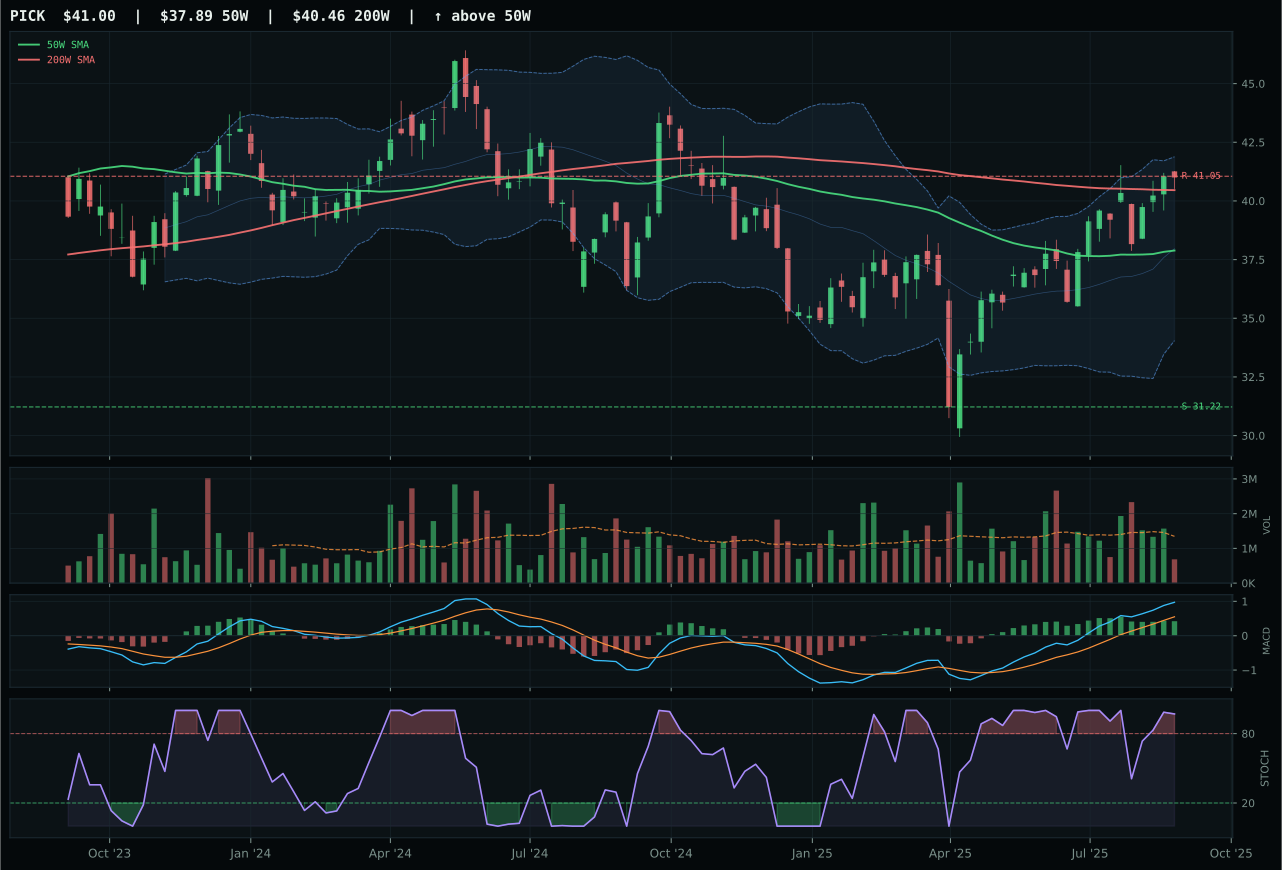
PICK has a neutral structure profile with 1.8% 13-week relative strength versus SPY.
A failed hold above support would weaken the setup.
Actionable but governed by invalidation levels.
REMX won decisively because it is the only representative with perfect 100/100 scores for both volume-price confirmation and persistence, combined with 51.7% category-relative outperformance that reflects structural metal scarcity demand (not momentum hype). The 72.9% thirteen-week return and 63.5% relative strength versus the market would normally trigger entry risk alerts, but the 1.96x average volume (accumulation/confirmation) tells the story: this is institutional money rotating into rare earth supply-chain bottlenecks, not retail FOMO. COPX lost ground despite similar macroeconomic support because its volume remained neutral (not accumulation), risk/reward was weaker at 39.7 versus 43.8, and category-relative strength collapsed to 0% versus REMX's 51.7%—a chasm that reflects different buyer profiles. Clean structure (85.5/100 versus 73.0/100) confirms this: REMX shows organized strength while COPX shows scattered interest.
Industrial Metals earned top-2 ranking and 10% allocation on a 78.6 category score—the second-highest score in the portfolio—driven by a macro fit of 75.0/100 and technical evidence of 100.0/100 from the 3/2/1 basket. Late-cycle reflation helps at +10, metals scarcity is active at +14, commodity breadth positive at +10, and real asset sponsorship at +6 align perfectly with REMX's explosive technical setup. The volume-price confirmation of 100/100 and persistence of 100/100 are not theoretical; they reflect that every dip into support on the way up is met by fresh buying, not profit-taking. This is a 20% conviction play in a portfolio rotating into hard assets. REMX must be watched carefully for signs of accumulation breakdown—a pullback to the 50W without volume would invalidate the setup—but current evidence shows this is the leading indicator for scarcity themes. Copper (COPX) and select mining (PICK) provide diversification within the category, but REMX carries the thesis.
Traditional Energy — XLE
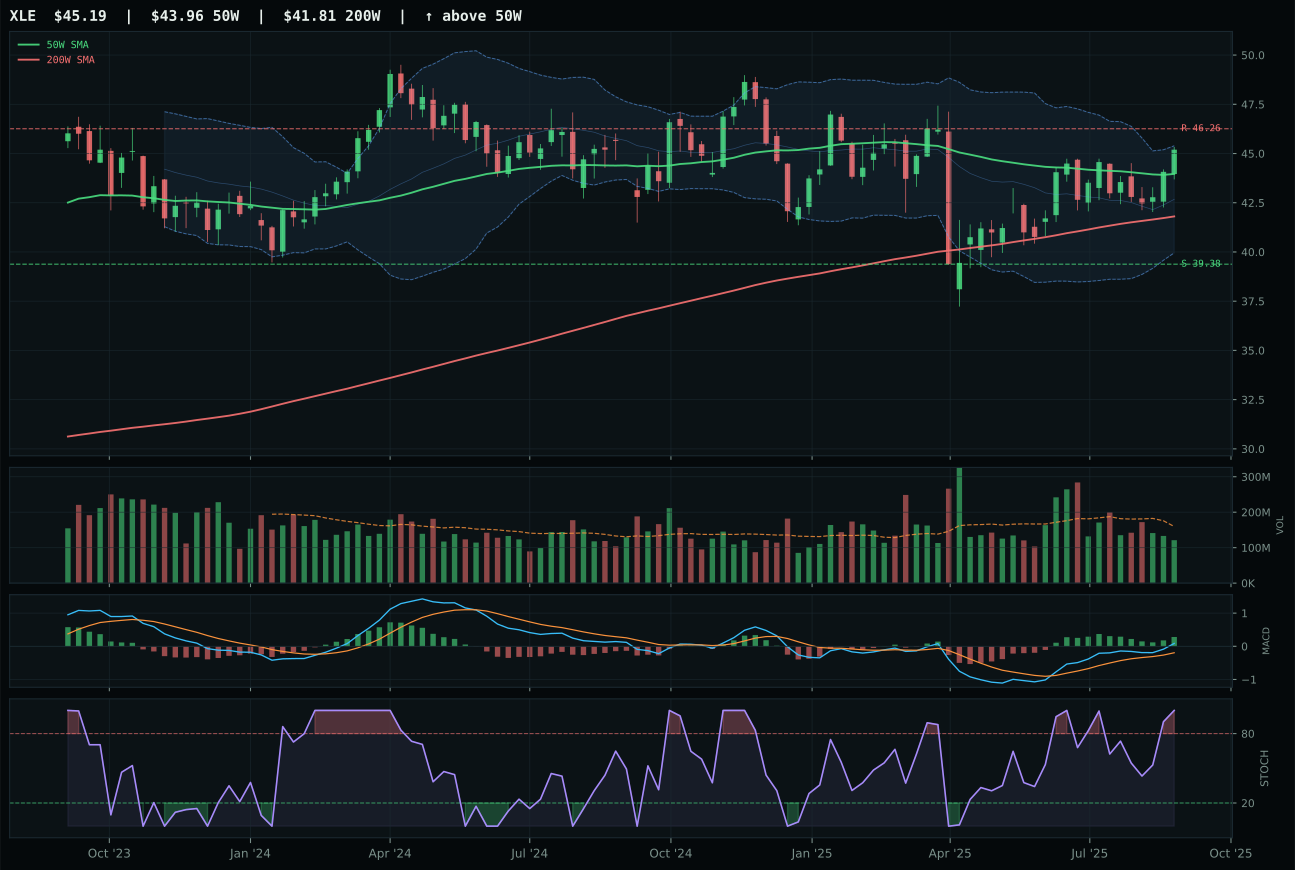
XLE has a compression near 50W profile with 1.4% 13-week relative strength versus SPY.
A failed hold above support would weaken the setup.
Actionable but governed by invalidation levels.
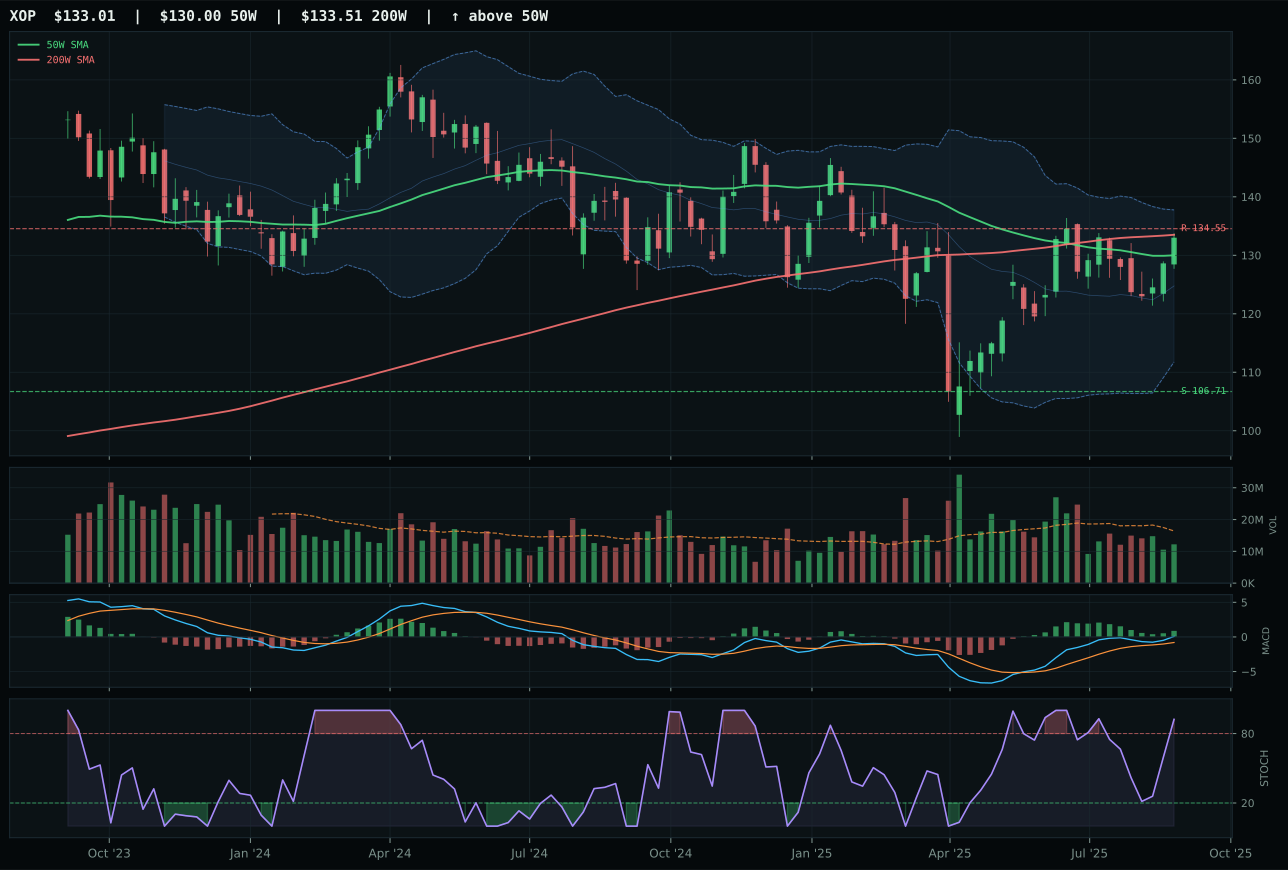
XOP has a compression near 50W profile with 1.8% 13-week relative strength versus SPY.
A failed hold above support would weaken the setup.
Actionable but governed by invalidation levels.
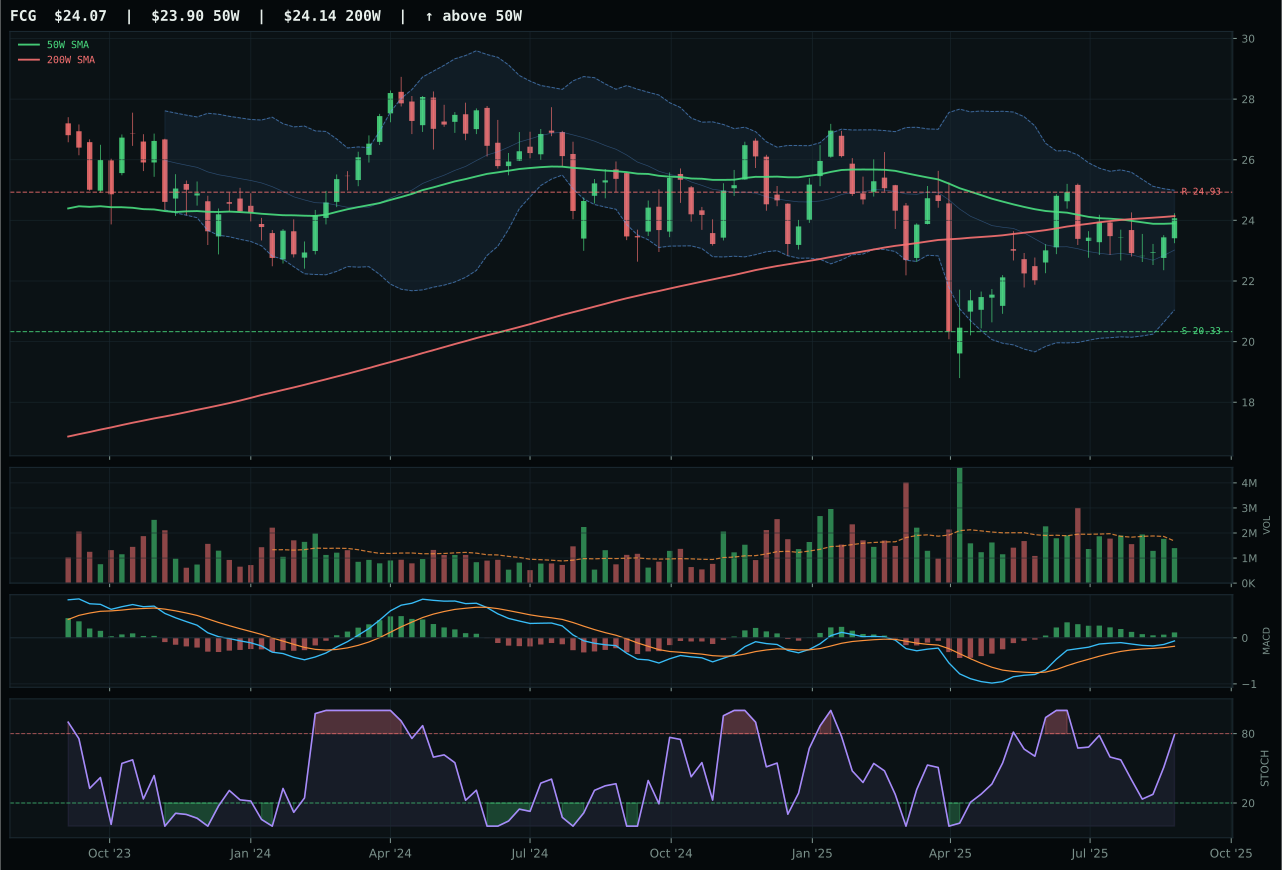
FCG has a compression near 50W profile with -0.1% 13-week relative strength versus SPY.
A failed hold above support would weaken the setup.
Actionable but governed by invalidation levels.
XLE won decisively because it combined perfect timing (100/100)—achieved by compressing into the 50-week moving average rather than extending away—with genuinely improving MACD and overbought stochastic RSI that signals imminent volatility. The compression setup matters enormously: price at just 2.8% above the 50-week with structure organized around the level gives buyers a natural support floor and room for expansion without immediately hitting resistance. XOP lost the category by 10.3 points because its timing score (95/100) was marginally weaker and its MACD flattened rather than improved, suggesting the move has less room to run before consolidating. Both carry similar relative strength (1.4% versus 1.8%), but XLE's volume profile, though neutral at 0.76x average, is still superior to XOP's thin participation. The structural difference is the deciding factor: XLE is ready to expand, XOP is closer to rolling over.
Traditional Energy earned top-2 ranking and 10% allocation on a 77.5 category score—matching Industrial Metals in conviction—because macro fit of 90.0/100 is the portfolio's strongest, with late-cycle reflation at +12, energy scarcity at +16, inflation pressure at +10, supply shortage at +9, and real asset sponsorship at +7 all aligned. This is the most macro-supported category in the current regime. XLE's technical setup of compression near the 50W with bullish-and-improving MACD and perfect 100/100 timing creates an asymmetric opportunity: downside to support at 14.8% offers defined risk; upside potential to 46.26 resistance is undefended. The 88/100 composite score on XLE shows trend strength without dangerous extension. Volume is thin at 0.76x, meaning if institutional buyers commit, expansion room exists. This is a 20% core holding in reflation—energy scarcity is real, prices are disciplined, and technicals offer entry geometry. XOP and FCG provide tactical diversification; XLE is the category anchor.
Nuclear Energy — URNM
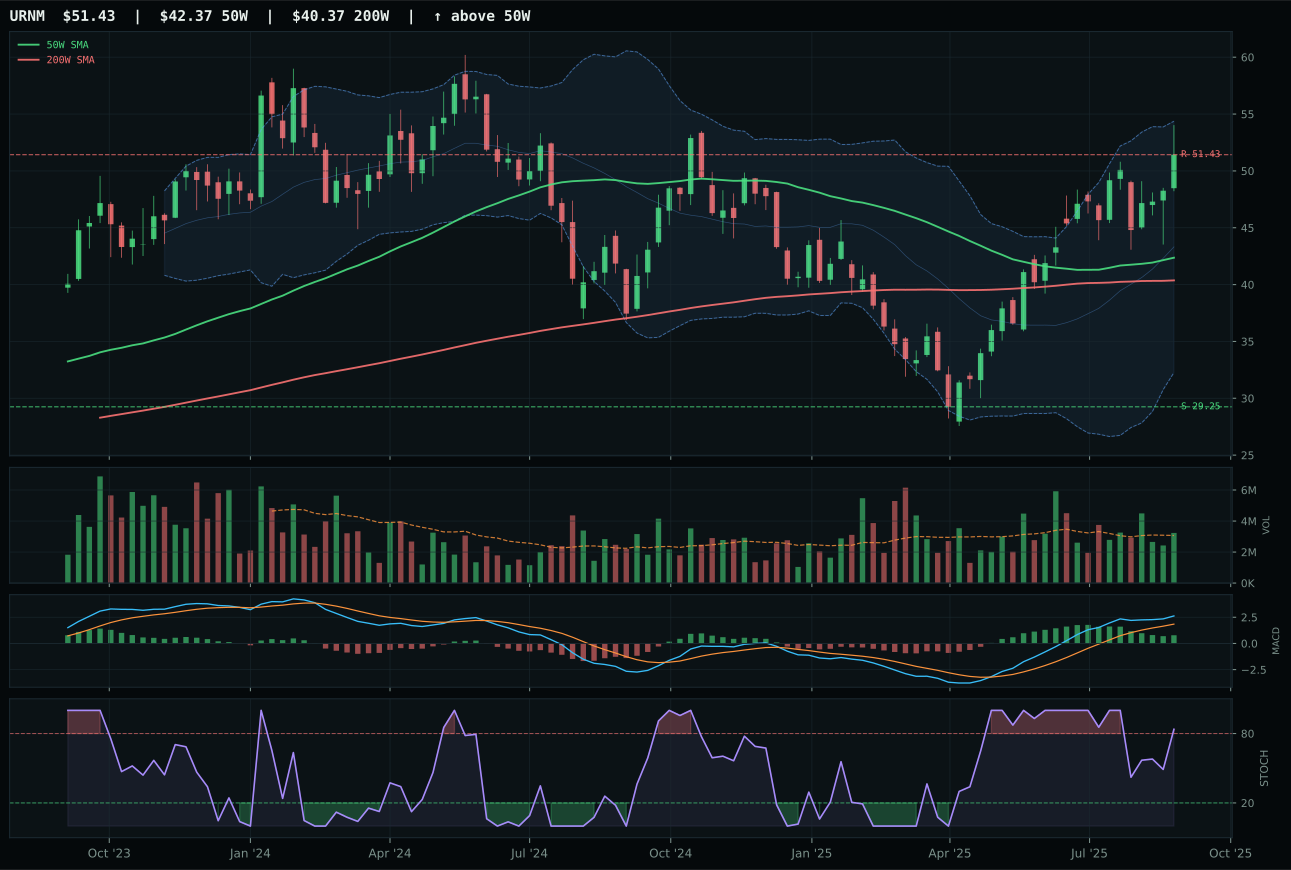
URNM has a vertical extension profile with 18.5% 13-week relative strength versus SPY.
A failed hold above support would weaken the setup.
Actionable but governed by invalidation levels.
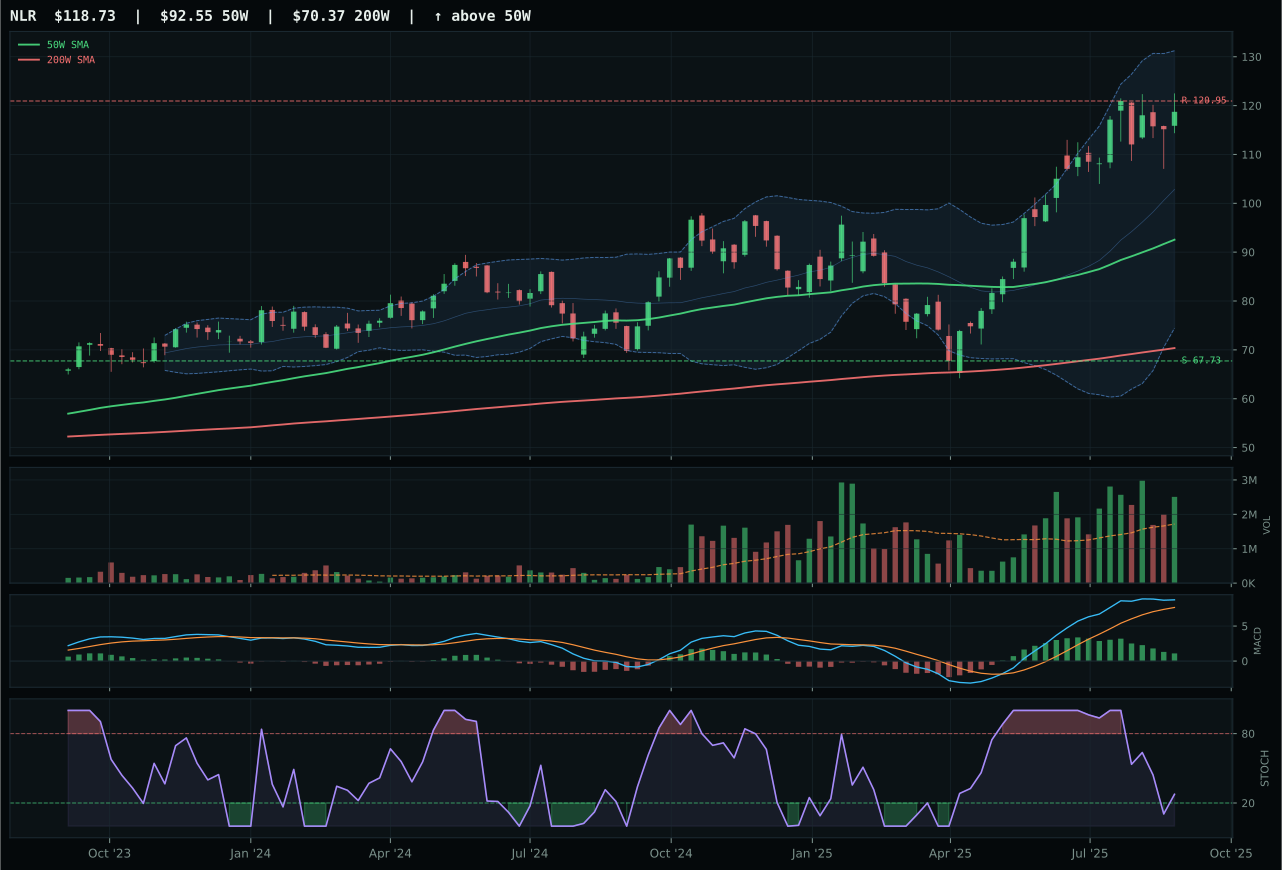
NLR has a vertical extension profile with 12.7% 13-week relative strength versus SPY.
A failed hold above support would weaken the setup.
Actionable but governed by invalidation levels.
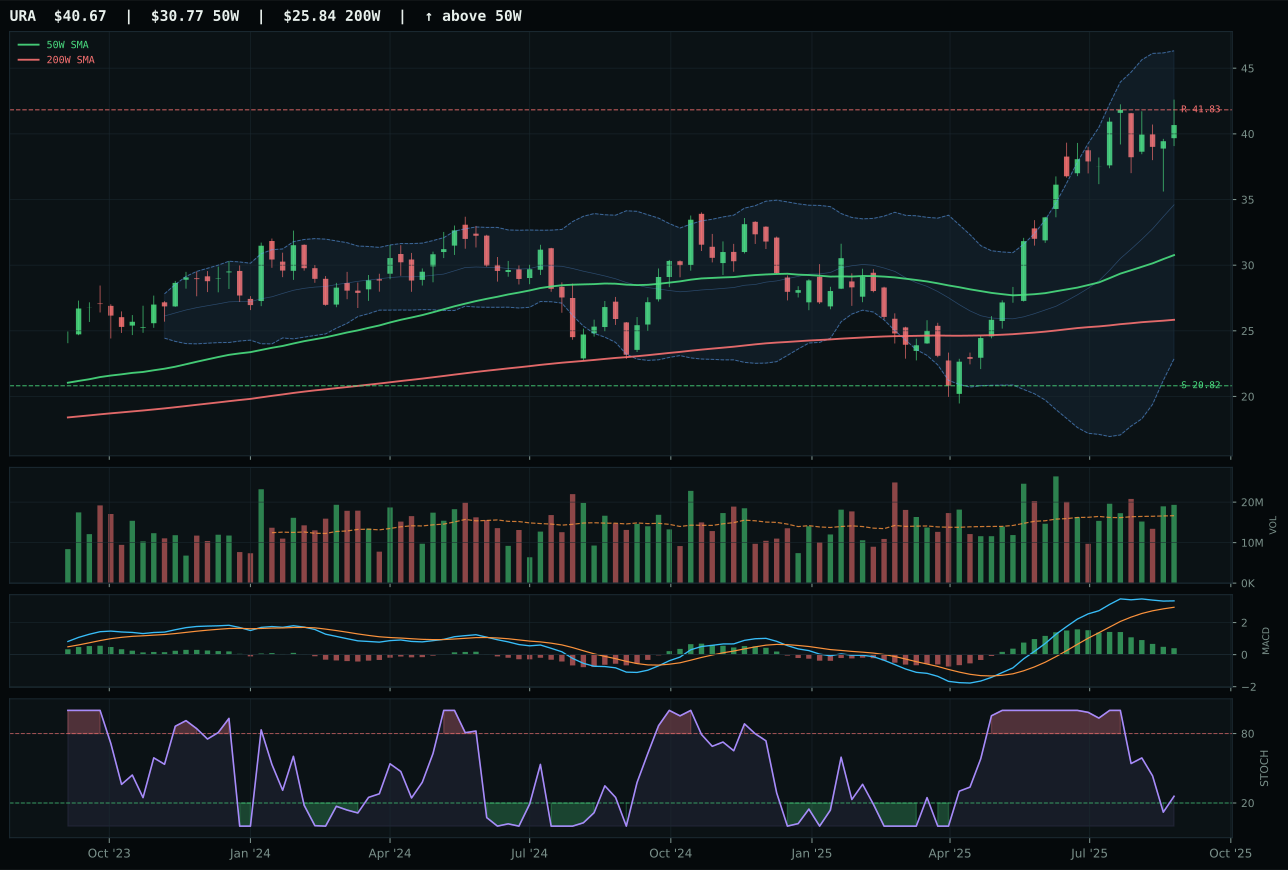
URA has a vertical extension profile with 17.6% 13-week relative strength versus SPY.
A failed hold above support would weaken the setup.
Actionable but governed by invalidation levels.
URNM won by 6.7 points because its category-relative strength (0.8%) beat NLR's (-4.9%) even though both represent extended vertical extensions with similar trend and momentum confirmation. The difference is that URNM's 27.9% thirteen-week return with 18.5% relative strength reflects investor demand for uranium scarcity in an AI-powered energy demand environment, while NLR's 22.2% thirteen-week return relies more on nuclear utility stability narratives. NLR's tighter 28.3% distance from the 50-week moving average would normally be advantageous, but it's offset by weaker relative conviction: MACD flattened in NLR versus remained bullish but flattening in URNM, and volume participation favored NLR with above-average activity—yet money still rotated toward URNM, voting with its feet for pure scarcity exposure. The winner is the asset class story, not the price momentum.
Nuclear Energy holds 5% on a 74.5 category score—third-highest in the portfolio—because macro fit of 69.0/100 and technical evidence of 68.2/100 create a middle-band holding in a regime where energy scarcity at +9, real asset sponsorship at +7, and late-cycle reflation at +7 all provide legitimate support. URNM's momentum at 100/100 is real, yet the 32/100 timing on extension means new buyers face significant entry risk. The 38.9/100 risk-reward shows 75.8% downside to support against 0% upside to resistance—a 1:1.9 ratio that is unfavorable for fresh capital. To earn 10%, nuclear would need to see URNM consolidate above the 50W in compression with accumulation volume, or to establish a fresh higher low if a pullback occurs. At current extension, this is a hold-for-believers trade, not a new-money trigger. Infrastructure and utilities remain steadier for defensive positioning; nuclear provides leverage to energy scarcity, but only if entry improves.
AI — AIQ
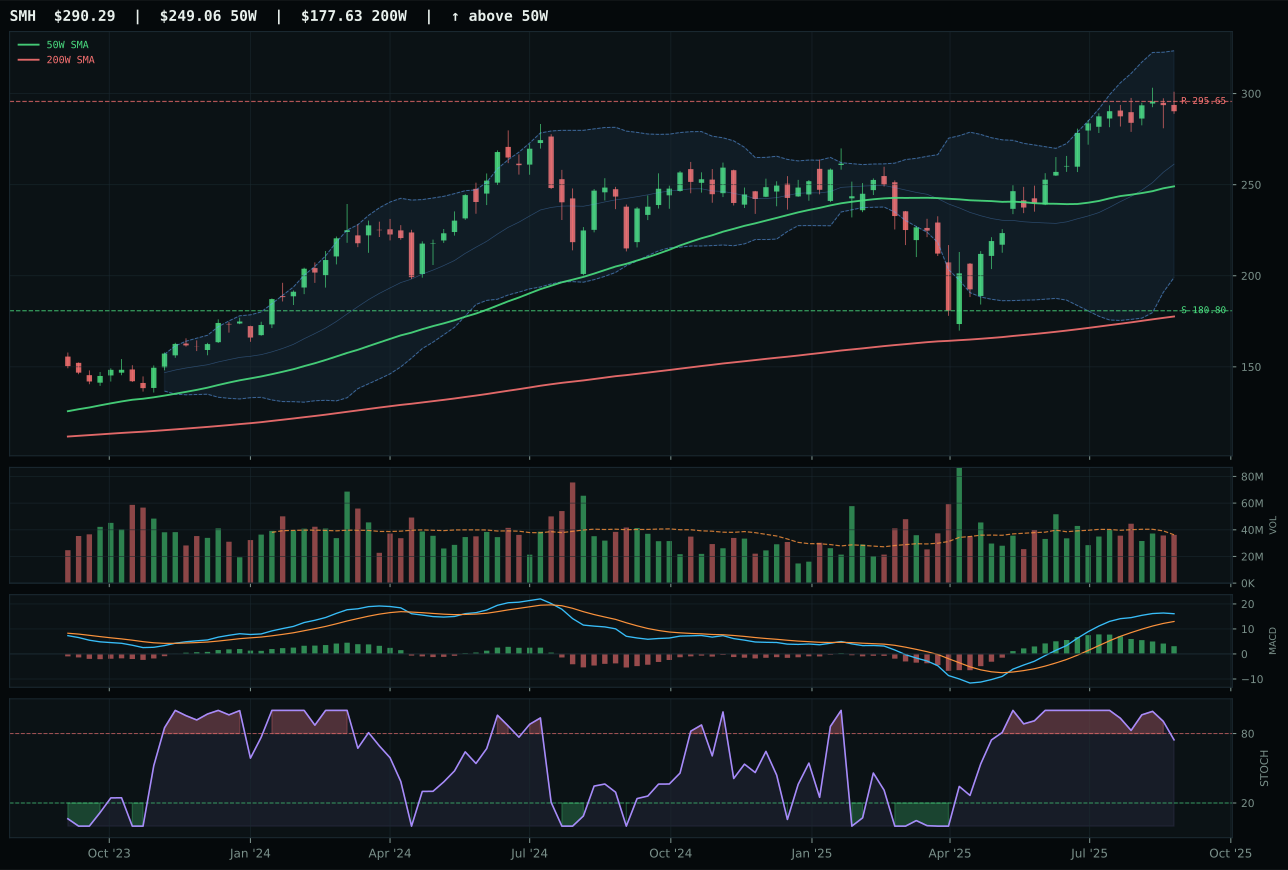
SMH has a vertical extension profile with 11.6% 13-week relative strength versus SPY.
A failed hold above support would weaken the setup.
Actionable but governed by invalidation levels.
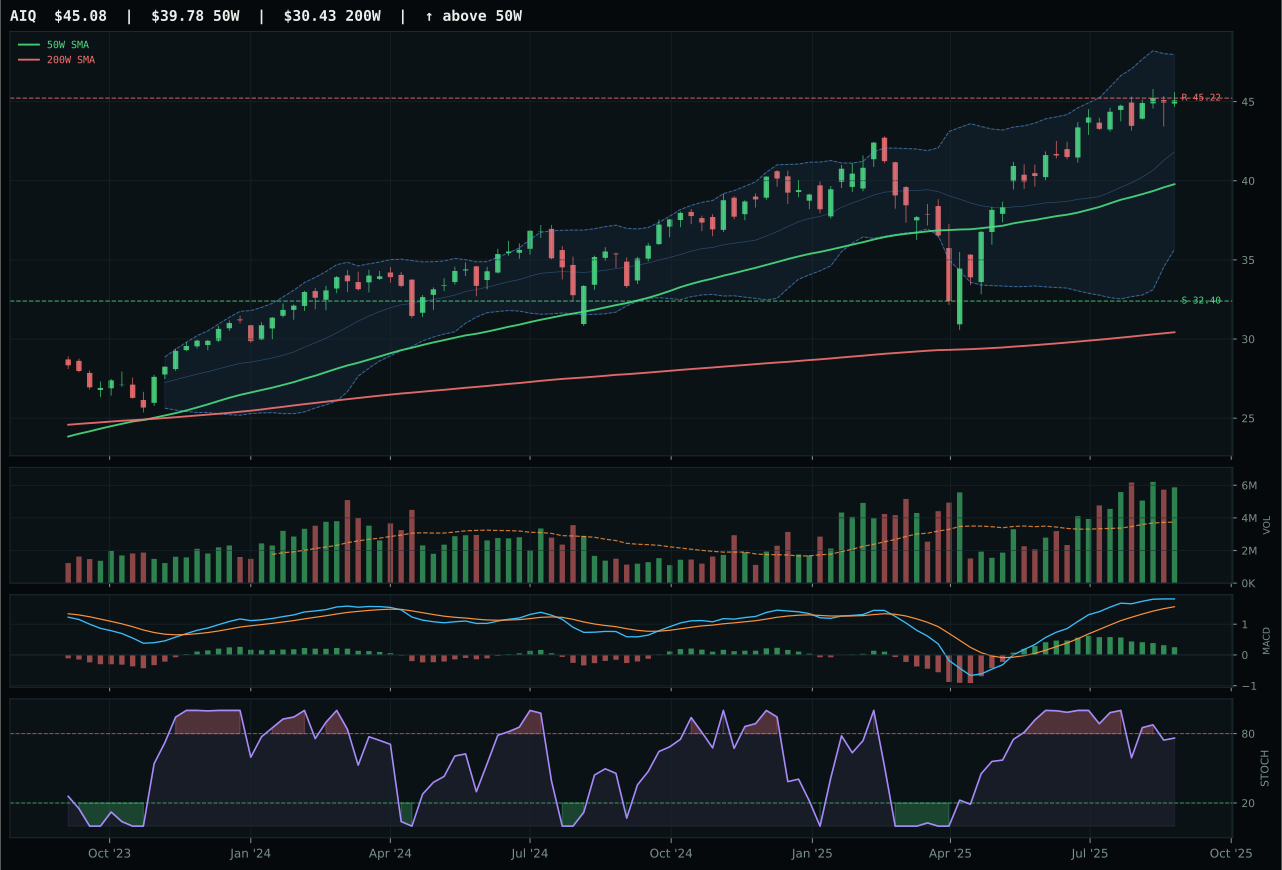
AIQ has a neutral structure profile with 2.4% 13-week relative strength versus SPY.
A failed hold above support would weaken the setup.
Actionable but governed by invalidation levels.
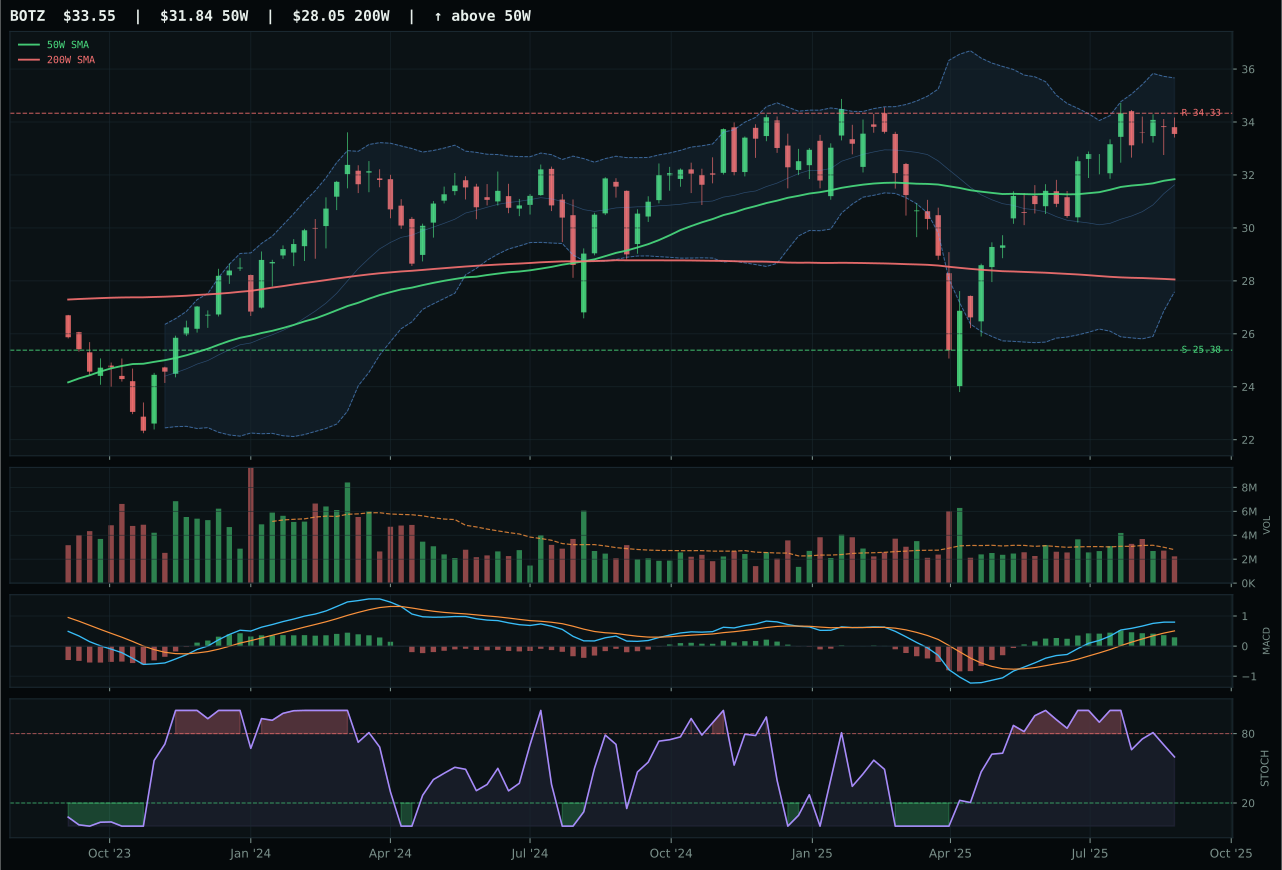
BOTZ has a neutral structure profile with -0.9% 13-week relative strength versus SPY.
A failed hold above support would weaken the setup.
Actionable but governed by invalidation levels.
AIQ won by trading extension for cleaner accumulation and better volume confirmation than its peers. While SMH boasts superior raw momentum with 21.1% thirteen-week returns and 11.6% relative strength, SMH's vertical extension setup combined with neutral volume participation created a timing risk—new buyers are entering near resistance with confirmation thinning. AIQ's 11.9% thirteen-week return comes with 1.57x average volume (genuine accumulation) and a more forgiving 13.3% distance from the 50-week moving average, giving the move room to expand without immediately hitting overbought conditions. The 7.9-point margin is clean because AIQ's structure (81.3/100) beats SMH's (75.9/100) on cleanliness and compression; this reflects organized buying rather than panic chasing.
AI scored 63.0 as the third-highest category, held at 5%, because macro fit of 54.0/100 and strong technical evidence of 86.4/100 place it in the middle band rather than the conviction tier. AI growth sponsorship is active at +14, supporting the category narrative, yet liquidity stress (-12) and credit stress (-8) create genuine friction in a late-cycle reflation where capital is rotating away from duration-sensitive narratives into real assets. SMH's 100/100 momentum in an overbought stochastic setup argues that the easy money has been made; AIQ's softer 13-week of 11.9% versus SPY's broader rally suggests software is decelerating relative to compute and semiconductors. The category needs to prove it can hold gains on weaker volume or attract fresh accumulation to justify a jump to 10%. At 5%, AI remains a satellite play—real exposure lives in real assets and energy, where macro is actively bullish, not contingently supportive.
Utilities & Infrastructure — IGF
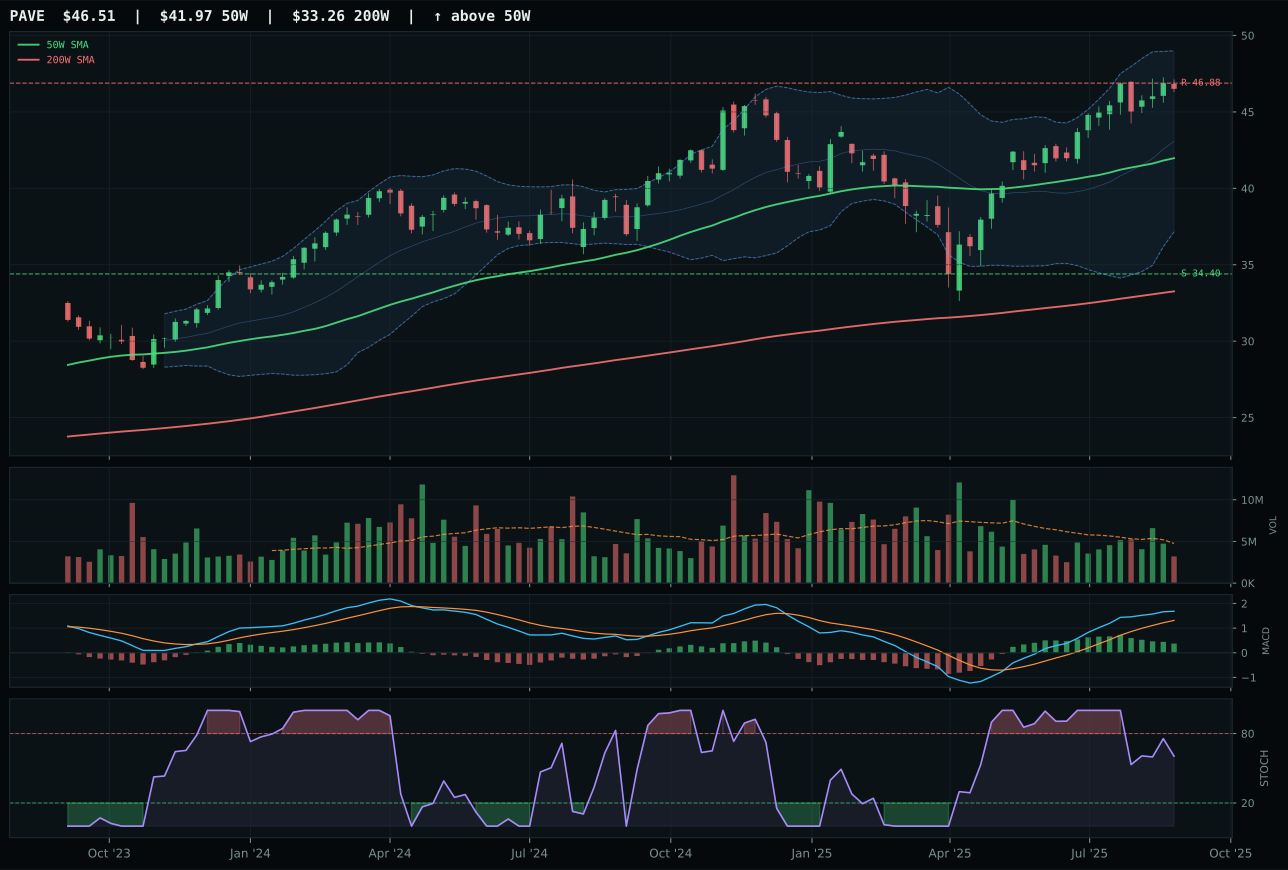
PAVE has a neutral structure profile with 2.6% 13-week relative strength versus SPY.
A failed hold above support would weaken the setup.
Actionable but governed by invalidation levels.
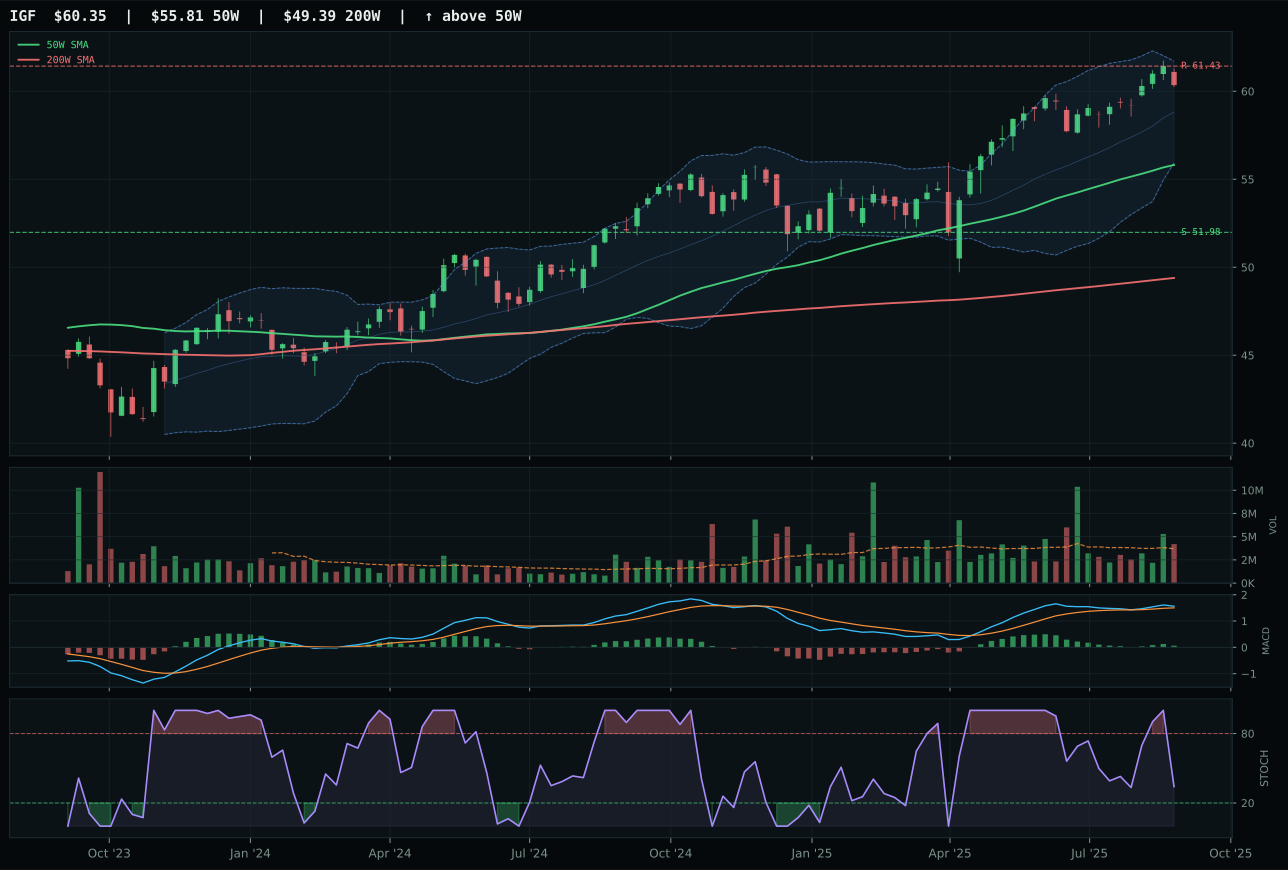
IGF has a neutral structure profile with -7.2% 13-week relative strength versus SPY.
A failed hold above support would weaken the setup.
Actionable but governed by invalidation levels.
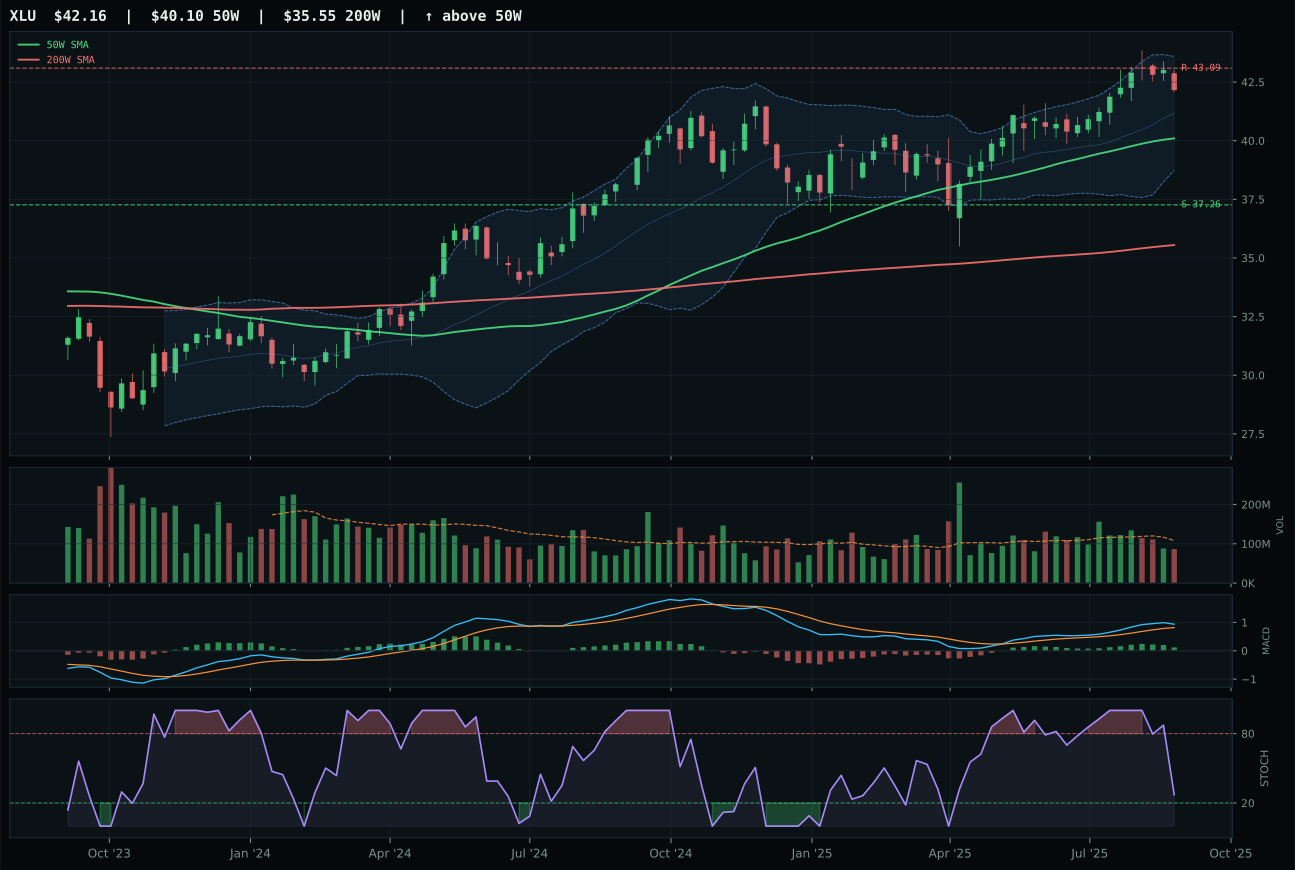
XLU has a neutral structure profile with -6.5% 13-week relative strength versus SPY.
A failed hold above support would weaken the setup.
Actionable but governed by invalidation levels.
IGF won against PAVE by displaying improving MACD confirmation while PAVE's MACD flattened, a technical distinction that mattered more than PAVE's superior 12.0% thirteen-week return. The structural trade-off is illuminating: PAVE has stronger raw momentum (87/100 versus 58/100) but IGF has cleaner participation with 1.13x average volume (above-average accumulation) versus PAVE's thin participation, plus superior timing of 75/100 versus 62/100 from its tighter 8.1% distance from the 50-week moving average. PAVE is extended and losing steam; IGF is coiled and confirming. The 4.1-point margin reflects that market participants are rotating toward the steadier technical setup (IGF's improving MACD) rather than chasing higher-momentum exposure (PAVE's flattening), a rotation signal that favors patient accumulation over aggressive entry.
Utilities & Infrastructure holds 5% on a 54.1 category score—middle-band positioning—because macro fit of 43.0/100 shows ambivalence in late-cycle reflation. Inflation pressure at negative 6 is a headwind for utilities; liquidity stress at negative 3 and risk appetite positive at negative 2 show the macro regime is not designed for defensive duration plays. IGF's global infrastructure and real-asset characteristics offer some inflation hedge, yet the 2.3% 13-week return and negative 7.2% RS lag indicate capital is rotating into higher-return real assets. PAVE's superior 12% 13-week return and 2.6% RS show that domestic infrastructure and capex benefit from reflation, yet thin volume undermines the setup. To earn 10%, utilities would need to consolidate and demonstrate fresh accumulation at higher prices, or to see a sector-wide MACD confirmation flipping to bullish-and-improving across the 3/2/1 basket. At 5%, this is a conservative sleeve for investors seeking income and inflation protection without equities. For conviction portfolios rotating into scarcity themes, this allocation is appropriate hedge ballast.
Precious Metals — GDX
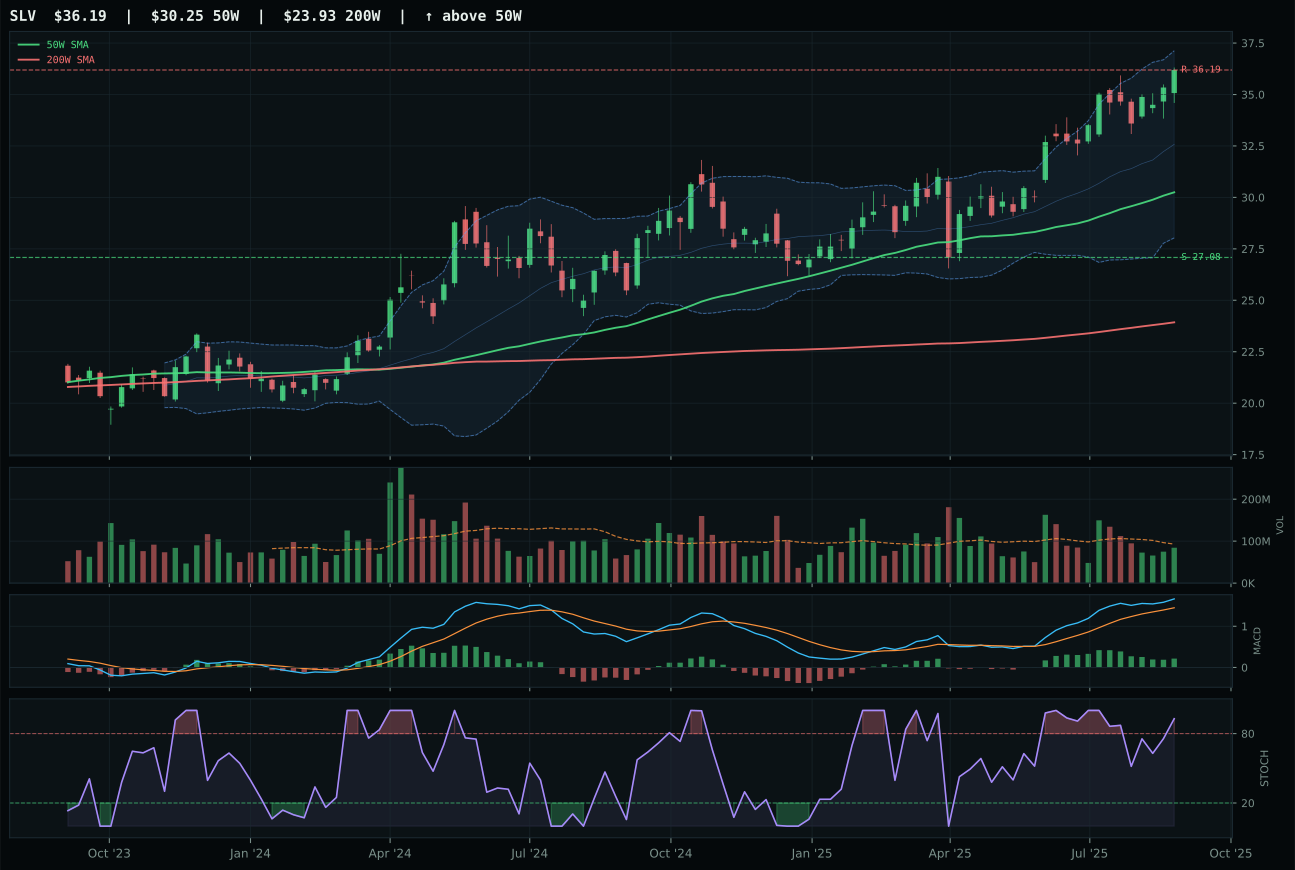
SLV has a vertical extension profile with 11.2% 13-week relative strength versus SPY.
A failed hold above support would weaken the setup.
Actionable but governed by invalidation levels.
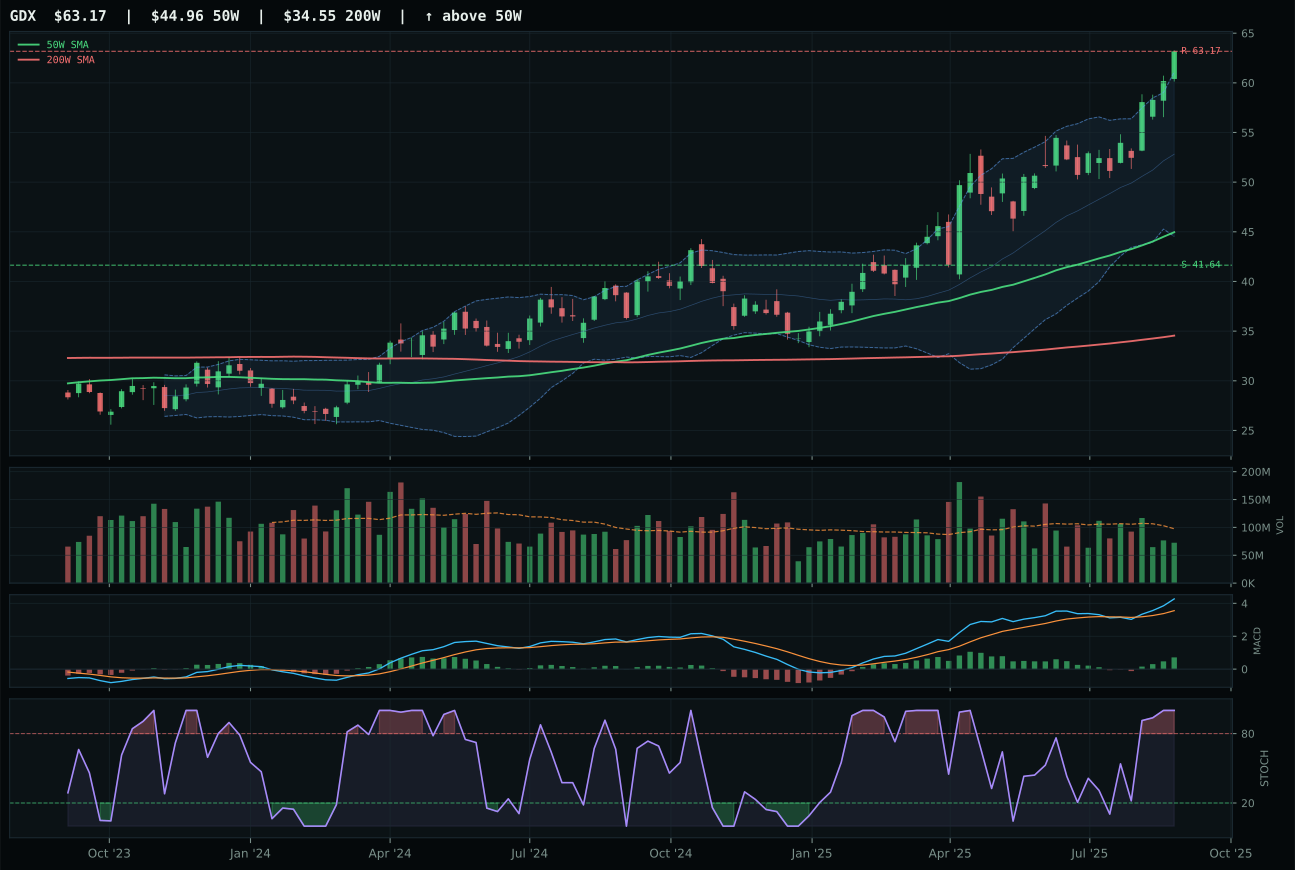
GDX has a vertical extension profile with 15.3% 13-week relative strength versus SPY.
A failed hold above support would weaken the setup.
Actionable but governed by invalidation levels.
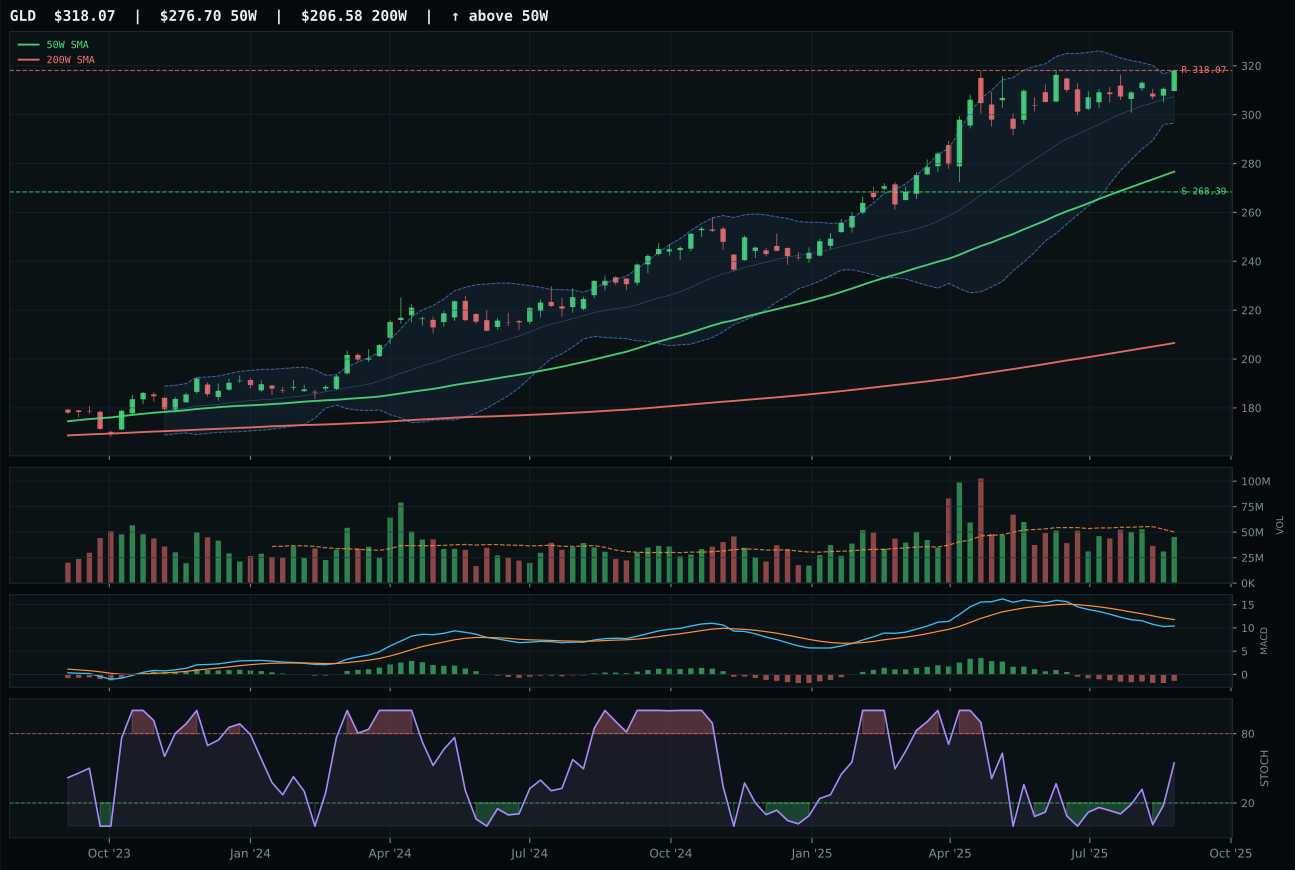
GLD has a neutral structure profile with -4.7% 13-week relative strength versus SPY.
A failed hold above support would weaken the setup.
Actionable but governed by invalidation levels.
GDX won by displaying the only improving MACD confirmation in the metals basket, even though its 40.5% extension above the 50-week moving average screams entry risk. The 100/100 momentum confirmation score (24.7% thirteen-week return, 15.3% relative strength, MACD bullish and improving) represents genuine institutional demand for gold miners as monetary hedges, not just momentum chasers following silver higher. SLV lost the decision because its MACD flattened rather than improved—a technical signal that the move is losing force—and its timing score of 32/100 (worse than GDX's 37/100) reflects a setup that is simply more extended. The structural difference is meaningful: GDX's vertical extension with 83.3 cleanliness shows organized strength, while SLV's vertical extension lacks that same conviction. The narrow minus-5.7-point gap masks the fact that GDX is the only representative with truly reinforcing technicals.
Precious Metals holds 5% as the category score of 48.4 reflects strong momentum (100/100 on GDX) but genuine entry-timing penalties and a macro fit of only 46.0/100 in a reflation regime. Risk appetite is currently neutral in macro, and liquidity stress at negative 9 and credit stress at negative 7 create headwinds that are not offset by supply-scarcity or inflation support. The 3/2/1 basket is led by SLV at 61.6 reasoned score—higher than GDX's 55.3—but SLV's bullish-but-flattening MACD and neutral volume triggered the allocator's skepticism about fresh accumulation. Precious metals serve here as a hedge and real-asset sleeve, not as a conviction trade. To earn 10%, the category would need to either see volume spike into resistance on GDX or watch both GDX and SLV reset on a pullback with positive stochastic turn-ups coupled to accumulation. Currently, overbought momentum in thin volume is a sell signal disguised as strength. Five percent is appropriate insurance; more would be speculation on extended setups.
Defense & Aerospace — XAR
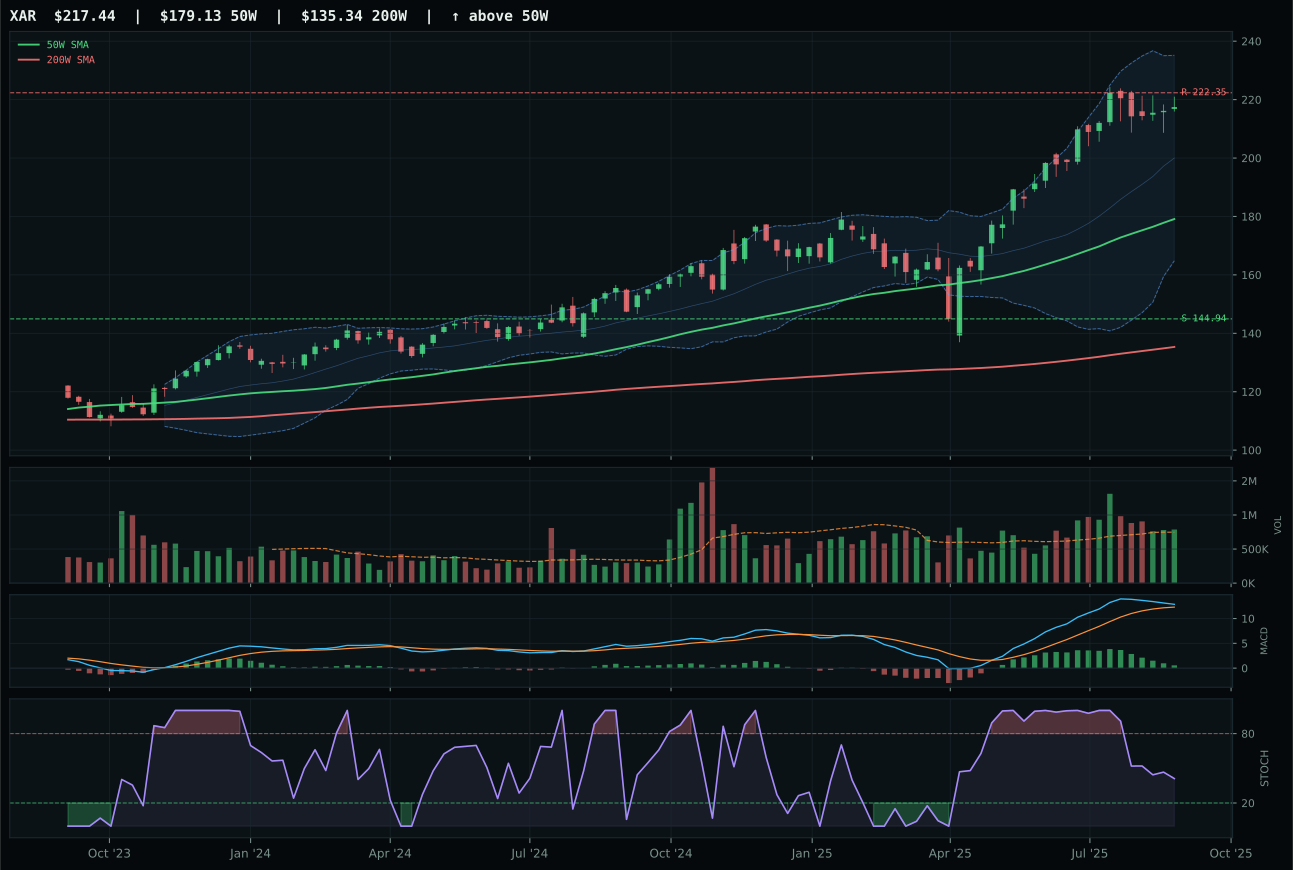
XAR has a vertical extension profile with 4.2% 13-week relative strength versus SPY.
A failed hold above support would weaken the setup.
Actionable but governed by invalidation levels.
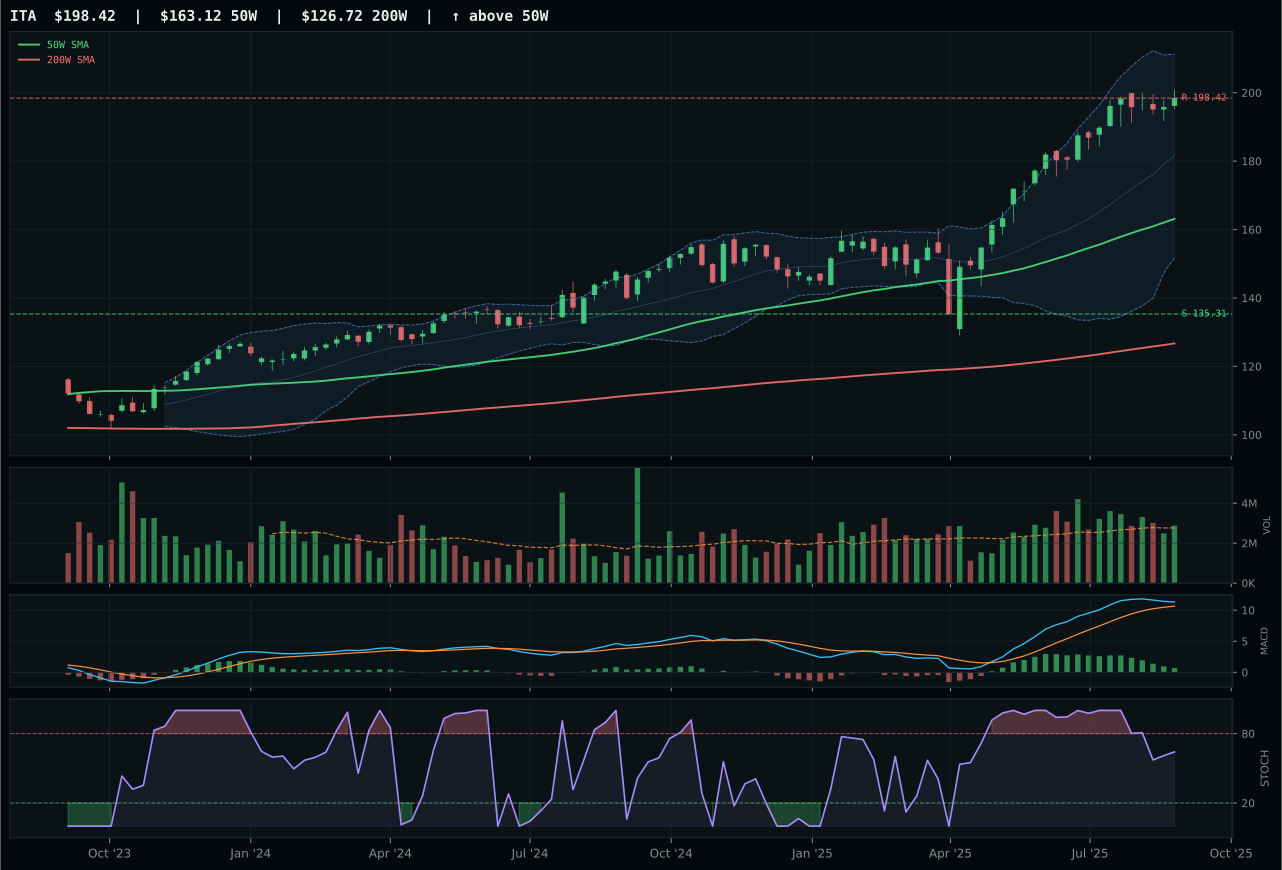
ITA has a vertical extension profile with 2.5% 13-week relative strength versus SPY.
A failed hold above support would weaken the setup.
Actionable but governed by invalidation levels.
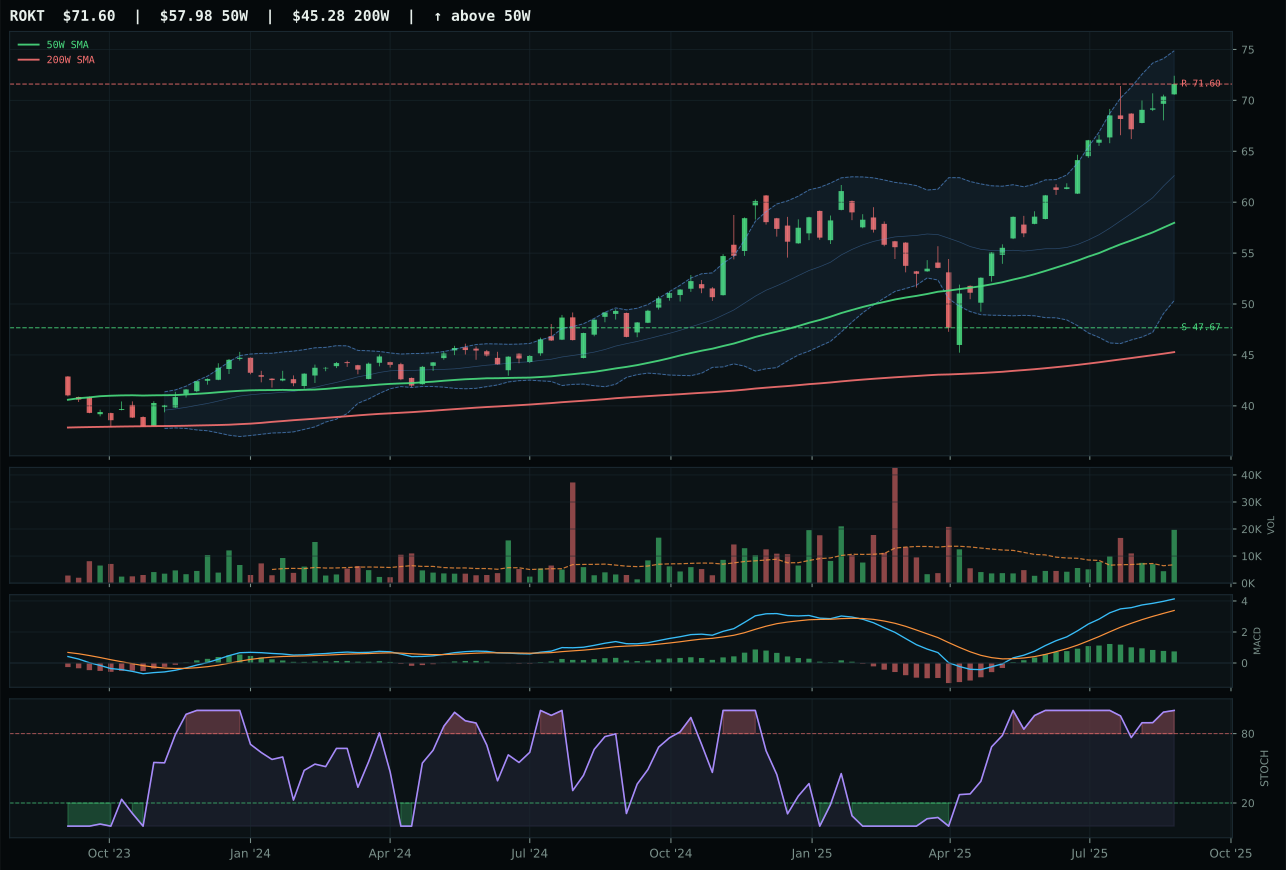
ROKT has a vertical extension profile with 12.8% 13-week relative strength versus SPY.
A failed hold above support would weaken the setup.
Tracked, but not top-2 eligible because: .
XAR won a close decision against ITA by maintaining marginal relative strength leadership within the category, though both are extended and vulnerable. The 4.2% relative strength versus the market combined with neutral category relative strength keeps XAR ahead, but the victory is built on fragile footing: price sits 21.4% above the 50-week moving average, MACD is flattening not improving, and the risk/reward calculation (37.8/100) reflects downside of 50% to support versus essentially zero upside to resistance. ITA lost by 1.4 points because category-relative strength fell to -1.7%, a technical betrayal that matters more than the identical trend and timing scores both ETFs carry. Neither setup is clean; both are extended toward sector resistance with neutral volume participation confirming that buyers have largely exhausted their ammunition.
Defense & Aerospace holds 5% despite a category score of 47.8, which ranks in the middle-lower tier, because macro fit of 57.0/100 and a full 3/2/1 basket of qualifying setups provide reasonable conviction in a reflation regime where geopolitical safety and capex sponsorship matter. Late-cycle reflation helps this exposure at +6; credit stress's active +2 is a rare macro positive for a defensive sector. Yet the 37.8/100 risk-reward on the category representative and thin 1.05x neutral volume suggest that XAR has already captured most of its move. To elevate above 5%, the category would need to see XAR compress back toward support and consolidate, or to see ITA or ROKT establish new relative strength inside the basket, signaling broadening demand rather than single-name momentum. At current extension and timing, this is a hold for believers in duration and defense, not a hunt for fresh entry.
Technology — XLK
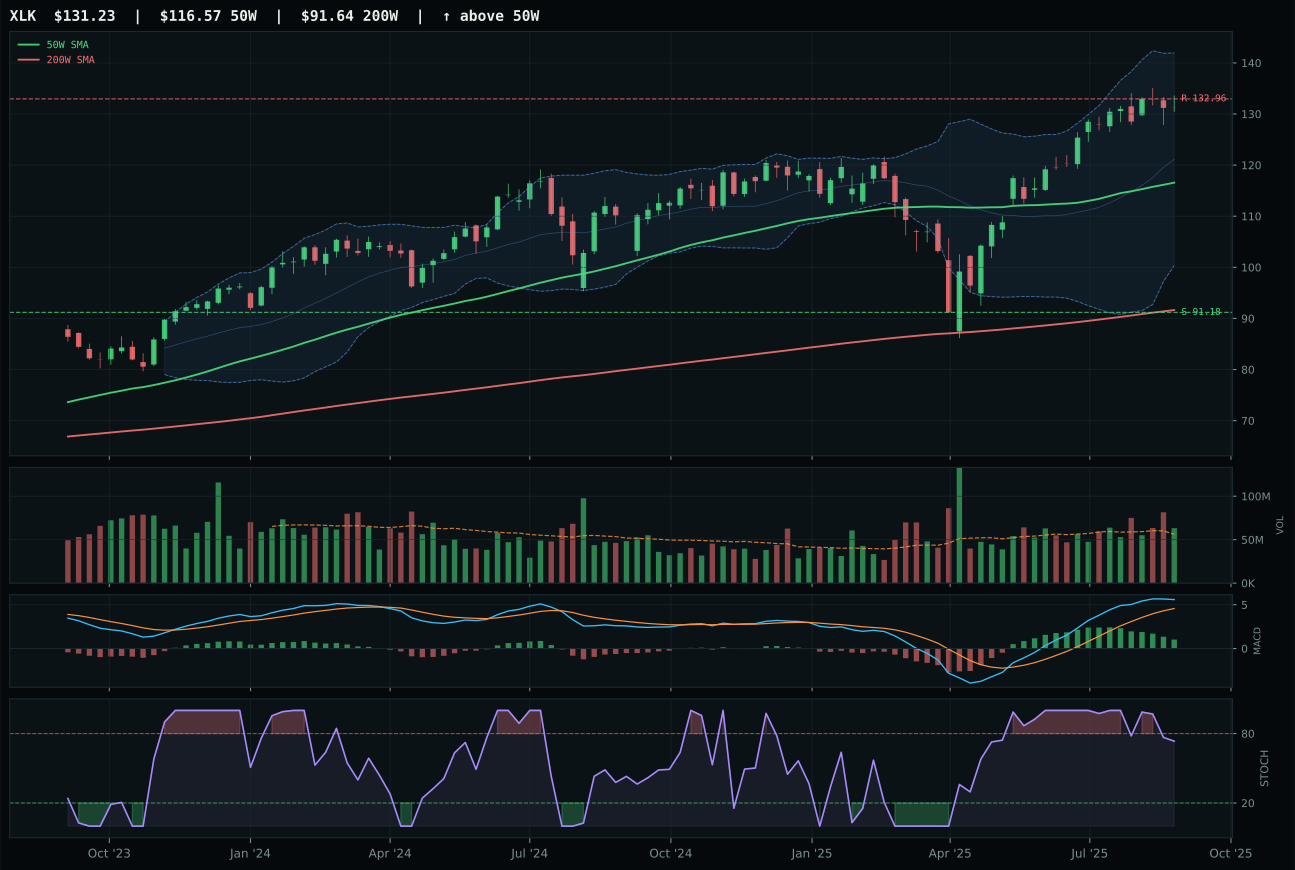
XLK has a neutral structure profile with 4.2% 13-week relative strength versus SPY.
A failed hold above support would weaken the setup.
Actionable but governed by invalidation levels.
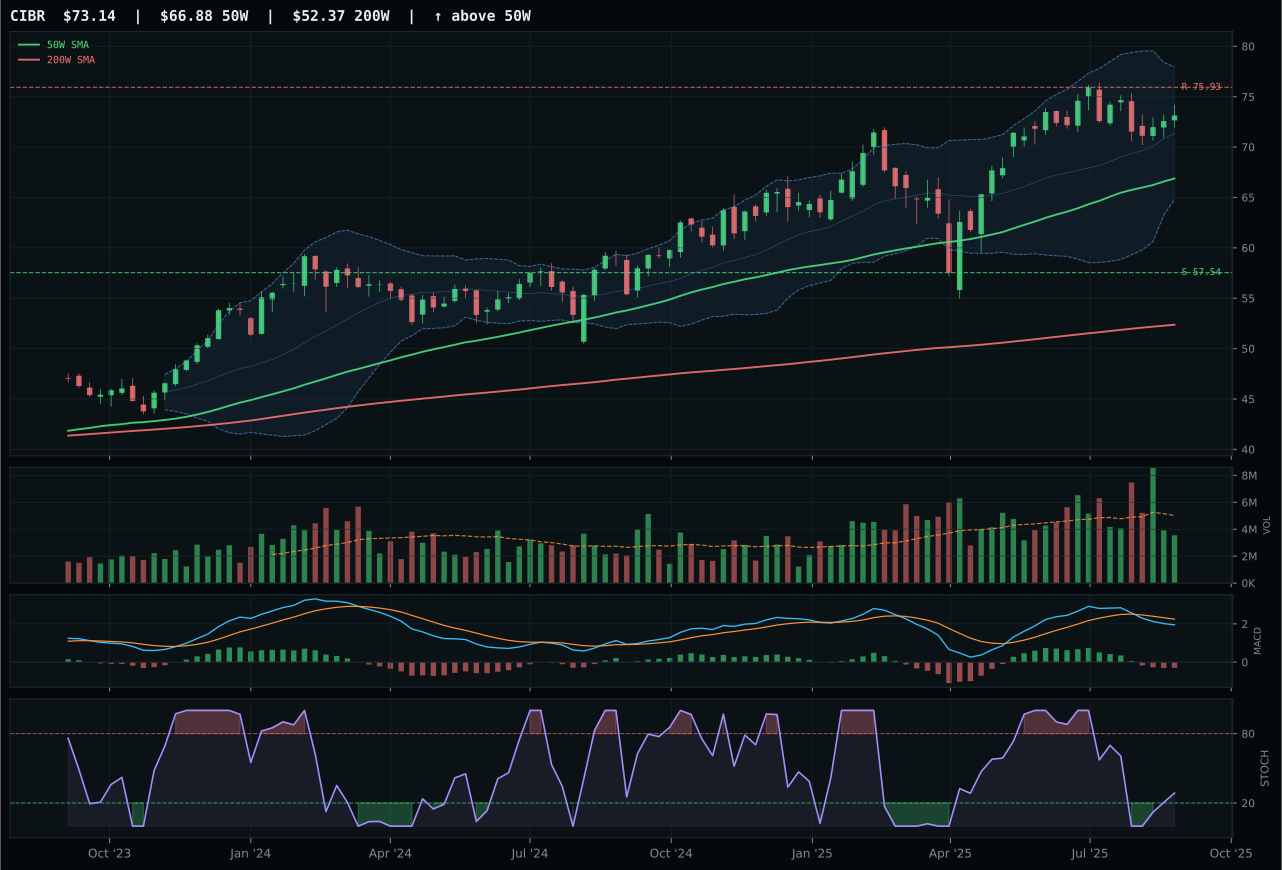
CIBR has a neutral structure profile with -7.6% 13-week relative strength versus SPY.
A failed hold above support would weaken the setup.
Actionable but governed by invalidation levels.
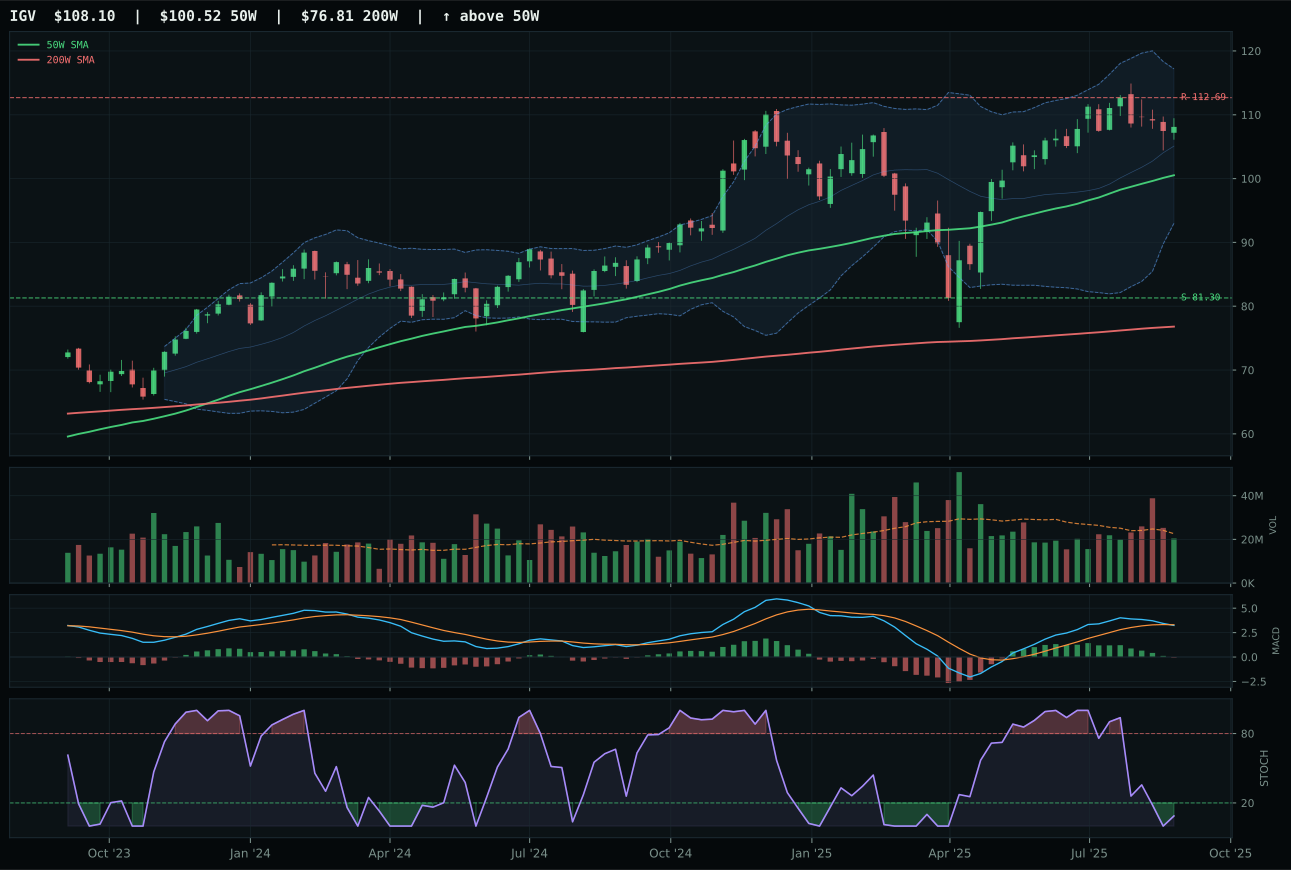
IGV has a neutral structure profile with -5.2% 13-week relative strength versus SPY.
A failed hold above support would weaken the setup.
Actionable but governed by invalidation levels.
XLK won the category by combining clean trend structure with genuine relative strength accumulation rather than mere price extension. The 13.7% thirteen-week return paired with 9.4% outperformance versus the category median signals that buyers are selecting this basket for its profitable tech leadership, not chasing momentum—an important distinction when price sits just 12.6% above the 50-week moving average with volume running 1.12x the 20-week average. CIBR lost ground because its MACD deteriorated to bearish/weakening while stochastic RSI rose into mid-zone, a setup that suggests fading interest rather than accumulation, compounded by negative 7.6% relative strength versus the broad market. The structural divergence matters more than the 22.8-point score gap; XLK is being bought on strength while CIBR is correcting on weakness.
Technology earned its 5% slot as the category-level macro fit of 44.0/100 reflects a regime where liquidity stress and credit stress are active headwinds offsetting the tailwind from positive risk appetite and AI growth sponsorship. At 42.7 final score, Technology ranks outside the top two but clearly ahead of true laggards; the category is neither broken nor compelling at current positioning. XLK's trend work is flawless at 100/100, but timing at 62/100 and risk-reward at 37.5/100 create a structure where the next leg depends entirely on whether support holds and volume accelerates. To earn allocation above 5%, this category would need to demonstrate category-wide breadth improvement—not just XLK leadership—and to see CIBR or IGV recapture some relative strength as evidence of broadening participation. In a late-cycle reflation where real assets and commodity exposure dominate, technology remains useful for diversification and momentum, not conviction.
Agriculture & Livestock — MOO
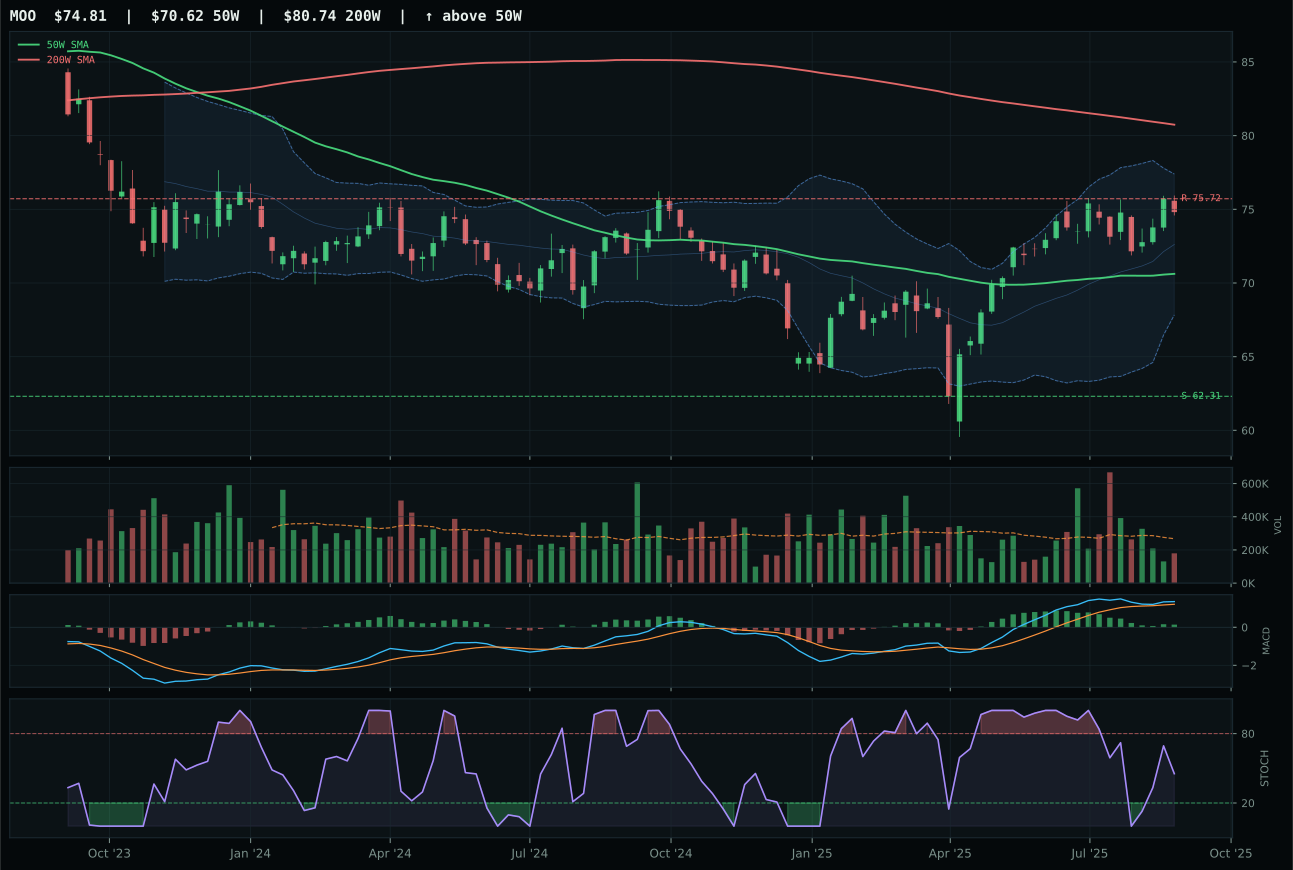
MOO has a neutral structure profile with -6.0% 13-week relative strength versus SPY.
A failed hold above support would weaken the setup.
Actionable but governed by invalidation levels.
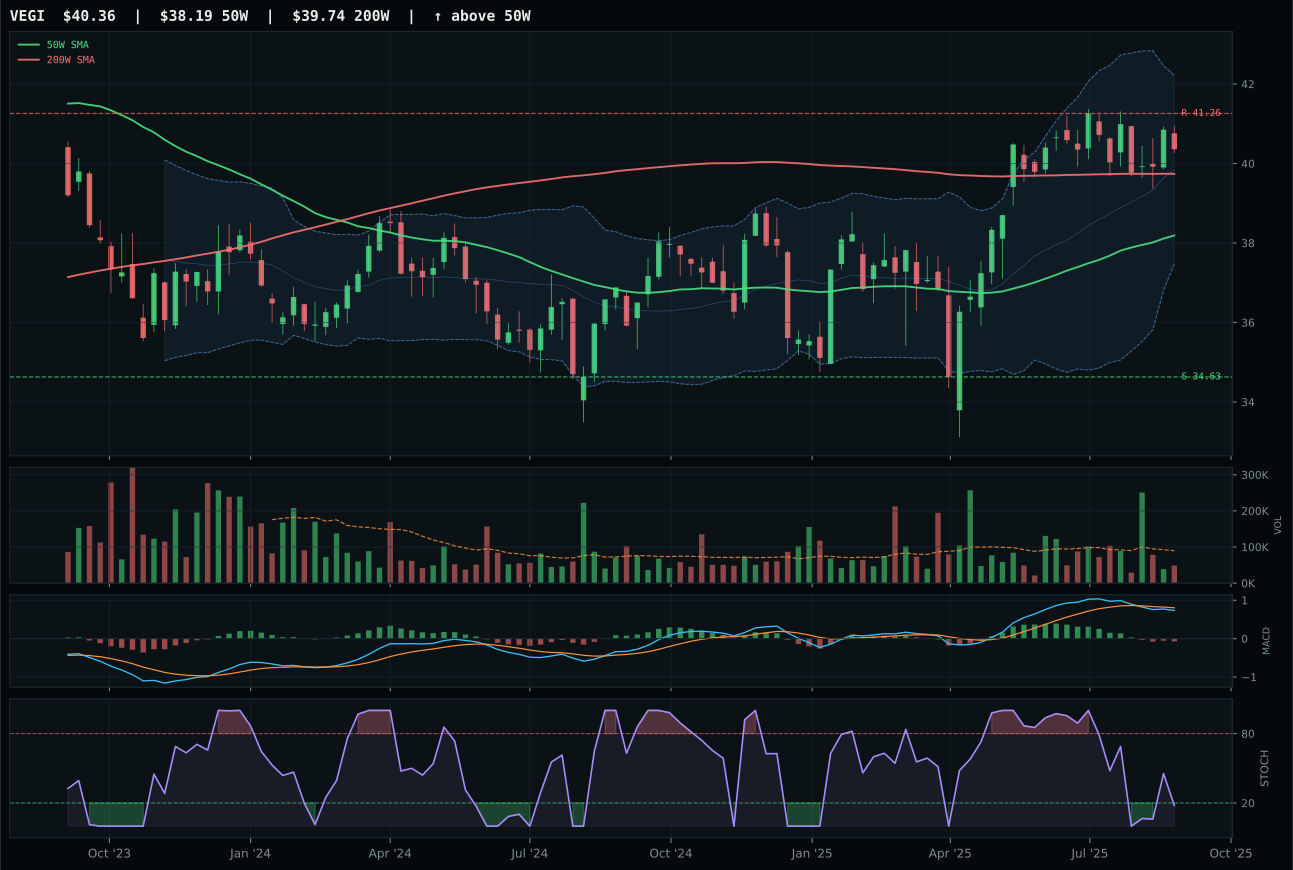
VEGI has a neutral structure profile with -8.0% 13-week relative strength versus SPY.
A failed hold above support would weaken the setup.
Tracked, but not top-2 eligible because: .
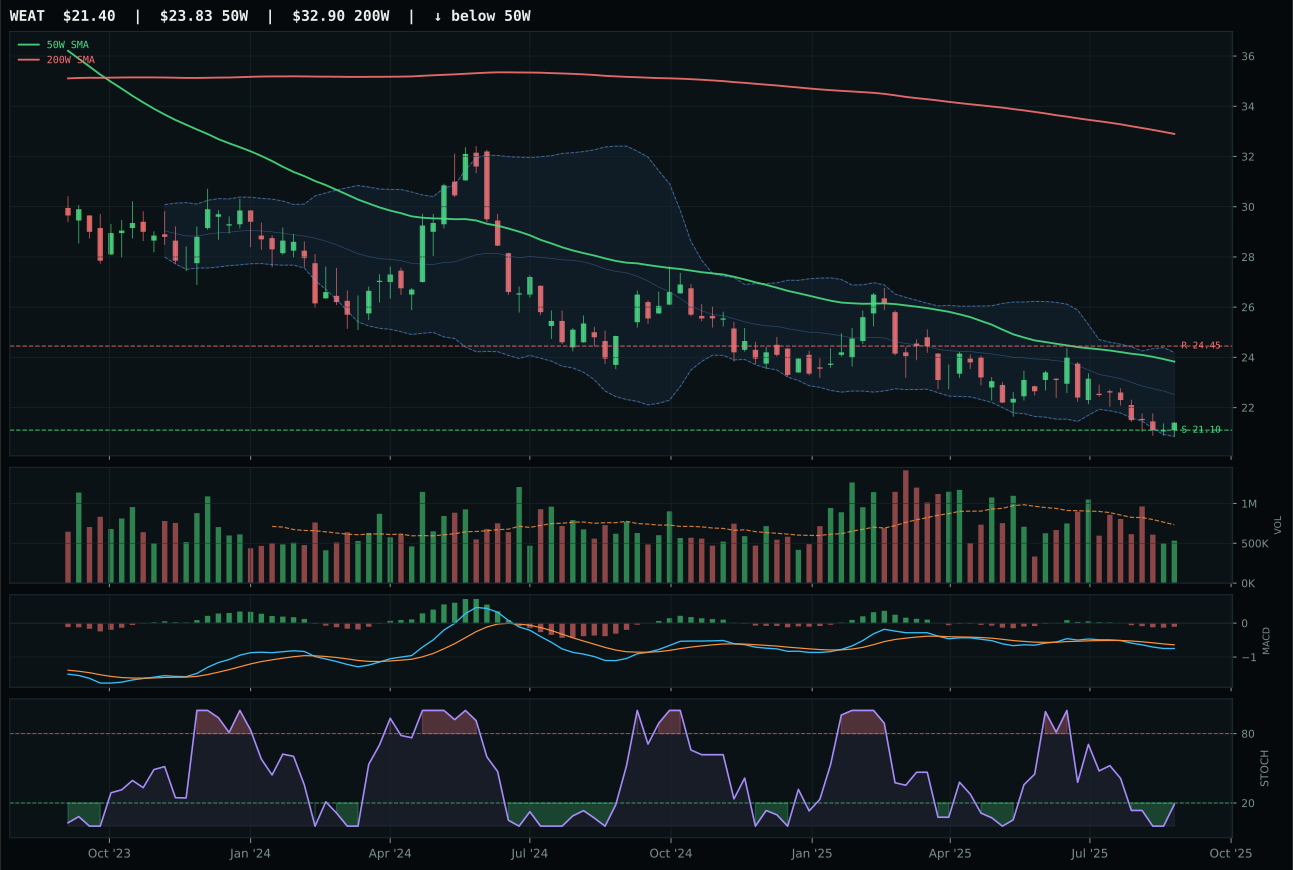
WEAT has a pullback into support profile with -15.0% 13-week relative strength versus SPY.
Extension and support failure are the main tactical risks.
Tracked, but not top-2 eligible because: structurally broken.
MOO won a dominant 24.6-point margin over VEGI because bullish momentum confirmation outweighed the headline weakness of trading below the 200-week moving average. The key is that MOO's 3.5% thirteen-week return came with category-relative outperformance of plus-2%, MACD that remains bullish despite flattening, and rising stochastic RSI at mid-zone—all signatures of a restart rather than a bounce in downtrend. VEGI deteriorated on every dimension: bearish/weakening MACD, oversold stochastic RSI turning up (a setup that often precedes deeper weakness), and negative 8.0% relative strength showing relative underperformance even within a weak category. The thin volume participation in MOO (0.67x average) is concerning, but it's better than deteriorating technical structure; you can accumulate thinly on strength, but you cannot hide deteriorating momentum confirmation.
Agriculture & Livestock earned 0% allocation despite a macro fit of 90.0/100—one of the highest in the portfolio—because technical evidence scored only 62.2/100 on MOO, and the final category score of 37.9 ranked this outside the allocation footprint entirely. The macro narrative is compelling: supply shortage at +13, inflation pressure at +10, and real asset sponsorship at +8 all favor agriculture. The technicals reject the thesis. MOO's negative 6.0% relative strength to SPY, near-horizontal 50W slope at 0.1%, and thin participation at 0.67x volume signal that despite strong fundamental support, no buyers are showing up. The category is ranked ninth or tenth because technicals override macro in a system where entry quality and volume confirmation matter more than narrative fit. For agriculture to claim allocation, MOO would need to establish a clean consolidation above support with accumulation volume, and the 13-week return would need to turn positive relative to SPY. Until price action and volume flip, this category remains a macro thesis without a technical vehicle.
Emerging Markets — ILF
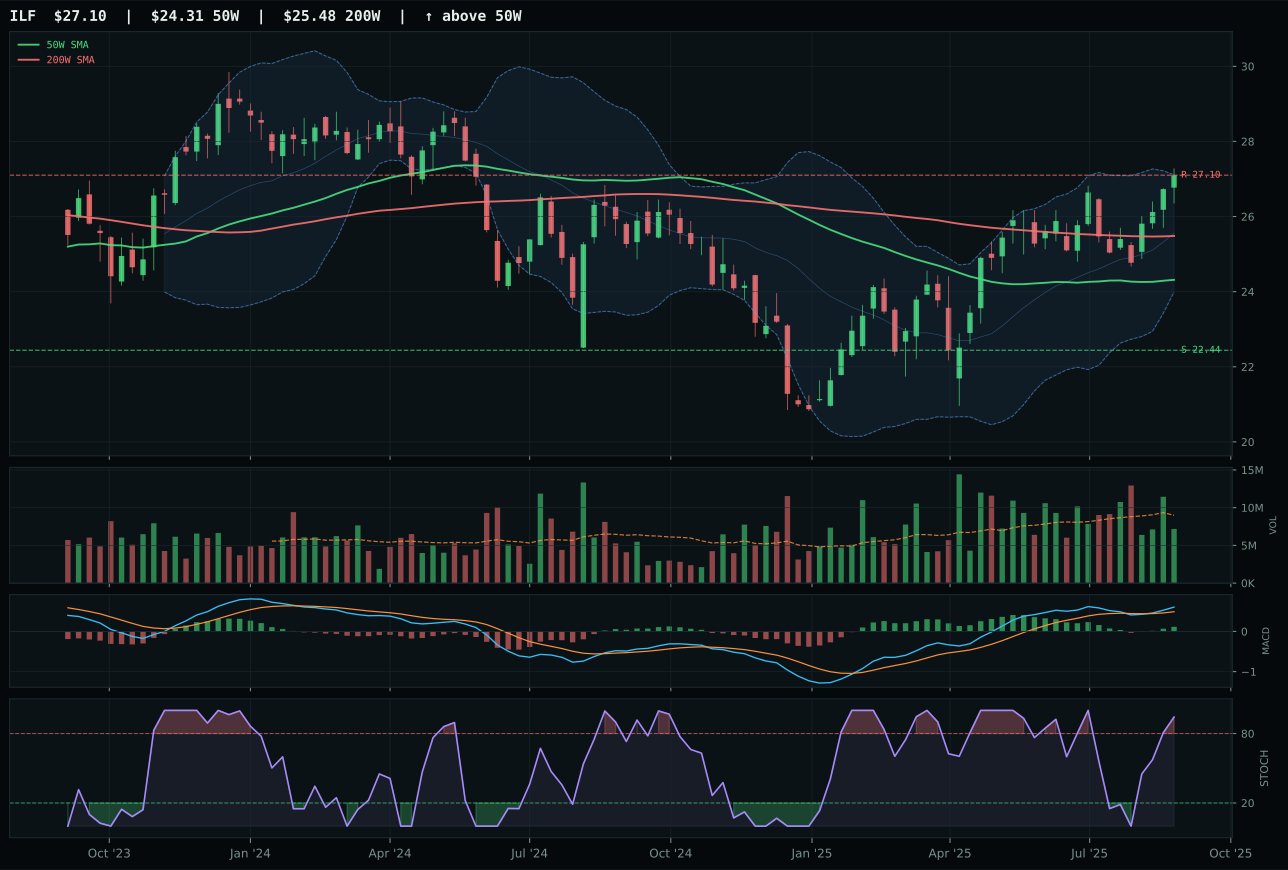
ILF has a neutral structure profile with -2.2% 13-week relative strength versus SPY.
A failed hold above support would weaken the setup.
Actionable but governed by invalidation levels.
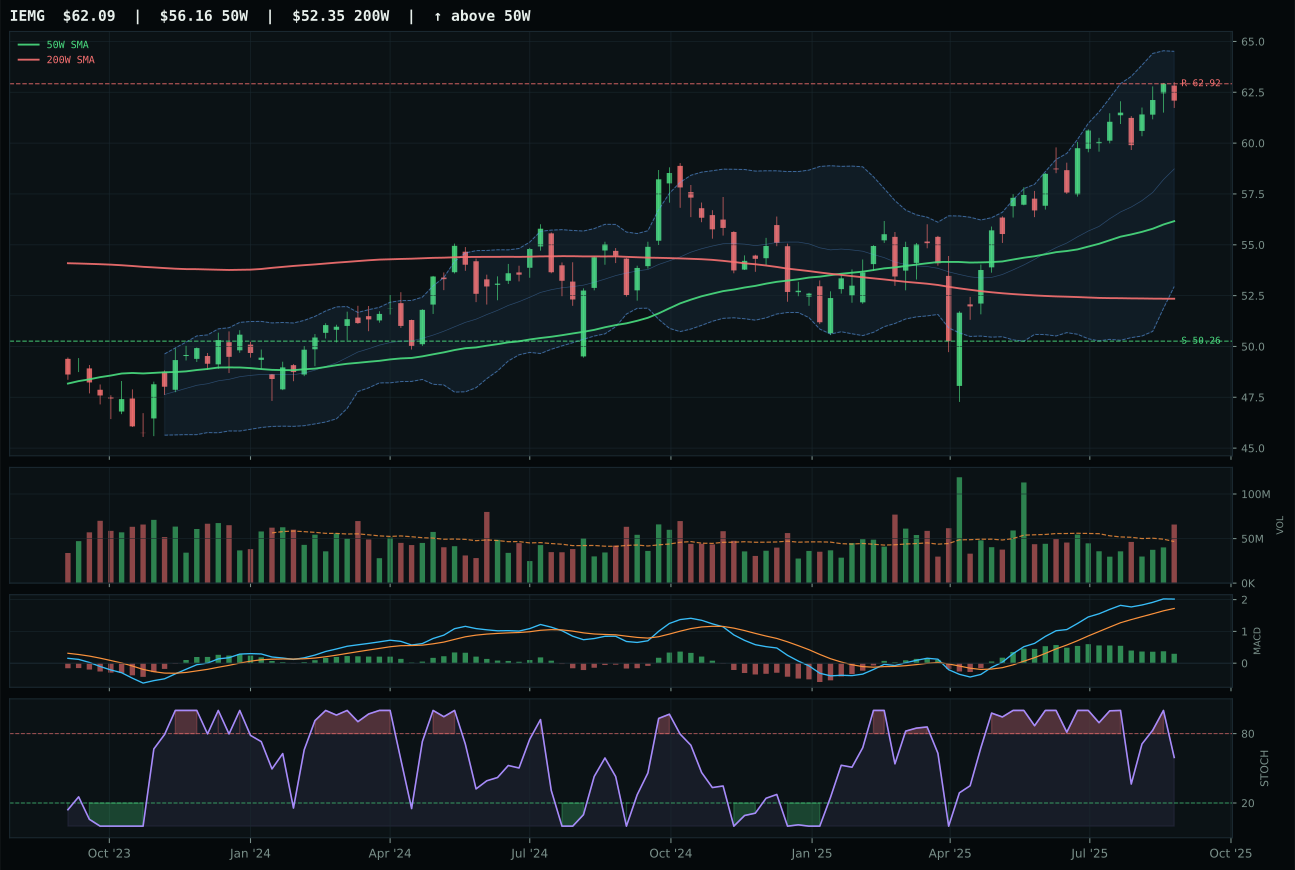
IEMG has a neutral structure profile with 0.1% 13-week relative strength versus SPY.
A failed hold above support would weaken the setup.
Actionable but governed by invalidation levels.
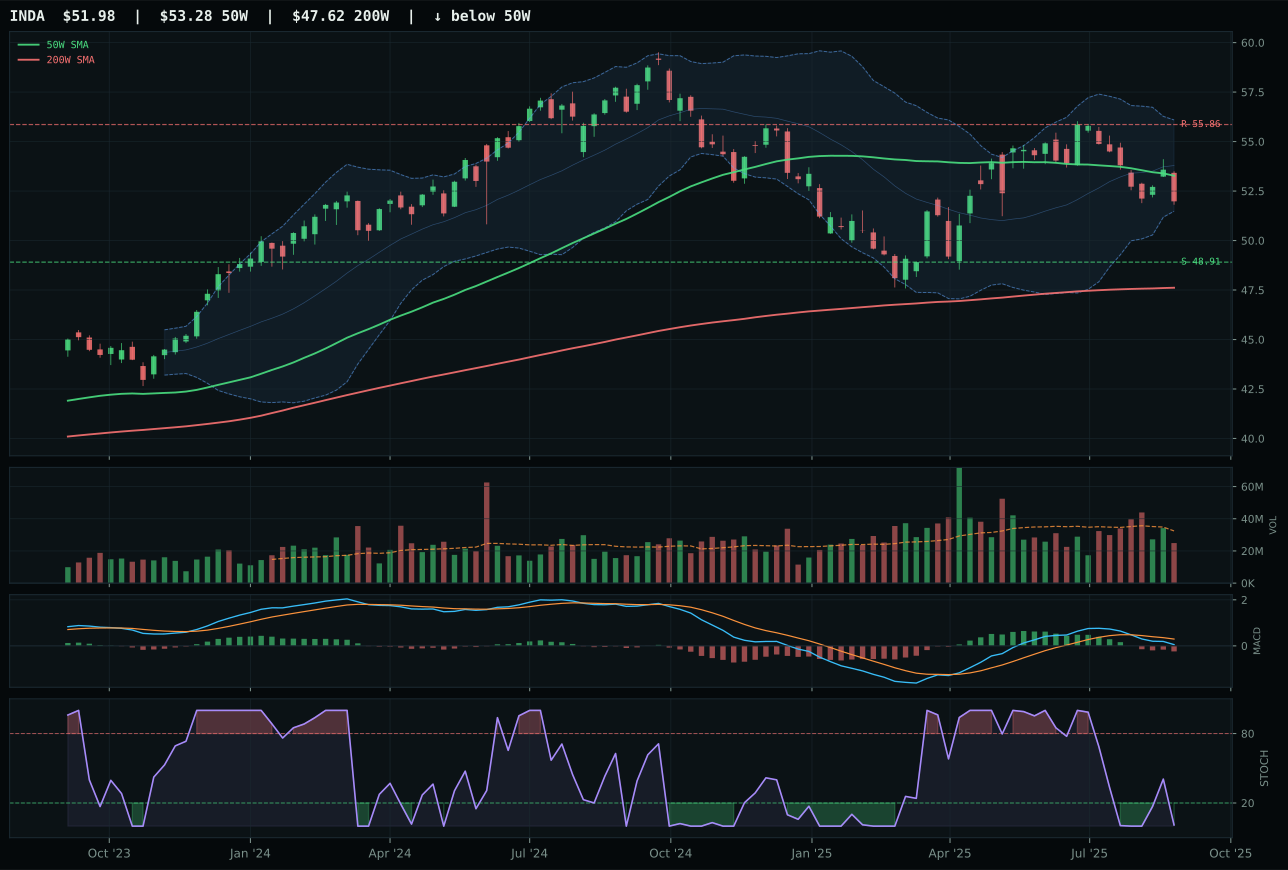
INDA has a compression near 50W profile with -13.7% 13-week relative strength versus SPY.
A failed hold above support would weaken the setup.
Actionable but governed by invalidation levels.
ILF won a narrow 3.4-point decision over IEMG because bullish improving MACD confirmation beat flattening MACD confirmation; both are extended near 52-week highs, but only ILF's momentum indicator is accelerating. The 7.2% thirteen-week return on ILF versus 9.5% for IEMG reveals the real pattern: ILF is capturing selective Latin American strength (commodity breadth, metals scarcity, real asset sponsorship) while IEMG is drawing broad emerging-market beta that is fighting stronger headwinds from credit stress and liquidity. ILF's 0% category-relative strength exactly matches the median, yet it wins because the quality of conviction matters more than the magnitude; IEMG's 2.3% category outperformance is from weaker underlying technicals (deteriorating MACD), suggesting relative strength that won't persist. The winner is the one with improving momentum, not the one with stronger price action.
Emerging Markets earned 0% allocation despite ILF winning its category, because the final score of 37.6 ranks it ninth or tenth among ten categories, and macro fit of only 38.0/100 shows fundamental resistance from active headwinds. Credit stress at negative 10 and liquidity stress at negative 10 are portfolio drags in a regime where late-cycle reflation favors risk appetite only in specific sectors (energy, metals, defense). ILF's Latin America commodity beta should benefit from supply shortage and inflation support, yet the negative 2.2% RS to SPY and 7.2% 13-week return show that emerging markets are orphaned by global capital. Commodity breadth positive is active at +8, but that support lifts industrial metals and agriculture, not EM equities. To earn allocation above 0%, Emerging Markets would need to see ILF establish positive RS to SPY over a 13-week period and to demonstrate volume acceleration into fresh highs. Currently, negative relative strength, thin institutional involvement, and macro headwinds from credit and liquidity stress exclude this category entirely. Real-asset exposures (metals, energy, agriculture) deliver the same inflation-hedge benefit with superior technicals and macro support.