
2025-08-22
Informational purposes only. The content in this report, including allocations, analysis, and commentary, is provided solely for informational and educational purposes. It does not constitute financial advice, investment advice, trading advice, or any other type of advice. Past performance does not guarantee future results. Always conduct your own research and consult a qualified financial professional before making investment decisions.
Weekly Allocation
| Ticker | Category | Weight | Role |
|---|---|---|---|
| FBTC | 50% | Overlay | |
| COPX | Industrial Metals | 10% | Top-2 (10%) |
| URNM | Nuclear Energy | 10% | Top-2 (10%) |
| SMH | AI | 5% | Tier-2 (5%) |
| IGF | Utilities & Infrastructure | 5% | Tier-2 (5%) |
| XLK | Technology | 5% | Tier-2 (5%) |
| ITA | Defense & Aerospace | 5% | Tier-2 (5%) |
| XLE | Traditional Energy | 5% | Tier-2 (5%) |
| GLD | Precious Metals | 5% | Tier-2 (5%) |
Trade Instructions — Monday Open
Sell the tranche from 2025-07-25 (completing its 4-week hold). Buy the new tranche. Instructions show net portfolio changes — same-asset positions cancel, weight changes show the delta.
| Action | Ticker | Instruction |
|---|---|---|
| SELL | REMX | Sell 50% of REMX position (reduce 5.00% → 2.50%) |
| SELL | NLR | Sell 25% of NLR position (reduce 10.00% → 7.50%) |
| SELL | BOTZ | Sell 20% of BOTZ position (reduce 6.25% → 5.00%) |
| SELL | PAVE | Sell entire PAVE position (1.25% of portfolio) |
| SELL | MOO | Sell 33% of MOO position (reduce 3.75% → 2.50%) |
| SELL | SLV | Sell entire SLV position (1.25% of portfolio) |
| BUY | XLK | Buy XLK — 12.50% of freed cash (adds 1.25% to portfolio) |
| BUY | COPX | Buy COPX — 25.00% of freed cash (adds 2.50% to portfolio) |
| BUY | GLD | Buy GLD — 12.50% of freed cash (adds 1.25% to portfolio) |
| BUY | IGF | Buy IGF — 12.50% of freed cash (adds 1.25% to portfolio) |
| BUY | URNM | Buy URNM — 25.00% of freed cash (adds 2.50% to portfolio) |
| BUY | SMH | Buy SMH — 12.50% of freed cash (adds 1.25% to portfolio) |
Current Portfolio After Trade
Combined holdings across all 4 active tranches. Each tranche is 25% of the portfolio.
| Ticker | % of Portfolio | Weight Bar |
|---|---|---|
| FBTC | 50.00% | |
| NLR | 7.50% | |
| COPX | 6.25% | |
| BOTZ | 5.00% | |
| ITA | 5.00% | |
| XLK | 5.00% | |
| GLD | 3.75% | |
| MOO | 2.50% | |
| REMX | 2.50% | |
| XLE | 2.50% | |
| XLU | 2.50% | |
| IGF | 2.50% | |
| URNM | 2.50% | |
| GDX | 1.25% | |
| SMH | 1.25% |
Macro Regime — Late-Cycle Reflation
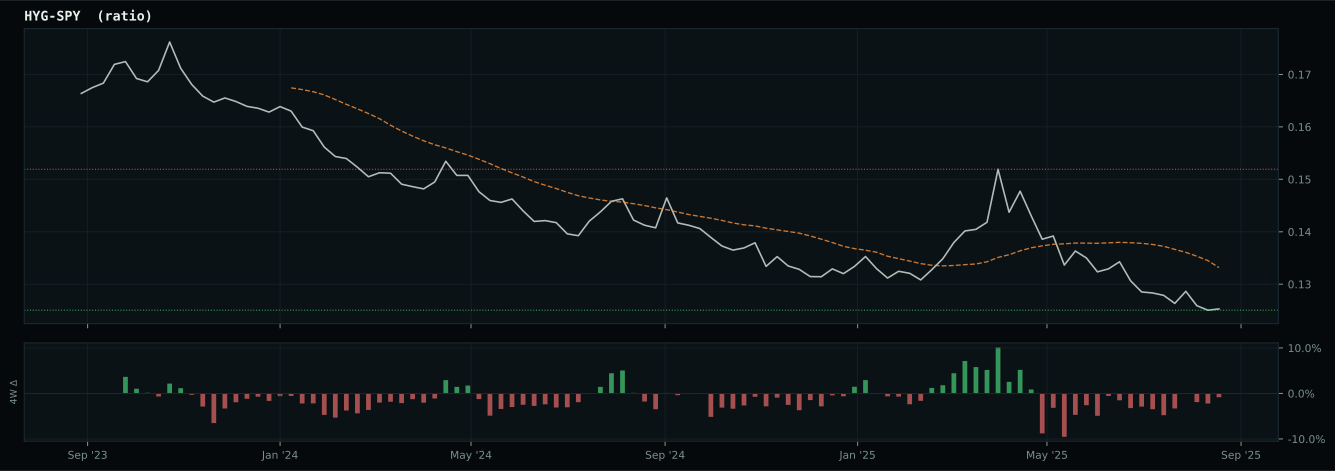
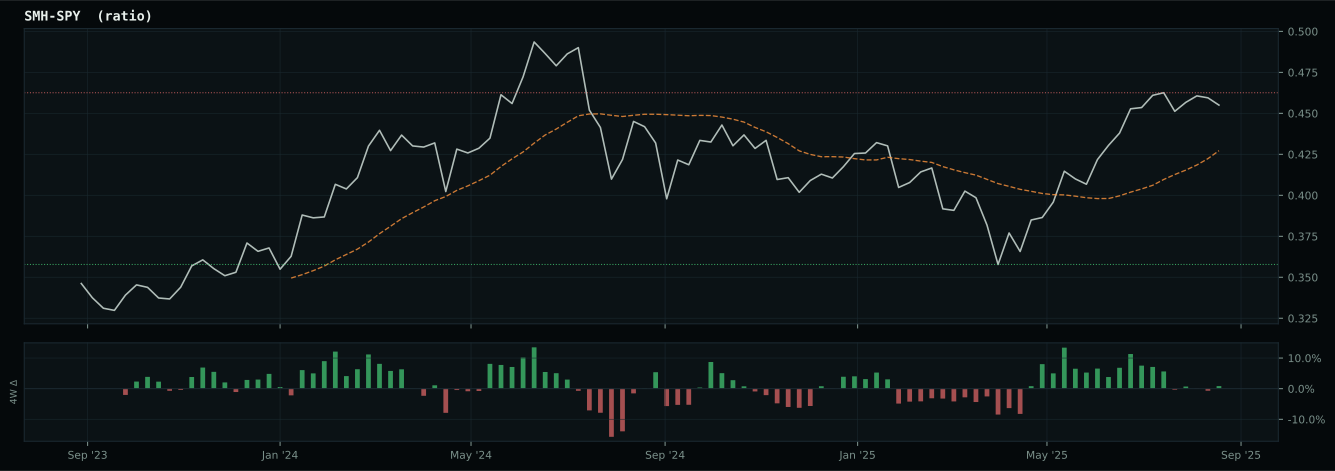
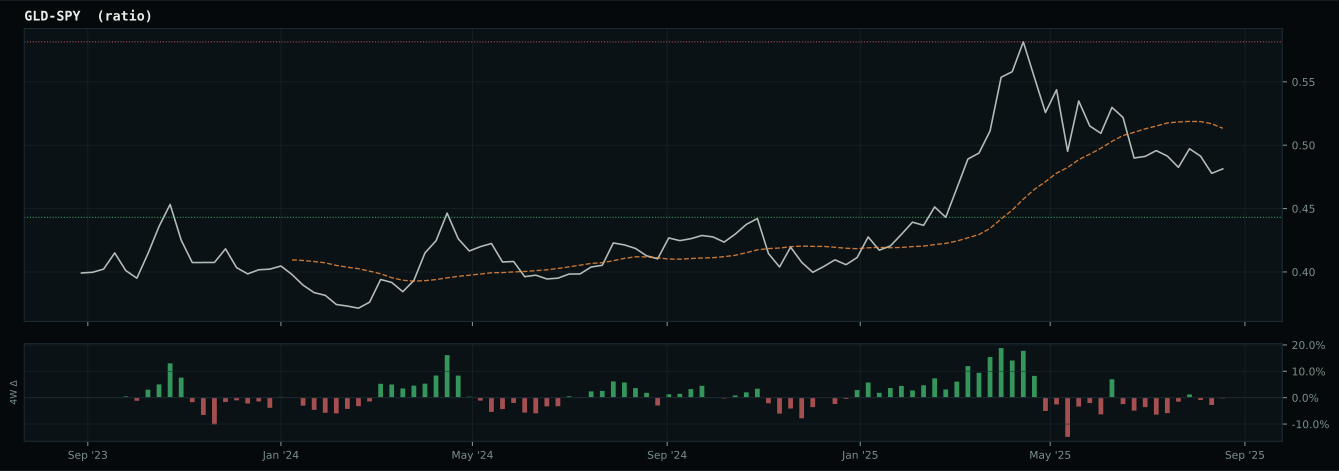
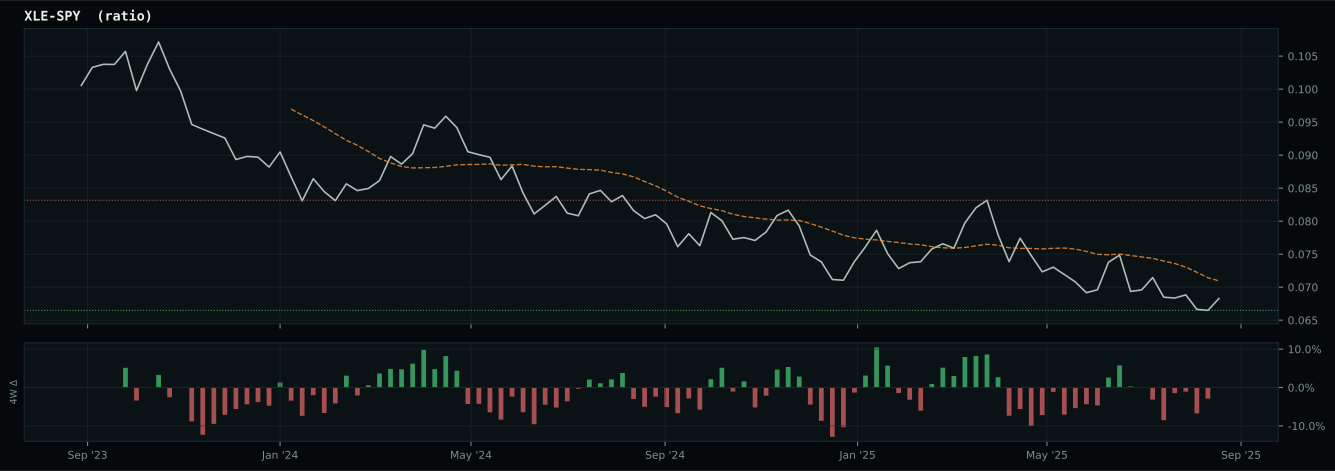
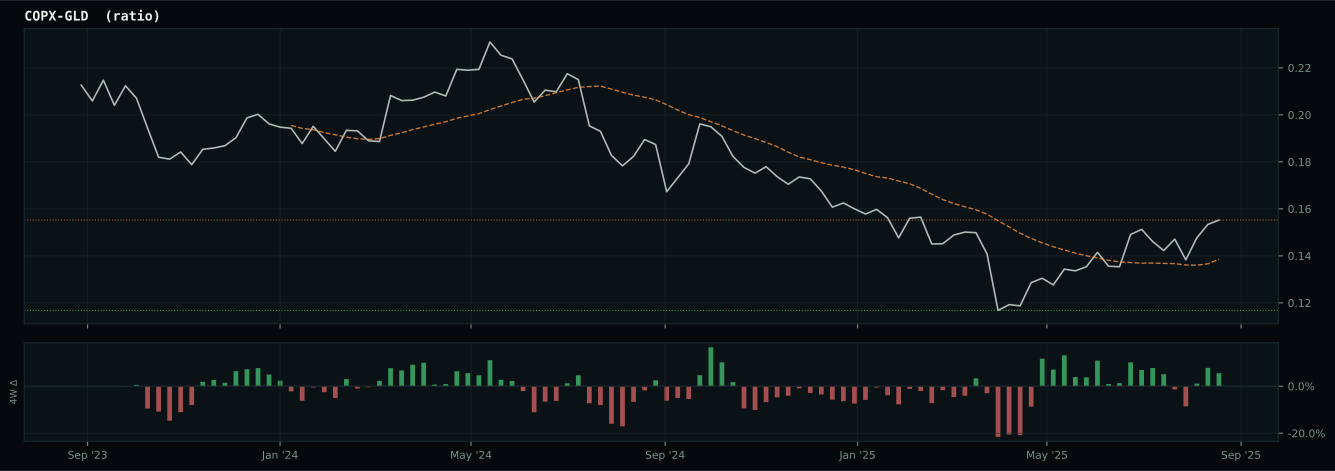
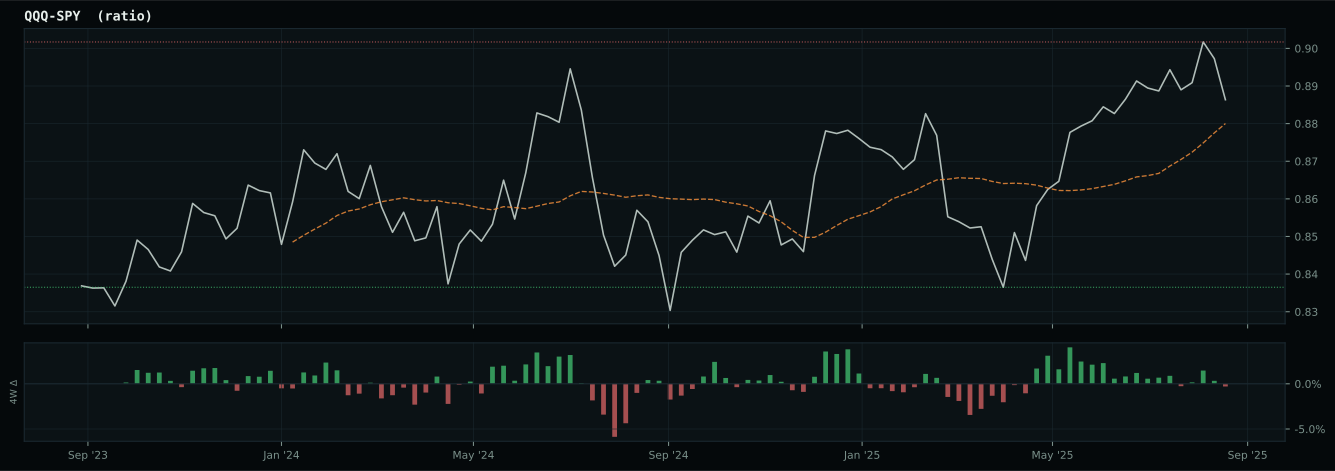
Macro Evidence Charts
Market-implied signals behind the macro regime scores. Each ratio compares two assets; the direction and slope of the ratio is what the macro engine reads.
Crypto Regime — TrendBTC
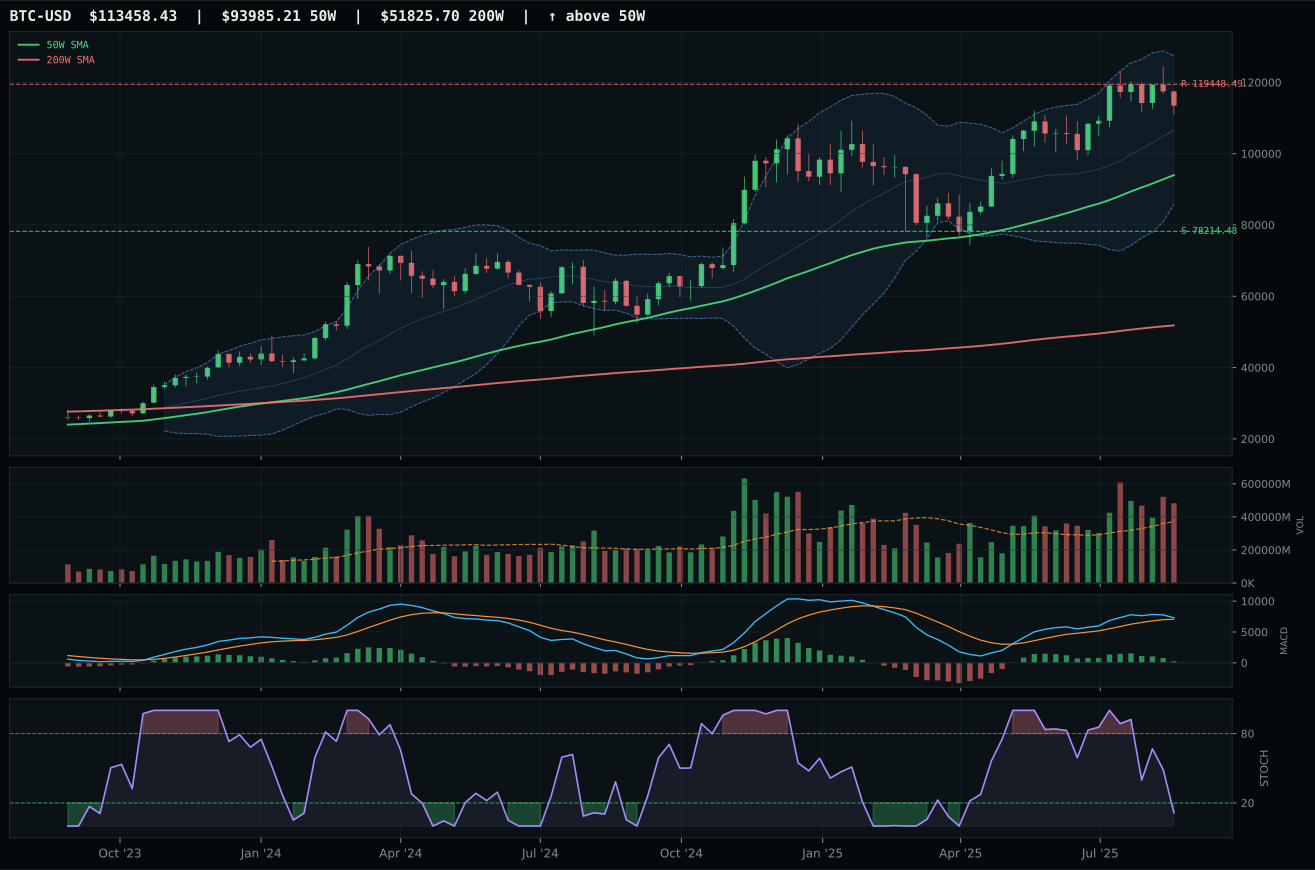
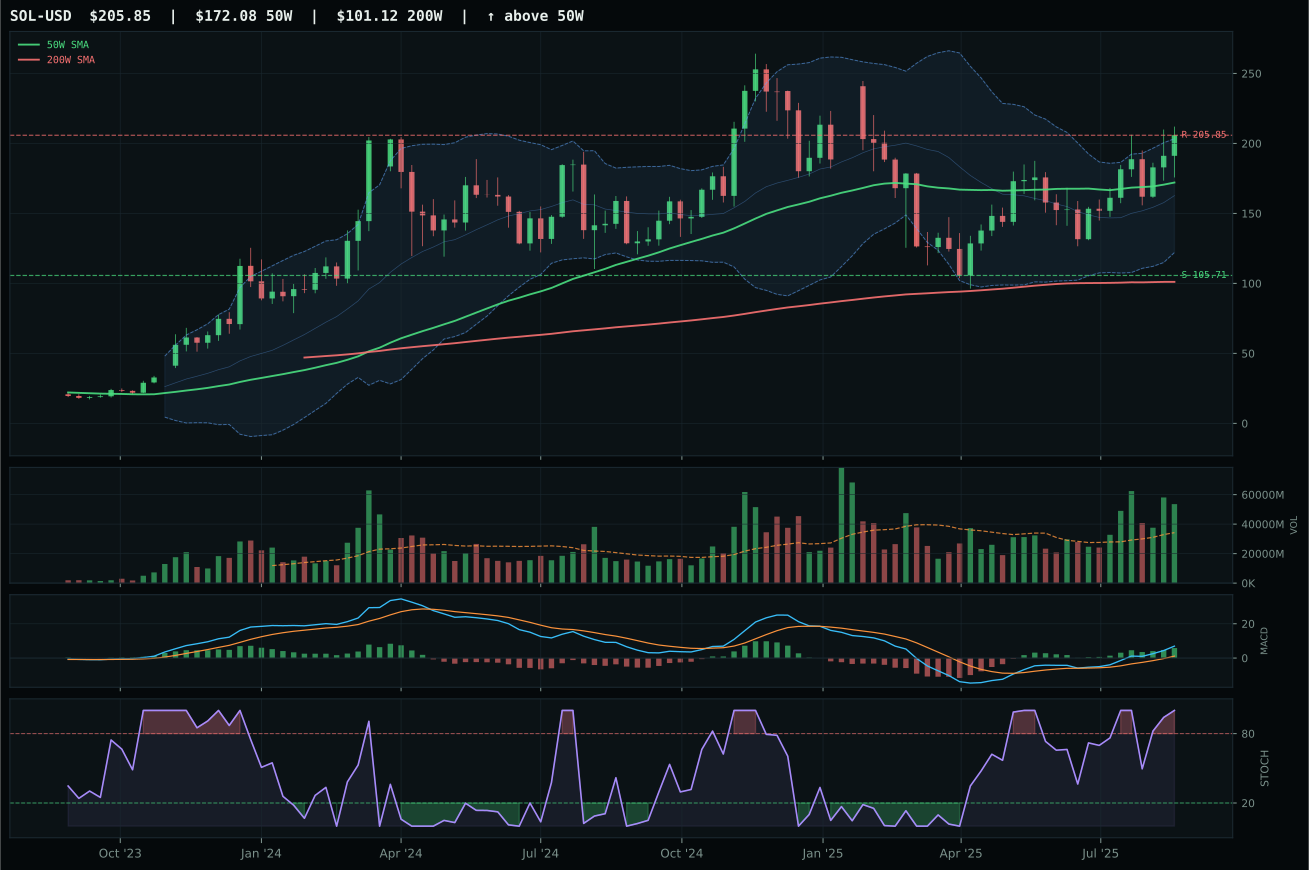
ValueBTC not armed: BTC has not made the first post-breakdown touch of the 200W buy zone after losing the 50W
TrendBTC confirmed: 2 consecutive closes above rising/flat 50W SMA
one or more available conditions failed
Category Rankings
| Rank | Category | Winner | Score | Alloc | 4W Ret | Peers (4W) |
|---|---|---|---|---|---|---|
| 1 | Industrial Metals | COPX | 72.5 | 20% | +11.28% | REMX +2.0% · PICK +3.9% |
| 2 | Nuclear Energy | URNM | 68.3 | 20% | +20.13% | URA +24.1% · NLR +18.3% |
| 3 | AI | SMH | 58.1 | 10% | +7.67% | BOTZ +4.2% · AIQ +9.4% |
| 4 | Utilities & Infrastructure | IGF | 54.8 | 10% | -1.29% | PAVE -0.4% · XLU -1.6% |
| 5 | Technology | XLK | 50.0 | 10% | +6.00% | IGV +8.8% · CIBR +5.2% |
| 6 | Defense & Aerospace | ITA | 47.1 | 10% | +3.52% | XAR +4.2% · ROKT +4.5% |
| 7 | Traditional Energy | XLE | 46.3 | 10% | -0.52% | XOP +0.3% · FCG -2.1% |
| 8 | Precious Metals | GLD | 42.6 | 10% | +10.68% | SLV +12.6% · GDX +22.2% |
| 9 | Emerging Markets | INDA | 39.1 | 0% | +0.41% | ILF +5.9% · IEMG +4.7% |
| 10 | Agriculture & Livestock | MOO | 37.4 | 0% | -2.69% | VEGI -2.8% · WEAT -1.2% |
Industrial Metals — COPX
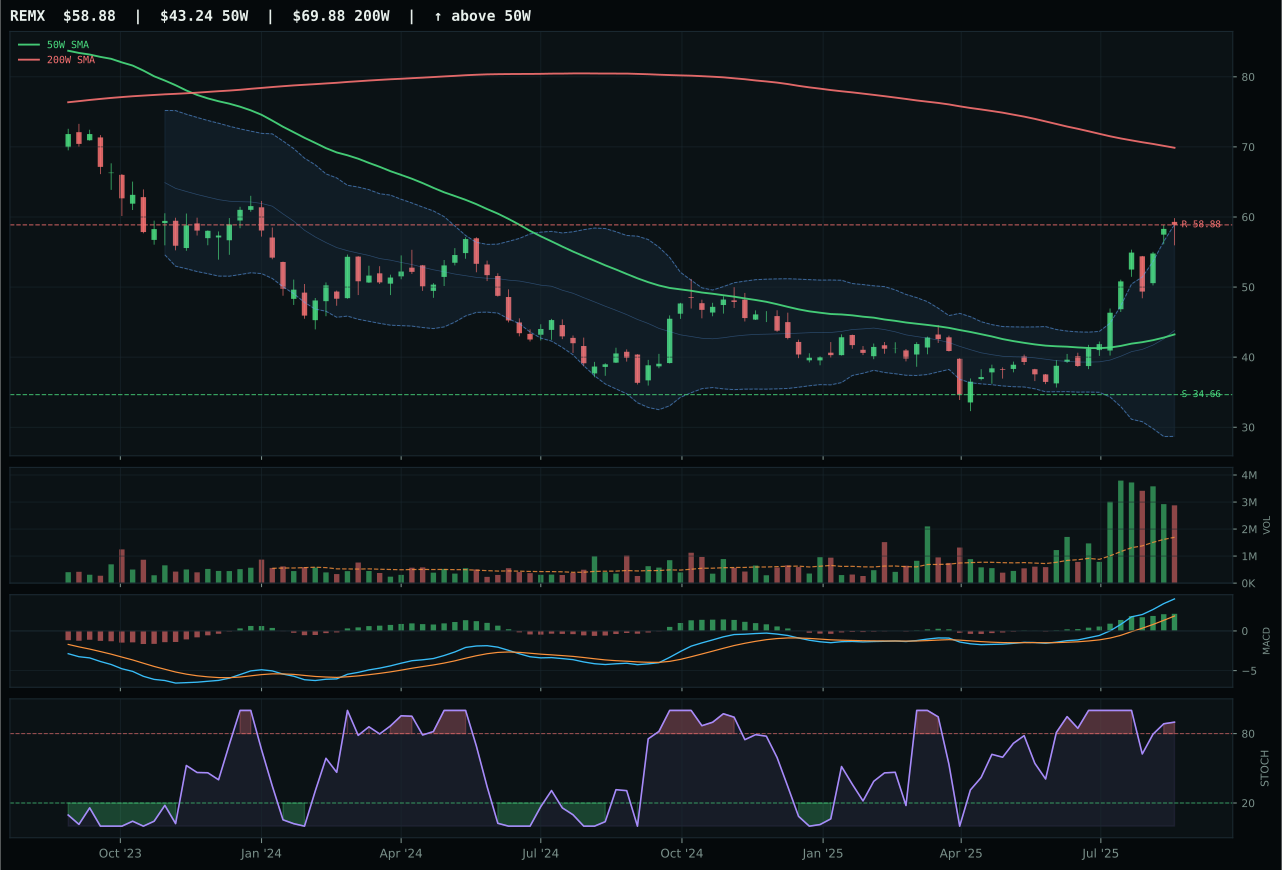
REMX has a vertical extension profile with 45.4% 13-week relative strength versus SPY.
A failed hold above support would weaken the setup.
Actionable but governed by invalidation levels.
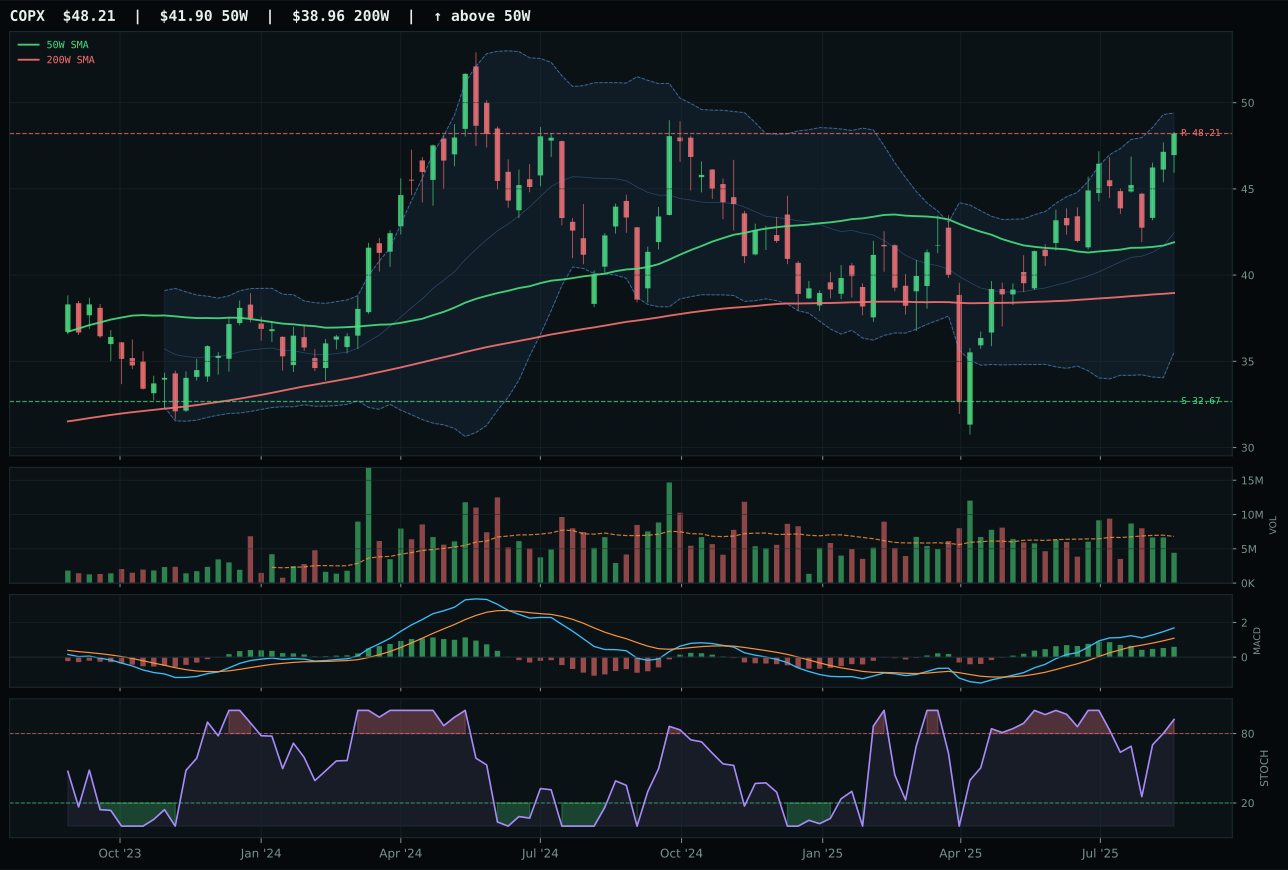
COPX has a vertical extension profile with 5.0% 13-week relative strength versus SPY.
A failed hold above support would weaken the setup.
Actionable but governed by invalidation levels.
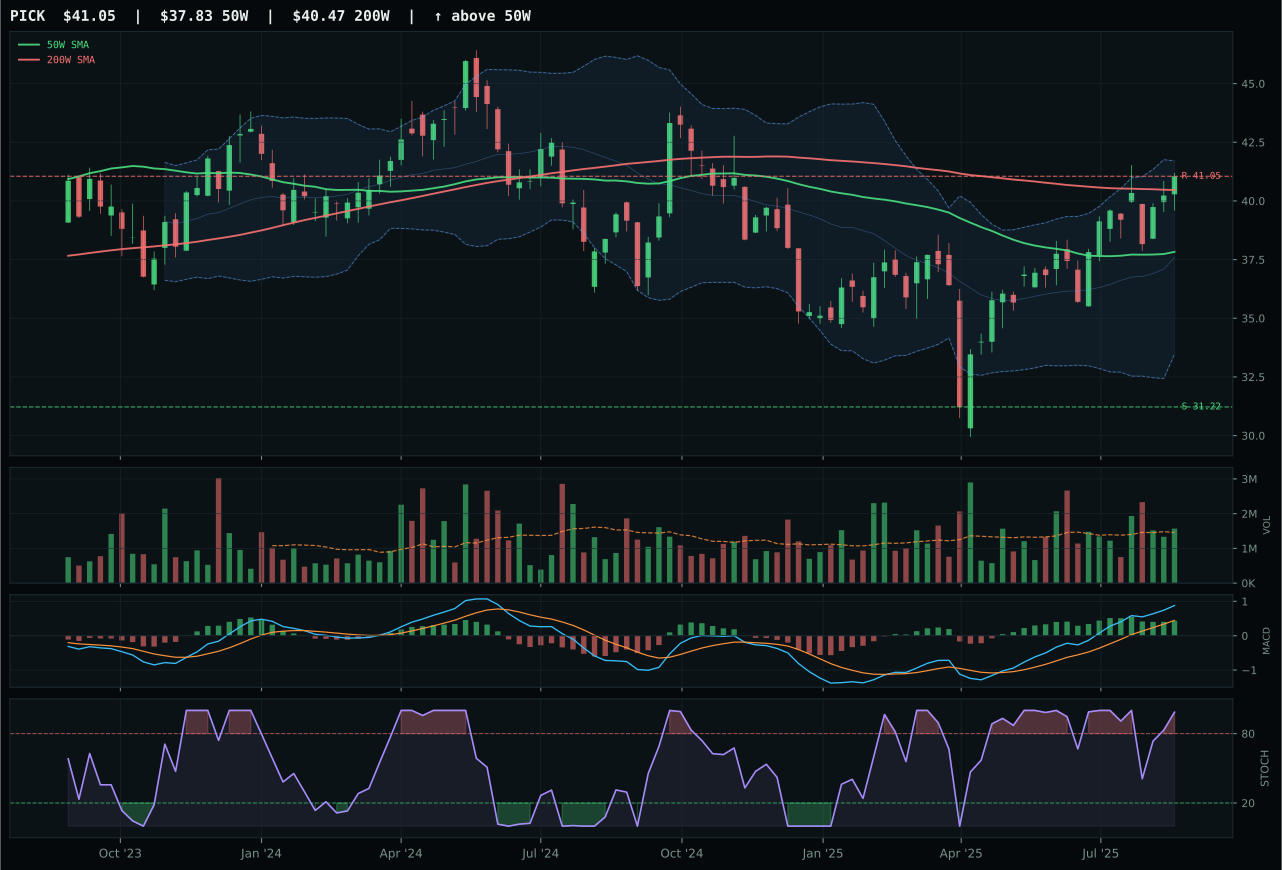
PICK has a neutral structure profile with -0.3% 13-week relative strength versus SPY.
A failed hold above support would weaken the setup.
Actionable but governed by invalidation levels.
COPX wins and earns top-2 despite being extended 15.0% above the 50-week because its technical evidence (52.2/100) is supported by dominant macro: metals scarcity is +12 points, commodity breadth positive is +7, and the category-level macro fit is 75.0/100—the strongest macro support of any category this week. Thirteen-week return of 16.5% and SPY-relative strength of 5.0% confirm the move is real, not a short squeeze. REMX is technically superior (trend 90, MACD bullish and improving, volume confirming), but REMX is dangerously extended at 36.2% above the 50-week with stochastic RSI overbought. COPX's tight 15.0% extension from the 50-week and category-relative strength at 0.0% (not stretched) means new buyers still have entry optionality. MACD is bullish but flattening (warning of deceleration), yet late-cycle reflation and copper demand for AI infrastructure justify the extension. The margin of victory is 5.5 points; COPX wins because extension is tolerable, not because the chart is pristine.
Industrial Metals earned 10% allocation as a top-2 overweight category, tied with Nuclear Energy. The 72.5 final score is the second-highest across all ten categories, driven by macro fit of 75.0/100—the best in the portfolio. Late-cycle reflation is +10, metals scarcity is +14, commodity breadth positive is +10, and real asset sponsorship is +6. Technical evidence for COPX is modest at 52.2/100 (timing weak at 32, risk/reward weak at 40), yet the macro thesis is undeniable. Copper demand from EV batteries and AI server infrastructure is structural. This allocation says: macro conviction is high enough to accept extended charts and weaker timing, because the reflation cycle is in play. The overlay structure (50% crypto) halves the normal 20%/10%/0% tiers to 10%/5%/0%, so COPX's 10% represents the full tier-1 slot available this week. Watch for COPX to extend beyond resistance at 48.21; if it does on deteriorating volume, the timing risk will become critical and the next pullback could be sharp.
Nuclear Energy — URNM
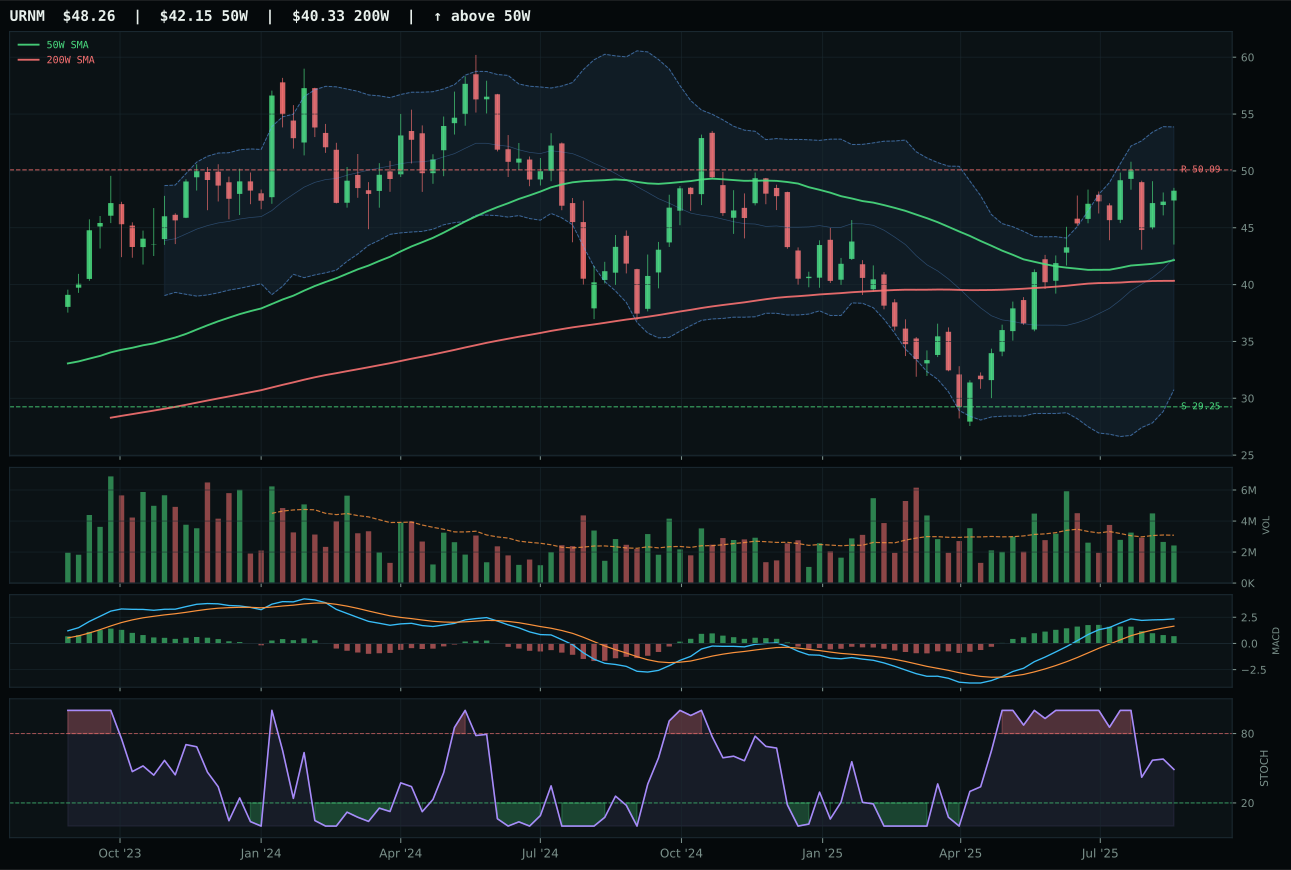
URNM has a neutral structure profile with 6.0% 13-week relative strength versus SPY.
A failed hold above support would weaken the setup.
Actionable but governed by invalidation levels.
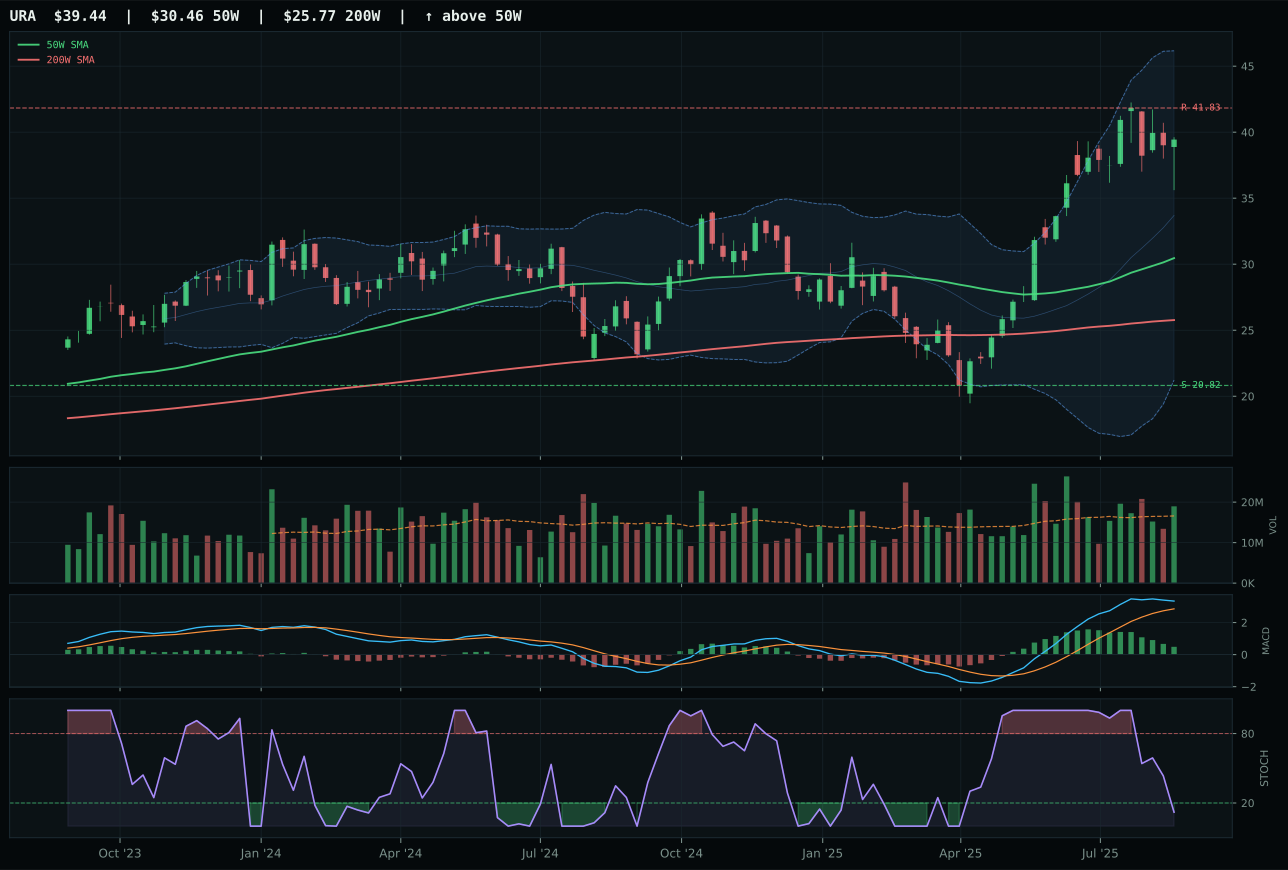
URA has a vertical extension profile with 12.5% 13-week relative strength versus SPY.
A failed hold above support would weaken the setup.
Actionable but governed by invalidation levels.
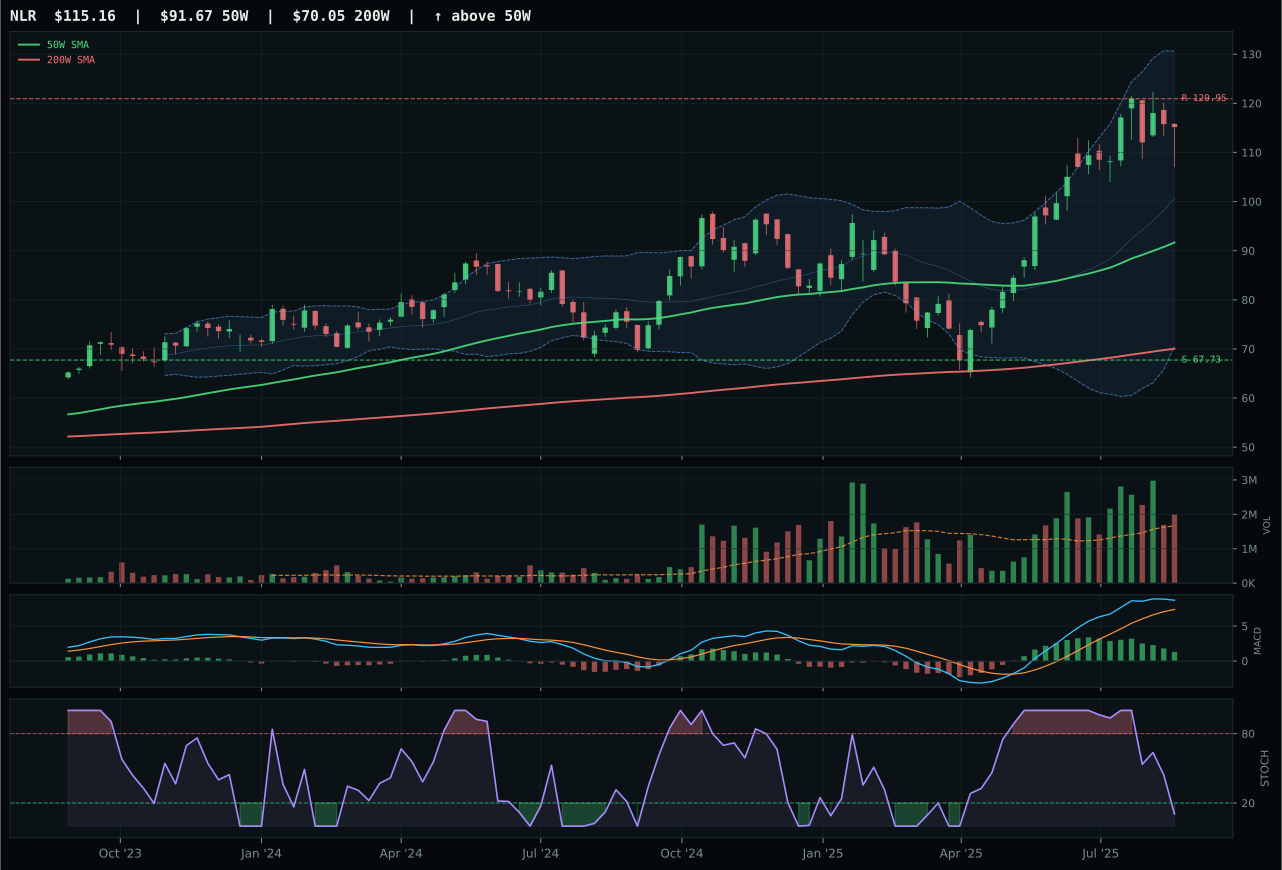
NLR has a vertical extension profile with 7.3% 13-week relative strength versus SPY.
A failed hold above support would weaken the setup.
Actionable but governed by invalidation levels.
URNM wins and earns top-2 because it offers clean entry geometry that REMX and URA do not. Price is 14.5% above the 50-week—extended but not reckless—while sitting in the upper retracement zone (Fib 0.236), meaning there is still room for expansion without new all-time highs. URNM's structure is neutral (not vertical), cleanliness is 83.3 (the highest in the category), and stochastic RSI is rising mid-zone at 0.49 (neither overbought nor oversold). URA is more extended at 29.5% above the 50-week with stochastic oversold (timing signal weak) despite higher momentum (23.9% return). URNM's 17.4% thirteen-week return and 6.0% SPY-relative strength confirm the trend without the exhaustion signals plaguing URA. Thirteen-week data matters less than timing score: URNM 78/100 versus URA 48/100 tells you entry risk has inverted in URNM's favor.
Nuclear Energy earned 10% allocation as a top-2 category, tying with Industrial Metals, based on a 68.3 final score and macro fit of 69.0/100. Energy scarcity is +9, real asset sponsorship is +7, and late-cycle reflation is +7—a solid macro case without being dominant. URNM's technical evidence is 76.7/100, supported by perfect trend (100/100) and clean structure (77.5/100), though timing is only 78/100 (14.5% distance from 50W is reasonable entry depth). Momentum confirmation is 74.3/100, which is respectable but not commanding. The 10% allocation reflects conviction that uranium demand is structural (AI power demands, energy transition, geopolitical supply constraints) while accepting that the chart is fairly well-advanced. Unlike COPX, which is extended on thin volume, URNM's neutral structure and rising-mid-zone stochastic give it more room to run. Watch URNM approaching resistance at 50.09; if it breaks on volume, the category could extend higher. If it rolls over, the macro case remains intact but the timing window resets lower.
AI — SMH
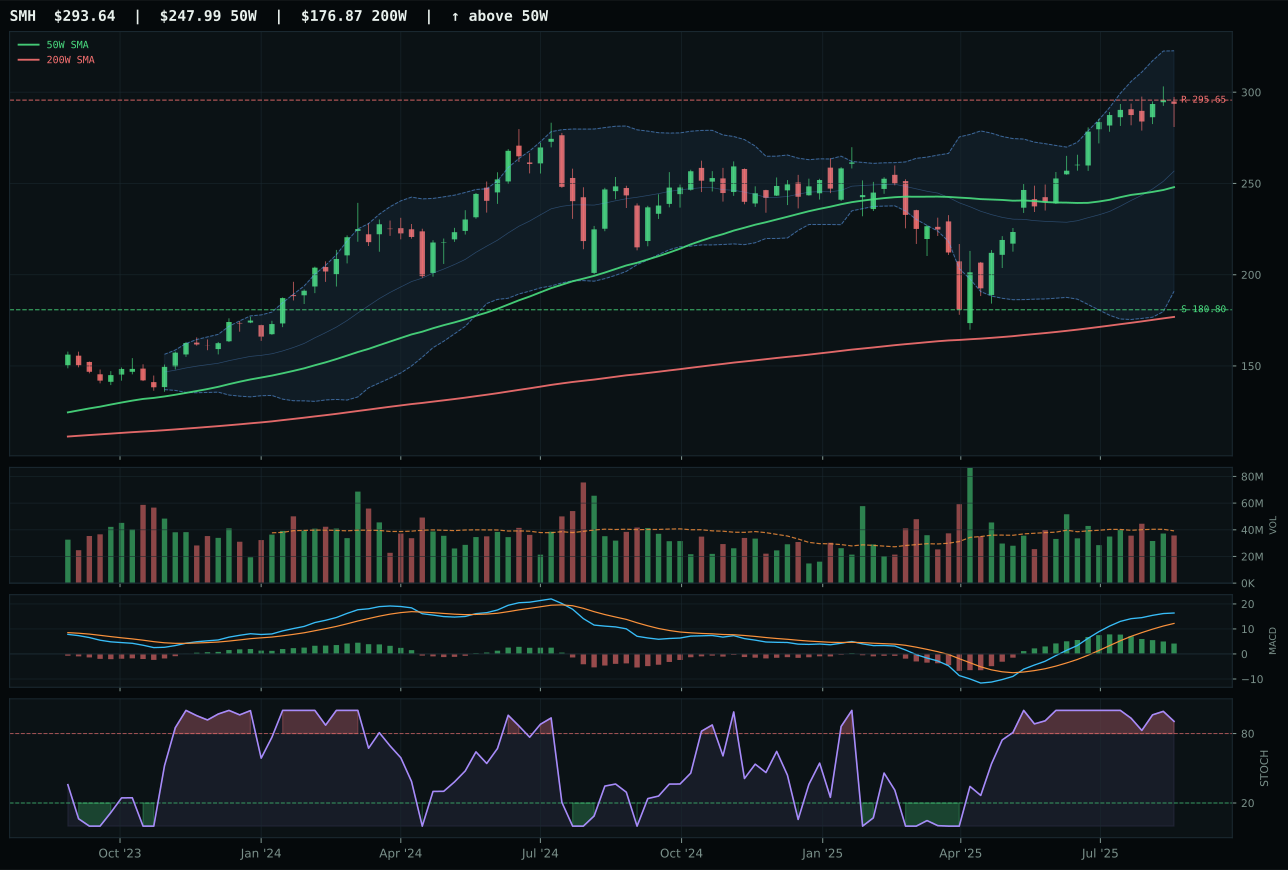
SMH has a vertical extension profile with 12.2% 13-week relative strength versus SPY.
A failed hold above support would weaken the setup.
Actionable but governed by invalidation levels.
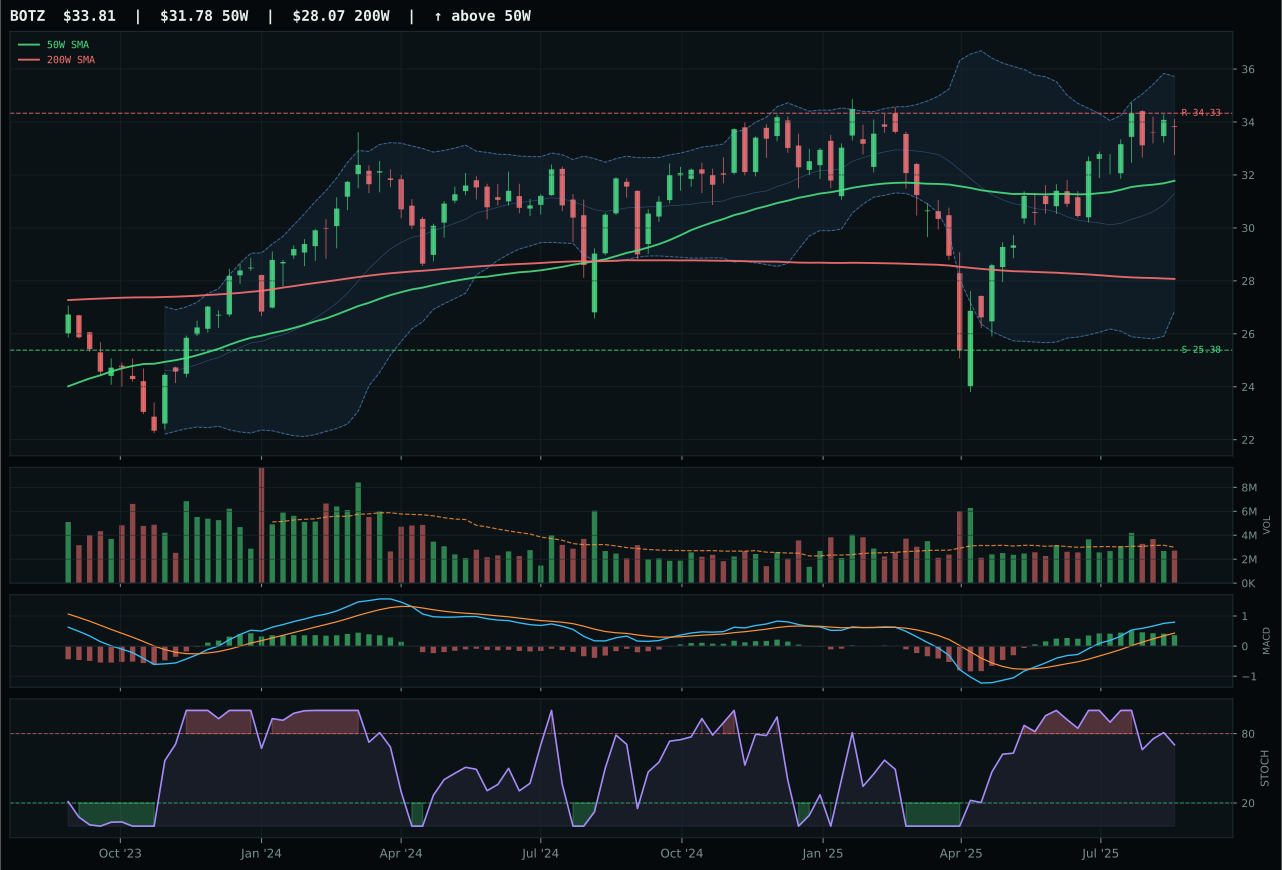
BOTZ has a neutral structure profile with -0.8% 13-week relative strength versus SPY.
A failed hold above support would weaken the setup.
Actionable but governed by invalidation levels.
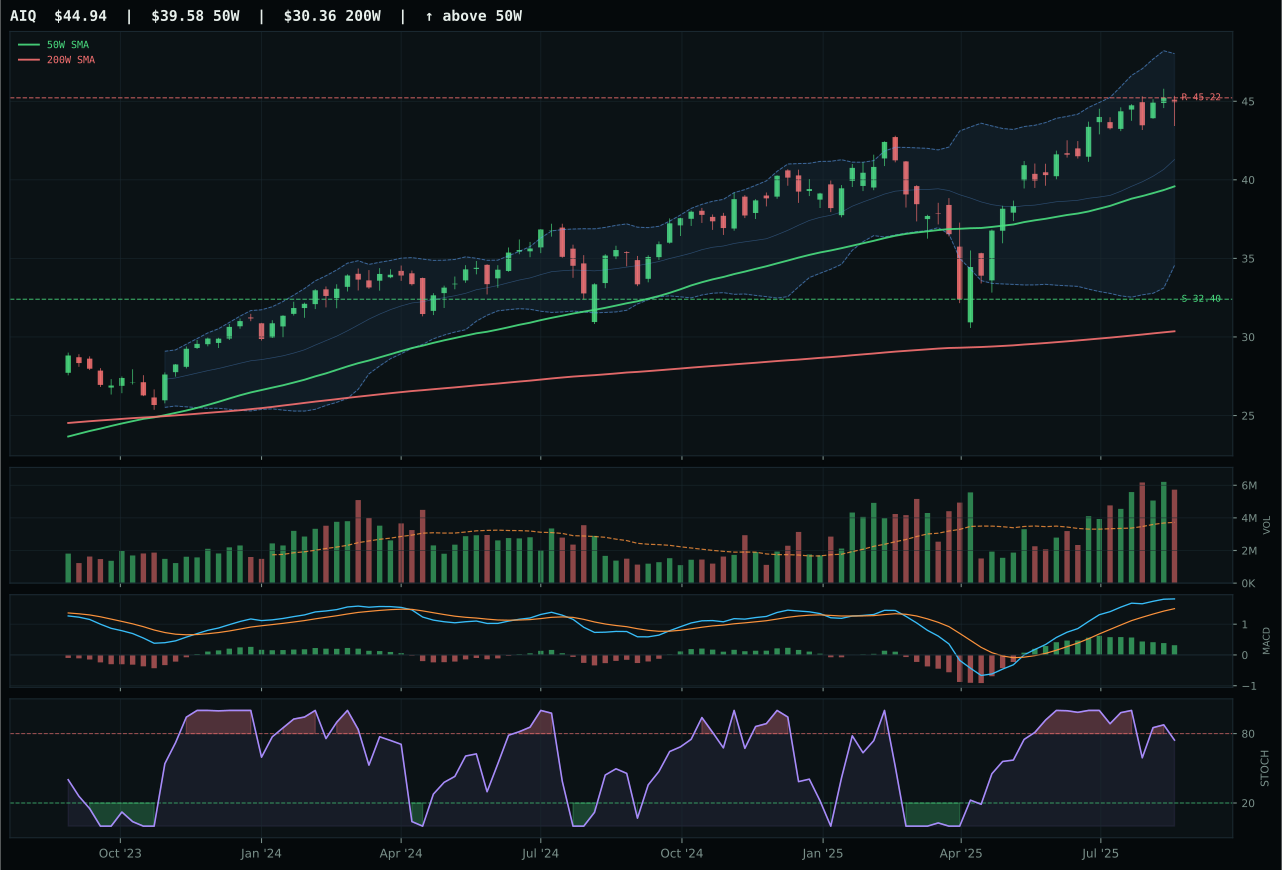
AIQ has a neutral structure profile with 1.1% 13-week relative strength versus SPY.
A failed hold above support would weaken the setup.
Actionable but governed by invalidation levels.
SMH wins because price sits 18.4% above the 50-week mean—an extended position that normally kills opportunity—yet the 23.7% thirteen-week return and 12.2% SPY-relative strength are too dominant to ignore. Semiconductor compute is attracting incremental capital despite late entry, driven by AI growth sponsorship worth +14 macro points. BOTZ lost because its category-relative strength lags at -1.9% while SMH holds +11.2%; that gap means the portfolio is actively choosing semiconductor AI over robotics AI, which is a signal worth respecting. Stochastic RSI sits overbought at 0.91 for SMH—a warning about entry timing—but momentum confirmation at 100/100 and persistence at 86.5/100 show the move has legs even when price is extended. The margin of victory is razor-thin (58.1 final score for SMH versus 62.3 for BOTZ in the reasoned proof order), which tells you timing risk is real.
AI earned 5% as tier-2, the same as Technology, because two categories ranked higher in total opportunity. The 58.1 final score reflects strong technical evidence (71.5/100) balanced against macro headwinds: risk appetite is +10 and AI sponsorship is +14, but liquidity stress costs -12 and credit stress costs -8. In late-cycle reflation, AI hardware demand should thrive, yet the portfolio's macro regime is simultaneously tight on funding conditions. The allocation acknowledges that SMH's trend is unambiguous (trend 100/100, RS 12.2%) while accepting that entry risk (distance to 50W of 18.4%, timing score just 32/100) constrains the size. If timing improved—price pulled back to test the 50-week without losing trend—or if macro stress signals abated, AI could graduate to top-2. For now it holds 5%, a statement that the thesis is real but the window for new entry is narrow.
Utilities & Infrastructure — IGF
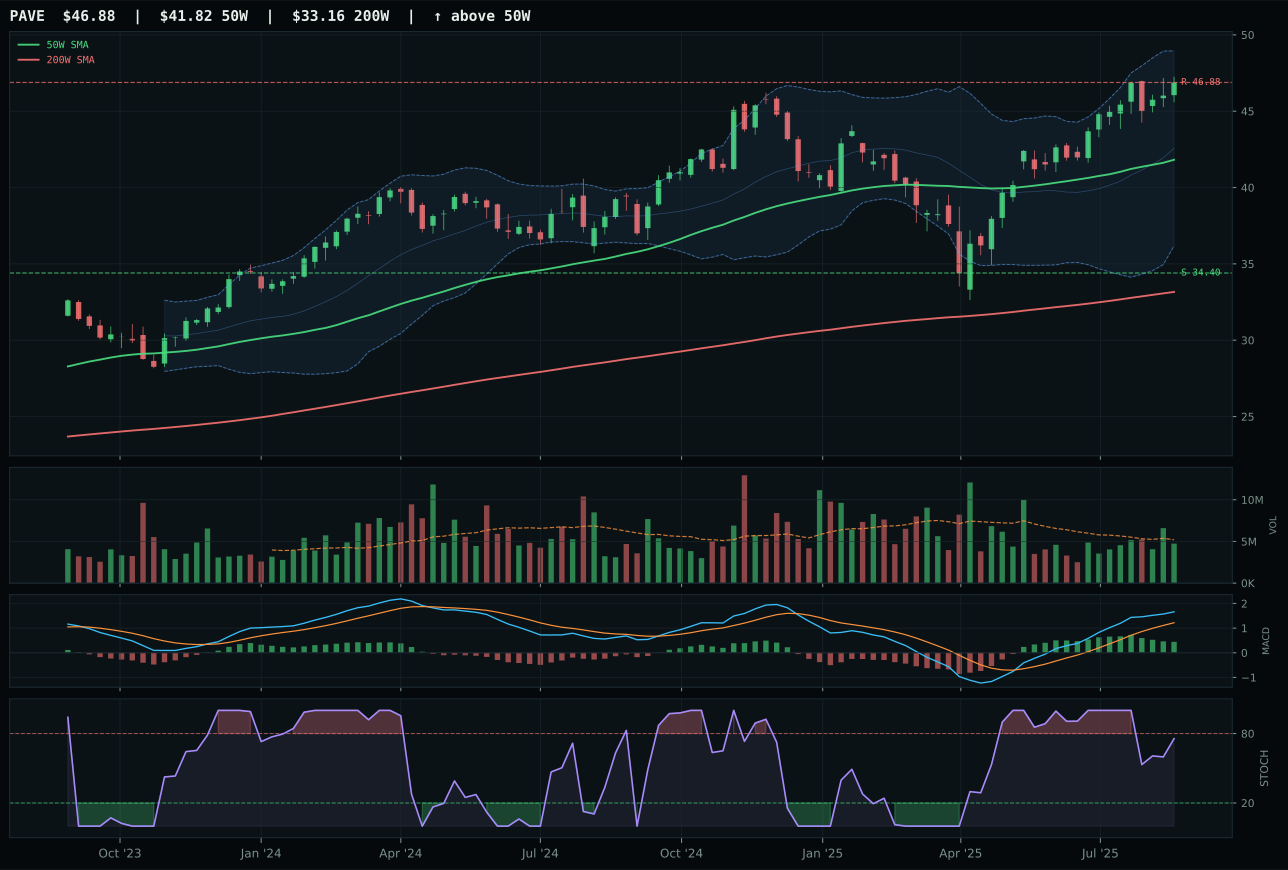
PAVE has a neutral structure profile with 2.4% 13-week relative strength versus SPY.
A failed hold above support would weaken the setup.
Actionable but governed by invalidation levels.
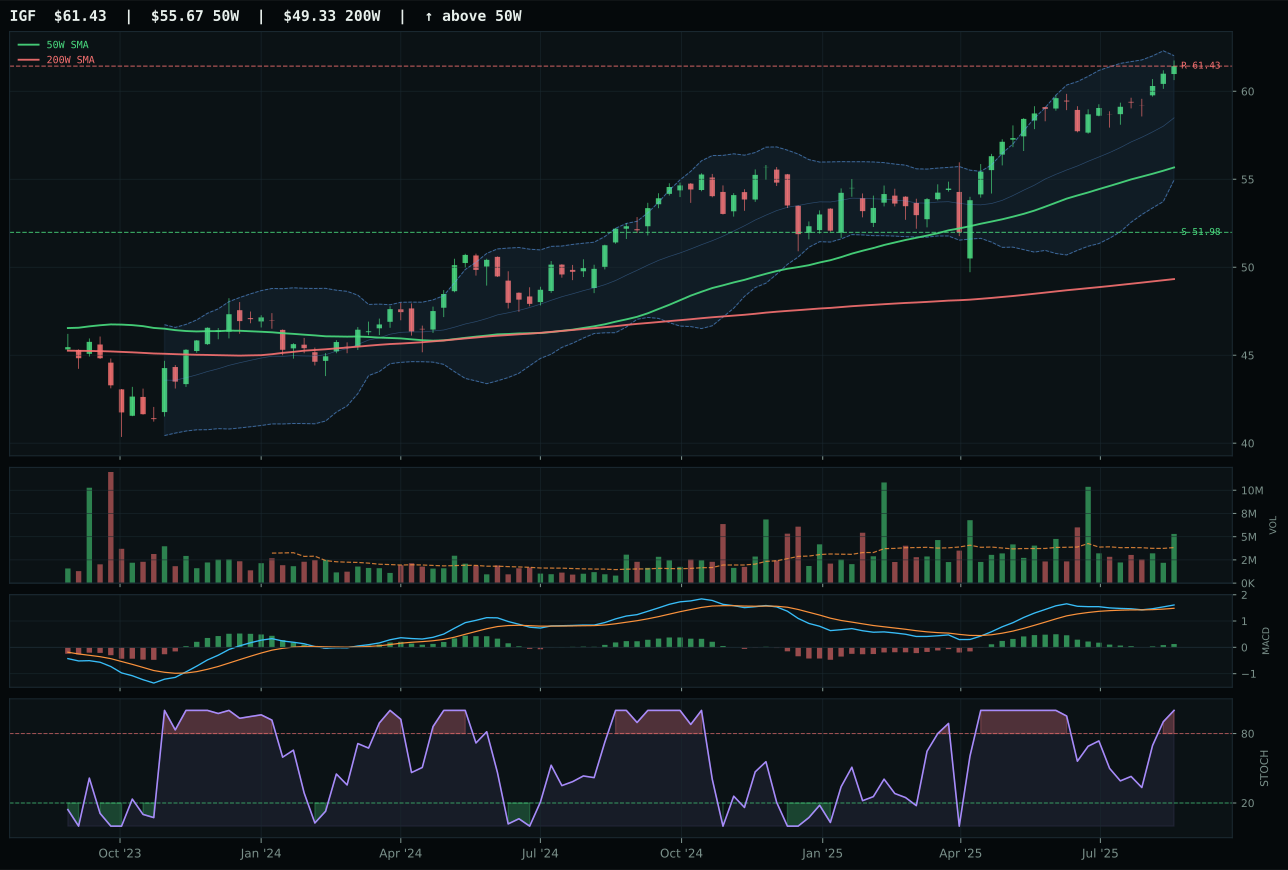
IGF has a neutral structure profile with -6.9% 13-week relative strength versus SPY.
A failed hold above support would weaken the setup.
Actionable but governed by invalidation levels.
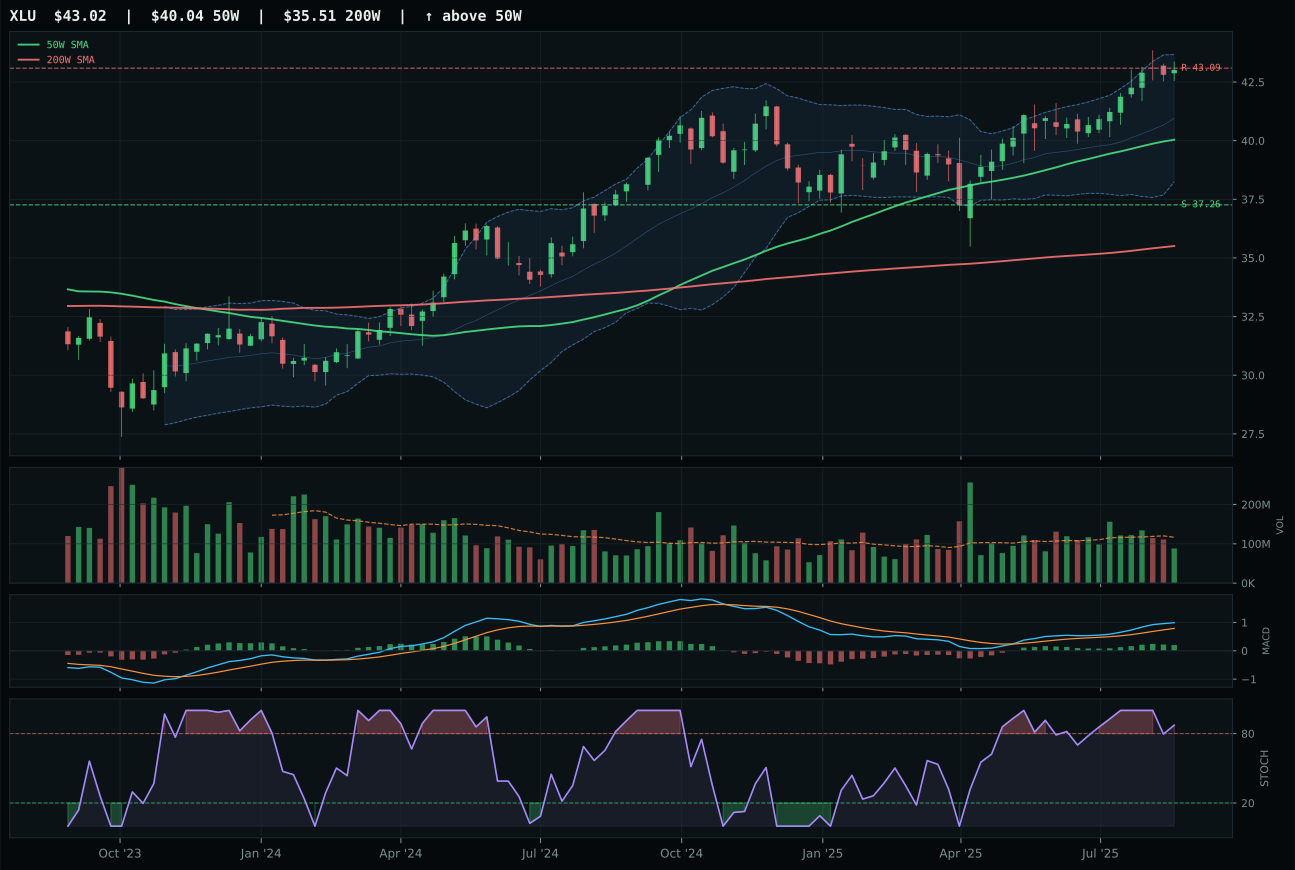
XLU has a neutral structure profile with -5.3% 13-week relative strength versus SPY.
A failed hold above support would weaken the setup.
Actionable but governed by invalidation levels.
IGF wins because it combines above-average participation (1.38x 20W volume) with a bullish MACD inflection (improving, not flattening), separating it from PAVE despite PAVE's stronger thirteen-week return (13.8% vs 4.6%). Price is 10.3% above the 50-week—reasonable extension—and stochastic RSI sits at overbought momentum (1.00), yet the 81.8/100 structure score indicates neutral setup quality with strong compression history (91.4%). Category-relative strength of -1.6% for IGF versus PAVE's +7.6% looks bearish at first glance, but in a category where participation is thin overall, the winner is the ETF accumulating volume not chasing on low liquidity. IGF's 89.7/100 trend confirmation and 65.2/100 volume-price confirmation show it is being accumulated into strength. PAVE lost because timing is weaker (70 vs 59)—PAVE is more extended—and its MACD is bullish but flattening (slowing), which means momentum is deceleration, not acceleration.
Utilities & Infrastructure earned 5% allocation as tier-2, not top-2. The 54.8 final score reflects technical evidence of 75.0/100 (solid) paired with macro fit of 46.0/100 (weak). Inflation pressure is active at -6 points, a headwind for utilities that benefit from fixed-rate contracts. Late-cycle reflation should favor infrastructure capex, but the macro regime is net negative for the category. IGF's trend is strong (89.7/100) and volume is confirming (above-average participation), which carries weight, but the category has no macro tailwind to justify expansion. For Utilities & Infrastructure to graduate to top-2, macro conditions would need to shift—either inflation pressure would need to reverse or real asset sponsorship would need to accelerate to offset it. Right now the category is a quality hold (trend intact, participation real) but not a conviction buy. The 5% allocation reflects the technical merit while accepting that macro regime does not provide expansion room.
Technology — XLK
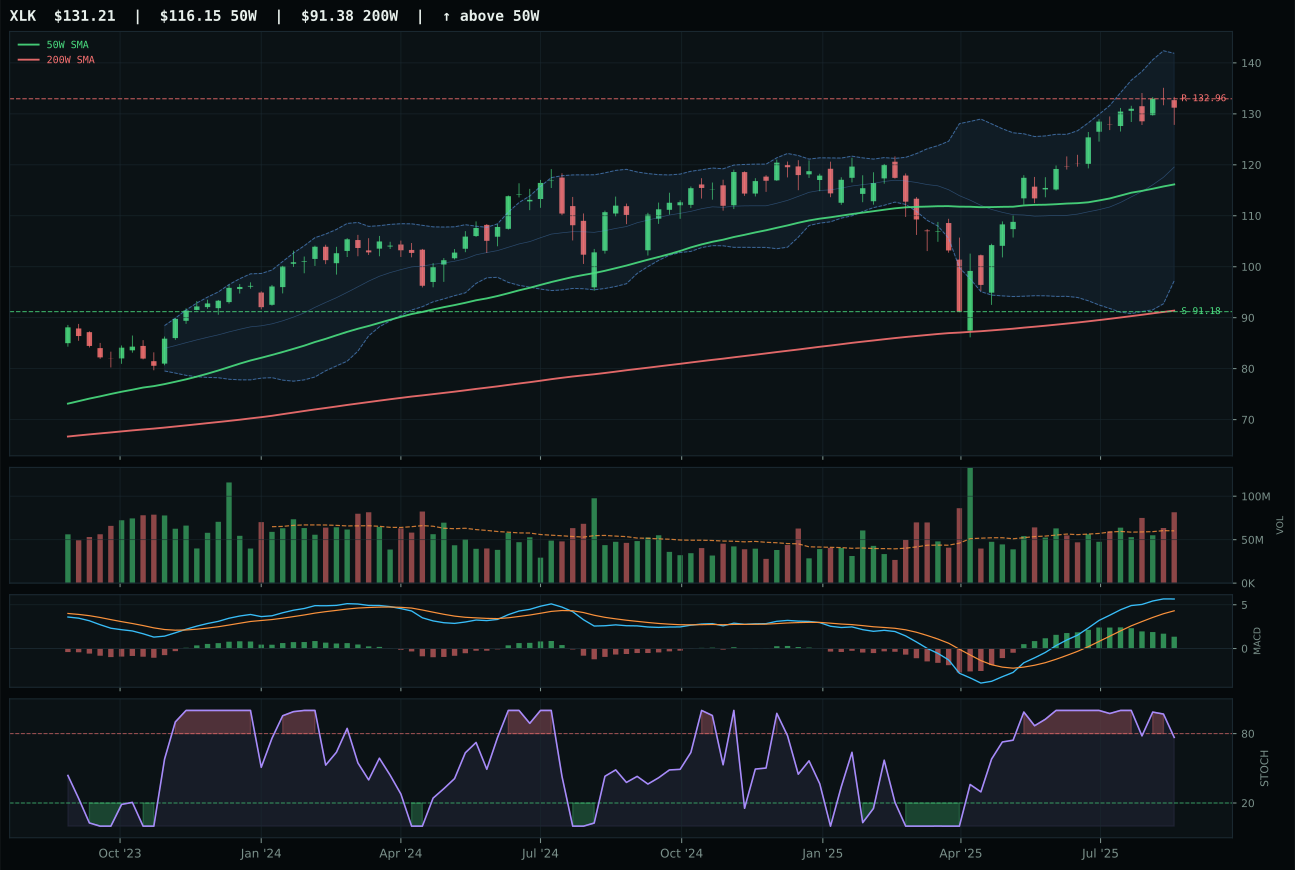
XLK has a neutral structure profile with 4.3% 13-week relative strength versus SPY.
A failed hold above support would weaken the setup.
Actionable but governed by invalidation levels.
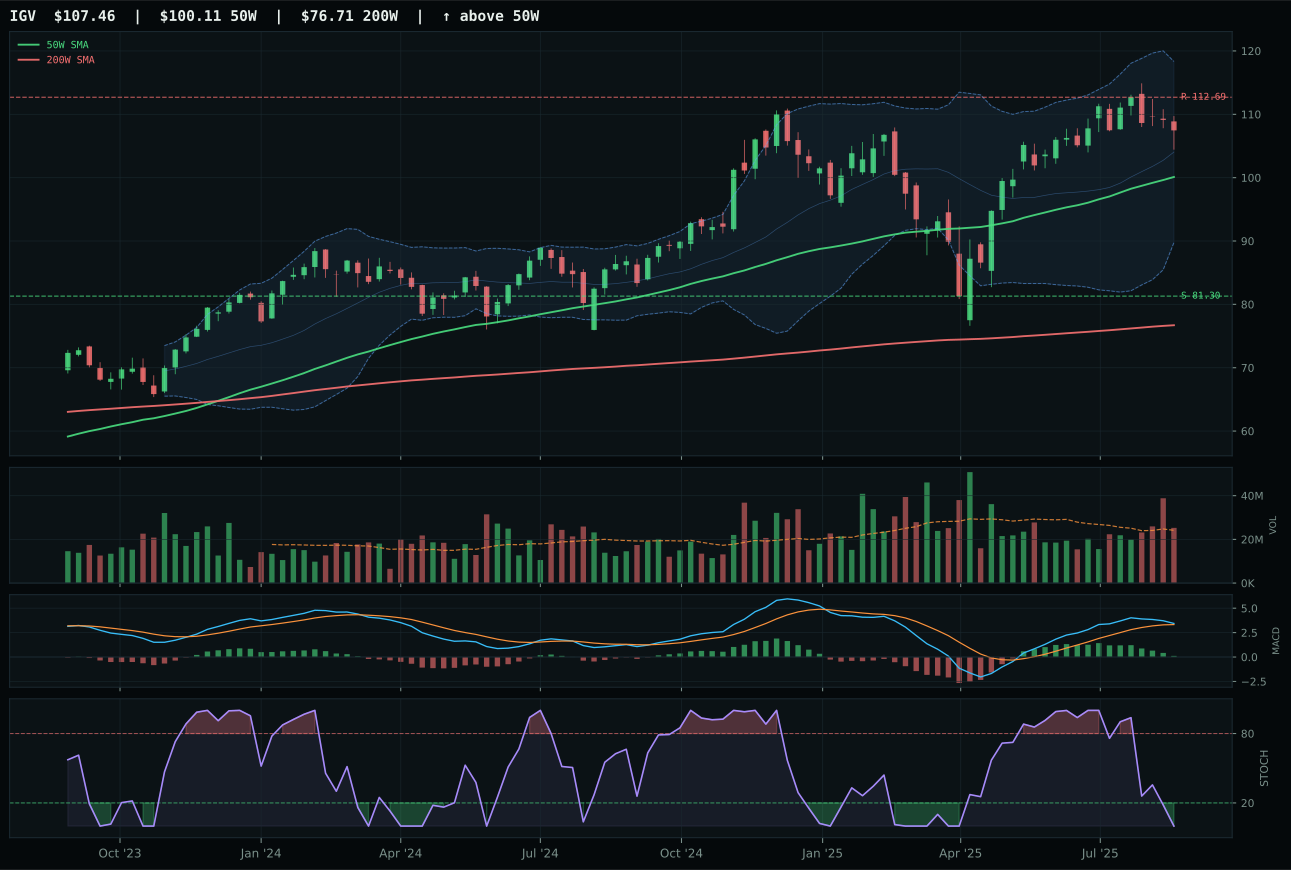
IGV has a neutral structure profile with -6.0% 13-week relative strength versus SPY.
A failed hold above support would weaken the setup.
Actionable but governed by invalidation levels.
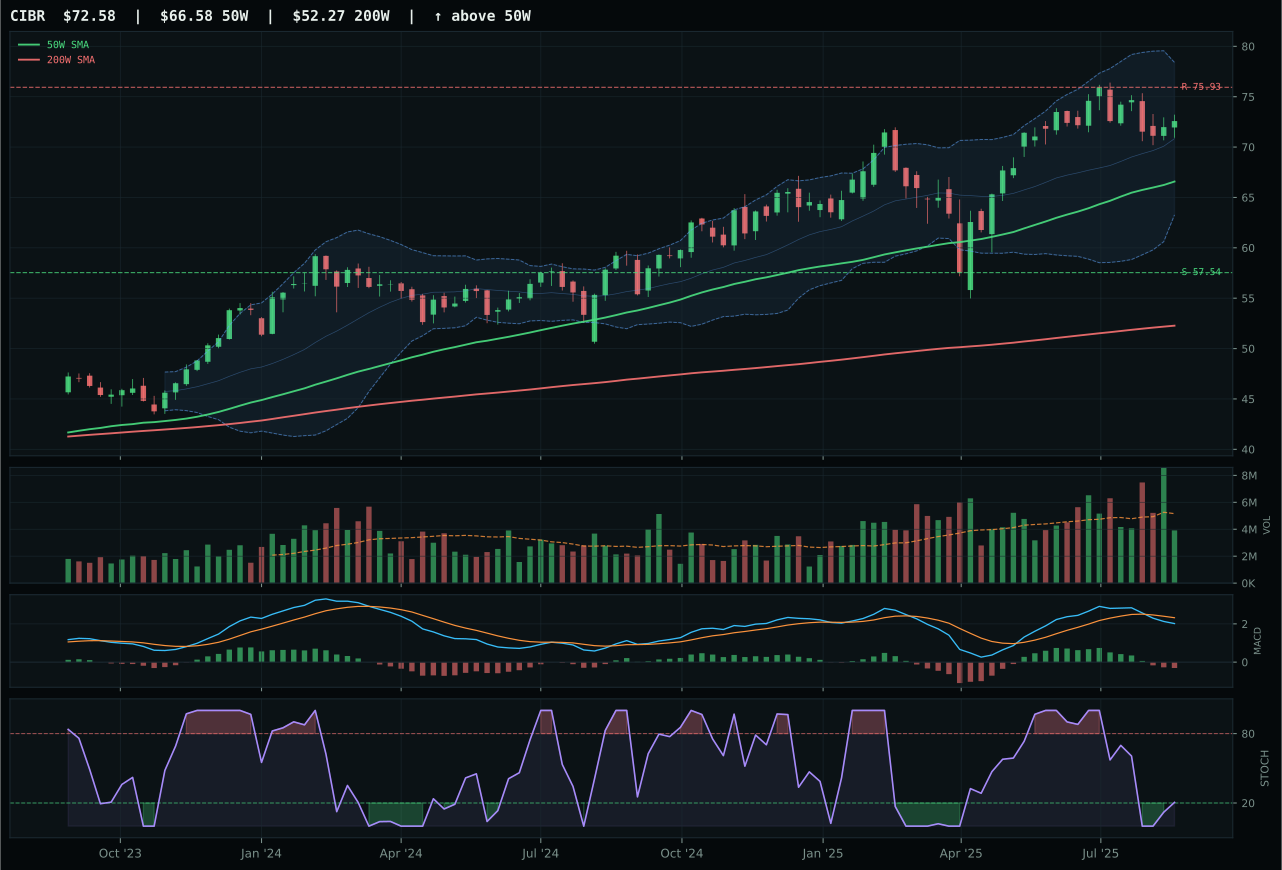
CIBR has a neutral structure profile with -9.3% 13-week relative strength versus SPY.
A failed hold above support would weaken the setup.
Actionable but governed by invalidation levels.
XLK wins because it sits just 13.0% above its 50-week moving average with a non-deteriorating 0.5% slope, capturing profitable broad-based technology at reasonable entry risk. Its 10.3% relative strength versus the category median and 4.3% outperformance of SPY signal genuine peer leadership—buyers are allocating to XLK specifically, not chasing the category. Volume at 1.36x the 20-week average confirms the move is being accumulated rather than squeezed higher on light participation. IGV lost despite bullish MACD because its stochastic RSI sits oversold (where reversals often stall before they accelerate), its category-relative strength is flat at 0.0%, and its timing score of 70 versus XLK's 77 reflects a weaker setup overall. The technical gap is decisive: XLK's momentum confirmation scored 98.1 against IGV's 43.
Technology earned 5% allocation as a tier-2 category, reflecting its rank outside the top-2 overweights. In a late-cycle reflation regime, the category's 50.0 final score was penalized by active liquidity stress (-10 macro points) and credit stress (-7 points), which offset the +9 points from positive risk appetite. XLK's trend evidence is pristine at 100/100, but its macro fit of 44.0/100 drags the category down—the absolute returns are real, yet the macro regime is defending against multiple headwinds simultaneously. For technology to claim a top-2 seat, either macro conditions would need to shift away from liquidity pressure or the relative strength versus credit-stressed peers would need to prove more durable across a full multi-week window. Right now, 5% acknowledges the setup without overcommitting into a regime that favors real assets over duration-sensitive growth.
Defense & Aerospace — ITA
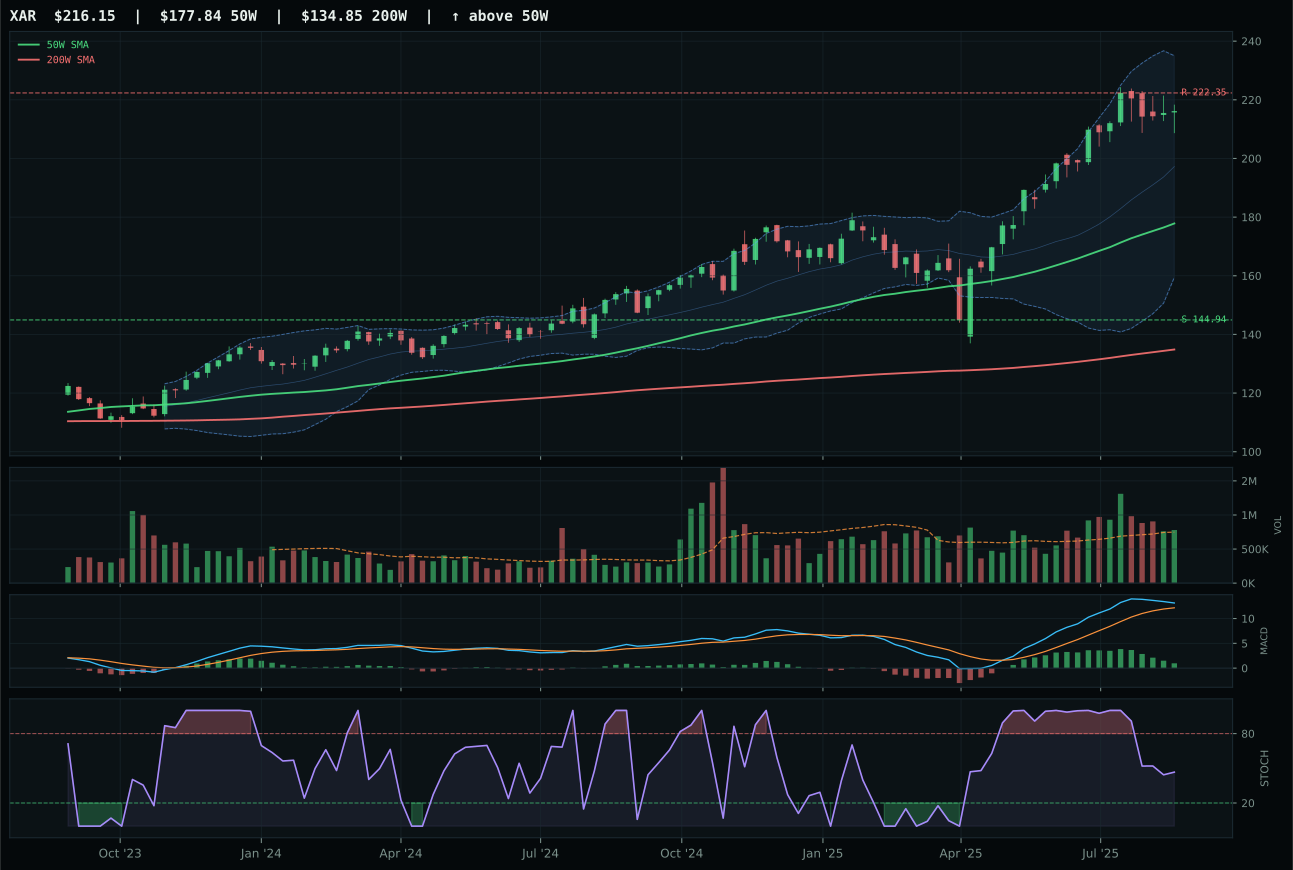
XAR has a vertical extension profile with 4.7% 13-week relative strength versus SPY.
A failed hold above support would weaken the setup.
Actionable but governed by invalidation levels.
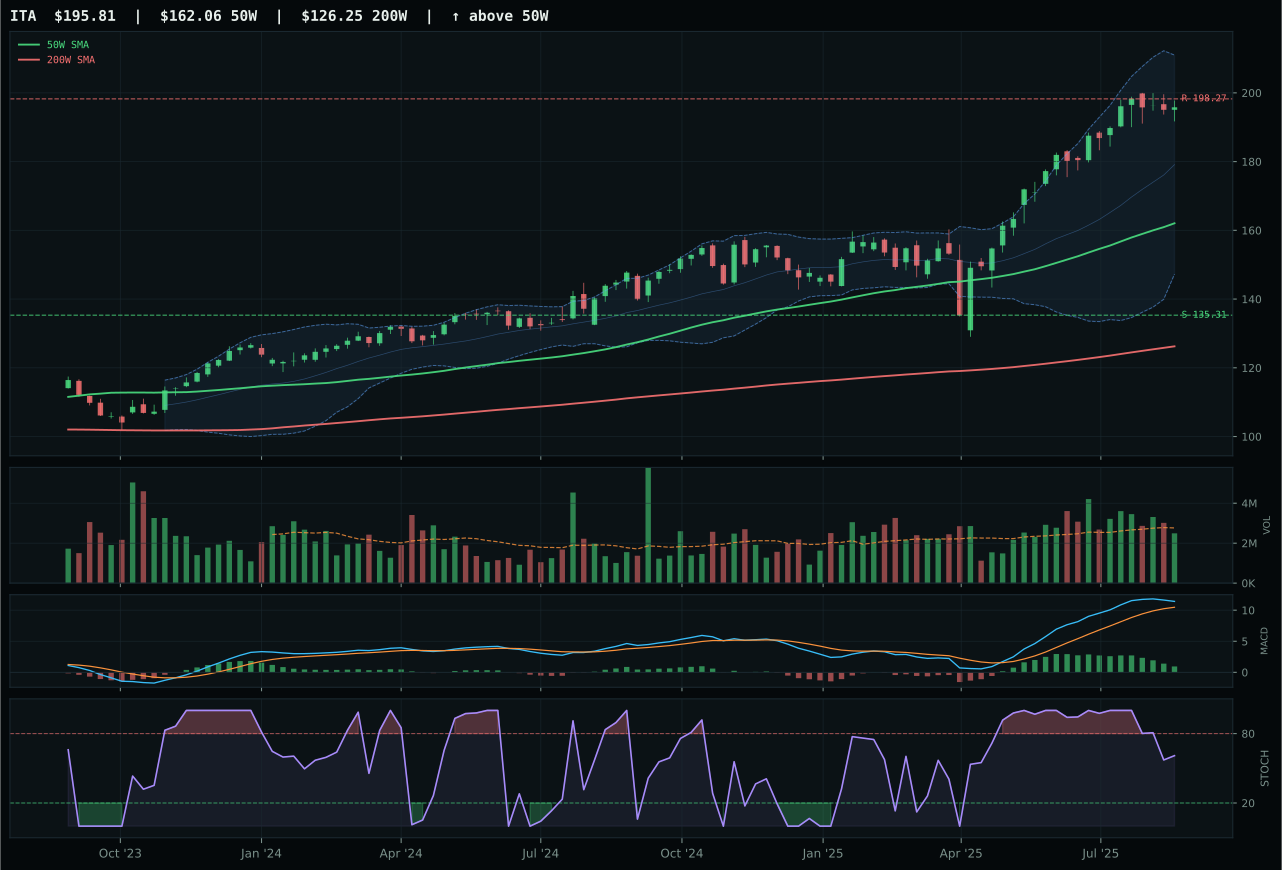
ITA has a vertical extension profile with 3.0% 13-week relative strength versus SPY.
A failed hold above support would weaken the setup.
Actionable but governed by invalidation levels.
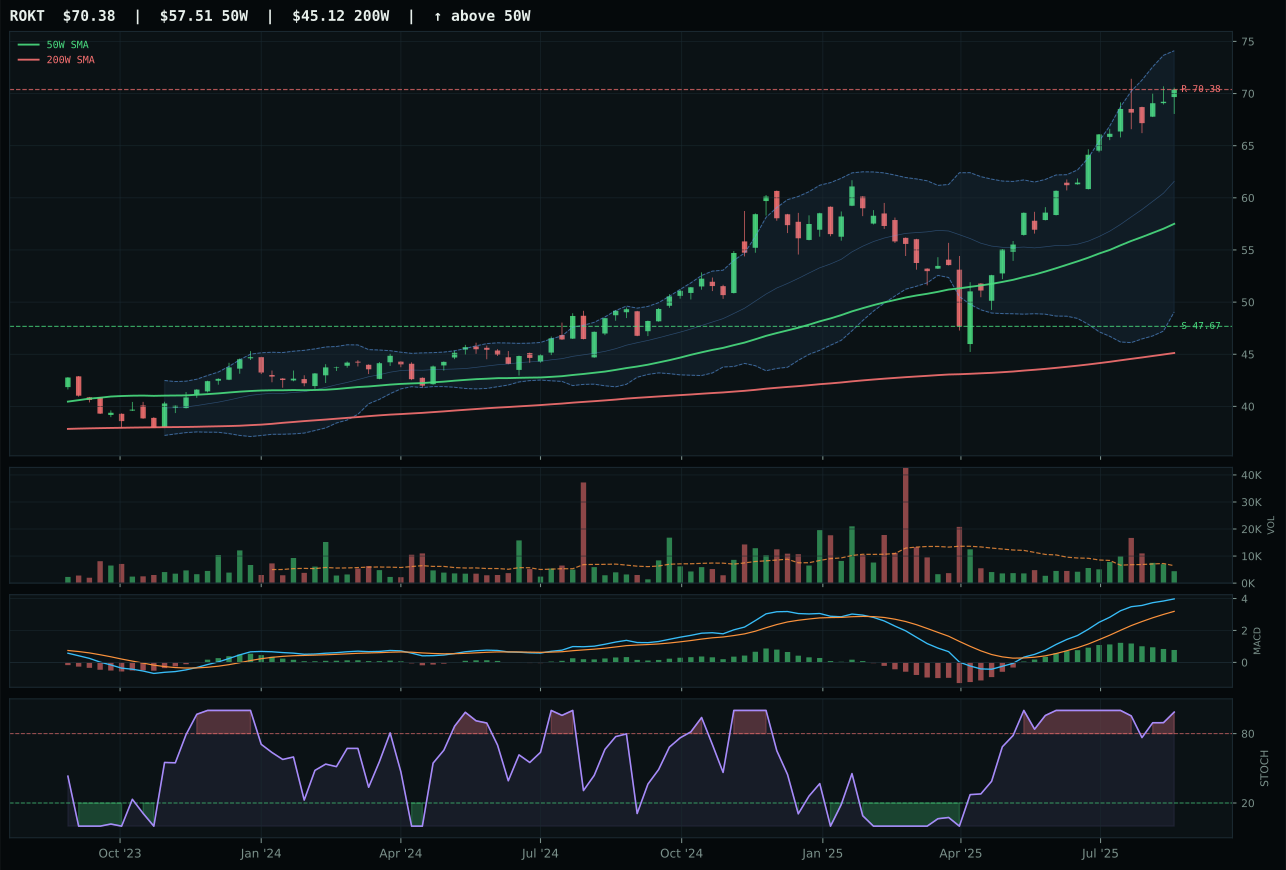
ROKT has a vertical extension profile with 12.2% 13-week relative strength versus SPY.
A failed hold above support would weaken the setup.
Tracked, but not top-2 eligible because: .
ITA wins by the tightest margin (only 1.5 points over XAR) because both charts are structurally similar—vertical extensions near the 52-week high—yet ITA's cleanliness score of 66.7 versus XAR's clean 76.4 seems backward until you consider ITA's relative strength positioning. ITA holds -1.7% relative strength within its category, meaning it is underowned against XAR, which holds 0.0% (neutral). When the category is rising but a strong chart is lagging peers, that often means buyers haven't rotated there yet. Price sitting 20.8% above the 50-week is a warning, but trend confirmation at 100/100 and 14.5% thirteen-week returns are real. XAR lost because it is slightly cleaner (76.4 vs 77.3 structure) yet offers nothing additional; the category-relative strength gap is immaterial, so ITA's narrower structure win carries the day.
Defense & Aerospace earned 5% allocation at rank 3-8, the standard tier-2 slice in this overlay environment. The 47.1 final score is depressed by weak technical evidence (57.2/100 for ITA) despite late-cycle reflation helping the category (+6 macro points). Liquidity stress is only -4 points here, much less punitive than in growth categories, which reflects the defensive character. ITA's momentum confirmation sits at just 70.5/100 because thirteen-week returns of 14.5% are undeniable but four-week returns are negative (-1.2%), signaling momentum is rolling over even as longer trends persist. For this category to earn top-2, either the technical setup would need to reset lower (clearing the extended position) or macro tailwinds would need to outpace headwinds more forcefully. Late-cycle reflation supports the thesis, but the execution risk in the chart right now limits conviction to 5%.
Traditional Energy — XLE
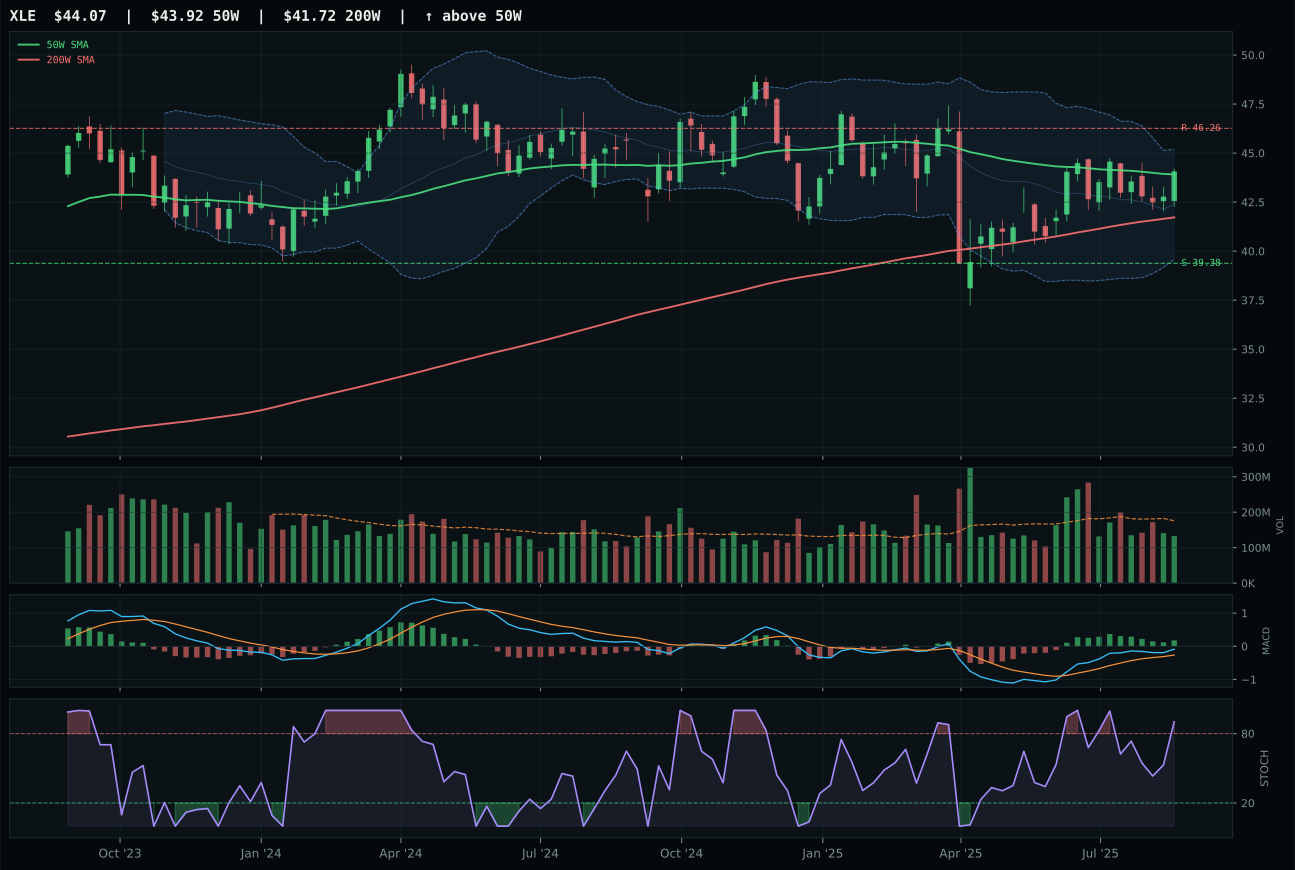
XLE has a compression near 50W profile with -3.9% 13-week relative strength versus SPY.
A failed hold above support would weaken the setup.
Actionable but governed by invalidation levels.
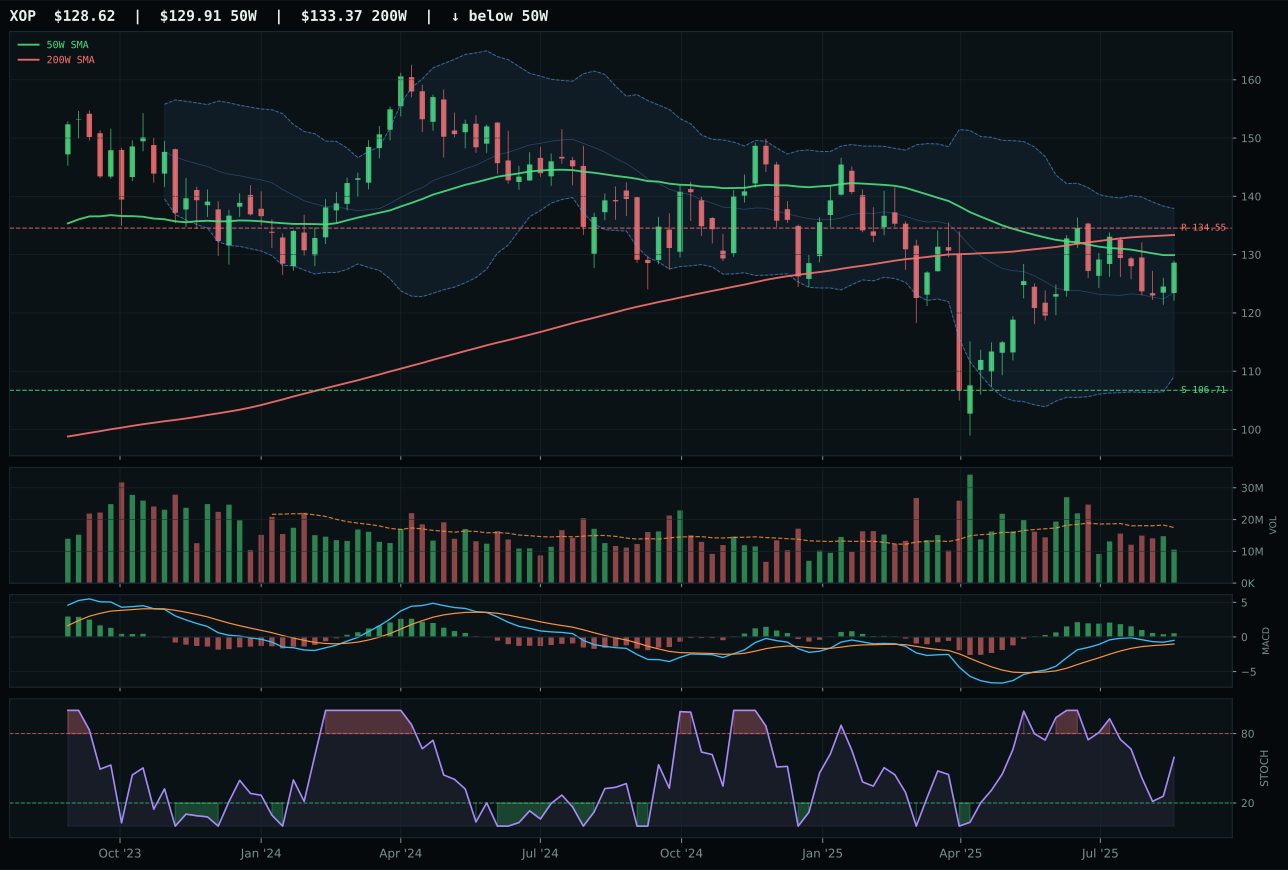
XOP has a compression near 50W profile with -5.0% 13-week relative strength versus SPY.
Extension and support failure are the main tactical risks.
Tracked, but not top-2 eligible because: structurally broken.
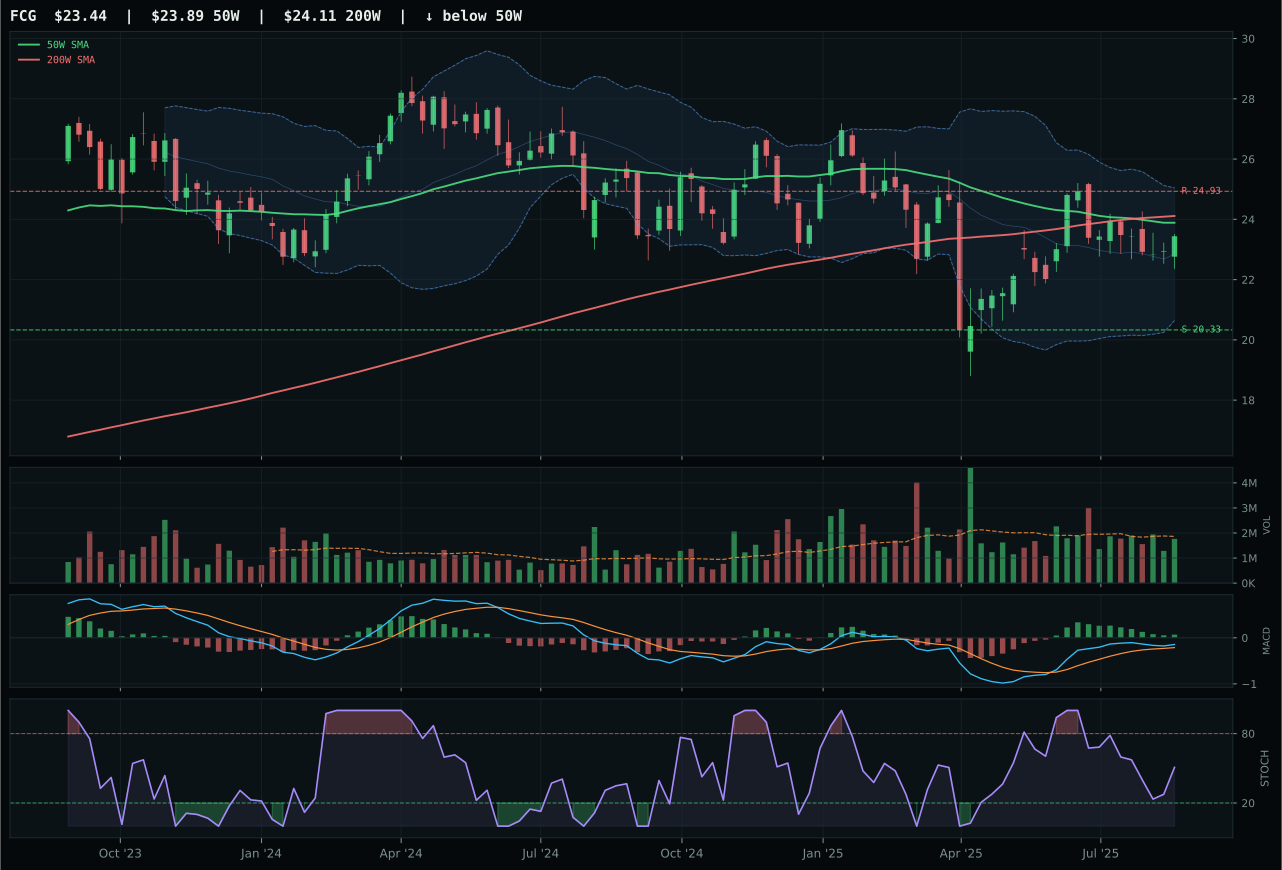
FCG has a compression near 50W profile with -6.1% 13-week relative strength versus SPY.
Extension and support failure are the main tactical risks.
Tracked, but not top-2 eligible because: structurally broken.
XLE wins because it is the only chart in the category with clean structure and reasonable timing. Price sits 0.4% from the 50-week—a compression setup that can provide expansion potential if buyers defend—and XLE's timing score of 95.0/100 reflects this perfect entry geometry. Thirteen-week return of 7.5% is modest but the stochastic RSI at 0.90 (overbought) paired with near-50W proximity suggests coil, not exhaustion. XOP lost decisively because its structure is broken (41.1 vs 76.7), volume participation is thin, and it has no technical merit beyond a rising stochastic. XLE's macro fit is 86.0/100—energy scarcity is +14, supply shortage is +7—the strongest macro support in the energy complex. Risk/reward of 52.2/100 is respectable given upside to resistance is capped at -4.7% but downside buffer to support is 11.9%. XLE is compact, well-defined, and backed by reflation tailwinds.
Traditional Energy earned 5% allocation as tier-2, not top-2, because the 46.2 final score lags Industrial Metals (72.5) and Nuclear (68.3). Macro fit is 90.0/100—excellent and identical to Agriculture—yet technical evidence for XLE is 70.5/100, pulling the category score down. Timing is near-perfect (95/100) but momentum confirmation is weak at 60.8/100 and risk/reward is just 52.2/100. The category setup is ambiguous: energy scarcity and late-cycle reflation are powerful tailwinds, yet the chart is compressing rather than extending, which limits upside clarity. XLE needs to break above resistance at 46.26 with follow-through volume to confirm expansion; if it rolls over from here, the macro case remains intact but entry risk escalates. The 5% allocation respects the macro thesis while acknowledging that execution in the near term is uncertain. If XLE closes the compression decisively higher, the category could graduate to top-2 in coming weeks.
Precious Metals — GLD
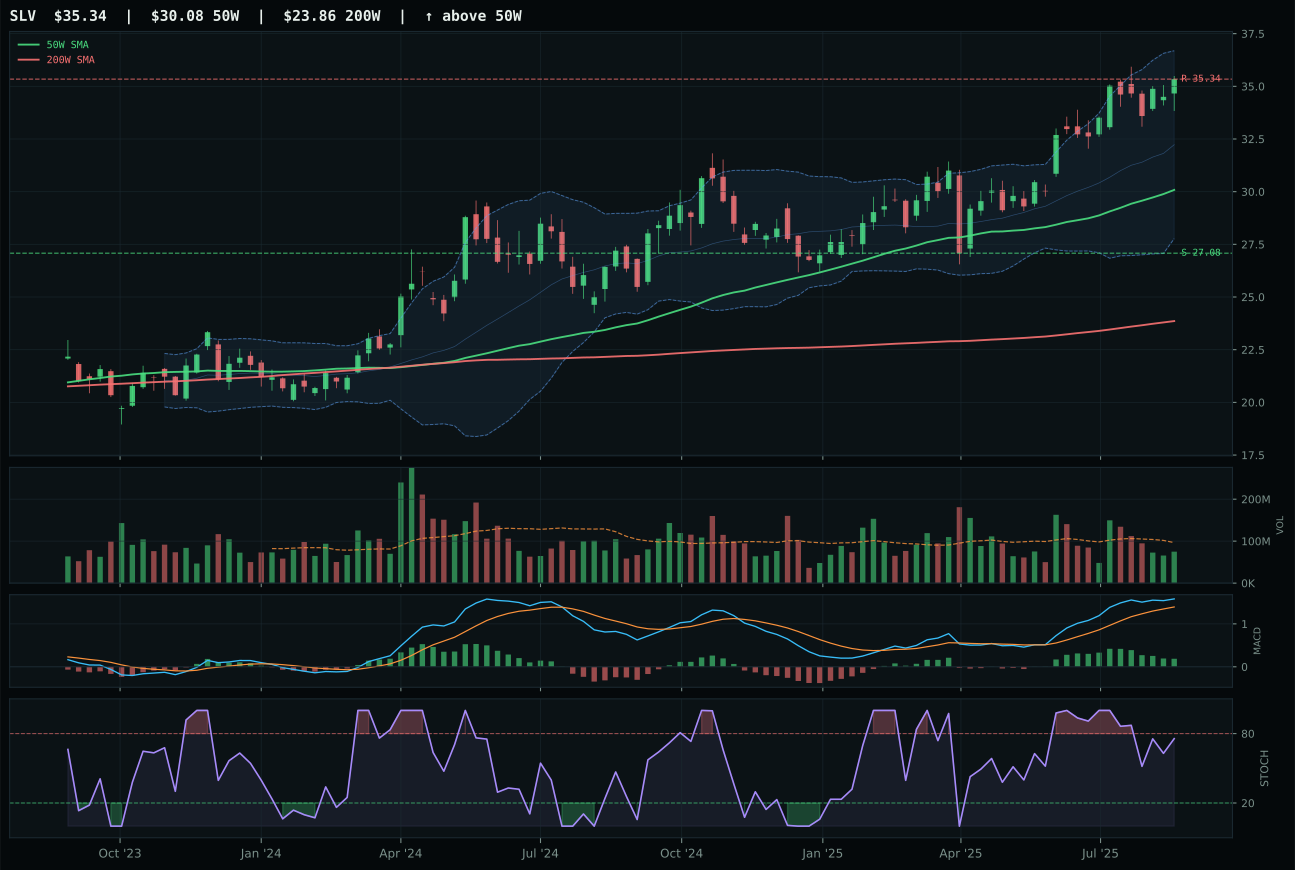
SLV has a vertical extension profile with 4.6% 13-week relative strength versus SPY.
A failed hold above support would weaken the setup.
Actionable but governed by invalidation levels.
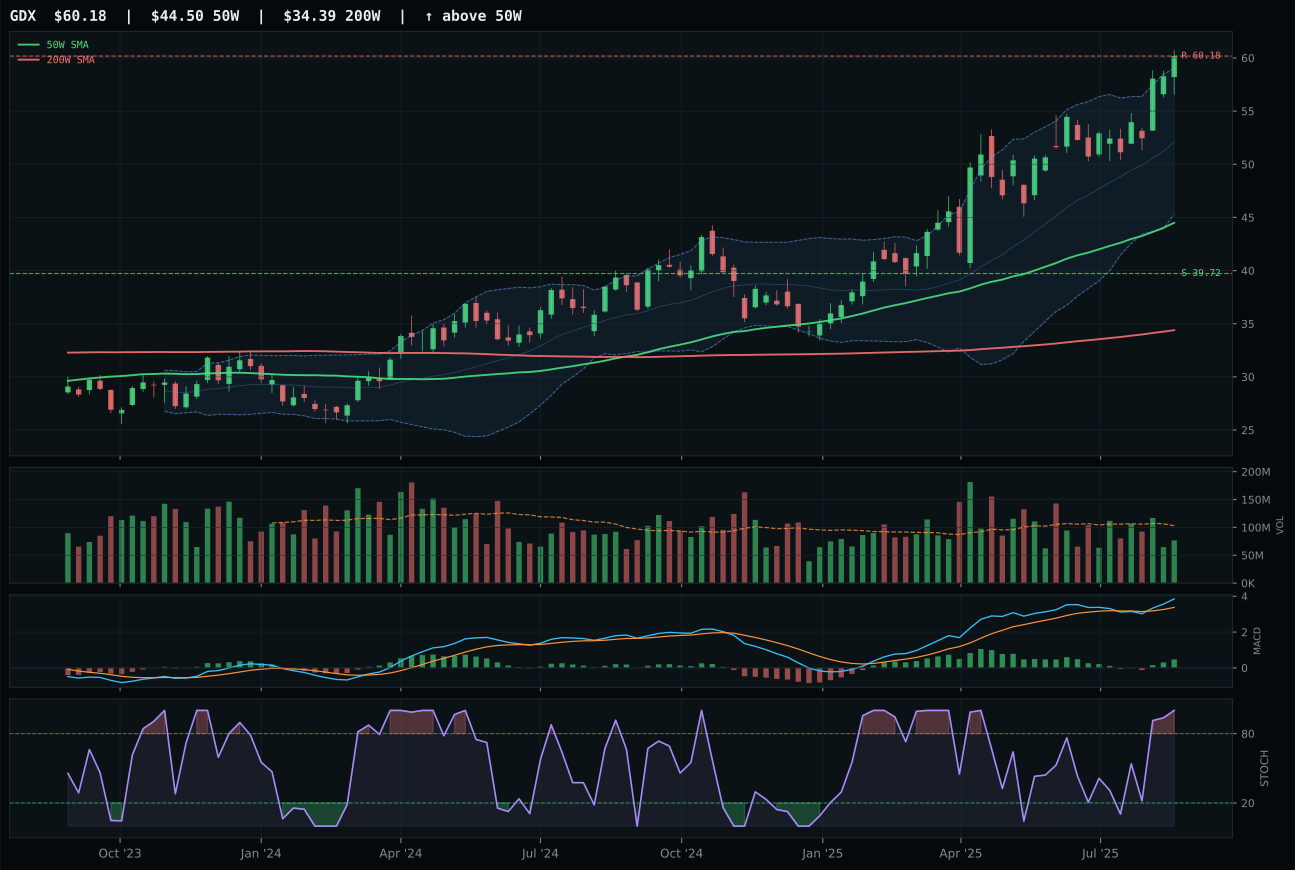
GDX has a vertical extension profile with 7.7% 13-week relative strength versus SPY.
A failed hold above support would weaken the setup.
Actionable but governed by invalidation levels.
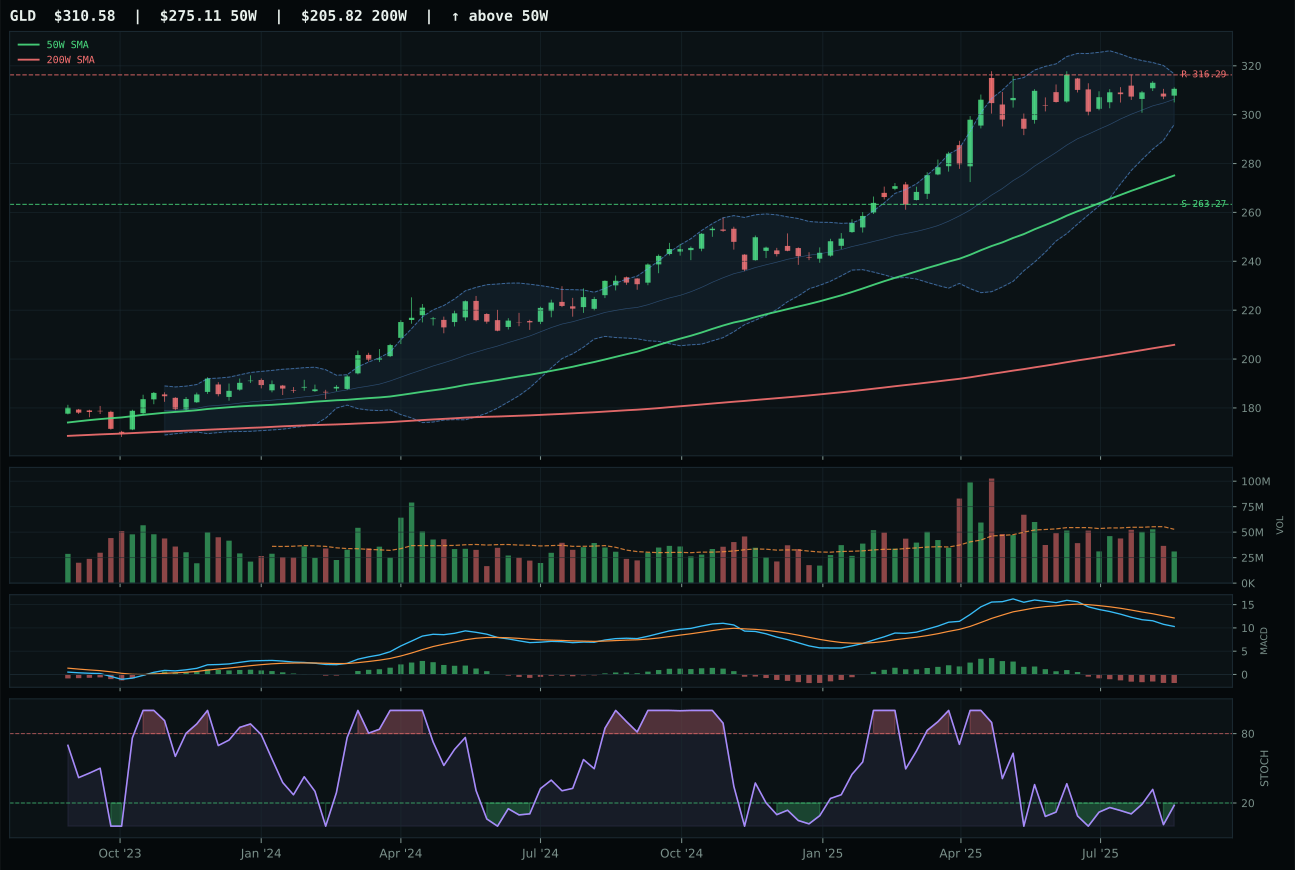
GLD has a neutral structure profile with -11.2% 13-week relative strength versus SPY.
A failed hold above support would weaken the setup.
Actionable but governed by invalidation levels.
GLD wins because it is the least damaged option in a broken category—technical evidence is only 18.5/100, the worst score of any category winner this week. Price is above both moving averages but momentum is dead: thirteen-week return is 0.3%, stochastic RSI is oversold at 0.18, MACD is bearish-weakening, and category-relative strength is catastrophic at -15.8%. GLD loses to SLV in the raw ranking (26.8 versus 61.7), but the allocation logic selects GLD as the representative because it is the highest-ranked final ETF in the category's 3/2/1 basket after testing against volume, persistence, and macro fit. SLV has better momentum (16.1% return, rising stochastic) but its timing score is 48 versus GLD's 62, meaning SLV is extended while GLD is coiled. In a category where nothing works, the representative is the ETF least likely to implode first.
Precious Metals earned 5% allocation this week, sitting outside the top-two overweight. The 42.6 final score reflects a macro fit of 46.0/100 (only positive risk appetite at -4 points active; no inflation sponsorship despite late-cycle reflation). Technically, the evidence is dire: GLD's momentum confirmation is 0.0/100 because price has gone nowhere (0.3% in thirteen weeks) and volume-price confirmation scores just 22.4/100. Gold is typically a hedge during stress or inflation acceleration, but right now risk appetite is positive and inflation pressure is active at only -4 points (not dominant). For precious metals to earn 5%, gold would need either a technical rebound with price clearing 296.60 on volume, or a macro shift toward credit stress acceleration or risk appetite collapse. Currently, the category is a hedge without a triggering event. The portfolio allocates zero, acknowledging that real assets are favored, but precious metals specifically are lagging industrial metals and energy peers in both technical and macro merit.
Emerging Markets — INDA
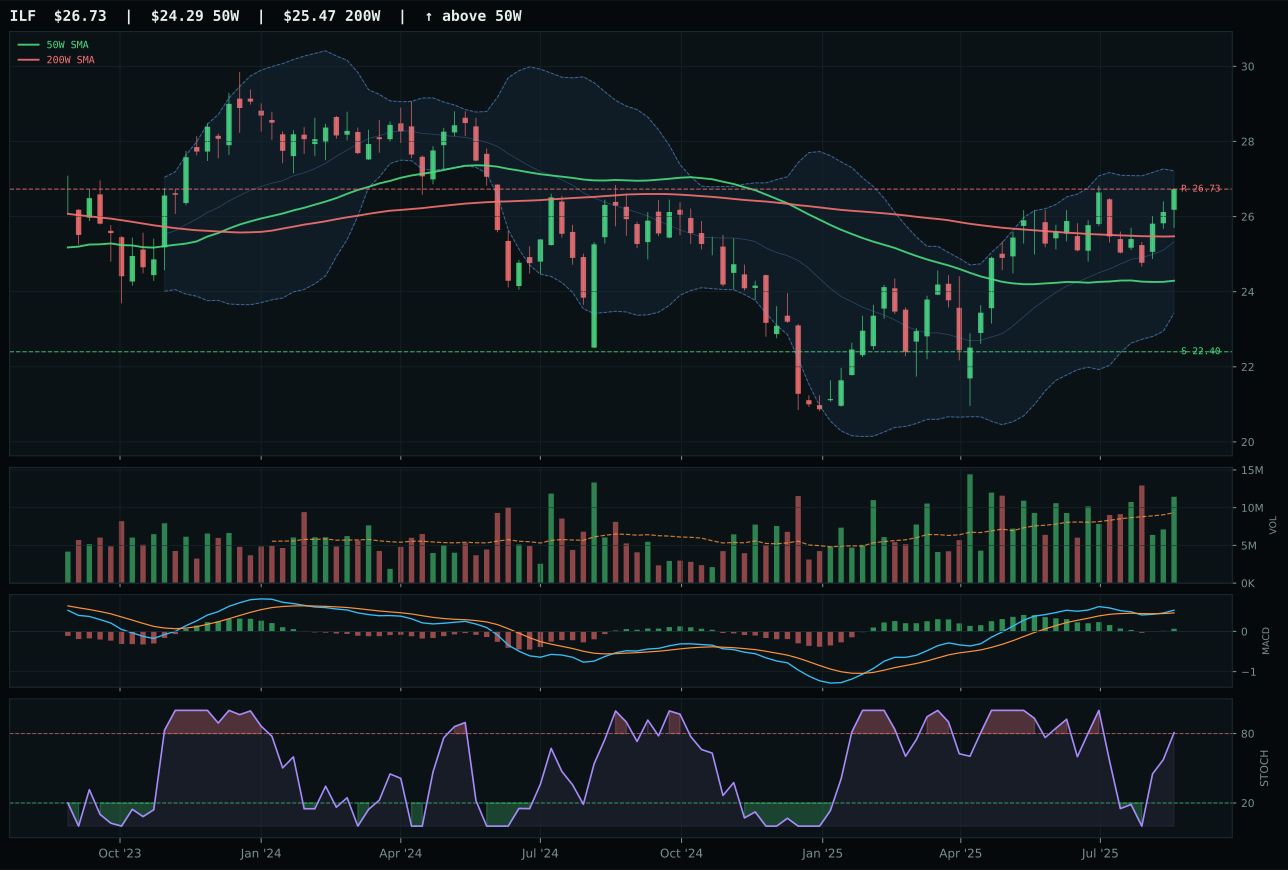
ILF has a neutral structure profile with -7.5% 13-week relative strength versus SPY.
A failed hold above support would weaken the setup.
Actionable but governed by invalidation levels.
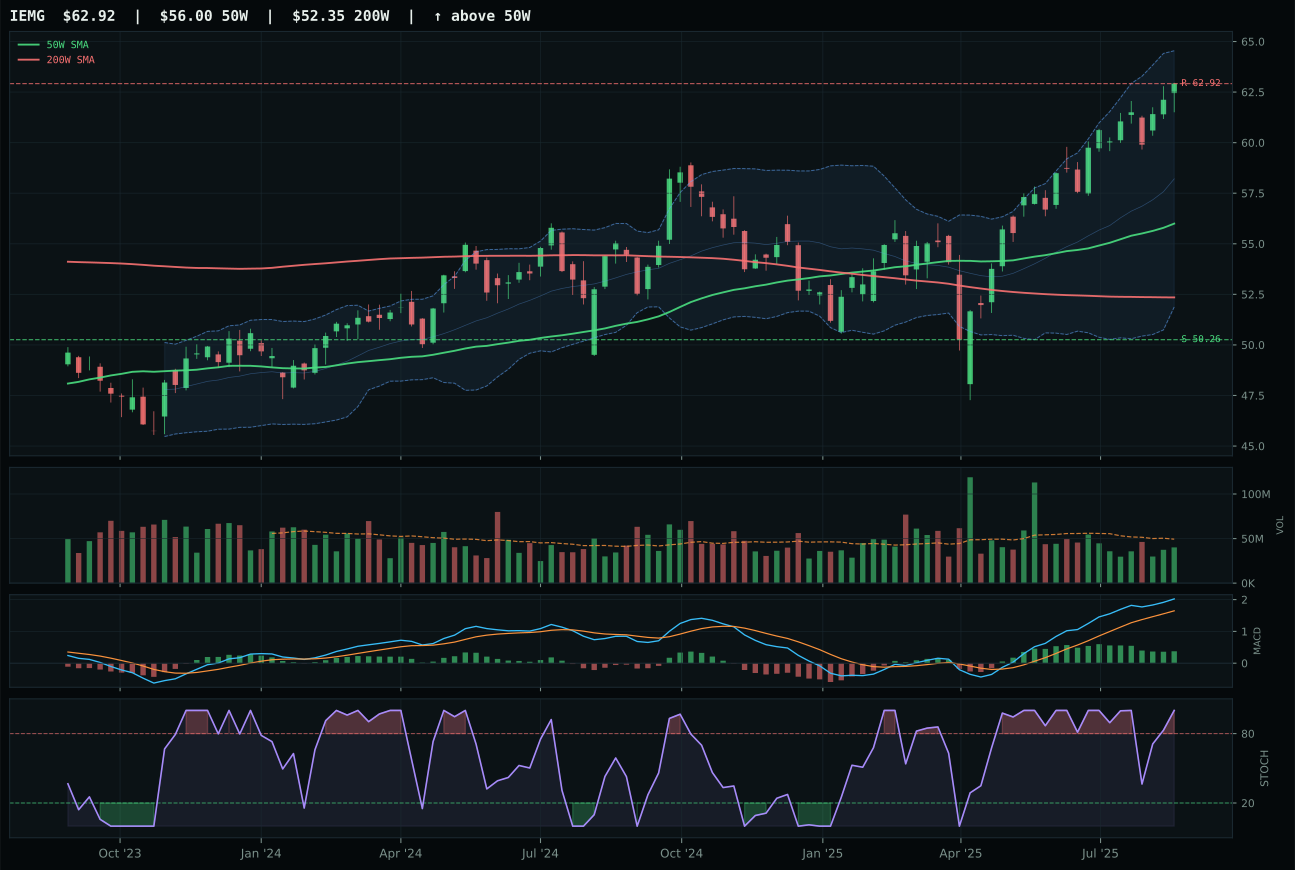
IEMG has a neutral structure profile with -1.9% 13-week relative strength versus SPY.
A failed hold above support would weaken the setup.
Actionable but governed by invalidation levels.
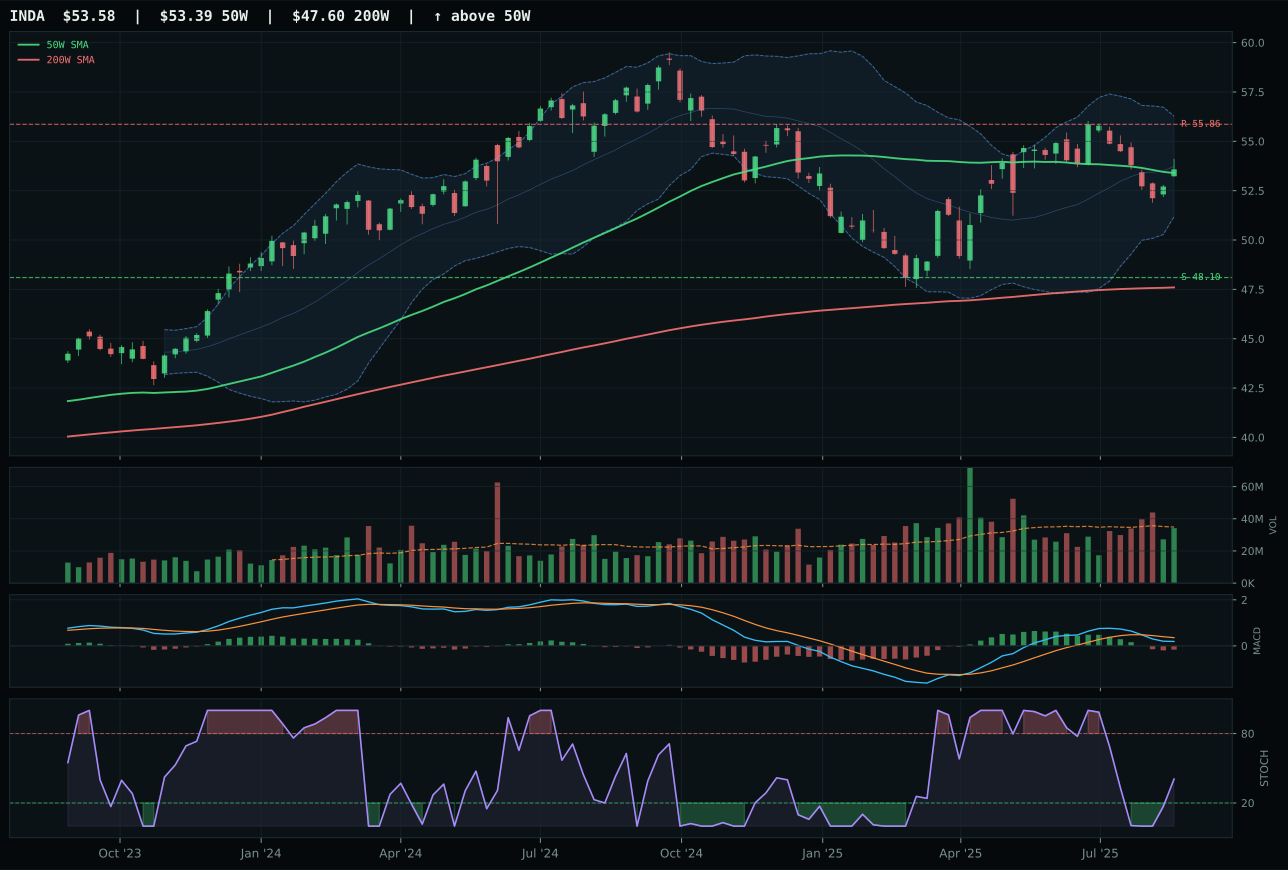
INDA has a compression near 50W profile with -13.3% 13-week relative strength versus SPY.
A failed hold above support would weaken the setup.
Actionable but governed by invalidation levels.
INDA wins a broken category by avoiding the worst damage, not by offering strength. Price sits 0.3% from the 50-week (perfect timing geometry, 100/100 score) in a compression setup, yet momentum is dead: thirteen-week return is -1.8%, MACD is bearish-weakening, and category-relative strength is -5.8%. The only reason INDA wins is that ILF is more extended (10.0% from 50W) and IEMG offers no edge. INDA's risk/reward of 59.5/100 reflects genuine upside optionality (0.0% to resistance, 11.4% downside buffer), but momentum confirmation at 2.4/100 is the second-worst score in the entire portfolio. ILF lost because timing score is weaker (59 vs 100), it is extended into overbought stochastic, and its MACD is bullish (not broken like INDA's), yet it has already moved—INDA has not. When a category is weak, the representative is often the chart least likely to fill gaps on unexpected reversals.
Emerging Markets earned 0% allocation this week, ranked 9th or 10th, because the 39.1 final score reflects both weak technical evidence (29.4/100 for INDA) and weak macro fit (38.0/100). Liquidity stress is -10, credit stress is -10, and risk appetite is only +8—the emerging markets complex is under pressure. INDA's chart is geometrically perfect for entry (0.3% from 50W), yet there are no buyers: momentum is negative, breadth is poor, and volume-price confirmation is just 27.2/100. This is a category where macro headwinds (funding stress, credit stress) are overwhelming any technical setup advantage. For Emerging Markets to earn 5% or 10%, the portfolio would need to see either INDA close above the 50W on accumulation (volume above 0.98x 20W average) with MACD inflection, or a shift in macro conditions that reduces liquidity/credit stress. Right now, allocating zero is discipline—the opportunity cost of waiting for better entry is outweighed by capital being deployed into Industrial Metals, Nuclear, Technology, and other categories with cleaner technical and macro alignment.
Agriculture & Livestock — MOO
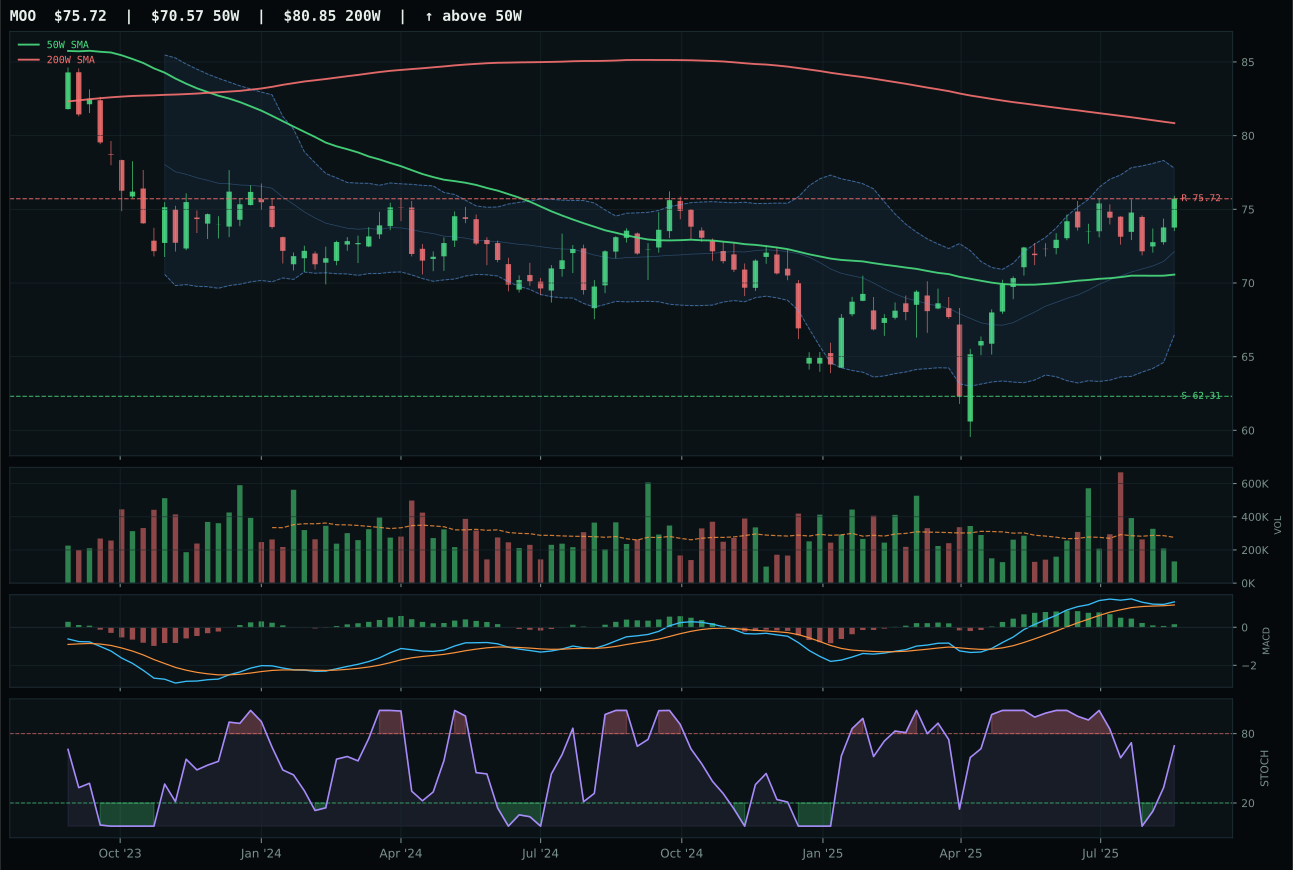
MOO has a neutral structure profile with -6.1% 13-week relative strength versus SPY.
A failed hold above support would weaken the setup.
Actionable but governed by invalidation levels.
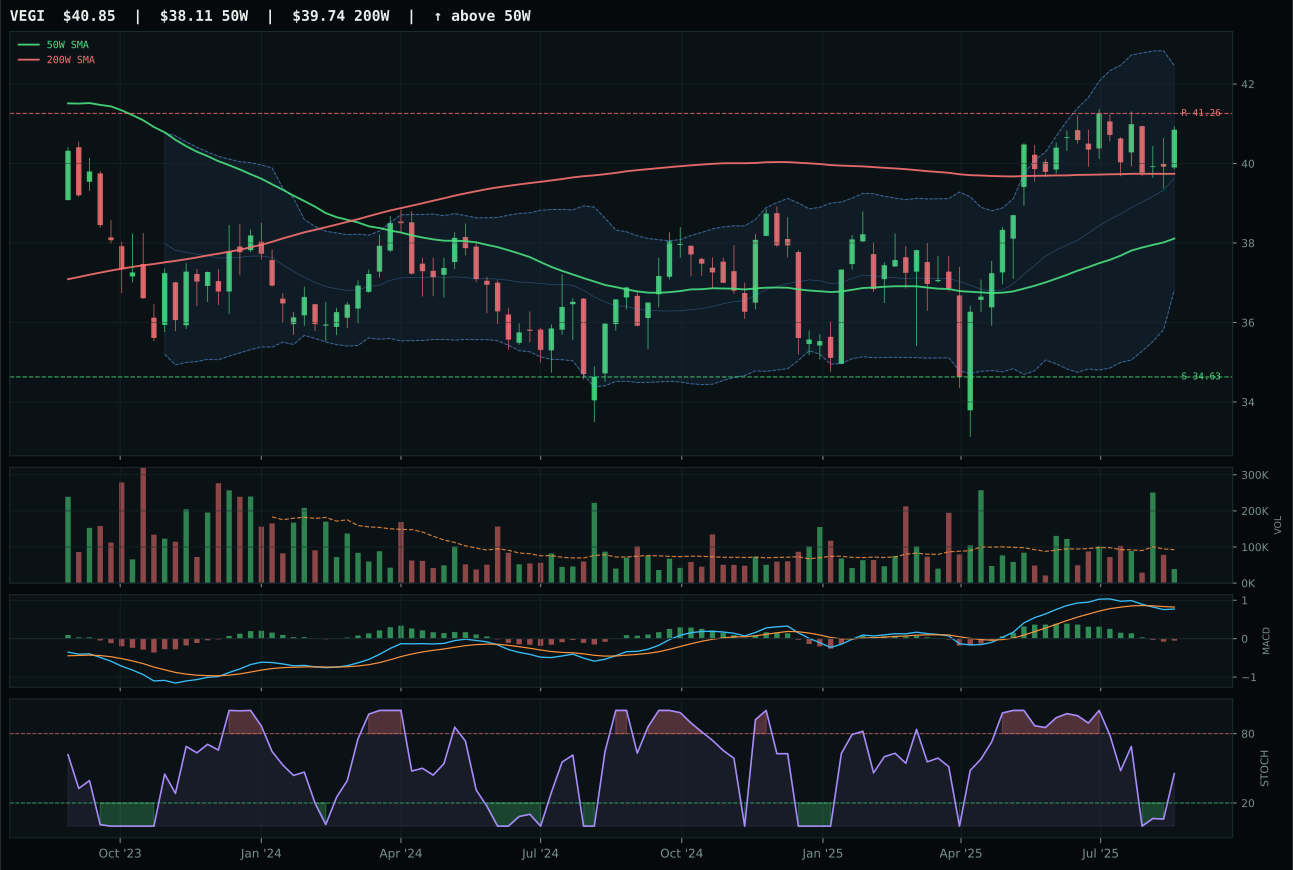
VEGI has a neutral structure profile with -8.9% 13-week relative strength versus SPY.
A failed hold above support would weaken the setup.
Tracked, but not top-2 eligible because: .
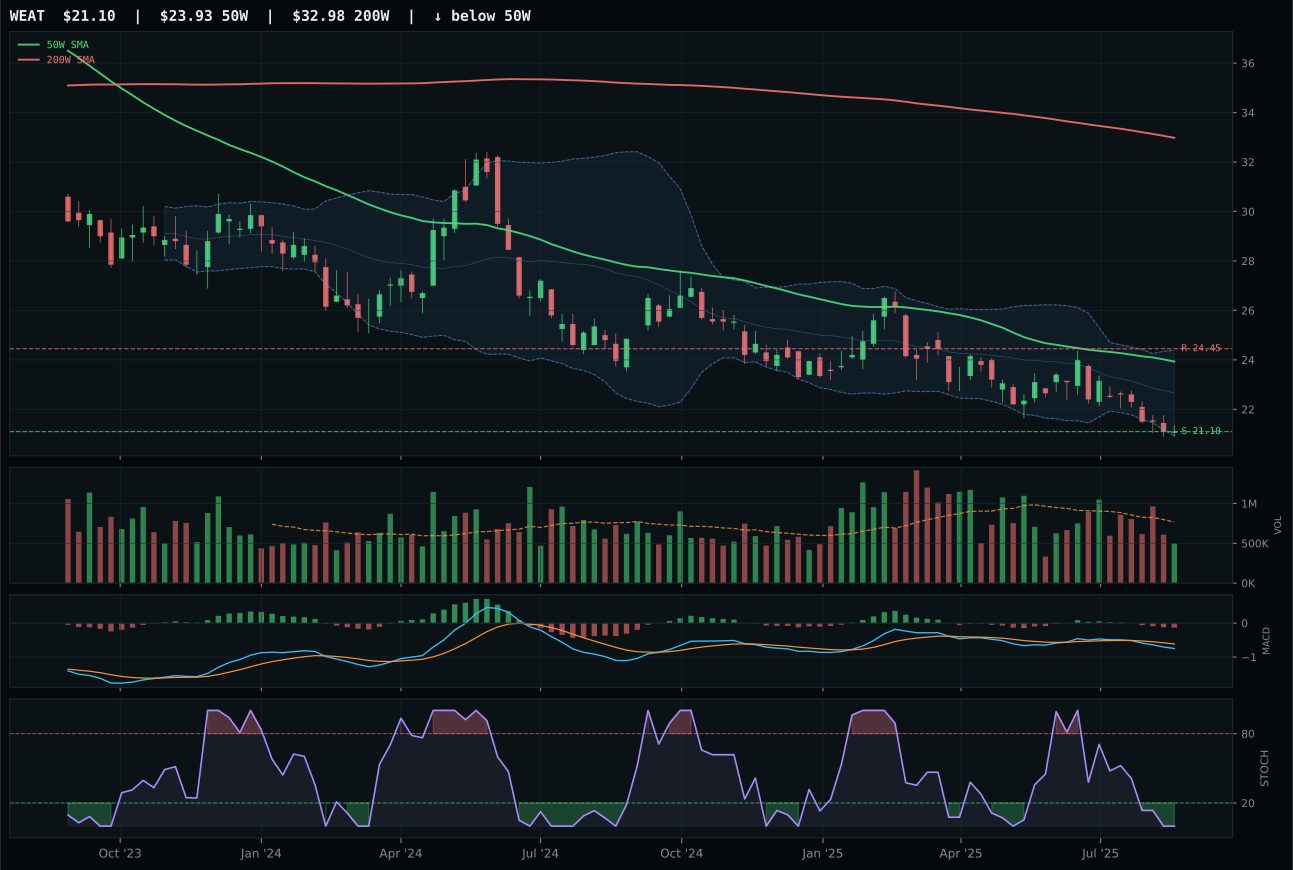
WEAT has a pullback into support profile with -20.1% 13-week relative strength versus SPY.
Extension and support failure are the main tactical risks.
Tracked, but not top-2 eligible because: structurally broken.
MOO wins a weak category—there is no strong hand here—because it avoids the deep technical damage of its peers. Price sits above the 50-week but below the 200-week, a split that signals trend uncertainty, yet MOO's MACD is still bullish-flattening while VEGI's has turned bearish-weakening. Thirteen-week returns of 5.3% are anemic, and the -6.1% relative strength to SPY is a red flag, but MOO's 2.8% category-relative strength versus VEGI's 0.0% shows at least some capital is rotating there. Volume is thin at 0.47x the 20-week average—participation is almost absent—which means risk/reward is skewed: upside to resistance is a hard 0%, but downside has 21.5% of buffer to support. VEGI lost because its MACD is breaking down (bearish-weakening) and category-relative strength is flat; when both technical and relative metrics are deteriorating, the category decision becomes obvious even if both charts are marginal.
Agriculture & Livestock earned 0% allocation this week, ranked outside the top-8 eligible categories. The 37.4 final score is the lowest among all ten, yet the macro fit is 90.0/100—supply shortage is active (+13 points), inflation pressure is +10, and real asset sponsorship is +8. The disconnect is stark: the macro thesis for agriculture is pristine in late-cycle reflation, but technical evidence collapsed to 63.1/100 for MOO. Price action is weak, volume is thin, momentum is barely positive (53/100 confirmation score), and the setup provides no entry clarity. This is a category where macro is screaming yes but the chart is saying not yet. To earn a 5% or 10% slot, MOO would need to close above resistance at 75.72 on above-average volume, signal MACD inflection upward, and show category-relative strength turning positive. Until that happens, the portfolio respects the macro tailwind by waiting—allocating zero prevents forced entry into a technically broken picture.