
2025-08-15
Informational purposes only. The content in this report, including allocations, analysis, and commentary, is provided solely for informational and educational purposes. It does not constitute financial advice, investment advice, trading advice, or any other type of advice. Past performance does not guarantee future results. Always conduct your own research and consult a qualified financial professional before making investment decisions.
Weekly Allocation
| Ticker | Category | Weight | Role |
|---|---|---|---|
| FBTC | 50% | Overlay | |
| COPX | Industrial Metals | 10% | Top-2 (10%) |
| NLR | Nuclear Energy | 10% | Top-2 (10%) |
| BOTZ | AI | 5% | Tier-2 (5%) |
| IGF | Utilities & Infrastructure | 5% | Tier-2 (5%) |
| GDX | Precious Metals | 5% | Tier-2 (5%) |
| ITA | Defense & Aerospace | 5% | Tier-2 (5%) |
| XLK | Technology | 5% | Tier-2 (5%) |
| MOO | Agriculture & Livestock | 5% | Tier-2 (5%) |
Trade Instructions — Monday Open
Sell the tranche from 2025-07-18 (completing its 4-week hold). Buy the new tranche. Instructions show net portfolio changes — same-asset positions cancel, weight changes show the delta.
| Action | Ticker | Instruction |
|---|---|---|
| SELL | URA | Sell entire URA position (2.50% of portfolio) |
| SELL | XAR | Sell entire XAR position (1.25% of portfolio) |
| SELL | SMH | Sell entire SMH position (1.25% of portfolio) |
| SELL | PAVE | Sell 50% of PAVE position (reduce 2.50% → 1.25%) |
| SELL | XLE | Sell 33% of XLE position (reduce 3.75% → 2.50%) |
| SELL | SLV | Sell 50% of SLV position (reduce 2.50% → 1.25%) |
| BUY | NLR | Buy NLR — 28.57% of freed cash (adds 2.50% to portfolio) |
| BUY | BOTZ | Buy BOTZ — 14.29% of freed cash (adds 1.25% to portfolio) |
| BUY | ITA | Buy ITA — 14.29% of freed cash (adds 1.25% to portfolio) |
| BUY | MOO | Buy MOO — 14.29% of freed cash (adds 1.25% to portfolio) |
| BUY | IGF | Buy IGF — 14.29% of freed cash (adds 1.25% to portfolio) |
| BUY | GDX | Buy GDX — 14.29% of freed cash (adds 1.25% to portfolio) |
Current Portfolio After Trade
Combined holdings across all 4 active tranches. Each tranche is 25% of the portfolio.
| Ticker | % of Portfolio | Weight Bar |
|---|---|---|
| FBTC | 50.00% | |
| NLR | 10.00% | |
| BOTZ | 6.25% | |
| REMX | 5.00% | |
| ITA | 5.00% | |
| COPX | 3.75% | |
| XLK | 3.75% | |
| MOO | 3.75% | |
| XLE | 2.50% | |
| XLU | 2.50% | |
| GLD | 2.50% | |
| PAVE | 1.25% | |
| SLV | 1.25% | |
| IGF | 1.25% | |
| GDX | 1.25% |
Macro Regime — Transition / Mixed
Macro Evidence Charts
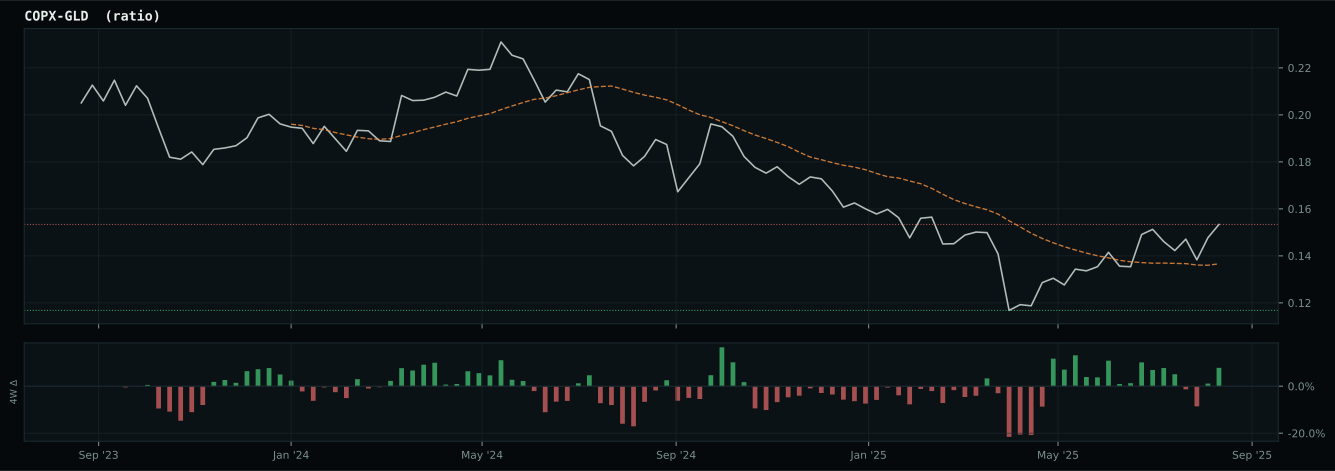
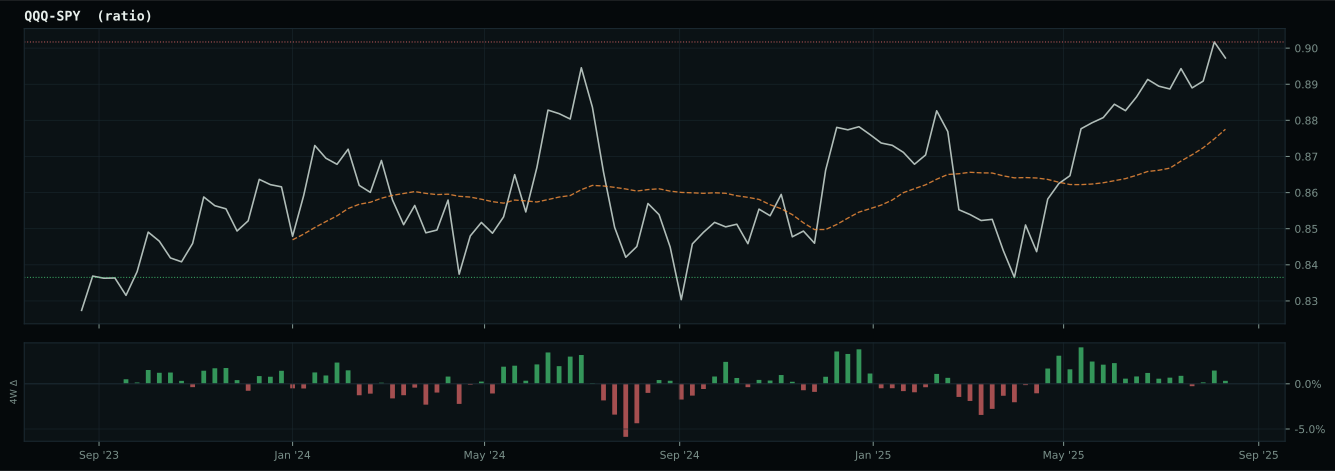
Market-implied signals behind the macro regime scores. Each ratio compares two assets; the direction and slope of the ratio is what the macro engine reads.
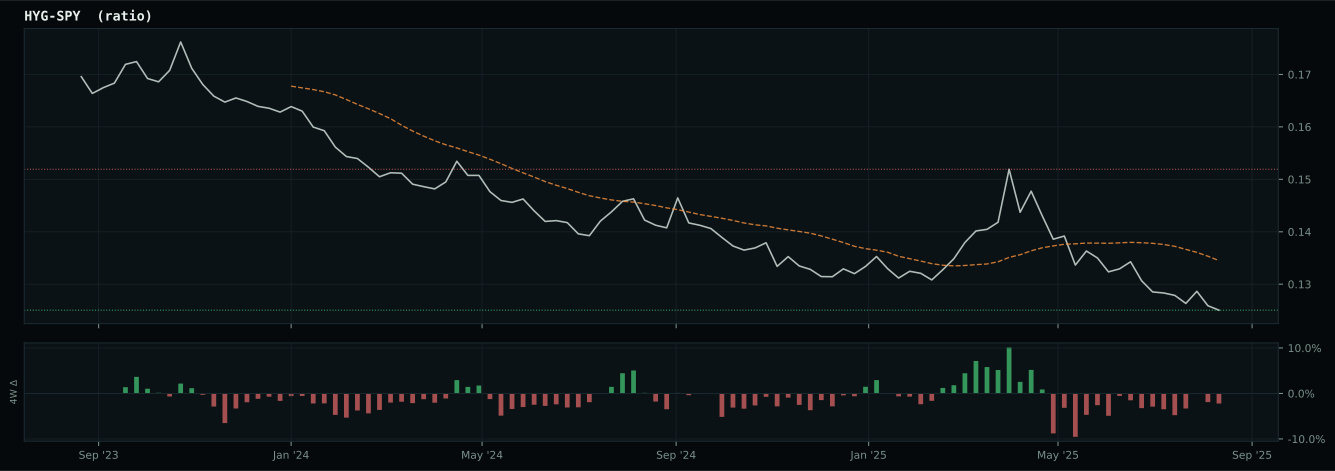
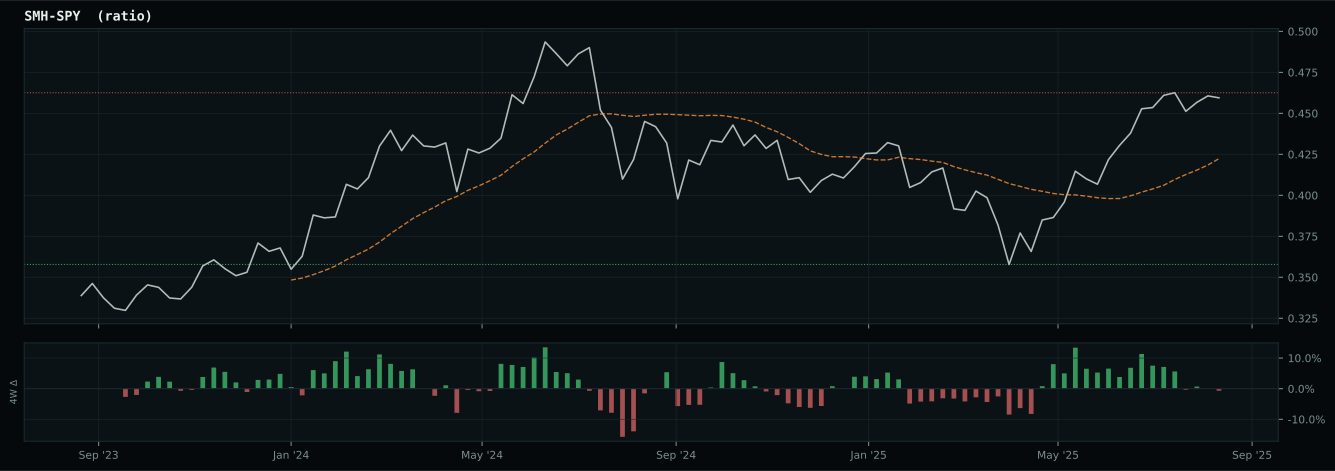
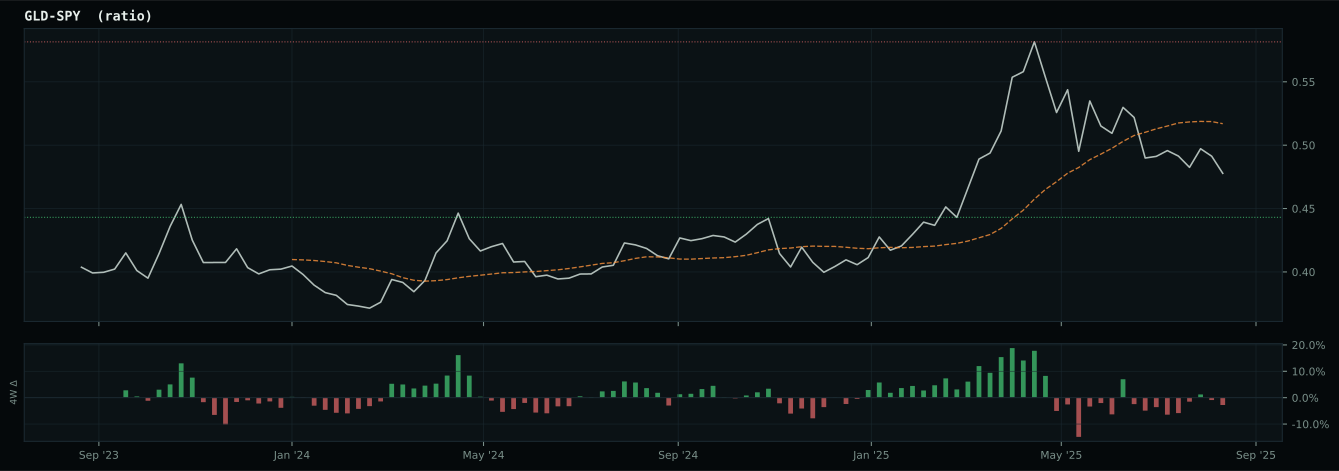
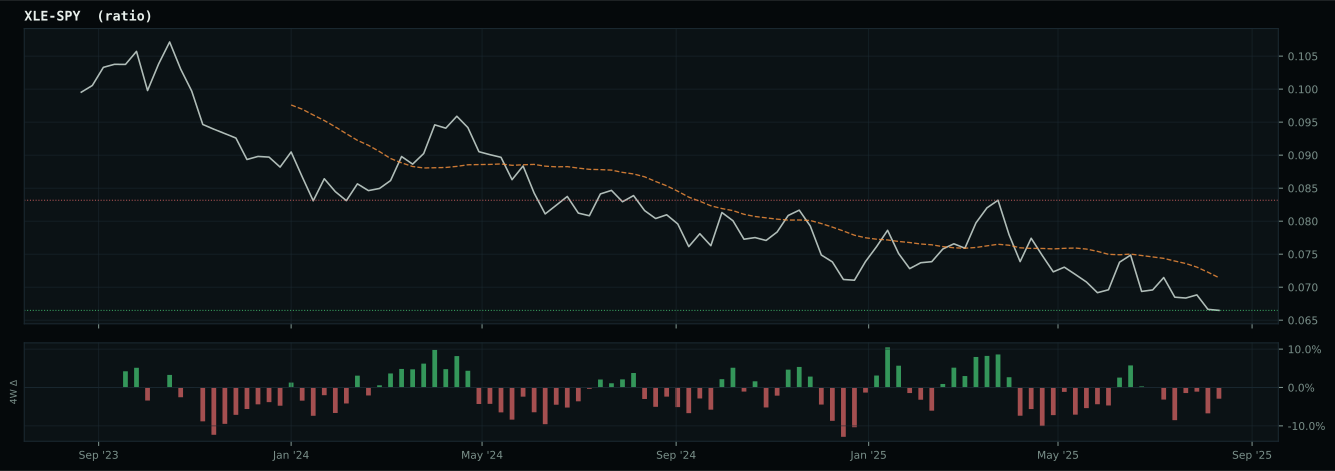
Crypto Regime — TrendBTC
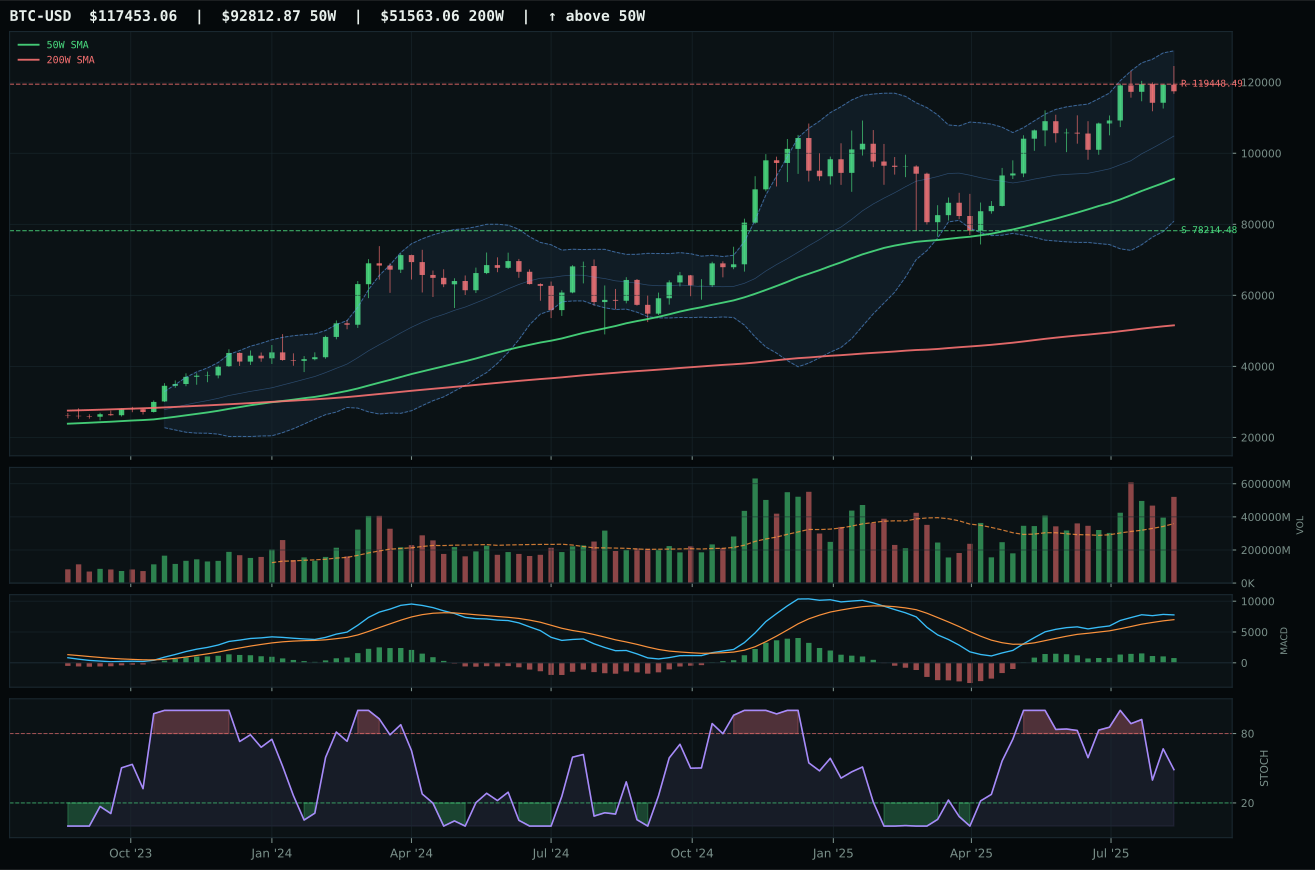
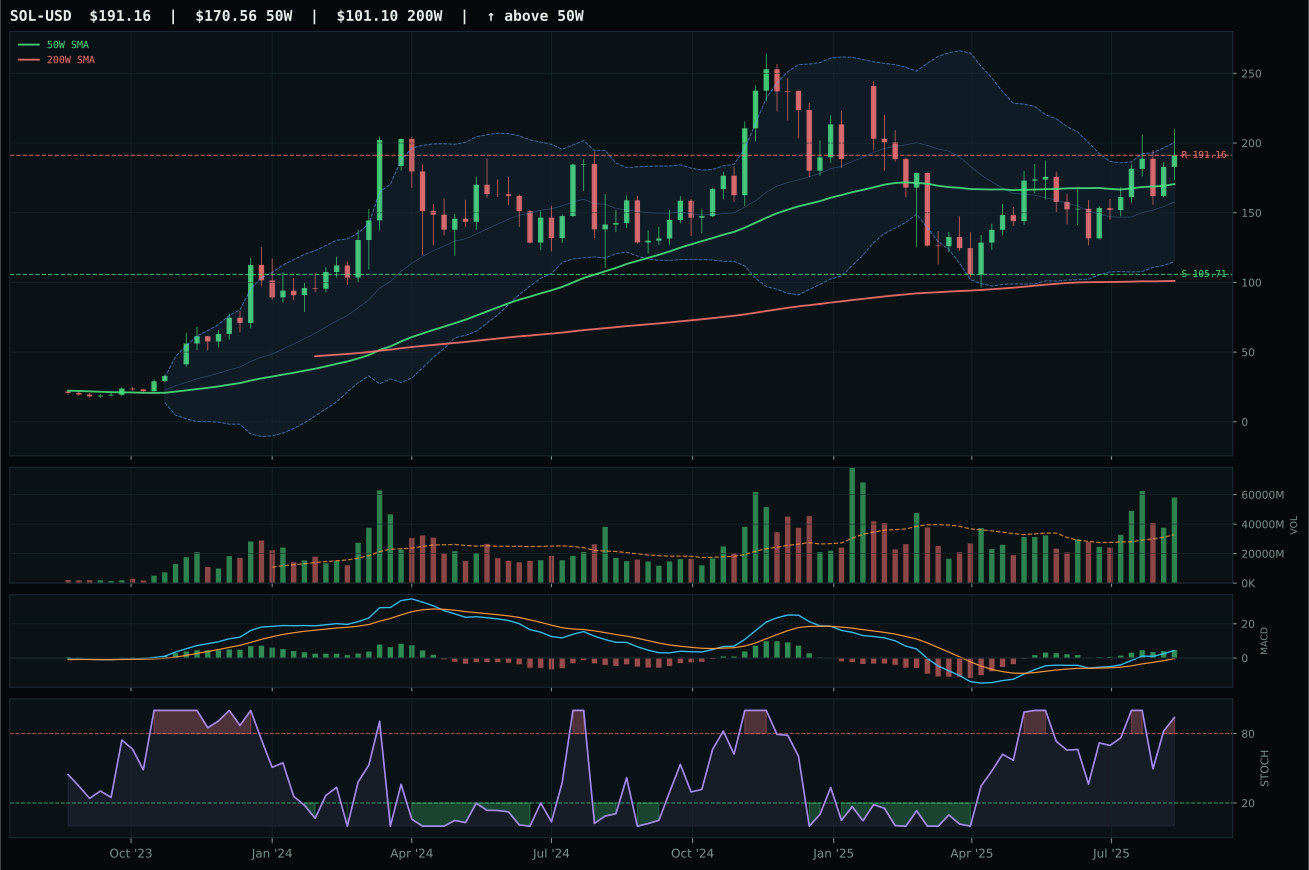
ValueBTC not armed: BTC has not made the first post-breakdown touch of the 200W buy zone after losing the 50W
TrendBTC confirmed: 2 consecutive closes above rising/flat 50W SMA
one or more available conditions failed
Category Rankings
| Rank | Category | Winner | Score | Alloc | 4W Ret | Peers (4W) |
|---|---|---|---|---|---|---|
| 1 | Industrial Metals | COPX | 71.2 | 20% | +14.12% | REMX +1.2% · PICK +5.6% |
| 2 | Nuclear Energy | NLR | 63.2 | 20% | +6.86% | URA +9.3% · URNM +10.3% |
| 3 | AI | BOTZ | 60.1 | 10% | +0.77% | SMH +3.0% · AIQ +5.6% |
| 4 | Utilities & Infrastructure | IGF | 58.5 | 10% | +0.54% | PAVE +1.5% · XLU -0.3% |
| 5 | Precious Metals | GDX | 51.1 | 10% | +19.07% | SLV +10.5% · GLD +9.3% |
| 6 | Defense & Aerospace | ITA | 50.4 | 10% | +2.47% | ROKT +5.0% · XAR +3.1% |
| 7 | Technology | XLK | 45.8 | 10% | +2.24% | IGV +3.2% · CIBR +4.6% |
| 8 | Agriculture & Livestock | MOO | 24.4 | 10% | +1.56% | VEGI +0.9% · WEAT +0.2% |
| 9 | Emerging Markets | IEMG | 22.9 | 0% | +4.37% | ILF +7.4% · INDA +0.3% |
| 10 | Traditional Energy | XLE | 18.6 | 0% | +4.30% | FCG +2.7% · XOP +5.2% |
Industrial Metals — COPX
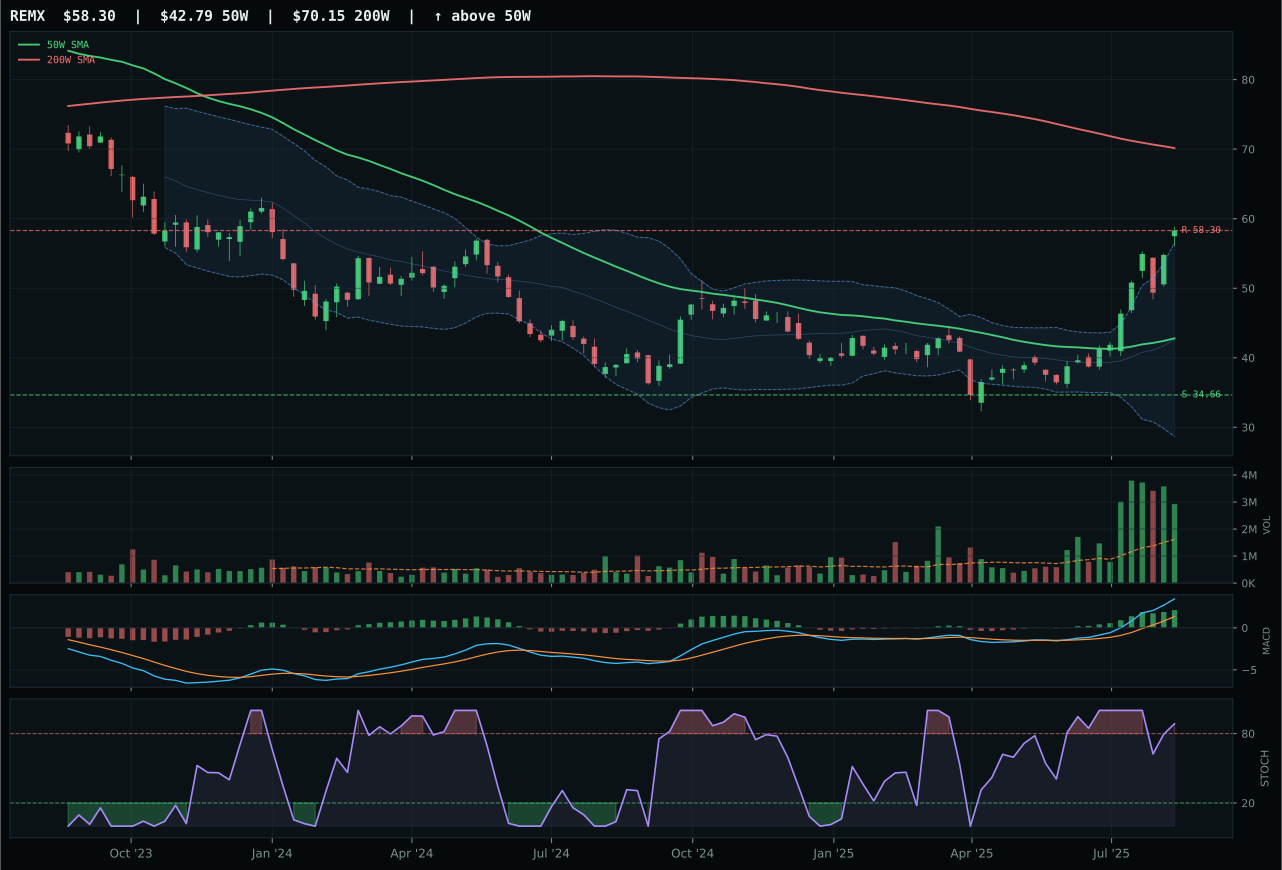
REMX has a vertical extension profile with 40.0% 13-week relative strength versus SPY.
A failed hold above support would weaken the setup.
Actionable but governed by invalidation levels.
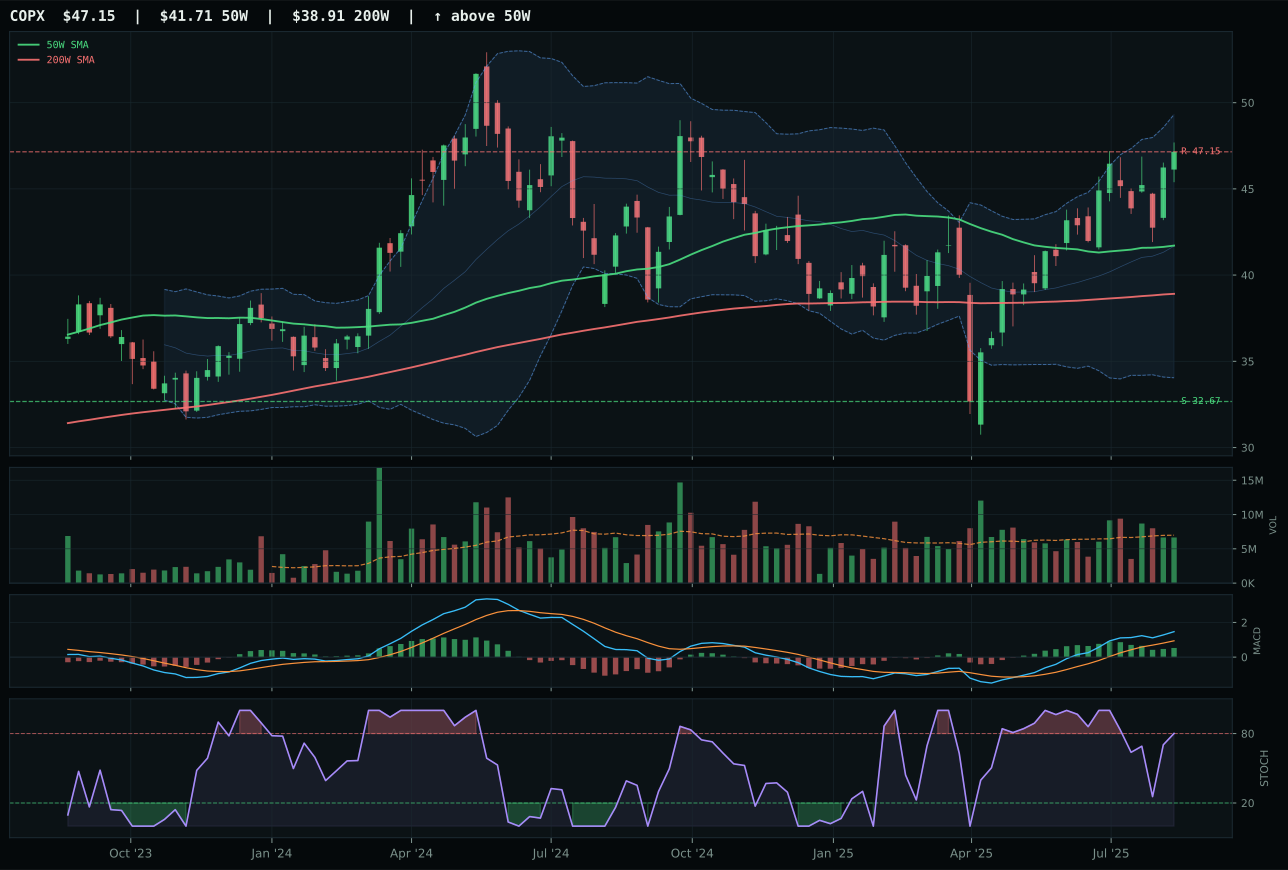
COPX has a neutral structure profile with 11.0% 13-week relative strength versus SPY.
A failed hold above support would weaken the setup.
Actionable but governed by invalidation levels.
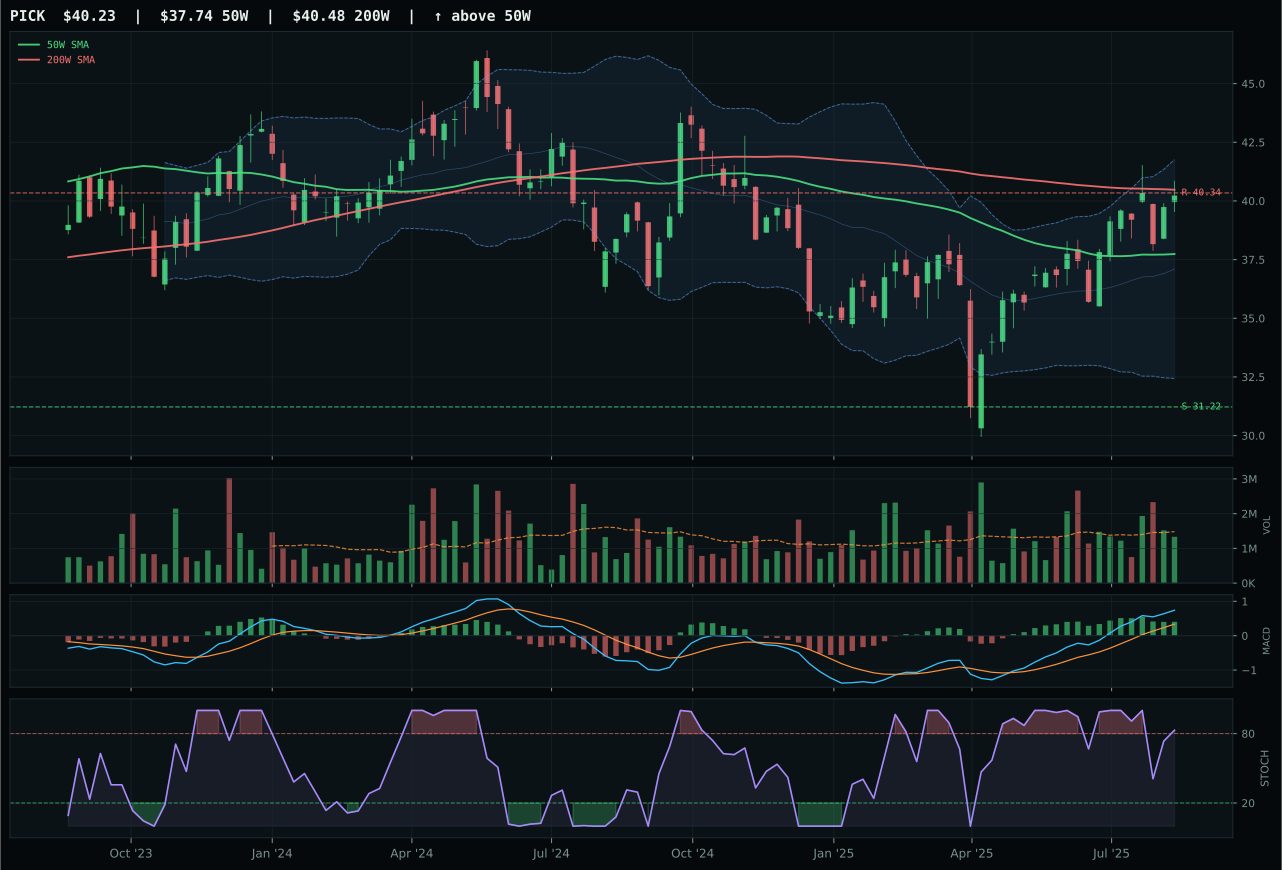
PICK has a neutral structure profile with 0.9% 13-week relative strength versus SPY.
A failed hold above support would weaken the setup.
Actionable but governed by invalidation levels.
COPX wins decisively despite a lower reasoned score than REMX because of superior timing, cleaner structure, and better volume-price confirmation. REMX has delivered a stunning 48.3% 13-week return with 40.0% SPY-relative strength, but that power move has left it vertically extended at 36.2% above the 50-week—a setup where the risk-reward is increasingly skewed against new buyers. COPX's 19.3% 13-week return and 11.0% relative strength are robust without being euphoric, and critically, it sits only 13.0% extended with neutral volume participation. COPX's timing score of 54.0 reflects a setup that is extended but not yet vertical, while REMX's timing score of 27.0 penalizes its aggressive stance. Both show MACD bullish, but COPX's is merely flattening while REMX's is still improving—meaning the tape is tightening for COPX while REMX is running out of fuel.
Industrial Metals scored 71.2/100, ranking second among all ten categories and earning twenty percent allocation as a core conviction position. The category-level macro fit of 65/100 is the highest among all categories, driven by active metals scarcity (plus-14), commodity breadth positive (plus-10), and real asset sponsorship (plus-6) offsetting minus-8 liquidity stress and minus-7 credit stress. The copper scarcity narrative—driven by AI infrastructure buildout and energy transition capex—is the strongest structural case in the portfolio this week. COPX's technical evidence at 76.3/100 combined with category macro tailwind creates a rare combination: trend confirmation, relative strength, and regime support. The allocation represents the portfolio's core real-asset bet; watch for a close below 32.67 support or extension beyond 47.15 resistance to trigger rebalancing, but the setup warrants maximum conviction.
Nuclear Energy — NLR
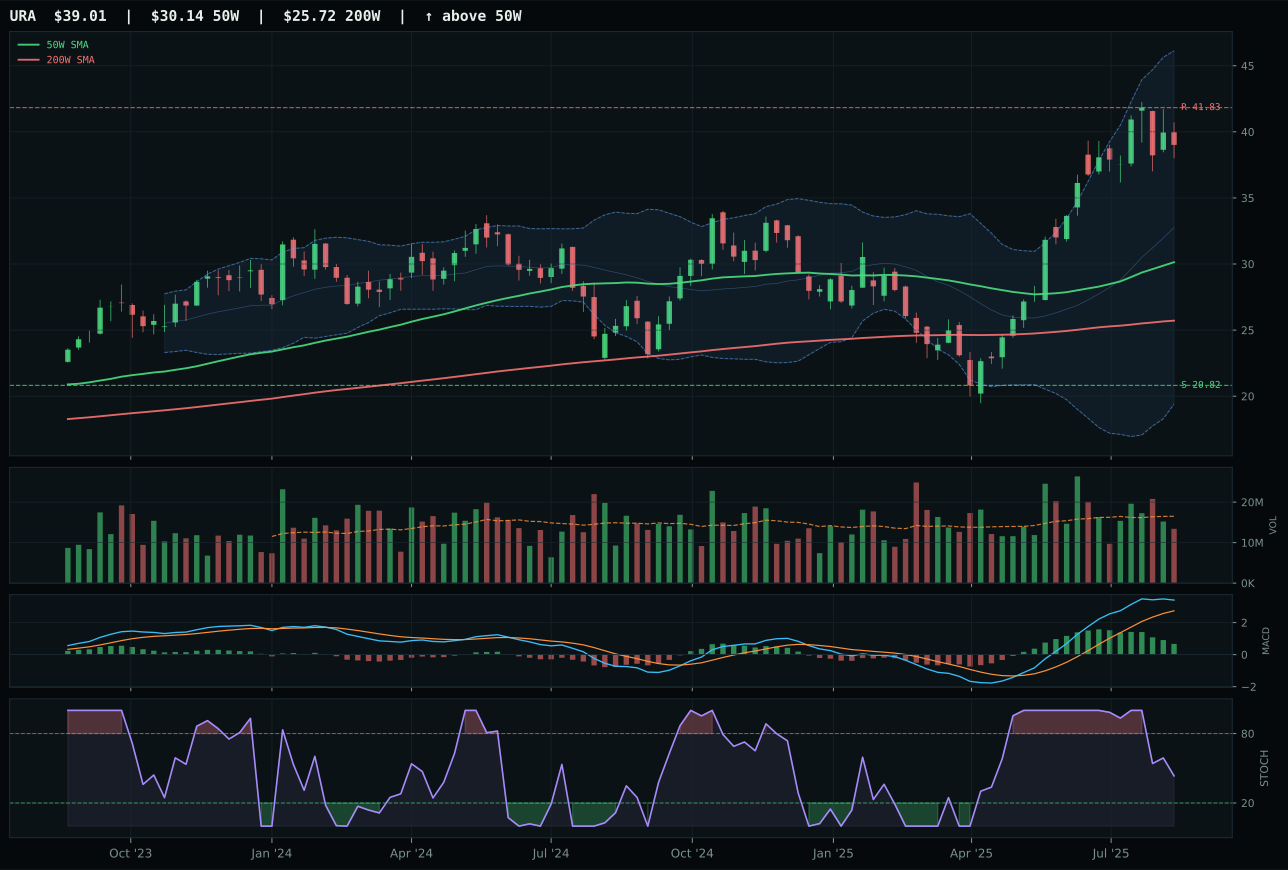
URA has a vertical extension profile with 32.5% 13-week relative strength versus SPY.
A failed hold above support would weaken the setup.
Actionable but governed by invalidation levels.
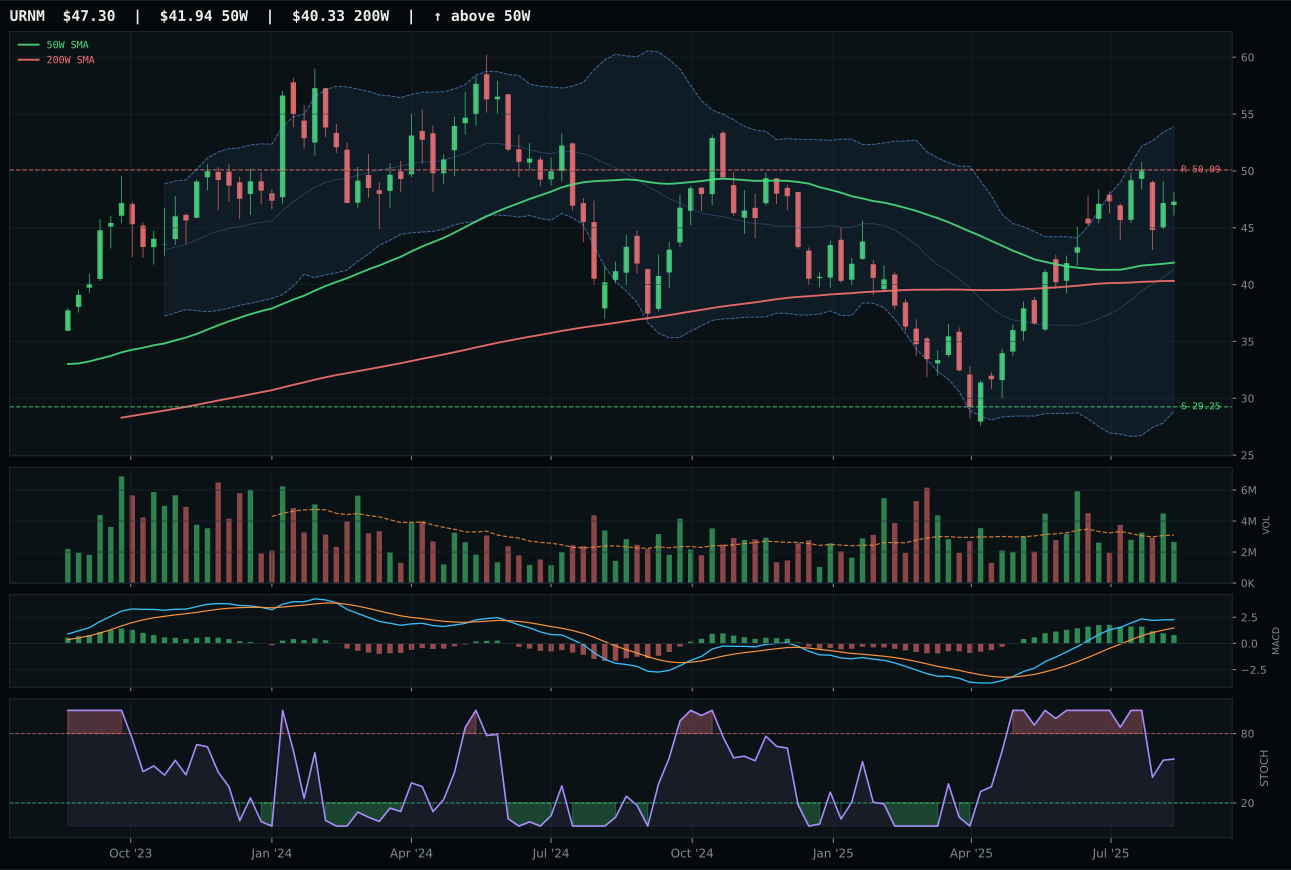
URNM has a neutral structure profile with 21.0% 13-week relative strength versus SPY.
A failed hold above support would weaken the setup.
Actionable but governed by invalidation levels.
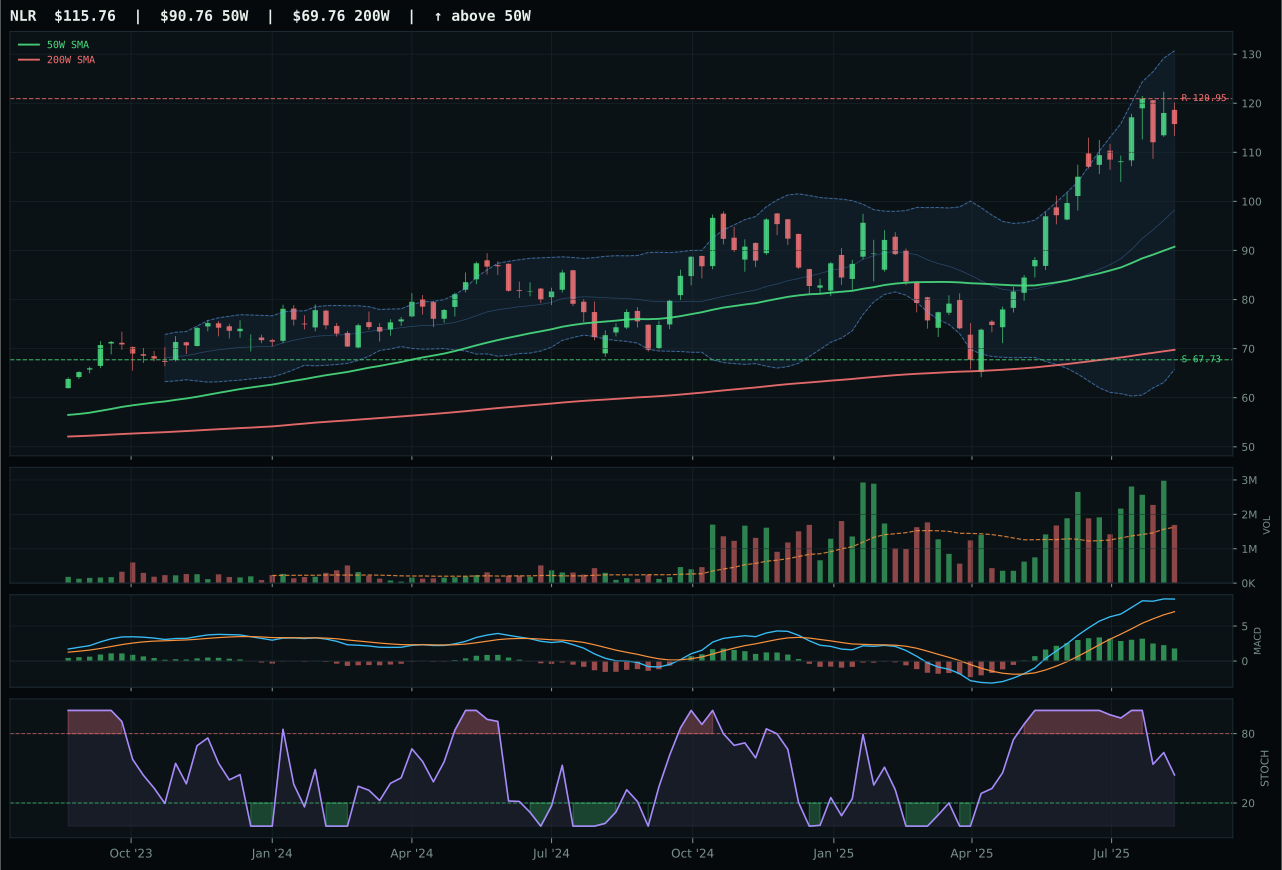
NLR has a vertical extension profile with 23.2% 13-week relative strength versus SPY.
A failed hold above support would weaken the setup.
Actionable but governed by invalidation levels.
NLR wins a photo-finish over URA because of marginally cleaner structure (73.6 vs. 72.9), even though both sit vertically extended and deliver identical momentum confirmation of 100.0. NLR's 31.5% 13-week return and 23.2% SPY-relative strength are legitimately compelling, and the setup is vertical extension rather than a total blow-off, which means the move retains some dignity. URA's 40.8% 13-week return and 32.5% relative strength are more aggressive—a sign that capital is pursuing it more desperately—and that desperation is itself a timing signal: URA's category-relative strength of 9.3% shows it is outrunning its peers, exactly when that outrun is most dangerous. NLR's stochastic RSI is falling and neutral at the entry point, suggesting a pause for absorption before the next leg; URA's is in the same condition, but from a higher absolute level and with a larger extension behind it.
Nuclear Energy scored 63.2/100, ranking second among all ten categories alongside Industrial Metals, and earned twenty percent allocation as a conviction conviction position on energy security and AI data-center power demands. The category-level macro fit is 50/100—neutral—but the real asset sponsorship descriptor (plus-7) and AI growth sponsorship (plus-5) provide dual tailwinds. The portfolio's allocation to NLR specifically reflects the unique confluence: nuclear energy is no longer a defensive utility play; it is positioning as critical infrastructure for AI buildout, combining steady cash flows with secular growth. NLR's momentum confirmation of 100/100 and persistence at 80.3 indicate institutional capital is rotating into the space with conviction. The risk: 27.5% extension leaves limited upside to the 120.95 resistance target, and any shift in AI capex expectations or rate-policy reversal could trigger mean reversion. Monitor for a breakdown below 67.73 support as the stop-loss signal; until then, the position reflects portfolio's highest-conviction macro bet.
AI — BOTZ
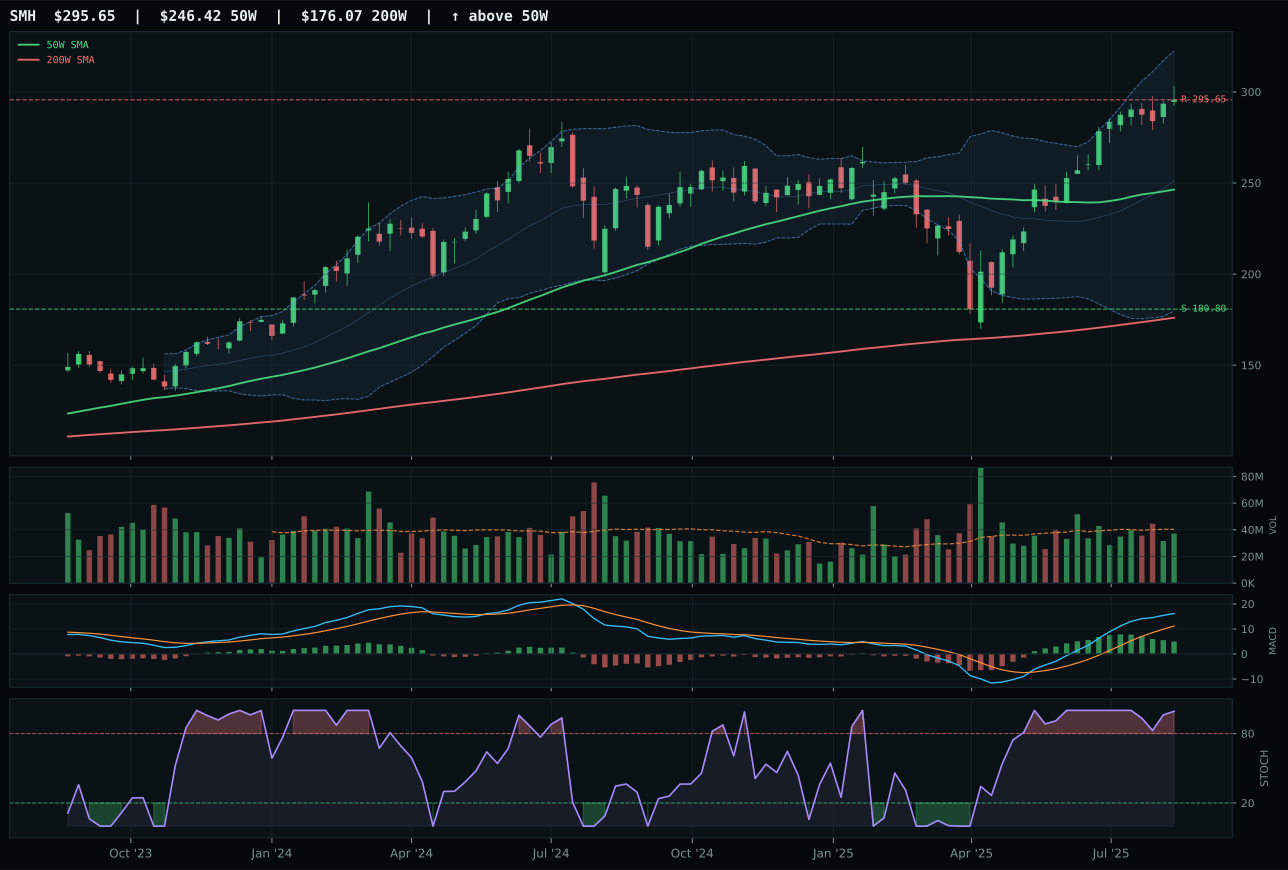
SMH has a vertical extension profile with 11.7% 13-week relative strength versus SPY.
A failed hold above support would weaken the setup.
Actionable but governed by invalidation levels.
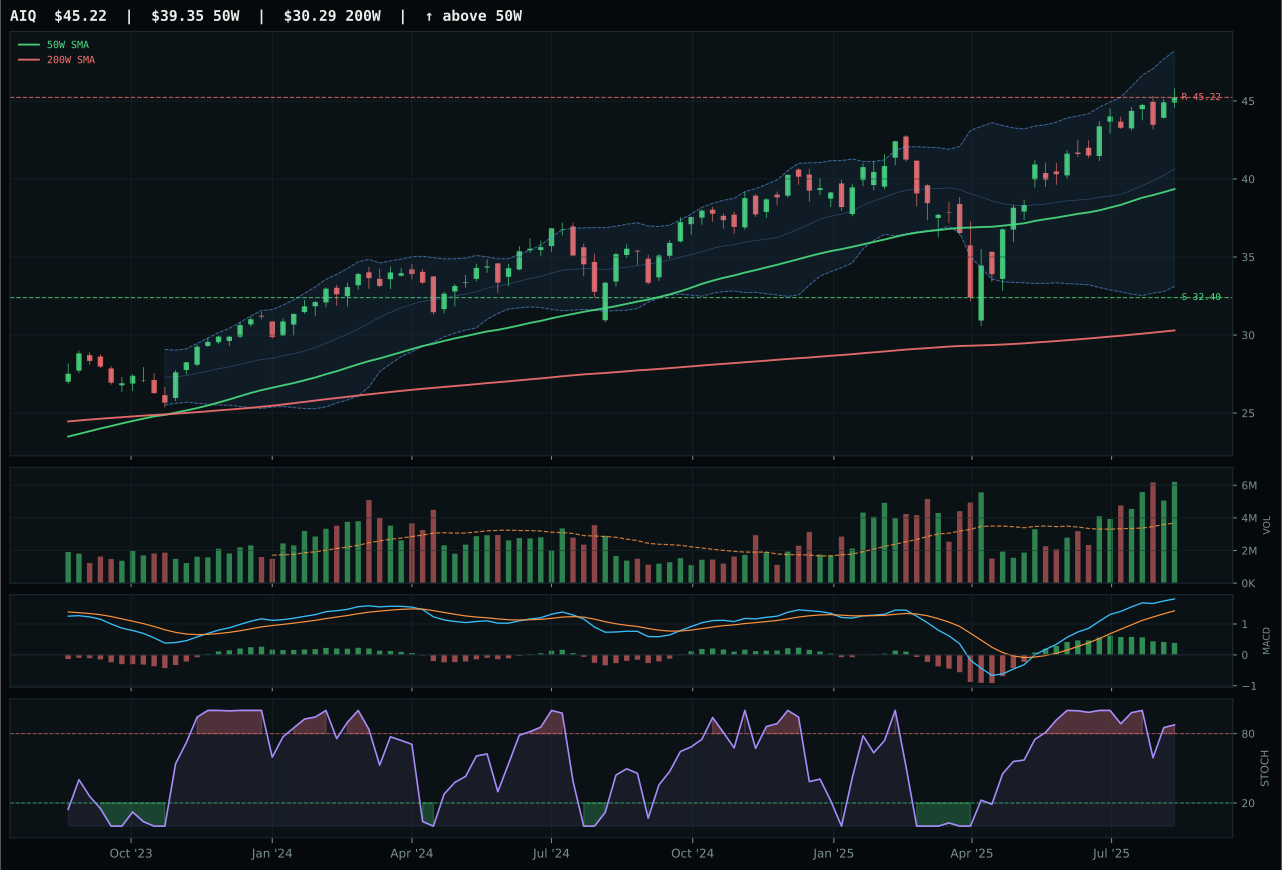
AIQ has a neutral structure profile with 2.2% 13-week relative strength versus SPY.
A failed hold above support would weaken the setup.
Actionable but governed by invalidation levels.
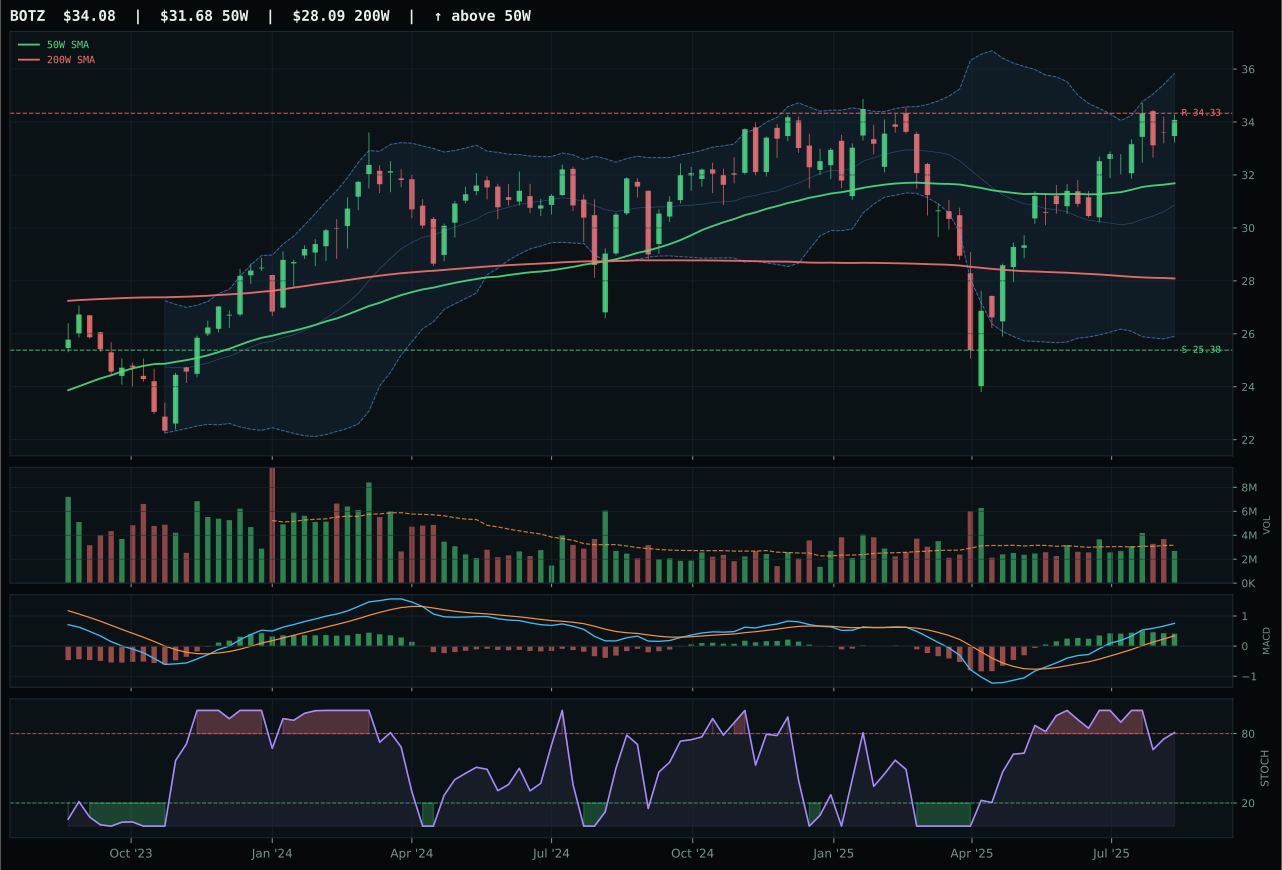
BOTZ has a neutral structure profile with 0.9% 13-week relative strength versus SPY.
A failed hold above support would weaken the setup.
Actionable but governed by invalidation levels.
BOTZ wins by defending a cleaner entry point while the category's other candidates overstay their welcome at the top of the move. At 7.6% above the 50-week, BOTZ offers measurably better timing (52.0 vs. 32.0) than SMH, which sits 20.0% extended and is facing the hard reality that every new buyer at those levels is late. BOTZ's 9.2% 13-week return and 0.9% SPY-relative strength are respectable without being euphoric, while SMH's 20.0% 13-week return and 11.7% relative strength represent the exact kind of vertical extension that punishes entry risk. Stochastic RSI overbought conditions appear in both charts, but SMH's are steeper and more prone to rollover; BOTZ's are cooling more gradually, suggesting less immediate distribution pressure.
AI earned a five percent allocation despite scoring 60.1/100 and placing outside top-two categories because the macro descriptor for AI growth sponsorship remains active at plus-14, providing category-level tailwind. However, SMH's superior technical evidence (70.6 vs. 51.4) and higher absolute momentum (20.0% thirteen-week return) indicate the category's best setups are already extended; the reasoned basket score started at 63.6, suggesting the category contained stronger candidates that the timing filter rejected. The allocation reflects a holding pattern: genuine AI exposure exists, but entry risk has become acute. The category would need either a category-wide pullback to reset extension metrics or BOTZ to demonstrate volume confirmation at current levels to justify elevation to top-two status.
Utilities & Infrastructure — IGF
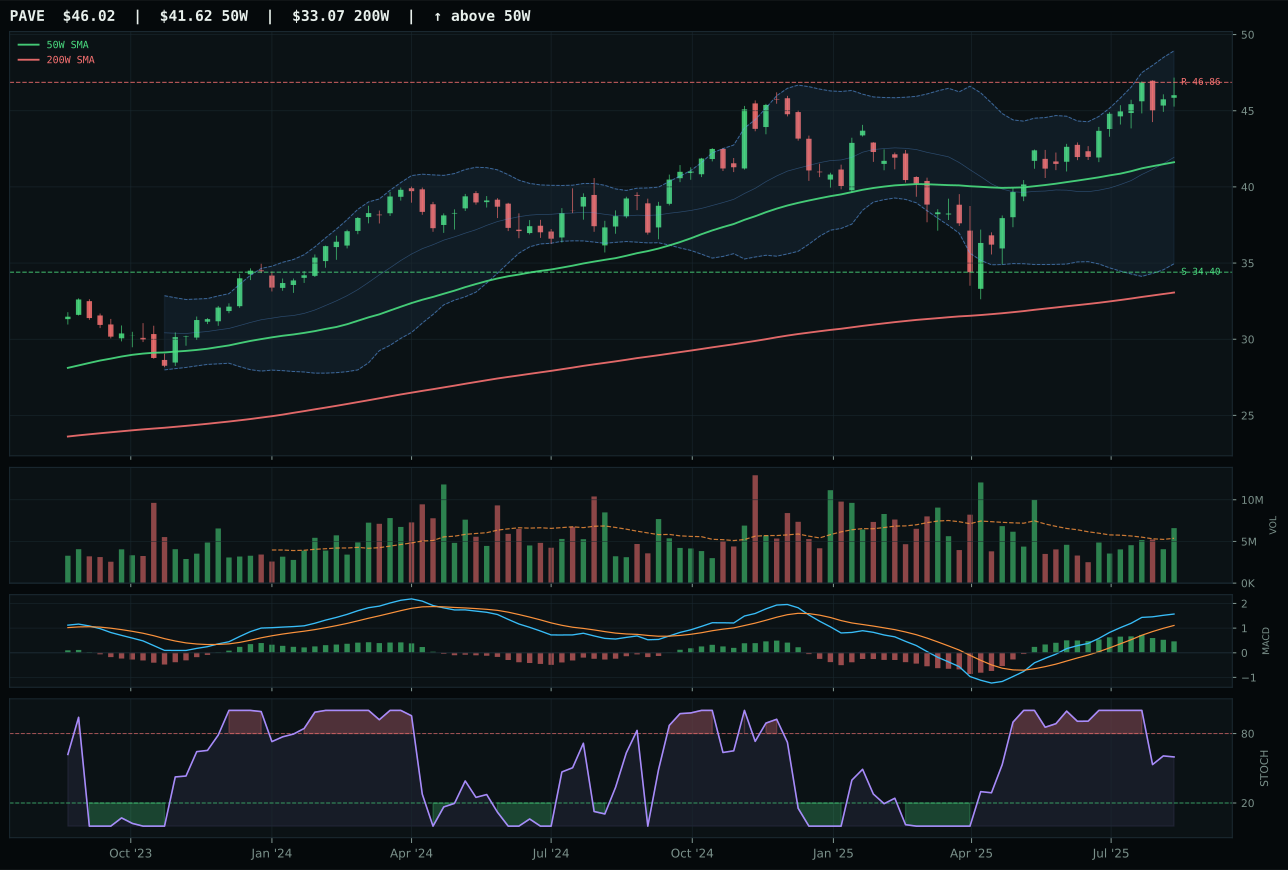
PAVE has a neutral structure profile with 0.3% 13-week relative strength versus SPY.
A failed hold above support would weaken the setup.
Actionable but governed by invalidation levels.
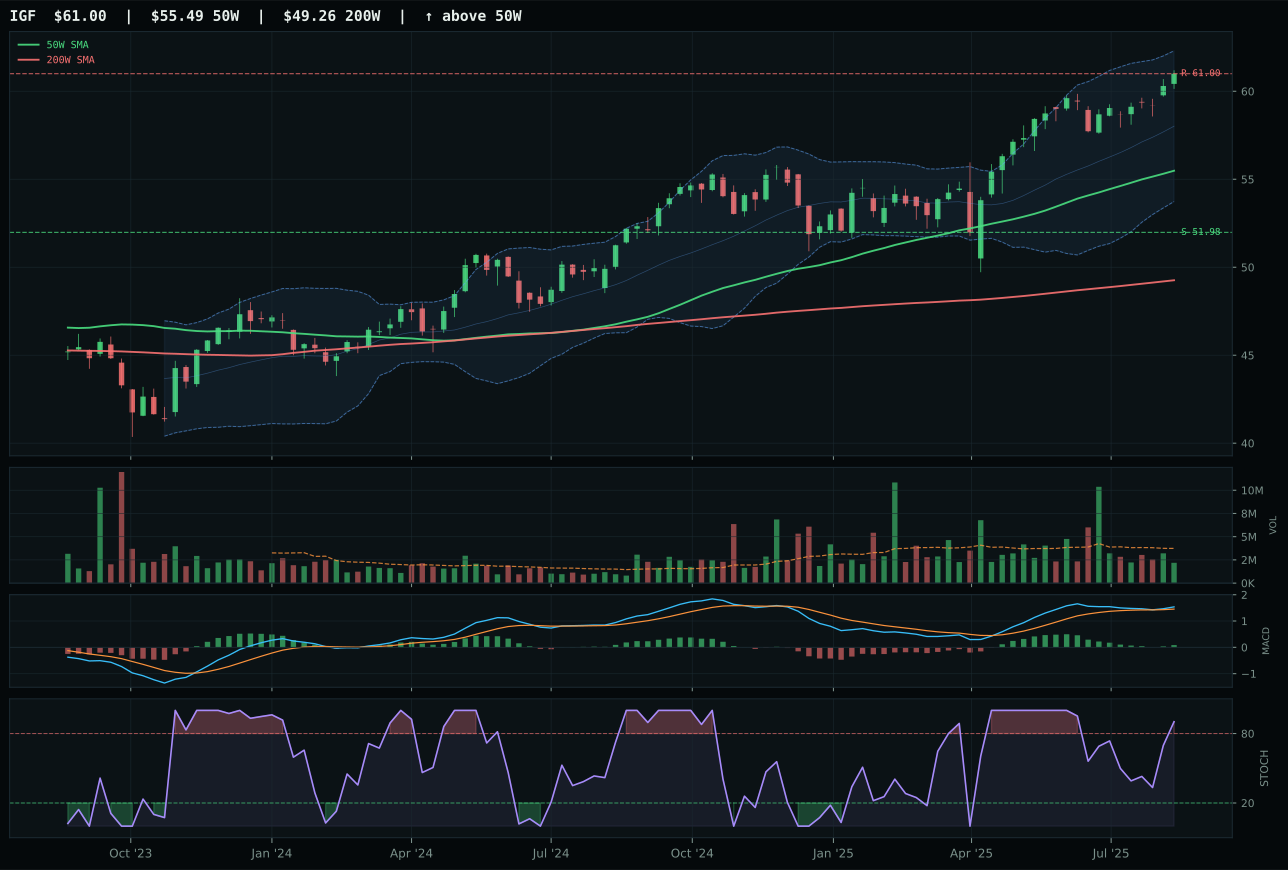
IGF has a neutral structure profile with -3.9% 13-week relative strength versus SPY.
A failed hold above support would weaken the setup.
Actionable but governed by invalidation levels.
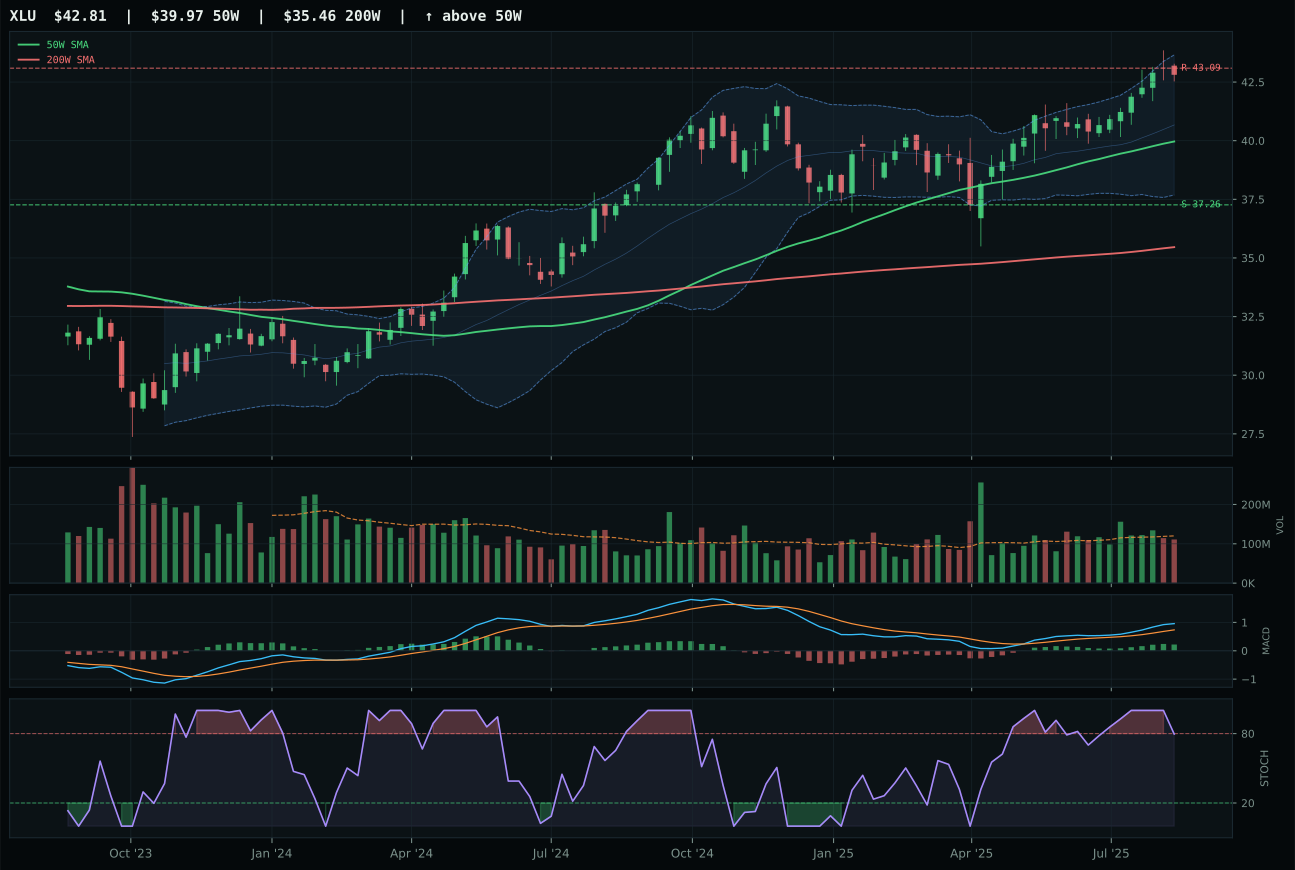
XLU has a neutral structure profile with -4.1% 13-week relative strength versus SPY.
A failed hold above support would weaken the setup.
Actionable but governed by invalidation levels.
IGF wins despite being technically similar to XLU and PAVE because MACD is bullish and improving (not flattening), which signals continued accumulation rather than momentum exhaustion. All three ETFs sit in neutral structure with price 9-10% above the 50-week and MACD bullish, but IGF's cleaner MACD trajectory combined with a respectable 75.0 timing score gives it the edge. PAVE's timing score of 62.0 lags because stochastic RSI is falling and the MACD is already flattening—signs that the move has lost its initial momentum. IGF's 4.4% 13-week return is modest, but it is paired with 0.0% category-relative strength (matching the peer median) and bullish momentum continuation, which means the position is neither exhausted nor complacent. Volume participation at 0.58x is thin, but no worse than its peers.
Utilities & Infrastructure scored 58.5/100, placing fifth among ten categories and earning five percent allocation as a defensive income position. The category-level macro fit is 49/100—neutral—with the mixed transition regime providing a plus-4 tailwind and liquidity stress offsetting at minus-3. The real asset sponsorship narrative is weak in this category compared to precious metals or industrial metals, and risk-appetite negative (-2) signals that utilities are being viewed as rate-sensitive rather than growth-supportive. IGF's international infrastructure positioning offers diversification benefit, but the thirteen-week return of 4.4% with minus-3.9% SPY underperformance confirms utilities are lagging the broader market. The allocation reflects portfolio need for ballast rather than conviction growth; thin volume at 0.58x average means the position is size-sensitive. Watch for volume acceleration above 0.8x average to signal institutional accumulation, or a close below 51.98 support to trigger exit. This is a stable, unexciting five percent—appropriate for a transition regime.
Precious Metals — GDX
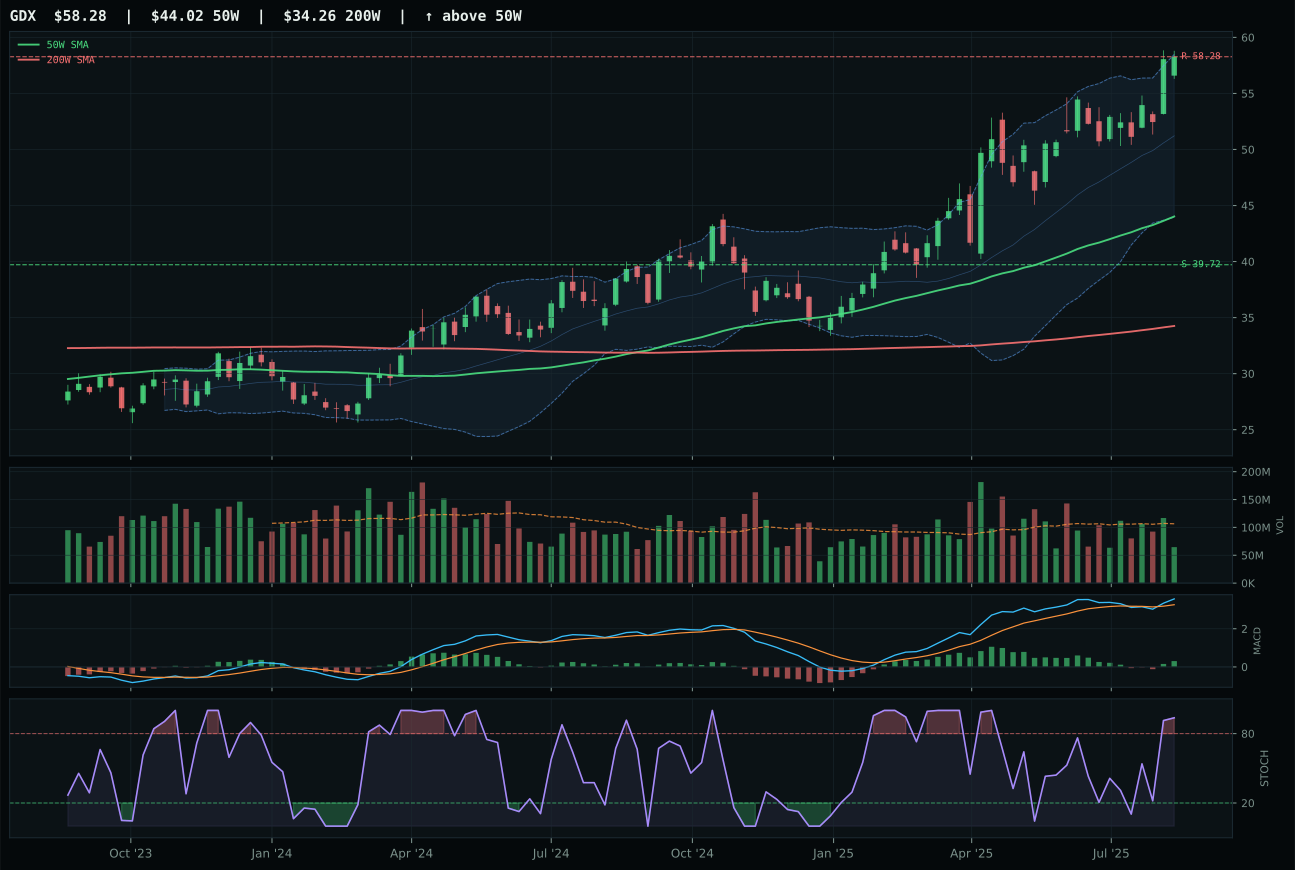
GDX has a vertical extension profile with 17.5% 13-week relative strength versus SPY.
A failed hold above support would weaken the setup.
Actionable but governed by invalidation levels.
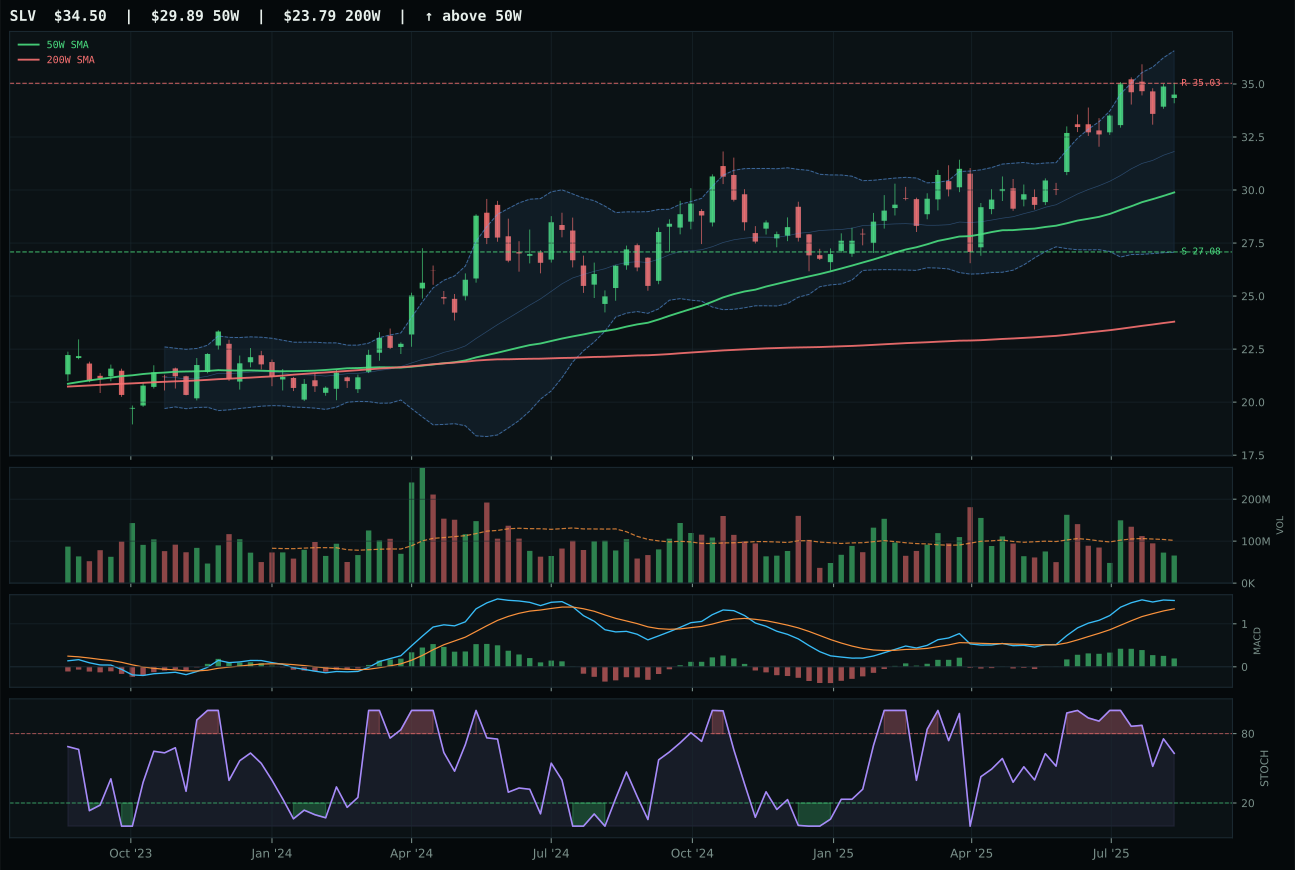
SLV has a vertical extension profile with 9.5% 13-week relative strength versus SPY.
A failed hold above support would weaken the setup.
Actionable but governed by invalidation levels.
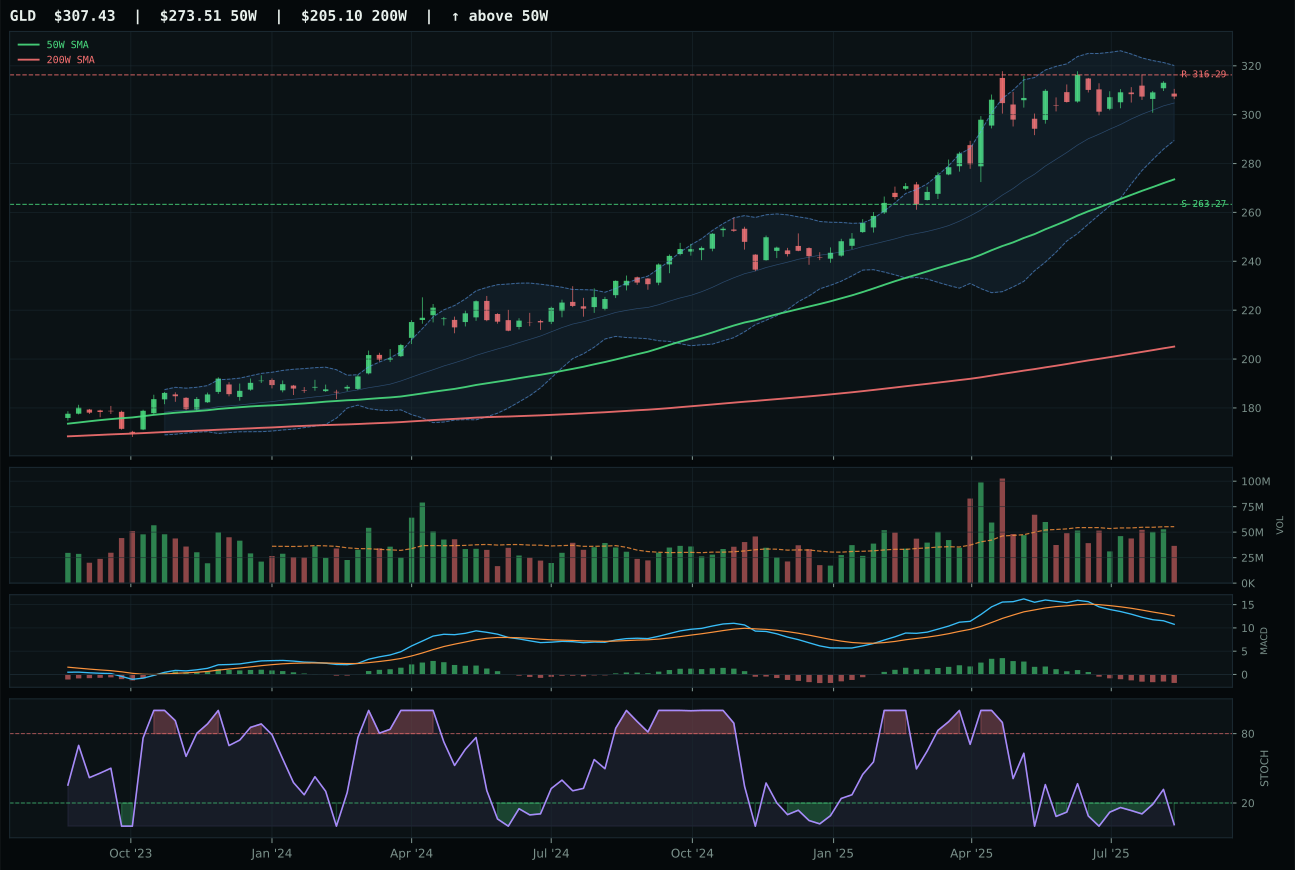
GLD has a neutral structure profile with -3.8% 13-week relative strength versus SPY.
A failed hold above support would weaken the setup.
Actionable but governed by invalidation levels.
GDX wins despite being a technical laggard in the category because its momentum compression is so extreme that it qualifies as leadership by exclusion. GDX's 25.8% 13-week return and 100.0 momentum confirmation score represent the kind of move that has already priced in most bullish scenarios, yet it still carries 17.5% SPY-relative strength—a reflection of genuine monetary and scarcity narratives supporting gold miners. SLV's technical profile is actually cleaner on several measures: MACD is less extended, stochastic RSI is falling rather than overbought, and structure is less stretched at upper retracement. Yet SLV's category-relative strength remains anchored at zero while GDX leads at 8.0%, and that relative leadership, combined with MACD continuation (bullish and improving vs. bullish but flattening), was enough to push GDX across the line despite worse entry risk.
Precious Metals earned five percent allocation at 51.1/100, placing fifth among ten categories, primarily as a hedge against the active credit stress descriptor (net minus-16 at the category level) despite positive liquidity stress offsetting modestly. GDX is extended 32 percent above its fifty-week moving average—a position where upside asymmetry has inverted—yet the portfolio holds because metals scarcity remains structurally sound and the monetary environment is supportive of real assets. The macro fit of 38/100 is weak, reflecting the mixed transition regime's ambiguity around inflation and safe-haven demand. SLV's technical evidence is slightly superior, but GDX's hundred-point momentum confirms that this category's value proposition is momentum-driven rather than mean-reverting. The allocation holds until either GDX closes below 39.72 support or volume dries below 0.4x average; neither condition exists yet, but the extension demands active monitoring.
Defense & Aerospace — ITA
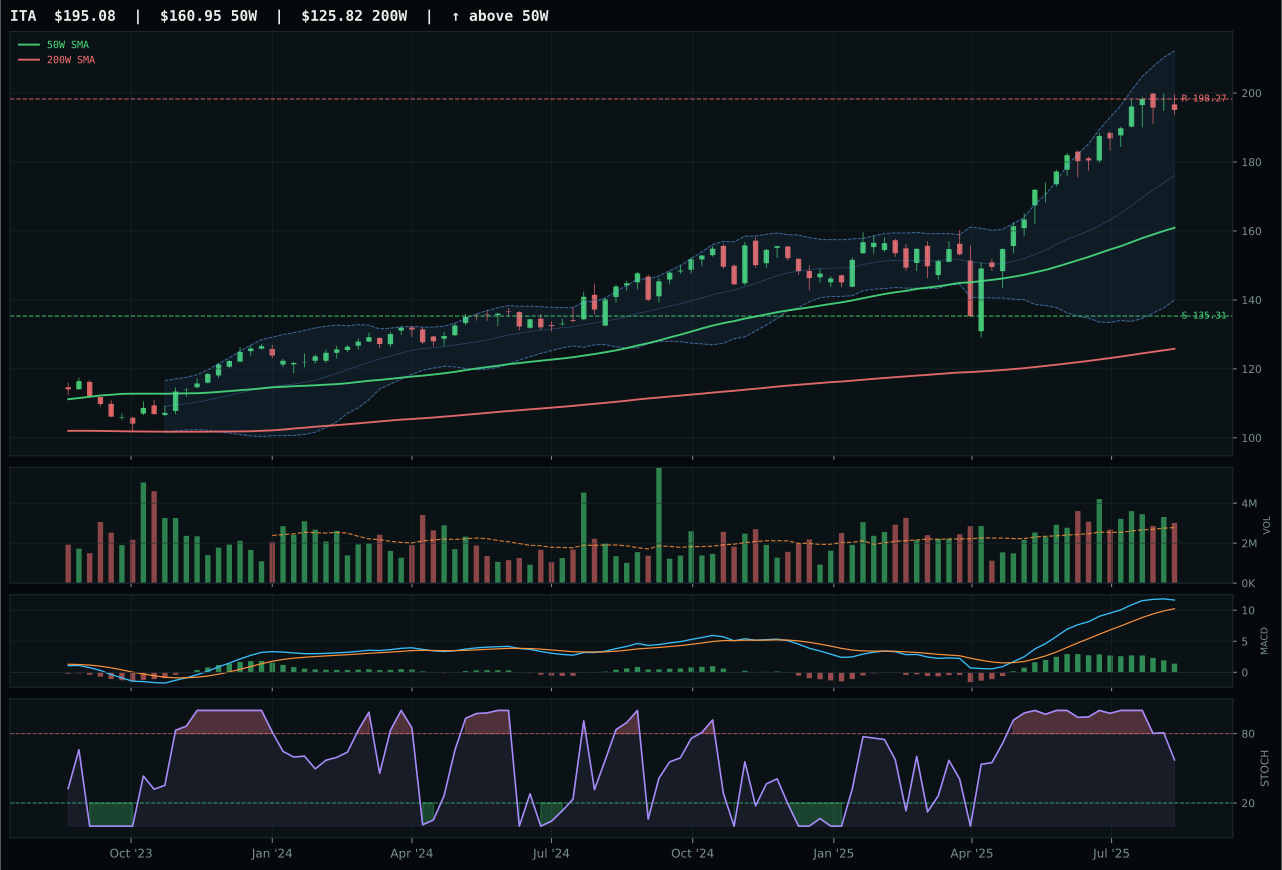
ITA has a vertical extension profile with 5.2% 13-week relative strength versus SPY.
A failed hold above support would weaken the setup.
Actionable but governed by invalidation levels.
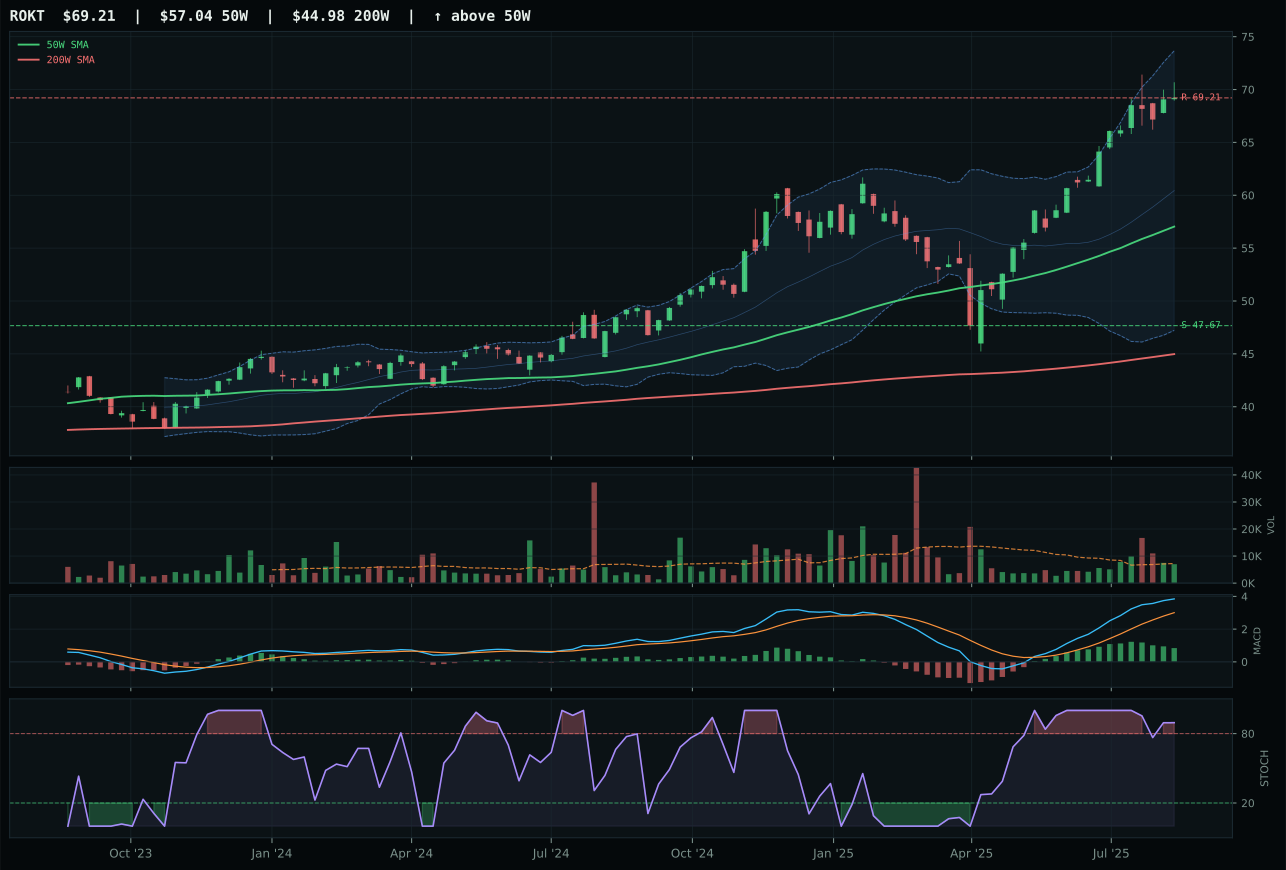
ROKT has a vertical extension profile with 9.9% 13-week relative strength versus SPY.
A failed hold above support would weaken the setup.
Tracked, but not top-2 eligible because: .
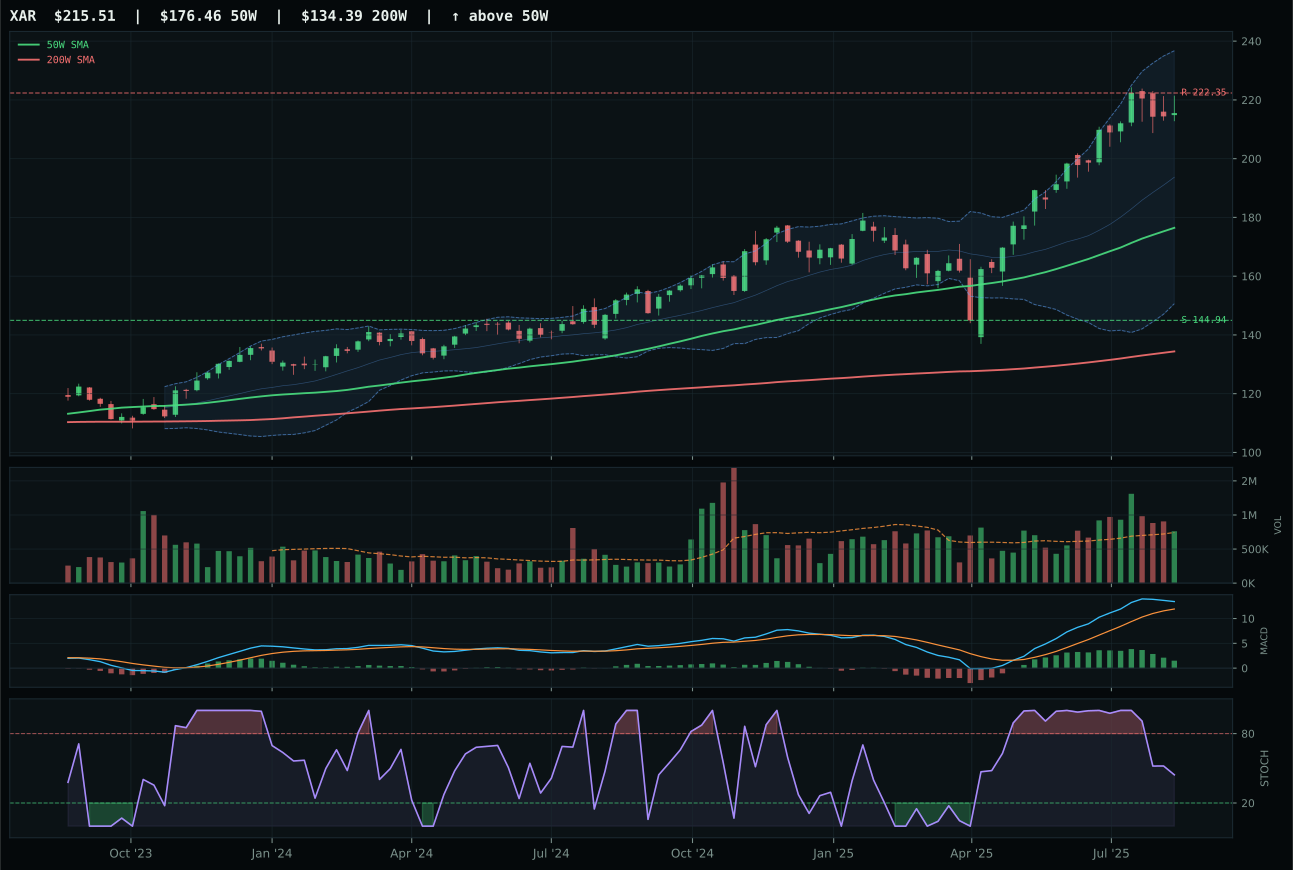
XAR has a vertical extension profile with 5.6% 13-week relative strength versus SPY.
A failed hold above support would weaken the setup.
Actionable but governed by invalidation levels.
ITA wins a close decision because its timing score of 40.0 materially beats ROKT's 22.0, even though both sit in vertical extension and both have MACD bullish but flattening. The difference is that ITA's stochastic RSI is falling and neutral at 0.57—a sign that momentum is cooling without panic—while ROKT's is overbought and rolling over at the worst possible juncture. ITA's 13.5% 13-week return and 5.2% SPY-relative strength match ROKT's nominal momentum scores, but ROKT's higher relative strength (9.9% vs. -0.4% in category terms) betrays the exact problem: it has run further ahead of its peers and is more vulnerable to snap-backs. ITA's 21.2% extension from the 50-week is steep, but the flat stochastic reading suggests consolidation rather than imminent reversal.
Defense & Aerospace scored 50.4/100, placing fifth among categories and earning a five percent tactical allocation. The category benefits minimally from the active macro descriptor set: credit stress is near-neutral at plus-2, and liquidity stress extracts minus-4, leaving the category dependent on pure technical merit in a mixed transition regime. ITA's vertical extension and 13.5% momentum are legitimate, but the category's third-ranked ETF (ROKT) shows the weakness: extremely extended positioning with overbought stochastic, relying on continued appetite for aerospace beta. The allocation holds because defense durability remains structurally sound—above both key moving averages—but elevated entry risk prevents top-two consideration. A pullback to the fifty-week moving average at 135.31 would reset the risk-reward and potentially trigger reallocation.
Technology — XLK
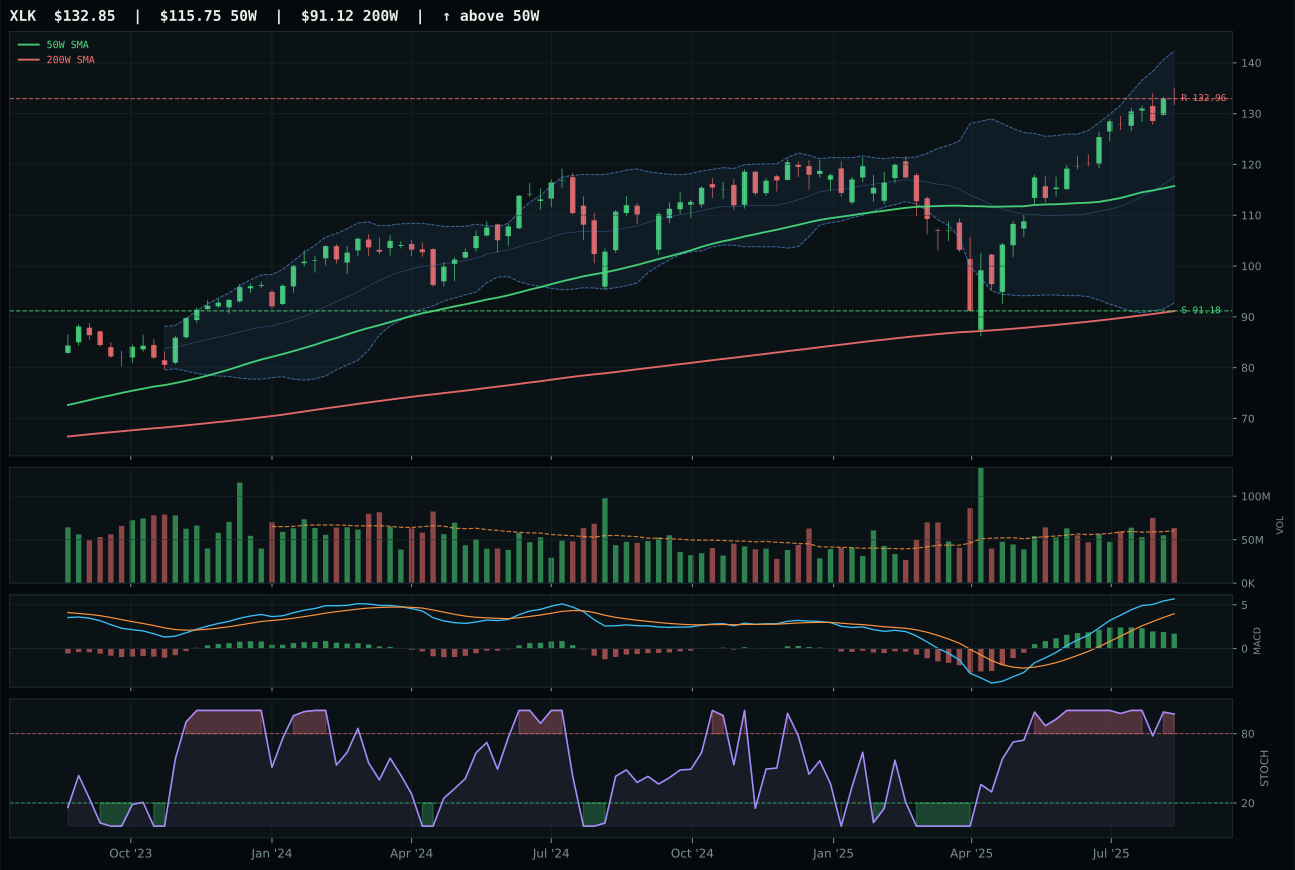
XLK has a neutral structure profile with 4.8% 13-week relative strength versus SPY.
A failed hold above support would weaken the setup.
Actionable but governed by invalidation levels.
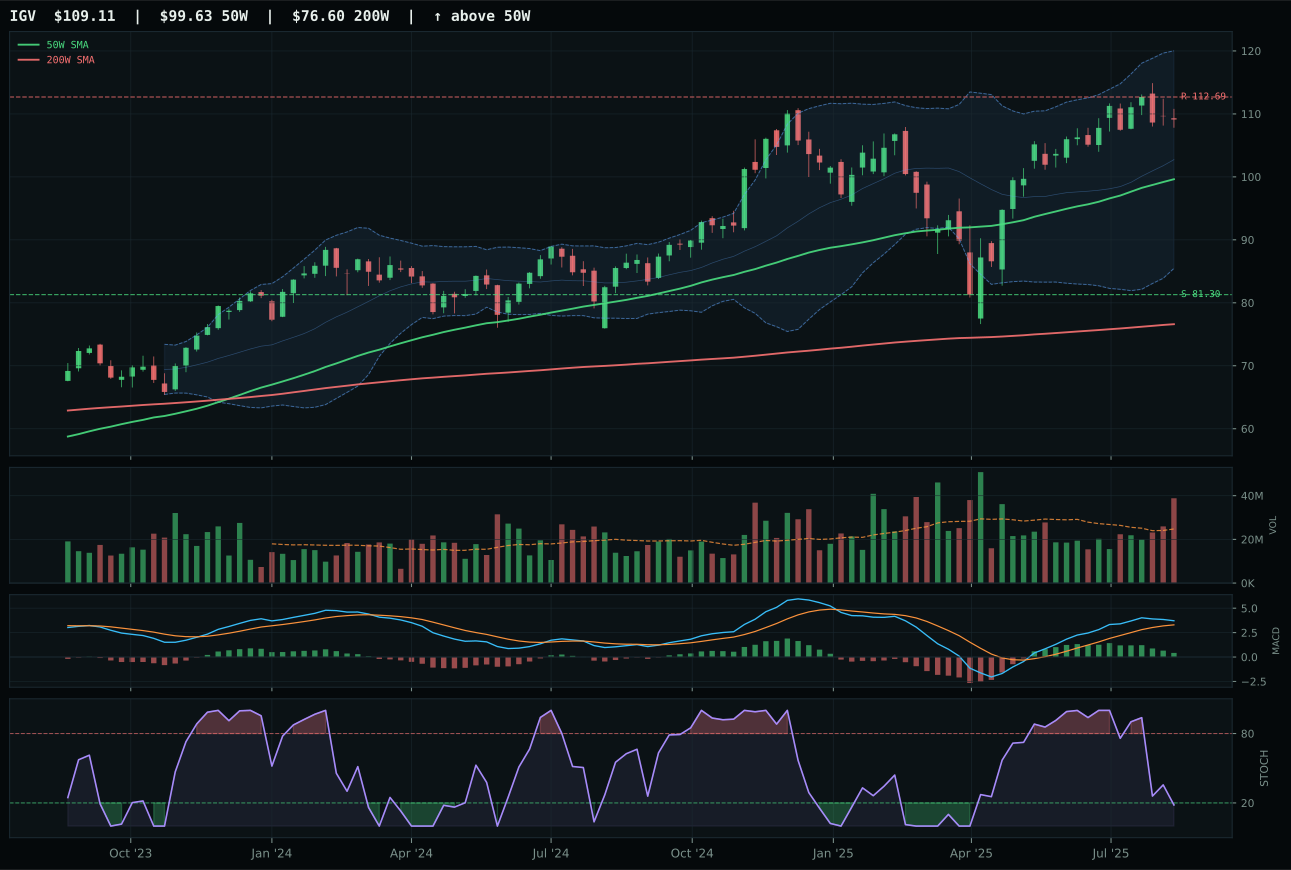
IGV has a neutral structure profile with -4.5% 13-week relative strength versus SPY.
A failed hold above support would weaken the setup.
Actionable but governed by invalidation levels.
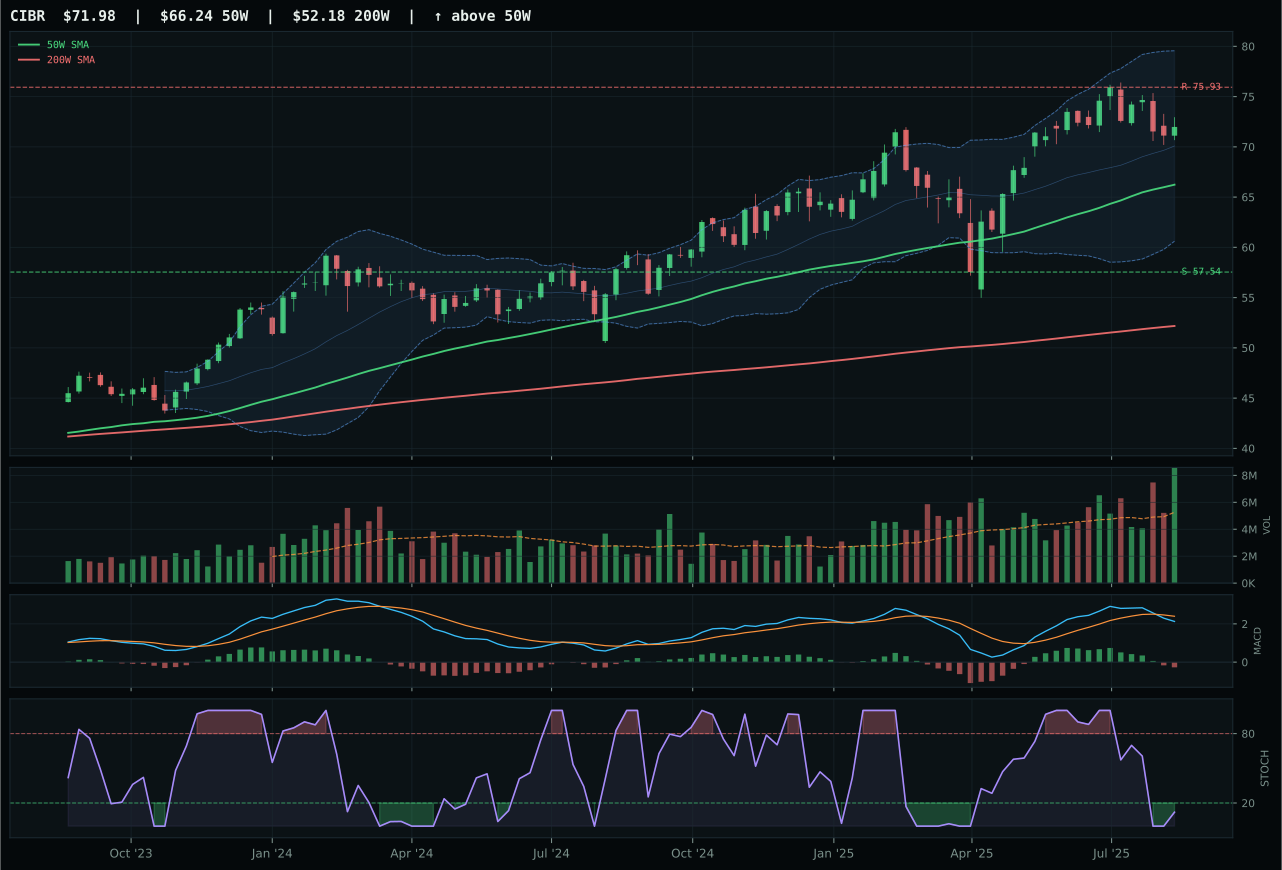
CIBR has a neutral structure profile with -7.5% 13-week relative strength versus SPY.
A failed hold above support would weaken the setup.
Actionable but governed by invalidation levels.
XLK wins the category because it combines trend completion with category-relative strength that its peers cannot match. Price sits 15.0% above the 50-week moving average with a gentle upslope, delivering a perfect 100.0 trend score, but the real edge lies in 9.4% outperformance versus the category median—a signal that institutional capital is accumulating this name over enterprise software (IGV) and cybersecurity (CIBR). IGV stumbled because its 13-week return of 3.8% trails XLK's 13.1% by 520 basis points, while MACD confirmation weakened from bullish to a flattening signal and category-relative strength dropped to zero. XLK's volume-price signature shows neutral sponsorship at 1.05x the 20-week average—neither rushed entry nor distribution—which means the 100-basis-point momentum edge is being absorbed, not rejected.
Technology ranked outside the top-two allocation slots this week at 46.2/100, landing fifth in final category scoring. The macro regime penalizes duration-sensitive growth despite the AI sponsorship descriptor being active at plus-6; liquidity stress and credit stress combined to net minus-16 at the category level, offsetting the +9 risk-appetite contribution. XLK's five percent allocation reflects the portfolio's need for diversified equity exposure in a mixed transition regime, but the risk asymmetry has shifted: price is 67 percent above the fifty-week compression zone, volume is neutral rather than accumulating, and MACD is bullish but rolling over. This is defensive positioning, not offensive capital deployment. Watch for either a pullback into support at 91.18 or a break above 132.96 to reset the entry risk profile.
Agriculture & Livestock — MOO
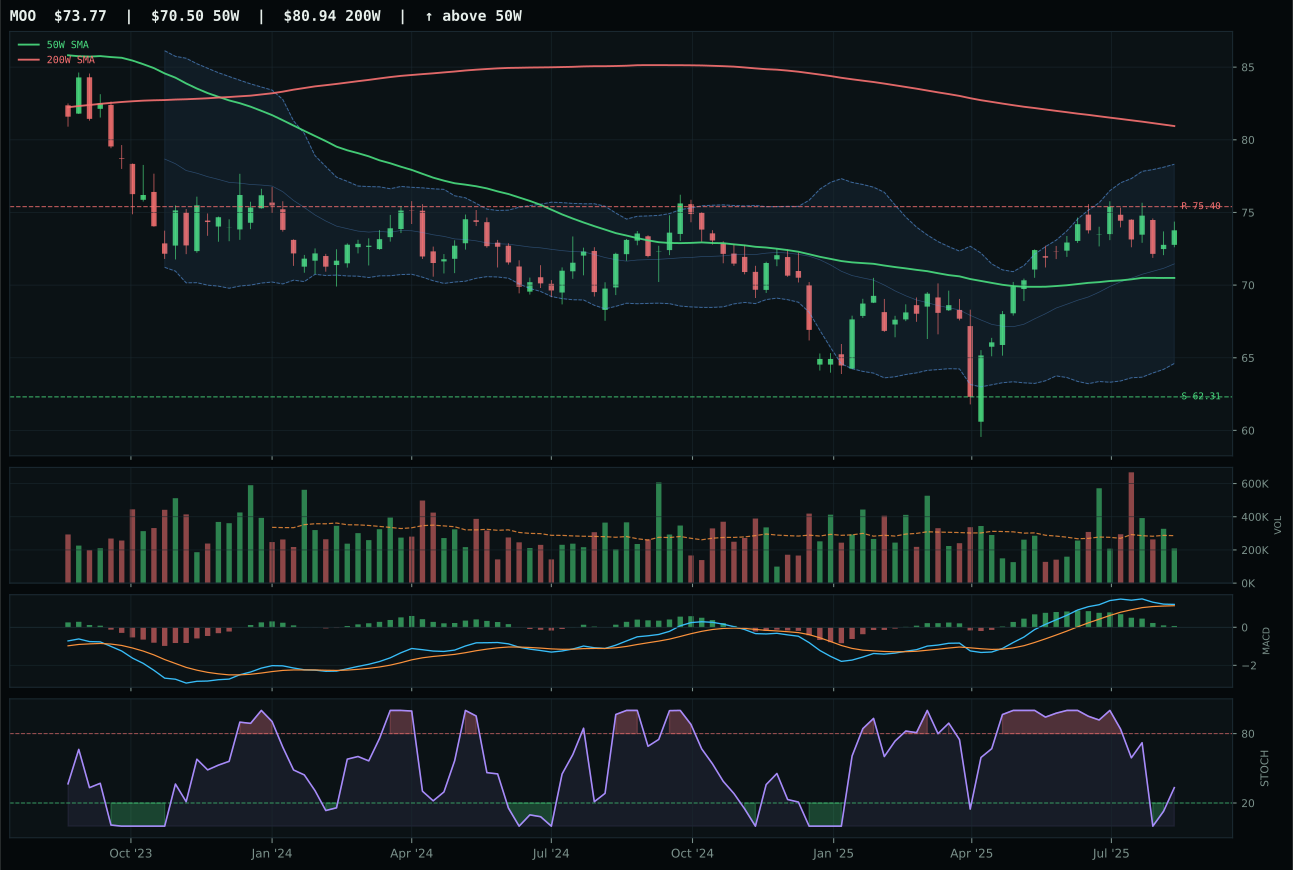
MOO has a neutral structure profile with -6.4% 13-week relative strength versus SPY.
A failed hold above support would weaken the setup.
Actionable but governed by invalidation levels.
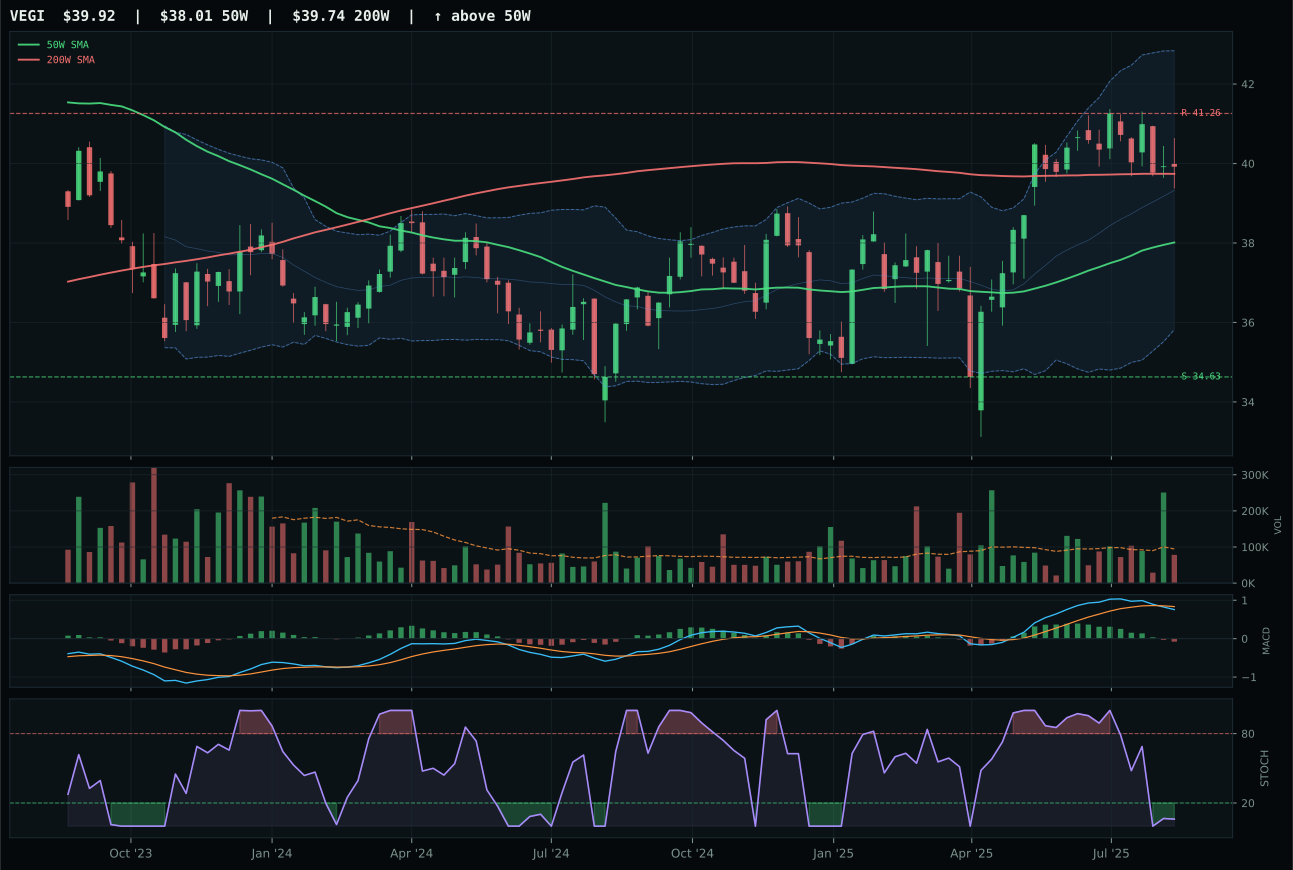
VEGI has a neutral structure profile with -9.7% 13-week relative strength versus SPY.
A failed hold above support would weaken the setup.
Tracked, but not top-2 eligible because: .
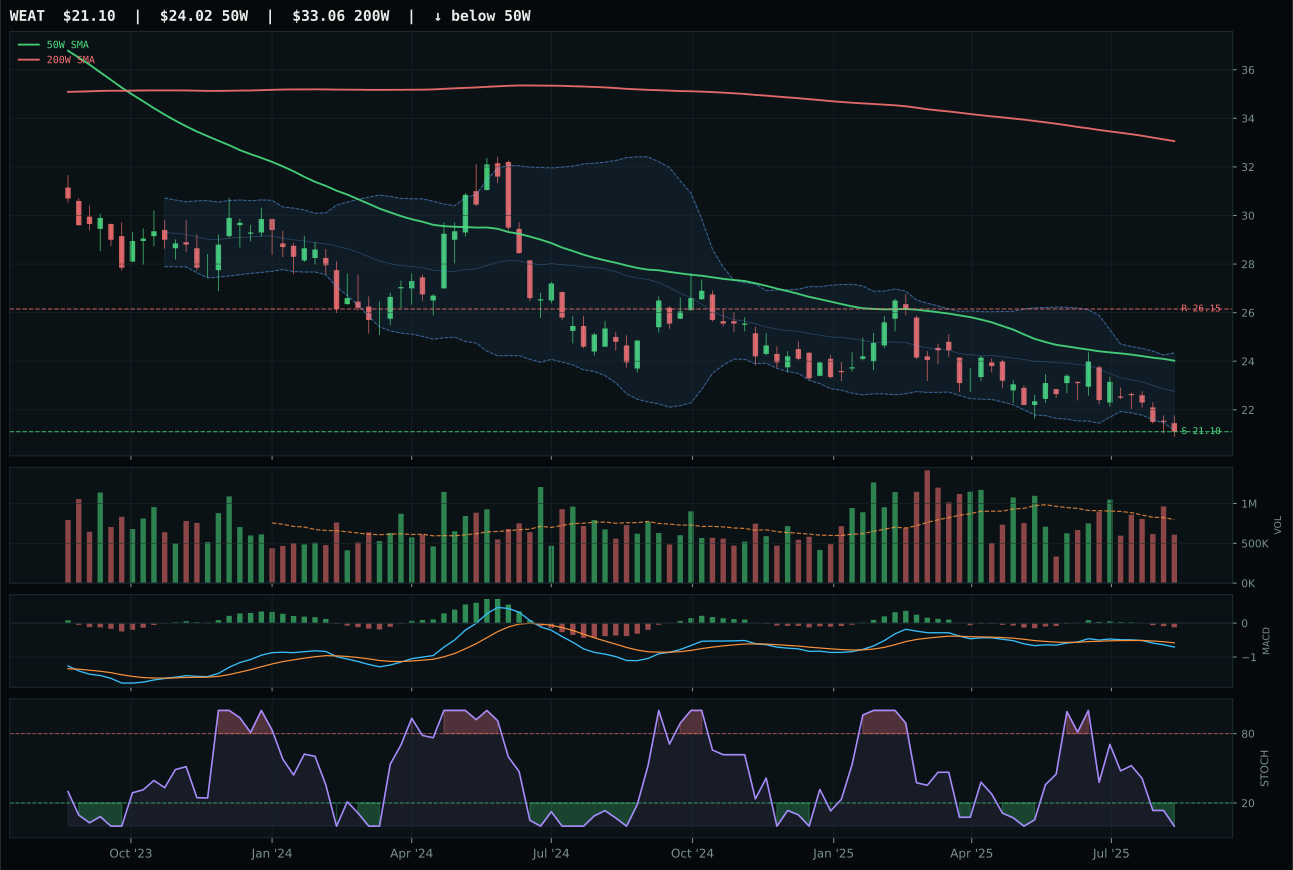
WEAT has a pullback into support profile with -13.9% 13-week relative strength versus SPY.
Extension and support failure are the main tactical risks.
Tracked, but not top-2 eligible because: structurally broken.
MOO wins the agriculture category despite a soft overall score because it is the only entry showing any technical credibility in a materially broken sector. Price sits just 4.6% above the 50-week with MACD bullish but flattening and stochastic RSI falling into neutral territory at 0.33—these conditions suggest a coil-like setup where a move has been prepared rather than extended. MOO's timing score of 85.0 reflects near-perfect positioning at the 50-week; it is the only setup among the three that has not yet blown through resistance violently. VEGI collapsed to 24.4 composite because its MACD has weakened to bearish, stochastic RSI is oversold, and 13-week momentum is negative at -1.4%, signaling sellers control the tape. MOO's thin participation (0.73x 20-week average) is a liability, but it is offset by the fact that the structure has not yet deteriorated.
Agriculture & Livestock scored just 24.4/100, ranking ninth among ten categories, yet earned five percent allocation due to the portfolio's need for real asset diversification and positive commodity breadth descriptor activity at plus-5. This is not conviction; this is hedge positioning. The category-level macro fit is 59/100—a illusion created by real asset sponsorship (plus-8) and commodity breadth (plus-5) offsetting minus-4 liquidity stress. MOO's actual setup is precarious: thin volume at 0.73x average means any news triggers outsized moves, and negative SPY relative strength of minus-6.4% confirms this exposure is fighting the broader tape. The five percent holds defensively, but any deterioration in MOO's structure below the fifty-week moving average or further volume contraction would justify immediate exit. This category needs genuine upside confirmation to justify higher allocation.
Emerging Markets — IEMG
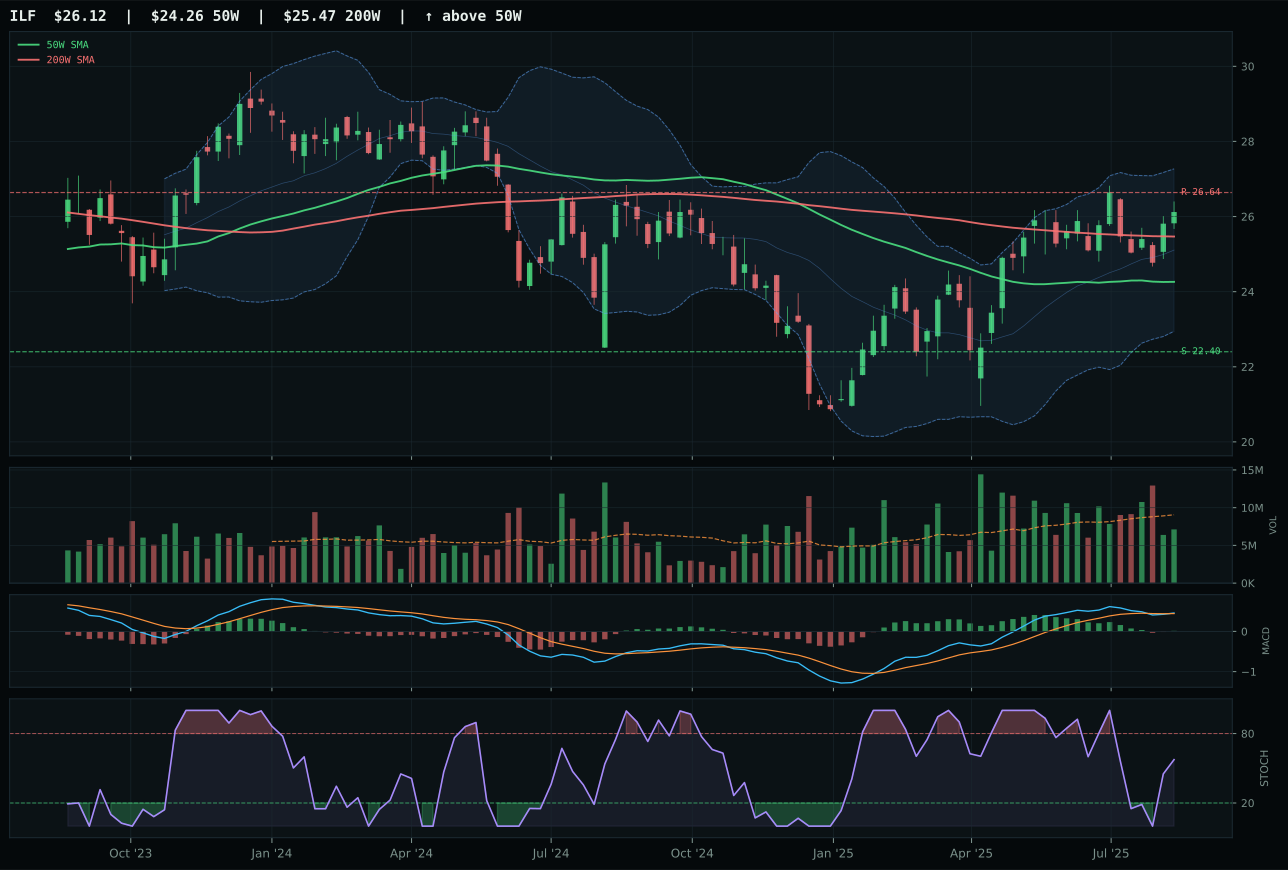
ILF has a neutral structure profile with -7.4% 13-week relative strength versus SPY.
A failed hold above support would weaken the setup.
Actionable but governed by invalidation levels.
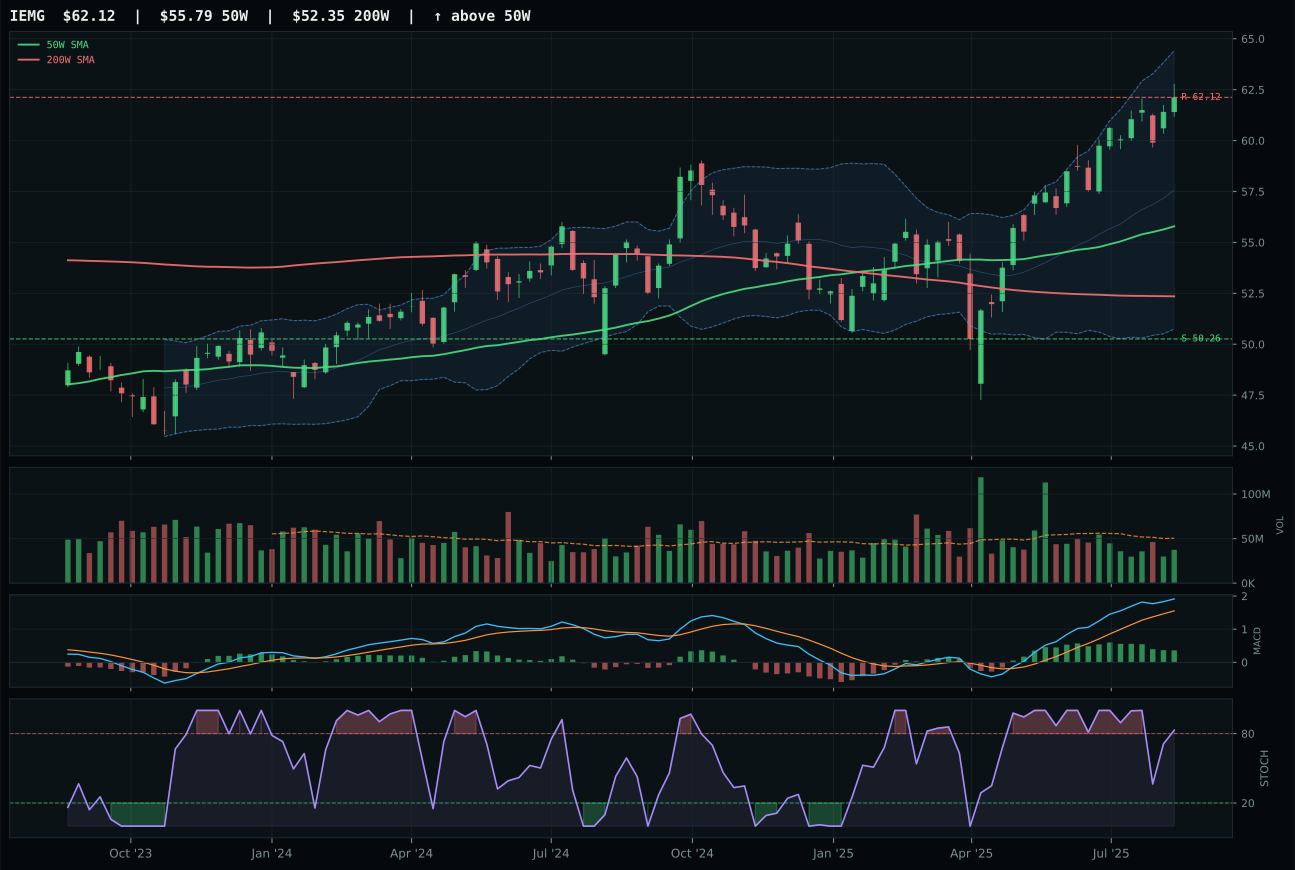
IEMG has a neutral structure profile with 0.1% 13-week relative strength versus SPY.
A failed hold above support would weaken the setup.
Actionable but governed by invalidation levels.
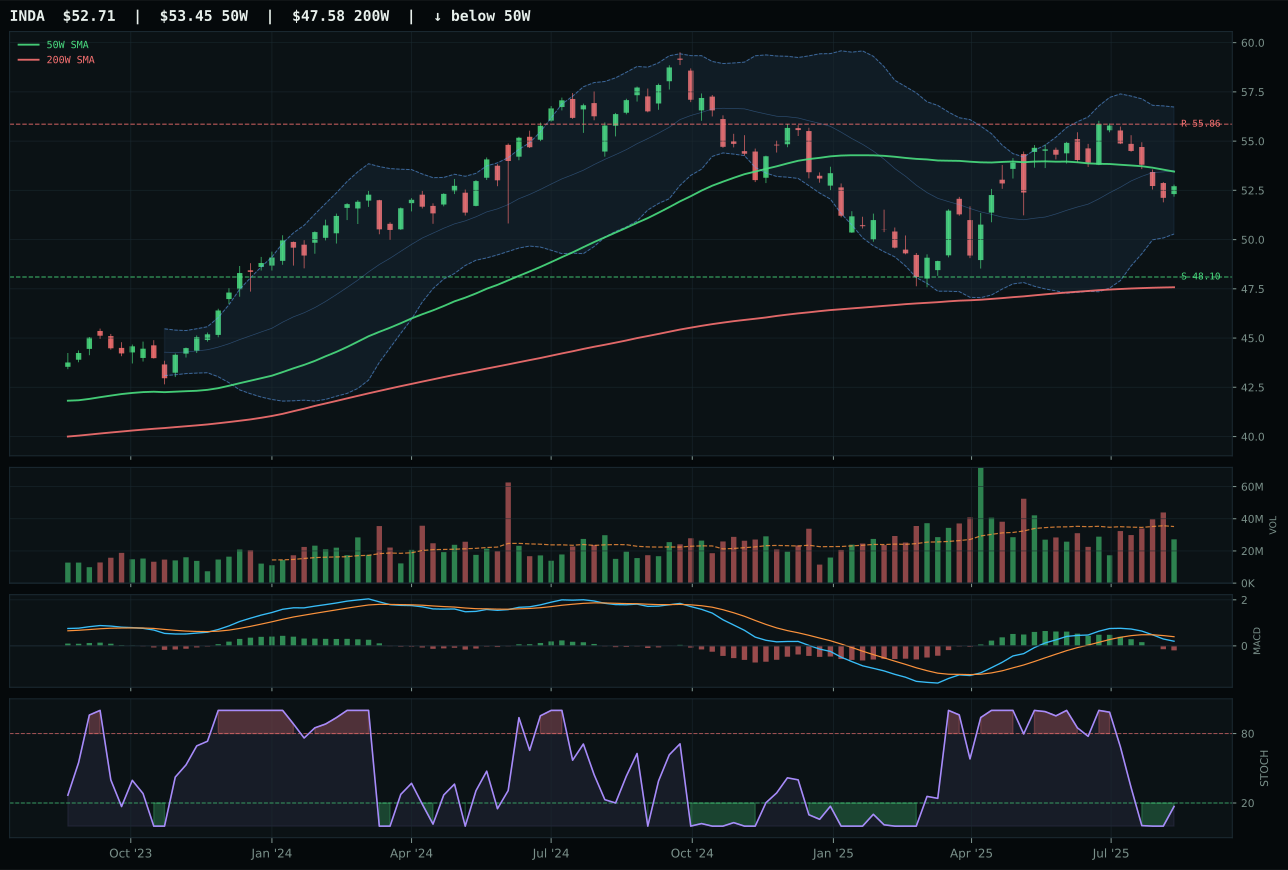
INDA has a compression near 50W profile with -11.9% 13-week relative strength versus SPY.
A failed hold above support would weaken the setup.
Actionable but governed by invalidation levels.
IEMG wins a marginal decision over ILF because of better category-relative strength (7.5% vs. 0.0%) and a slightly cleaner structure score (76.5 vs. 74.7), though the technical difference is immaterial. Both ETFs sit in similar positions—11-12% above the 50-week with neutral-to-overbought stochastic readings and bullish but flattening MACD. IEMG's real edge is its 8.4% 13-week return and 0.1% SPY-relative strength, which signal broad-based EM participation rather than a narrow commodity or currency bet. ILF's -7.4% SPY-relative weakness and flat 0.8% 13-week return reflect concentrated exposure to commodities and Latin American currency risk, which are struggling in the current macro. Neither setup is compelling on absolute terms, but IEMG's more balanced beta and category leadership tilt the scales in its favor.
Emerging Markets scored 22.9/100 and earned zero percent allocation—entirely excluded from the portfolio this week and ranking tenth among ten categories. The category is crushed by credit stress (minus-10) and liquidity stress (minus-10) in the macro descriptor set, overwhelming the plus-8 risk-appetite contribution. IEMG's technical evidence is 55.3/100—below the portfolio median—driven by thin volume participation (0.74x average), overbought stochastic rolling over, and zero SPY outperformance despite price above both major moving averages. This is a category fighting the regime: a mixed transition environment penalizes emerging-market sensitivity to credit stress and liquidity shock risk. The portfolio would require a sustained improvement in the risk-appetite descriptor (from active to strongly confirmed) and volume acceleration above 1.0x average in IEMG to justify even a five percent speculative allocation. Emerging markets remain structurally weak; capital is better deployed in domestic alternatives.
Traditional Energy — XLE
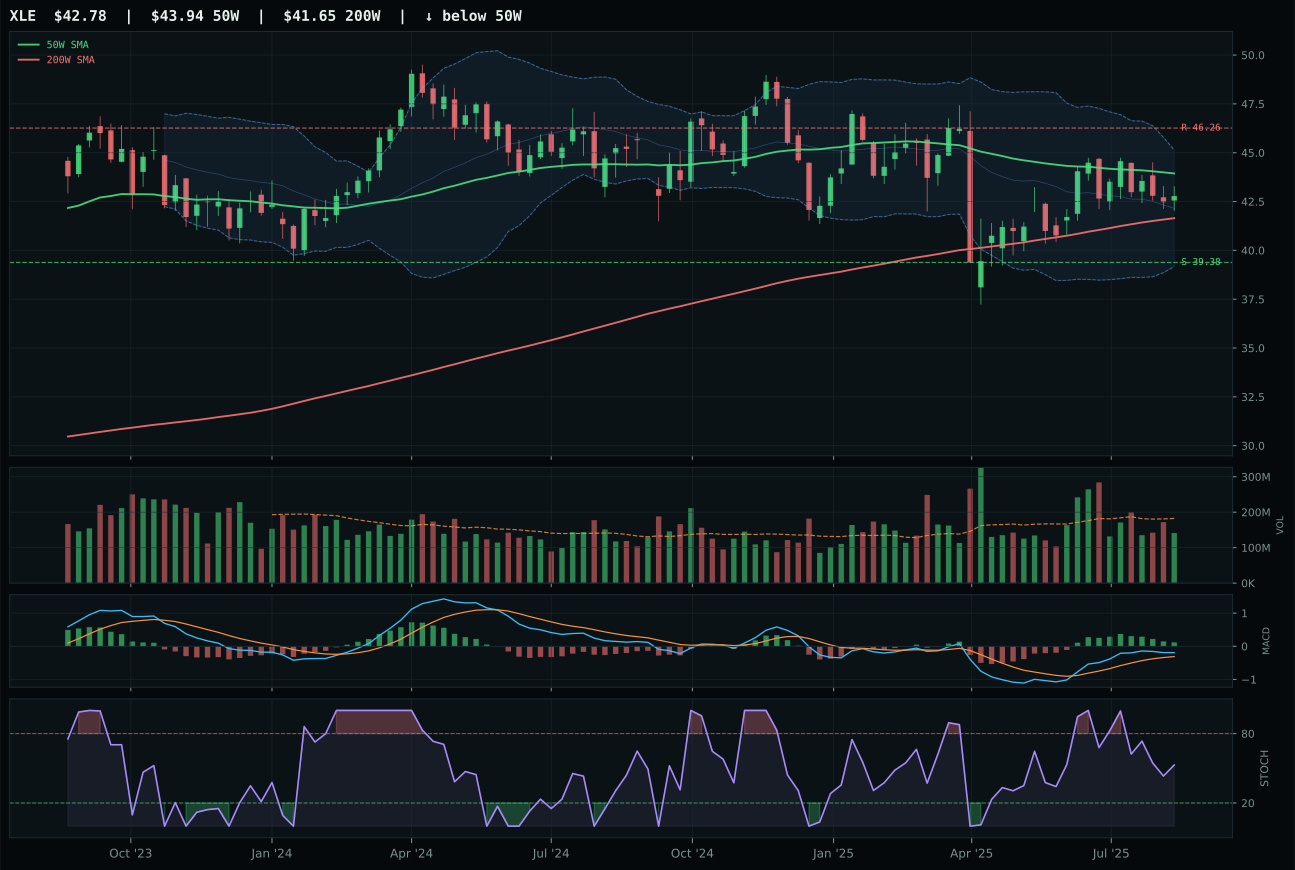
XLE has a compression near 50W profile with -8.2% 13-week relative strength versus SPY.
A failed hold above support would weaken the setup.
Actionable but governed by invalidation levels.
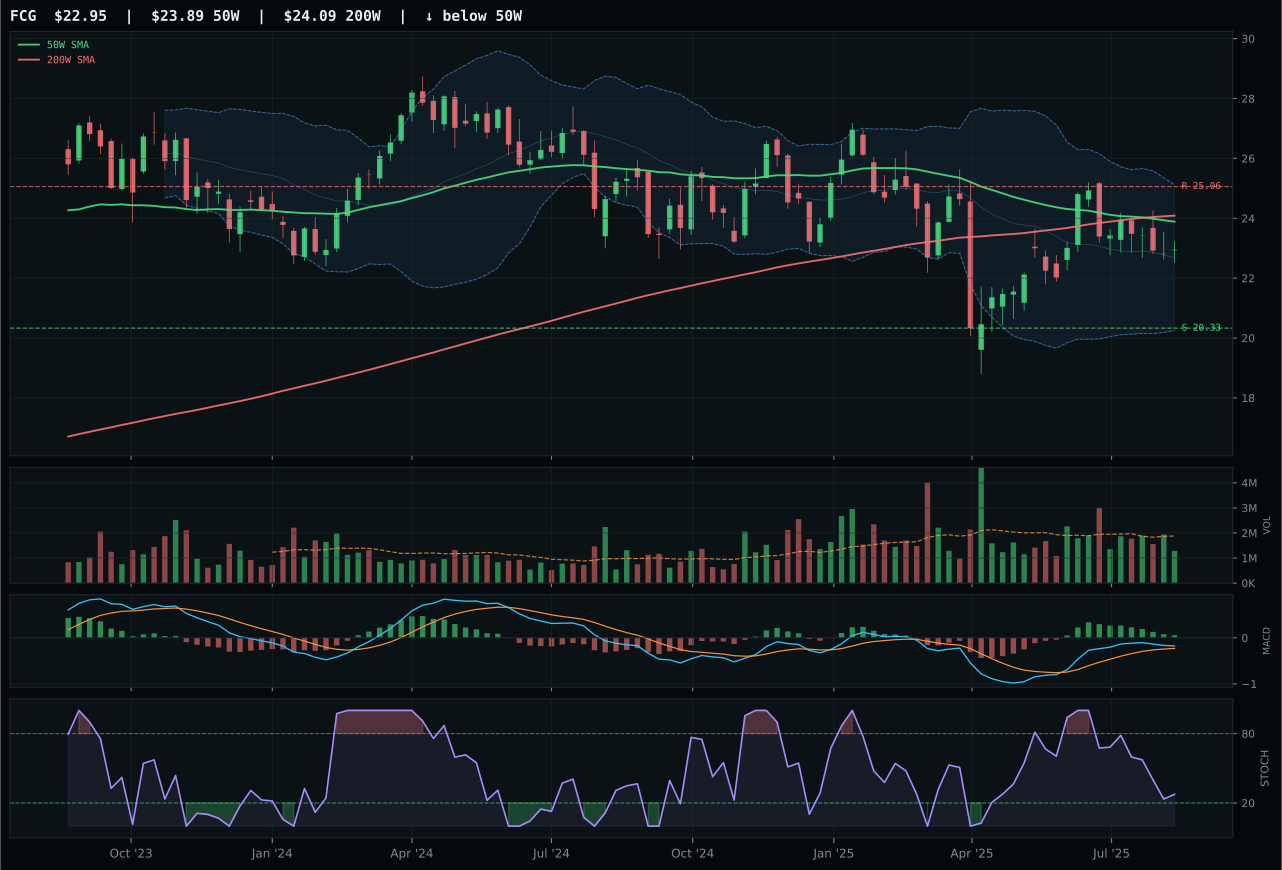
FCG has a neutral structure profile with -8.5% 13-week relative strength versus SPY.
Extension and support failure are the main tactical risks.
Tracked, but not top-2 eligible because: structurally broken.
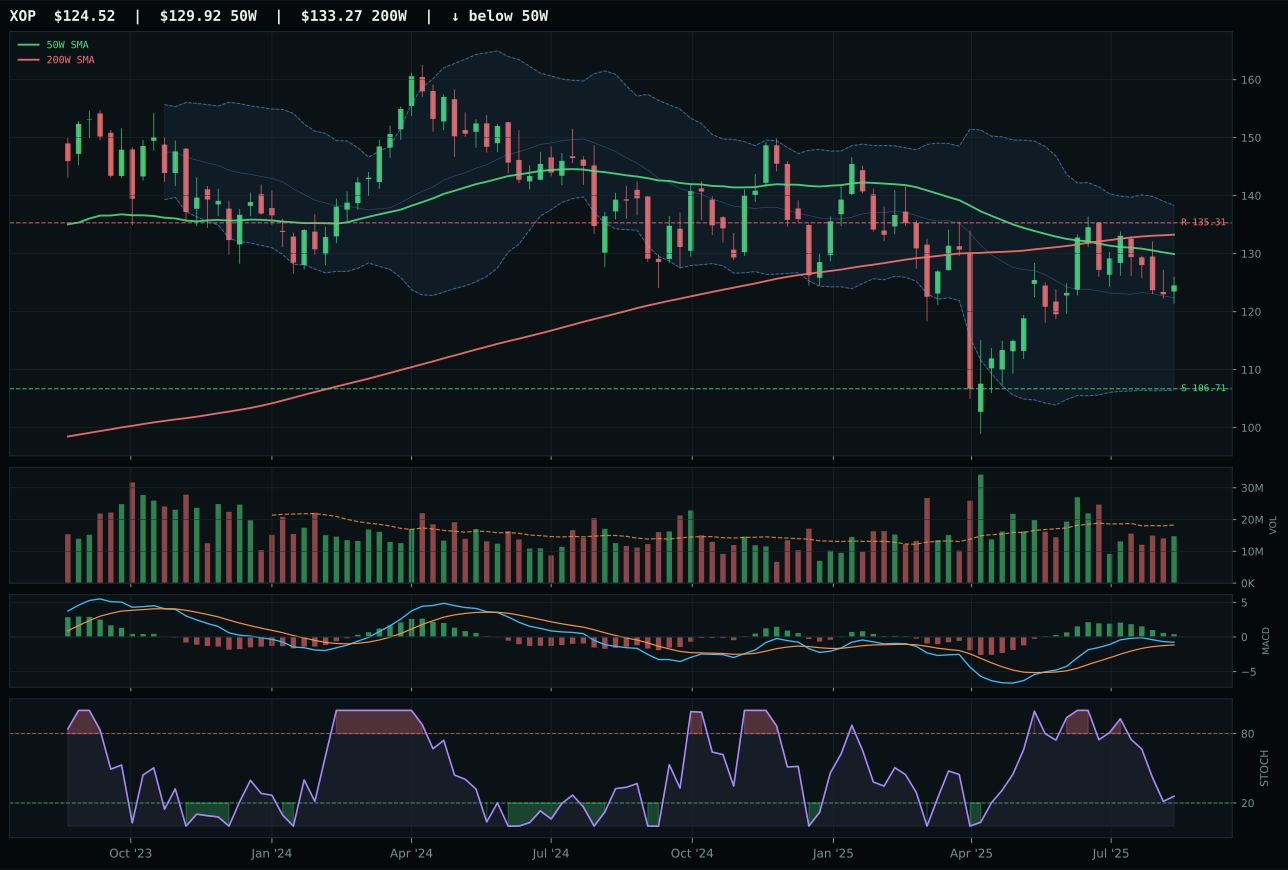
XOP has a neutral structure profile with -9.0% 13-week relative strength versus SPY.
Extension and support failure are the main tactical risks.
Tracked, but not top-2 eligible because: structurally broken.
XLE wins the energy category by default rather than conviction, as the entire sector scores poorly and XLE is merely the least damaged choice. Price sits 2.5% below the 50-week—technically a pullback rather than a broken trend—and the setup is compression near the moving average, which can support a rebound if buyers defend. XLE's timing score of 95.0 is the category's strongest because being near support with MACD bullish and stochastic RSI falling offers legitimate mean-reversion appeal. FCG and XOP both sit 8-9% SPY-relative weak and show distribution pressure or thin participation; FCG carries the label "structurally broken," which is an automatic hard filter. XLE's 0.1% 13-week return is anemic, but it avoids the negative returns that plague its peers—a critical distinction in a collapsing sector.
Traditional Energy scored 18.6/100 and earned zero percent allocation—excluded entirely from the portfolio this week and ranking ninth among ten categories. The macro regime offers no support: real asset sponsorship (plus-7) is offset by credit stress (minus-7) and liquidity stress (minus-7), leaving the category at net neutral. More critically, the technical evidence is 60/100—bottom quartile—driven by price sitting below the critical fifty-week moving average, negative SPY relative strength at minus-8.2%, and momentum confirmation of just 42.8. XLE's pullback compression offers a tactical entry point for mean-reversion traders, but portfolio capital is needed elsewhere. The category would require a sustained breakout above 46.26 resistance paired with volume acceleration to 1.2x average to earn consideration for a five percent tactical slot. Until that setup materializes, traditional energy remains a speculative trade, not an allocation-worthy position.