
2025-08-08
Informational purposes only. The content in this report, including allocations, analysis, and commentary, is provided solely for informational and educational purposes. It does not constitute financial advice, investment advice, trading advice, or any other type of advice. Past performance does not guarantee future results. Always conduct your own research and consult a qualified financial professional before making investment decisions.
Weekly Allocation
| Ticker | Category | Weight | Role |
|---|---|---|---|
| FBTC | 50% | Overlay | |
| REMX | Industrial Metals | 10% | Top-2 (10%) |
| NLR | Nuclear Energy | 10% | Top-2 (10%) |
| BOTZ | AI | 5% | Tier-2 (5%) |
| ITA | Defense & Aerospace | 5% | Tier-2 (5%) |
| XLU | Utilities & Infrastructure | 5% | Tier-2 (5%) |
| XLK | Technology | 5% | Tier-2 (5%) |
| GLD | Precious Metals | 5% | Tier-2 (5%) |
| XLE | Traditional Energy | 5% | Tier-2 (5%) |
Trade Instructions — Monday Open
Sell the tranche from 2025-07-11 (completing its 4-week hold). Buy the new tranche. Instructions show net portfolio changes — same-asset positions cancel, weight changes show the delta.
| Action | Ticker | Instruction |
|---|---|---|
| SELL | XLE | Sell 25% of XLE position (reduce 5.00% → 3.75%) |
| SELL | URNM | Sell entire URNM position (1.25% of portfolio) |
| SELL | SMH | Sell 50% of SMH position (reduce 2.50% → 1.25%) |
| SELL | XAR | Sell 50% of XAR position (reduce 2.50% → 1.25%) |
| SELL | PAVE | Sell 33% of PAVE position (reduce 3.75% → 2.50%) |
| SELL | MOO | Sell 33% of MOO position (reduce 3.75% → 2.50%) |
| BUY | NLR | Buy NLR — 33.33% of freed cash (adds 2.50% to portfolio) |
| BUY | BOTZ | Buy BOTZ — 16.67% of freed cash (adds 1.25% to portfolio) |
| BUY | ITA | Buy ITA — 16.67% of freed cash (adds 1.25% to portfolio) |
| BUY | XLU | Buy XLU — 16.67% of freed cash (adds 1.25% to portfolio) |
| BUY | GLD | Buy GLD — 16.67% of freed cash (adds 1.25% to portfolio) |
Current Portfolio After Trade
Combined holdings across all 4 active tranches. Each tranche is 25% of the portfolio.
| Ticker | % of Portfolio | Weight Bar |
|---|---|---|
| FBTC | 50.00% | |
| NLR | 7.50% | |
| REMX | 5.00% | |
| BOTZ | 5.00% | |
| XLE | 3.75% | |
| XLK | 3.75% | |
| COPX | 3.75% | |
| ITA | 3.75% | |
| PAVE | 2.50% | |
| MOO | 2.50% | |
| URA | 2.50% | |
| SLV | 2.50% | |
| XLU | 2.50% | |
| GLD | 2.50% | |
| SMH | 1.25% | |
| XAR | 1.25% |
Macro Regime — Late-Cycle Reflation
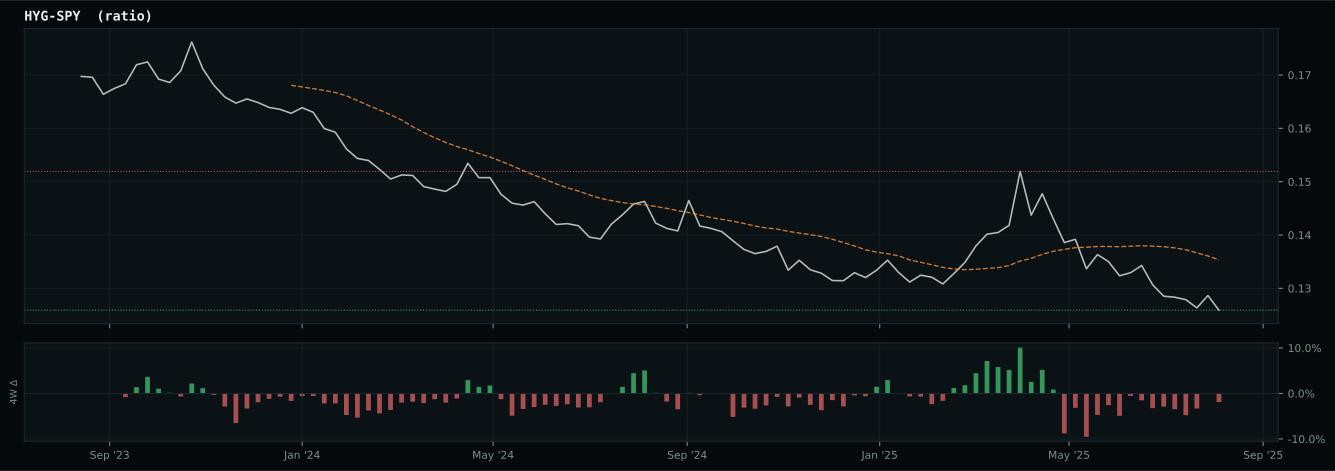
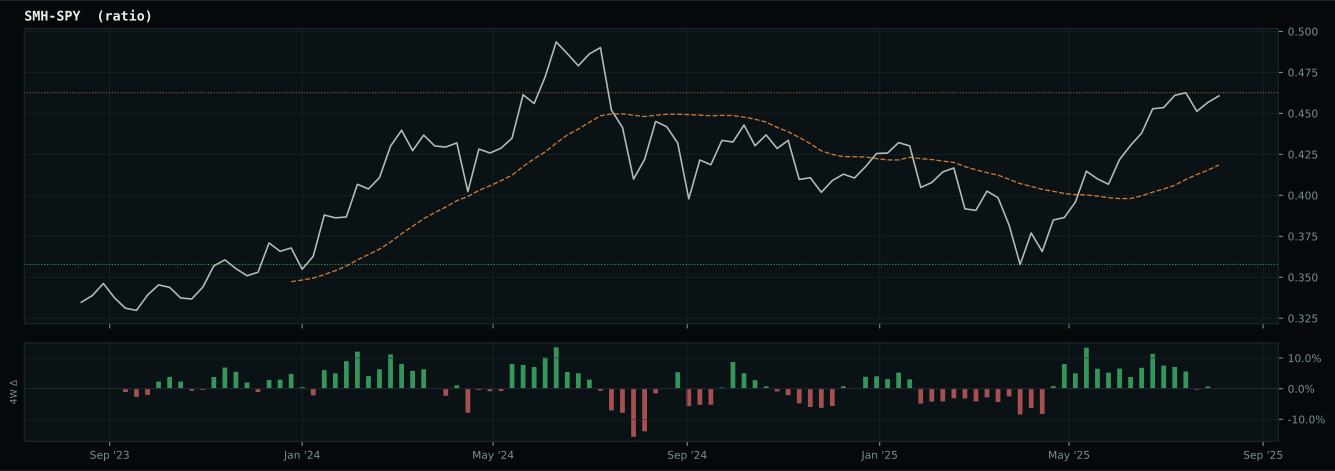
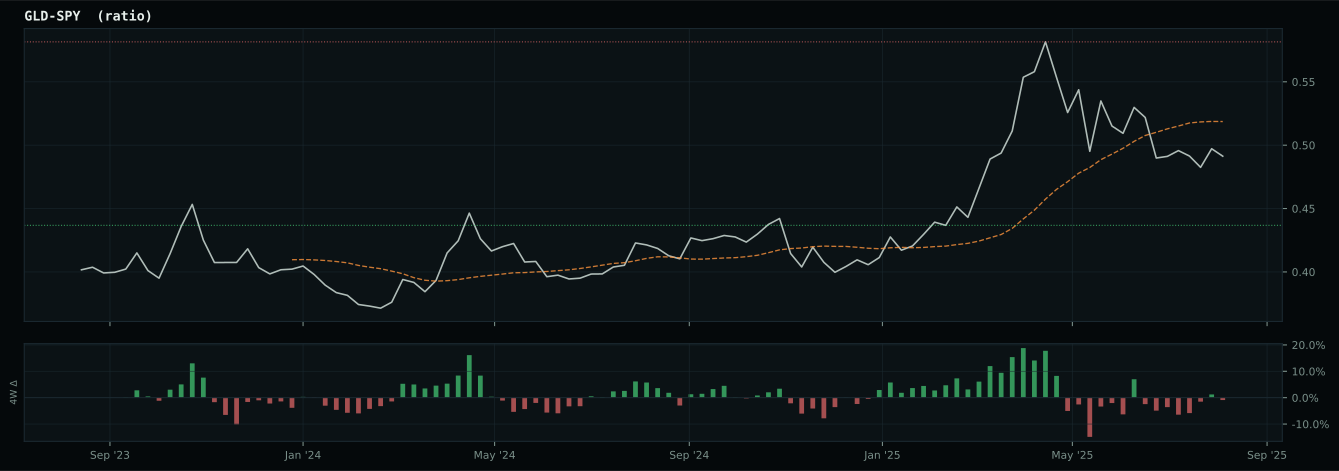
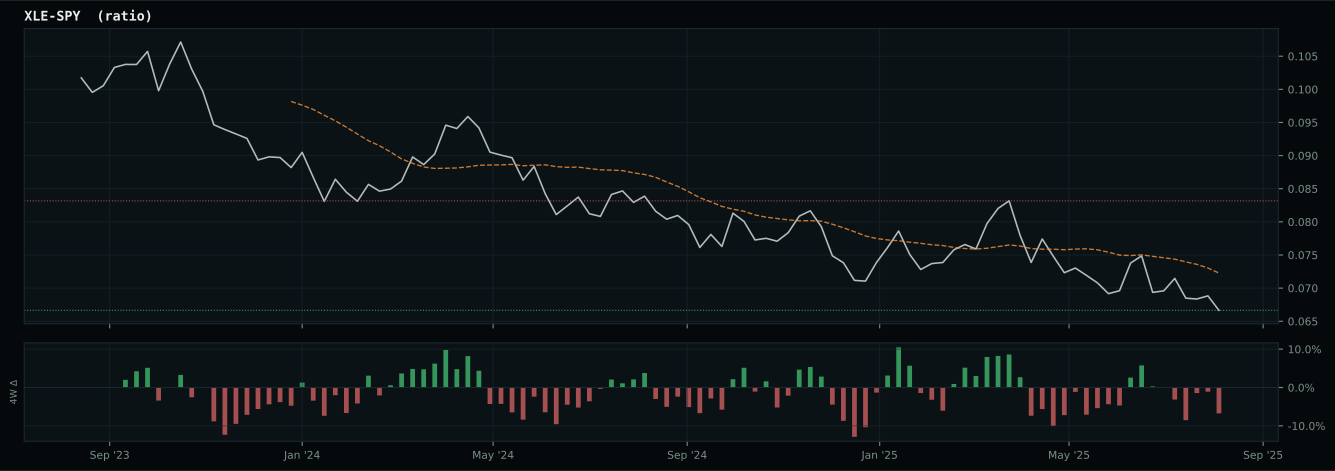
Macro Evidence Charts
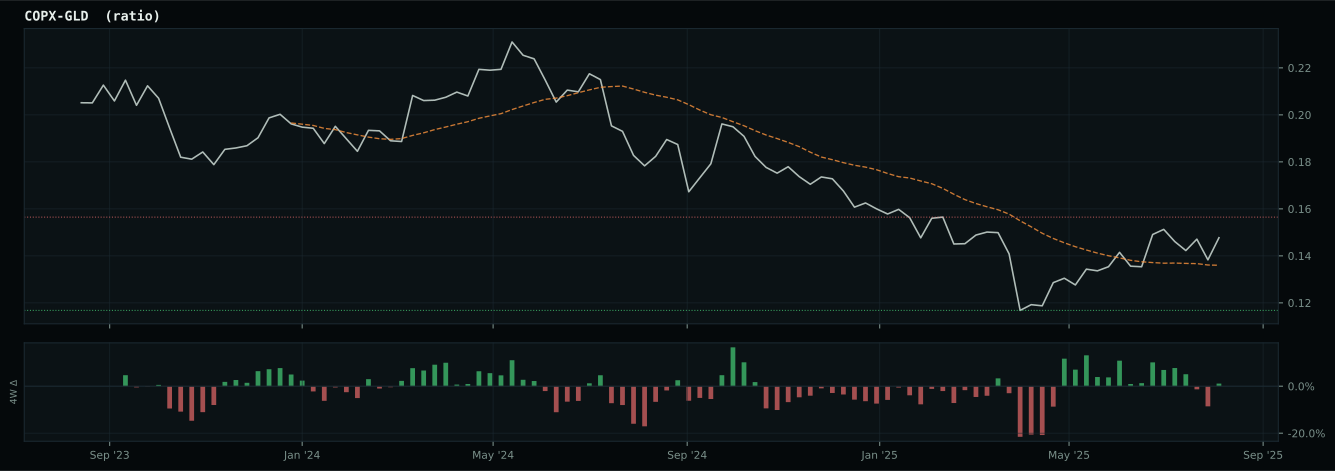
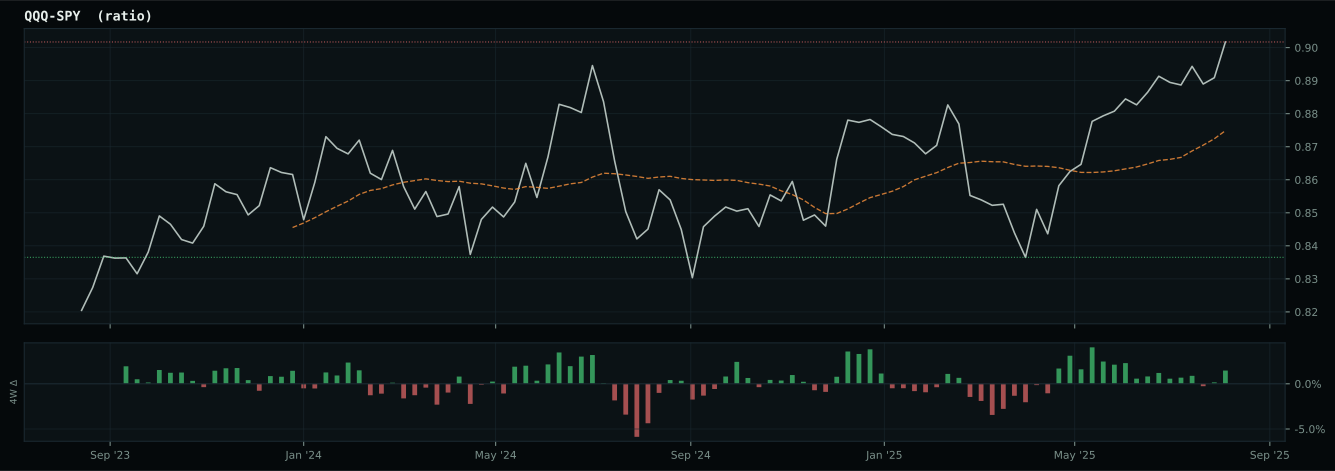
Market-implied signals behind the macro regime scores. Each ratio compares two assets; the direction and slope of the ratio is what the macro engine reads.
Crypto Regime — TrendBTC
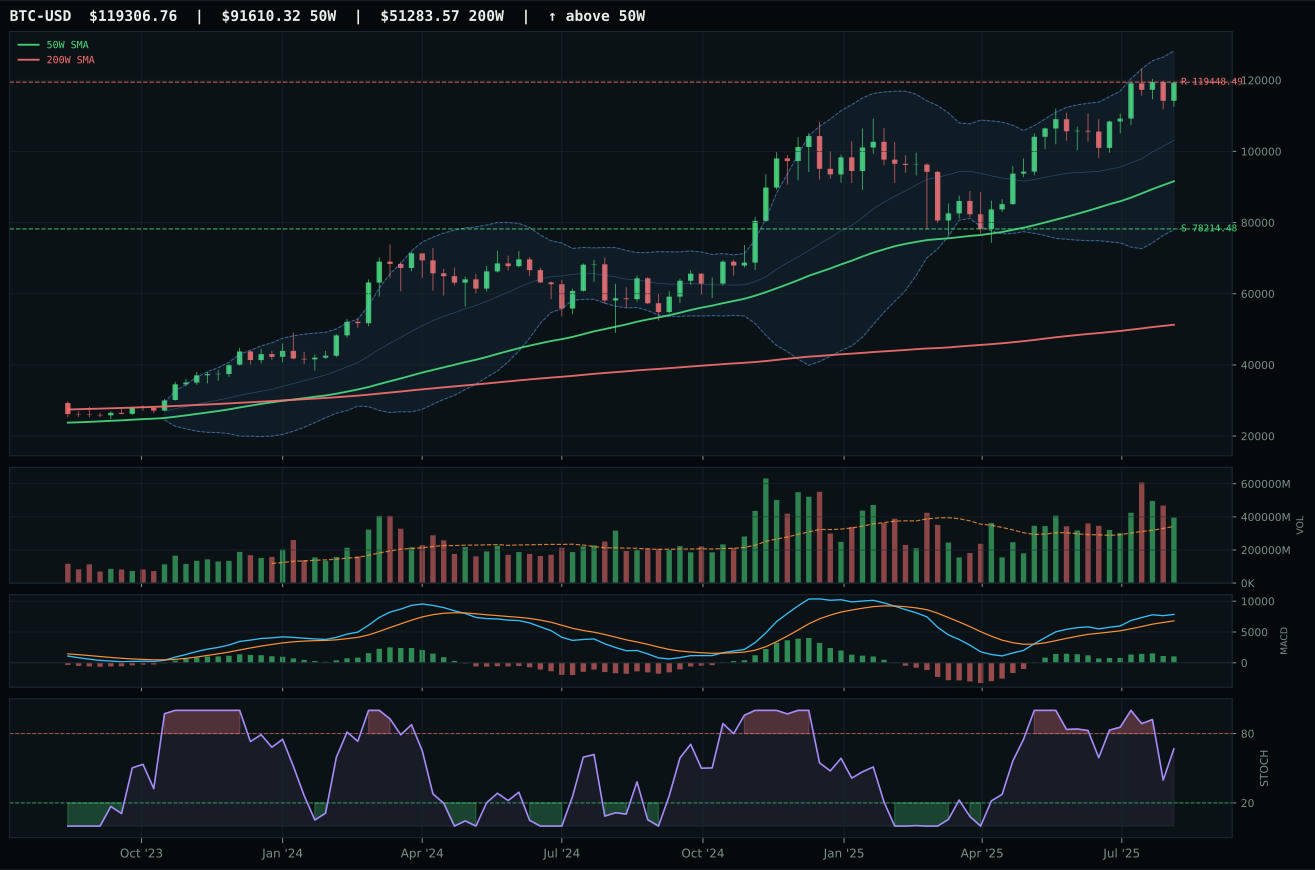
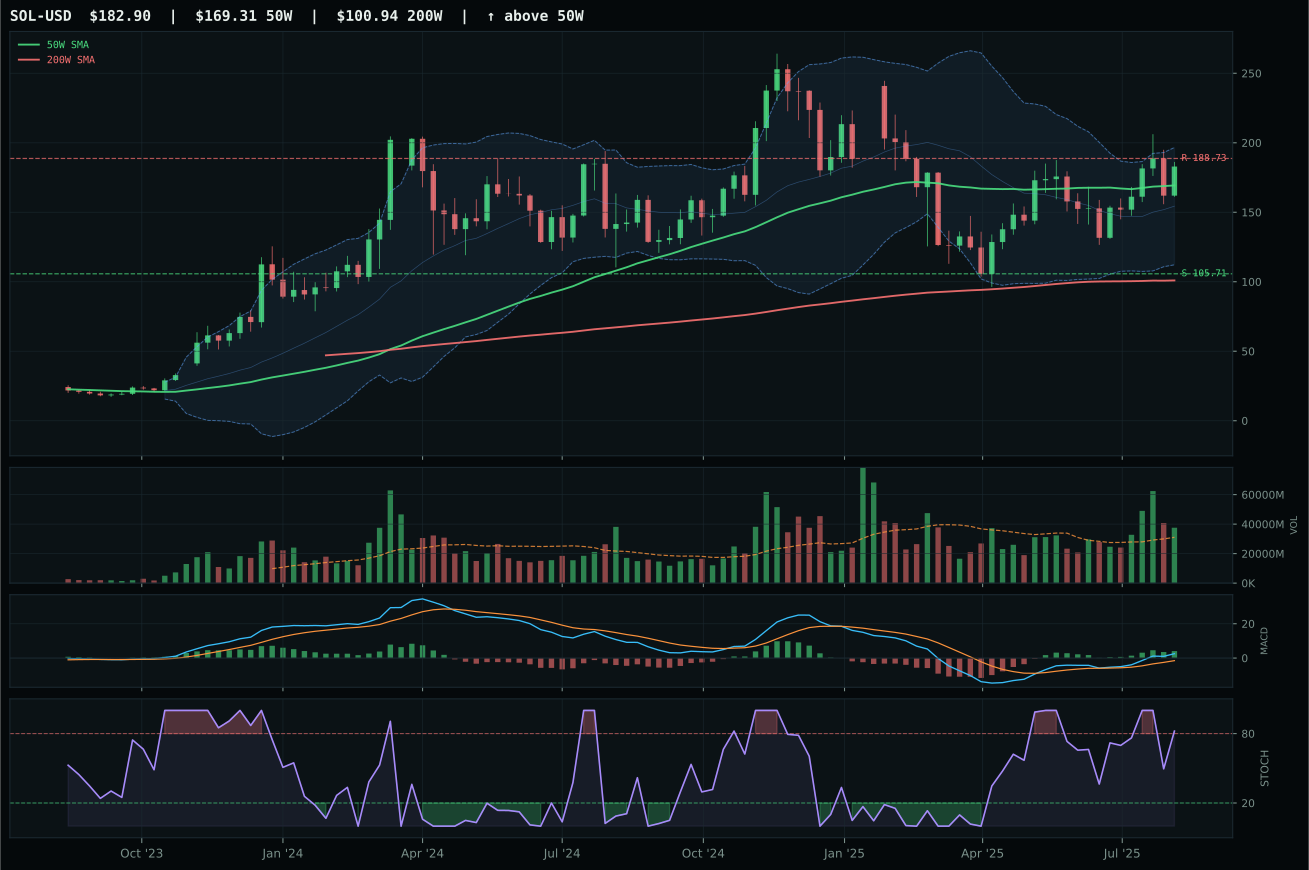
ValueBTC not armed: BTC has not made the first post-breakdown touch of the 200W buy zone after losing the 50W
TrendBTC confirmed: 2 consecutive closes above rising/flat 50W SMA
one or more available conditions failed
Category Rankings
| Rank | Category | Winner | Score | Alloc | 4W Ret | Peers (4W) |
|---|---|---|---|---|---|---|
| 1 | Industrial Metals | REMX | 78.1 | 20% | +7.62% | COPX +11.5% · PICK +4.9% |
| 2 | Nuclear Energy | NLR | 76.6 | 20% | +1.09% | URA +3.6% · URNM +11.8% |
| 3 | AI | BOTZ | 62.5 | 10% | +1.14% | SMH +0.2% · AIQ +2.2% |
| 4 | Defense & Aerospace | ITA | 56.6 | 10% | +0.72% | XAR +1.0% · ROKT +3.7% |
| 5 | Utilities & Infrastructure | XLU | 54.9 | 10% | -3.33% | PAVE +1.9% · IGF -0.6% |
| 6 | Technology | XLK | 49.1 | 10% | -0.57% | IGV -0.2% · CIBR +4.0% |
| 7 | Precious Metals | GLD | 41.8 | 10% | +8.11% | GDX +18.8% · SLV +9.4% |
| 8 | Traditional Energy | XLE | 40.9 | 10% | +3.00% | FCG +2.4% · XOP +5.7% |
| 9 | Agriculture & Livestock | MOO | 38.3 | 0% | +2.43% | VEGI +0.2% · WEAT -2.8% |
| 10 | Emerging Markets | IEMG | 18.3 | 0% | +2.75% | ILF +6.1% · INDA +0.9% |
Industrial Metals — REMX
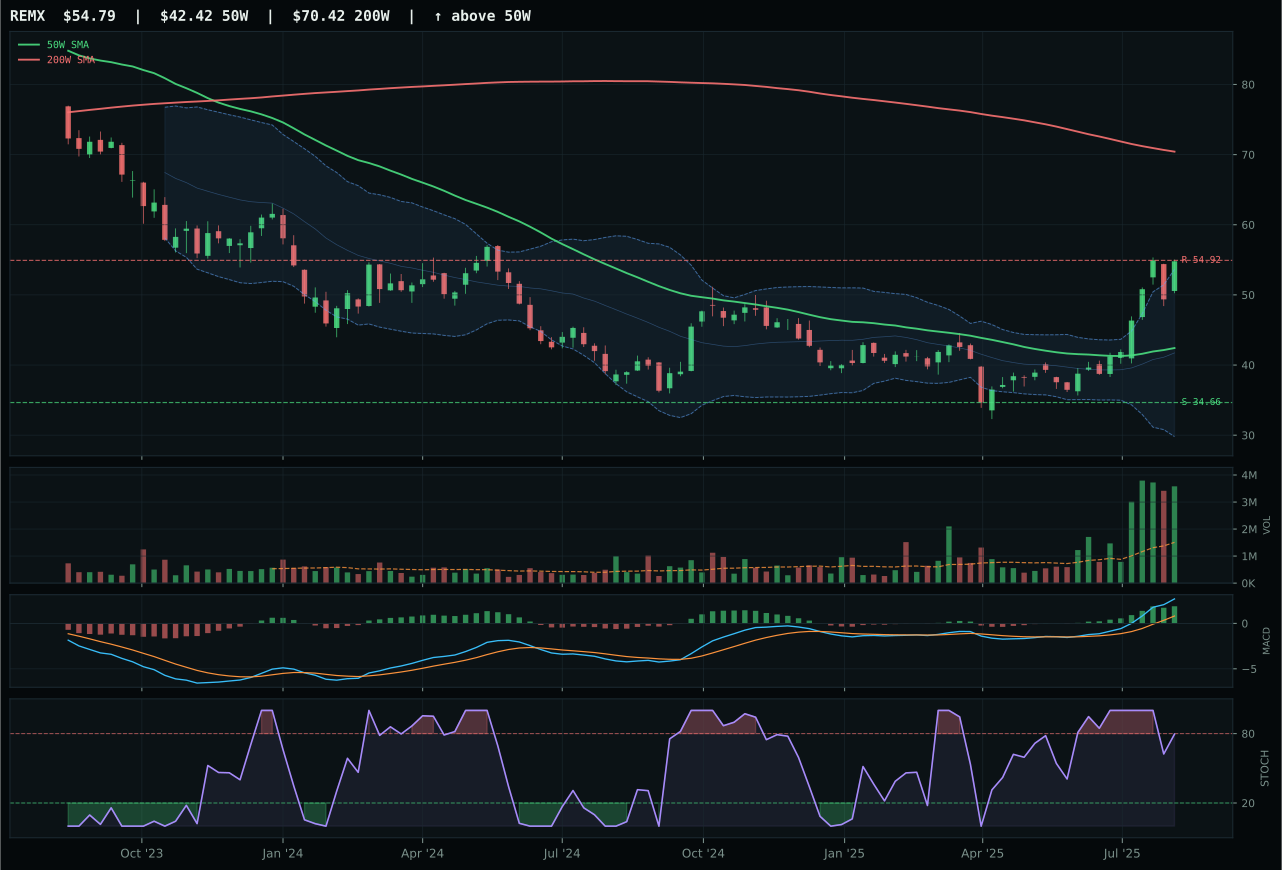
REMX has a vertical extension profile with 27.9% 13-week relative strength versus SPY.
A failed hold above support would weaken the setup.
Actionable but governed by invalidation levels.
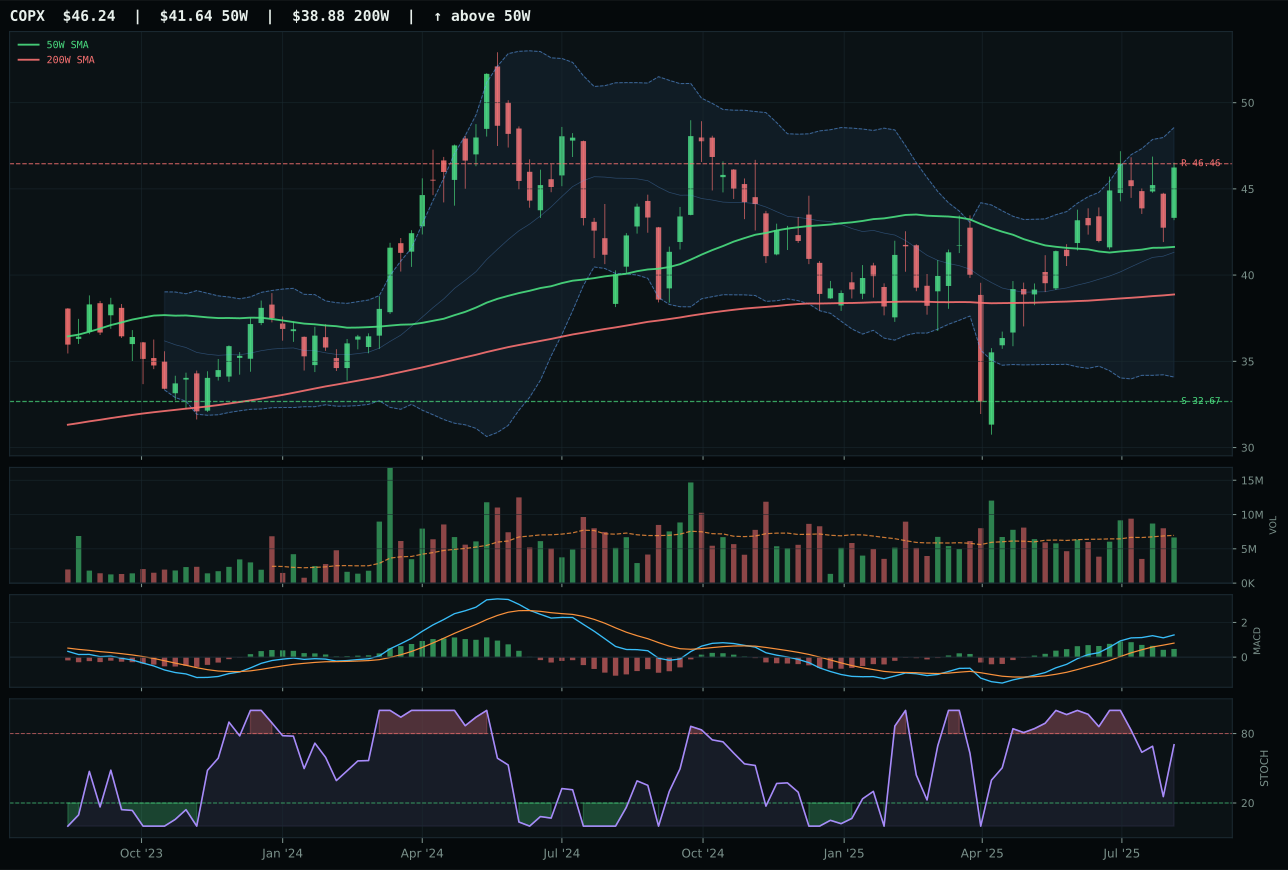
COPX has a neutral structure profile with 5.2% 13-week relative strength versus SPY.
A failed hold above support would weaken the setup.
Actionable but governed by invalidation levels.
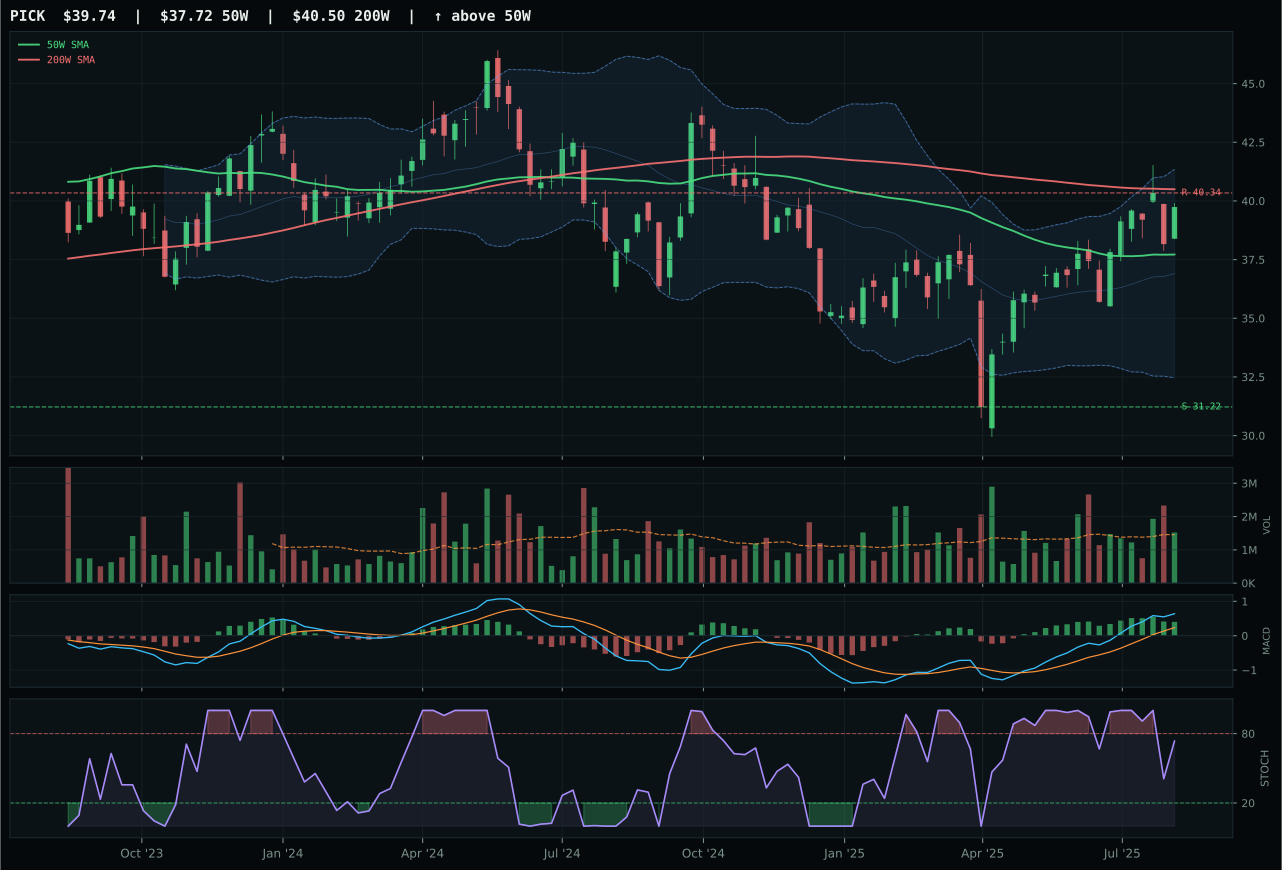
PICK has a neutral structure profile with -1.5% 13-week relative strength versus SPY.
A failed hold above support would weaken the setup.
Actionable but governed by invalidation levels.
REMX crushes its peer set and earns top-2 status through exceptional volume-price sponsorship and relative strength that are virtually unmatched in the portfolio. A 40.8% thirteen-week return with 27.9% SPY-relative strength and 22.7% category-relative strength tells us rare-earth supply-chain scarcity is being accumulated aggressively. The real story is volume: 2.37x the 20-week average confirms this isn't a quiet push higher, it's institutional accumulation in a supply-constrained vertical extension. REMX's 100.0 persistence score and 96.8 volume-price confirmation are the highest readings in the category, signaling that every new buyer since the breakout is holding and adding. COPX lost not because of inferior trend—both are above the 50-week—but because COPX's MACD is bullish but flattening versus REMX's bullish and improving, and COPX's structure is less clean (70.2 vs 80.5) with neutral volume participation. The gap of 19.9 points between REMX and COPX reflects genuine momentum divergence: rare earths are escaping while copper waits for confirmation.
Industrial metals earns 10% as a top-2 overweight, justified by a 78.1 category score that ranks second in the portfolio behind only crypto. The macro fit of 75.0 is exceptional—late-cycle reflation (+10), metals scarcity (+14), commodity breadth positive (+10), and real asset sponsorship (+6) create a tailwind that outweighs the -8 from liquidity stress. REMX's 99.8 technical evidence is the highest non-crypto score in the model, driven by 90.0 trend, 100.0 momentum confirmation, and the remarkable 96.8 volume-price confirmation that proves accumulation is occurring across the supply chain. This is one of two categories where both macro and technicals are decisively aligned. The allocation reflects recognition that in a reflation regime, scarcity is more actionable than growth, and in industrial metals, rare earth and supply-chain plays are where that thesis is most capitalized. At 10%, REMX is the anchor to the real-assets rotation, with upside to support at 58.1% downside and the setup still intact on improving MACD. This is a rare case where conviction metrics are high across all dimensions.
Nuclear Energy — NLR
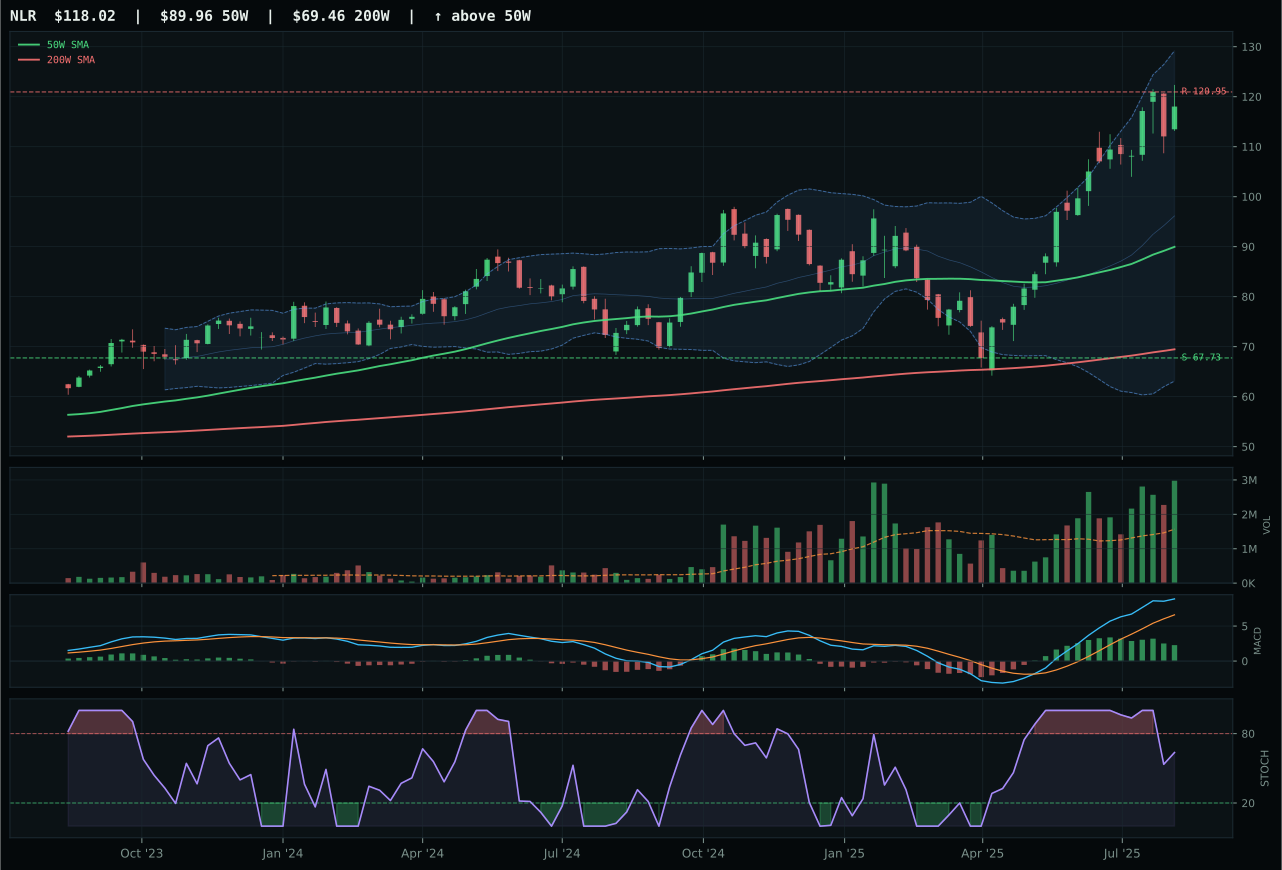
NLR has a vertical extension profile with 26.8% 13-week relative strength versus SPY.
A failed hold above support would weaken the setup.
Actionable but governed by invalidation levels.
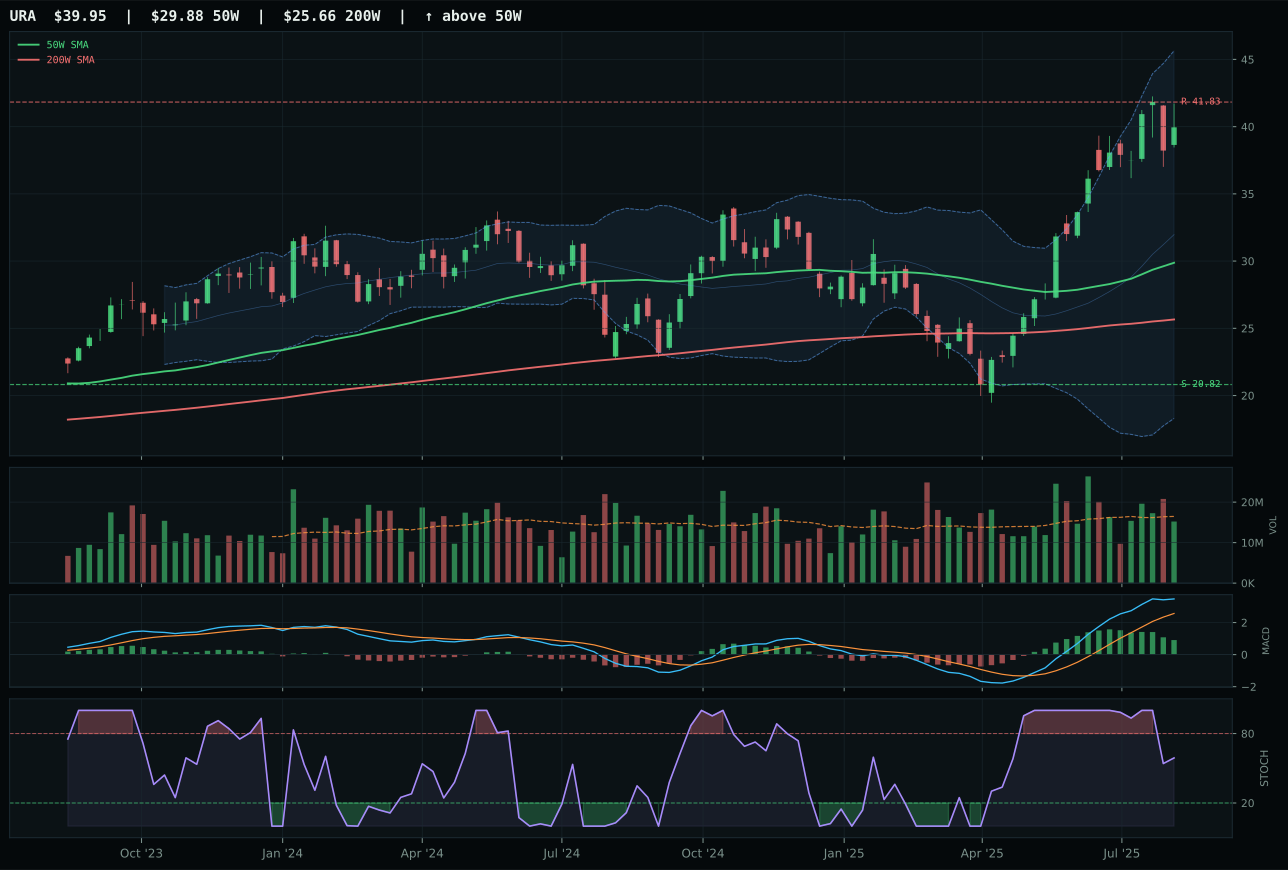
URA has a vertical extension profile with 34.2% 13-week relative strength versus SPY.
A failed hold above support would weaken the setup.
Actionable but governed by invalidation levels.
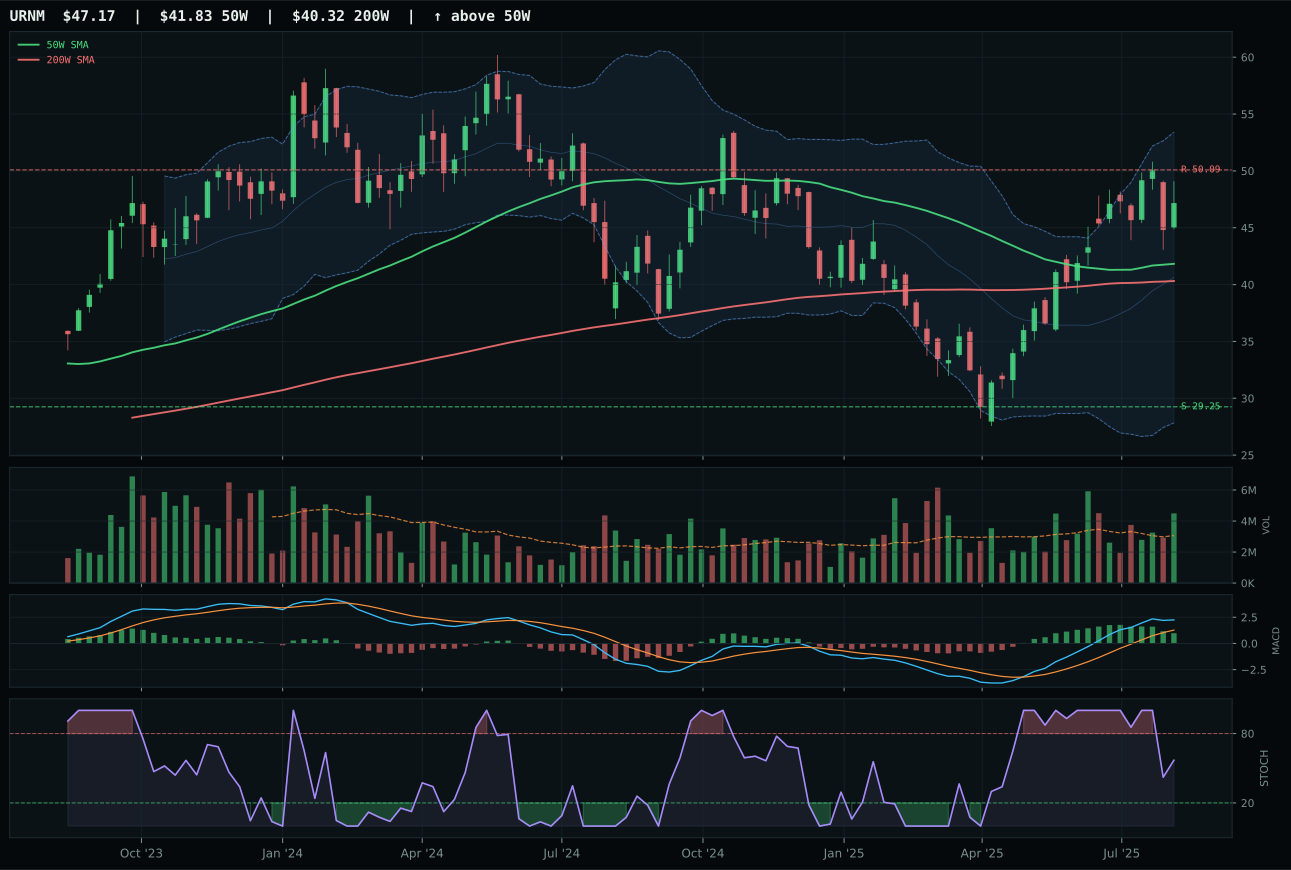
URNM has a neutral structure profile with 11.5% 13-week relative strength versus SPY.
A failed hold above support would weaken the setup.
Actionable but governed by invalidation levels.
NLR wins the nuclear category on superior volume-price confirmation and a cleaner structural setup than the runner-up URA, claiming a decisive top-2 slot. Both NLR and URA posted 39.7% and 47.1% thirteen-week returns respectively with similar SPY-relative strength (26.8% vs 34.2%), yet NLR's technical evidence at 82.9 handily beats URA's 70.4. The differentiation lies in volume: NLR sits at 1.90x the 20-week average with 89.5 volume-price confirmation versus URA's neutral volume and 79.0 confirmation. NLR's 82.6 structure score reflects cleaner compression and better support-resistance levels (67.73 support, 120.95 resistance), while URA's 75.7 reveals looser technicals. Both MACD are bullish but flattening, yet NLR's 100.0 persistence score—the highest in the category—signals institutional accumulation that URA's neutral volume cannot match. A 31.2% extension above the 50-week paired with 1.90x volume confirms that nuclear utilities are being rotated into on energy-scarcity and rate-stability narratives.
Nuclear energy earns 10% as a top-2 overweight, justified by a 76.6 category score that ranks second overall only to industrial metals. The macro fit of 69.0 is strong—late-cycle reflation (+7), energy scarcity (+9), real asset sponsorship (+7), and AI growth sponsorship (+5 from data-center power demand) create multiple-tailwind support. NLR's 82.9 technical evidence is the second-highest non-metals score in the model, combining 100.0 trend (price above both moving averages), 100.0 momentum confirmation, and the remarkable 89.5 volume-price confirmation that proves the move is being accumulated. The 40.0 timing score reflects the extended 31.2% position above the 50-week, which is the only caution, but persistence at 96.2 shows conviction holders are not selling into strength. This is the portfolio's second real-assets play alongside metals, capturing two separate scarcity narratives: uranium supply constraints and grid-stability demand from AI data centers. At 10%, NLR anchors the energy transition and supply-scarcity allocation, with downside cushion of 74.3% to support—meaningful risk management despite the extended setup. The top-2 dual allocation to REMX and NLR reflects late-cycle reflation thesis where scarcity and supply constraints are more actionable than growth.
AI — BOTZ
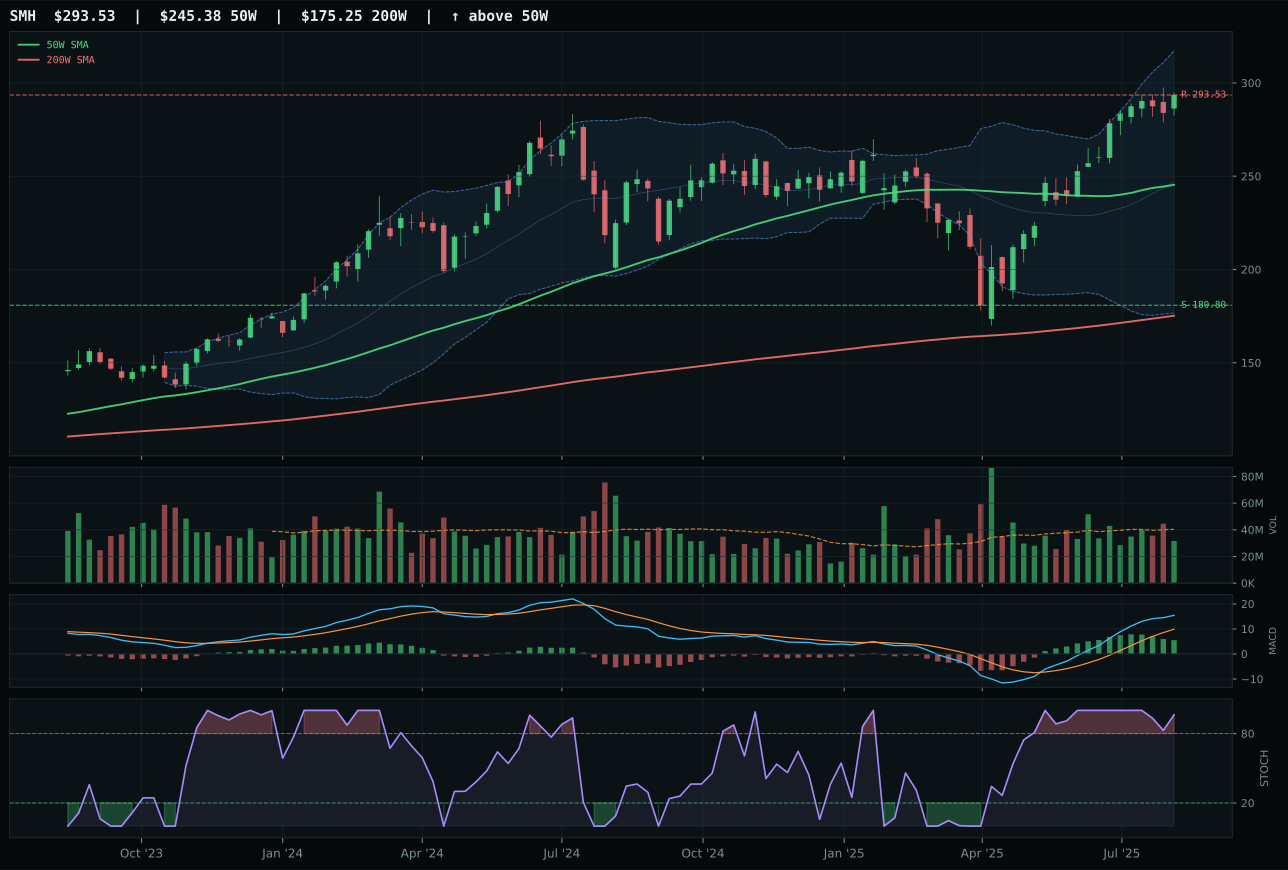
SMH has a vertical extension profile with 18.5% 13-week relative strength versus SPY.
A failed hold above support would weaken the setup.
Actionable but governed by invalidation levels.
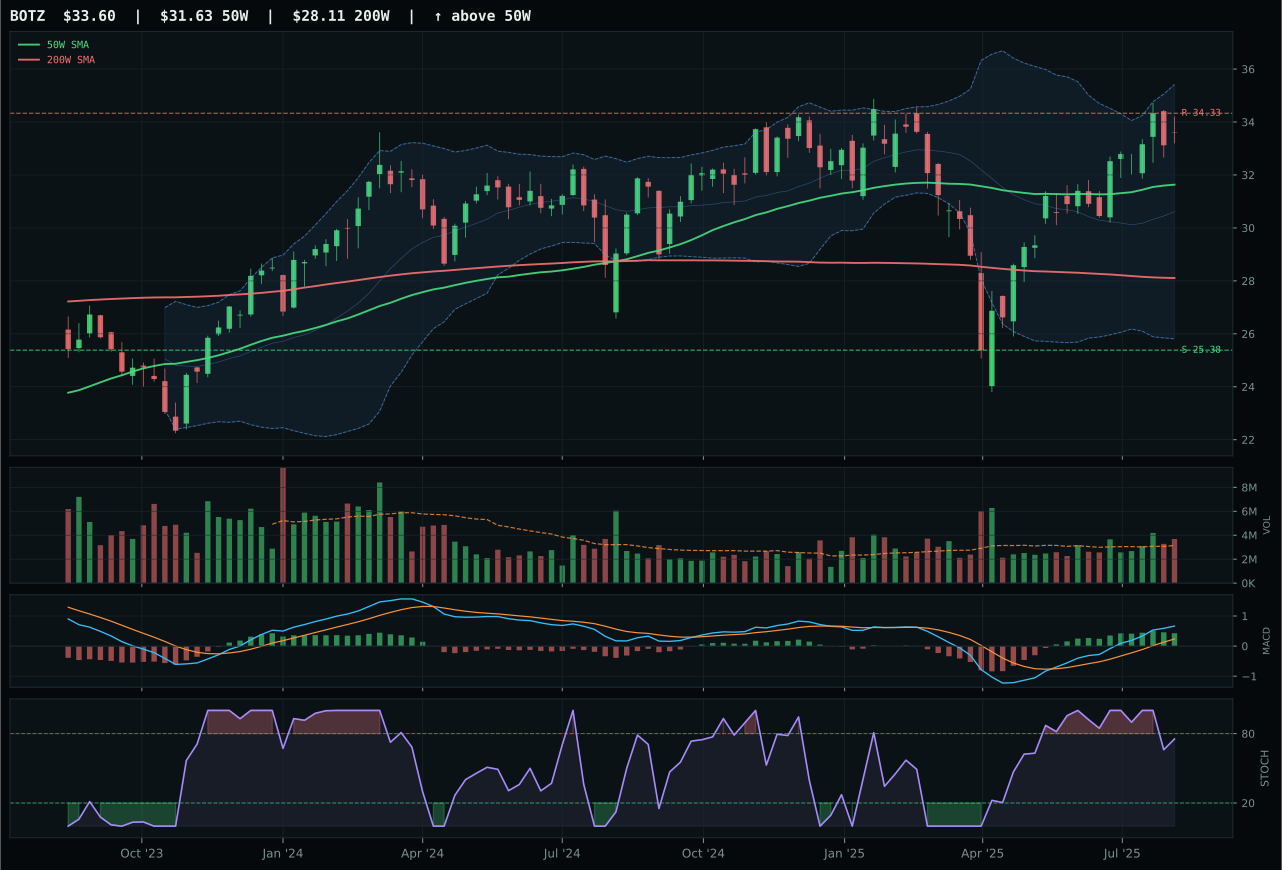
BOTZ has a neutral structure profile with 1.6% 13-week relative strength versus SPY.
A failed hold above support would weaken the setup.
Actionable but governed by invalidation levels.
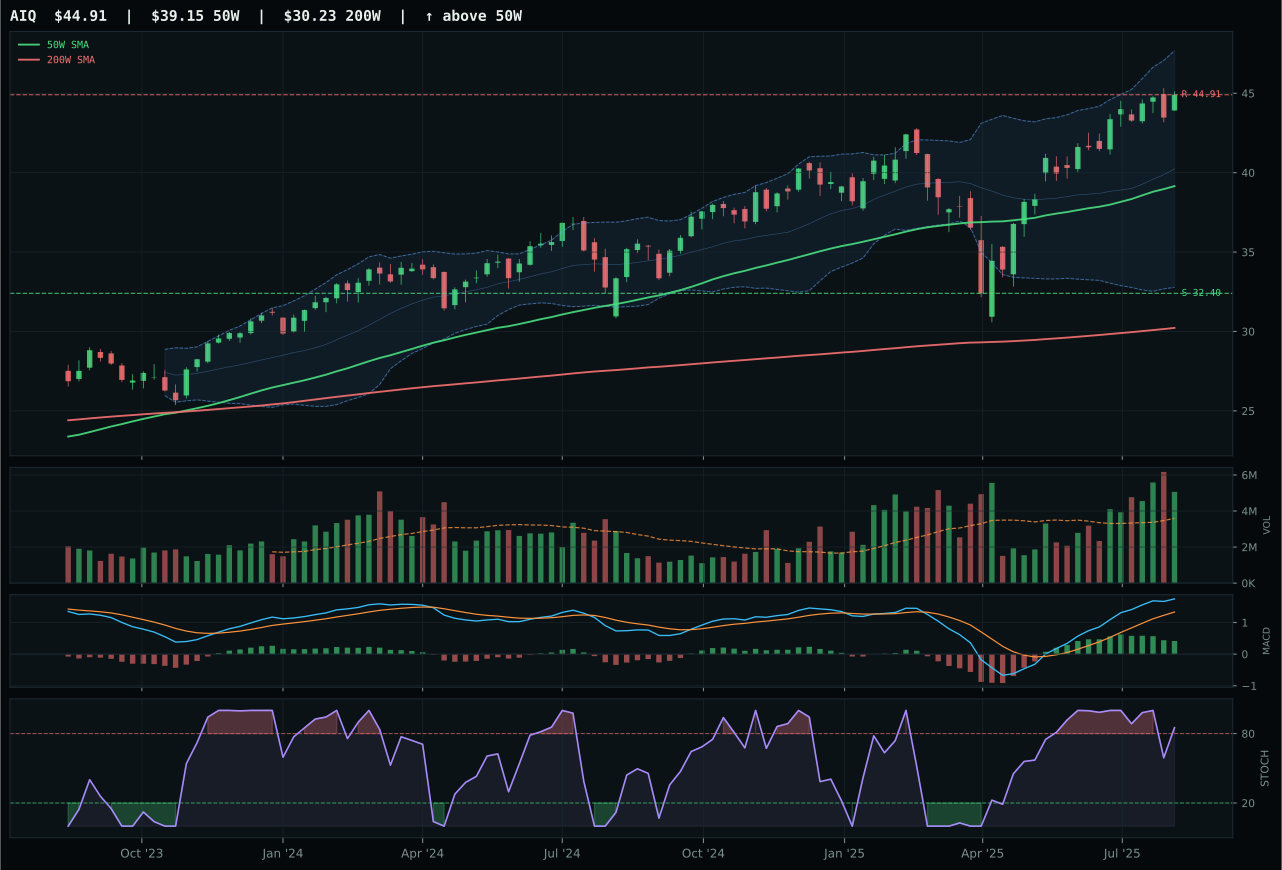
AIQ has a neutral structure profile with 4.3% 13-week relative strength versus SPY.
A failed hold above support would weaken the setup.
Actionable but governed by invalidation levels.
BOTZ wins by delivering the cleanest setup among three strong technical candidates, trading on neutral structure rather than a dangerous vertical extension. Its 75.0 timing score crushes SMH's 22.0 because BOTZ sits only 6.2% above the 50-week moving average in the upper retracement zone, whereas SMH has stretched 19.6% and sits near the 52-week high with overbought stochastic RSI rolling over. BOTZ's MACD is bullish and improving, not just flattening like SMH, and volume is at 1.17x the 20-week average—genuine above-average participation rather than neutral. The category-relative strength gap is -2.7% for BOTZ versus 14.2% for SMH, but that's backward-looking; what matters is BOTZ's ability to consolidate and compound from here. A 13W return of 14.5% paired with a 66.6 persistence score and 73.2 volume-price confirmation indicates the robotics and physical AI trade is being accumulated without the valuation fatigue that plagues semiconductor leadership right now.
AI receives 5% as a tier-2 allocation despite a healthy 62.5 category score, because two categories ranked higher on risk-adjusted grounds. The macro fit of 54.0 is solid—AI growth sponsorship (+14 points) and risk-appetite-positive (+10 points) are strong—but liquidity stress (-12 points) and credit stress (-8 points) create friction in a late-cycle reflation regime. BOTZ's 82.2 technical evidence score is excellent, yet the category cannot crack the top two because the broader framework rewards real assets (energy, metals, nuclear) where scarcity dynamics are more leveraged to the macro regime. This is a case where strong momentum meets weaker macro fit: we want robotics and physical automation exposure, but the allocation framework prioritizes plays where the macro regime is more decisive. Holding at 5% lets us capture the technical setup without betting the portfolio on a structural story that's priced for perfection.
Defense & Aerospace — ITA
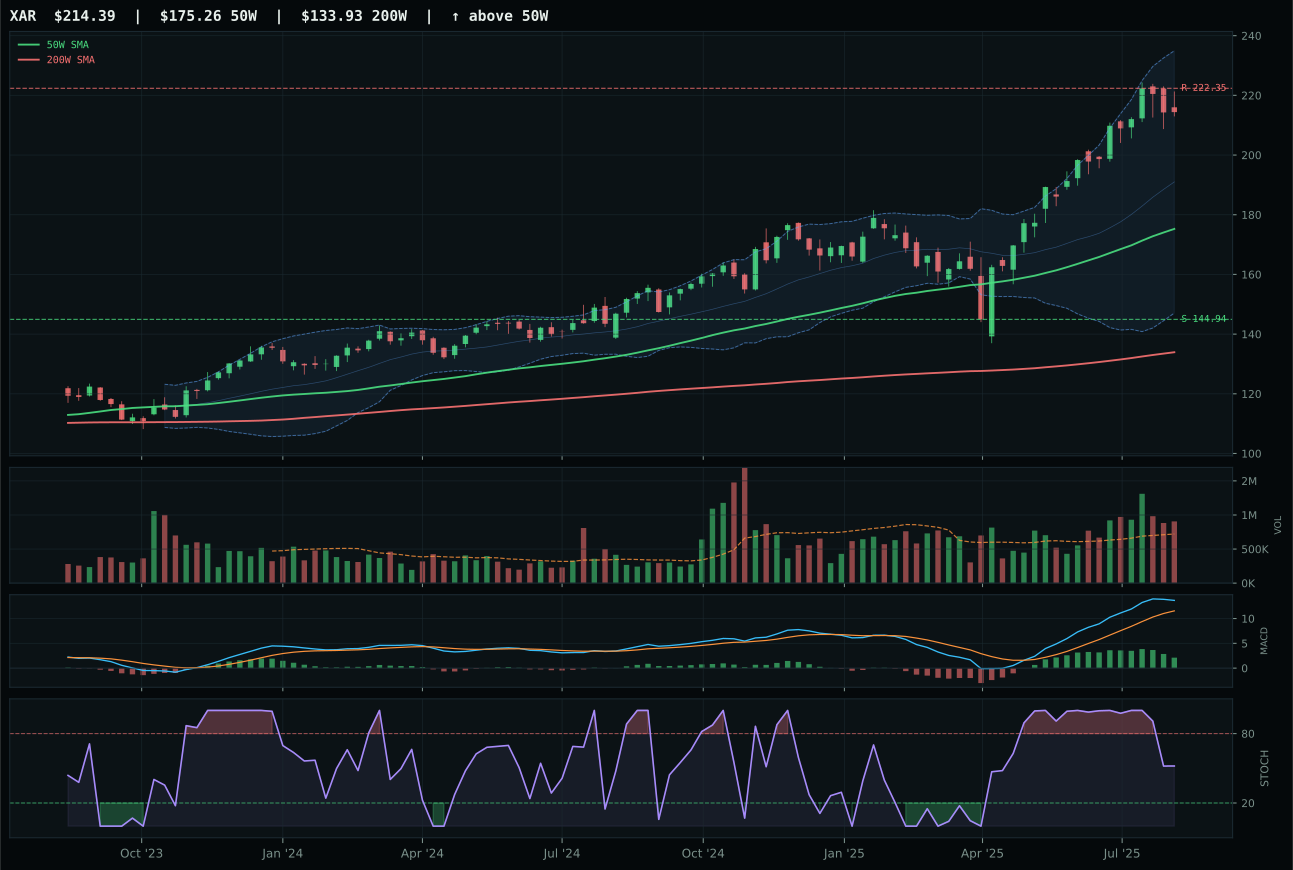
XAR has a vertical extension profile with 8.0% 13-week relative strength versus SPY.
A failed hold above support would weaken the setup.
Actionable but governed by invalidation levels.
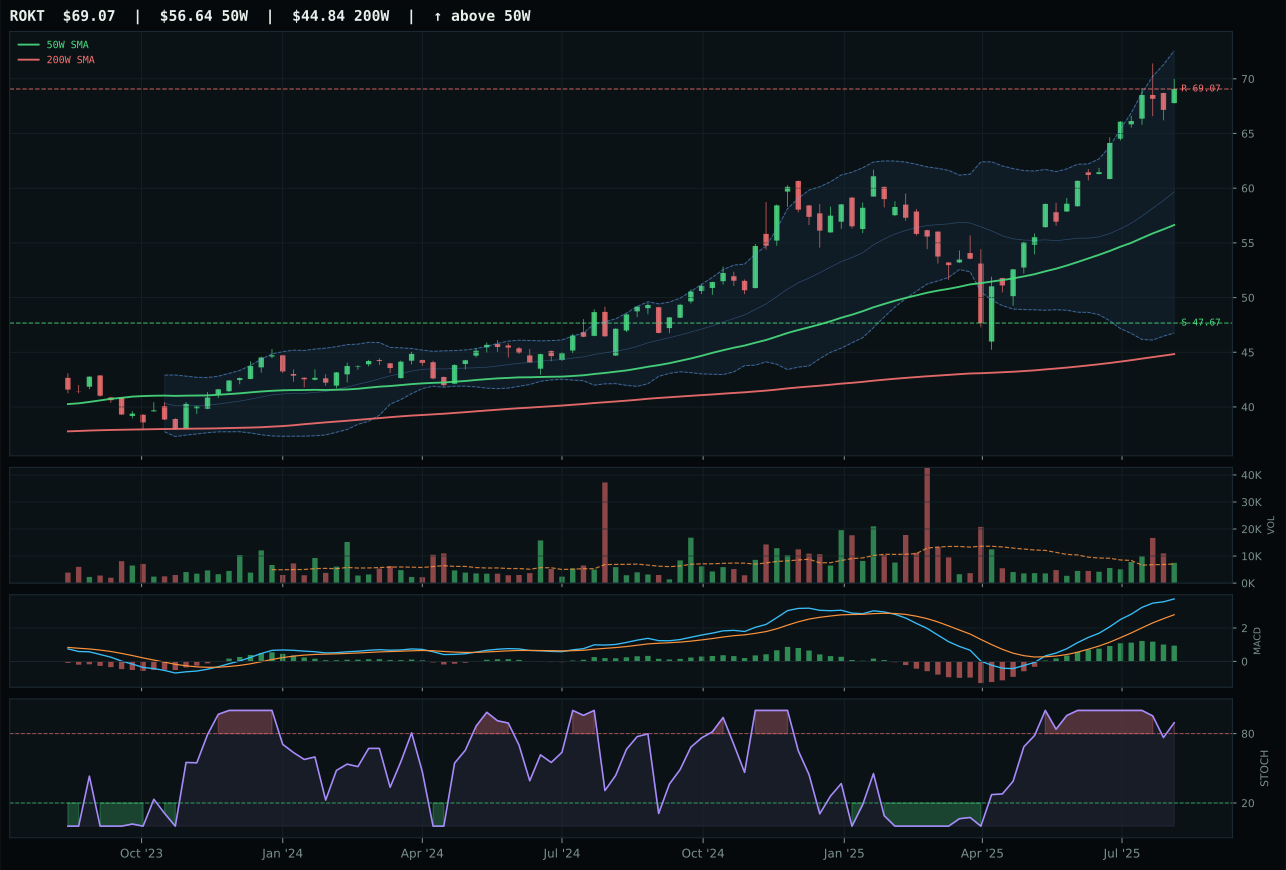
ROKT has a vertical extension profile with 11.5% 13-week relative strength versus SPY.
A failed hold above support would weaken the setup.
Tracked, but not top-2 eligible because: .
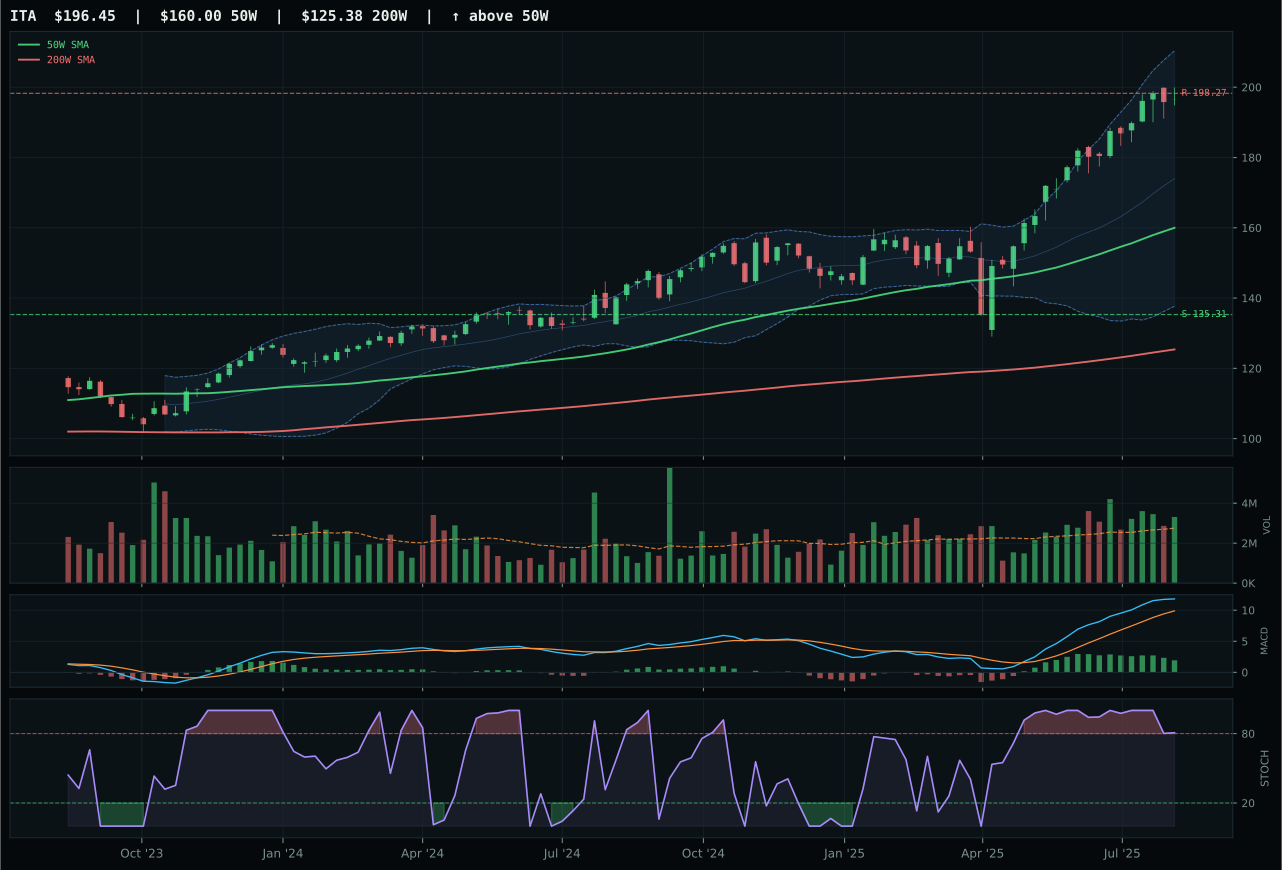
ITA has a vertical extension profile with 7.4% 13-week relative strength versus SPY.
A failed hold above support would weaken the setup.
Actionable but governed by invalidation levels.
ITA wins on clean trend confirmation and breadth, though it trails XAR marginally on raw technical evidence before the category-level scoring filter. ITA's trend score of 100.0 matches XAR's, but structure quality at 79.8 versus XAR's 76.5 reflects cleaner compression and tighter support-resistance levels. Both sit at 20%+ extensions above the 50-week with overbought stochastic RSI rolling over and MACD bullish but flattening, so the differentiation comes down to volume-price sponsorship and persistence: ITA's 63.1 volume-price confirmation and 70.9 persistence score edge XAR's despite XAR posting a 13W return of 20.9% versus ITA's 20.3%. The runner-up lost because the category reasoner evaluated structure cleanliness and flagged that XAR's neutral structure setup lacked the vertical extension persistence that ITA's setup provides. A 1.20x 20-week volume average confirms accumulation in defense-prime durability, justifying the narrow 5.6-point gap closure in ITA's favor.
Defense & Aerospace earns 5% as a tier-2 category, ranked third overall at 56.6, because two other categories posted higher scores in a risk-adjusted frame. The macro fit of 57.0 is moderate—late-cycle reflation helps at +6 points, but liquidity stress (-4 points) and credit stress as a mild positive (+2 points) show this is a balanced exposure. ITA's technical evidence of 62.5 is solid but not exceptional; the category wins on macro alignment with transition narratives and geopolitical scarcity signals. The real constraint is that industrial metals (78.1) and nuclear energy (76.6) posted much higher composite scores, leaving defense in the second tier despite trending well above the 50W and 200W with confirmed breadth. At 5%, we maintain exposure to defense durability and capex cycles without overweighting a sector that benefits from late-cycle reflation but lacks the leverage to energy and metals scarcity that the top two categories possess.
Utilities & Infrastructure — XLU
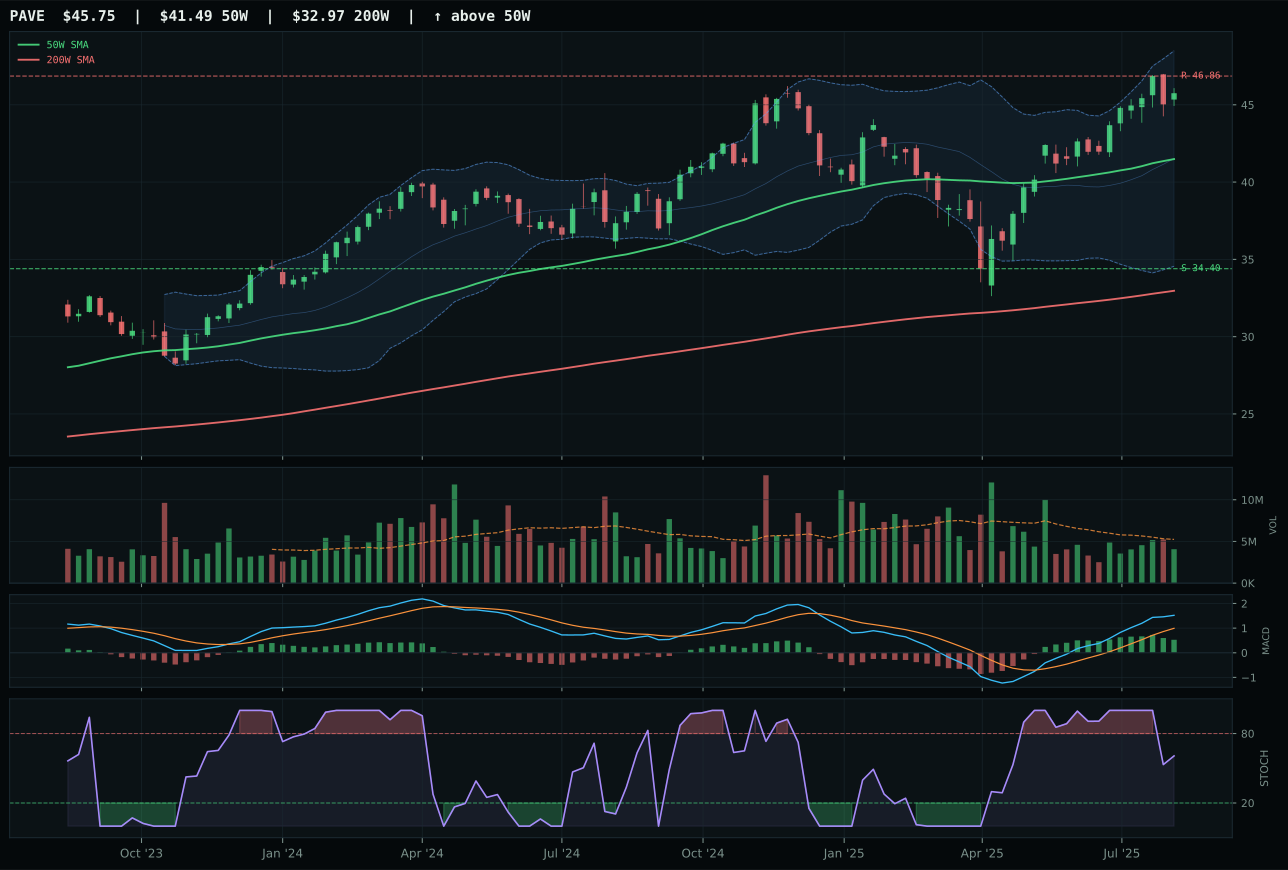
PAVE has a neutral structure profile with 1.0% 13-week relative strength versus SPY.
A failed hold above support would weaken the setup.
Actionable but governed by invalidation levels.
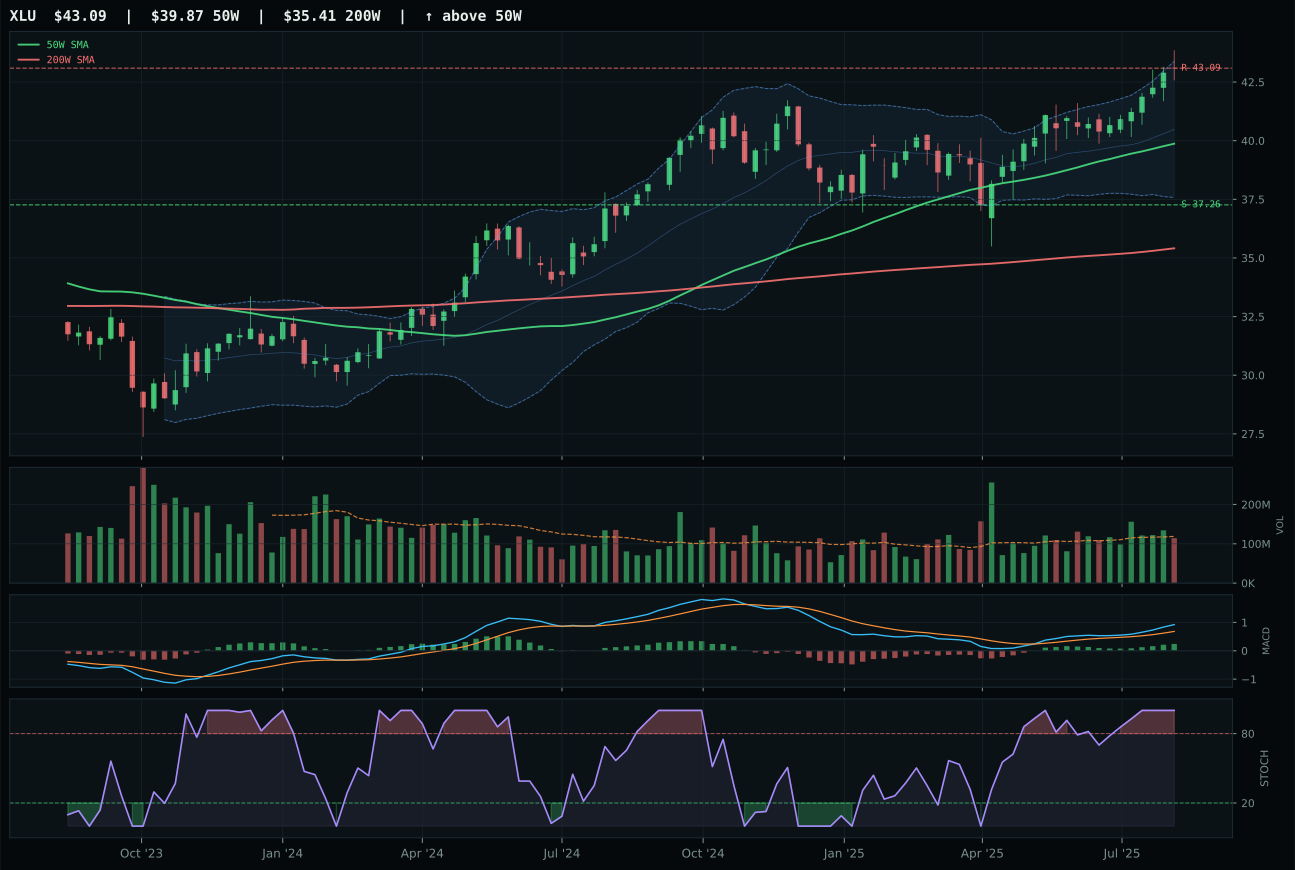
XLU has a neutral structure profile with -5.5% 13-week relative strength versus SPY.
A failed hold above support would weaken the setup.
Actionable but governed by invalidation levels.
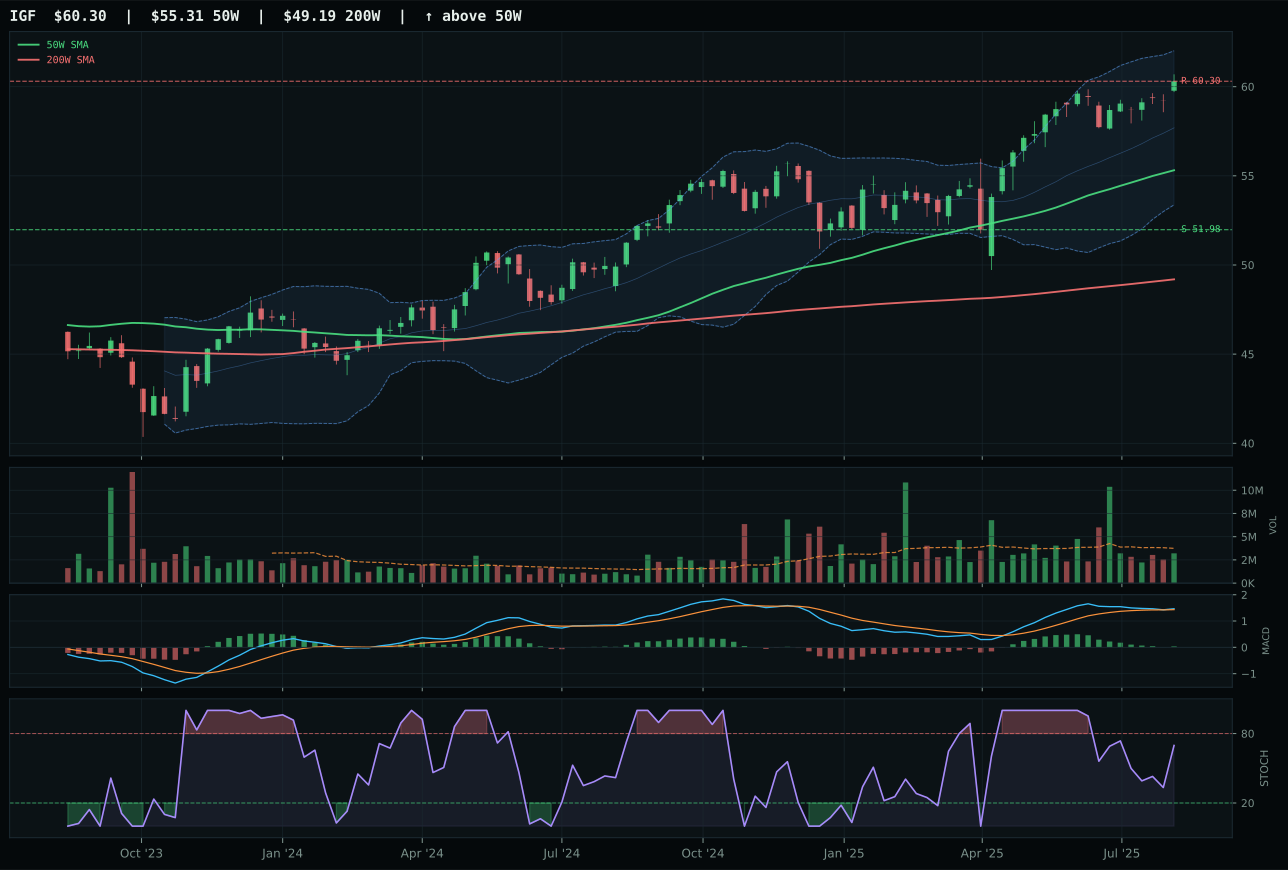
IGF has a neutral structure profile with -7.7% 13-week relative strength versus SPY.
A failed hold above support would weaken the setup.
Actionable but governed by invalidation levels.
XLU wins a tight battle over PAVE on timing quality and MACD confirmation despite nearly identical technical evidence scores. Both XLU and PAVE posted 76 composite scores with trend readings of 92 and 98 respectively, but XLU's 75.0 timing decisively beats PAVE's 62.0 because XLU has a bullish-and-improving MACD versus PAVE's bullish-but-flattening signal, and sits only 8.1% above the 50-week versus PAVE's deeper extended position. XLU's stochastic RSI is overbought momentum at 1.00, indicating a potential pullback but also proving conviction, while PAVE's falling-neutral stochastic at a lower reading suggests less urgency. Risk-reward is 54.2 for XLU versus 38.3 for PAVE—a 16-point edge driven by tighter resistance at just breakeven and meaningful support at 15.6% downside. XLU's 80.3 structure score versus PAVE's 79.6 is marginal, but combined with superior MACD progression, XLU edges the runner-up in a near-peer decision where both are near 52-week lows in repair-zone Fibonacci positioning.
Utilities & Infrastructure earns 5% as a tier-2 allocation, ranked sixth overall at 54.9, because moderate technical merit meets weak macro fit in a portfolio already tilted toward scarcity plays. The category-level macro fit of 43.0 is the weakest among all tier-2 holds: inflation pressure is a -6 headwind, reflecting that rate-sensitive utilities underperform in reflation, and liquidity stress (-3) plus risk-appetite-negative (-2) add further friction. XLU's 74.6 technical evidence is solid but not exceptional in a portfolio where industrial metals and nuclear both posted 80+ scores. The allocation reflects portfolio construction: utilities provide defensive ballast and dividend stability, which matter in a late-cycle environment even when macro isn't explicitly supportive. At 5%, we're maintaining a core position in regulated utility cash flows rather than making a bullish call. For utilities to move up to 10%, we'd need either inflation expectations to reverse materially or for XLU to demonstrate accumulation above the 50-week with improved MACD—currently it's flattening, not accelerating. Until then, utilities sit as portfolio stabilizer while the real-assets rotation concentrates capital in energy, metals, and nuclear where supply constraints are more decisively priced.
Technology — XLK
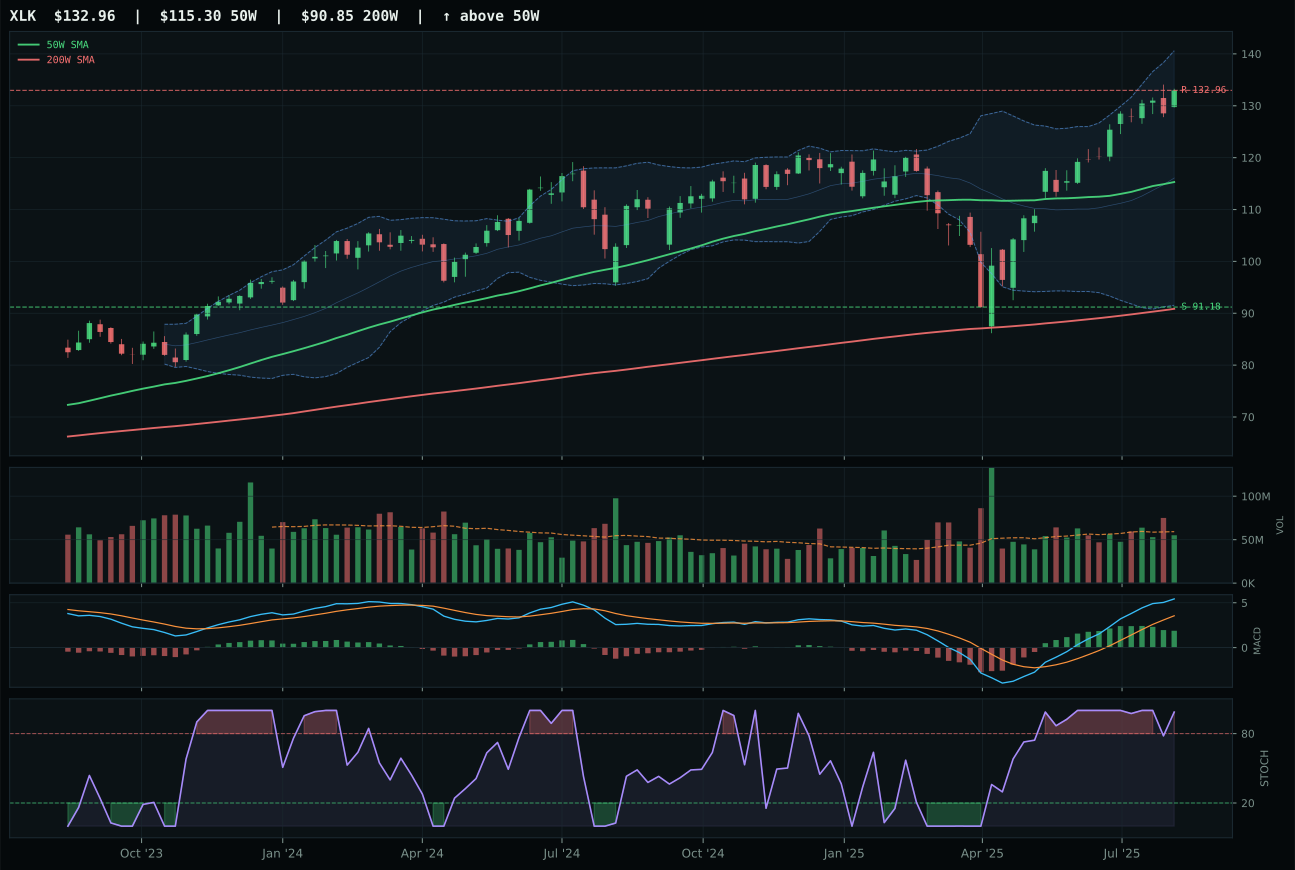
XLK has a vertical extension profile with 9.3% 13-week relative strength versus SPY.
A failed hold above support would weaken the setup.
Actionable but governed by invalidation levels.
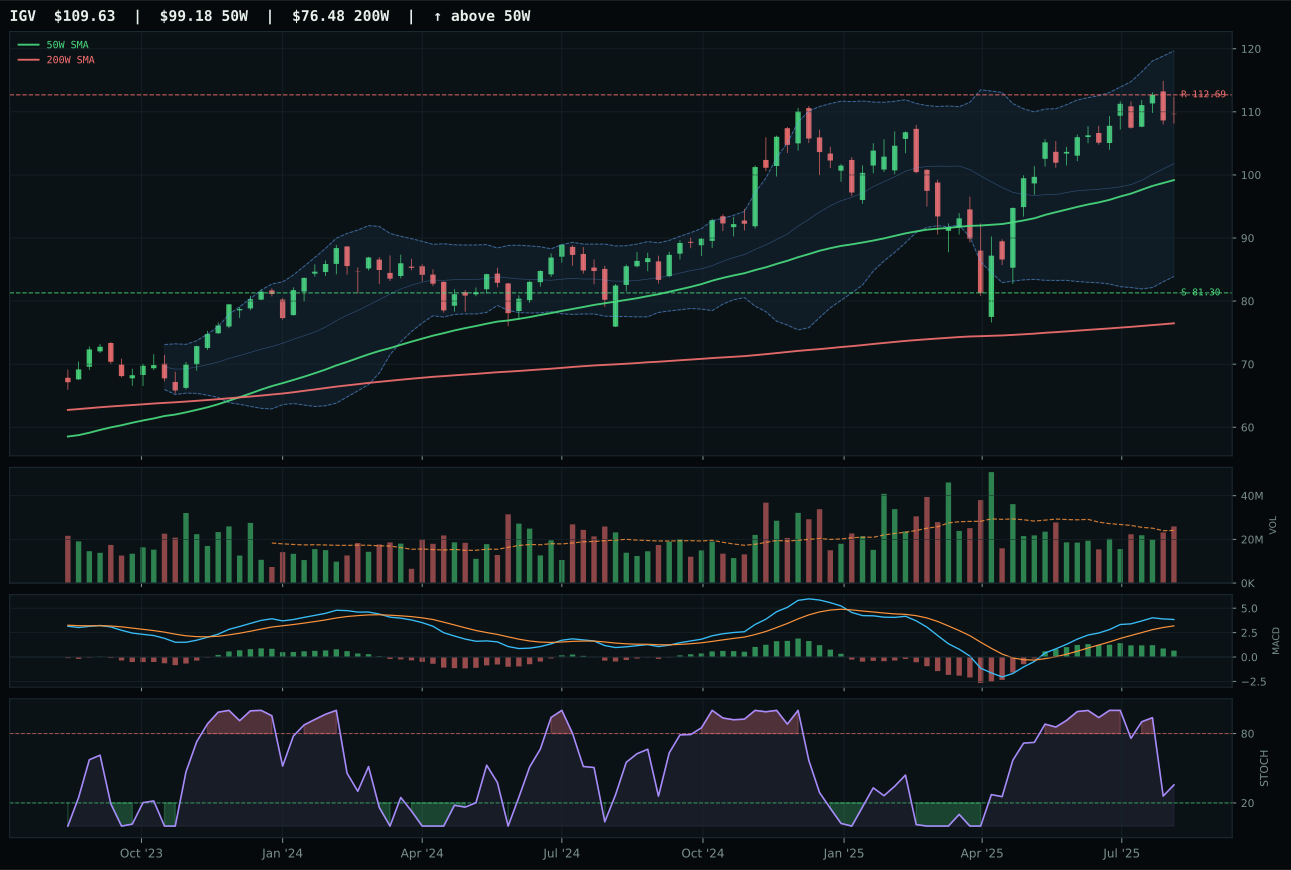
IGV has a neutral structure profile with -2.9% 13-week relative strength versus SPY.
A failed hold above support would weaken the setup.
Actionable but governed by invalidation levels.
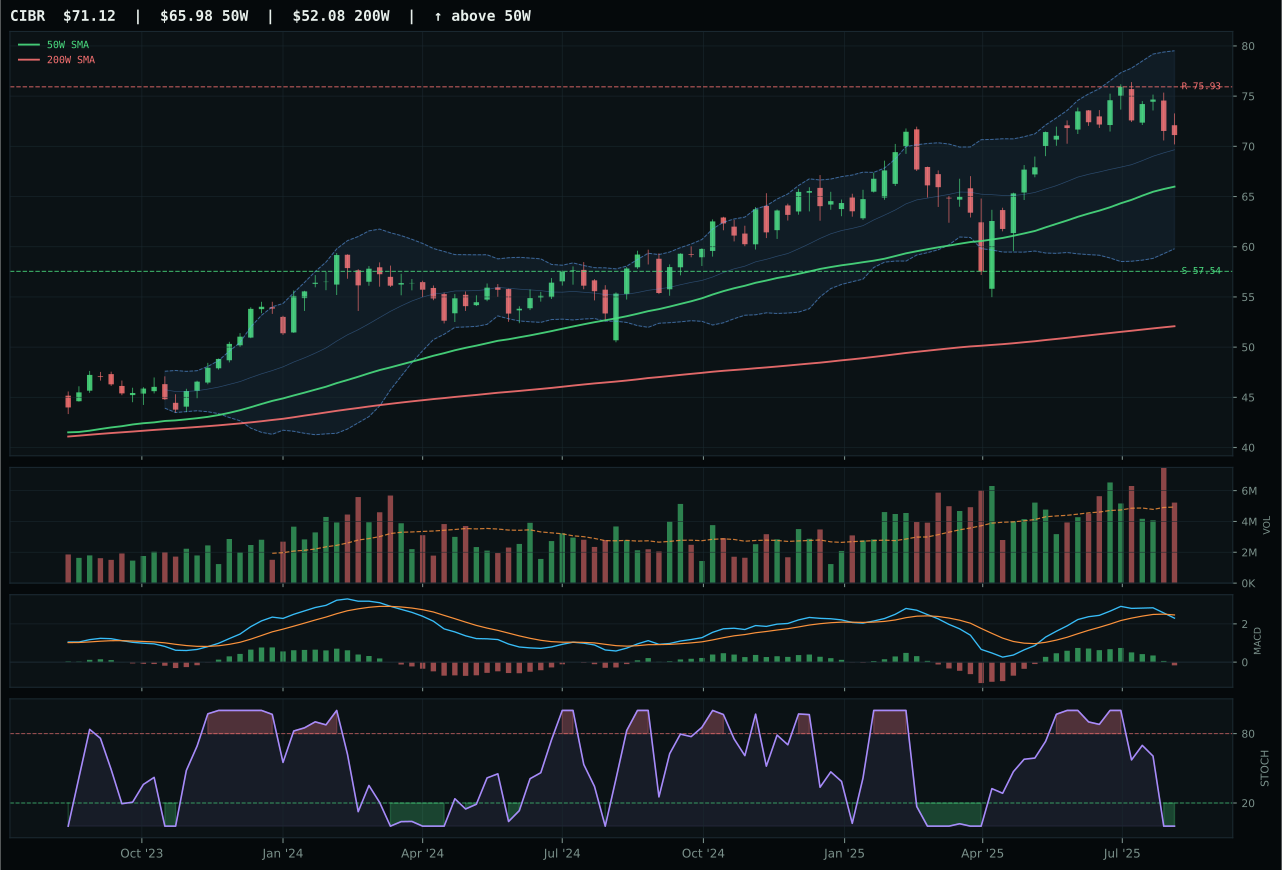
CIBR has a neutral structure profile with -8.2% 13-week relative strength versus SPY.
A failed hold above support would weaken the setup.
Actionable but governed by invalidation levels.
XLK wins the category on relative strength inside its peer set and clean momentum confirmation despite extended positioning. The 12.2% category-relative strength versus IGV's flat reading (0.0%) tells us there's genuine accumulation in broad profitable tech leadership rather than a generic sector bounce. XLK's MACD is bullish but flattening and stochastic RSI is rolling over from overbought, which typically signals a pause in velocity—yet the 22.2% thirteen-week return, 100.0 momentum confirmation score, and neutral volume at 0.93x average proves this isn't distribution, it's consolidation. IGV, the runner-up, failed on two counts: its risk-reward ratio of 46.4 versus XLK's 56.1 reflects tighter downside (45.8% support cushion), and its -2.9% thirteen-week SPY-relative return shows it lagged the broad market while XLK posted 9.3% outperformance. The setup is a vertical extension 15.5% above the 50-week, which penalizes entry timing at 37.0, but the persistence and volume-price confirmation scores of 85.1 and 69.5 respectively indicate the move is being held, not faded.
Technology earns 5% as a tier-2 hold despite a 49.1 category score that ranks it outside the top two. The macro environment—late-cycle reflation with active risk-appetite-positive and AI-growth-sponsorship signals—provides tailwind, but liquidity stress (-10 points) and credit stress (-7 points) create meaningful headwinds that prevent this category from breaking into the overweight tiers. XLK's technical evidence of 61.7 out of 100 is respectable but insufficient to overcome a category-level macro fit of only 44.0. The tension here is real: we have clean, confirmed momentum in a sector with structural tailwinds from AI adoption, yet the broader macro regime penalizes stretched valuations and early-cycle multiple compression risk. Holding at 5% lets us maintain exposure to profitable technology leadership while respecting that better risk-adjusted opportunities exist elsewhere in the portfolio this week—specifically in real assets and energy where supply constraints are more actionable.
Precious Metals — GLD
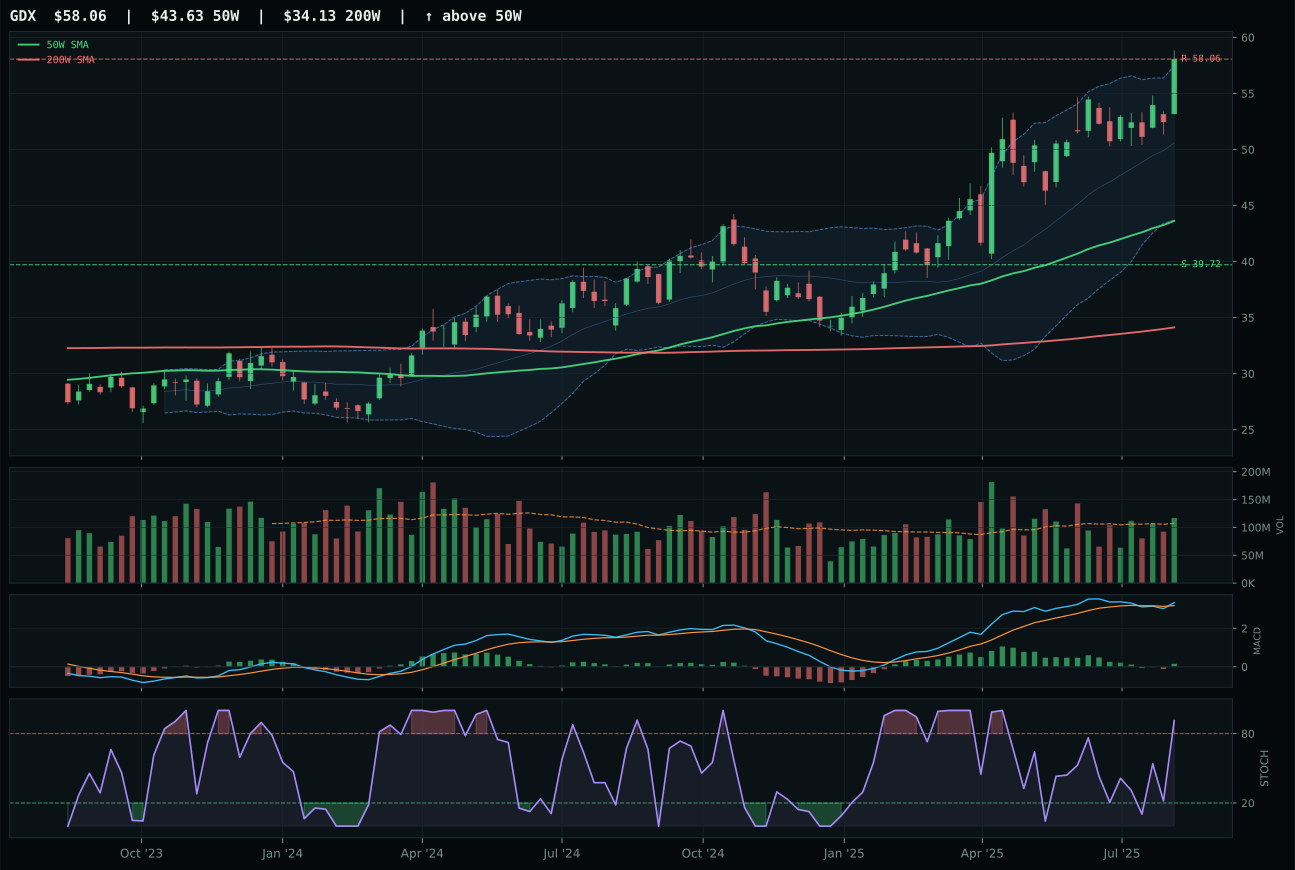
GDX has a vertical extension profile with 2.4% 13-week relative strength versus SPY.
A failed hold above support would weaken the setup.
Actionable but governed by invalidation levels.
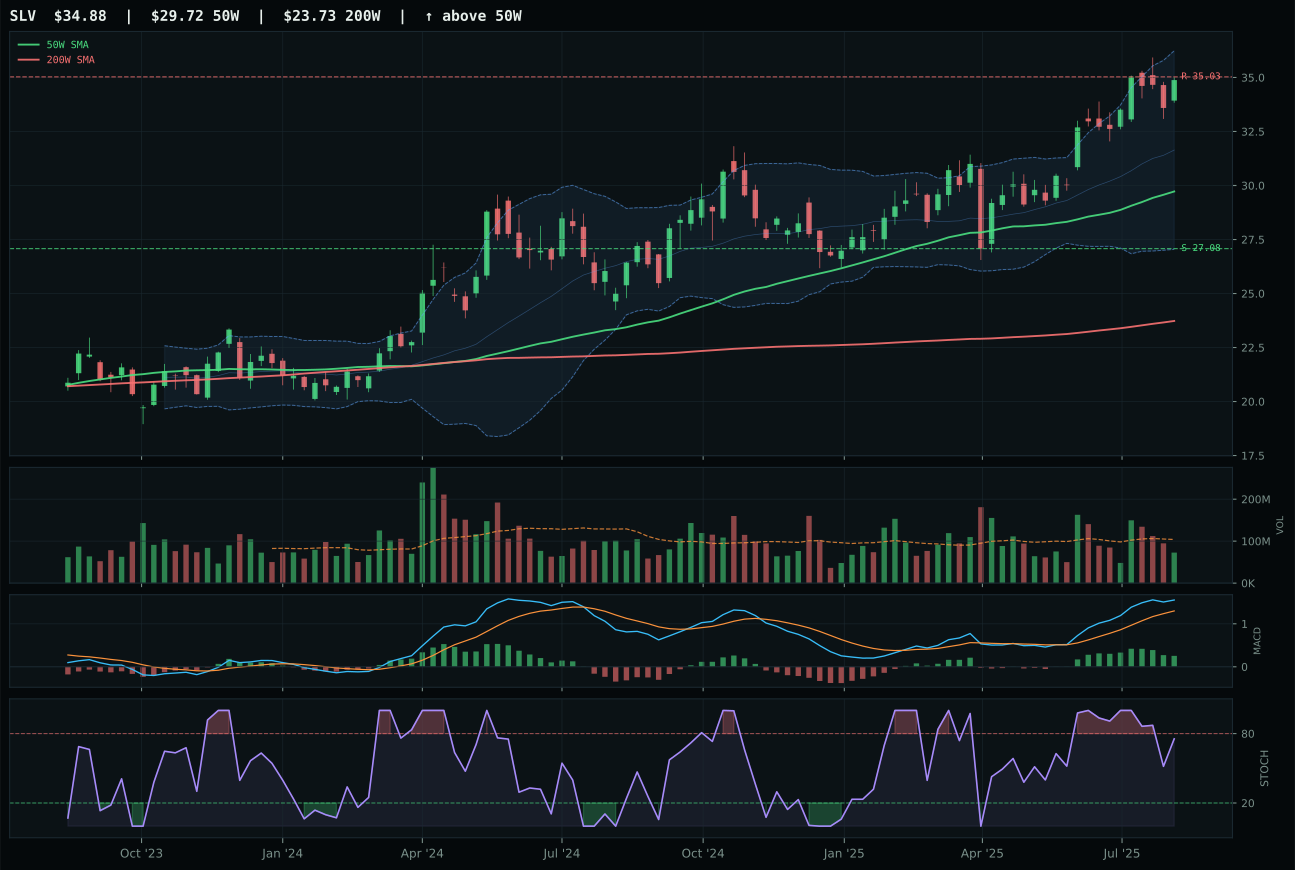
SLV has a vertical extension profile with 4.1% 13-week relative strength versus SPY.
A failed hold above support would weaken the setup.
Actionable but governed by invalidation levels.
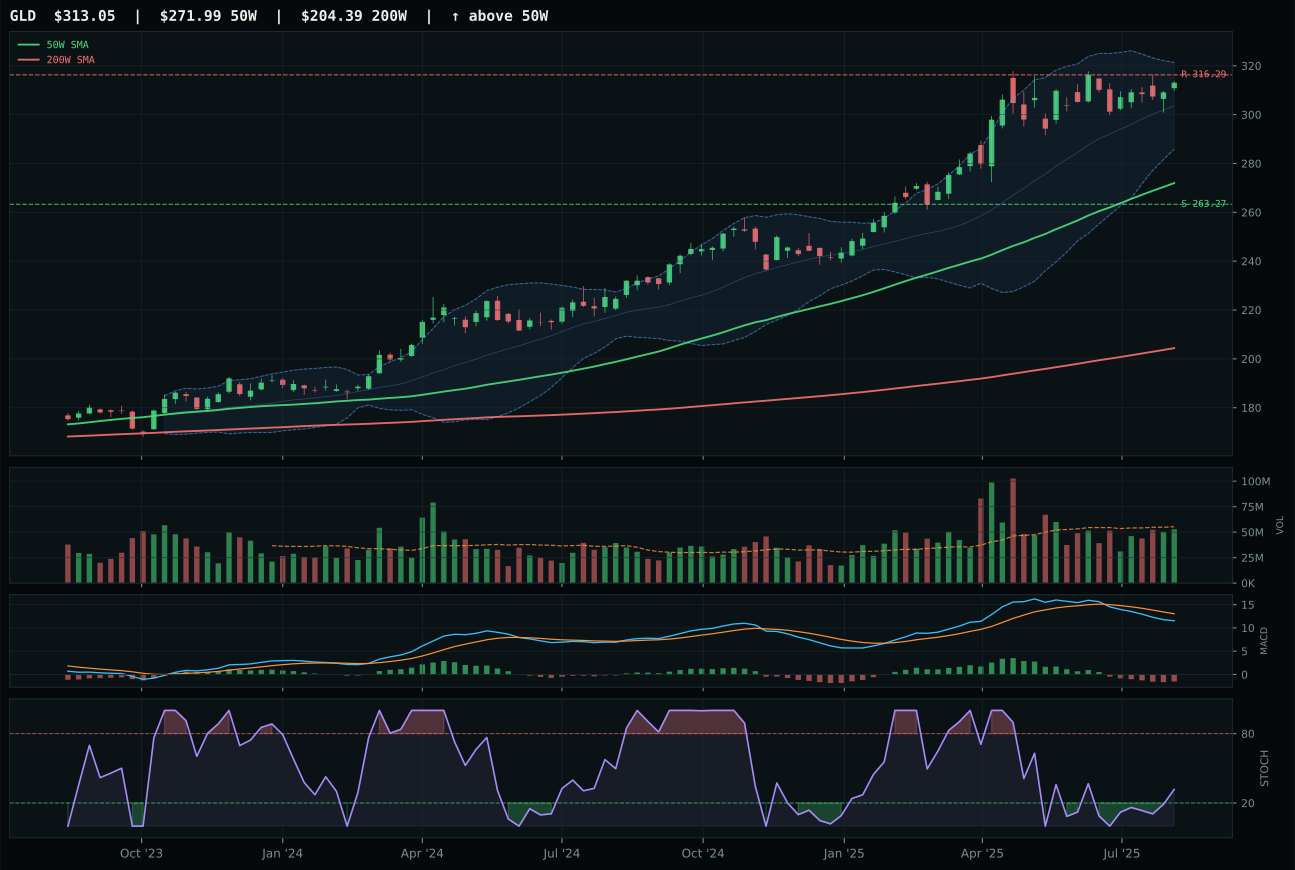
GLD has a vertical extension profile with -10.9% 13-week relative strength versus SPY.
A failed hold above support would weaken the setup.
Actionable but governed by invalidation levels.
GLD wins a weak category by default technical processing rather than strength; this is a category where the winner is barely qualified to hold capital. GLD's 41.8 category score masks severe technical deterioration: a 1.7 momentum confirmation score reflects a 2.0% thirteen-week return paired with -13.2% category-relative weakness and bearish/weakening MACD. The ETF is 15.1% extended above the 50-week with neutral volume and rising mid-zone stochastic RSI—textbook failed momentum. GLD won because SLV and GDX both posted worse timing and macro fit, but the gap is narrow; GDX's 63.8 technical evidence nearly offsets GLD's structural advantage. The runner-up lost because GDX is 33.1% extended above the 50-week in the near 52-week-high extension zone with overbought stochastic rolling over, yet paradoxically GDX's bullish-and-improving MACD and 15.3% thirteen-week return gave it 99.0 momentum confirmation—a textbook setup for mean reversion. GLD's only edge is sitting closer to the 50-week in a less stretched Fibonacci zone, which is not a case for conviction.
Precious metals earns 5% as a tier-2 defensive sleeve, ranked seventh overall at 41.8, because the allocation framework maintains a core hedging position despite weak technicals. The category-level macro fit of 46.0 is only moderate; risk-appetite-positive is the sole active descriptor at -4 points (working against gold), meaning precious metals here are a pure technical play on mean reversion rather than a macro conviction trade. The portfolio's 50% crypto overlay and TrendBTC regime are likely suppressing metals allocation—gold and Bitcoin don't co-perform, and in a reflation + risk-on environment, real assets tied to energy and industrial demand dominate. At 5%, we're keeping a volatility hedge and negative-beta anchor against the equity-heavy posture, not making a bullish metals call. For metals to move up the allocation ladder, we'd need either risk-appetite to turn materially negative or GLD to reclaim the 200-week moving average with above-average volume and improving MACD. Right now it's a portfolio ballast, not a conviction bet.
Traditional Energy — XLE
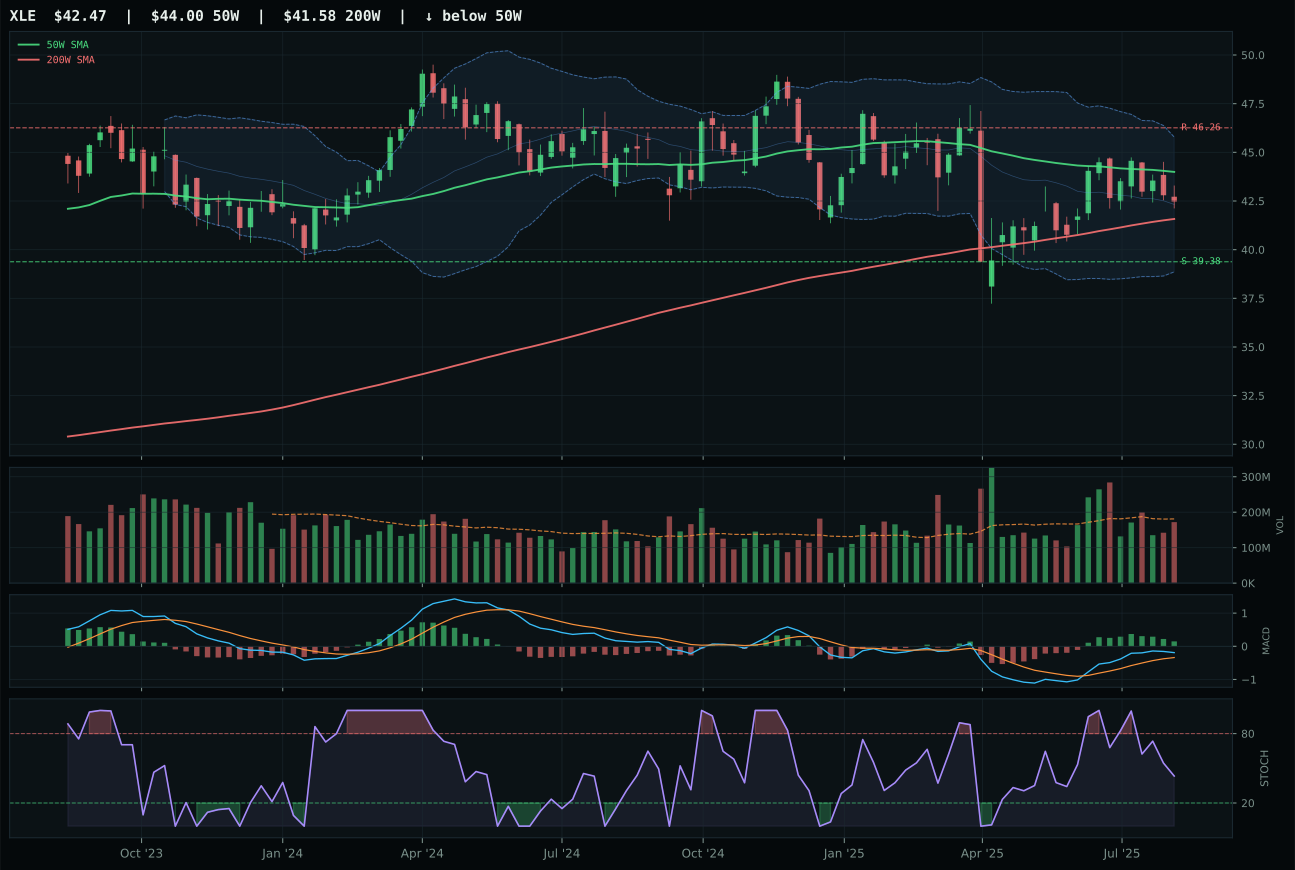
XLE has a neutral structure profile with -9.9% 13-week relative strength versus SPY.
A failed hold above support would weaken the setup.
Actionable but governed by invalidation levels.
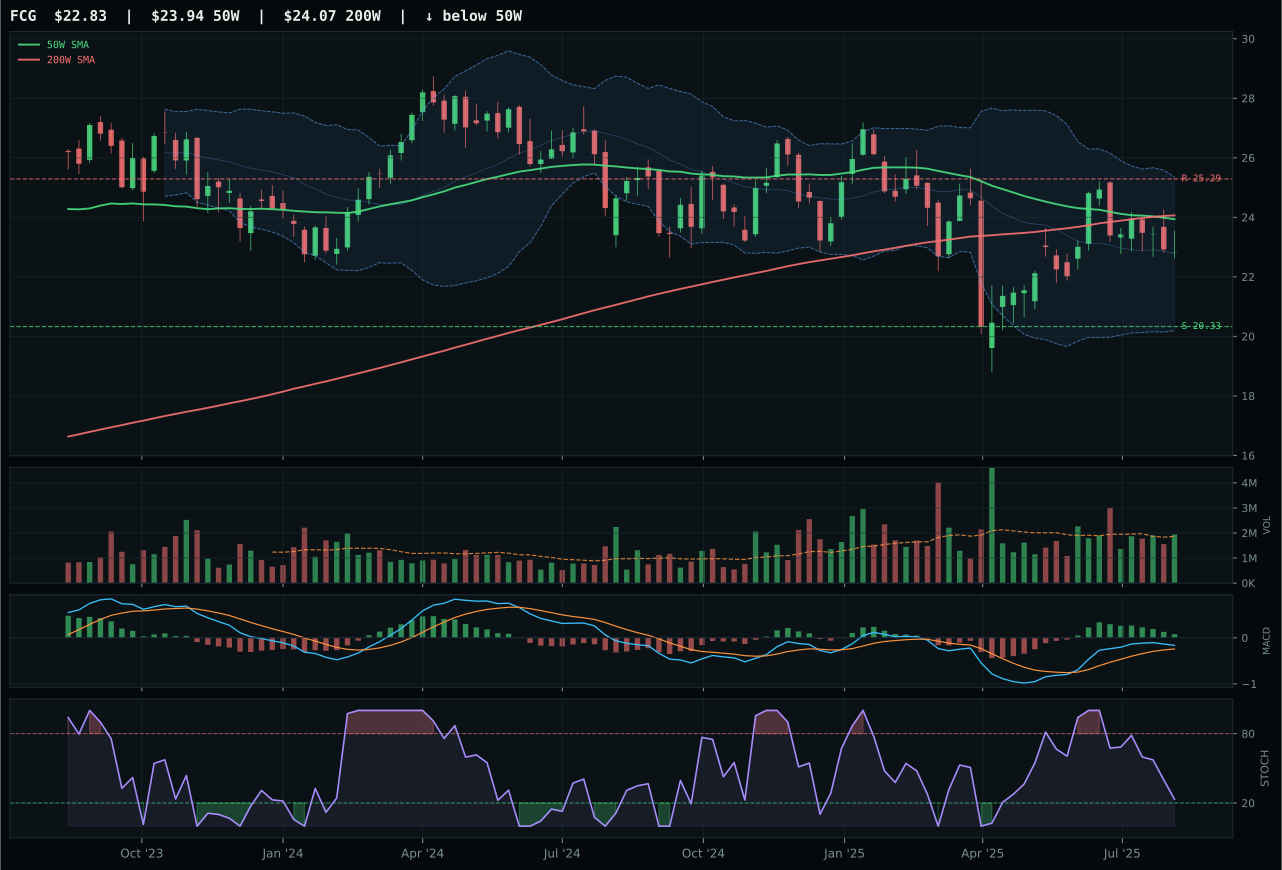
FCG has a neutral structure profile with -9.7% 13-week relative strength versus SPY.
Extension and support failure are the main tactical risks.
Tracked, but not top-2 eligible because: structurally broken.
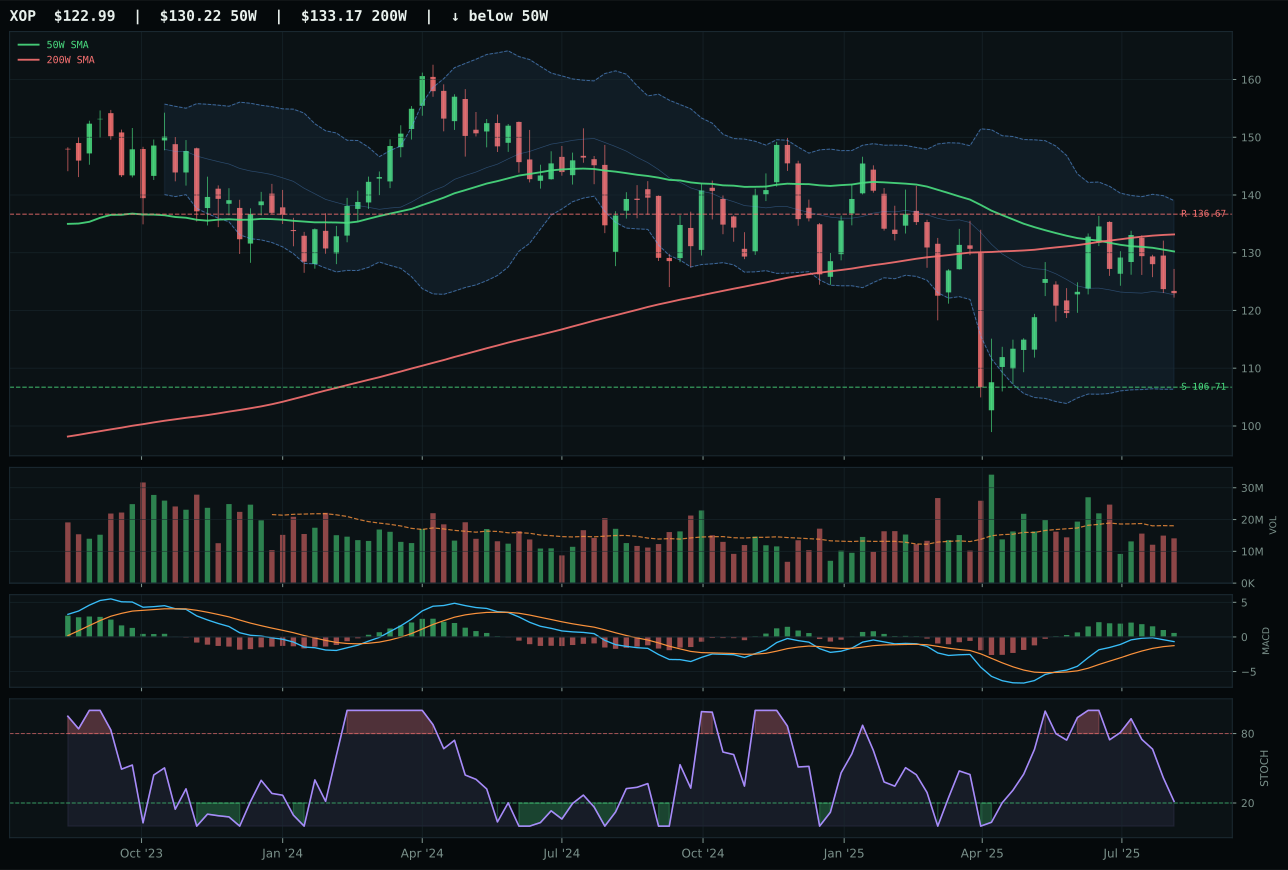
XOP has a neutral structure profile with -9.4% 13-week relative strength versus SPY.
Extension and support failure are the main tactical risks.
Tracked, but not top-2 eligible because: structurally broken.
XLE wins a challenged category by the narrowest of margins over a near-peer runner-up, claiming top billing on superior structure and risk-reward despite energy's broad technical weakness. XLE's 46.2 trend score reflects price below the 50-week but still above the 200-week—a repair setup, not a breakdown. The critical win comes from risk-reward at 63.9 versus FCG's lower score, driven by a -8.2% upside-to-resistance level that still offers 7.8% downside to support. XLE's timing score of 85.0 is exceptional for a pullback setup, reflecting the Fibonacci 0.786 zone and falling-neutral stochastic that signal capitulation. FCG lost because structure quality cratered to 37.5—the hard filter flagged it as structurally broken, meaning support levels or technical integrity is compromised. Volume participation is neutral across energy names at 0.95x average, so differentiation comes down to chart cleanliness and positioning. XLE's 71.4 structure versus FCG's 37.5 is the deciding factor in a category where fundamentals (energy scarcity, supply shortage) matter more than timing.
Energy earns 5% as a tier-2 allocation, ranked fifth overall at 40.9, because macro support is exceptional but technicals remain unconvincing. The category-level macro fit of 90.0 is the second-strongest in the portfolio after agriculture, driven by late-cycle reflation (+12), energy scarcity (+16), inflation pressure (+10), supply shortage (+9), and real asset sponsorship (+7)—a 60+ point tailwind. Yet XLE's technical evidence is only 48.2, a gap that prevents energy from cracking the top two. The ETF is in repair mode below the 50-week, which means we're buying a mean-reversion play on energy scarcity, not riding an established uptrend. The portfolio's real-asset allocation is already heavily weighted to REMX (+10%) and NLR (+10%), which capture scarcity with better technicals. At 5%, energy is a macro satellite position—we're betting geopolitical and production disruptions will eventually force price higher, but we're not committing capital to lead the move. For energy to earn 10%, we'd need XLE to reclaim the 50-week with accumulation volume and MACD confirmation, proving the supply story is translating into actual accumulation rather than just macro narrative.
Agriculture & Livestock — MOO
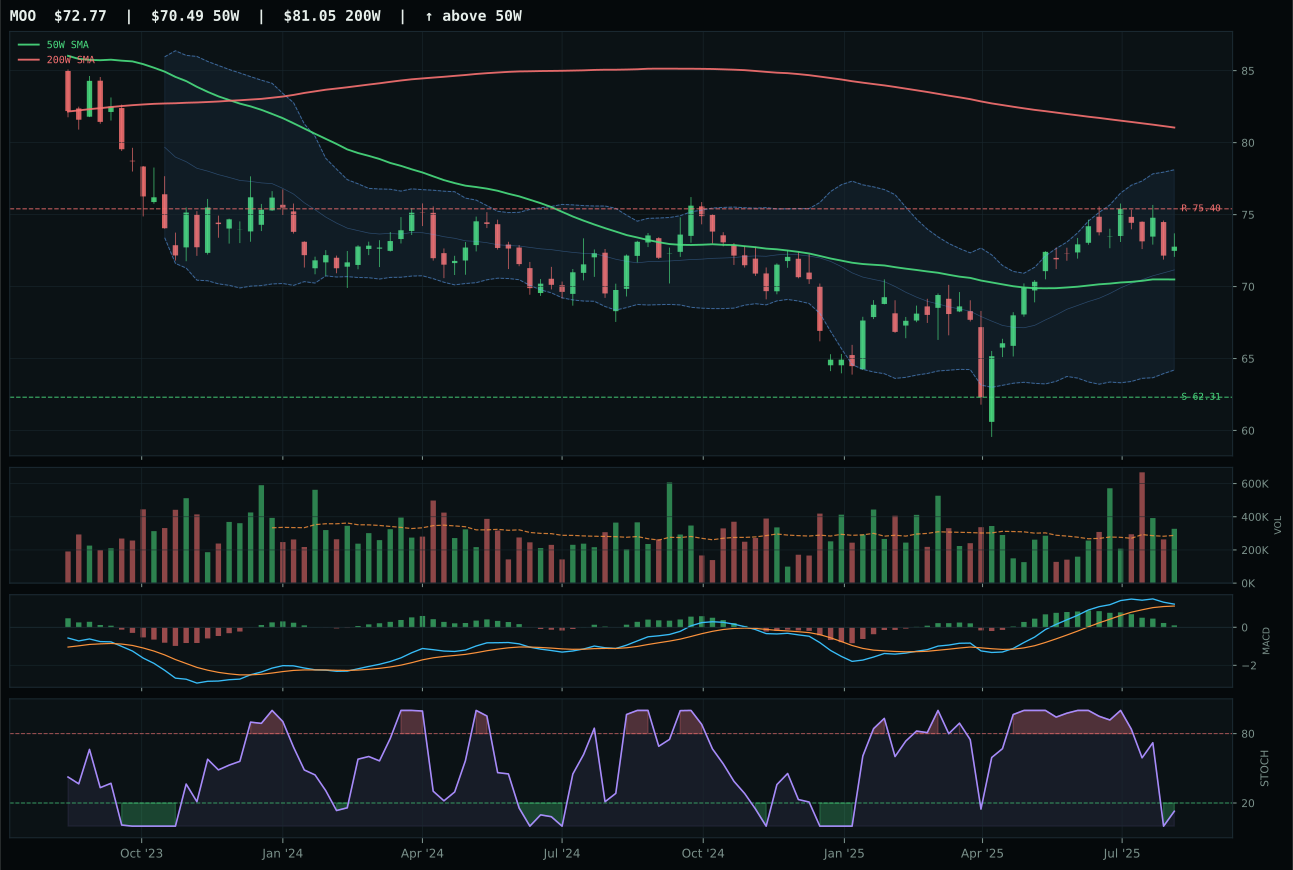
MOO has a neutral structure profile with -9.4% 13-week relative strength versus SPY.
A failed hold above support would weaken the setup.
Actionable but governed by invalidation levels.
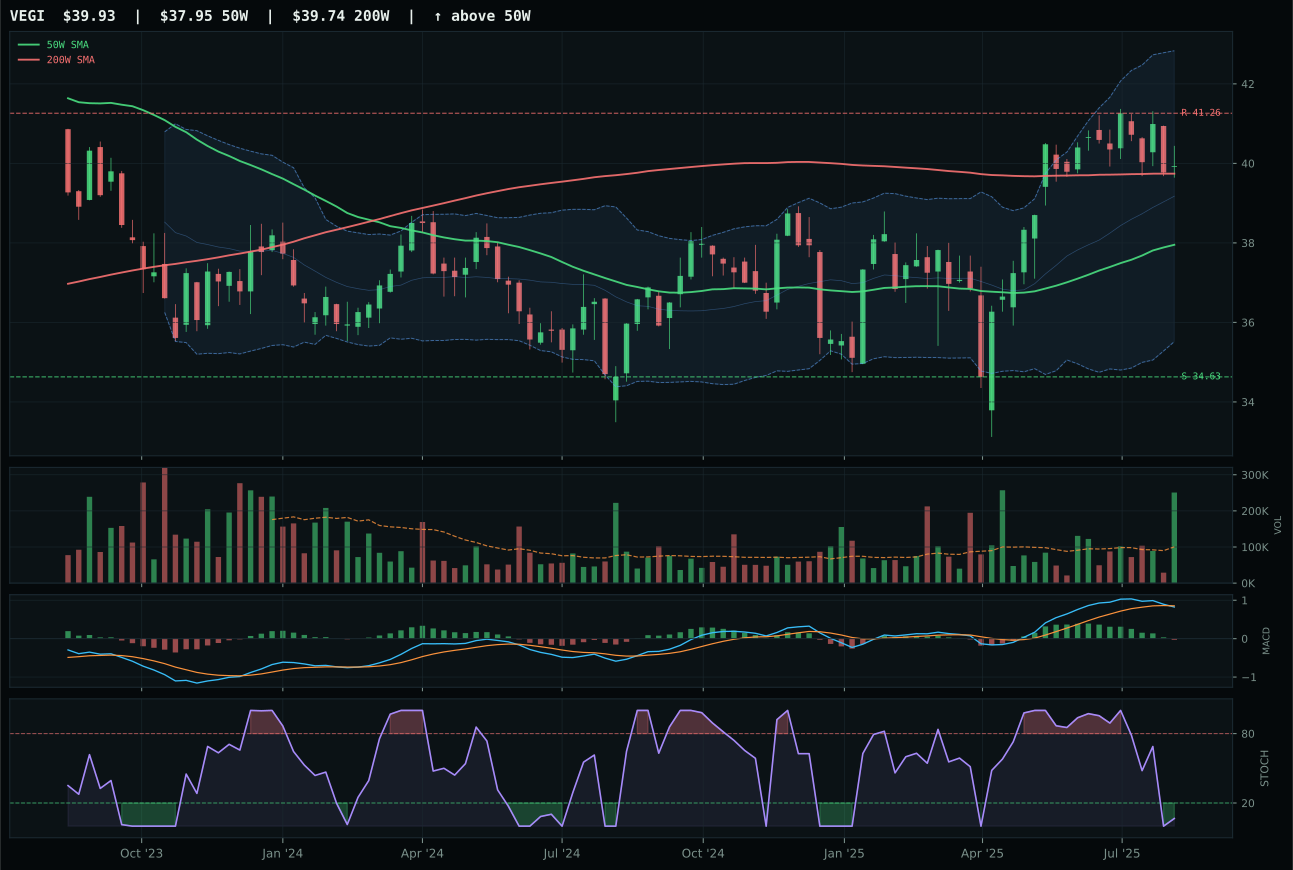
VEGI has a neutral structure profile with -9.7% 13-week relative strength versus SPY.
A failed hold above support would weaken the setup.
Tracked, but not top-2 eligible because: .
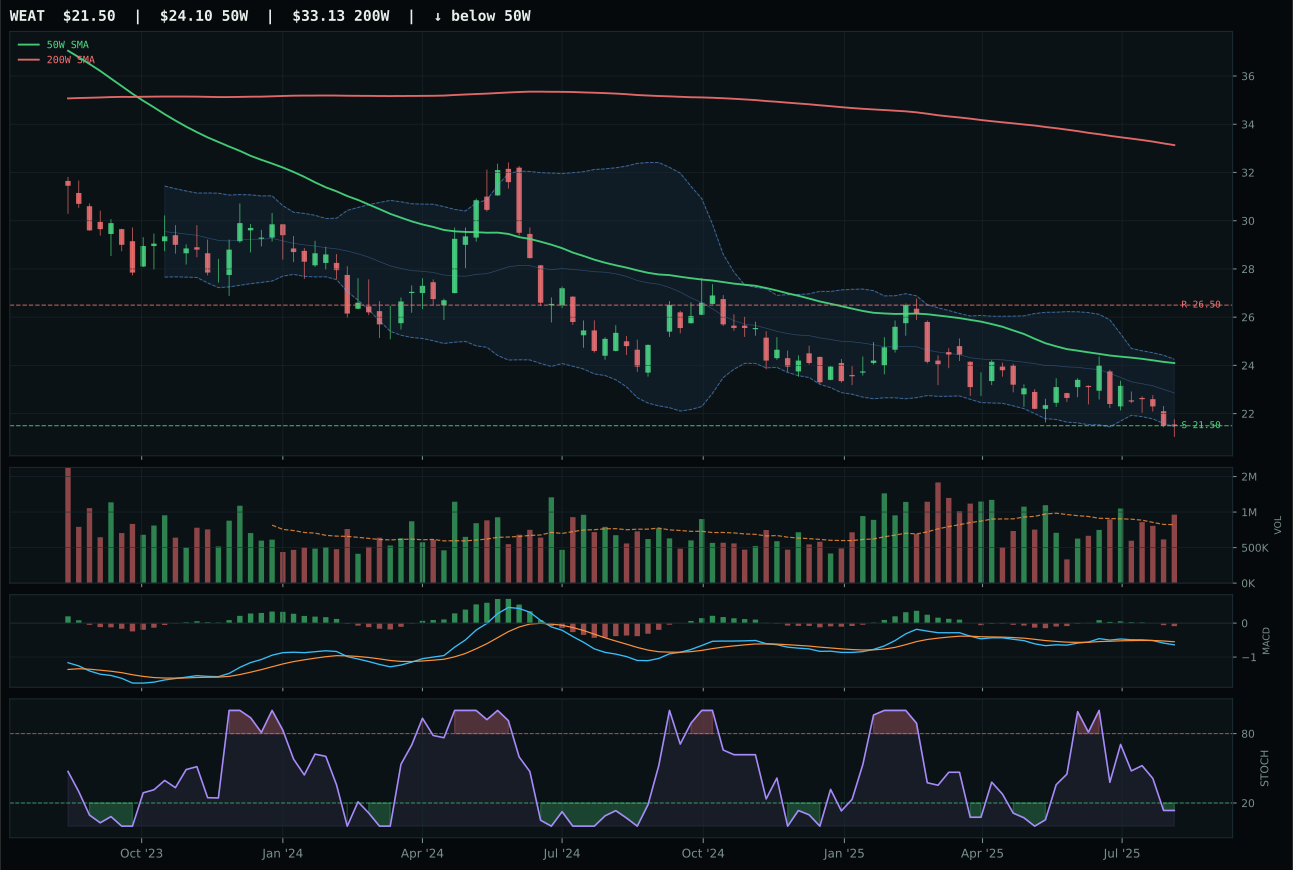
WEAT has a pullback into support profile with -16.1% 13-week relative strength versus SPY.
Extension and support failure are the main tactical risks.
Tracked, but not top-2 eligible because: structurally broken.
MOO wins the category despite significant technical weakness, which underscores how severely macro-driven this allocation is. The ETF is only marginally above the 50-week and below the 200-week, posting a 51.8 trend score and just 3.5% thirteen-week return with -9.4% SPY-relative weakness. Yet MOO's timing score of 85.0 reflects an oversold stochastic at 0.13 paired with MACD bullish but flattening near support—a classic coil setup. VEGI lost primarily because its MACD is bearish/weakening rather than bullish, a critical signal difference in a mean-reversion frame. MOO's 44.5 momentum confirmation is weak, but the 90.0 category-level macro fit—driven by supply shortage (+13), inflation pressure (+10), real asset sponsorship (+8), and commodity breadth positive (+5)—overwhelms technical evidence in this bucket. The category reasoner weighted technical at 62% and macro at 38%, meaning a 53.2 technical score paired with 70.0 ETF-level macro fit was sufficient to win the beauty contest.
Agriculture receives 0% allocation this week and ranked 9th or 10th, excluded entirely despite a compelling macro narrative. The category score of 38.2 tells the real story: while the macro fit of 90.0 is exceptional—the strongest macro support in the portfolio—the technical evidence of 53.2 is too weak to justify allocation in a framework that prioritizes risk-adjusted compounding. MOO's 51.8 trend score and below-200W positioning mean we're buying into weakness on macro faith, not technical confirmation. In a late-cycle reflation regime, that's a low-conviction bet. The portfolio framework surfaces a key tension: agriculture has real scarcity tailwinds, but the technicals are telling us supply disruptions haven't yet translated into breadth or accumulation signals. What would change this: we need to see MOO close above its 200-week moving average with above-average volume and MACD confirmation, not a repair-zone setup trading on hope. Until the charts catch up to the macro story, agriculture sits on the sidelines while energy, metals, and nuclear—which have both macro support and technical confirmation—carry the real-asset allocation.
Emerging Markets — IEMG
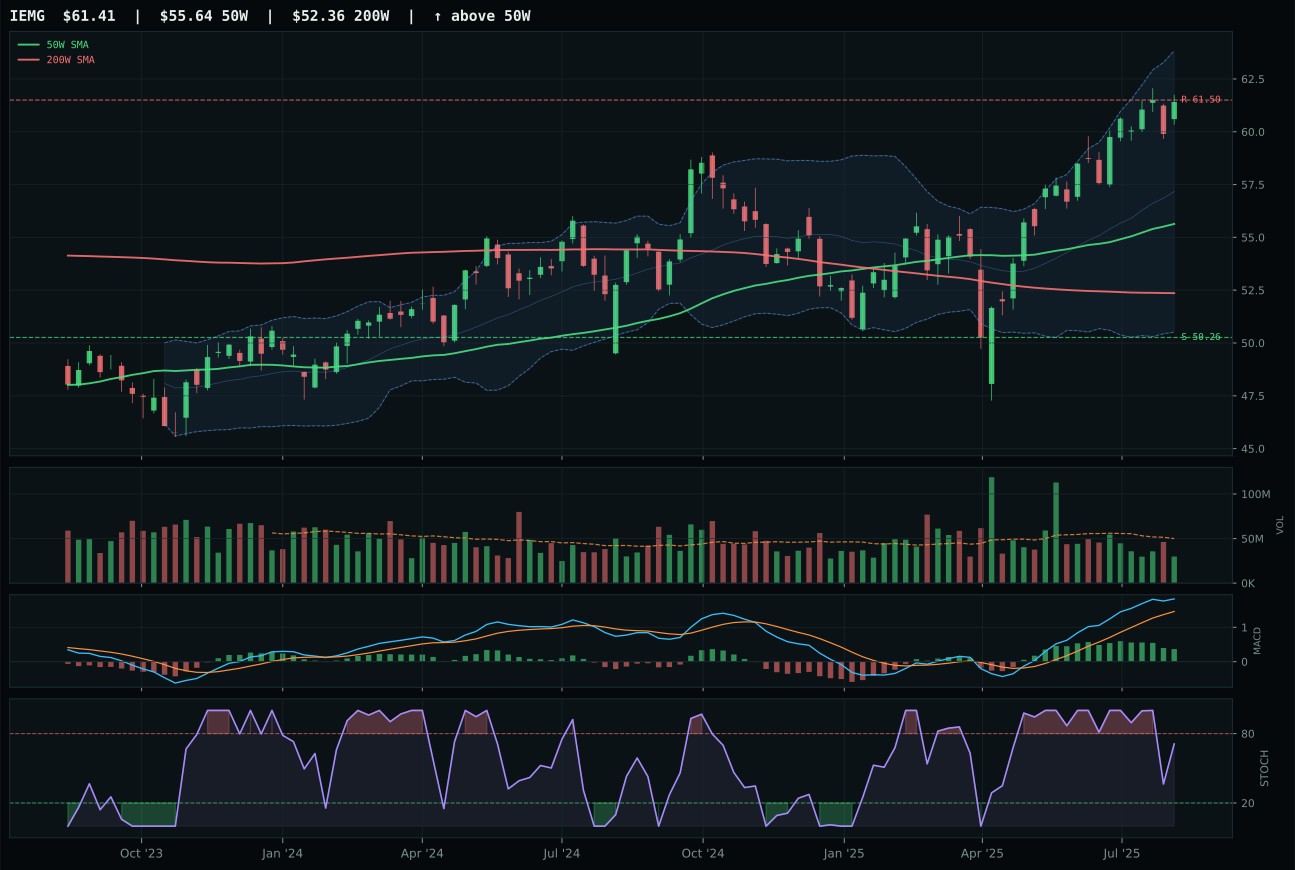
IEMG has a neutral structure profile with -2.3% 13-week relative strength versus SPY.
A failed hold above support would weaken the setup.
Actionable but governed by invalidation levels.
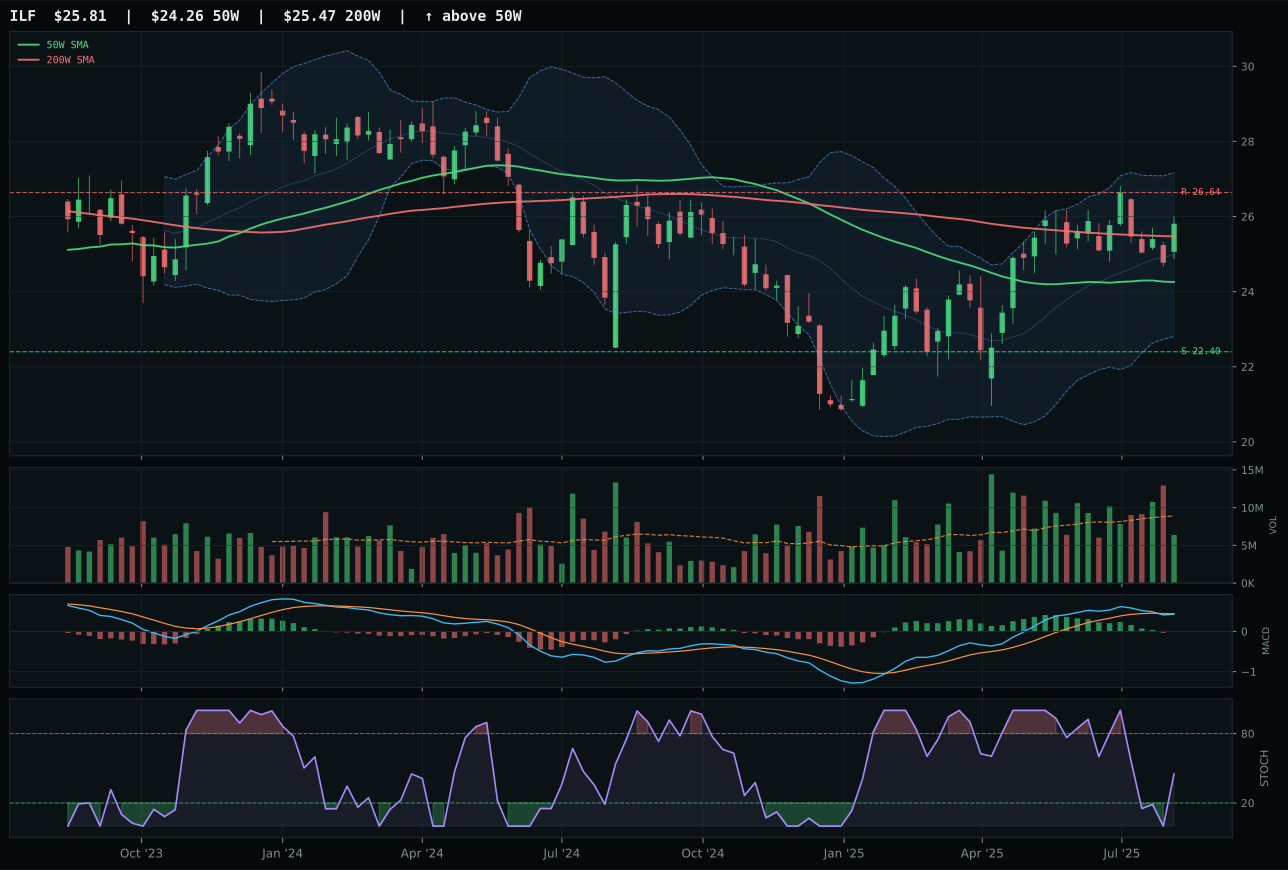
ILF has a neutral structure profile with -11.5% 13-week relative strength versus SPY.
A failed hold above support would weaken the setup.
Actionable but governed by invalidation levels.
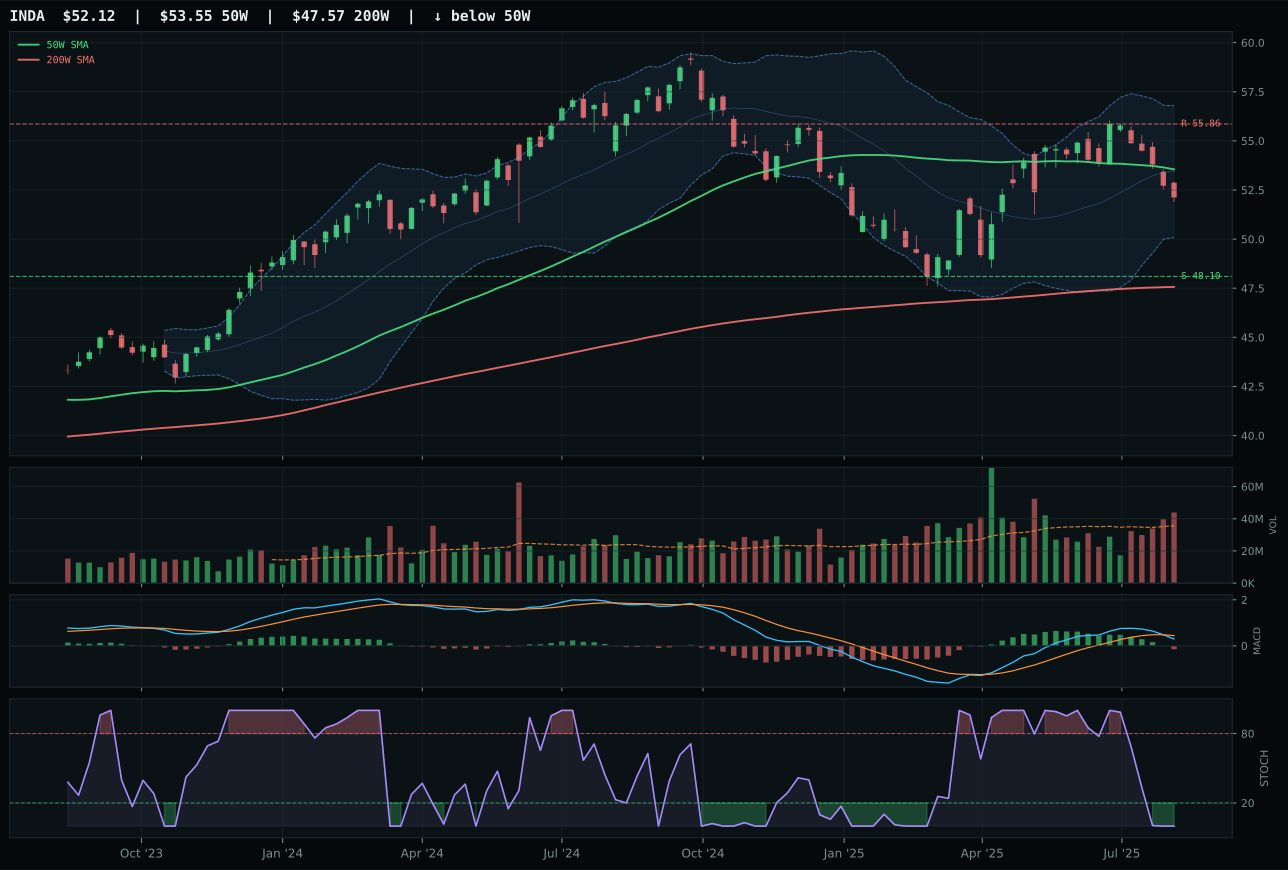
INDA has a compression near 50W profile with -13.4% 13-week relative strength versus SPY.
A failed hold above support would weaken the setup.
Actionable but governed by invalidation levels.
IEMG wins a weak emerging-markets basket on relative strength and MACD confirmation, but the category itself earns zero allocation because technicals and macro alignment both fail. IEMG's 69.0 technical evidence beats ILF's 33.7 decisively, driven by a bullish-but-flattening MACD versus ILF's bearish/weakening signal, and a 9.1% category-relative strength edge over ILF's flat reading. IEMG's 82.5 trend score reflects price above both major moving averages, and a 10.6% thirteen-week return with falling-neutral stochastic RSI at 0.71 suggests mean reversion is building. Yet the real problem is the category-level macro fit of only 38.0—risk-appetite-positive provides +8 points, but credit stress (-10) and liquidity stress (-10) create a -12 point combined headwind that overwhelms any technical edge. ILF lost because bearish MACD, -9.7% SPY-relative weakness, and a 1.5% thirteen-week return disqualify it entirely, but neither runner-up came close to overcoming the macro environment.
Emerging markets earns 0% allocation this week and ranked dead last at 9th or 10th, excluded entirely because macro headwinds overwhelm technical evidence. The category score of 18.3 reflects a collision between decent technical merit (IEMG's 69.0 technical evidence and 75.3 momentum confirmation) and hostile macro conditions. In a late-cycle reflation regime, credit stress (-10) and liquidity stress (-10) are twin anvils on emerging-market beta; risk-appetite-positive (+8) cannot offset that -20 point swing. IEMG sits at 10.4% above the 50-week with thin participation at 0.60x average volume—momentum without conviction. The portfolio's 50% crypto overlay in TrendBTC mode is likely the real constraint; Bitcoin capital tends to flow out of emerging-market equities in reflation cycles where developed-market assets capture scarcity plays. What would earn EM an allocation: we need credit stress to flip positive or liquidity to stabilize, coupled with technical breakout above recent highs on expanding volume. Until then, EM sits on the sidelines while industrial metals, nuclear, and energy—where scarcity is priced in both macro and technicals—carry the real-assets rotation.