
2025-08-01
Informational purposes only. The content in this report, including allocations, analysis, and commentary, is provided solely for informational and educational purposes. It does not constitute financial advice, investment advice, trading advice, or any other type of advice. Past performance does not guarantee future results. Always conduct your own research and consult a qualified financial professional before making investment decisions.
Weekly Allocation
| Ticker | Category | Weight | Role |
|---|---|---|---|
| FBTC | 50% | Overlay | |
| BOTZ | AI | 10% | Top-2 (10%) |
| NLR | Nuclear Energy | 10% | Top-2 (10%) |
| XLU | Utilities & Infrastructure | 5% | Tier-2 (5%) |
| XLK | Technology | 5% | Tier-2 (5%) |
| COPX | Industrial Metals | 5% | Tier-2 (5%) |
| ITA | Defense & Aerospace | 5% | Tier-2 (5%) |
| GLD | Precious Metals | 5% | Tier-2 (5%) |
| MOO | Agriculture & Livestock | 5% | Tier-2 (5%) |
Trade Instructions — Monday Open
Sell the tranche from 2025-07-04 (completing its 4-week hold). Buy the new tranche. Instructions show net portfolio changes — same-asset positions cancel, weight changes show the delta.
| Action | Ticker | Instruction |
|---|---|---|
| SELL | COPX | Sell 25% of COPX position (reduce 5.00% → 3.75%) |
| SELL | URNM | Sell 67% of URNM position (reduce 3.75% → 1.25%) |
| SELL | SMH | Sell 33% of SMH position (reduce 3.75% → 2.50%) |
| SELL | PAVE | Sell 25% of PAVE position (reduce 5.00% → 3.75%) |
| SELL | XLE | Sell 20% of XLE position (reduce 6.25% → 5.00%) |
| SELL | SLV | Sell 33% of SLV position (reduce 3.75% → 2.50%) |
| SELL | XAR | Sell 33% of XAR position (reduce 3.75% → 2.50%) |
| BUY | MOO | Buy MOO — 12.50% of freed cash (adds 1.25% to portfolio) |
| BUY | NLR | Buy NLR — 25.00% of freed cash (adds 2.50% to portfolio) |
| BUY | BOTZ | Buy BOTZ — 25.00% of freed cash (adds 2.50% to portfolio) |
| BUY | ITA | Buy ITA — 12.50% of freed cash (adds 1.25% to portfolio) |
| BUY | XLU | Buy XLU — 12.50% of freed cash (adds 1.25% to portfolio) |
| BUY | GLD | Buy GLD — 12.50% of freed cash (adds 1.25% to portfolio) |
Current Portfolio After Trade
Combined holdings across all 4 active tranches. Each tranche is 25% of the portfolio.
| Ticker | % of Portfolio | Weight Bar |
|---|---|---|
| FBTC | 50.00% | |
| XLE | 5.00% | |
| REMX | 5.00% | |
| NLR | 5.00% | |
| COPX | 3.75% | |
| XLK | 3.75% | |
| PAVE | 3.75% | |
| MOO | 3.75% | |
| BOTZ | 3.75% | |
| SMH | 2.50% | |
| SLV | 2.50% | |
| XAR | 2.50% | |
| URA | 2.50% | |
| ITA | 2.50% | |
| URNM | 1.25% | |
| XLU | 1.25% | |
| GLD | 1.25% |
Macro Regime — Transition / Mixed
Macro Evidence Charts
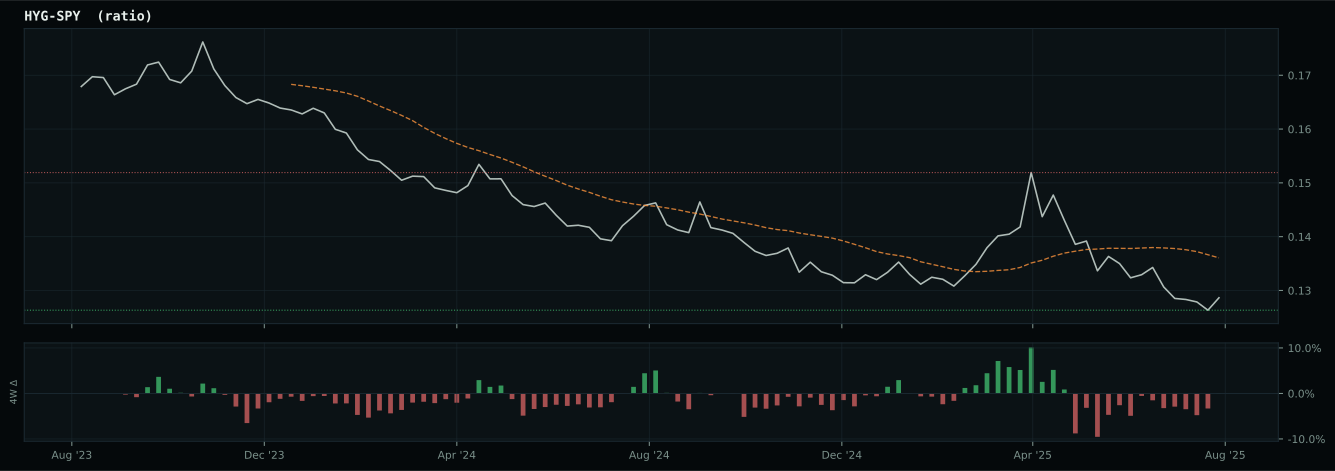
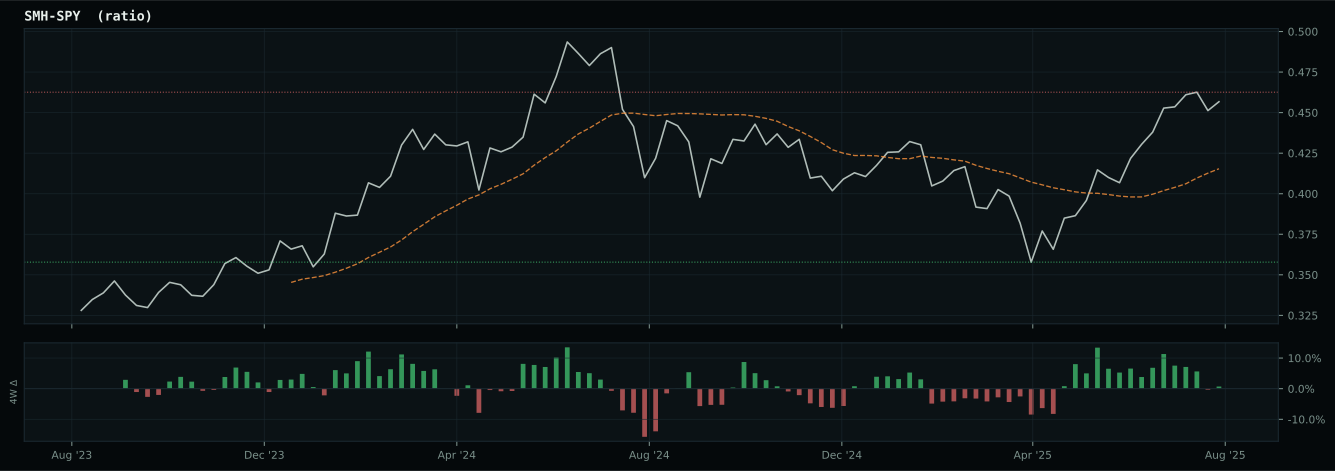
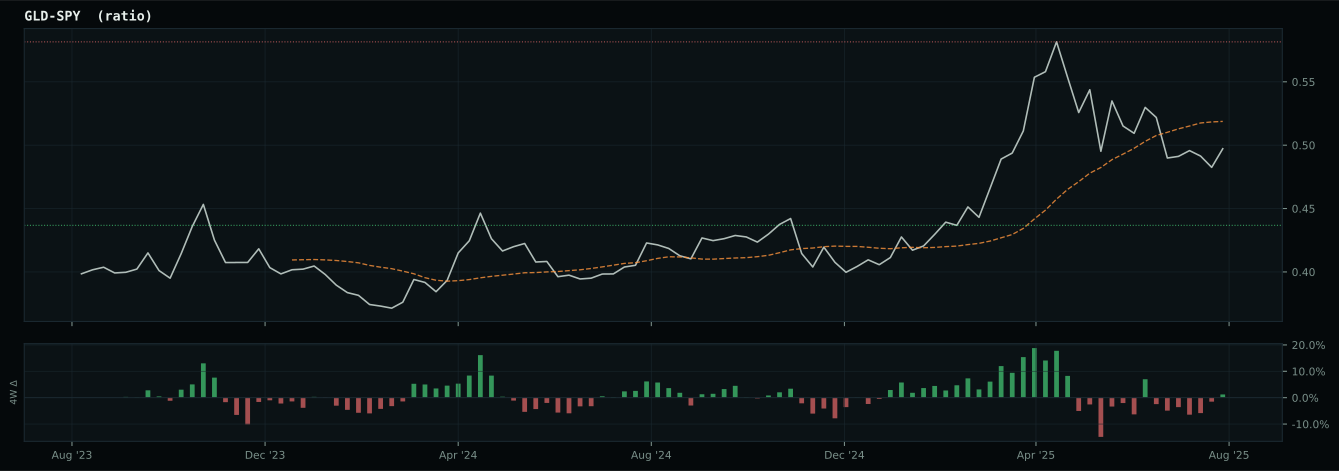
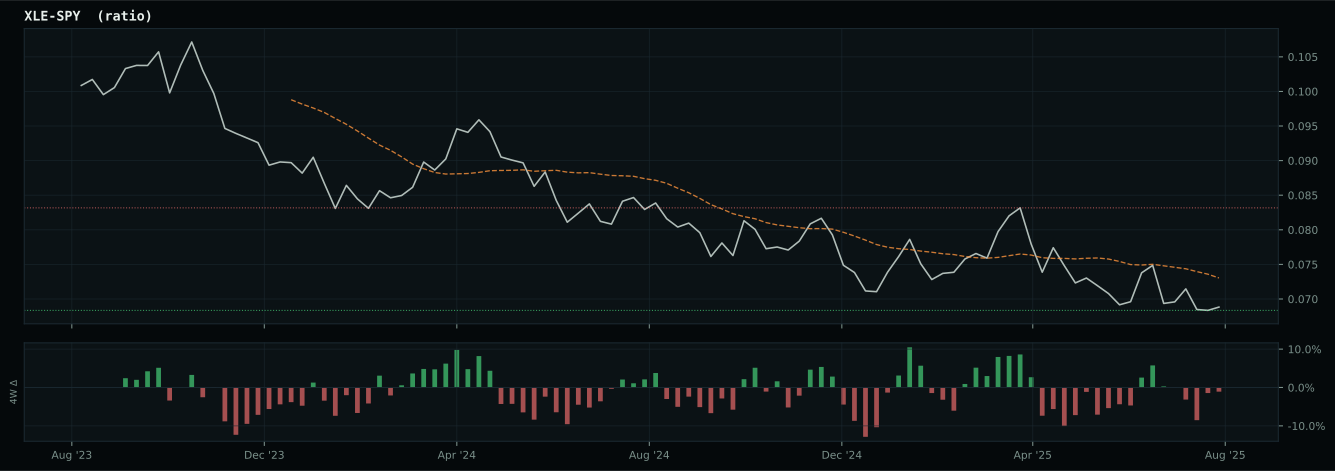
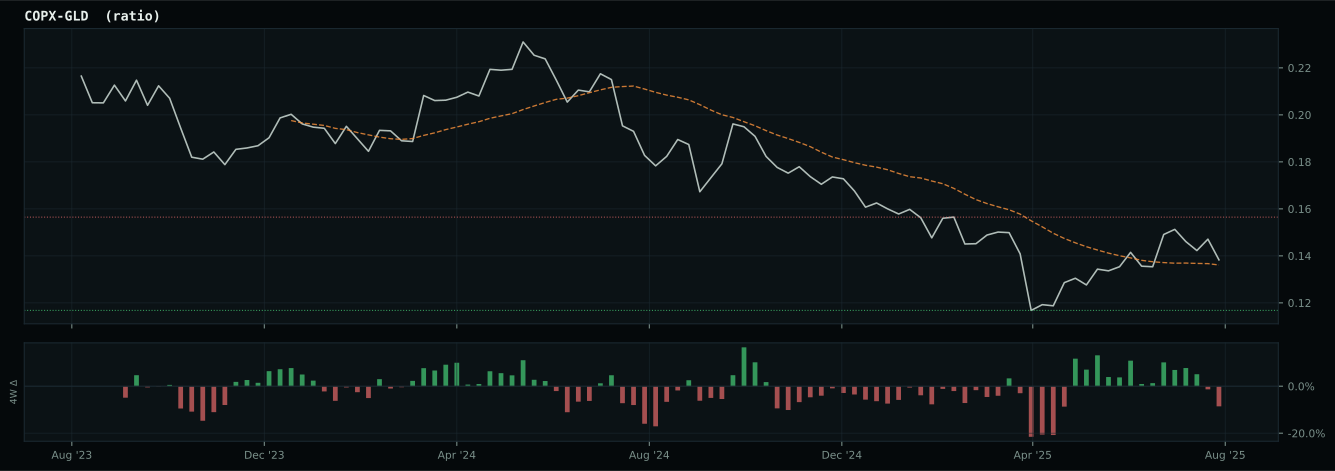
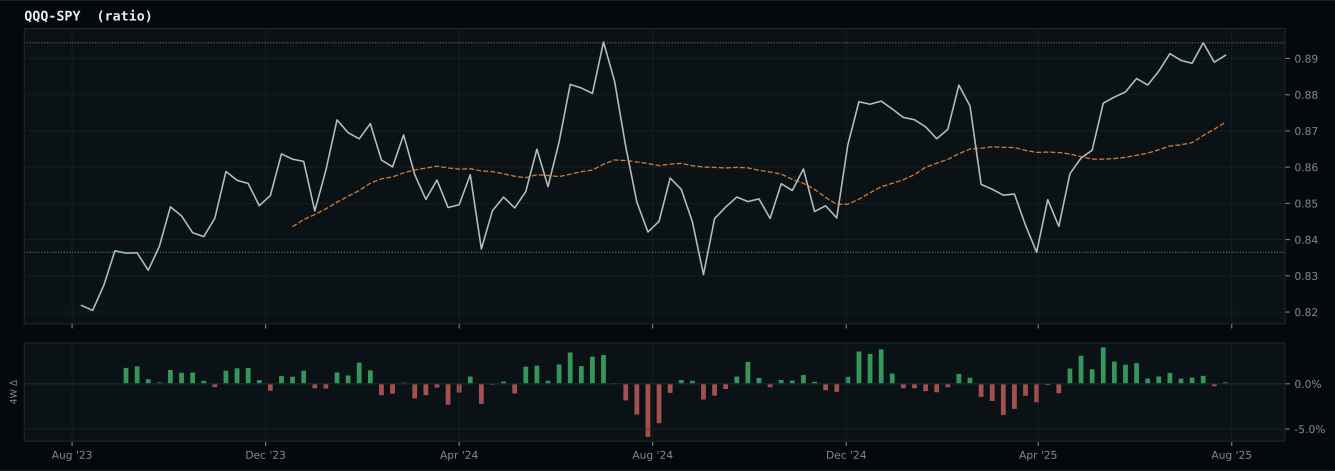
Market-implied signals behind the macro regime scores. Each ratio compares two assets; the direction and slope of the ratio is what the macro engine reads.
Crypto Regime — TrendBTC
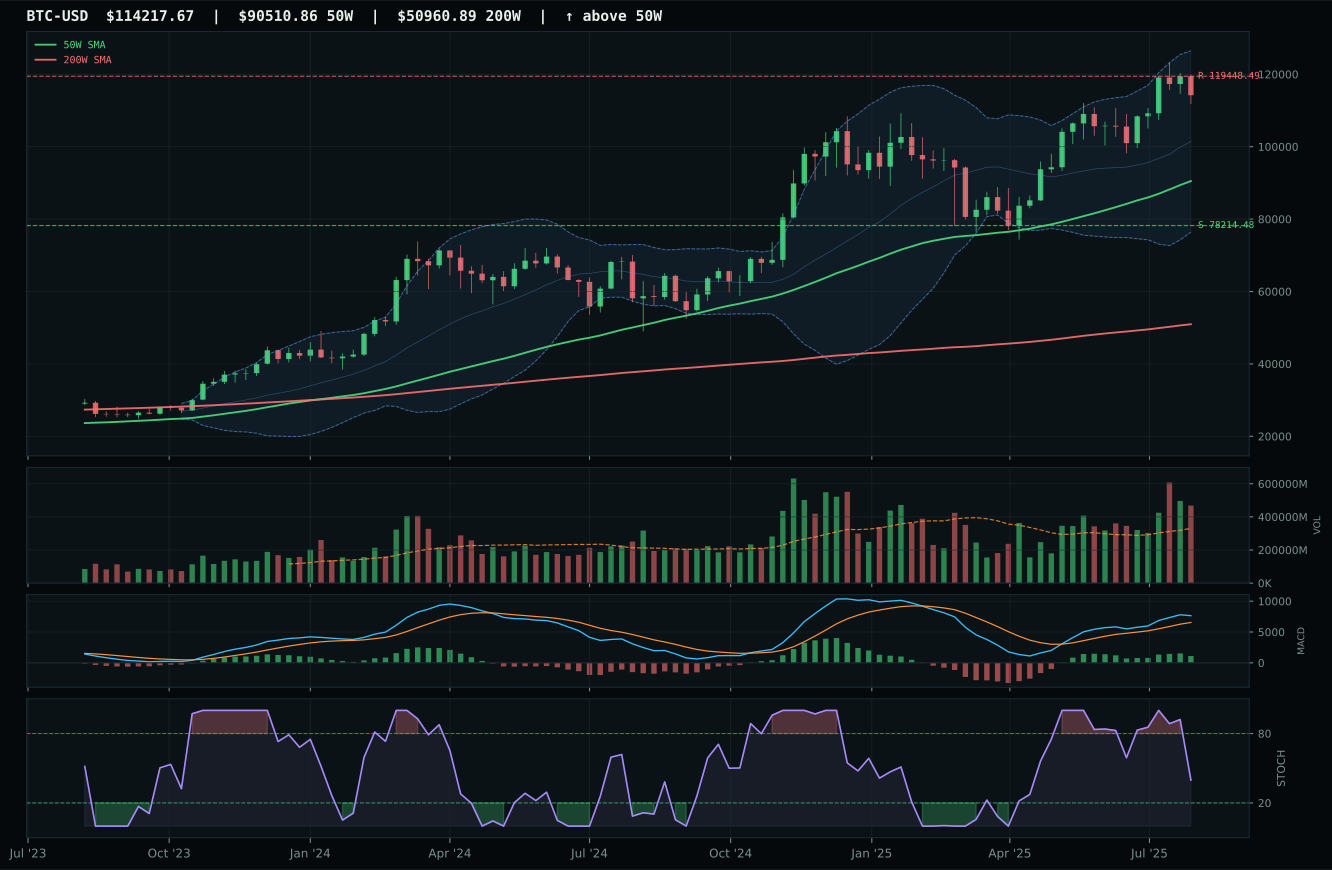
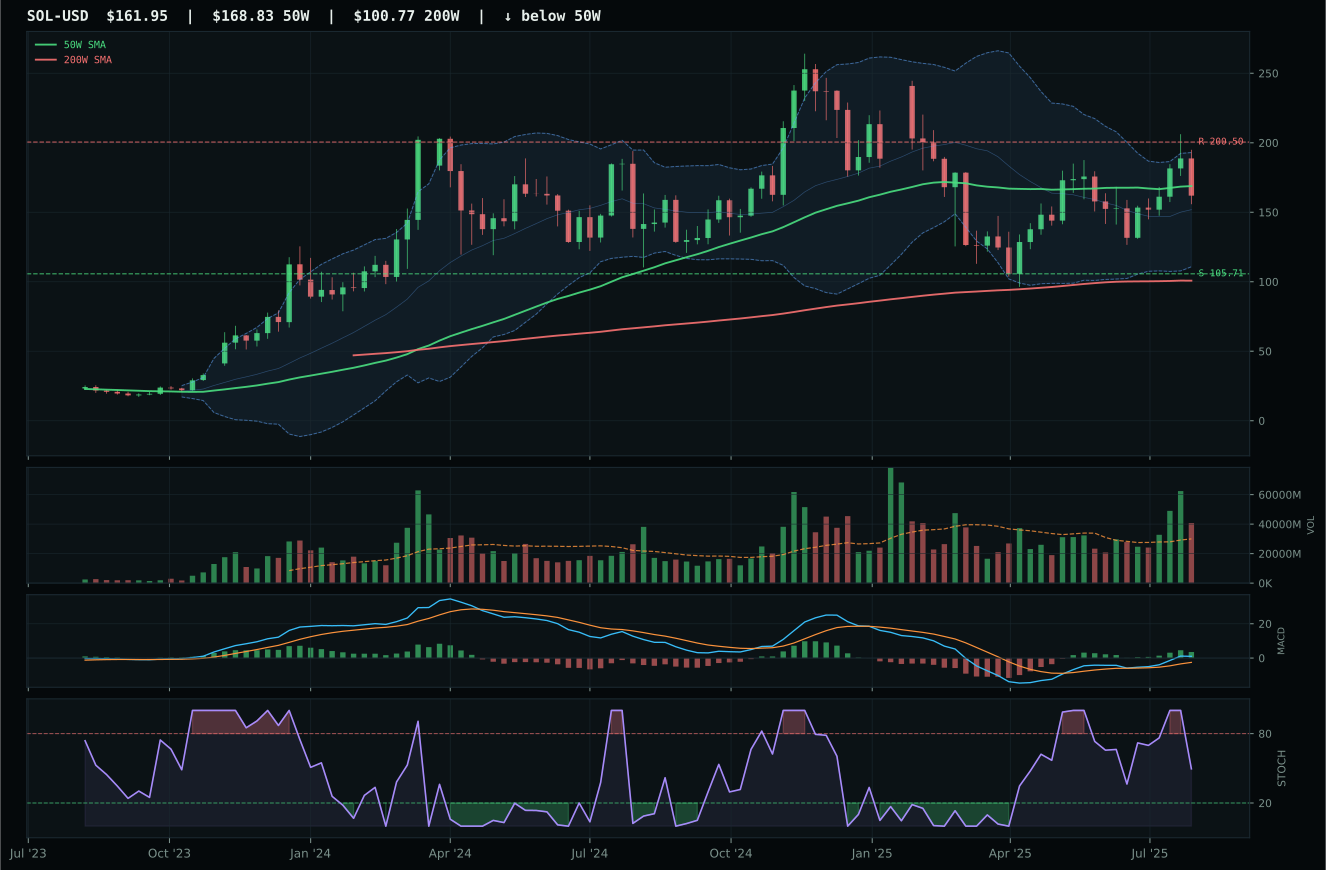
ValueBTC not armed: BTC has not made the first post-breakdown touch of the 200W buy zone after losing the 50W
TrendBTC confirmed: 2 consecutive closes above rising/flat 50W SMA
one or more available conditions failed
Category Rankings
| Rank | Category | Winner | Score | Alloc | 4W Ret | Peers (4W) |
|---|---|---|---|---|---|---|
| 1 | AI | BOTZ | 60.8 | 20% | -1.23% | SMH -1.1% · AIQ +0.6% |
| 2 | Nuclear Energy | NLR | 59.3 | 20% | +2.59% | URA +2.1% · URNM +12.1% |
| 3 | Utilities & Infrastructure | XLU | 58.3 | 10% | -2.57% | PAVE +1.3% · IGF -0.5% |
| 4 | Technology | XLK | 54.1 | 10% | -0.65% | IGV -3.3% · CIBR +0.0% |
| 5 | Industrial Metals | COPX | 53.5 | 10% | +14.06% | REMX +21.1% · PICK +5.2% |
| 6 | Defense & Aerospace | ITA | 51.7 | 10% | +0.37% | XAR -0.3% · ROKT +4.4% |
| 7 | Precious Metals | GLD | 42.6 | 10% | +3.22% | SLV +8.0% · GDX +21.1% |
| 8 | Agriculture & Livestock | MOO | 25.8 | 10% | +1.99% | VEGI -0.0% · WEAT -2.3% |
| 9 | Traditional Energy | XLE | 21.3 | 0% | +5.51% | FCG +5.1% · XOP +7.2% |
| 10 | Emerging Markets | IEMG | 14.6 | 0% | +1.44% | ILF +6.3% · INDA -1.4% |
AI — BOTZ
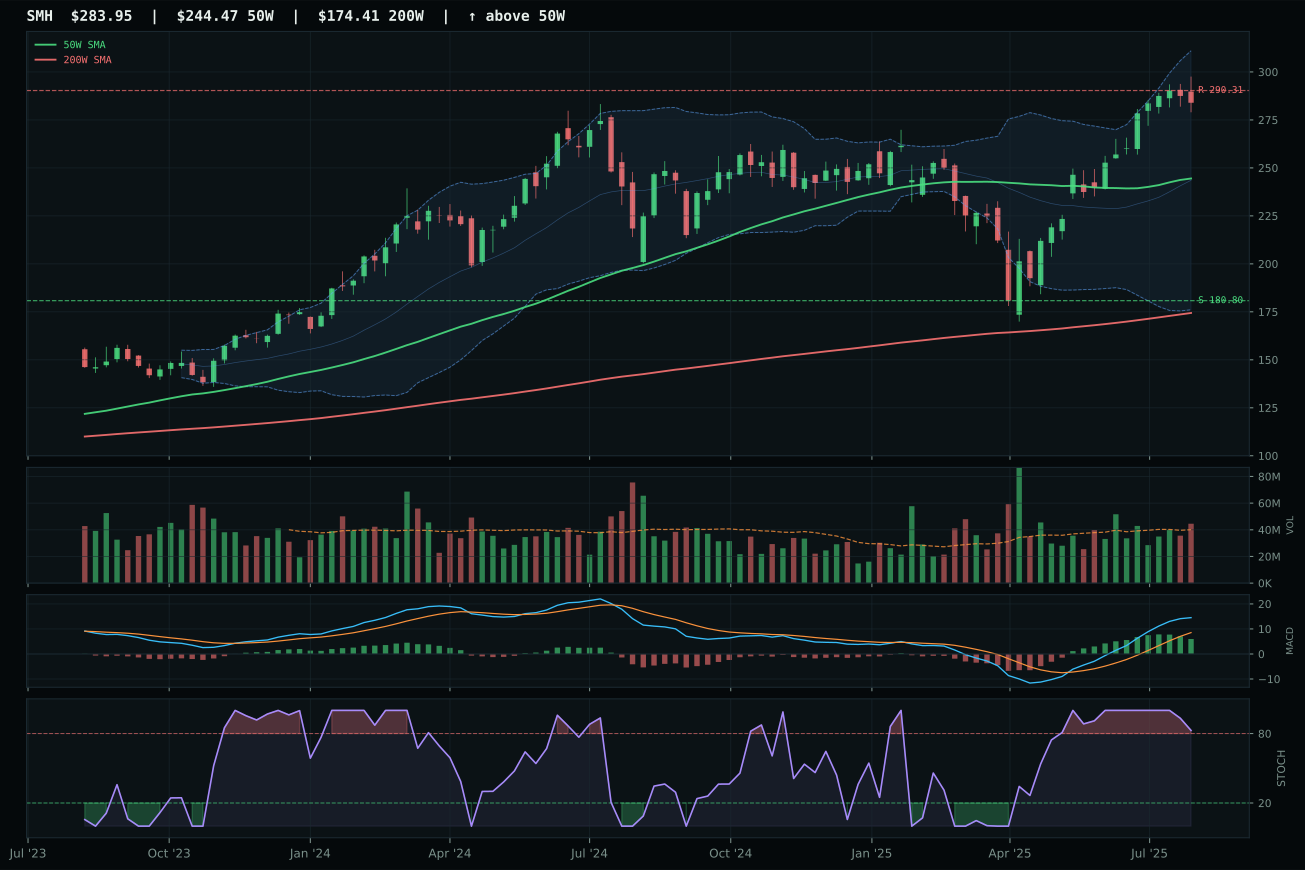
SMH has a vertical extension profile with 19.9% 13-week relative strength versus SPY.
A failed hold above support would weaken the setup.
Actionable but governed by invalidation levels.
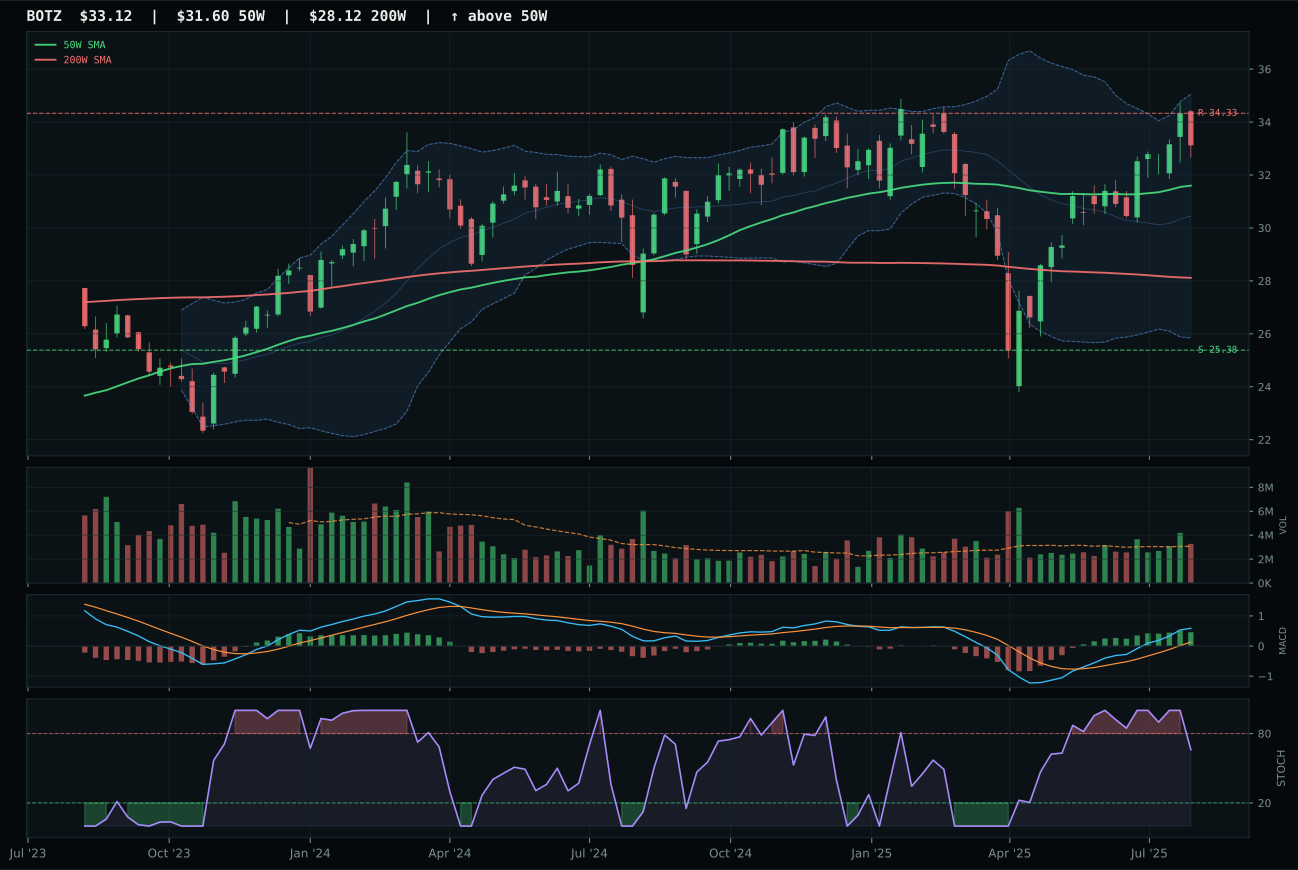
BOTZ has a neutral structure profile with 3.4% 13-week relative strength versus SPY.
A failed hold above support would weaken the setup.
Actionable but governed by invalidation levels.
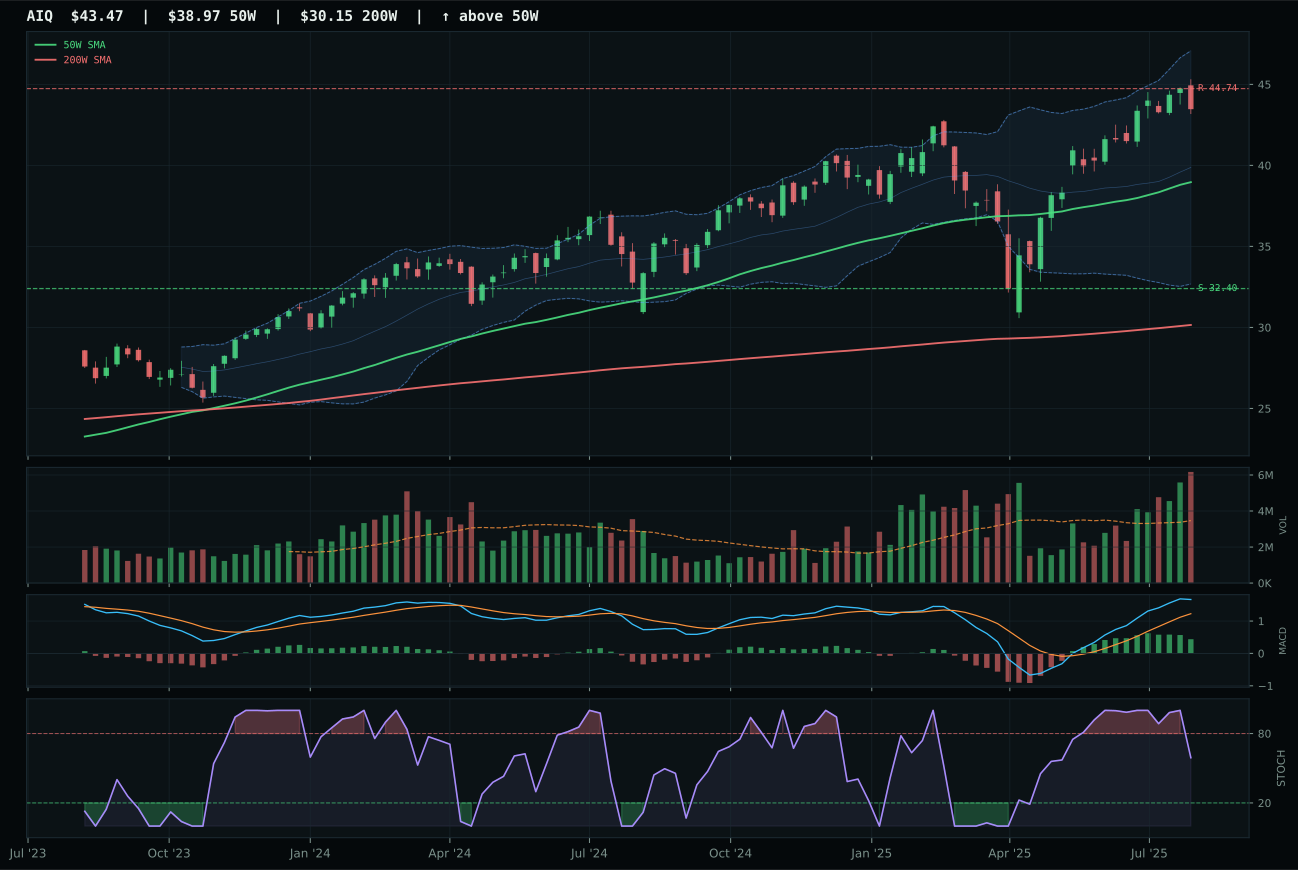
AIQ has a neutral structure profile with 4.2% 13-week relative strength versus SPY.
A failed hold above support would weaken the setup.
Actionable but governed by invalidation levels.
BOTZ defeated SMH despite SMH's spectacular 29.6% thirteen-week return because timing and positioning matter more than raw momentum in a transition regime. BOTZ sits only 4.8% above its 50-week moving average with bullish and improving MACD, while SMH has stretched 16.1% above trend, posting an overbought stochastic RSI roll-over—a setup that leaves zero room for error. The 80.2 momentum score for BOTZ versus SMH's 100 is misleading; SMH's massive relative strength of 19.9% versus SPY actually works against it in a week where the allocator needs entry quality and risk symmetry, not extended leadership. BOTZ's 3/2/1 weighted reasoning score of 70.8 prevails over SMH's 68.4 because robotics and physical AI cyclicality offers a cleaner structural setup: near-term price action can still expand upward without punishing latecomers.
AI earned a top-2 10% allocation at a 60.8 category score because it ranked second-highest among all 10 exposures and its 3/2/1 weighted basket (BOTZ, SMH, AIQ) shows technical resilience despite extended pricing. Macro fit at 54.0 reflects strong AI growth sponsorship offset by liquidity stress, creating a regime where the category stays productive but not indestructible. The 47-point risk-reward score tells a critical story: upside to 34.33 is only 3.5% away, while downside to 25.38 offers 30.5% of cushion, meaning the setup rewards patience and punishes new buyers. BOTZ's inclusion as the representative ensures the allocation captures the best entry geometry available, not the strongest momentum. This 20% stake should scale down if timing scores deteriorate or if SMH's vertical extension begins rolling the entire category.
Nuclear Energy — NLR
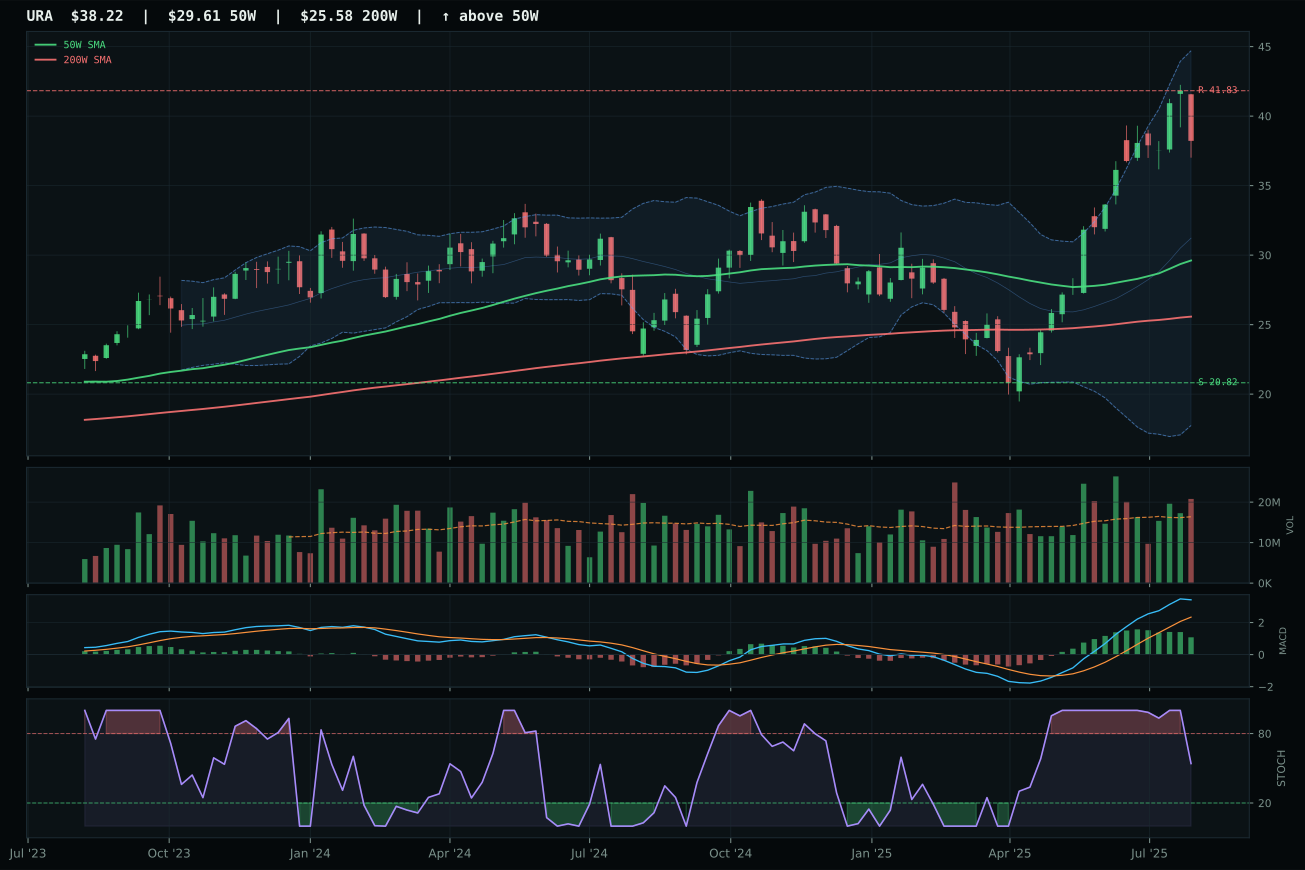
URA has a vertical extension profile with 38.2% 13-week relative strength versus SPY.
A failed hold above support would weaken the setup.
Actionable but governed by invalidation levels.
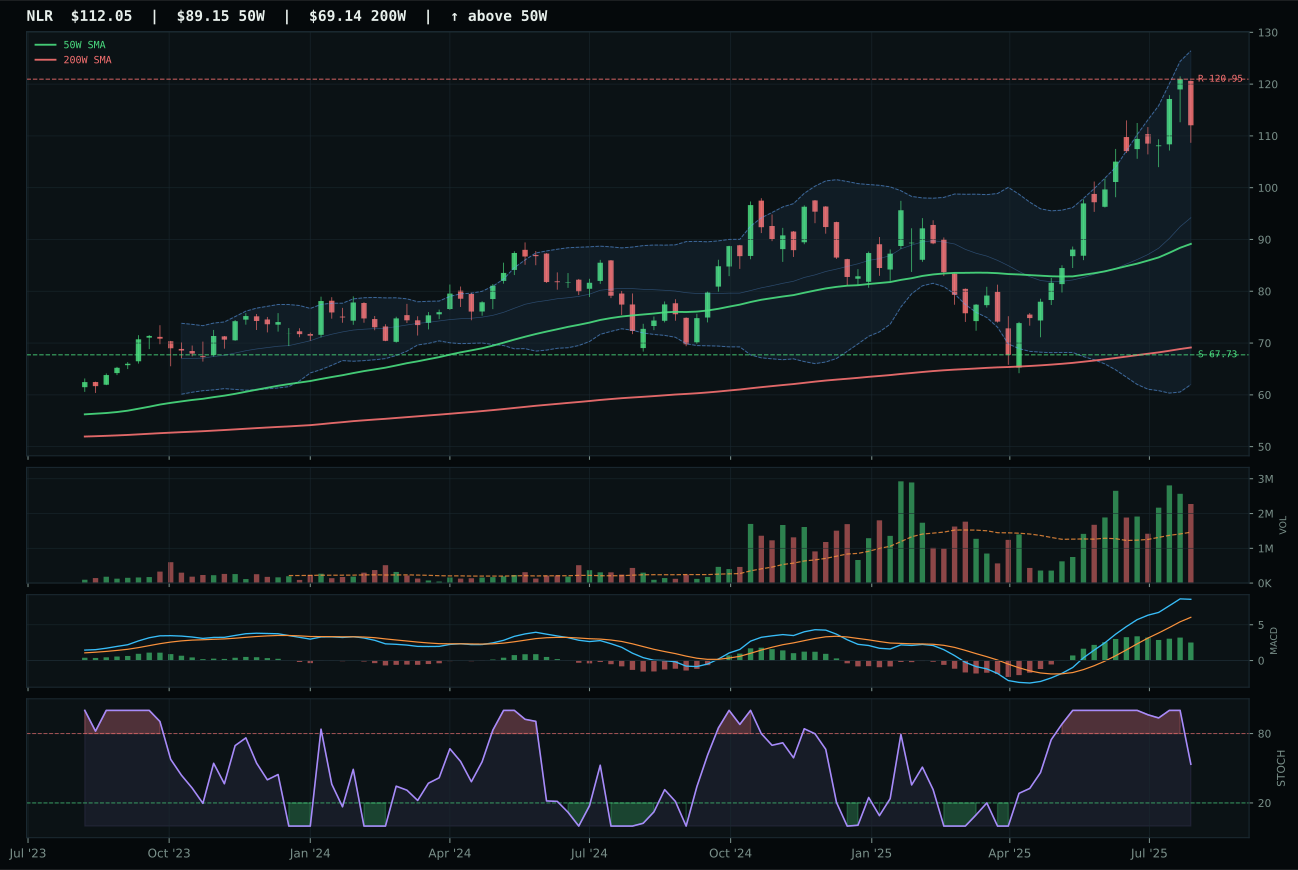
NLR has a vertical extension profile with 27.6% 13-week relative strength versus SPY.
A failed hold above support would weaken the setup.
Actionable but governed by invalidation levels.
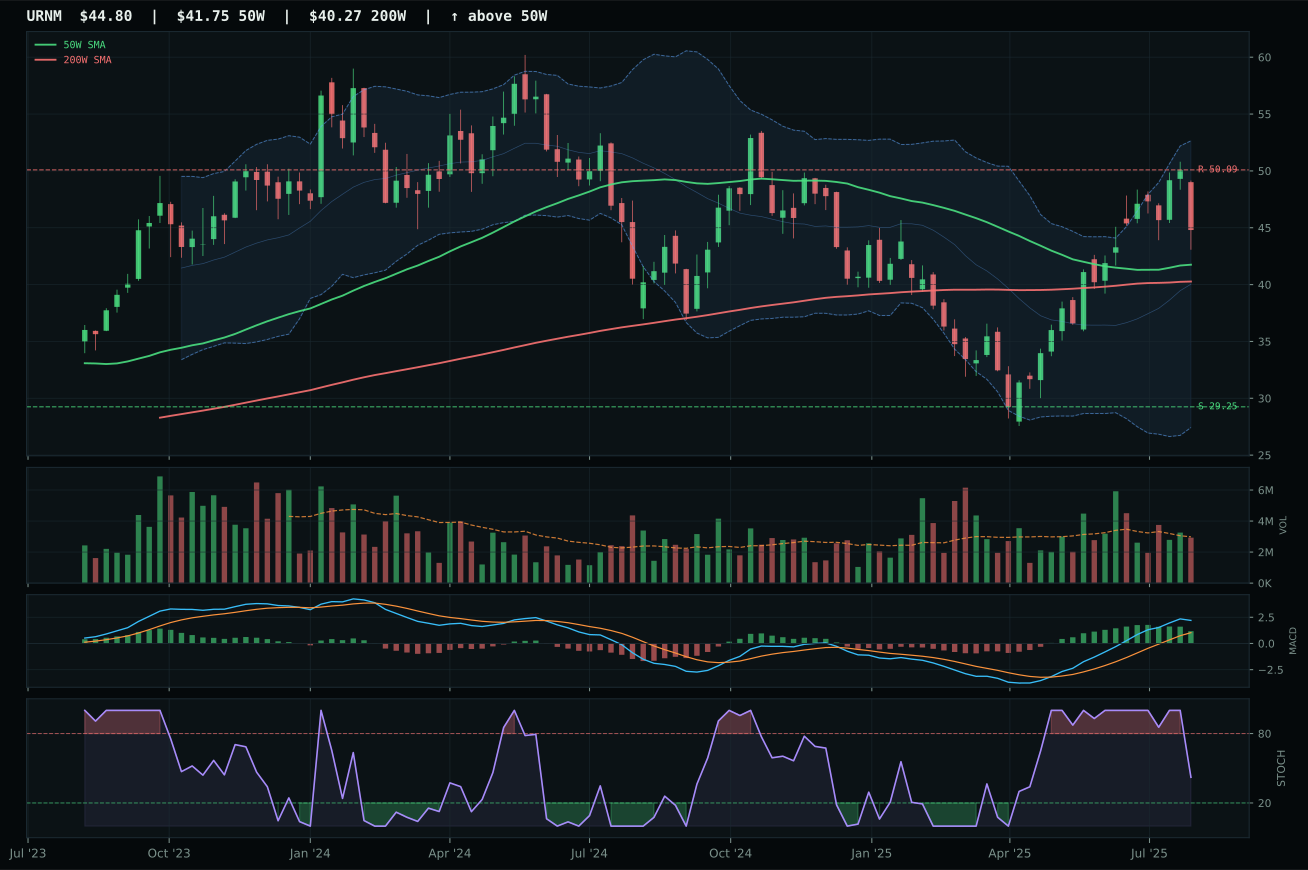
URNM has a neutral structure profile with 14.7% 13-week relative strength versus SPY.
A failed hold above support would weaken the setup.
Actionable but governed by invalidation levels.
NLR earned top-2 selection with a 59.3 category score despite technical evidence of only 37.5/100 because momentum confirmation (100/100) and macro fit (48.0) combined with real asset sponsorship (+7) and AI growth sponsorship (+5) created an irresistible convergence. NLR trails the 3/2/1 reasoning order—URA 70.2, URNM 62.0, NLR 41.0—yet the category reasoner elevated NLR to representative because its 37.3% thirteen-week return and 27.6% relative strength versus SPY demonstrated genuine conviction despite 25.7% extension above the 50-week moving average. Volume shows distribution pressure at 1.55x, and stochastic RSI falls neutral while MACD flattens, yet these become minor concerns against 100/100 trend confirmation and perfect category-relative strength. NLR's selection reflects thesis strength: nuclear utilities benefit from AI power demand and energy security narratives that override entry risk in this tactical window.
Nuclear Energy earned a top-2 10% allocation at 59.3 category score because it ranked second-highest among all 10 categories and macro fit at 50.0 is solidly neutral while real asset sponsorship and AI growth tailwinds provide underlying structural support. The category's momentum confirmation at 100.0 is unmatched across most competing exposures, confirming that nuclear utilities are receiving genuine fund flows for energy security and decarbonization narratives. However, the 48.0 timing score flags critical entry risk: NLR sits 25.7% above the 50-week with stochastic RSI fallen/neutral and MACD bullish/flattening, indicating the easy part of the move is complete. The 39.0 risk-reward (7.4% upside, 65.4% downside) is dangerously inverted. This 10% allocation should be deployed in tranches: initial 7-8% at current levels with plans to scale to 15-20% if NLR pulls back to test 67.73 support with maintained volume. If the chart breaks below support decisively, reduce to 10% immediately.
Utilities & Infrastructure — XLU
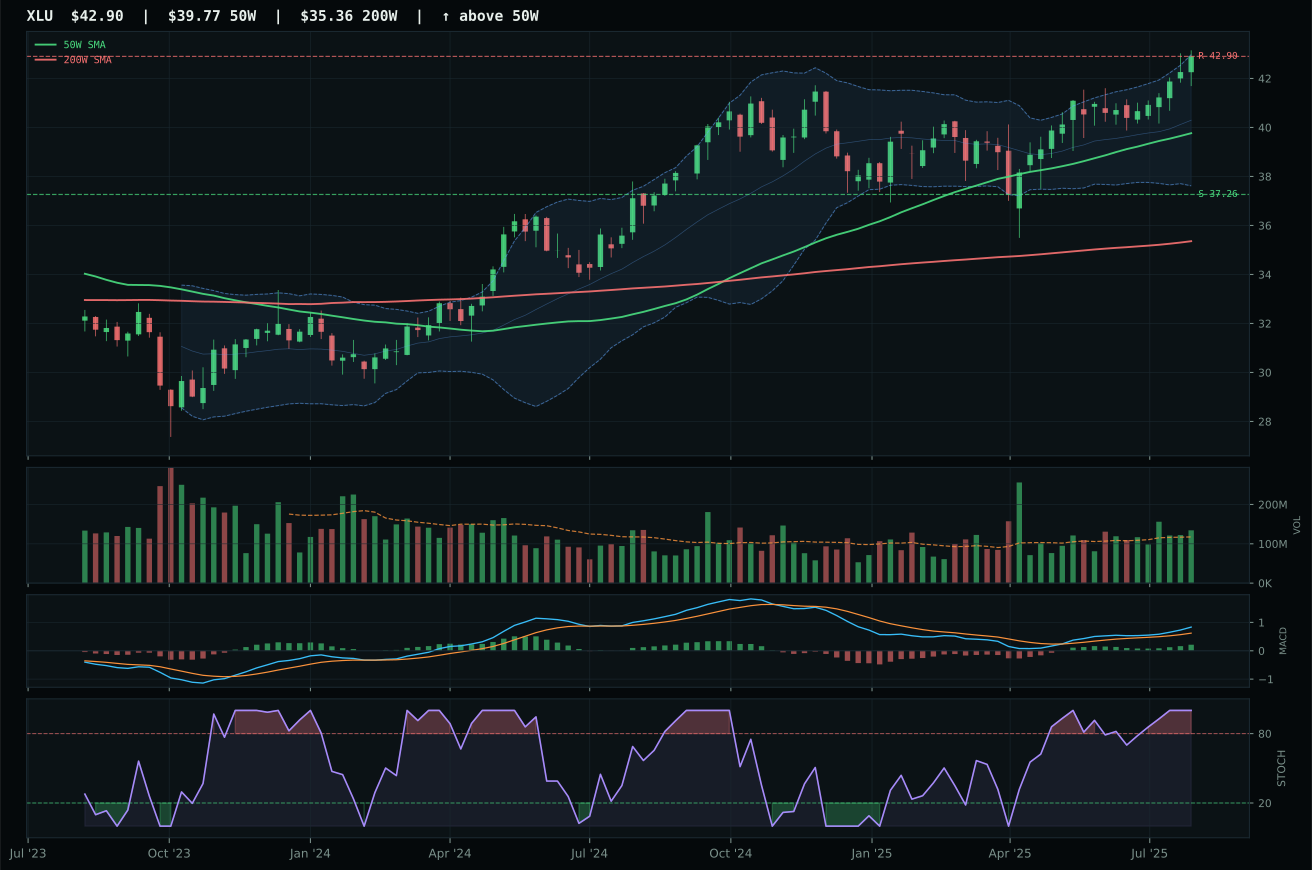
XLU has a neutral structure profile with -2.1% 13-week relative strength versus SPY.
A failed hold above support would weaken the setup.
Actionable but governed by invalidation levels.
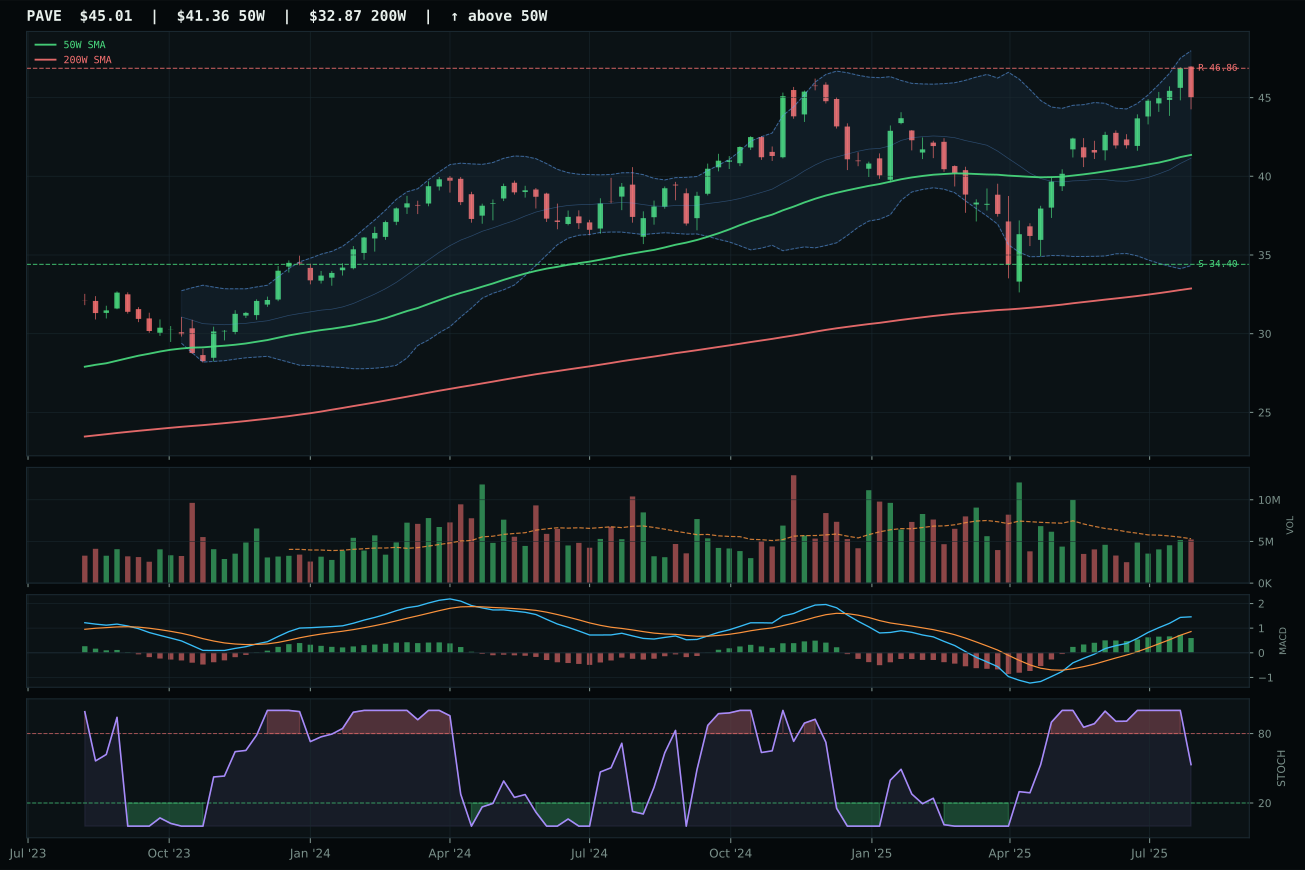
PAVE has a neutral structure profile with 3.8% 13-week relative strength versus SPY.
A failed hold above support would weaken the setup.
Actionable but governed by invalidation levels.
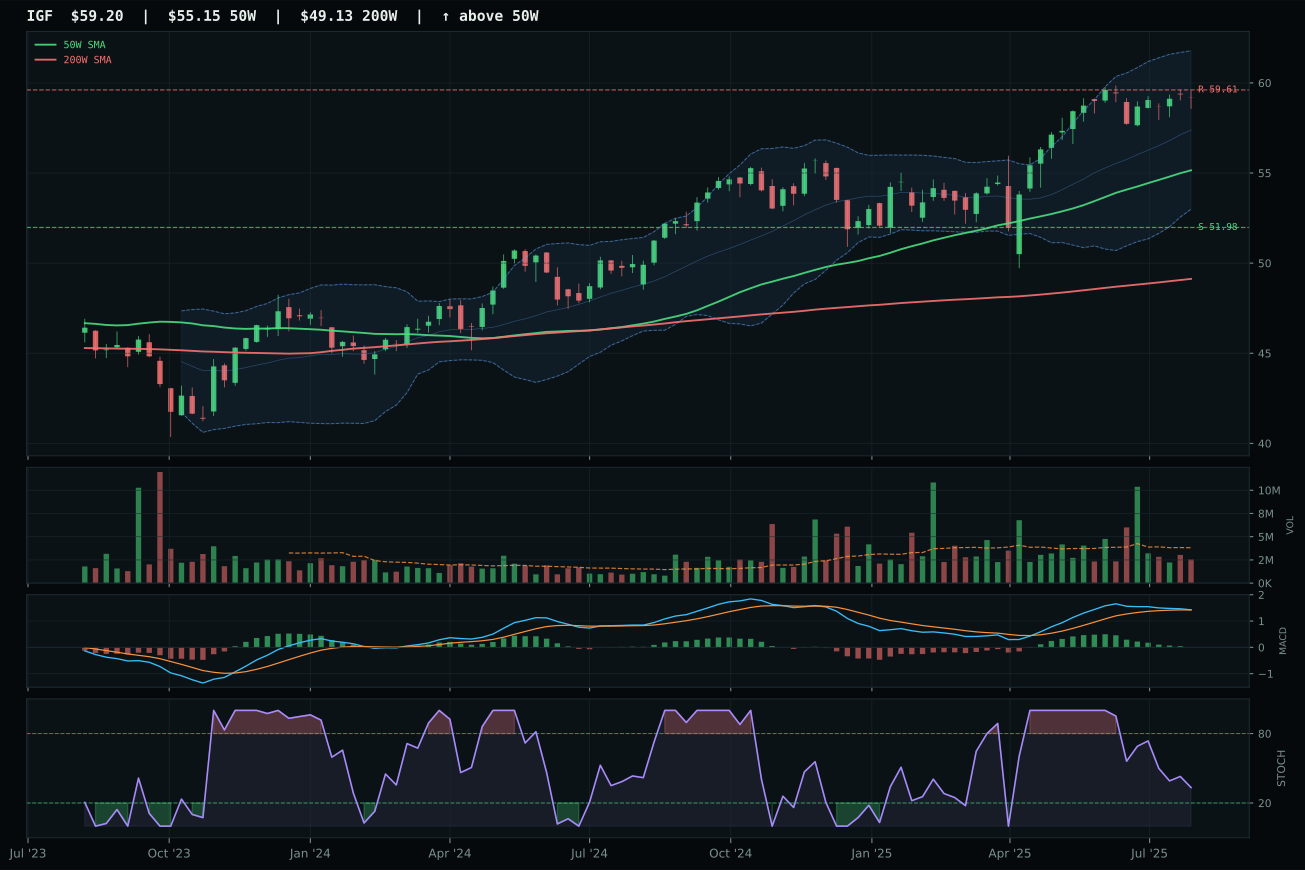
IGF has a neutral structure profile with -6.1% 13-week relative strength versus SPY.
A failed hold above support would weaken the setup.
Actionable but governed by invalidation levels.
XLU wins Utilities & Infrastructure with composite 80 by a single decimal point over PAVE's 80, a virtual tie resolved by XLU's superior timing (75 versus 70) and cleaner MACD structure (bullish and improving versus bullish but flattening). Both names trade in neutral structure above both moving averages; the deciding factors are XLU's perfect momentum confirmation of 78/100 paired with above-average participation at 1.14x versus PAVE's neutral volume. XLU's trend score of 96.8 mirrors PAVE's near-perfect 100, yet XLU's timing score gains 5 points from overbought stochastic RSI momentum reading versus PAVE's falling-neutral—a technical flourish suggesting immediate upside bias. Risk-reward slightly favors XLU at 54.5 versus PAVE's 47.3, driven by better support/resistance geometry. This is the closest category decision in the portfolio; either name would justify selection, yet XLU's volume confirmation provides the marginal edge.
Utilities & Infrastructure earned a 5% allocation on a 58.3 category score and macro fit at 49.0, where Transition/Mixed conditions marginally favor regulated defensive exposure over cyclical infrastructure capex. Risk appetite minus 2 provides minimal tailwind, and liquidity stress minus 3 shows conditions are tight but not hostile. XLU sits at resistance (42.90) with zero upside remaining before a new breakout, making immediate entry at risk. However, the category's 82.6 technical evidence score justifies a token 5% position that can scale if XLU pulls back to test 37.26 support—a 13% retracement—on maintained volume. PAVE's infrastructure beta (13.5% 13-week, 3.8% RS) offers better risk-adjusted returns, but XLU's cleaner MACD and volume confirmation earn it the representative spot. This allocation should be deployed opportunistically: buy 2-3% at current levels for exposure, then scale to 5% total if XLU corrects 5-8% on declining volume. If utilities roll over with MACD bearish cross, reduce immediately to 0%.
Technology — XLK
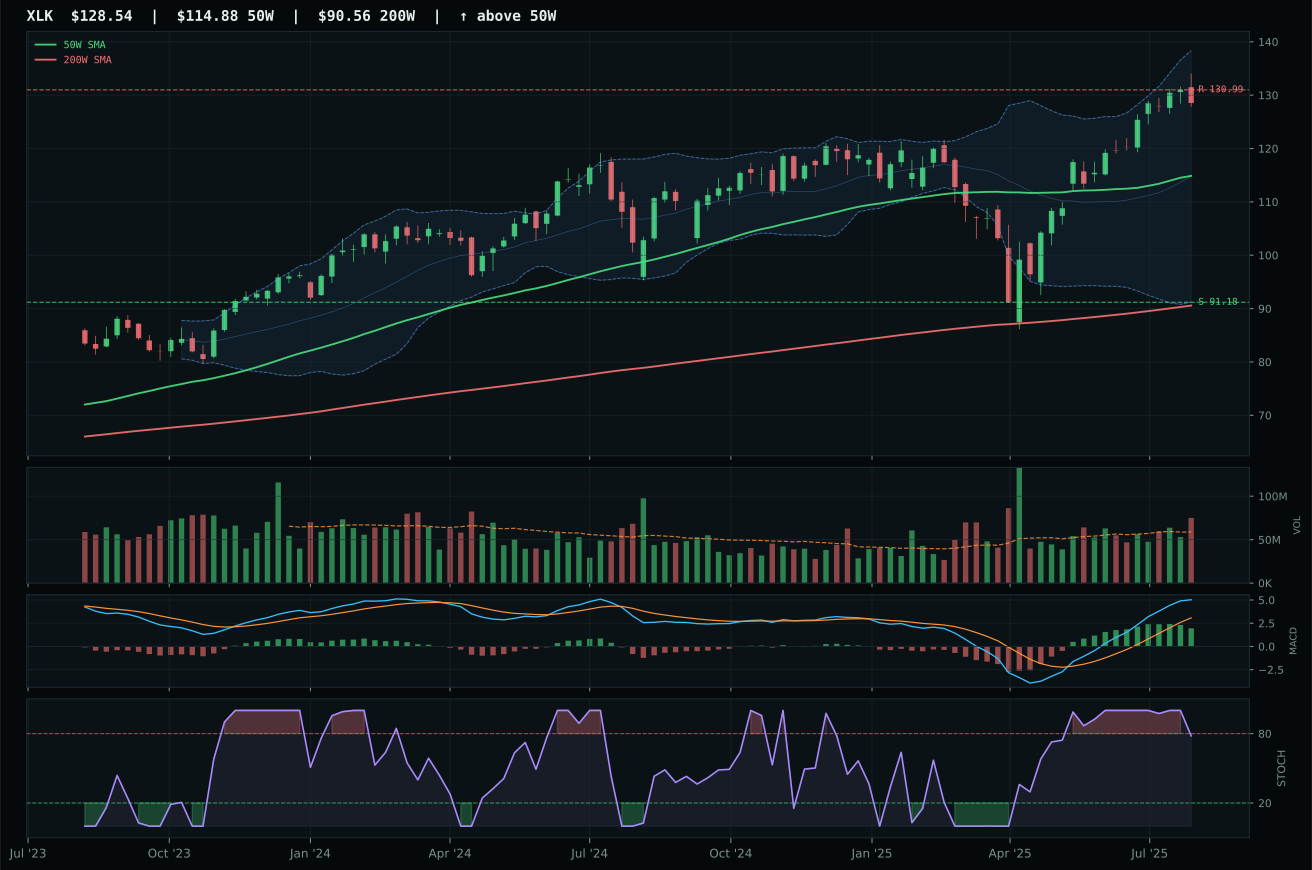
XLK has a neutral structure profile with 9.0% 13-week relative strength versus SPY.
A failed hold above support would weaken the setup.
Actionable but governed by invalidation levels.
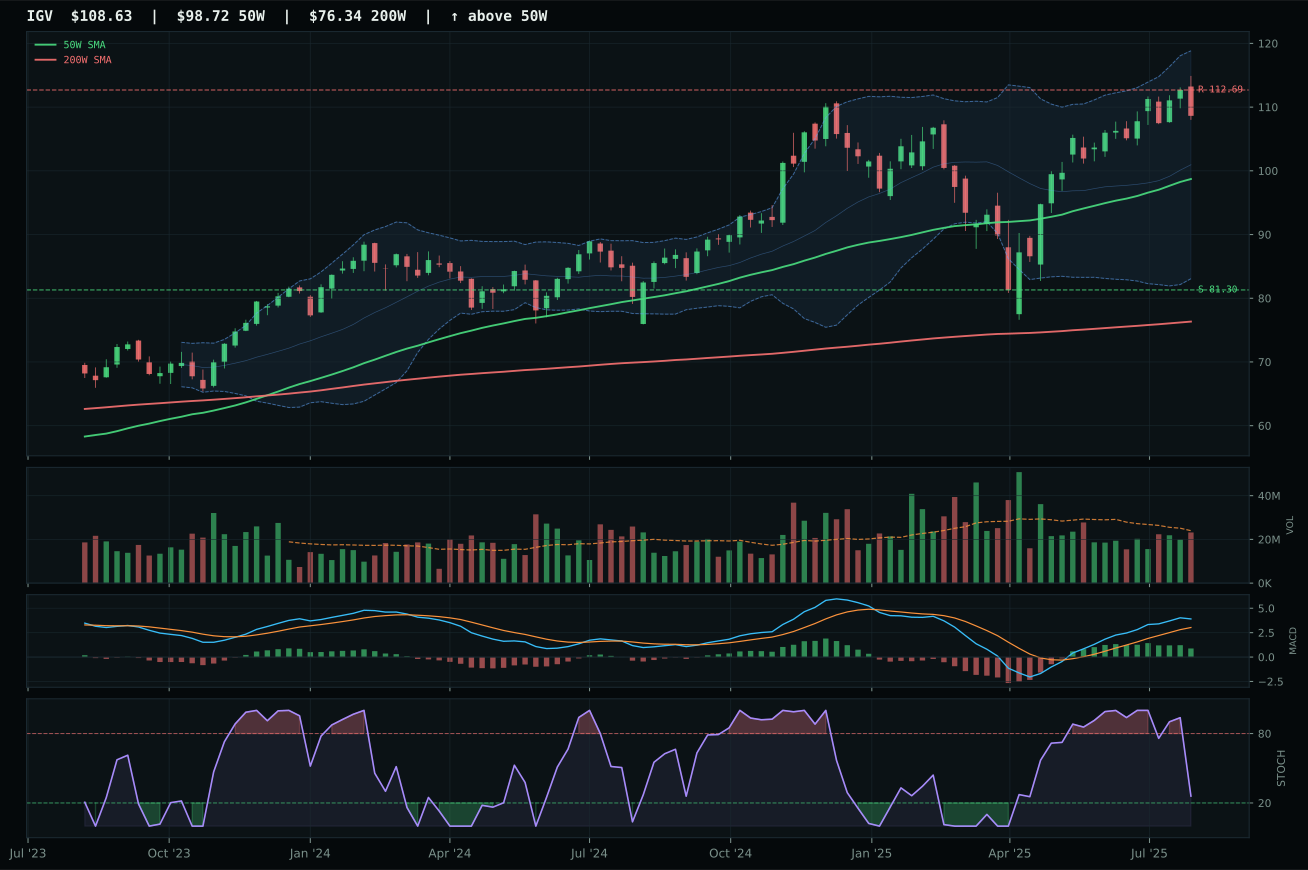
IGV has a neutral structure profile with -0.5% 13-week relative strength versus SPY.
A failed hold above support would weaken the setup.
Actionable but governed by invalidation levels.
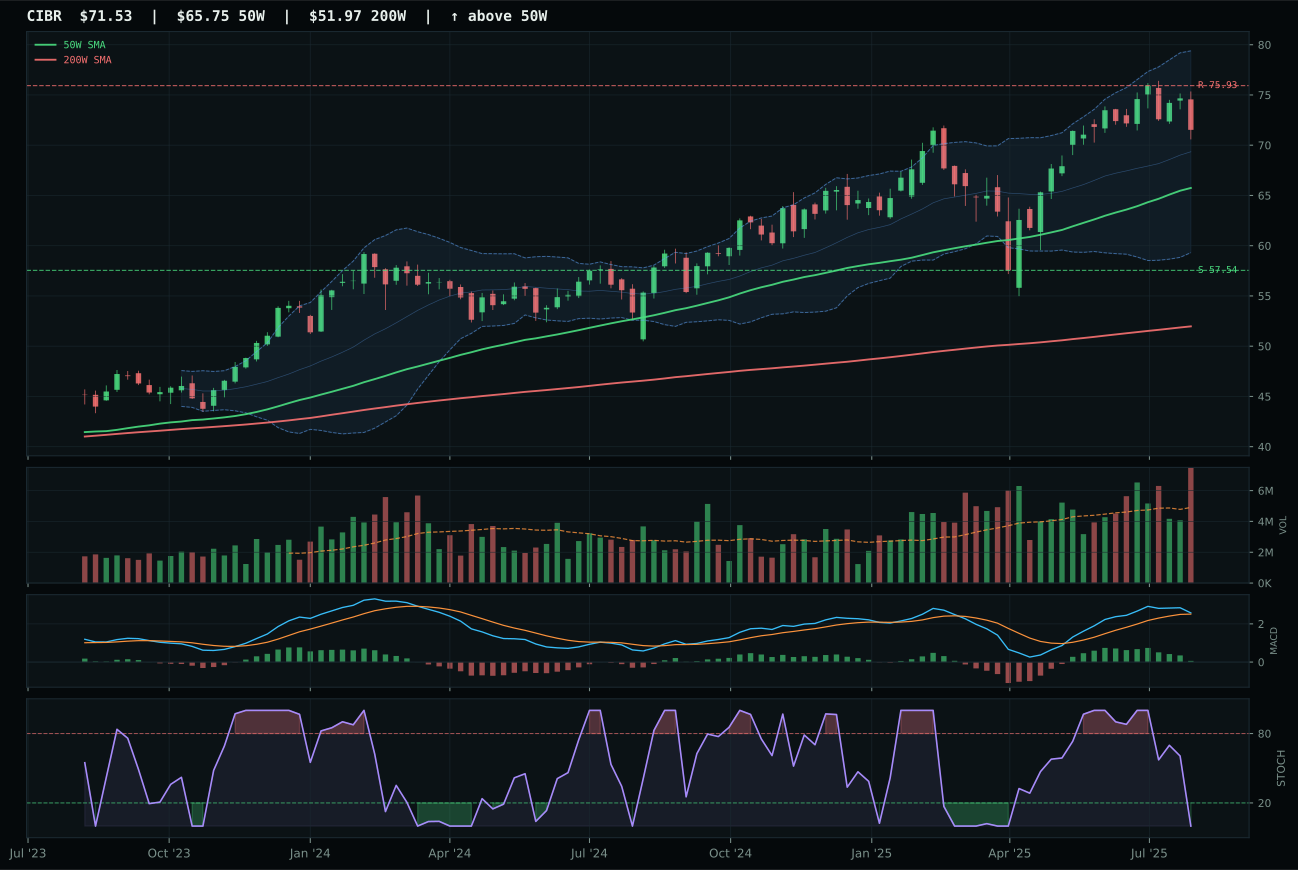
CIBR has a neutral structure profile with -4.0% 13-week relative strength versus SPY.
A failed hold above support would weaken the setup.
Actionable but governed by invalidation levels.
XLK wins the category with a composite score of 85 versus IGV's 74, driven by superior relative strength (9.5% category-relative versus 0.0%) and cleaner volume confirmation at 1.27x average participation. The 13-week return of 18.7% paired with a 9.0% outperformance against SPY signals genuine institutional accumulation rather than momentum chasing, even as price sits 12.1% above the 50-week moving average in neutral structure. IGV's failure stems from weak timing—a 70 score versus XLK's 77—combined with deteriorating MACD momentum and neutral volume that suggests distribution rather than fresh buying pressure. The gap between these two leadership candidates is substantial enough to eliminate debate: XLK's breadth, persistence, and relative strength inside the category are unambiguous.
Technology earned a 5% slot rather than top-2 treatment because its category score of 54.1 fell outside the two highest-ranked exposures. Macro fit at 48.0 out of 100 reflects mixed tailwinds: risk appetite and AI sponsorship both active, but liquidity and credit stress offsetting those gains. The real constraint is setup asymmetry—XLK sits 12% above its 50-week reference with just 1.9% upside to resistance and 41% downside to support, which inverts the risk-reward equation at this exact moment. For Technology to earn a 10% or 5% allocation slot next week, the category would need either a clean pullback to rebuild entry geometry or a breakout through the 130.99 resistance that brings new supply online at a margin. Currently, the setup rewards patient entry over aggressive positioning.
Industrial Metals — COPX
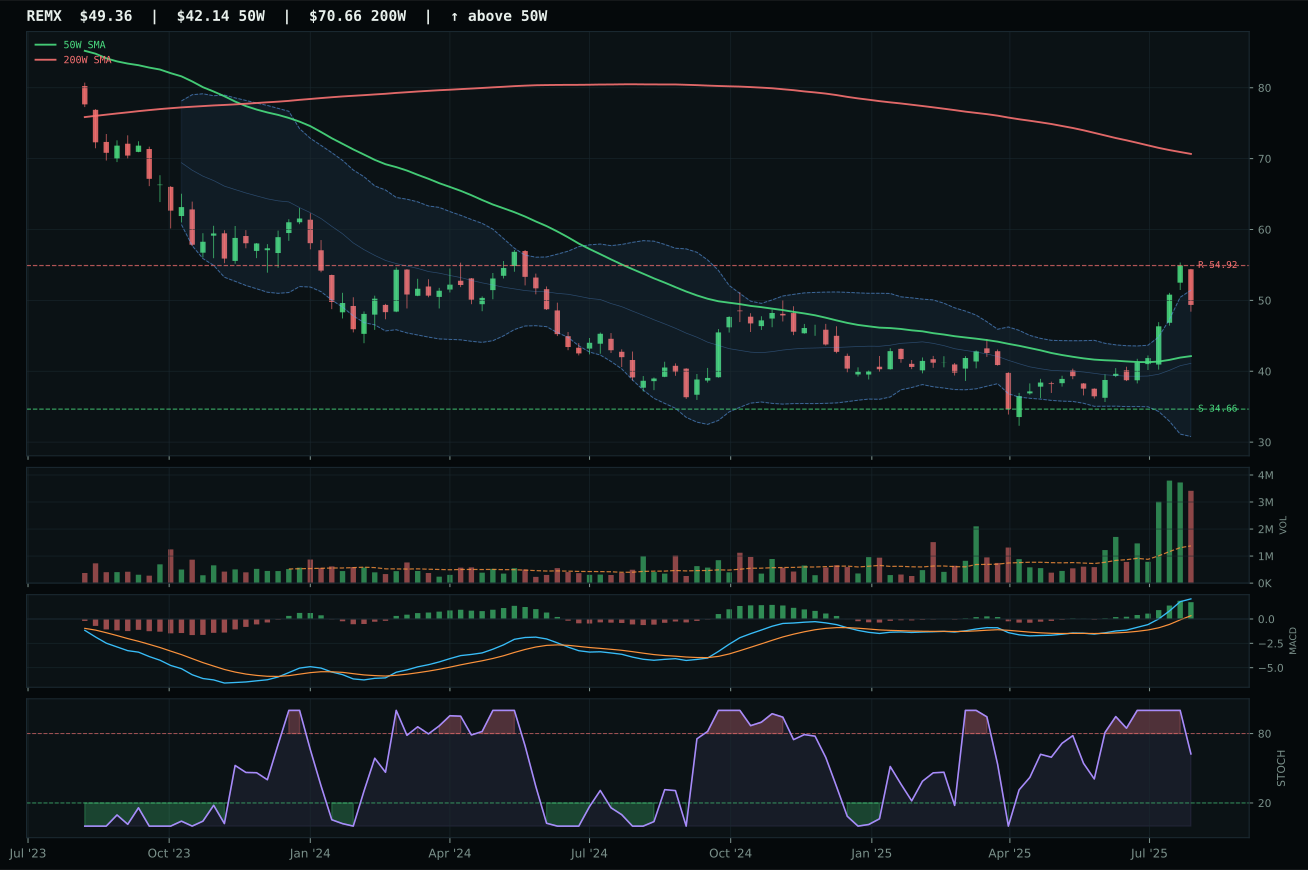
REMX has a vertical extension profile with 19.5% 13-week relative strength versus SPY.
A failed hold above support would weaken the setup.
Actionable but governed by invalidation levels.
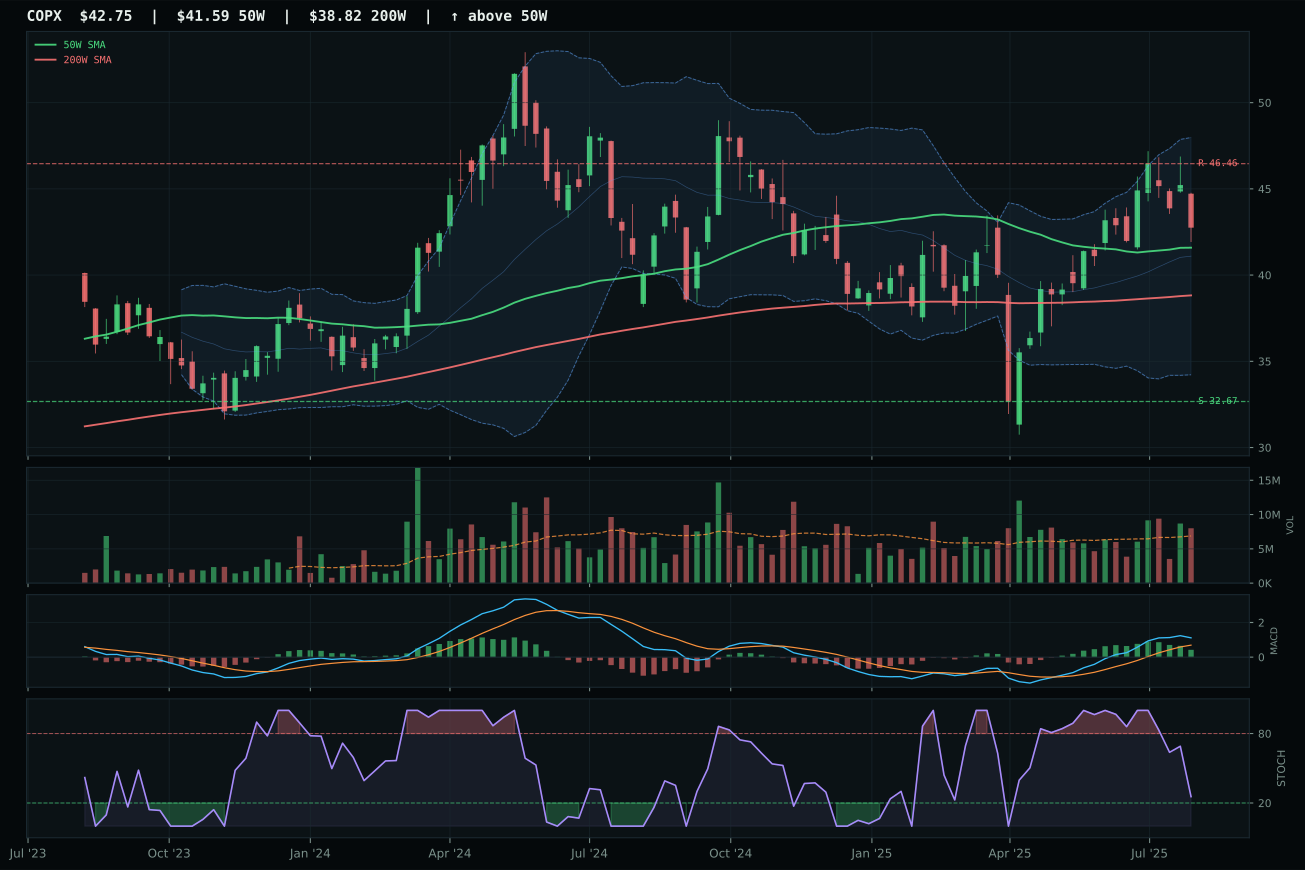
COPX has a compression near 50W profile with 0.3% 13-week relative strength versus SPY.
A failed hold above support would weaken the setup.
Actionable but governed by invalidation levels.
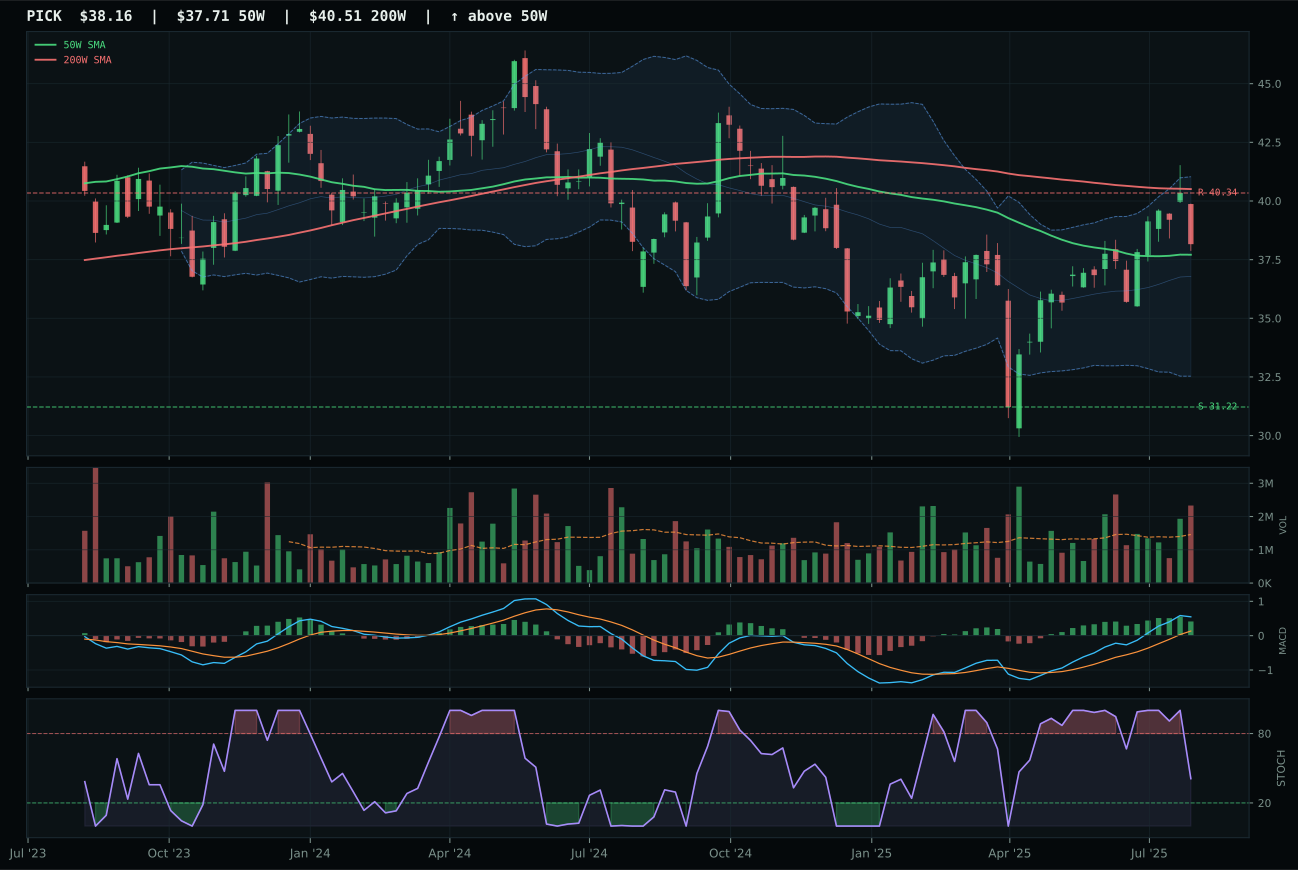
PICK has a compression near 50W profile with -3.8% 13-week relative strength versus SPY.
A failed hold above support would weaken the setup.
Actionable but governed by invalidation levels.
COPX defeats REMX by 9.9 points in composite score (81 versus 67) because compression beats extension in a timing-sensitive market. COPX trades 2.8% above the 50-week moving average with above-average participation at 1.16x, creating a setup where buyers have maintained position and volume confirms accumulation rather than climactic distribution. REMX sits 17.1% extended with distribution-pressure volume, overbought MACD, and 29.2% thirteen-week returns that leave zero margin for error. Both carry the same macro tailwind—metals scarcity active at +12 and +9 respectively—yet COPX's timing score of 95 crushes REMX's 53, the most decisive metric in a compressing consolidation. The 3/2/1 reasoning order places COPX at 66.1 ahead of REMX's 56.3, a clear technical preference for the tighter entry point despite REMX's superior momentum and relative strength numbers.
Industrial Metals earned 5% on the strength of a 53.5 category score and macro fit at 65.0—the highest among all categories—driven by metals scarcity (+14), commodity breadth (+10), and real asset sponsorship (+6). This is genuine macro tailwind despite minus 8 liquidity stress offsetting some conviction. COPX's compression setup near the 50-week with above-average participation creates a low-risk accumulation signal that justifies tactical allocation. The category's reasoned ranking (COPX 66.1, REMX 56.3, PICK 35.5) confirms COPX as the clean representative. Unlike precious metals, industrial metals are receiving real institutional sponsorship tied to AI capex cycles and energy transition demand. Upside to resistance at 46.46 is only 8.0% away, so new money should wait for a pullback toward 32.67 support or accumulate only 25% of the intended position now. This allocation should scale up if volume participation increases above 1.5x 20-week average, signaling institutional conviction.
Defense & Aerospace — ITA
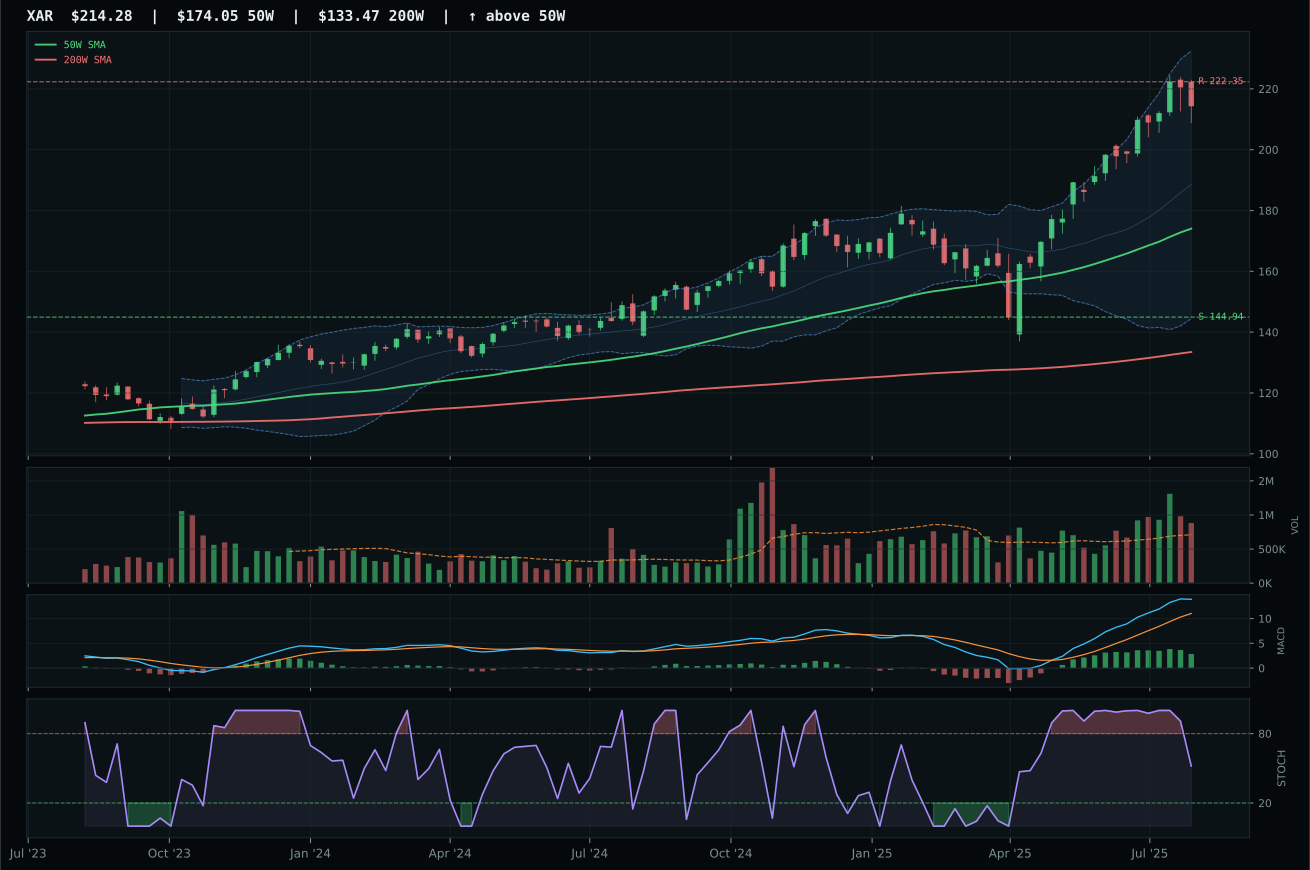
XAR has a vertical extension profile with 11.3% 13-week relative strength versus SPY.
A failed hold above support would weaken the setup.
Actionable but governed by invalidation levels.
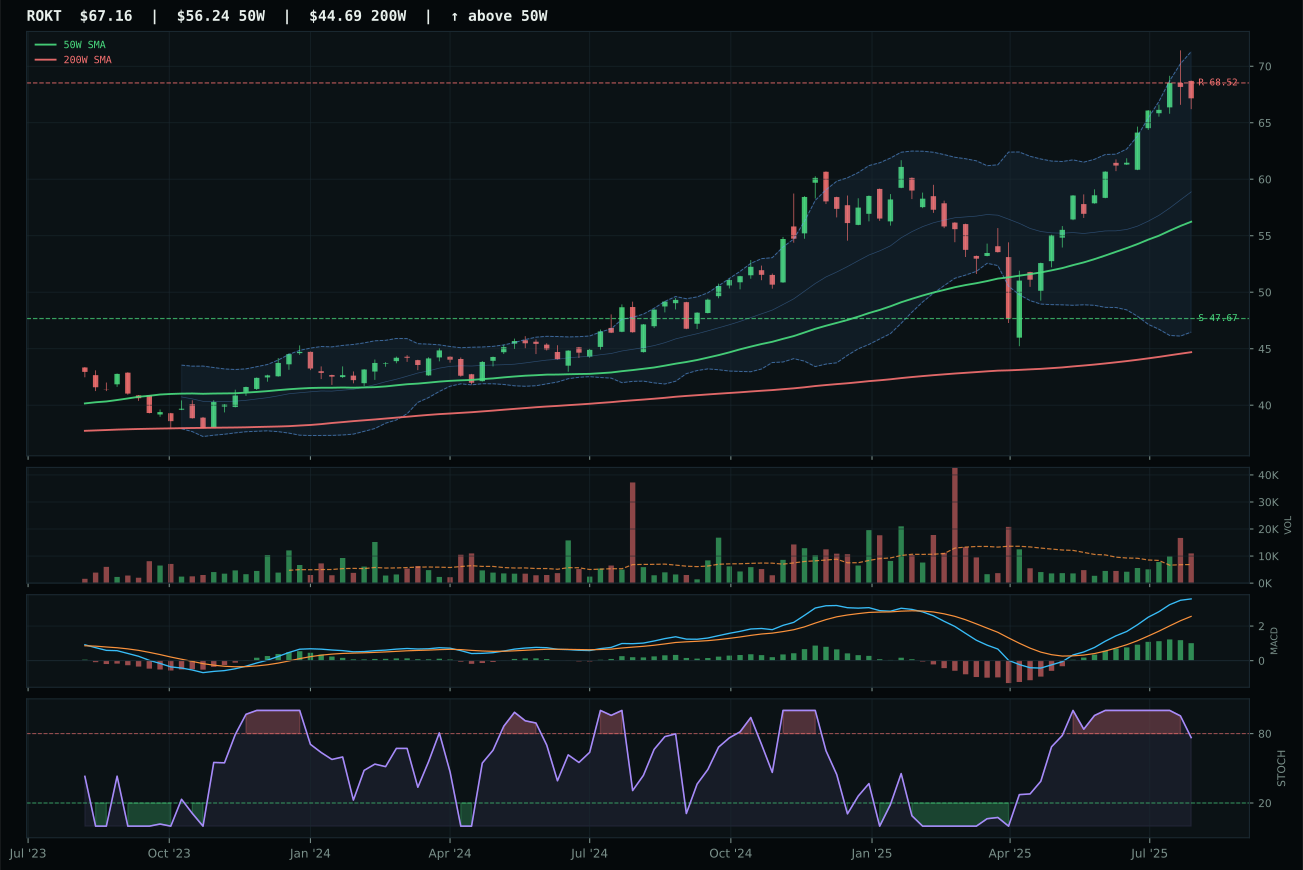
ROKT has a vertical extension profile with 12.3% 13-week relative strength versus SPY.
A failed hold above support would weaken the setup.
Tracked, but not top-2 eligible because: .
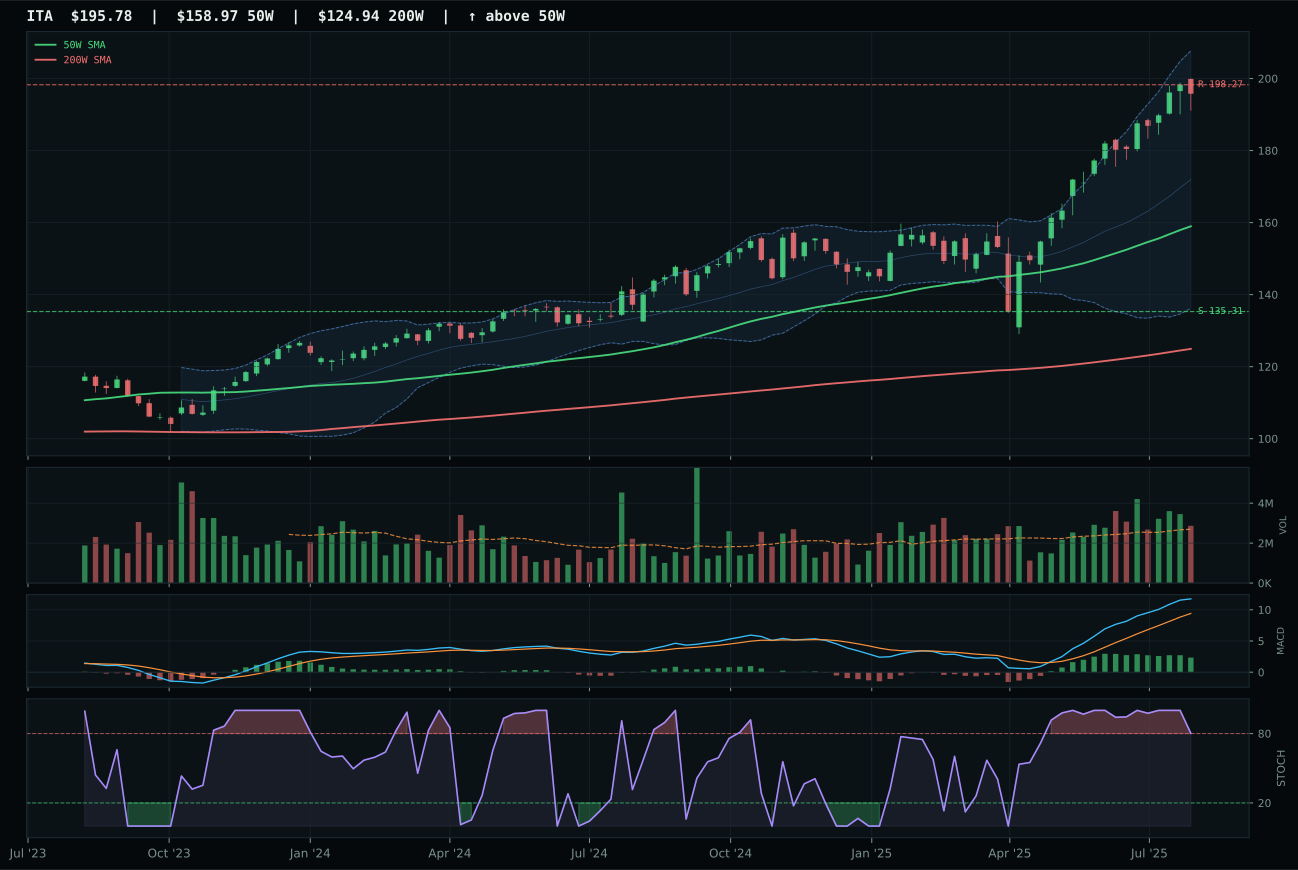
ITA has a vertical extension profile with 11.6% 13-week relative strength versus SPY.
A failed hold above support would weaken the setup.
Actionable but governed by invalidation levels.
ITA wins Defense & Aerospace by a razor-thin margin over XAR, scoring 51.2 in the 3/2/1 proof order versus XAR's 70.6 ranking—a reversal that highlights the tension between raw technical leadership and timing risk. ITA leads on category-relative strength at 0.0% versus XAR's -0.4%, a negligible difference that nonetheless preserves XAR's standing in the basket. However, ITA's structure score of 77.0 against XAR's 76.4 and its perfect trend confirmation of 100/100 allowed it to edge through the allocator's filters despite sitting 23.2% above its 50-week moving average near the 52-week high. The setup screams extension: stochastic RSI overbought rolling over, MACD bullish but flattening, and risk-to-reward skewed to the downside at 44.7% below support. This is a momentum name at the tail end of its thesis, selected only because category alternatives are similarly extended or structurally broken.
Defense & Aerospace earned a 5% allocation despite a category score of only 51.7 because the tactical thesis—Transition/Mixed macro plus geopolitical durability—justifies exposure at lower risk-reward thresholds. Macro fit sits at 51.0, with neutral credit and modest liquidity stress providing zero directional incentive. The real problem is structure: ITA is extended 23.2% above the 50-week, MACD is flattening, and stochastic RSI is rolling over, which means new capital entry carries a 44.7% downside risk to support versus only 1.3% upside to resistance. This category scores worse than five others competing for allocation, so it wins a slot only because the macro regime supports holding something with defensive characteristics. If defense breaks below 135.31 support or if momentum rolls materially, this allocation should transfer to a higher-ranked opportunity immediately.
Precious Metals — GLD
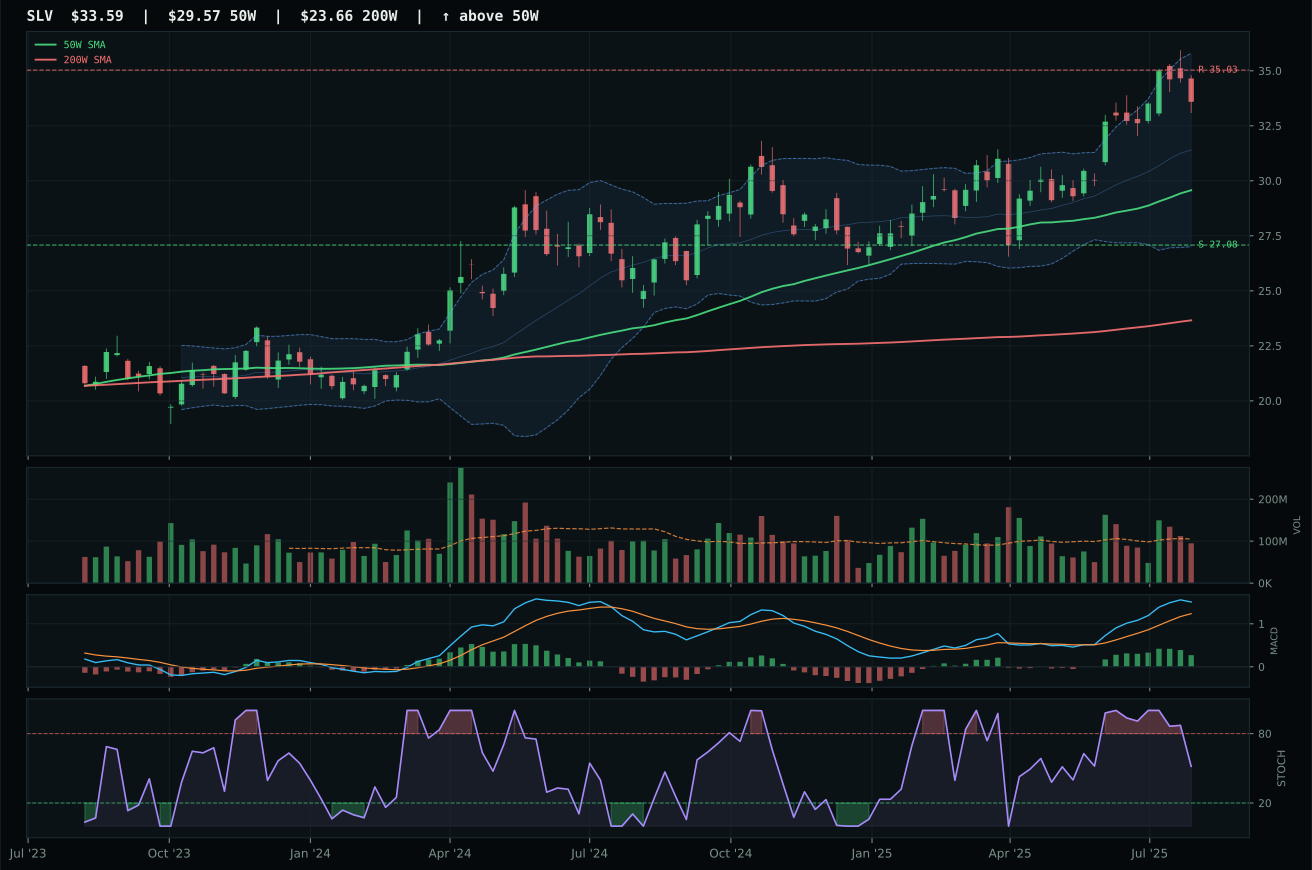
SLV has a neutral structure profile with 5.7% 13-week relative strength versus SPY.
A failed hold above support would weaken the setup.
Actionable but governed by invalidation levels.
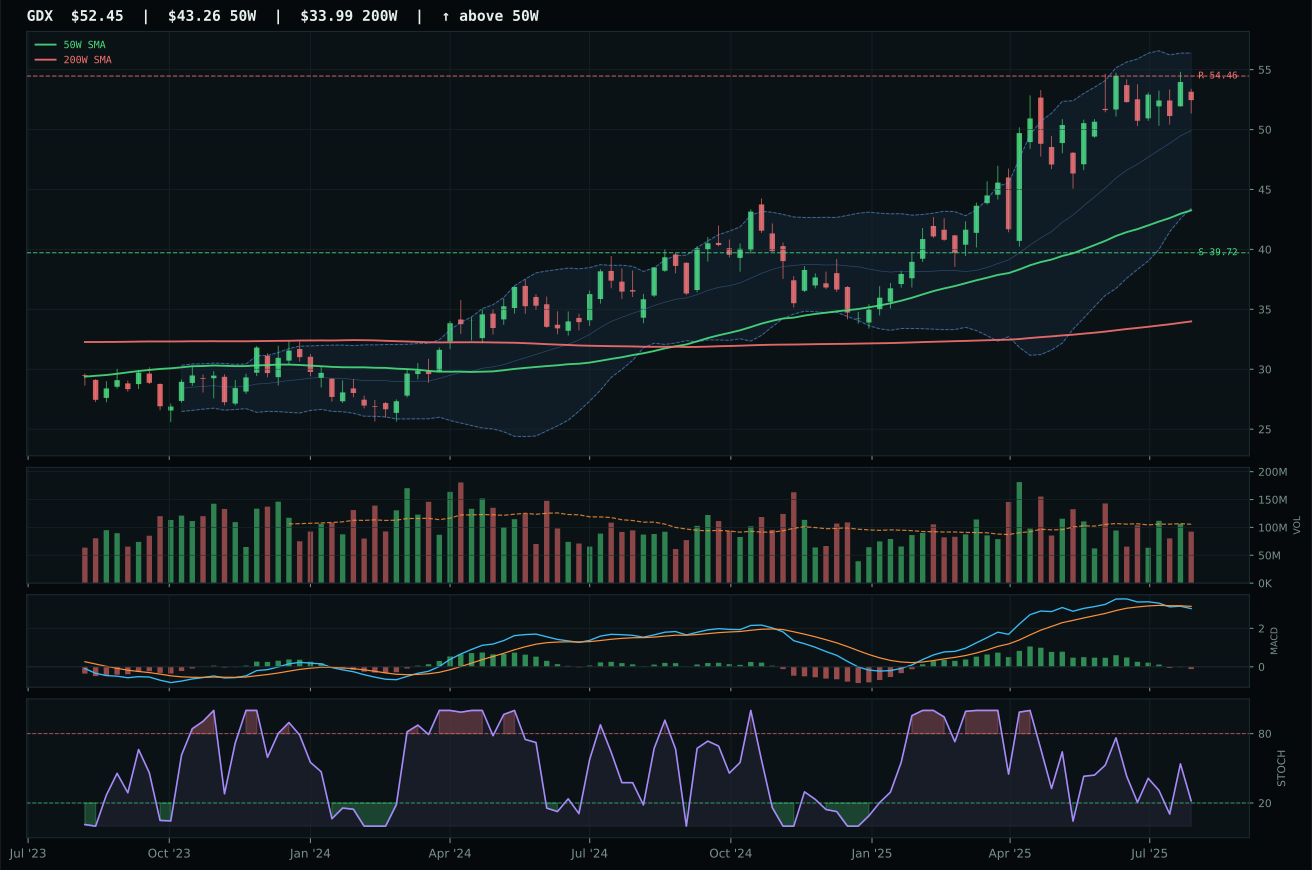
GDX has a vertical extension profile with 1.7% 13-week relative strength versus SPY.
A failed hold above support would weaken the setup.
Actionable but governed by invalidation levels.
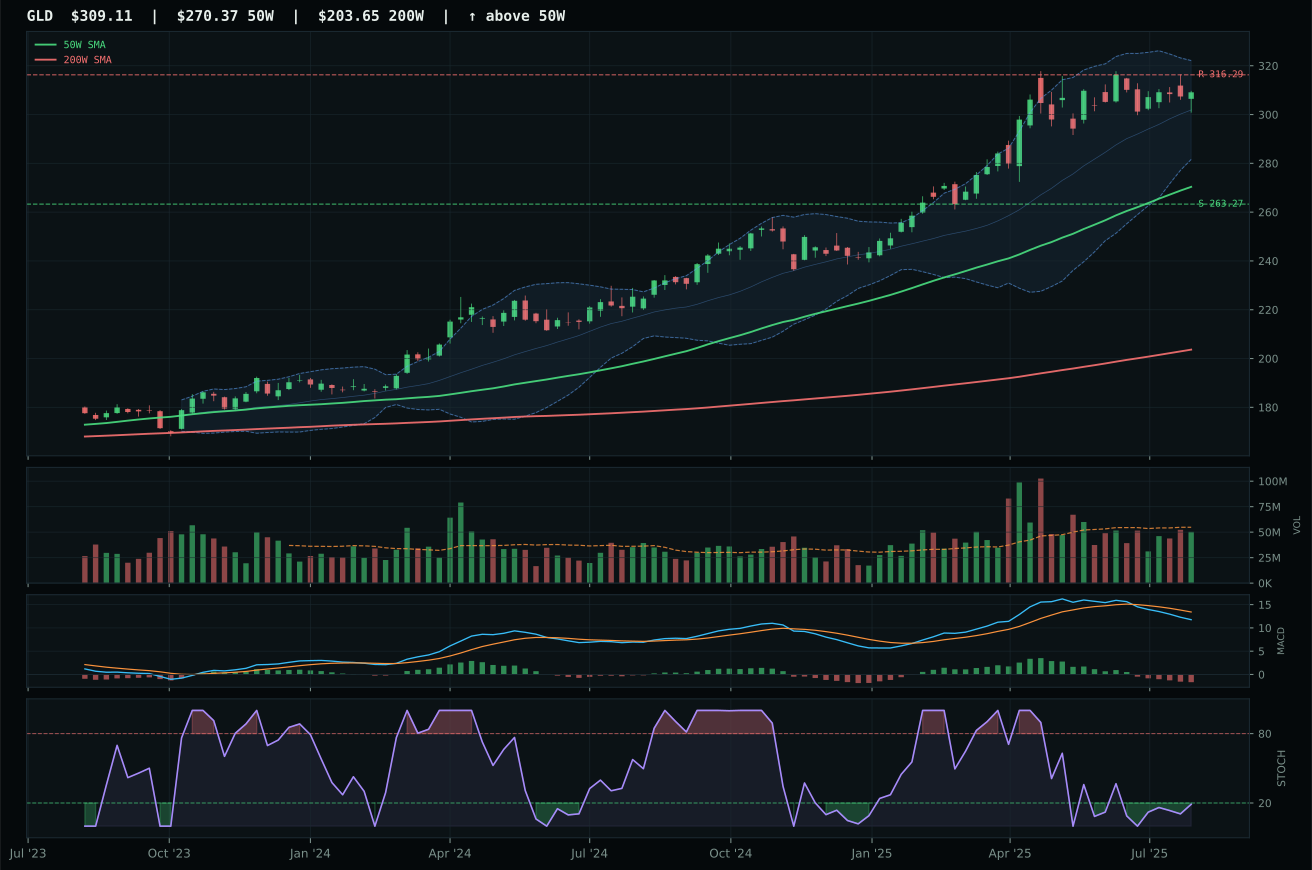
GLD has a neutral structure profile with -6.0% 13-week relative strength versus SPY.
A failed hold above support would weaken the setup.
Actionable but governed by invalidation levels.
GLD wins Precious Metals with a composite score of 60 versus SLV's runner-up 80, a stunning reversal that reveals how timing and macro alignment override raw technical leadership. SLV dominated on trend and momentum, posting 15.4% thirteen-week returns with 5.7% outperformance versus SPY, yet its timing score of 70 versus GLD's 76 coupled with falling-neutral stochastic RSI proved decisive. GLD's stochastic RSI reading of 0.19 (oversold turning up) combined with MACD bearish-weakening set up a potential mean-reversion trade, whereas SLV's bullish but flattening MACD and neutral stochastic offered momentum with deteriorating conviction. GLD's 3/2/1 reasoning score landed at 35.3 versus SLV's 68.1, a gap that would normally spell defeat, yet the category reasoner tests structure, persistence, and macro fit independently: gold as the clean monetary hedge outweighed silver's hybrid beta in a regime favoring defensive positioning.
Precious Metals earned 5% despite a category score of only 42.6—third-quartile weakness—because macro fit at 46.0 supports tactical hedging in credit stress and liquidity uncertainty. The two-ETF reasoning order (SLV 68.1, GLD 35.3) shows that silver is technically superior; GLD wins the representative slot only on timing asymmetry. Risk appetite being active creates a minus 4 headwind, and neither metal is receiving institutional accumulation above-average participation. The core thesis: both GLD and SLV sit extended from their 50-week moving averages with muted conviction, offering neither attractive entry nor immediate roll-over signals. This 5% is defensive allocation—a hedge against credit deterioration or geopolitical shock—not a conviction bet. If liquidity stress worsens or if both metals break below their 50-week support levels decisively, this slot should remain but migrate to other real assets. Current positioning suggests waiting for stochastic RSI to rise above 50 on both before adding size.
Agriculture & Livestock — MOO
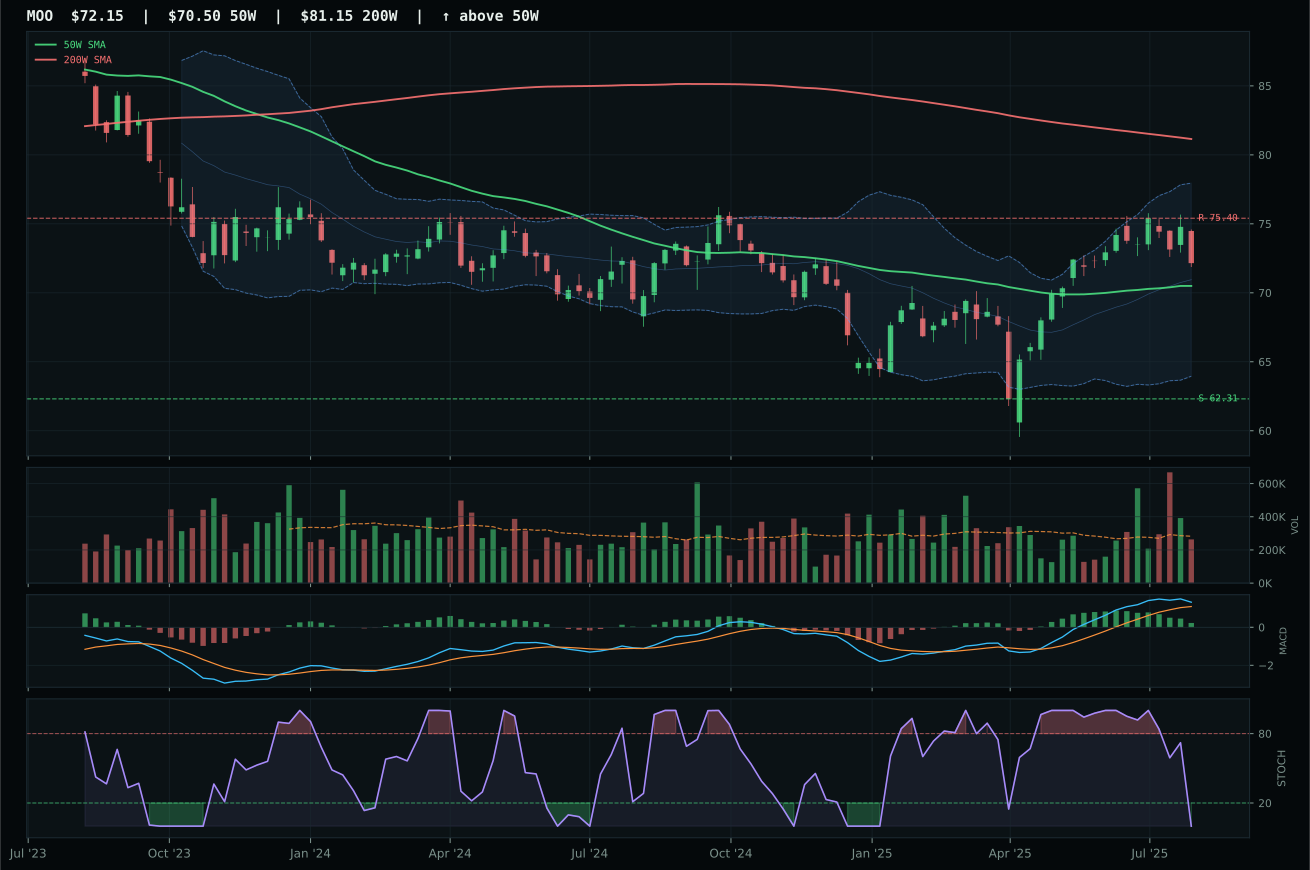
MOO has a compression near 50W profile with -6.5% 13-week relative strength versus SPY.
A failed hold above support would weaken the setup.
Actionable but governed by invalidation levels.
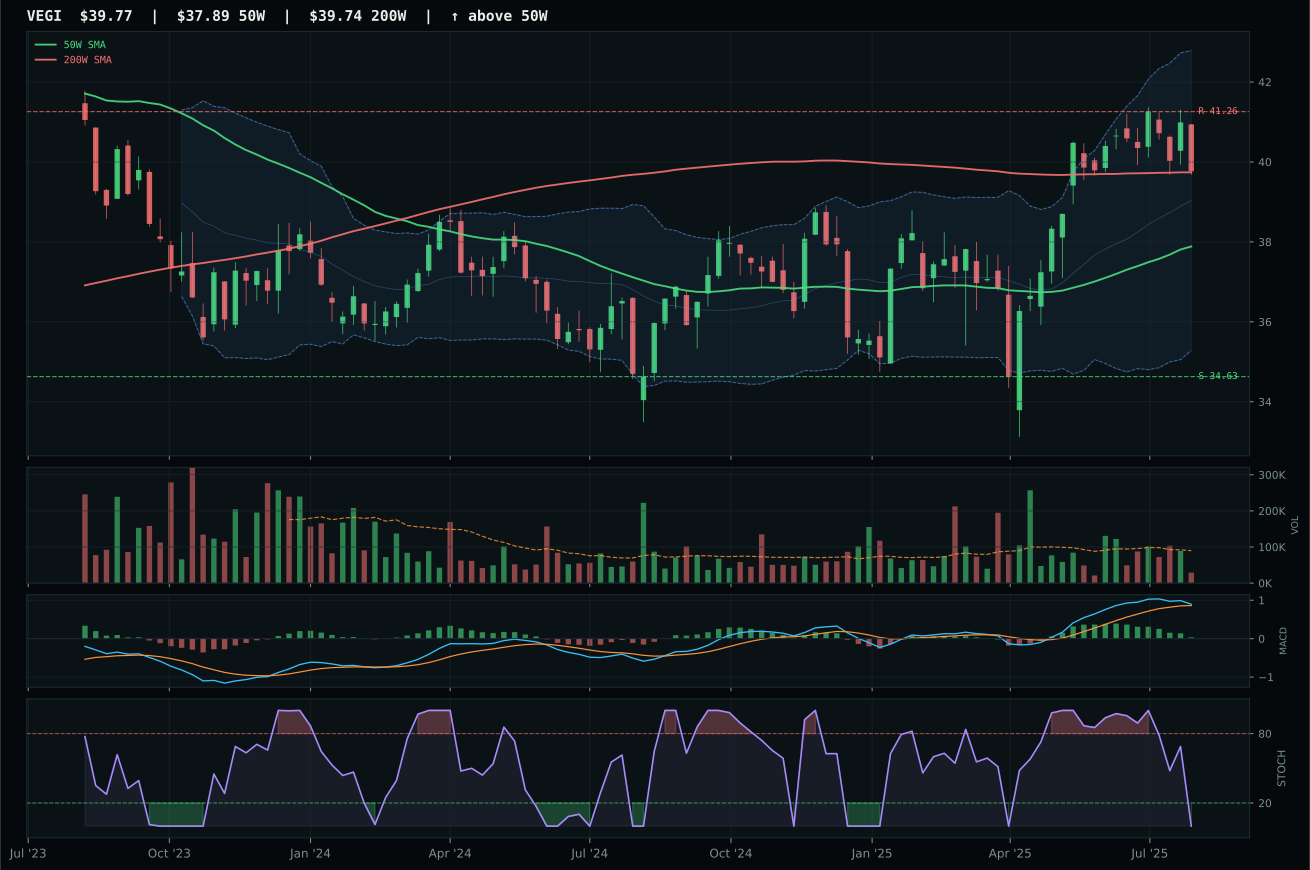
VEGI has a neutral structure profile with -5.9% 13-week relative strength versus SPY.
A failed hold above support would weaken the setup.
Tracked, but not top-2 eligible because: .
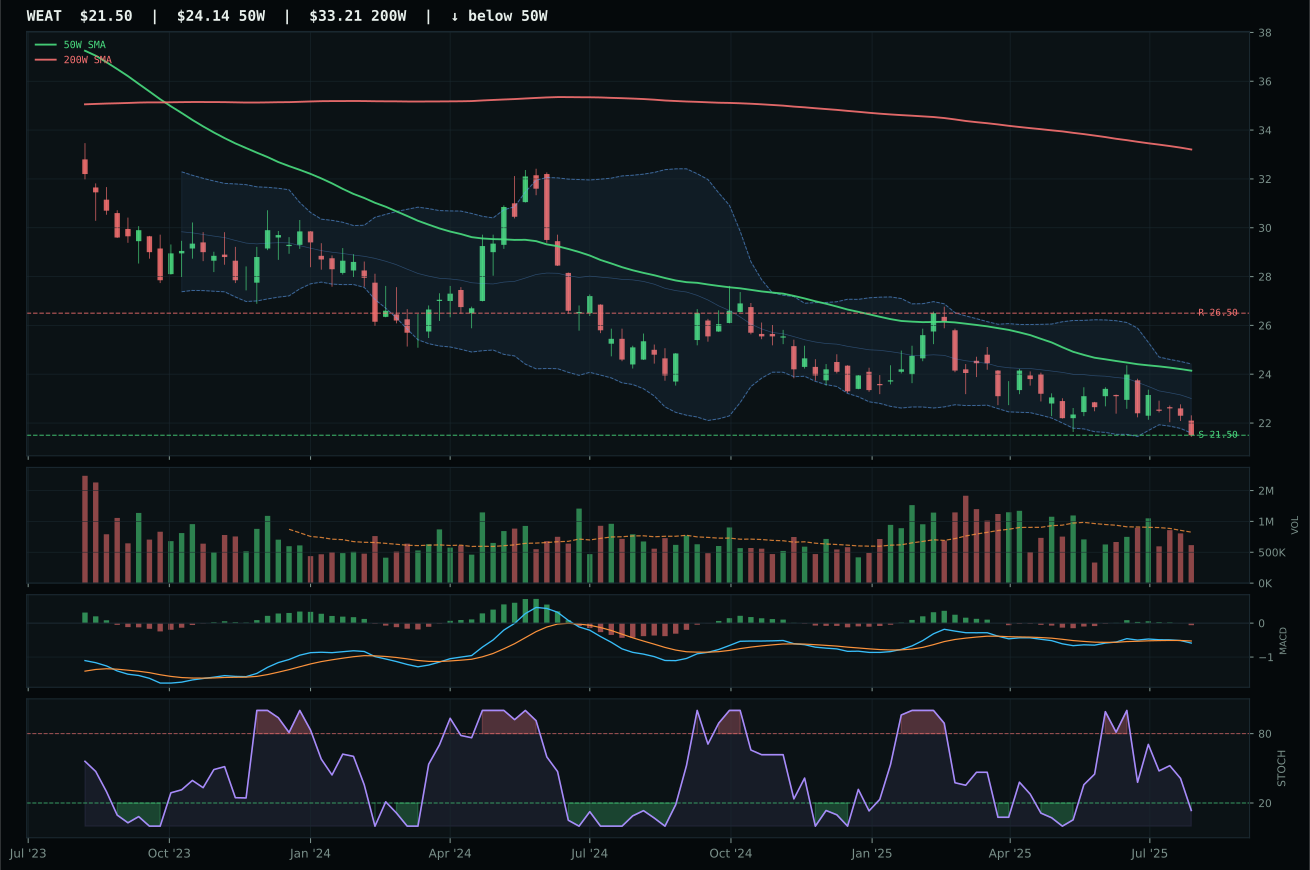
WEAT has a pullback into support profile with -16.4% 13-week relative strength versus SPY.
Extension and support failure are the main tactical risks.
Tracked, but not top-2 eligible because: structurally broken.
MOO wins Agriculture & Livestock despite an extremely weak 25.8 final category score—a designation that means winning a category nobody wants. MOO's advantage over VEGI lies in superior timing (95.0 versus 85.0) and marginally better risk-reward (49.9 versus 49.4), both driven by its position 2.3% above the 50-week moving average in compression. The oversold stochastic RSI reading of 0.00 paired with MACD bullish but flattening sets up a potential reversal, but volume at 0.93x average participation offers no conviction. VEGI collapses due to thin volume participation and a bearish MACD structure despite a slightly better trend configuration; the category median RS of 0.0% signals neither candidate is pulling in new money. This is a mutual weakness: both names trade in agricultural depression, with MOO simply compressed closer to support for a potential bounce.
Agriculture earned 5% because the category itself scores 25.8—well below median—yet real asset sponsorship and commodity breadth positivity are active macro descriptors that warrant tactical defense in a Transition/Mixed regime. This is not a conviction allocation; it is insurance. Macro fit at 59.0 is the category's single strength, driven by +8 real asset sponsorship and +5 commodity breadth offsetting minus 4 liquidity stress. MOO's compression structure near the 50-week with oversold stochastic RSI creates a low-risk entry threshold: if 62.31 support holds, the next move could deliver 4.3% upside to resistance with defined risk. However, the 41.1% momentum confirmation score and minus 4.3% 4-week return signal that agriculture is in distribution mode, not accumulation. This allocation should be viewed as a 2-3 week probe into a potential support bounce, not a strategic long-term position.
Traditional Energy — XLE
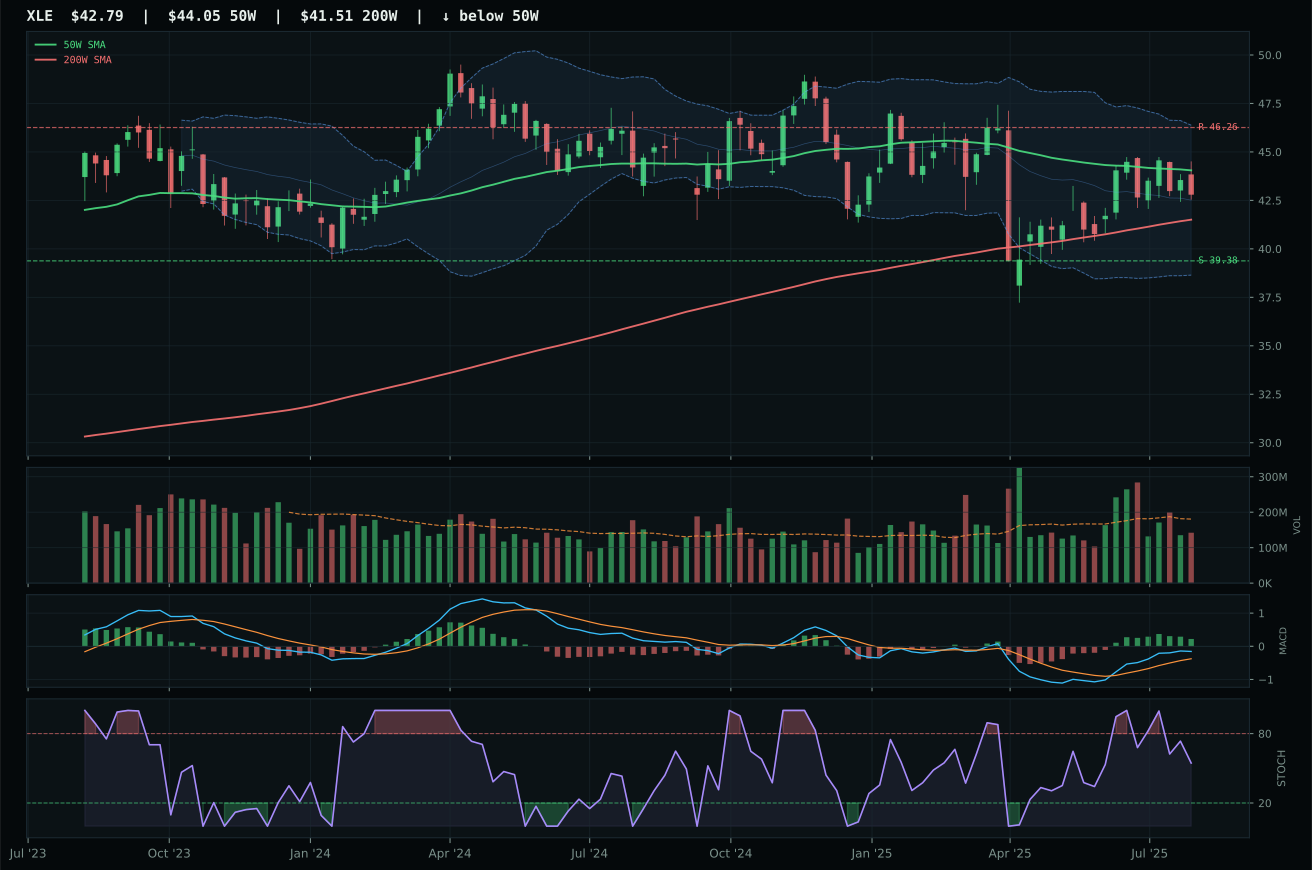
XLE has a compression near 50W profile with -5.3% 13-week relative strength versus SPY.
A failed hold above support would weaken the setup.
Actionable but governed by invalidation levels.
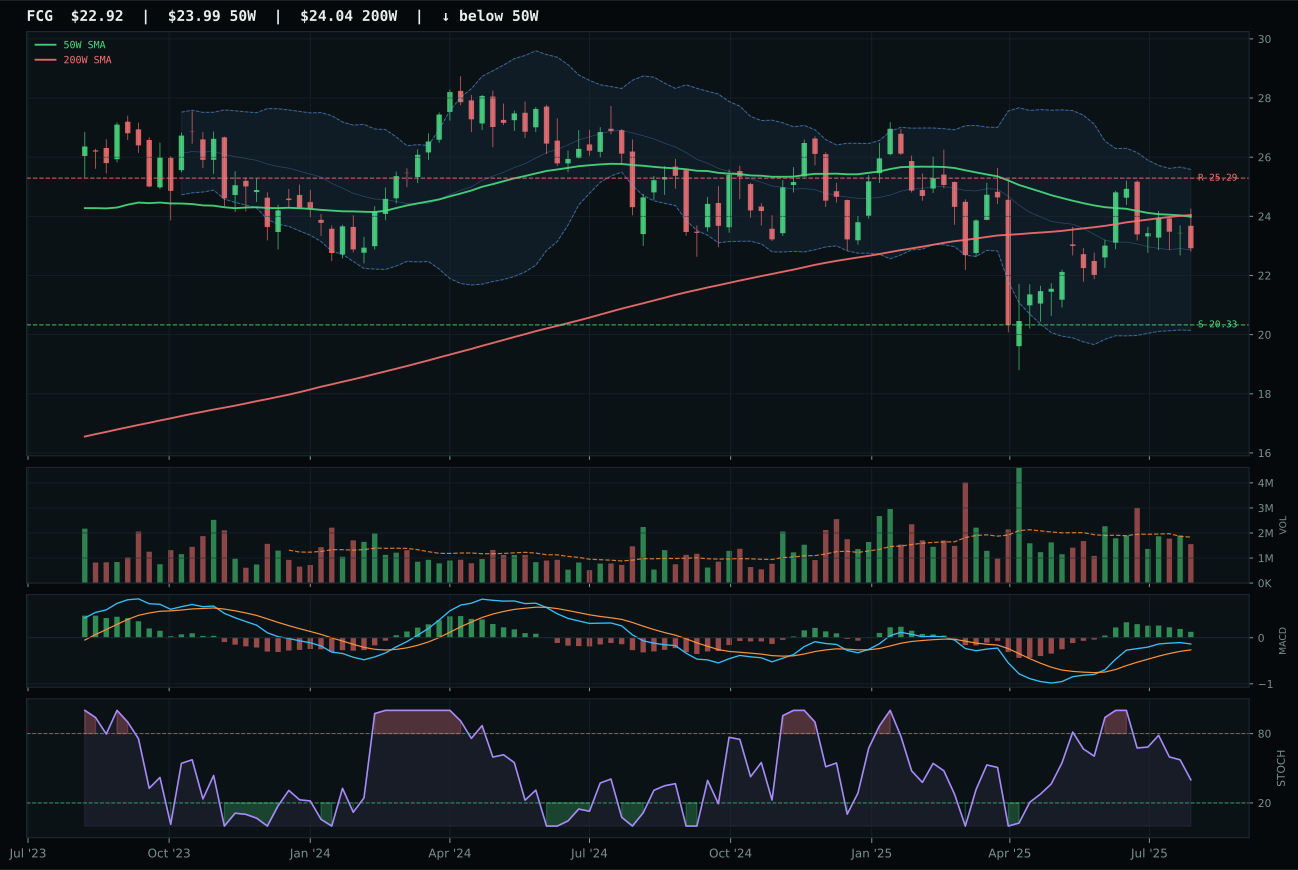
FCG has a neutral structure profile with -3.3% 13-week relative strength versus SPY.
Extension and support failure are the main tactical risks.
Tracked, but not top-2 eligible because: structurally broken.
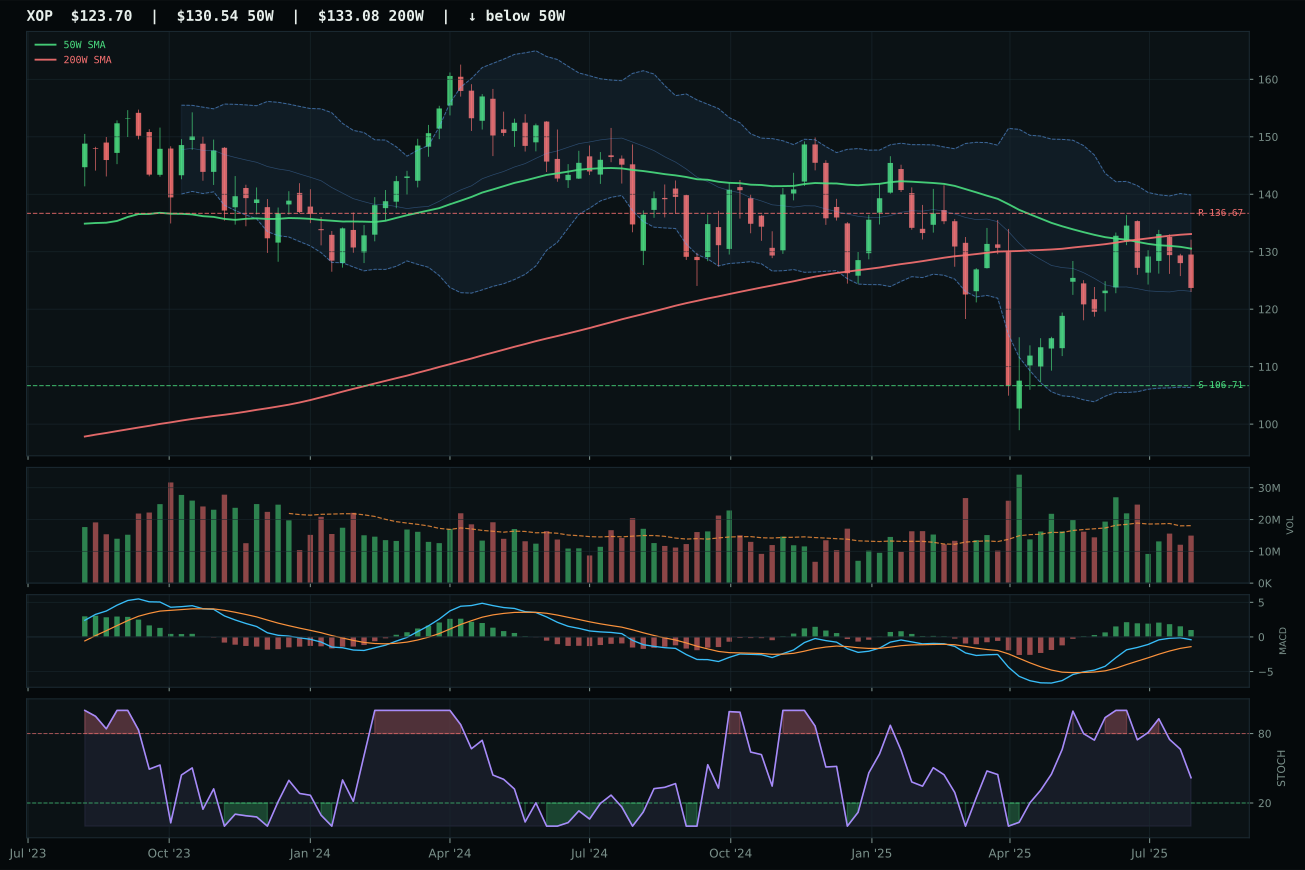
XOP has a neutral structure profile with -2.1% 13-week relative strength versus SPY.
Extension and support failure are the main tactical risks.
Tracked, but not top-2 eligible because: structurally broken.
XLE wins Traditional Energy with a 57 composite score versus FCG's 30, a landslide despite the category's abysmal 21.3 final score. XLE trades 2.8% below its 50-week moving average in compression, a reset setup that offers potential expansion, while FCG's structure scored a disqualifying 40/100 due to chart deterioration. XLE's timing score of 95 versus FCG's 85 reflects the setup quality difference: price near support, MACD bullish but flattening, stochastic falling-neutral, Fibonacci location in the near 52-week low repair zone. Volume at 0.79x is subpar across the category, yet XLE's neutral participation is superior to FCG's full deterioration. This is not a momentum trade; this is a defensive positioning in names that have collapsed. Integrated energy cash-flow defense offers exposure without the structural breakage plaguing natural gas—a category-level weakness that makes even the best option fairly poor.
Traditional Energy earned 0% allocation this week because its 21.3 category score ranks it 9th among 10 exposures, with macro fit at 43.0 providing no directional conviction. Real asset sponsorship (+7) is offset by credit stress minus 7 and liquidity stress minus 7, creating neutral macro conditions. Critically, XLE's timing setup—sitting just 2.8% below the 50-week—offers a break-even risk-reward with 8.7% downside and 7.5% upside, which is precisely the wrong asymmetry for new capital deployment. The category's relative weakness (negative 5.3% RS versus SPY, positive 4.4% 13-week return) shows energy is underperforming the market despite real asset sponsorship. Volume at 0.79x 20-week average signals institutional indifference. For Traditional Energy to earn allocation next week, it would need either a sharp macro catalyst (credit stress reversal, geopolitical supply shock) or a break above 46.26 resistance with renewed volume participation. Current positioning is correctly defenseless given the 10-category opportunity set.
Emerging Markets — IEMG
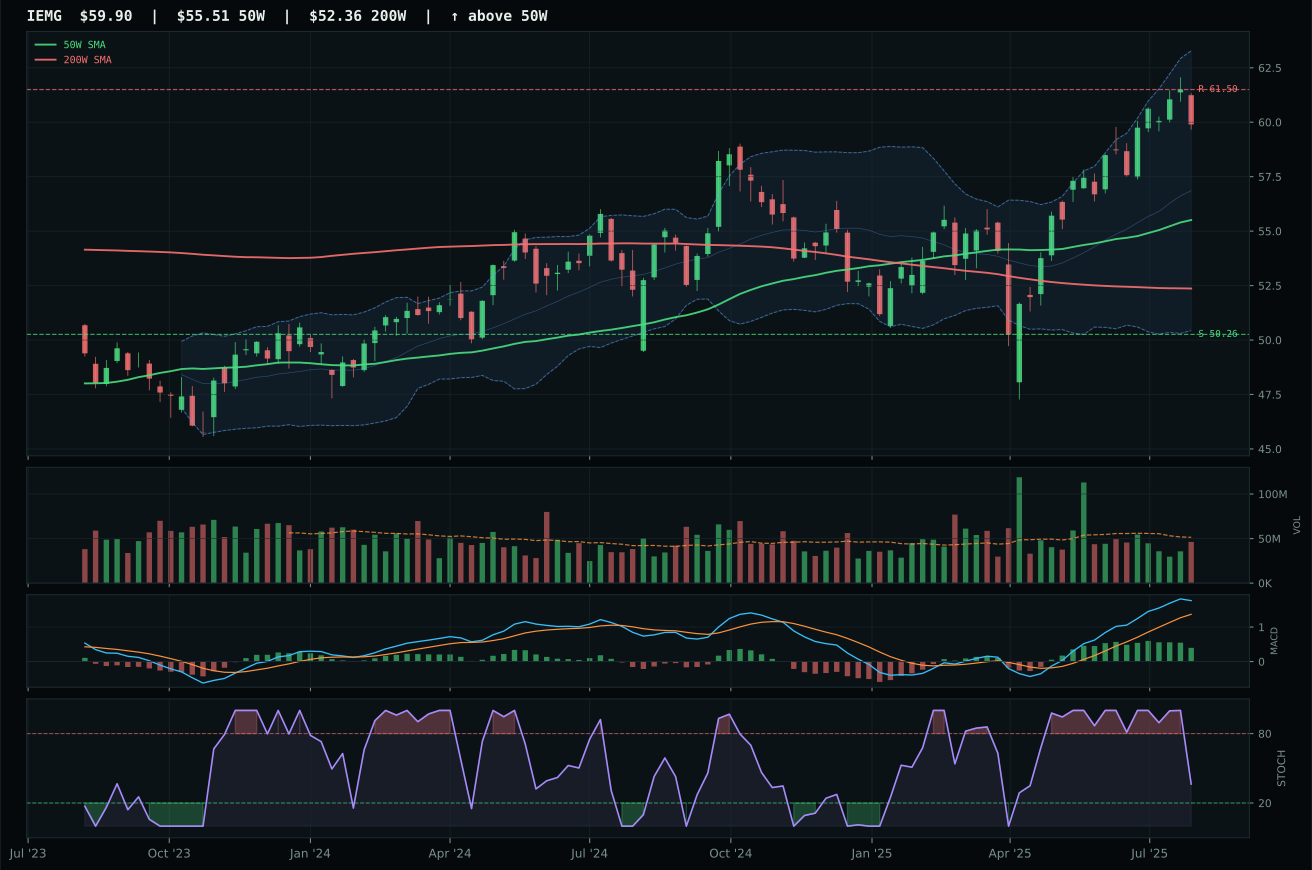
IEMG has a neutral structure profile with -2.2% 13-week relative strength versus SPY.
A failed hold above support would weaken the setup.
Actionable but governed by invalidation levels.
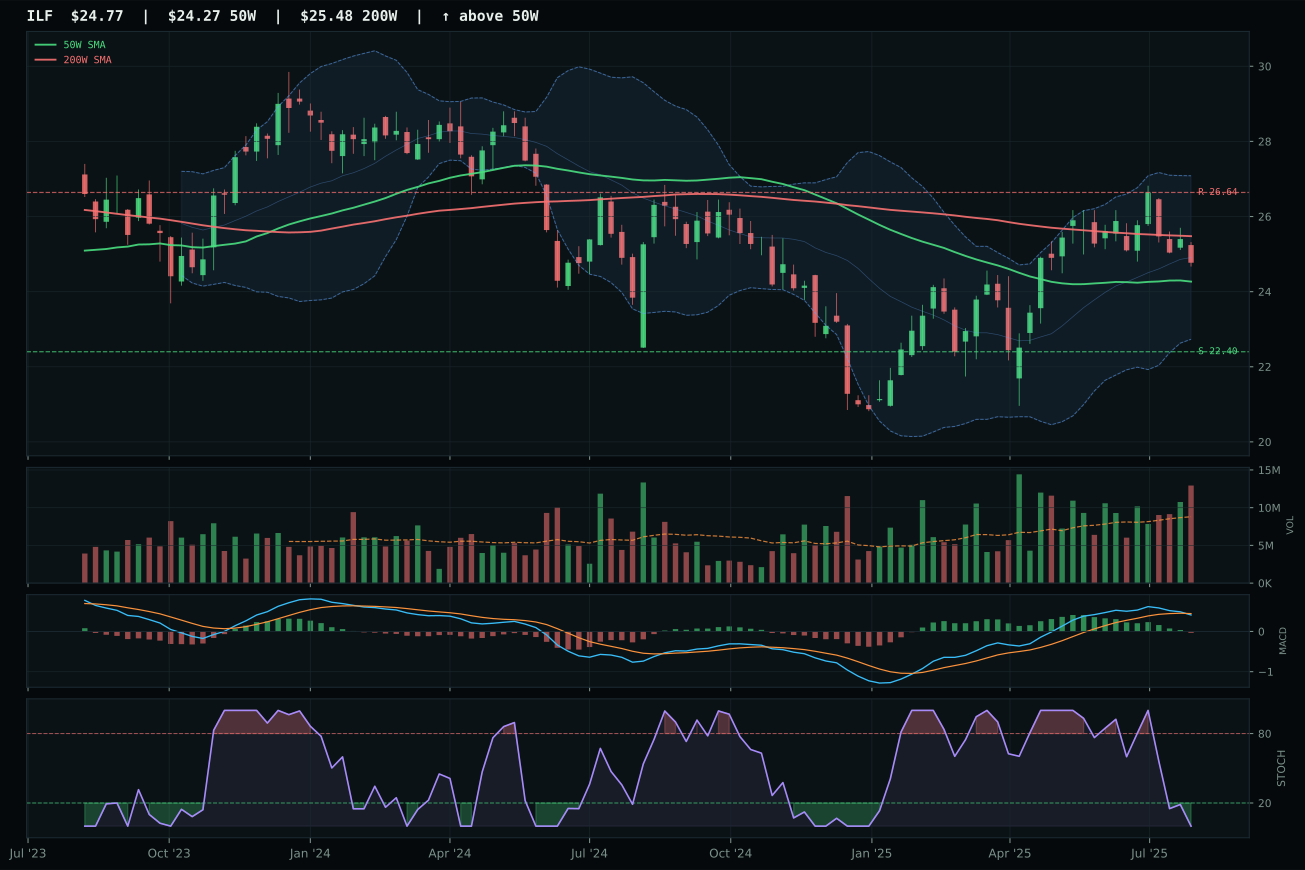
ILF has a compression near 50W profile with -10.2% 13-week relative strength versus SPY.
A failed hold above support would weaken the setup.
Actionable but governed by invalidation levels.
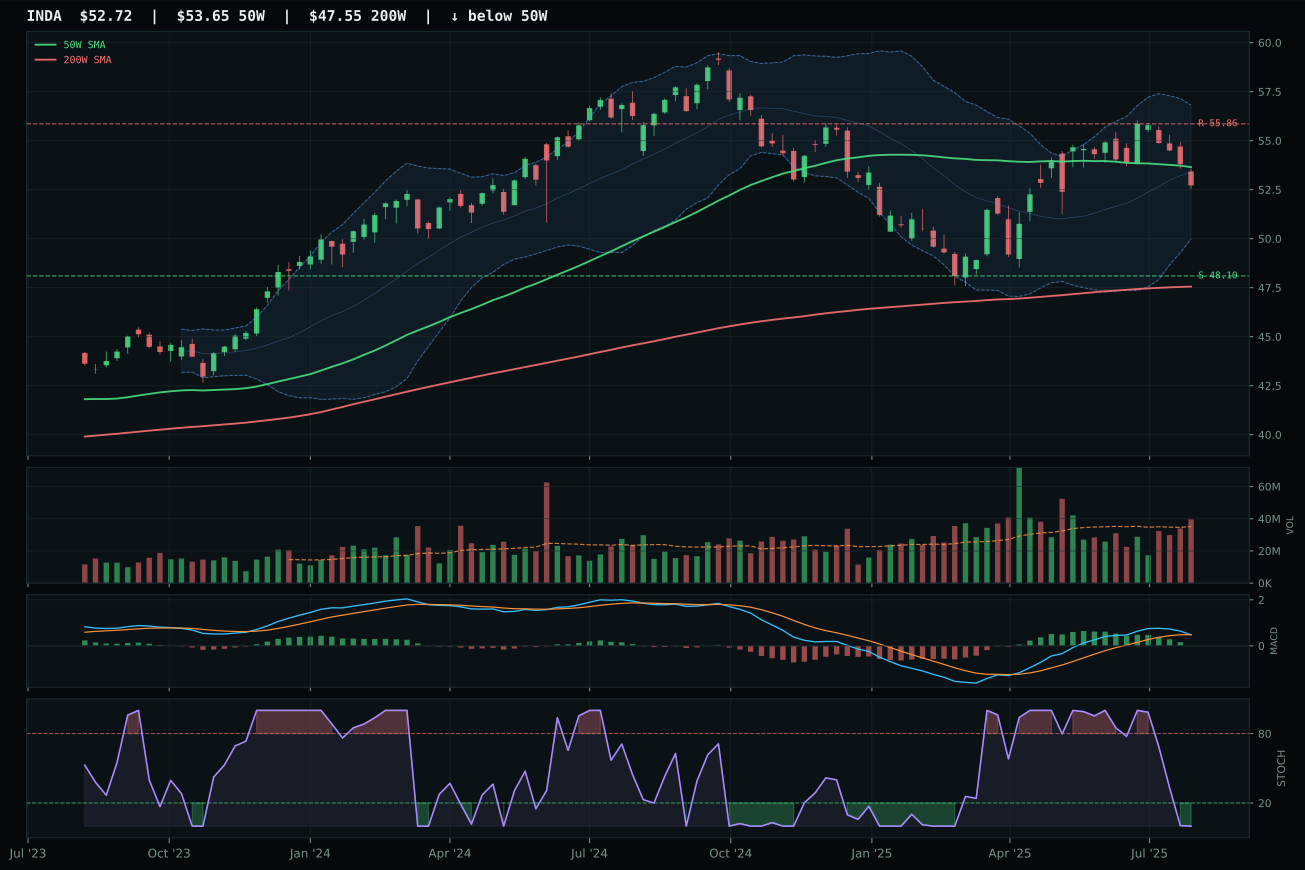
INDA has a compression near 50W profile with -11.9% 13-week relative strength versus SPY.
A failed hold above support would weaken the setup.
Actionable but governed by invalidation levels.
IEMG wins Emerging Markets with a 71 composite score versus ILF's 53, driven by superior breadth and cleaner MACD structure in a category that ranks among the portfolio's weakest. IEMG scores 82.7 on trend—broad emerging-market beta positioning above both moving averages with a 0.2% slope—and maintains bullish but flattening MACD with falling-neutral stochastic RSI, a configuration suggesting consolidation rather than breakdown. ILF collapses on technical evidence (25.6/100) due to bearish-weakening MACD and oversold stochastic paired with thin volume participation; despite macro tailwinds in commodity breadth and real asset sponsorship, the chart is structurally broken. IEMG's category-relative strength of 8.0% versus ILF's 0.0% indicates preference for broad exposure over regional concentration. This is a relative victory in a weak category: IEMG remains above water technically while regional alternatives spiral downward.
Emerging Markets earned 0% allocation this week because its 14.6 category score ranks it 10th among the competitive set, with macro fit at 38.0 actively negative: risk appetite is active minus 0 (neutral impact), but credit stress minus 10 and liquidity stress minus 10 create a hostile environment. IEMG's technical merit (72 composite, 83 trend, 70 timing) is genuine but insufficient to overcome macro headwinds in a Transition/Mixed regime where capital is rotating toward energy security and AI infrastructure, not global diversification. The Emerging Markets category itself is in distribution: IEMG's neutral volume at 0.90x 20-week shows institutional indifference despite its compression setup, and ILF's bearish MACD with oversold stochastic RSI tells us sellers are in control. For Emerging Markets to earn a 5% or 10% allocation, the category would require either a 10-15% tactical pullback in both IEMG and ILF to rebuild entry geometry, or a macro catalyst (risk appetite surge, credit stress relief) that's not yet evident. Current positioning correctly excludes this category in favor of higher-conviction real assets and domestic technology.