
2025-07-25
Informational purposes only. The content in this report, including allocations, analysis, and commentary, is provided solely for informational and educational purposes. It does not constitute financial advice, investment advice, trading advice, or any other type of advice. Past performance does not guarantee future results. Always conduct your own research and consult a qualified financial professional before making investment decisions.
Weekly Allocation
| Ticker | Category | Weight | Role |
|---|---|---|---|
| FBTC | 50% | Overlay | |
| REMX | Industrial Metals | 10% | Top-2 (10%) |
| NLR | Nuclear Energy | 10% | Top-2 (10%) |
| BOTZ | AI | 5% | Tier-2 (5%) |
| ITA | Defense & Aerospace | 5% | Tier-2 (5%) |
| PAVE | Utilities & Infrastructure | 5% | Tier-2 (5%) |
| XLE | Traditional Energy | 5% | Tier-2 (5%) |
| MOO | Agriculture & Livestock | 5% | Tier-2 (5%) |
| SLV | Precious Metals | 5% | Tier-2 (5%) |
Trade Instructions — Monday Open
Sell the tranche from 2025-06-27 (completing its 4-week hold). Buy the new tranche. Instructions show net portfolio changes — same-asset positions cancel, weight changes show the delta.
| Action | Ticker | Instruction |
|---|---|---|
| SELL | XLK | Sell 40% of XLK position (reduce 6.25% → 3.75%) |
| SELL | SMH | Sell 40% of SMH position (reduce 6.25% → 3.75%) |
| SELL | URNM | Sell 25% of URNM position (reduce 5.00% → 3.75%) |
| SELL | XAR | Sell 25% of XAR position (reduce 5.00% → 3.75%) |
| SELL | IEMG | Sell entire IEMG position (1.25% of portfolio) |
| SELL | COPX | Sell 20% of COPX position (reduce 6.25% → 5.00%) |
| BUY | XLE | Buy XLE — 12.50% of freed cash (adds 1.25% to portfolio) |
| BUY | REMX | Buy REMX — 25.00% of freed cash (adds 2.50% to portfolio) |
| BUY | MOO | Buy MOO — 12.50% of freed cash (adds 1.25% to portfolio) |
| BUY | NLR | Buy NLR — 25.00% of freed cash (adds 2.50% to portfolio) |
| BUY | BOTZ | Buy BOTZ — 12.50% of freed cash (adds 1.25% to portfolio) |
| BUY | ITA | Buy ITA — 12.50% of freed cash (adds 1.25% to portfolio) |
Current Portfolio After Trade
Combined holdings across all 4 active tranches. Each tranche is 25% of the portfolio.
| Ticker | % of Portfolio | Weight Bar |
|---|---|---|
| FBTC | 50.00% | |
| XLE | 6.25% | |
| PAVE | 5.00% | |
| COPX | 5.00% | |
| REMX | 5.00% | |
| URNM | 3.75% | |
| XAR | 3.75% | |
| SLV | 3.75% | |
| XLK | 3.75% | |
| SMH | 3.75% | |
| MOO | 2.50% | |
| URA | 2.50% | |
| NLR | 2.50% | |
| BOTZ | 1.25% | |
| ITA | 1.25% |
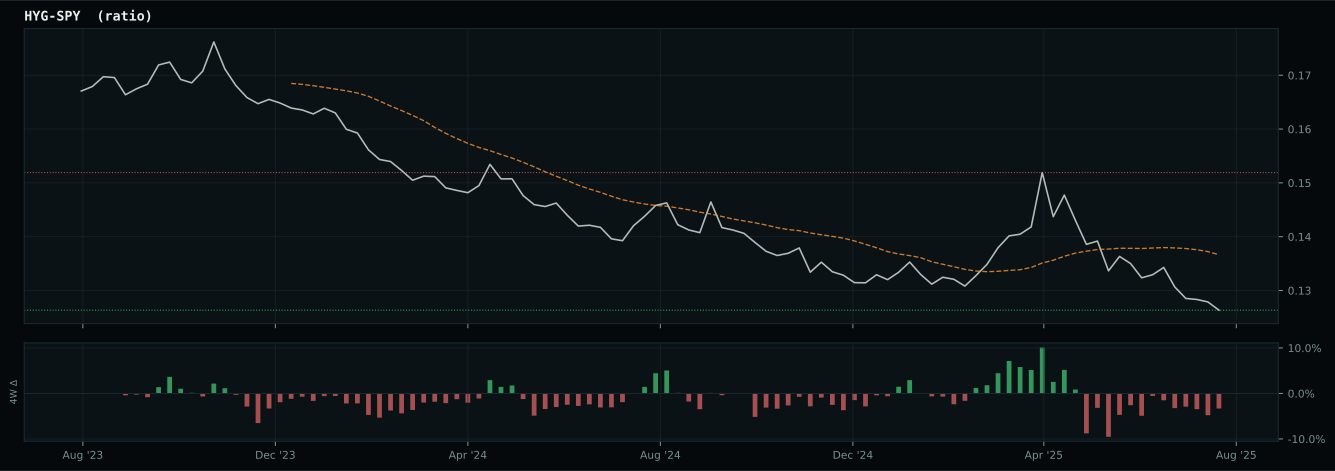
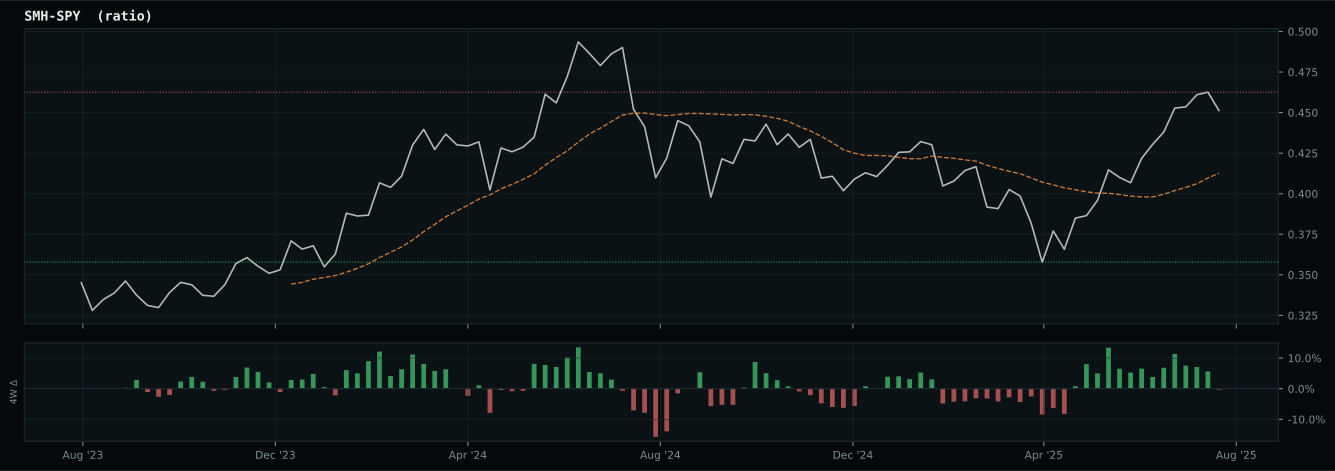
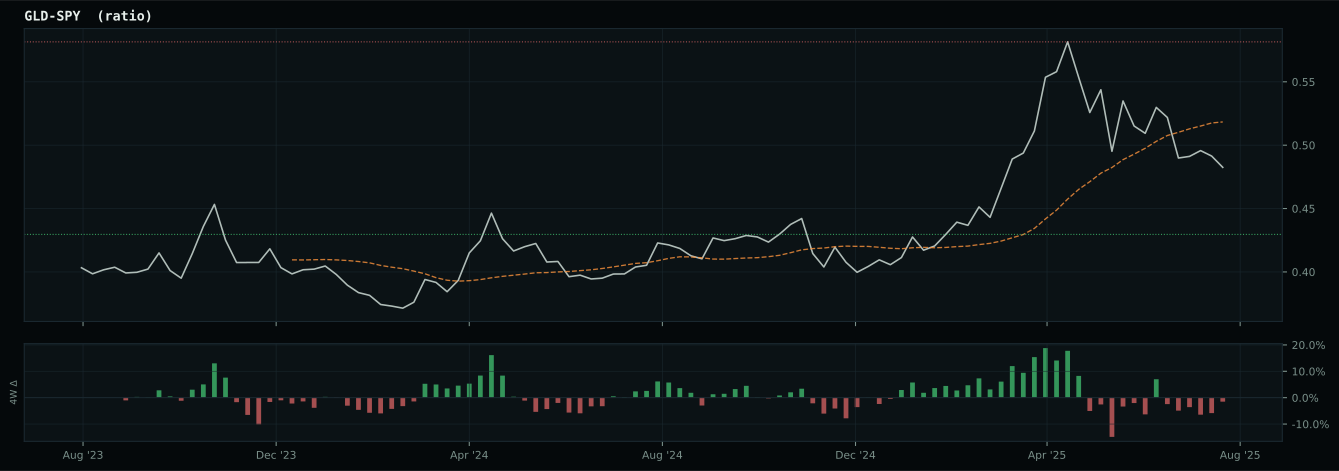
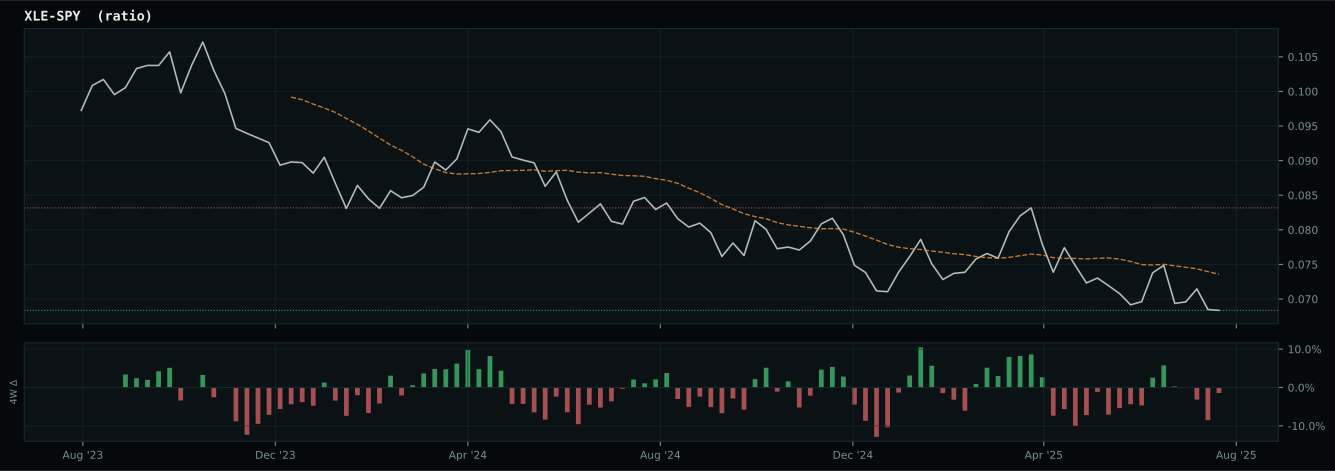
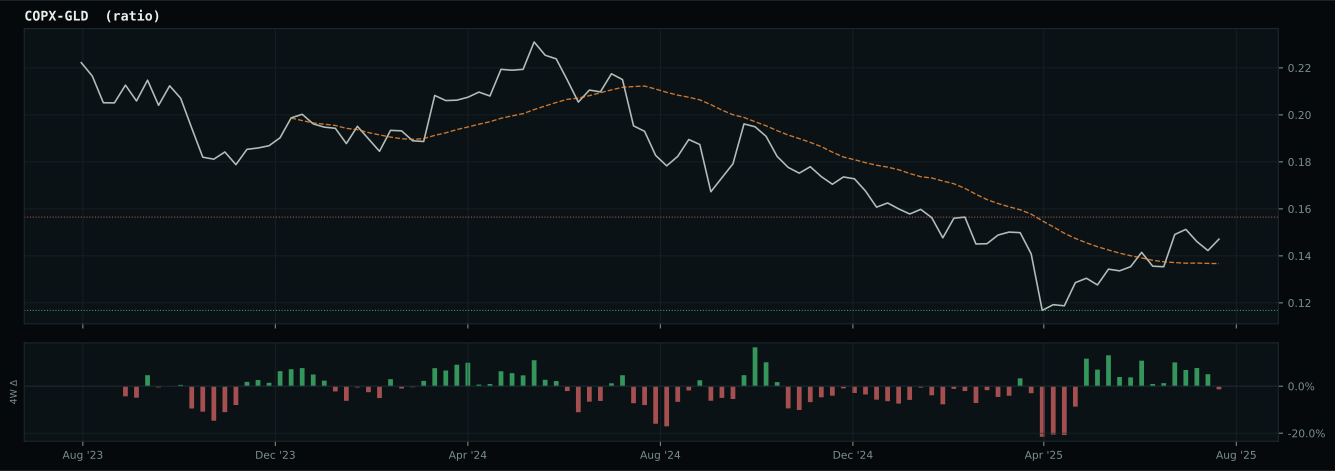
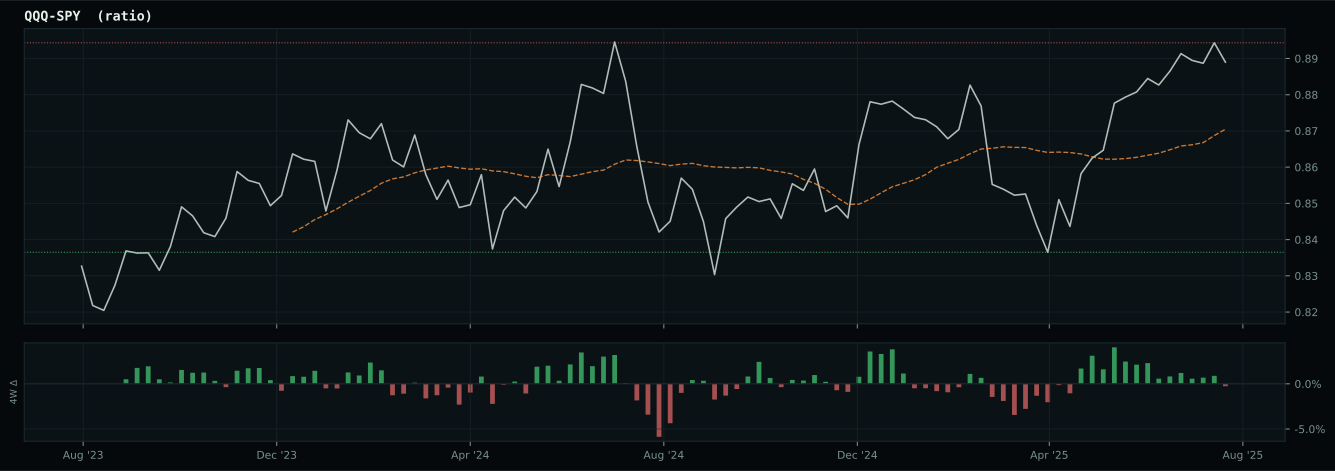
Macro Regime — Risk-Off Deterioration
Macro Evidence Charts
Market-implied signals behind the macro regime scores. Each ratio compares two assets; the direction and slope of the ratio is what the macro engine reads.
Crypto Regime — TrendBTC
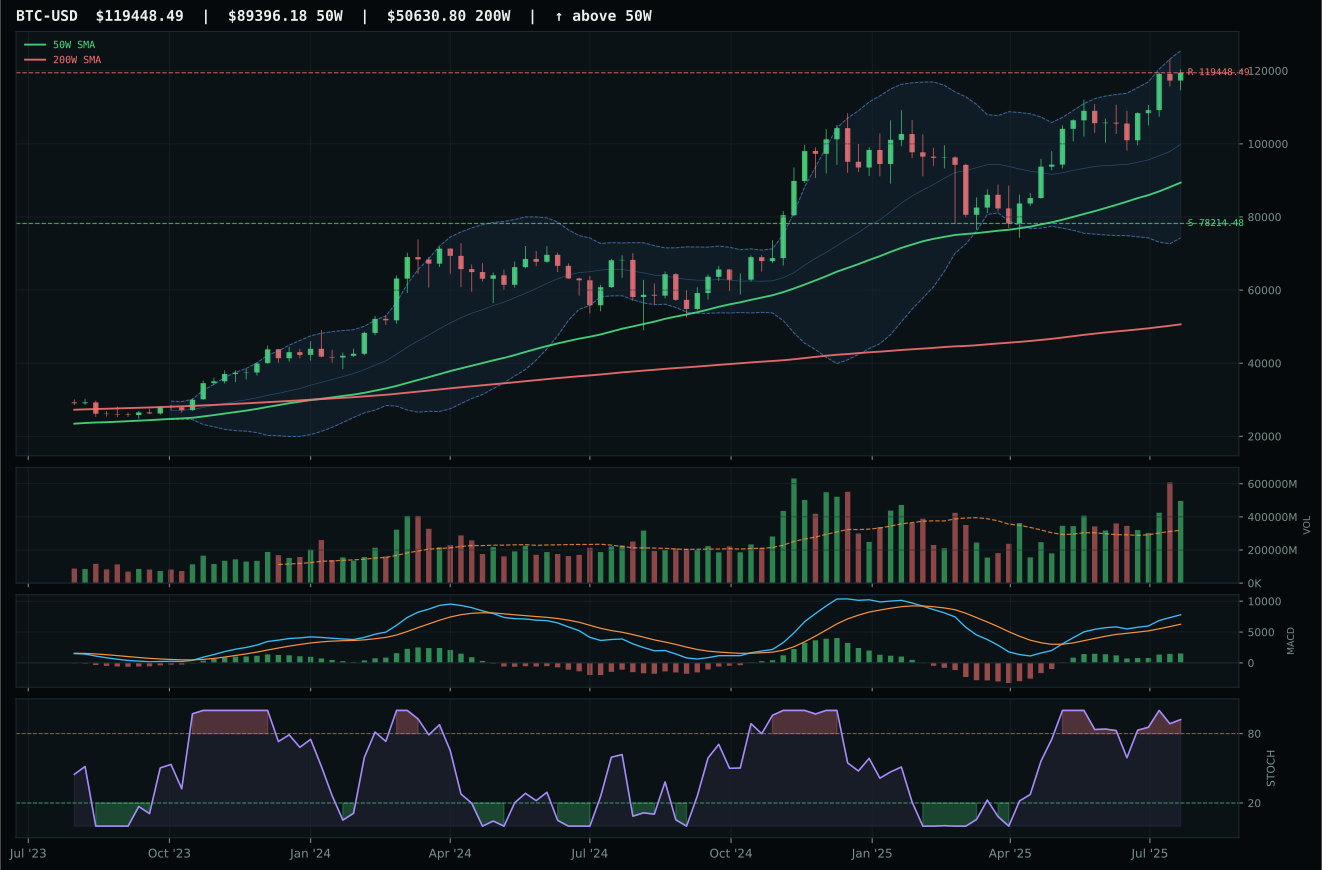
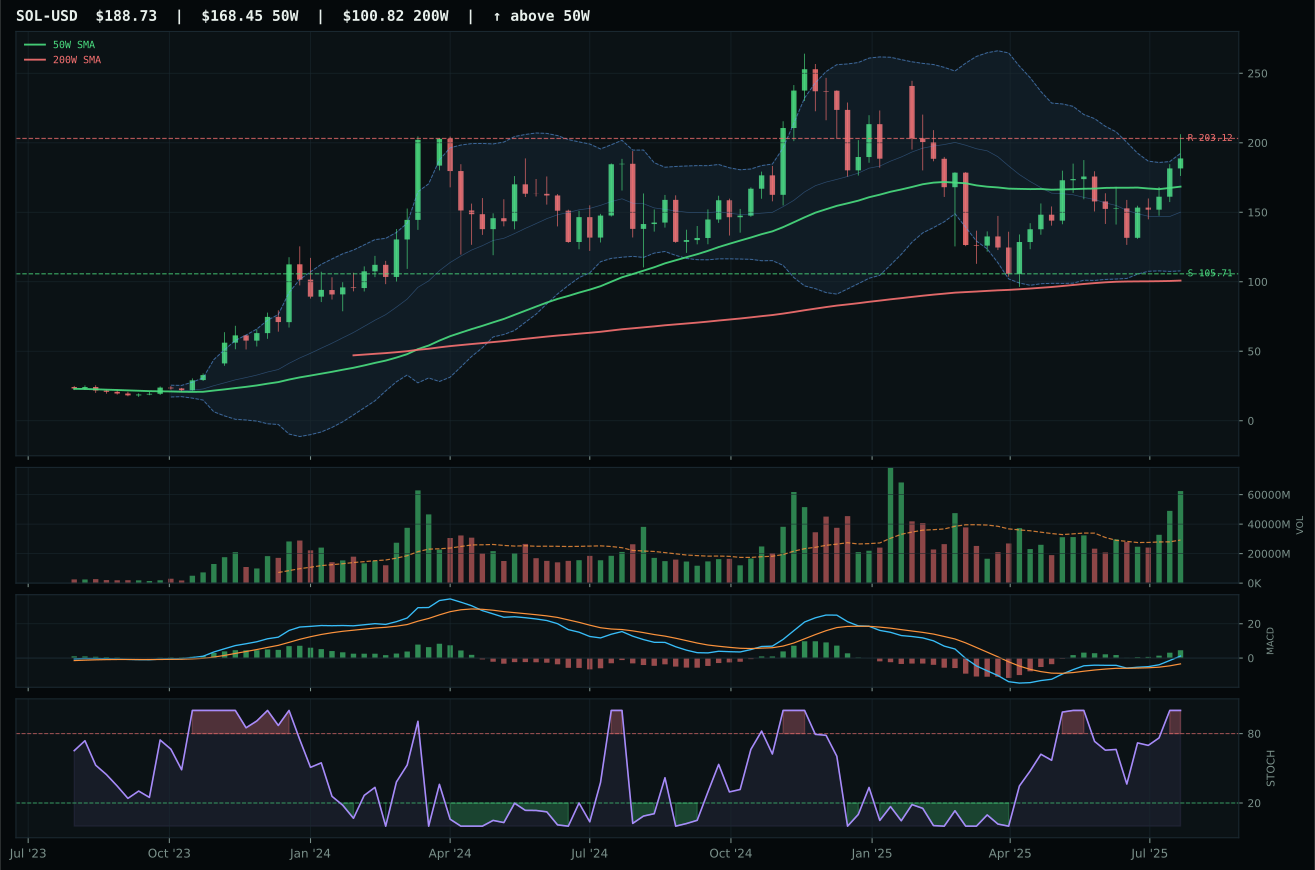
ValueBTC not armed: BTC has not made the first post-breakdown touch of the 200W buy zone after losing the 50W
TrendBTC confirmed: 2 consecutive closes above rising/flat 50W SMA
one or more available conditions failed
Category Rankings
| Rank | Category | Winner | Score | Alloc | 4W Ret | Peers (4W) |
|---|---|---|---|---|---|---|
| 1 | Industrial Metals | REMX | 75.8 | 20% | +10.79% | PICK +3.5% · COPX +8.0% |
| 2 | Nuclear Energy | NLR | 75.3 | 20% | -3.94% | URA -4.6% · URNM -1.1% |
| 3 | AI | BOTZ | 63.6 | 10% | -1.76% | SMH +1.4% · AIQ -0.1% |
| 4 | Defense & Aerospace | ITA | 61.4 | 10% | -1.87% | XAR -2.4% · ROKT +2.8% |
| 5 | Utilities & Infrastructure | PAVE | 57.1 | 10% | -0.30% | XLU +1.5% · IGF +3.2% |
| 6 | Traditional Energy | XLE | 53.3 | 10% | +0.27% | FCG -1.1% · XOP -0.8% |
| 7 | Agriculture & Livestock | MOO | 46.4 | 10% | +1.48% | VEGI -0.4% · WEAT -4.5% |
| 8 | Precious Metals | SLV | 43.9 | 10% | +1.21% | GDX +13.6% · GLD +1.1% |
| 9 | Technology | XLK | 43.6 | 0% | -0.22% | IGV -5.3% · CIBR -2.6% |
| 10 | Emerging Markets | IEMG | 23.4 | 0% | +2.60% | ILF +6.1% · INDA -0.0% |
Industrial Metals — REMX
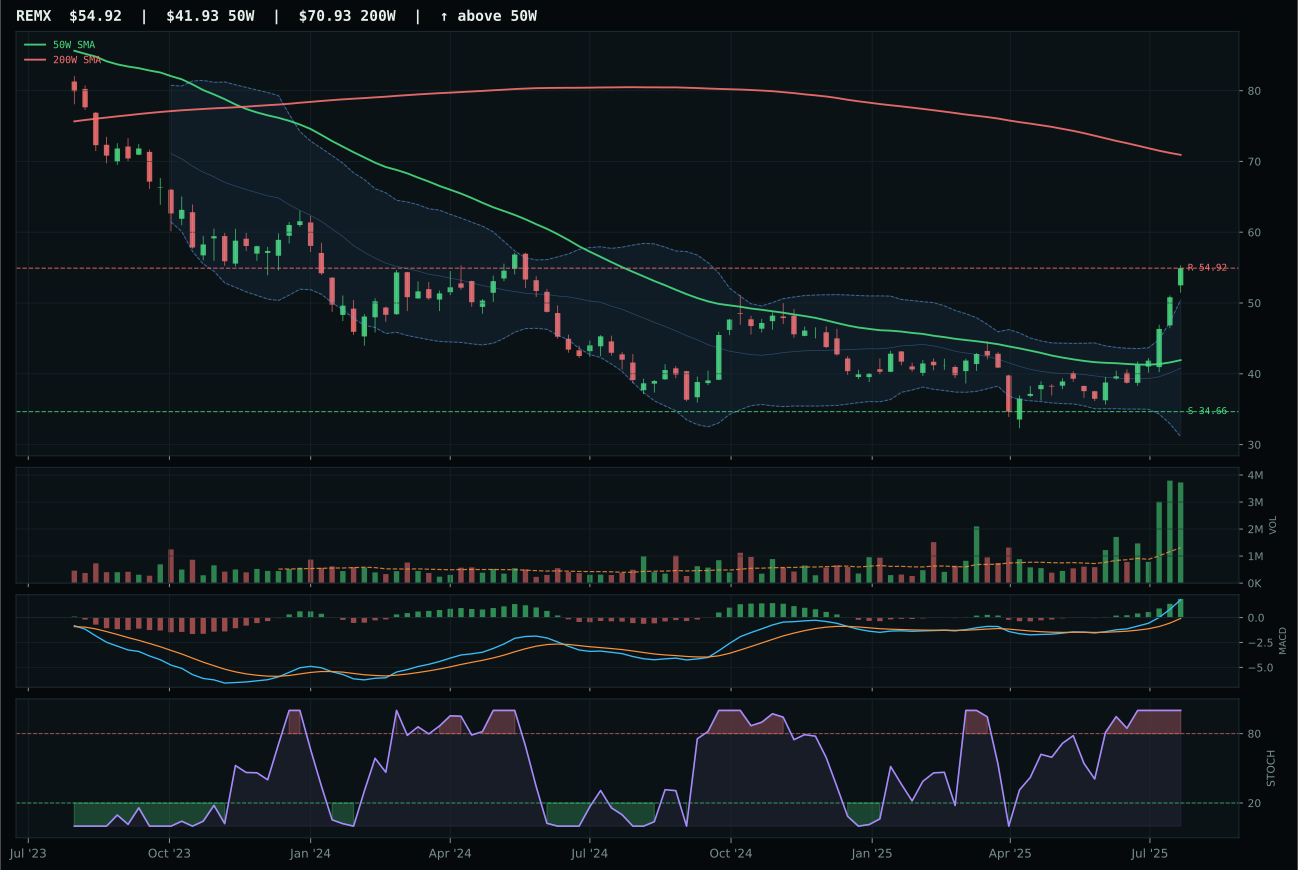
REMX has a vertical extension profile with 27.3% 13-week relative strength versus SPY.
A failed hold above support would weaken the setup.
Actionable but governed by invalidation levels.
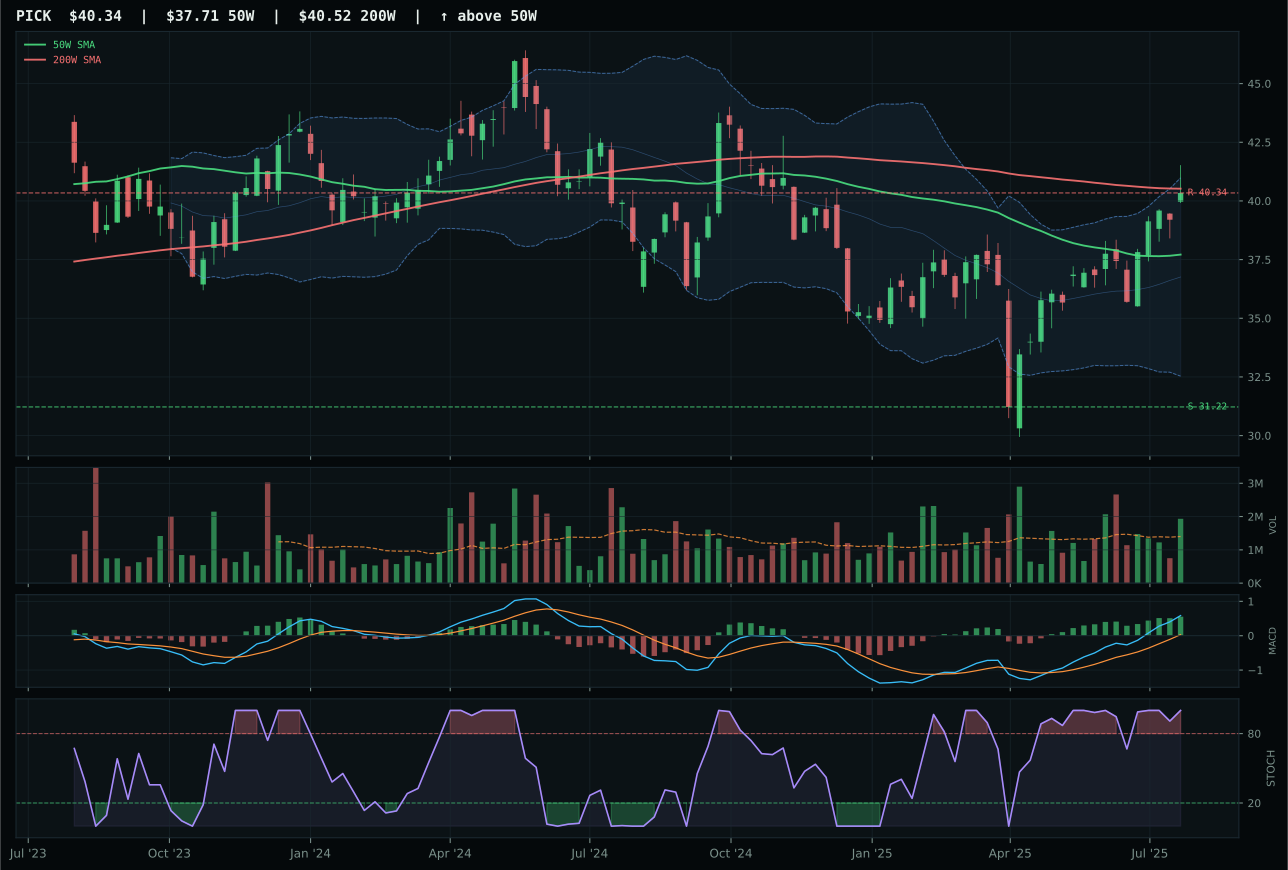
PICK has a neutral structure profile with -2.9% 13-week relative strength versus SPY.
A failed hold above support would weaken the setup.
Actionable but governed by invalidation levels.
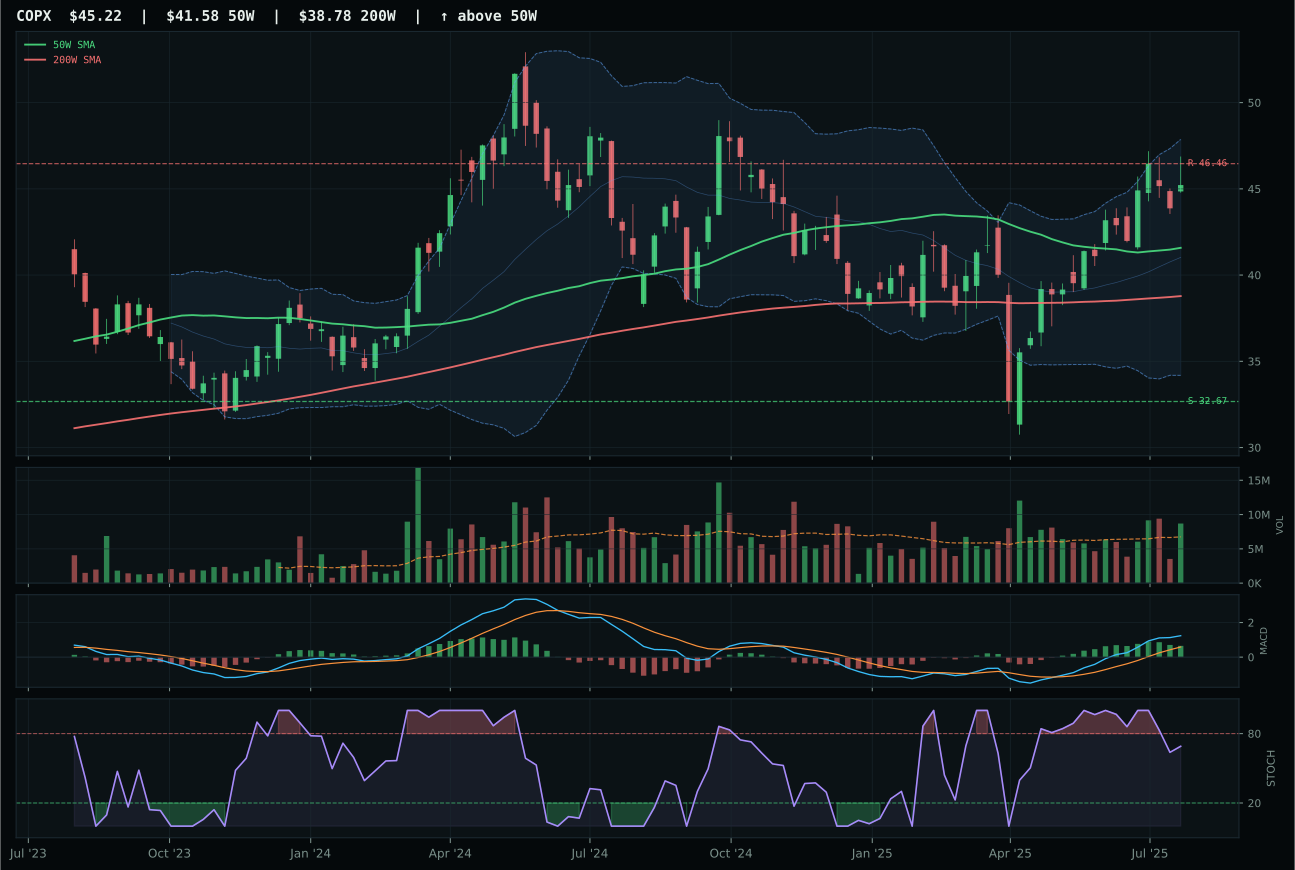
COPX has a neutral structure profile with -0.3% 13-week relative strength versus SPY.
A failed hold above support would weaken the setup.
Actionable but governed by invalidation levels.
REMX claimed the industrial-metals leadership and earned a top-2 allocation through the sheer force of technical sponsorship and macro alignment that is nearly impossible to argue against. The 43.0% 13-week return with 27.3% SPY relative strength and 27.6% category-relative strength demonstrates that rare-earth supply scarcity is being priced in by institutional capital in real time; REMX's 100.0% momentum confirmation and 99.4% volume-price confirmation show accumulation at 2.84x the 20-week average, a participation level that typically precedes meaningful moves and suggests this trade is not yet crowded relative to available liquidity. The setup sits at vertical extension 31.0% above the 50W, which creates timing risk, but the bullish-and-improving MACD combined with overbought momentum and rare-earth supply shortage as an active macro descriptor (plus-9) creates a rare technical-macro confluence where the fundamental scarcity story is being confirmed in real time by tape. PICK lost despite neutral structure and 12.8% 13-week returns because structure was less clean at 76.9 versus 84.2 and volume participation was only above-average at 1.37x versus REMX's accumulation-confirmation level; PICK is a broader mining play that spreads the conviction thinner.
Industrial Metals earned 10% as the second-highest-weighted category in the portfolio, a top-2 overweight justified by a 75.8 final score and a 67.0% macro fit that is the most durable in the current late-cycle reflation regime. The category receives plus-14 for active metals-scarcity descriptor, plus-10 for commodity-breadth-positive, plus-6 for real-asset-sponsorship, and plus-10 from late-cycle reflation—a macro profile that is structurally bulletproof against near-term equity volatility. REMX's 100.0% technical evidence in the reasoned-ETF proof layer is the highest in the entire portfolio, driven by perfect trend (90.0/100), perfect momentum confirmation (100.0/100), and persistence at 100.0/100 where all three factors (trend, relative strength, MACD volume confirmation) are aligned. The downside risk to support at 34.66 offers 58.5% protection versus 0.0% upside to resistance, but this asymmetry is acceptable because the macro supply-shortage thesis is multi-quarter durable, not a bounce-trade. Industrial metals hold their 10% allocation because rare-earth and copper supply constraints are structural facts, not cyclical fears; the technical extension risk is real but subordinate to the macro certainty of supply deficits that cannot be solved in quarterly timeframes.
Nuclear Energy — NLR
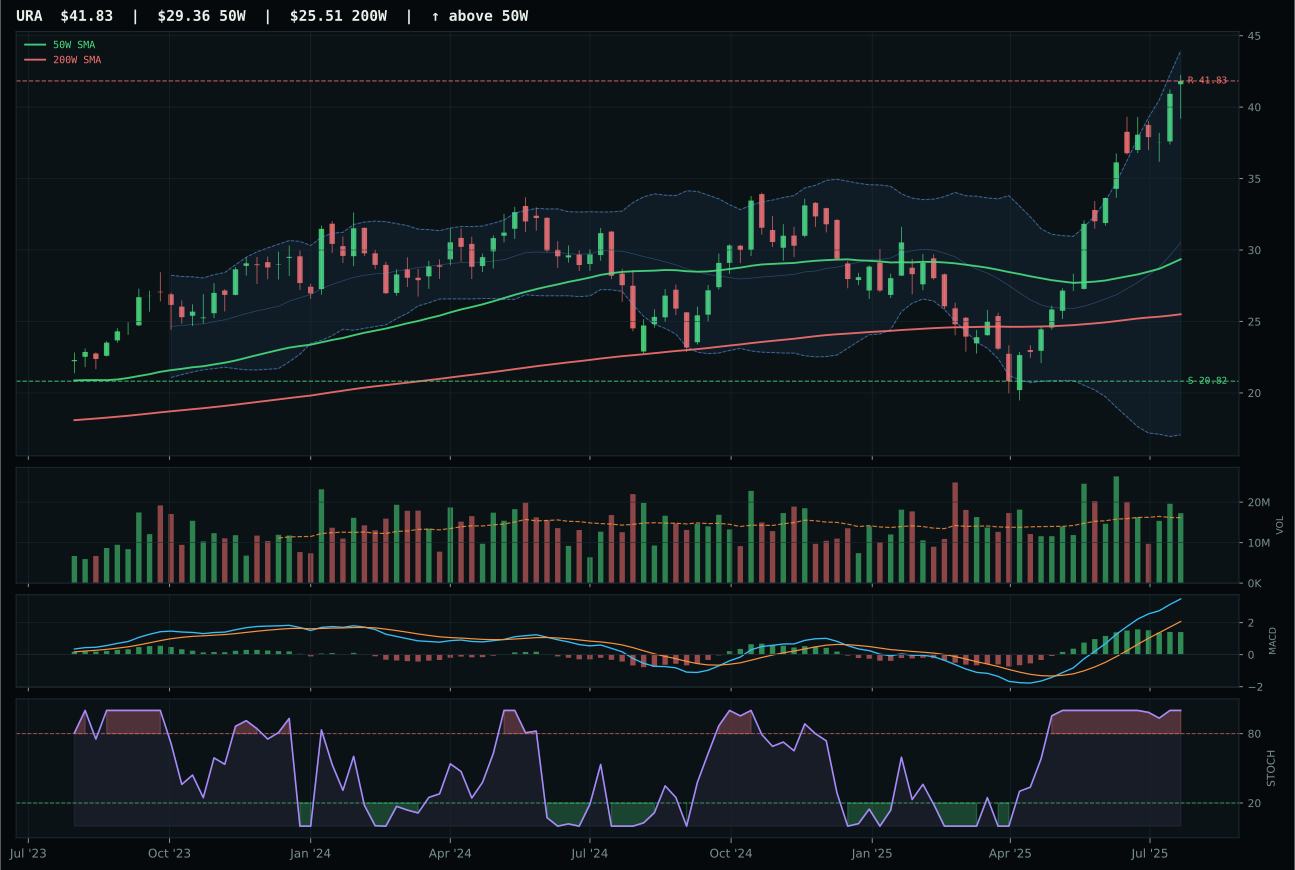
URA has a vertical extension profile with 55.4% 13-week relative strength versus SPY.
A failed hold above support would weaken the setup.
Actionable but governed by invalidation levels.
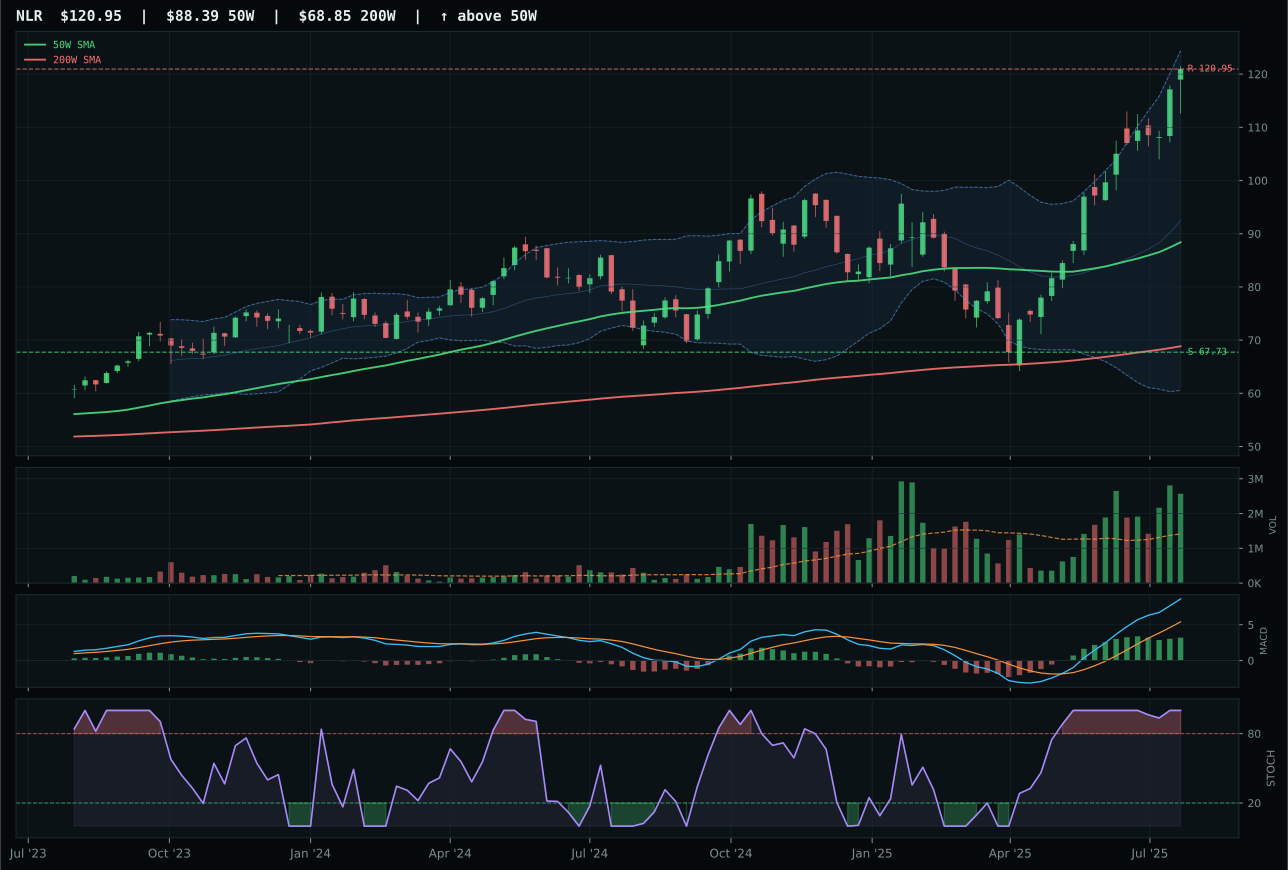
NLR has a vertical extension profile with 39.4% 13-week relative strength versus SPY.
A failed hold above support would weaken the setup.
Actionable but governed by invalidation levels.
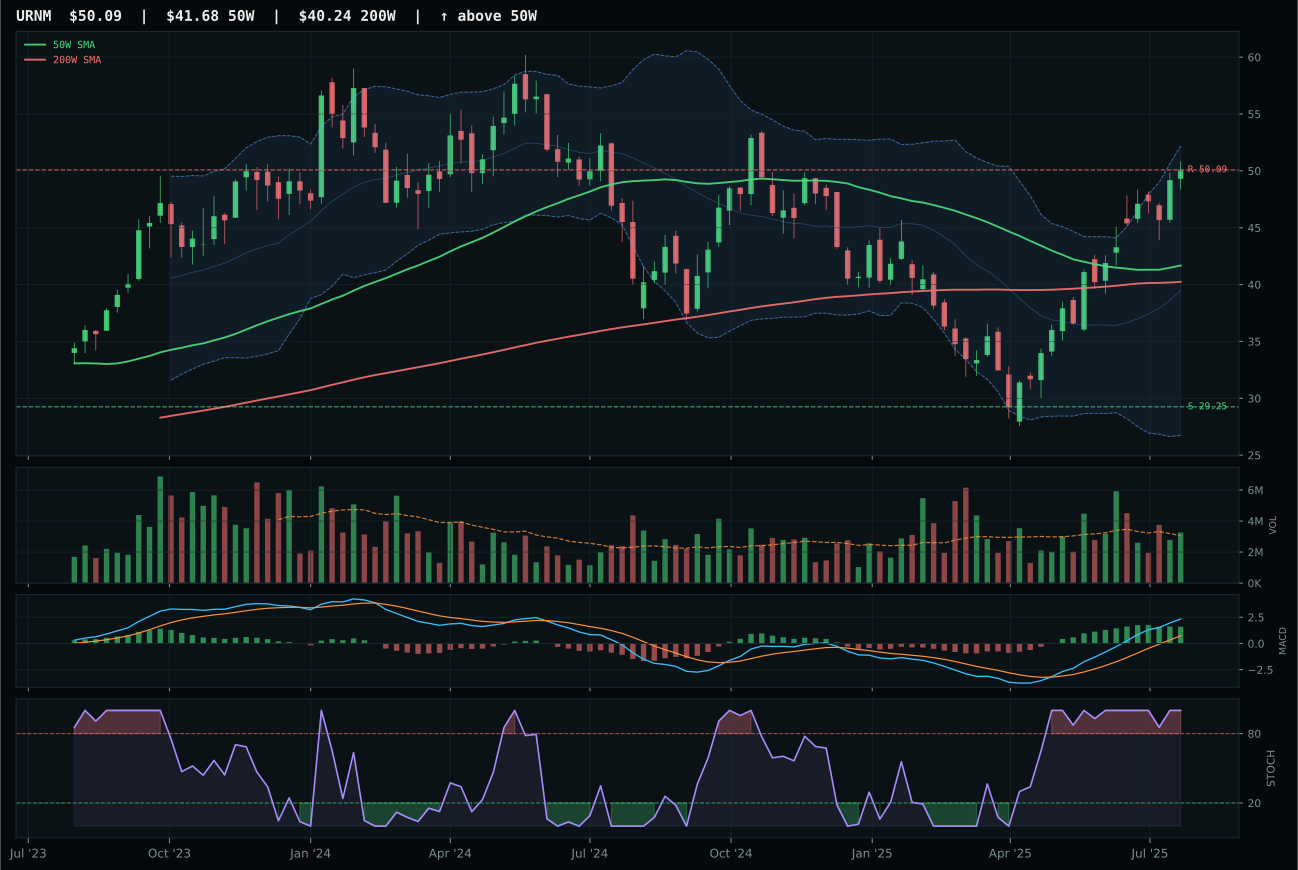
URNM has a vertical extension profile with 31.8% 13-week relative strength versus SPY.
A failed hold above support would weaken the setup.
Actionable but governed by invalidation levels.
NLR claimed the nuclear-energy leadership and earned a rare top-2 allocation through a perfect-storm confluence of technical trend, relative strength, and macro alignment that makes this the portfolio's purest thematic conviction play. The 55.1% 13-week return with 39.4% SPY relative strength is the single highest relative-strength reading in any category this week; nuclear utilities benefit from ai-driven electricity demand, energy-security mandates, and the transition narrative's sudden embrace of nuclear as baseload. NLR's 100.0% trend score, 100.0% momentum confirmation, and 91.9% volume-price confirmation combine with accumulation-confirmation volume at 1.82x the 20-week average to create a setup where every technical metric is aligned. The 36.8% extension above the 50W creates timing risk and justifies the 32.0 timing score (penalizing entry), but the bullish-but-flattening MACD with overbought momentum and zero category-relative-strength divergence indicate this is a leader that has attracted the smartest money first rather than late retail. URA lost despite 71.1% 13-week returns because structure was less clean at 79.3 versus 86.0, volume participation lagged at neutral versus accumulation, and the 42.5% extension from the 50W creates more entry risk than NLR's 36.8%.
Nuclear Energy earned 10% as the portfolio's other top-2 overweight, with a 75.3 final score that exactly mirrors industrial metals' conviction level and supported by a 64.0% macro fit that includes plus-9 for energy-scarcity, plus-7 for late-cycle reflation, plus-7 for real-asset-sponsorship, and plus-5 for ai-growth-sponsorship. NLR's 85.6% technical evidence and 54.0% macro fit combine to justify top-2 allocation despite the category being more speculative than defensives like defense or infrastructure; the thesis is that ai-driven electricity demand combined with geopolitical energy independence fears will force governments and utilities to embrace nuclear as the only viable baseload option that avoids climate risk. The downside risk to support at 67.73 offers 78.6% protection, which is the highest in the portfolio, and that risk asymmetry justifies the 10% allocation despite the vertical-extension timing risk. Nuclear energy holds its top-2 slot because the macro setup is durable (energy scarcity will not resolve in quarters), and the technical sponsorship at 100.0% momentum is the cleanest accumulation signal among all ten categories. The category would face pressure if either equity risk-off accelerates and forces systematic deleveraging of speculative thematic plays, or if uranium supply suddenly eases and removes the scarcity premium from the narrative.
AI — BOTZ
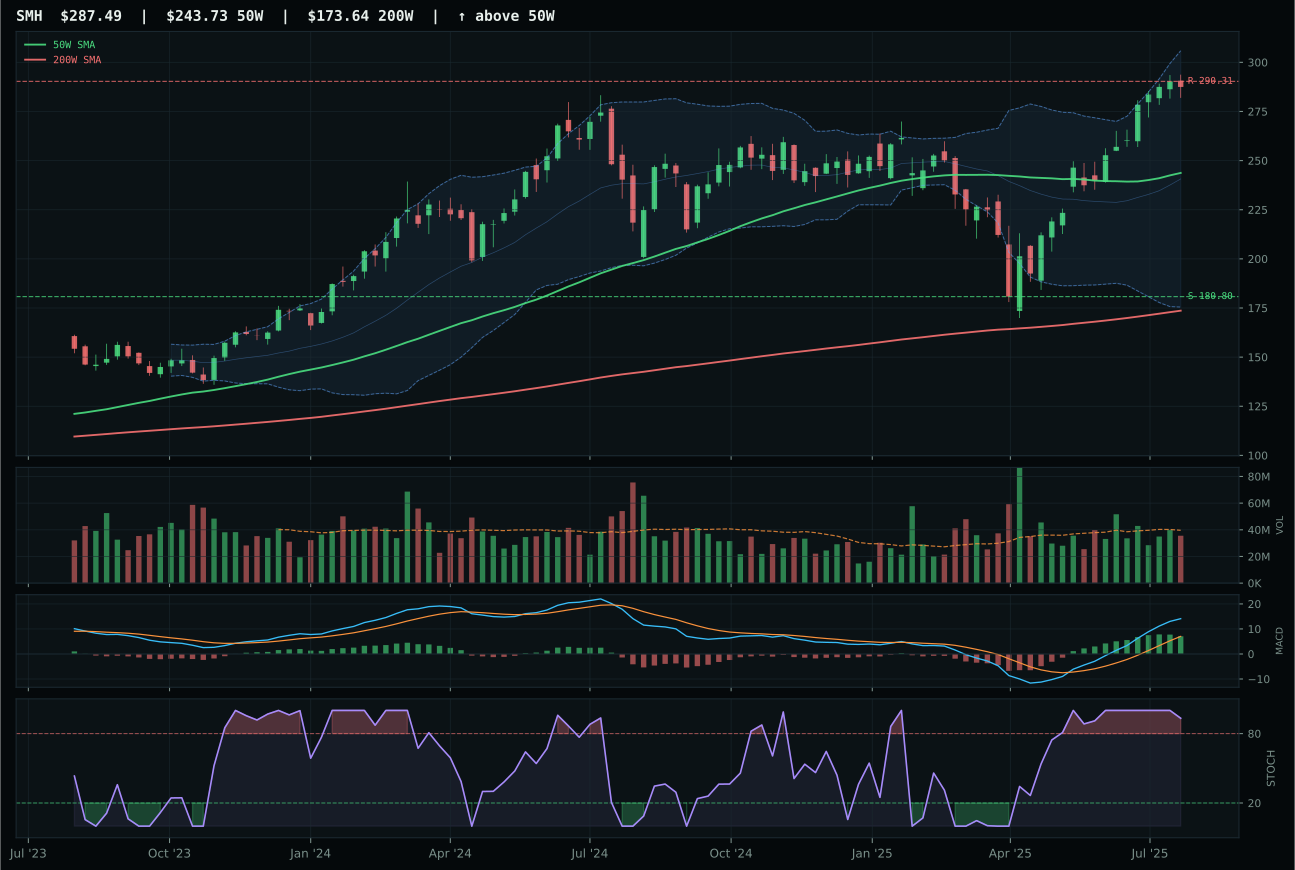
SMH has a vertical extension profile with 19.9% 13-week relative strength versus SPY.
A failed hold above support would weaken the setup.
Actionable but governed by invalidation levels.
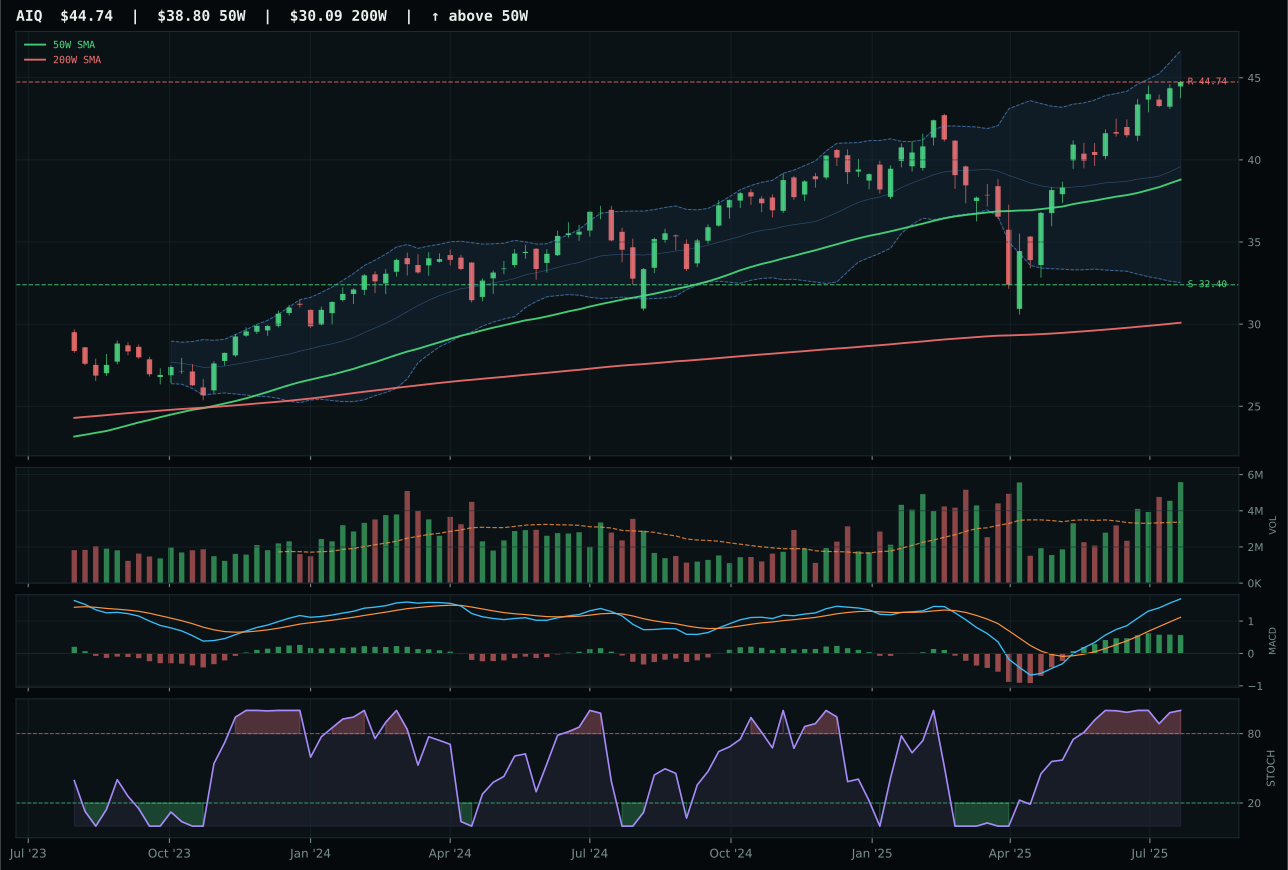
AIQ has a vertical extension profile with 6.0% 13-week relative strength versus SPY.
A failed hold above support would weaken the setup.
Actionable but governed by invalidation levels.
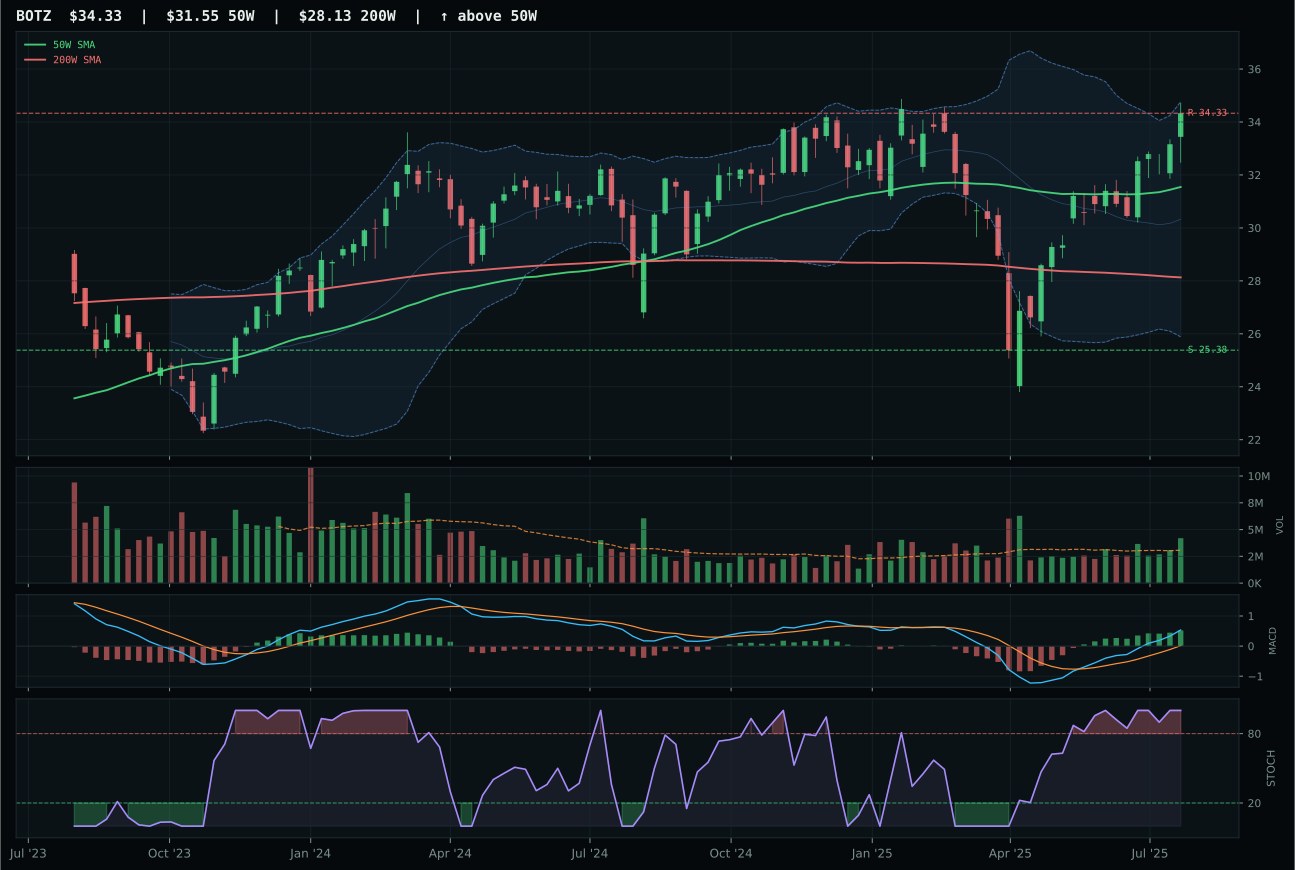
BOTZ has a neutral structure profile with 4.4% 13-week relative strength versus SPY.
A failed hold above support would weaken the setup.
Actionable but governed by invalidation levels.
BOTZ claimed the AI leadership by defending a cleaner entry structure and superior timing mechanics relative to the stretched compute-plays that dominate category returns. The robotics and physical-automation angle produced a 4.4% SPY relative-strength advantage with neutral volume at 1.36x the 20-week average—institutional participation without the vacuum-like accumulation that precedes rollover. BOTZ's timing score of 75 towers over SMH's 27 because the hardware exposure sits only 8.8% from its 50W and occupies the neutral-structure zone near Fib 0.236 rather than vertical extension; MACD is bullish and improving, stochastic RSI sits at overbought momentum, and the 13W return of 20.1% trails the semiconductors' 35.6% because this ETF is capturing the broad robotics thesis without the concentration risk. SMH lost ground on positioning alone: it is 18% extended above the 50W in full vertical extension with stochastic RSI rolling over and volume at neutral participation, creating a setup where every new buyer is late and downside to support at 180.80 offers 46.5% of risk per percentage of potential upside.
AI received 5% allocation this week as a tier-2 holding despite a final score of 63.6 that ranks it solidly among the nine eligible categories. The category's 44.0% macro fit explains the ranking gap: risk-off deterioration applies a minus-10 penalty, and even though ai growth sponsorship is active at plus-14 and risk appetite positive adds plus-10, the twin drains of liquidity stress at minus-12 and credit stress at minus-8 leave this category structurally undersupported in the current regime. BOTZ's 99.1% momentum confirmation and 79.4% volume-price confirmation demonstrate that the move has real sponsorship, but that sponsorship is accumulation within a defensive pivot rather than organic growth demand. The category holds its 5% slot because technical evidence at 86.8% for the representative ETF justifies a satellite position in an environment where energy scarcity and metals depletion are the macro tailwinds. For AI to reclaim top-2 weight, risk appetite would need to shift positive in the regime layer—moving from risk-off deterioration to risk-on recovery—which would instantly unlock the full 14-point ai growth sponsorship amplifier and compress the liquidity/credit penalties.
Defense & Aerospace — ITA
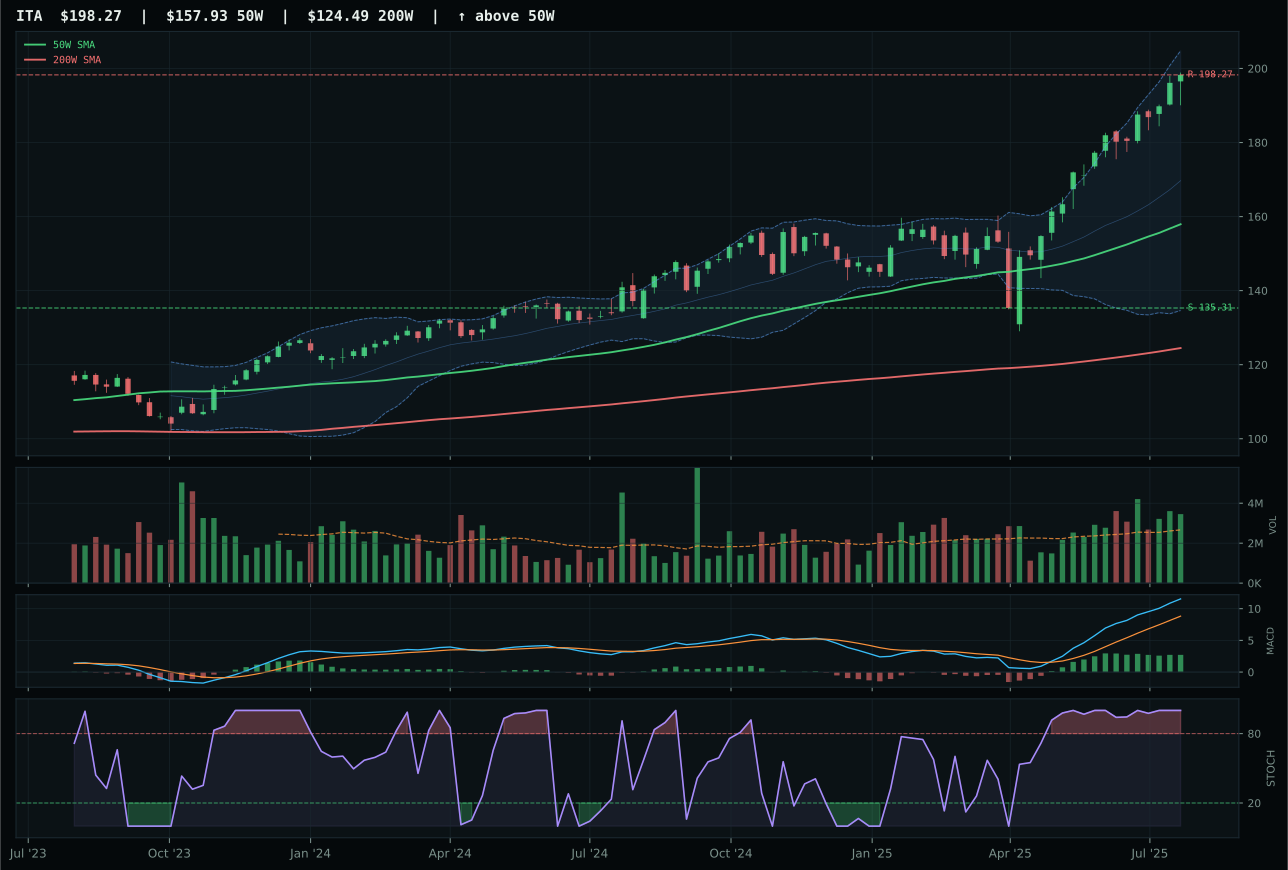
ITA has a vertical extension profile with 12.4% 13-week relative strength versus SPY.
A failed hold above support would weaken the setup.
Actionable but governed by invalidation levels.
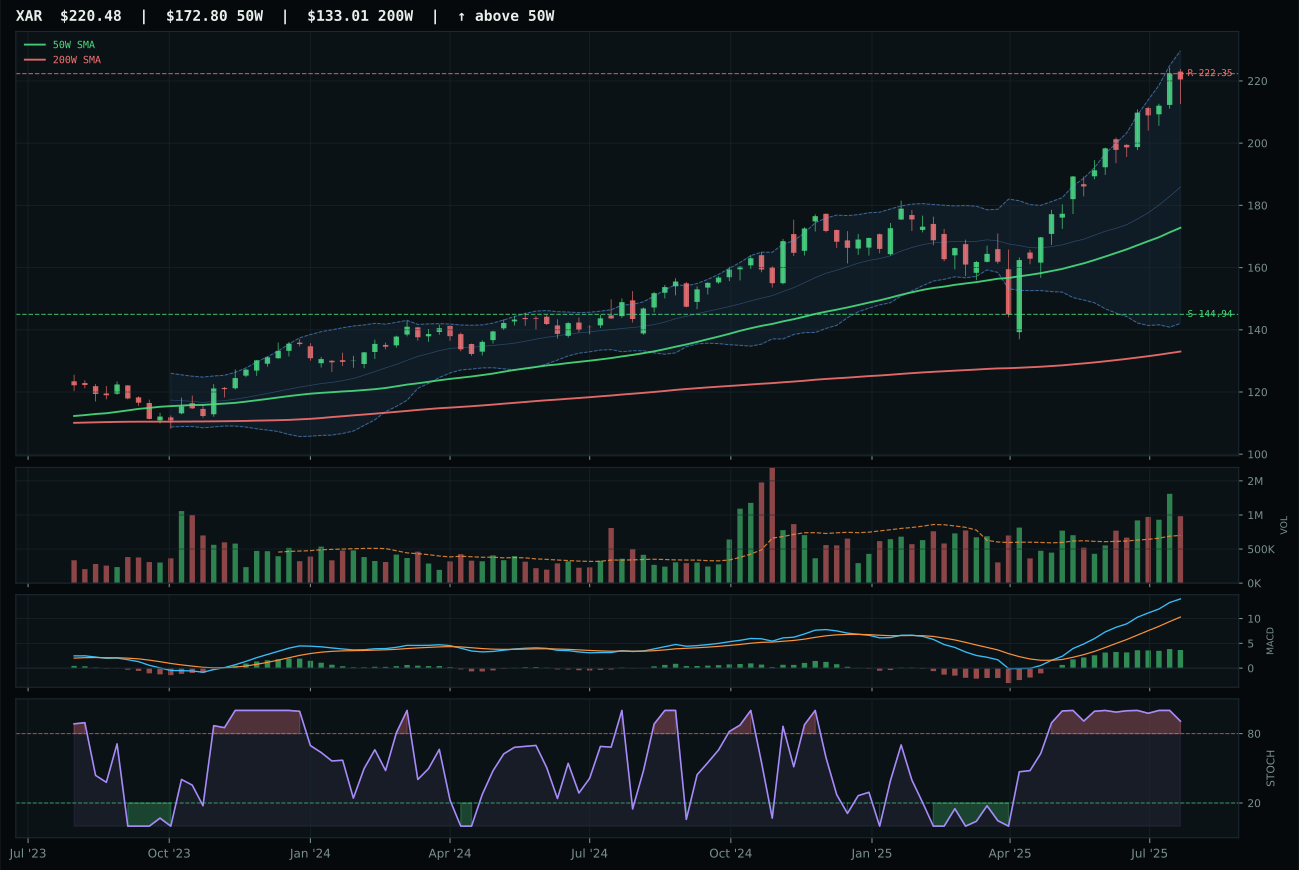
XAR has a vertical extension profile with 14.2% 13-week relative strength versus SPY.
A failed hold above support would weaken the setup.
Actionable but governed by invalidation levels.
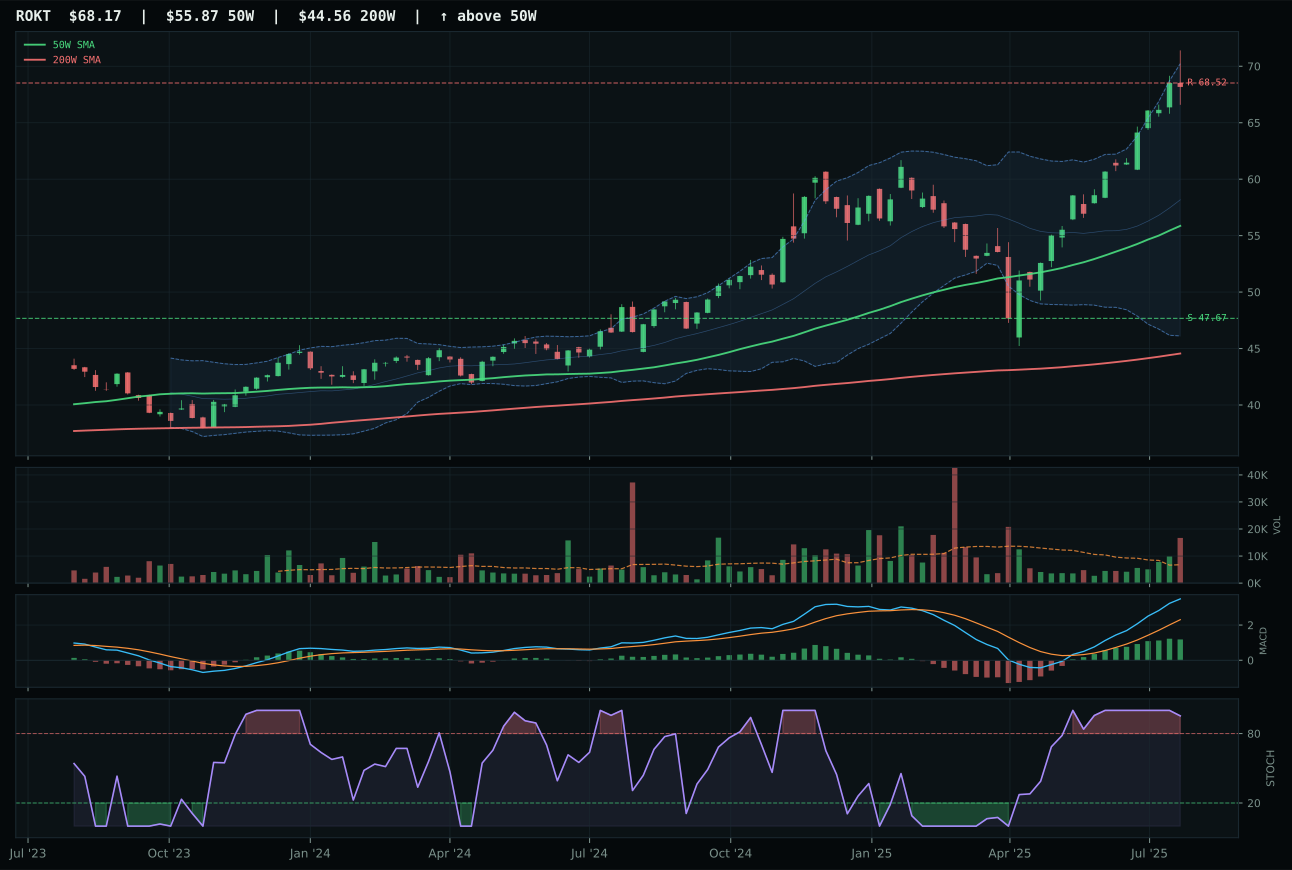
ROKT has a vertical extension profile with 13.9% 13-week relative strength versus SPY.
A failed hold above support would weaken the setup.
Tracked, but not top-2 eligible because: .
ITA edged out XAR in the tightest category decision of the week—a margin of just 0.4 points—by assembling perfect trend mechanics with the least-deteriorated momentum structure in a category where both finalists are vertically extended and fighting entry risk. The 12.4% SPY relative strength and 28.1% 13-week return signal genuine durability demand for defense primes, and ITA's bullish-but-flattening MACD still outperforms XAR's comparison because volume confirmation at 1.30x the 20-week average maintains enough institutional accumulation to prevent rollover. Where ITA won the tiebreaker was timing: at 32.0 versus XAR's 27.0, the slightly shallower distance from the 50W (25.5% versus XAR's 26.3% implied by support/resistance topology) paired with flattening rather than improving MACD reflects an ETF that has already attracted the smart buyers and is now in the messy consolidation phase rather than fresh entry. Both trades occupy the same vertical-extension, overbought-momentum, above-average-volume setup, but ITA's entry risk feels marginally less acute.
Defense & Aerospace secured 5% as a tier-2 category with a final score of 61.4, benefiting from a 61.0% macro fit that is unusually constructive for a risk-off regime. Risk-off deterioration typically hurts cyclicals, but the plus-7 from risk-off deterioration itself and plus-6 from active late-cycle reflation signals create a unique tailwind for defense spending and military supply-chain durability that transcends the broader equity selloff. ITA's 68.4% technical evidence combines perfectly timed entry mechanics (32.0 timing score) with perfect trend (100.0 on above-50W, above-200W, and 0.7% 50W slope) to produce a category that is genuinely countercyclical to the equity recession fears embedded in the regime. At 5%, this category holds its slot because defense budgets continue despite recession risk, and the supply-constrained nature of aerospace/defense manufacturing aligns with the active supply-shortage and late-cycle reflation descriptors. To climb to top-2, the category would need either stronger relative strength (currently negative at minus-1.5% versus the category median) or a major shift in credit spreads—the plus-2 on credit stress is only barely positive, and if that reverses to active credit stress, this category's countercyclical advantage collapses.
Utilities & Infrastructure — PAVE
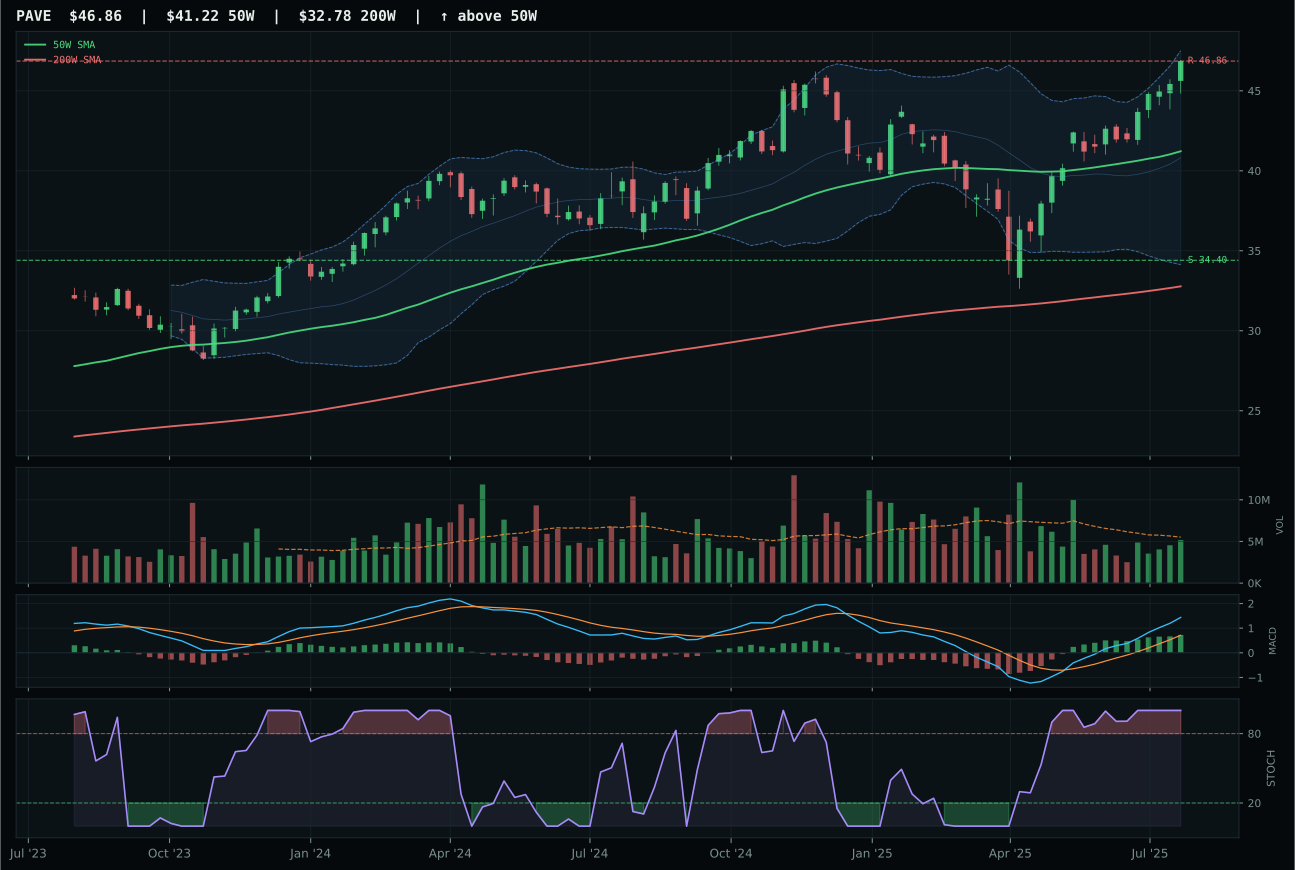
PAVE has a neutral structure profile with 7.8% 13-week relative strength versus SPY.
A failed hold above support would weaken the setup.
Actionable but governed by invalidation levels.
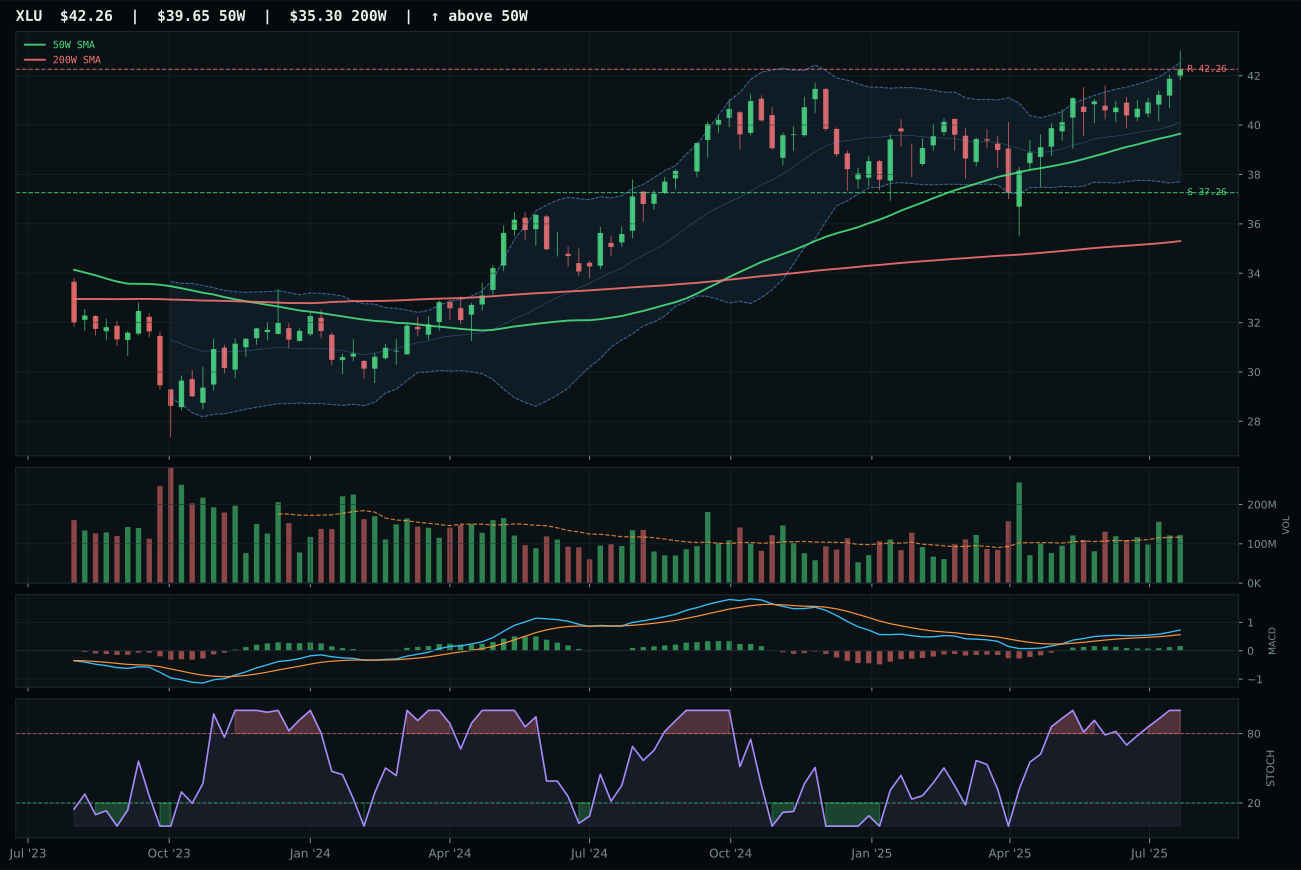
XLU has a neutral structure profile with -7.6% 13-week relative strength versus SPY.
A failed hold above support would weaken the setup.
Actionable but governed by invalidation levels.
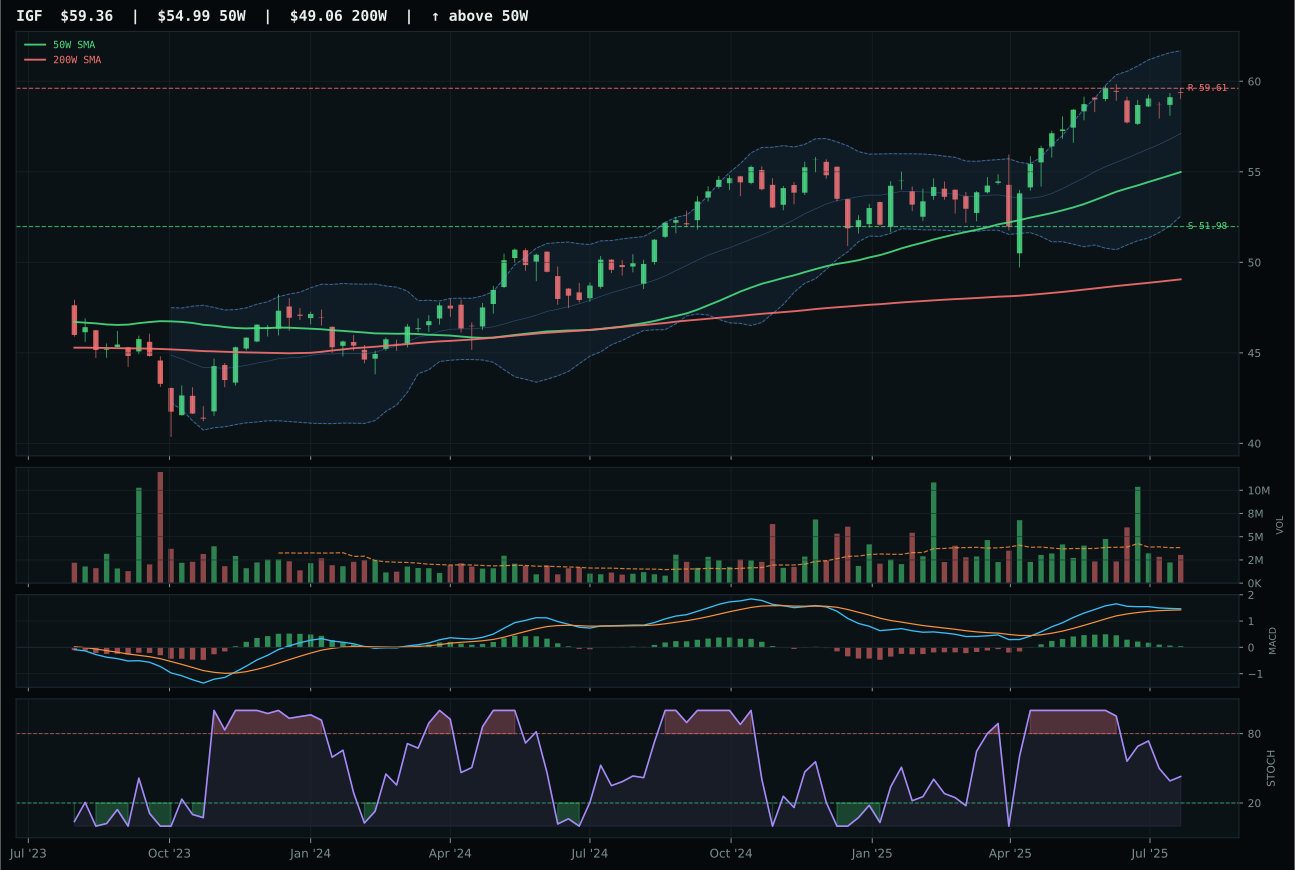
IGF has a neutral structure profile with -10.3% 13-week relative strength versus SPY.
A failed hold above support would weaken the setup.
Actionable but governed by invalidation levels.
PAVE claimed utilities-and-infrastructure leadership by pairing the strongest relative-strength advantage in the category with perfect trend mechanics and momentum confirmation that left XLU no viable path to victory. The 23.5% 13-week return with 7.8% SPY relative strength and 15.4% category-relative strength demonstrates that domestic-infrastructure capex bets are outpacing regulated-utility dividend plays in the current regime; PAVE's infrastructure angle captures the ai-datacenter buildout, 5G infrastructure refresh, and post-stimulus capex cycles that are genuinely growth-oriented rather than purely defensive. PAVE's 100.0% trend score, 100.0% momentum confirmation, and 88.1% volume-price confirmation combine with neutral volume at 0.94x the 20-week average to create a setup that is mechanically clean: price above both the 50W and 200W with bullish-improving MACD and overbought momentum sitting in the near-52W-high zone. XLU lost because structure was less clean (80.1 versus 81.8), category-relative strength lagged dramatically (0.0% versus 15.4%), and the defensive utility thesis cannot compete with the infrastructure growth narrative in a late-cycle regime.
Utilities and Infrastructure earned 5% as a tier-2 category with a final score of 57.1, held as a satellite position because PAVE's 91.6% technical evidence demonstrates that infrastructure capex demand is real and measurable even though the macro fit at 47.0% is pedestrian. The category's 47.0% macro fit includes plus-8 from risk-off deterioration (because infrastructure is quasi-defensive and benefits from safety rotation) and plus-4 from commodity-breadth-positive and risk-appetite-positive each, but those tailwinds are offset by minus-6 for inflation pressure and minus-5 for credit stress, leaving the category in neutral territory. PAVE holds the 5% slot because infrastructure spending is countercyclical to equity volatility—governments and corporations continue capex in recessions—and the 13.7% extension from the 50W is manageable compared to the 25-35% extensions dominating other categories. The 41.0% risk/reward (0.0% upside to resistance, 36.2% downside to support) indicates this is a defensive wealth-preservation position rather than a return generator. For utilities to climb to top-2, the category would need either confirmation that inflation-pressure and credit-stress descriptors are moderating (which would improve the 47.0% macro fit), or evidence that 5G/datacenter capex is accelerating faster than consensus, which would strengthen the growth narrative. At 5%, this category represents a bet that infrastructure spending persists even if equity markets reset lower.
Traditional Energy — XLE
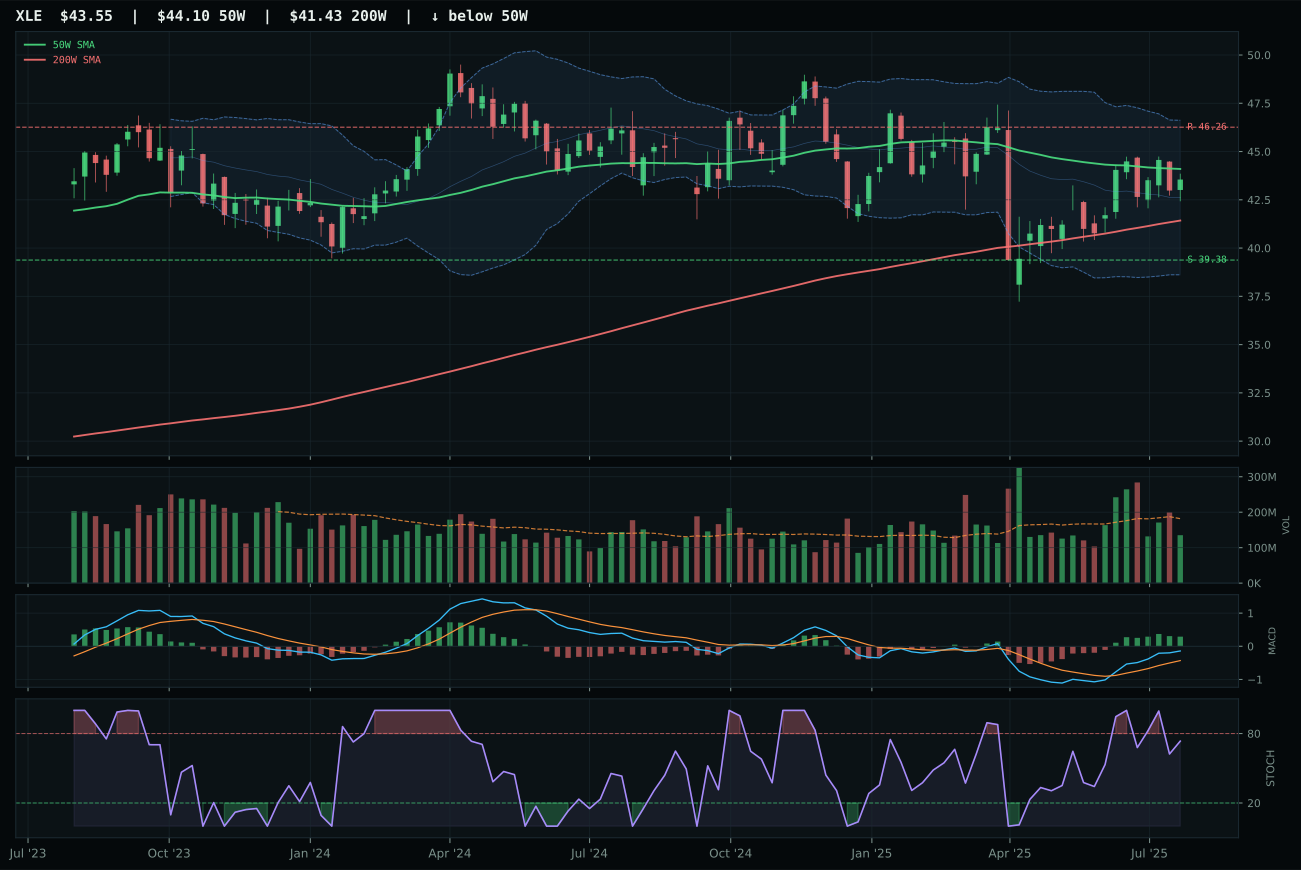
XLE has a compression near 50W profile with -10.0% 13-week relative strength versus SPY.
A failed hold above support would weaken the setup.
Actionable but governed by invalidation levels.
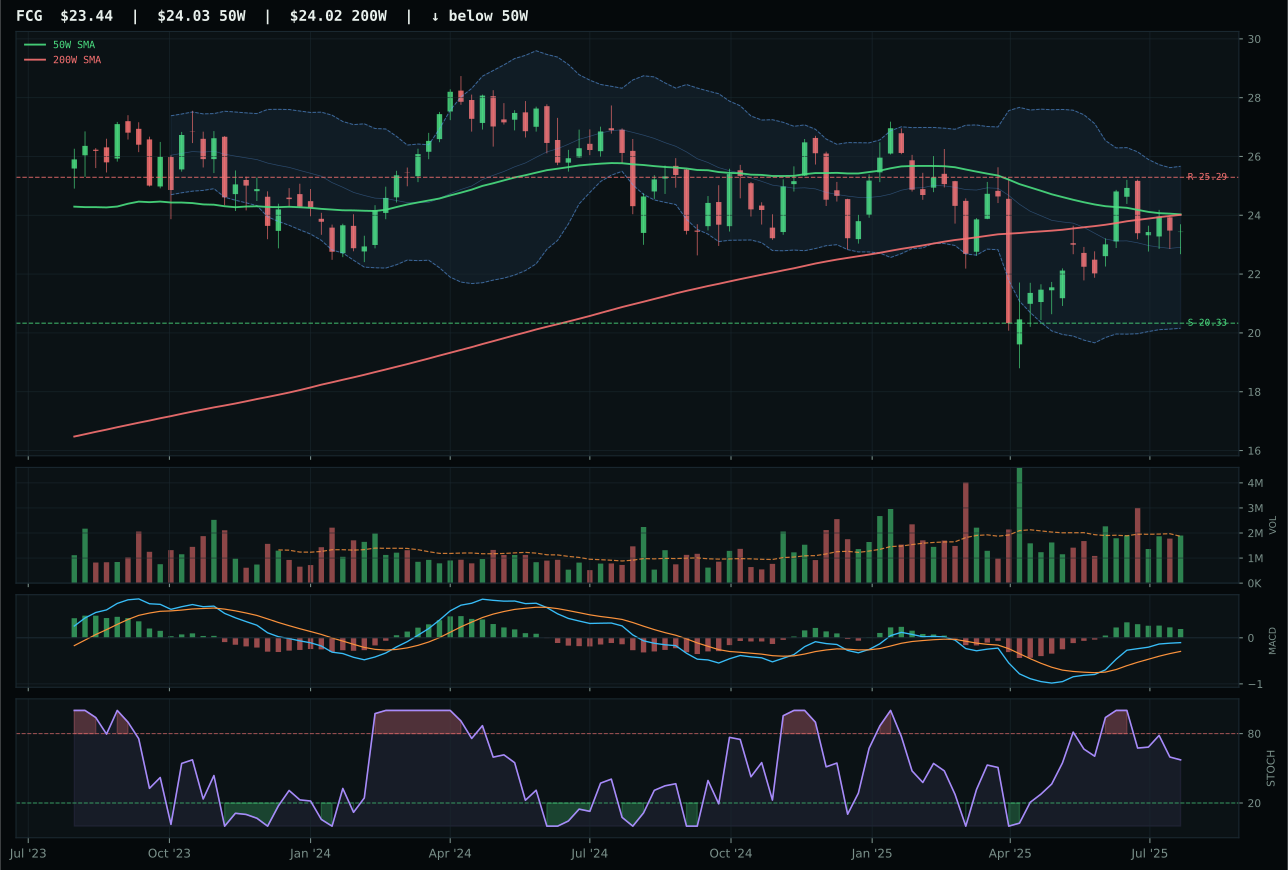
FCG has a compression near 50W profile with -6.5% 13-week relative strength versus SPY.
A failed hold above support would weaken the setup.
Actionable but governed by invalidation levels.
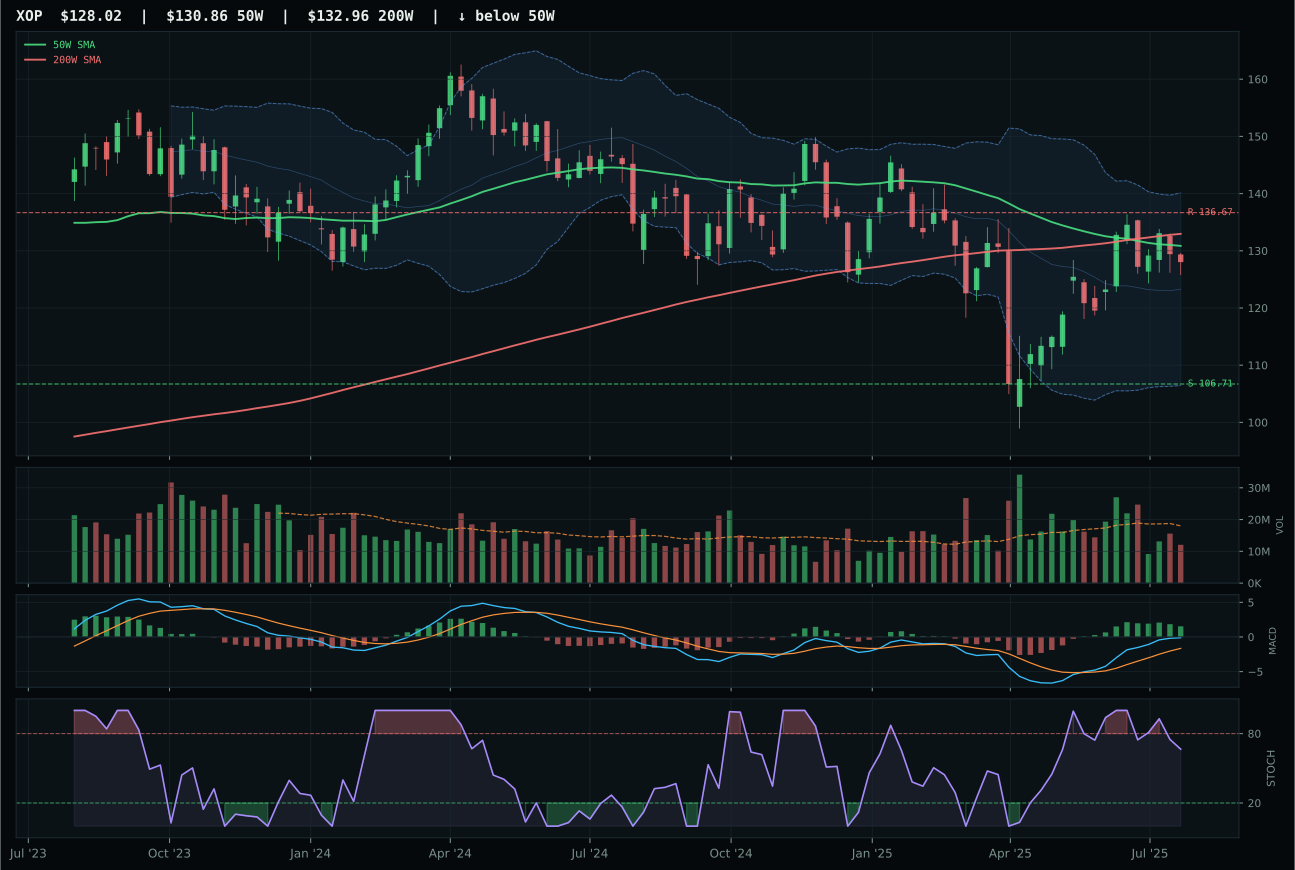
XOP has a compression near 50W profile with -2.8% 13-week relative strength versus SPY.
Extension and support failure are the main tactical risks.
Tracked, but not top-2 eligible because: structurally broken.
XLE won the traditional-energy category by defending the most constructive timing setup in a compressed-entry environment where both finalists occupy compression near the 50W and both display bullish-improving MACD. The energy-scarcity macro descriptor at plus-16 and supply-shortage at plus-9 dominate category thinking, and XLE's 100.0% timing score reflects the fact that price sits just negative 1.1% from the 50W with MACD bullish and improving and stochastic RSI falling-neutral—a classic coil setup where consolidation is nearing breakout. XLE's 5.7% 13-week return lags SPY by 10.0%, which initially appears weak, but thin volume at 0.74x the 20-week average creates exactly the low-participation environment where institutional accumulation precedes breakouts. FCG lost to XLE on timing (95.0 versus 100.0) because MACD is bullish but flattening rather than improving, and structure is marginally less clean at 72.7 versus 74.5; both ETFs sit in middle-retracement zones, but XLE's MACD confirmation edge tips the scale in a tie.
Traditional Energy earned 5% as a tier-2 category with a final score of 53.3, sustained entirely by the 80.0% macro fit that includes energy-scarcity at plus-16, inflation-pressure at plus-10, supply-shortage at plus-9, and late-cycle reflation at plus-12. XLE's 57.5% technical evidence is adequate but underwhelming—trend at 50.0 reflects price below the 50W, and momentum confirmation at 43.8% indicates weak conviction and thin volume participation. The allocation decision reflects a pure macro play: geopolitical oil supply disruptions, OPEC production caps, and transition-driven refinery constraints are structural facts that make 5% defensible despite poor momentum. The risk/reward of 55.0 upside versus 10.6% downside to support (39.38) is acceptable for a defensive position, and the compression-near-50W timing setup suggests limited downside if buyers do not defend the level. Energy would reclaim top-2 if either crude prices spike above $100 on new geopolitical conflict, or if refineries begin rationing that pushes crack spreads higher and validates the energy-scarcity narrative at a more aggressive price level. At current levels, 5% represents a hedged conviction that traditional energy will outperform equity indices in late-cycle reflation scenarios while acknowledging that momentum remains weak.
Agriculture & Livestock — MOO
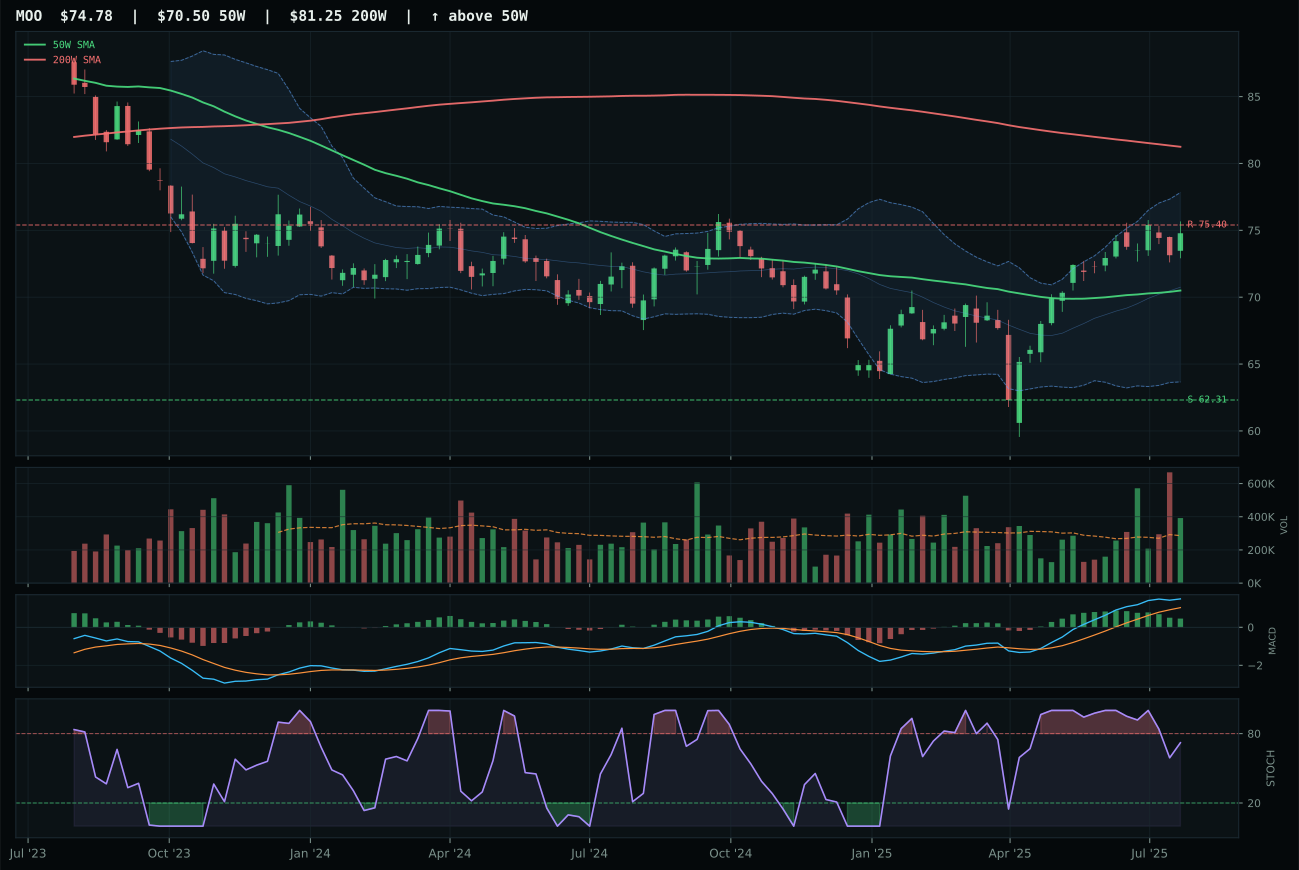
MOO has a neutral structure profile with -5.7% 13-week relative strength versus SPY.
A failed hold above support would weaken the setup.
Actionable but governed by invalidation levels.
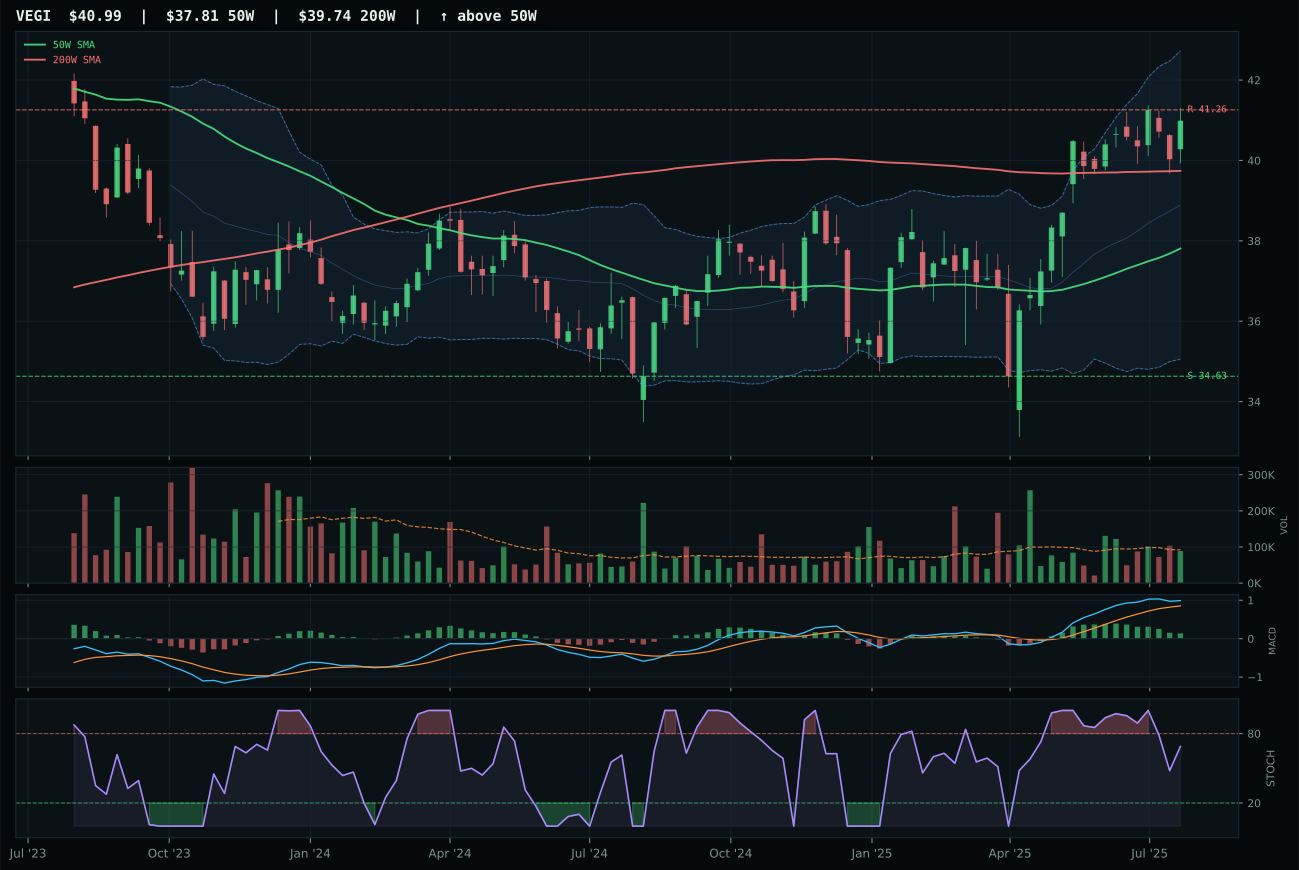
VEGI has a neutral structure profile with -5.6% 13-week relative strength versus SPY.
A failed hold above support would weaken the setup.
Tracked, but not top-2 eligible because: .
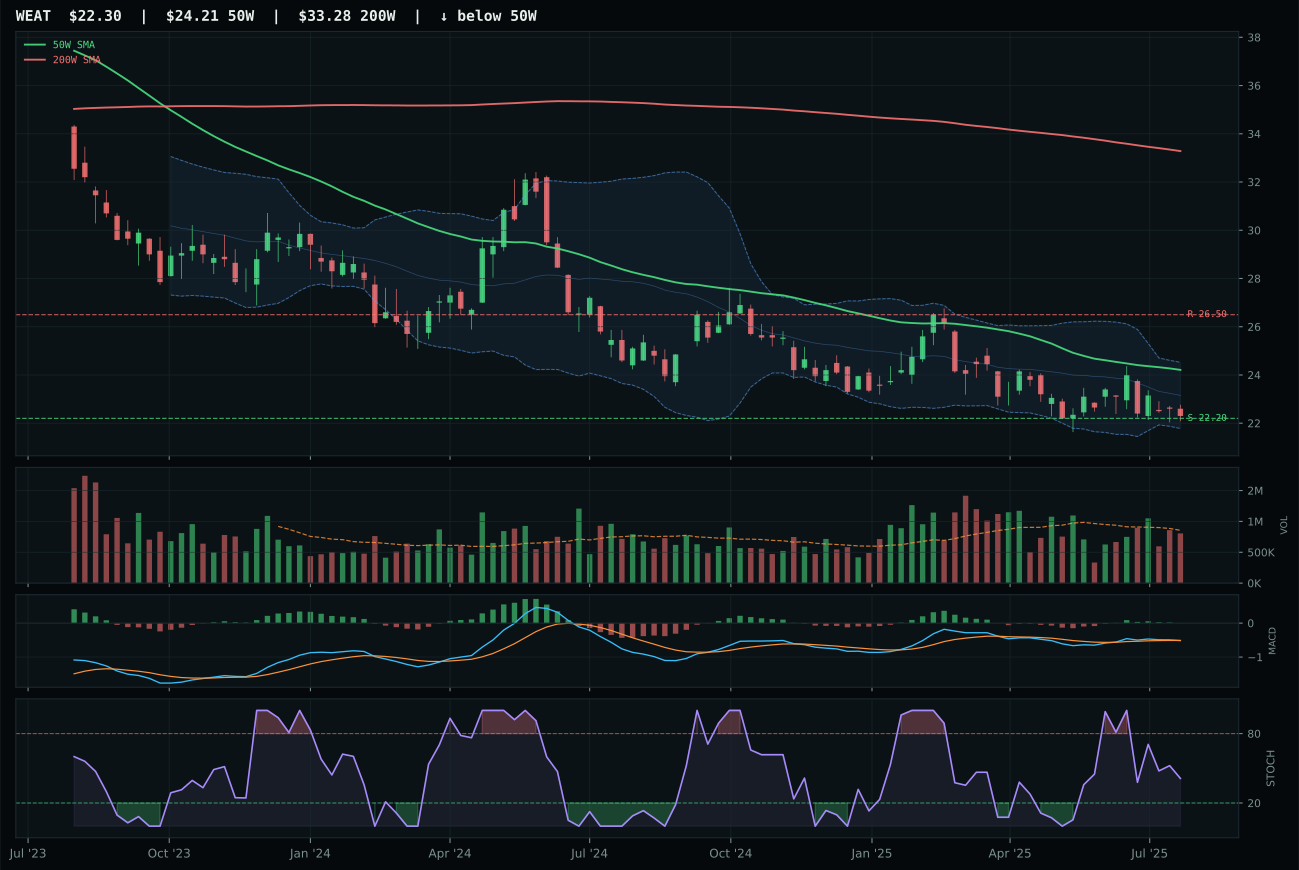
WEAT has a pullback into support profile with -19.6% 13-week relative strength versus SPY.
Extension and support failure are the main tactical risks.
Tracked, but not top-2 eligible because: structurally broken.
MOO narrowly escaped the second-tier trap by assembling the strongest category macro support and the cleanest breadth advantage within its three-ETF peer set, despite weaker technical structure than VEGI on the surface. The supply-shortage descriptor at plus-13, inflation-pressure active signal at plus-10, and real-asset-sponsorship at plus-8 create a macro profile that is genuinely orthogonal to risk-off deterioration; MOO captured that macro opportunity with a 66.7 reasoned ETF proof score that trails VEGI's 45.0 because its category-relative strength sits at 0.0% while maintaining above-average volume participation at 1.37x the 20-week average. The 10.0% 13-week return is modest and underperforming SPY by 5.7%, but the bullish-but-flattening MACD with falling-neutral stochastic RSI indicates this is a compressed setup where buyers have been disciplined rather than frantic. VEGI lost to MOO because structure was less clean at 73.1 versus 78.5 and volume confirmation lagged at neutral versus above-average participation; even though VEGI's macro fit at 66.0% is respectable, MOO's superior technical sponsorship and cleaner compression near the 50W carries the tiebreaker.
Agriculture earned 5% allocation despite a surprisingly low final score of 46.4, which paradoxically reveals the outsized power of macro alignment in the current regime. The category's 90.0% macro fit is the second-highest among all ten categories—trailing only precious metals—because supply shortage, inflation pressure, and late-cycle reflation are exactly the descriptors driving real-asset allocation in a risk-off environment where currency debasement fears are running high. MOO's 60.6% technical evidence would normally be insufficient for allocation, but the 70.0% macro fit of the representative ETF combines with category-level macro support to justify the 5% slot. The tension is real: 13-week momentum at 10.0% is weak, relative strength is negative at minus-5.7%, and the setup is below the 200W, which signals this is a defensive value reversion rather than a momentum chase. Agricultural commodities hold their allocation because they are a direct inflation hedge and supply-constrained by geopolitical disruption; the macro case is durable even if the technicals require patience. For this category to gain ground, it would need either confirmation that the 50W acts as support and rebounds, or a macro shift that activates additional inflation-pressure or commodity-breadth-positive signals that are currently at their ceiling.
Precious Metals — SLV
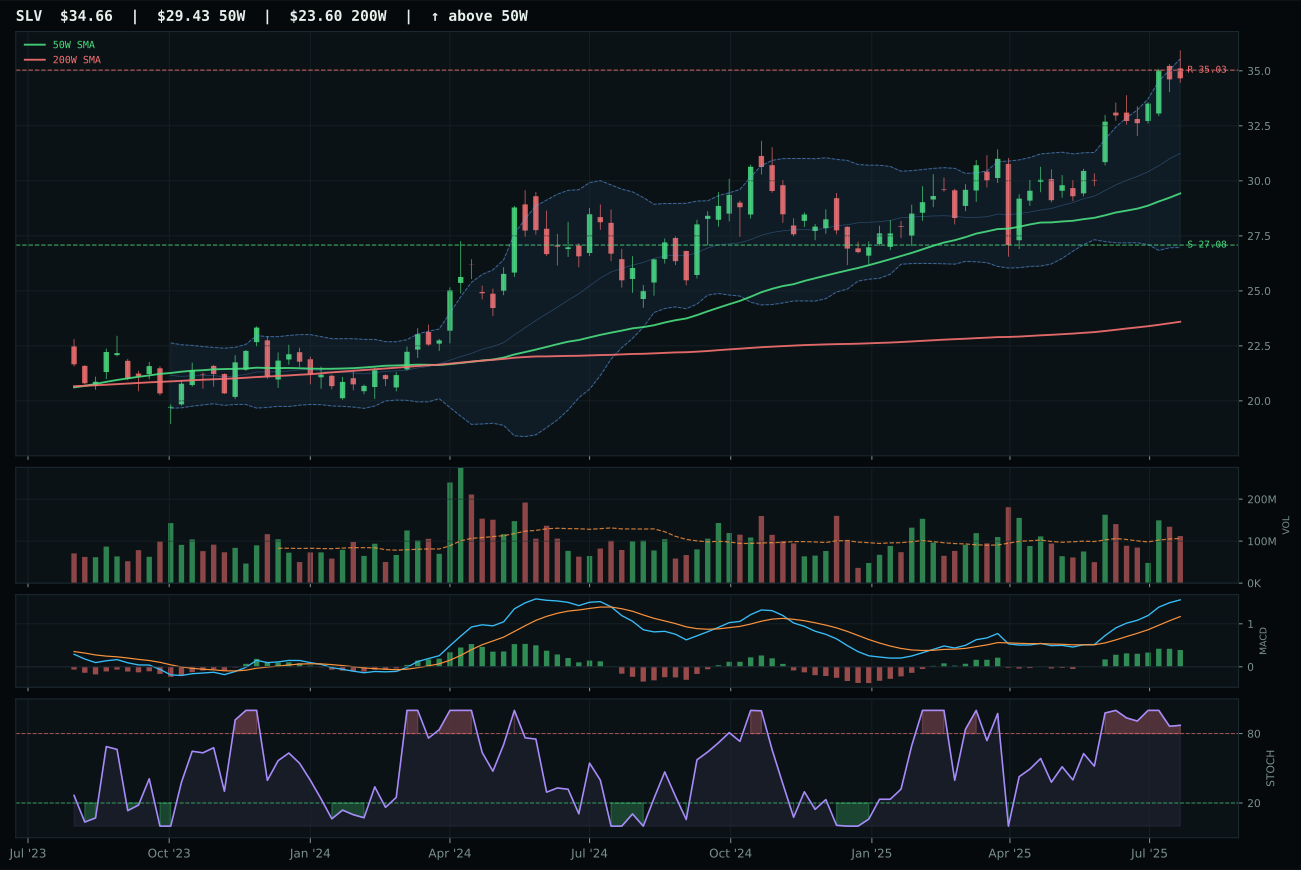
SLV has a vertical extension profile with -0.4% 13-week relative strength versus SPY.
A failed hold above support would weaken the setup.
Actionable but governed by invalidation levels.
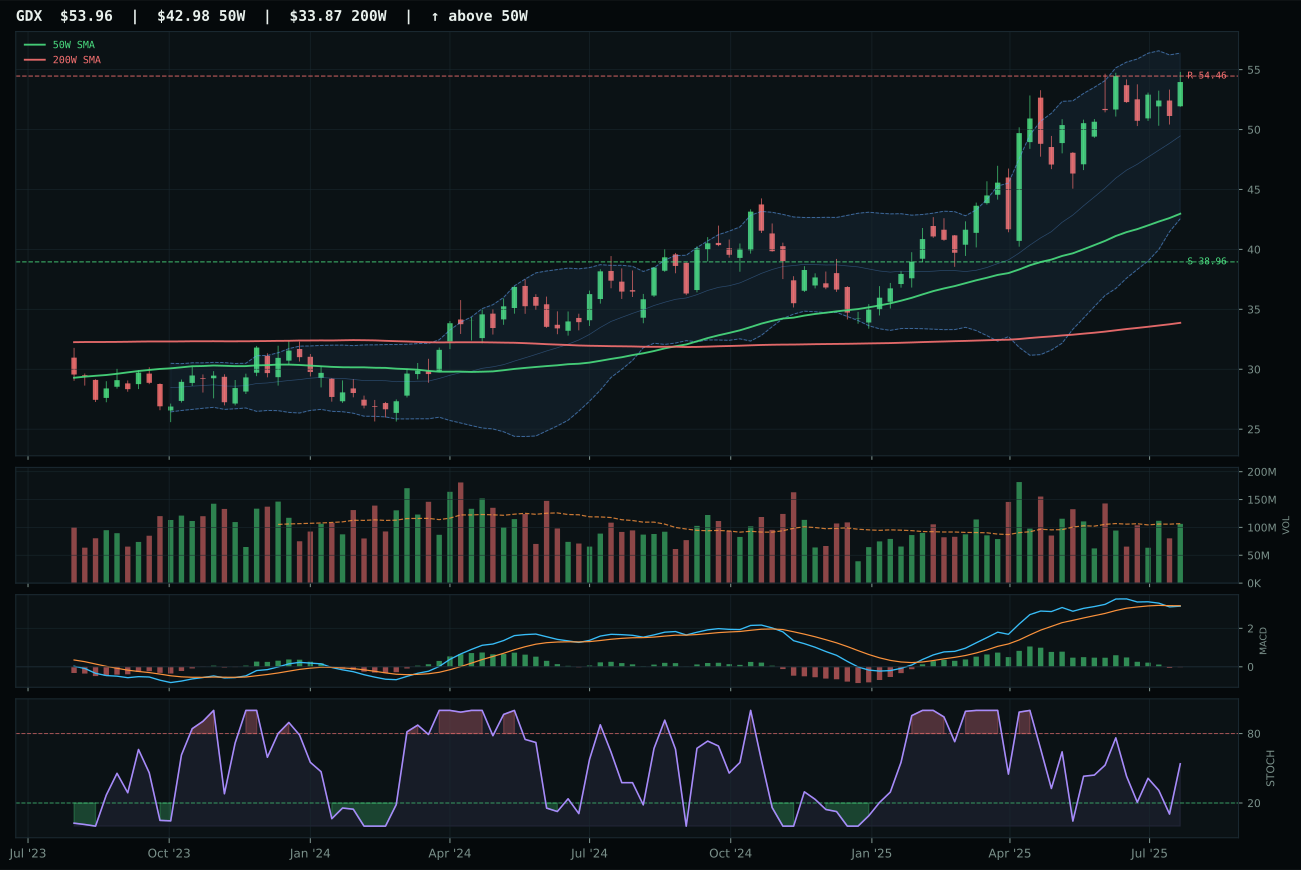
GDX has a vertical extension profile with -5.2% 13-week relative strength versus SPY.
A failed hold above support would weaken the setup.
Actionable but governed by invalidation levels.
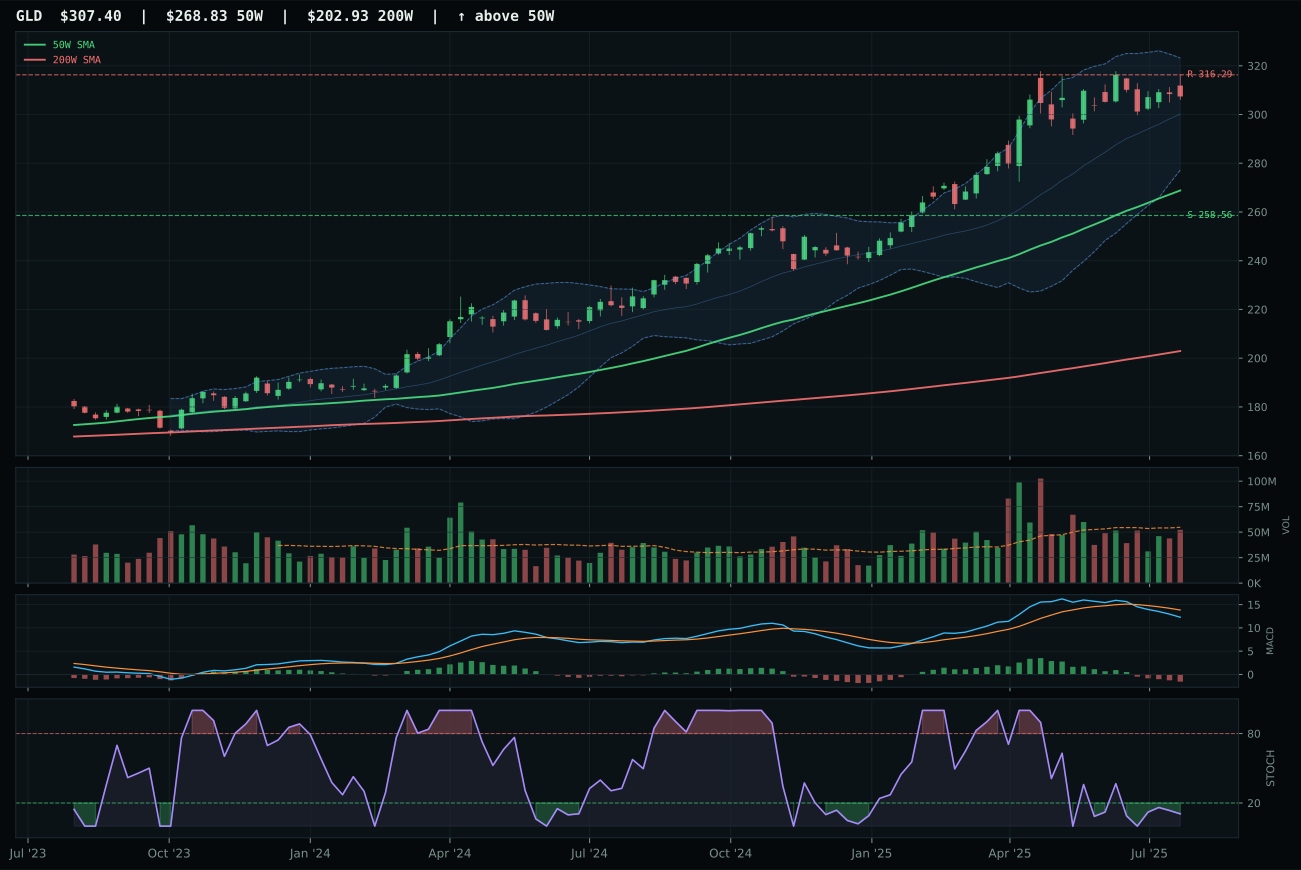
GLD has a neutral structure profile with -14.8% 13-week relative strength versus SPY.
A failed hold above support would weaken the setup.
Actionable but governed by invalidation levels.
SLV won the precious-metals category decisively over GDX by pairing a cleaner trend structure with the only bullish-and-improving MACD in the peer set, a crucial advantage when both ETFs sit at vertical extension and overbought momentum. Silver's 15.3% 13-week return and category-relative strength of 4.8% don't match gold miners' raw momentum, but SLV's 99.5% trend score—price above both the 50W and 200W with 0.7% 50W slope—combined with a 59.5% volume-price confirmation indicates institutional accumulation is defending the position rather than rotating out. GDX's 10.6% 13-week return trails sharply while sitting 25.6% extended from the 50W and displaying bearish-weakening MACD with rising-midzone stochastic RSI; the technical evidence of 29.1/100 is disqualifying even though miners' leverage to monetary policy is conceptually powerful. SLV's timing score of 35.0 versus GDX's 48 might suggest the miner setup is better, but that comparison inverts when MACD deterioration is factored in—GDX is rolling over from overbought while SLV is rolling over while maintaining bullish structure, a critical distinction.
Precious metals earned 5% as a tier-2 category with a final score of 43.9, one of the lowest-scoring allocations in the portfolio and sustained only by the unique macro setup around monetary debasement and risk-off deterioration. The category's 54.0% macro fit includes a plus-8 from risk-off deterioration itself—a regime shift that typically favors gold and silver as flight-to-safety assets—but that tailwind is partially offset by minus-4 for risk appetite positive, indicating the category is conflicted between defensive and growth narratives. SLV's 57.6 reasoned proof score and 58.6% technical evidence are sufficient to win the category but inadequate to climb into top-2; the category holds 5% because metals scarcity is active at plus-7 and inflation pressure at plus-5 maintain structural support despite weak momentum. The risk/reward of 45.7% upside versus 28.0% downside to support offers some protection, but at 17.8% extension above the 50W, new entries are fighting time decay. For precious metals to become a top-2 allocation, either risk-off deterioration would need to intensify further (raising the plus-8 penalty to regime strength), or deflation fears would need to activate and begin pricing in a major liquidity contraction that historically drives gold to multi-year extremes—neither appears imminent.
Technology — XLK
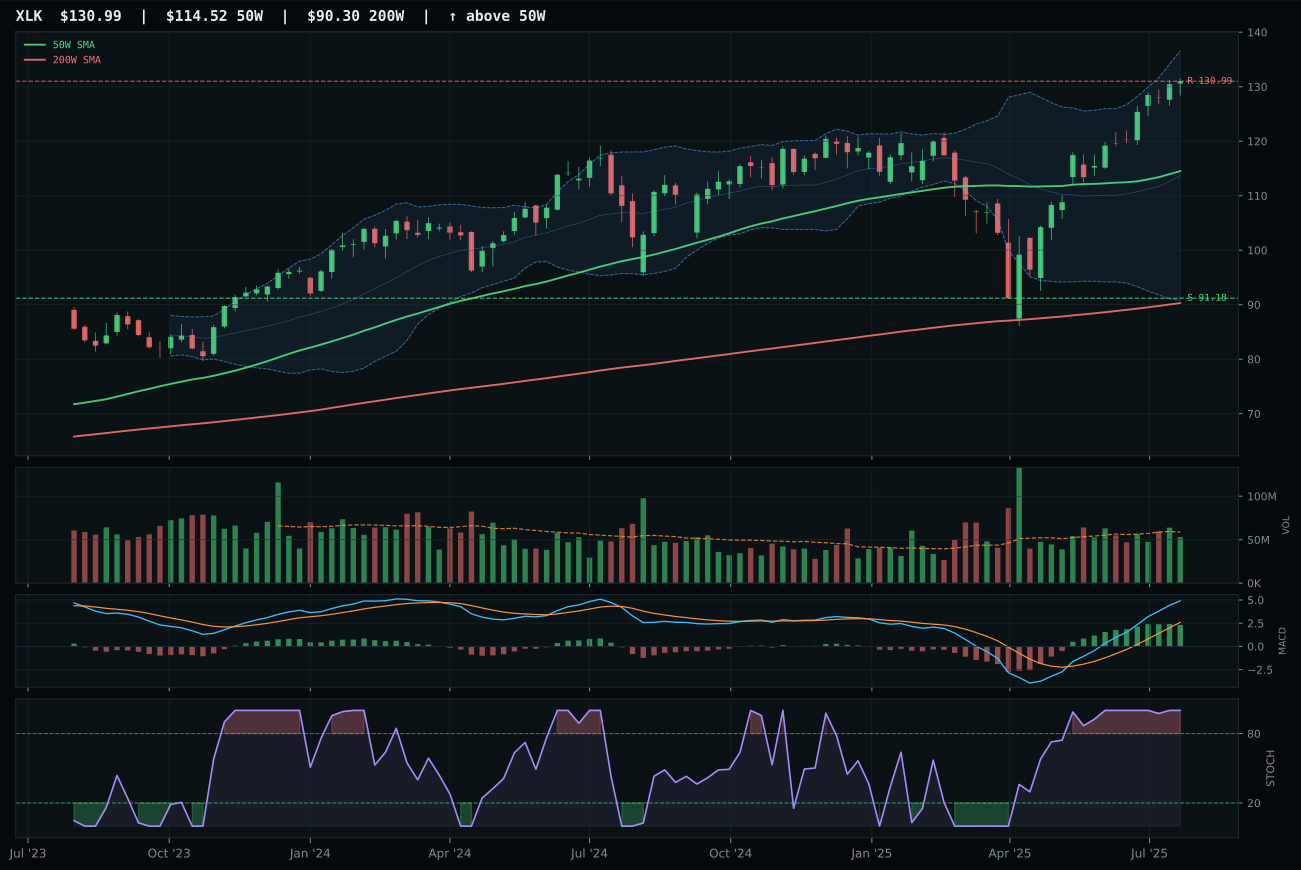
XLK has a neutral structure profile with 10.0% 13-week relative strength versus SPY.
A failed hold above support would weaken the setup.
Actionable but governed by invalidation levels.
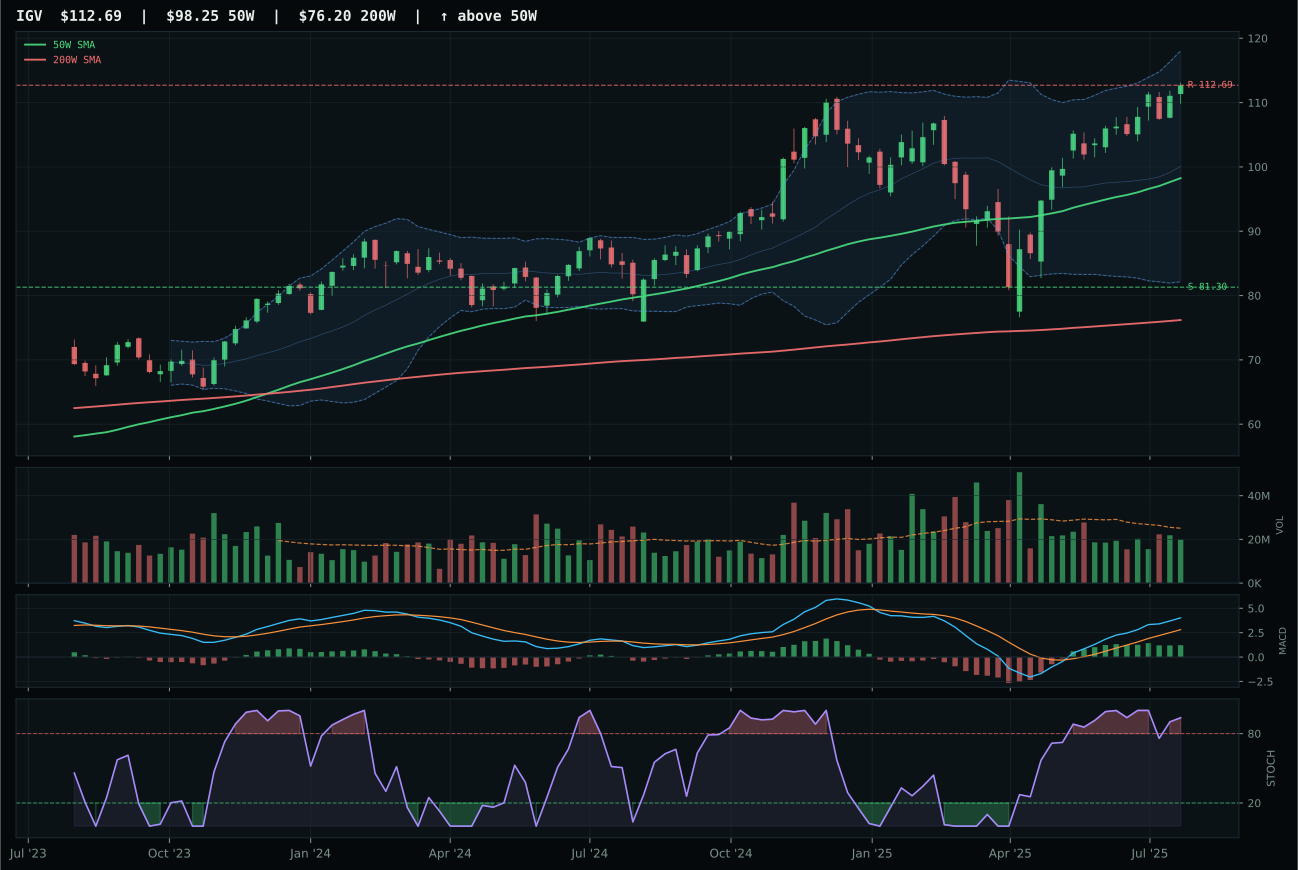
IGV has a neutral structure profile with 3.2% 13-week relative strength versus SPY.
A failed hold above support would weaken the setup.
Actionable but governed by invalidation levels.
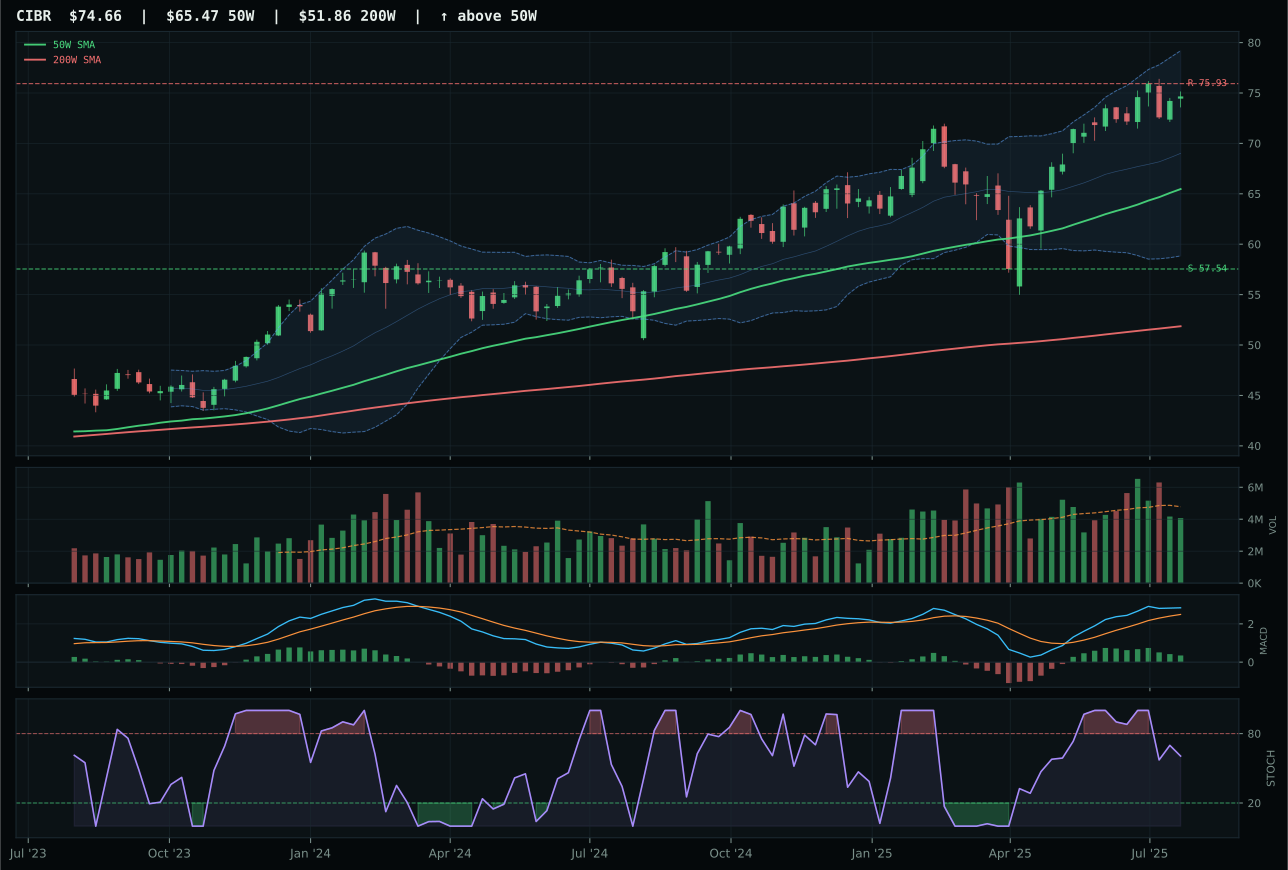
CIBR has a neutral structure profile with -1.4% 13-week relative strength versus SPY.
A failed hold above support would weaken the setup.
Actionable but governed by invalidation levels.
XLK won the technology category by combining the most consistent technical evidence with the cleanest relative strength positioning within its three-ETF peer set. The 10.0% outperformance versus SPY and 6.8% category-relative strength tell a story of institutional accumulation at scale—this is profitable technology equity that broader market buyers are actively selecting over duration-sensitive software plays like IGV. XLK's MACD is bullish and improving while stochastic RSI sits at overbought momentum, a constructive divergence that rewards early entries but not late chasers; the setup sits neutral on structure with only 14.6% extension above the 50W, providing genuine risk/reward asymmetry. IGV lost despite matching XLK's above-the-50W trend because its timing score collapsed to 44 from XLK's 74—MACD is flattening, stochastic RSI is rolling over, and 13W returns of 18.9% lag the winner by 700 basis points on inferior relative strength of just 3.2% versus SPY.
Technology earned 0% allocation this week and ranked outside the top-eight categories entirely, a sharp downgrade from its historical anchor status. The category's final score of 43.6 reflects a fundamental conflict: technical evidence is strong at 90.1/100, but macro fit deteriorates sharply to 44.0/100 when risk-off deterioration, active liquidity stress at minus-9 impact, and credit stress at minus-6 are layered atop nominal risk-appetite-positive signals. With the overlay halving all tier sizes to 10%/5%/0%, the eight highest-scoring categories consumed all available slots, leaving technology to compete as the ninth or tenth ranked option. What would resurrect this category is either a clear risk-on regime shift—which would activate the embedded +9 for ai growth sponsorship—or a collapse in credit spreads that removes the minus-6 drag from active credit stress descriptors. Until one of those structural shifts occurs, profitable earnings are insufficient to compete against commodity and energy scarcity, which own the current late-cycle reflation macro environment.
Emerging Markets — IEMG
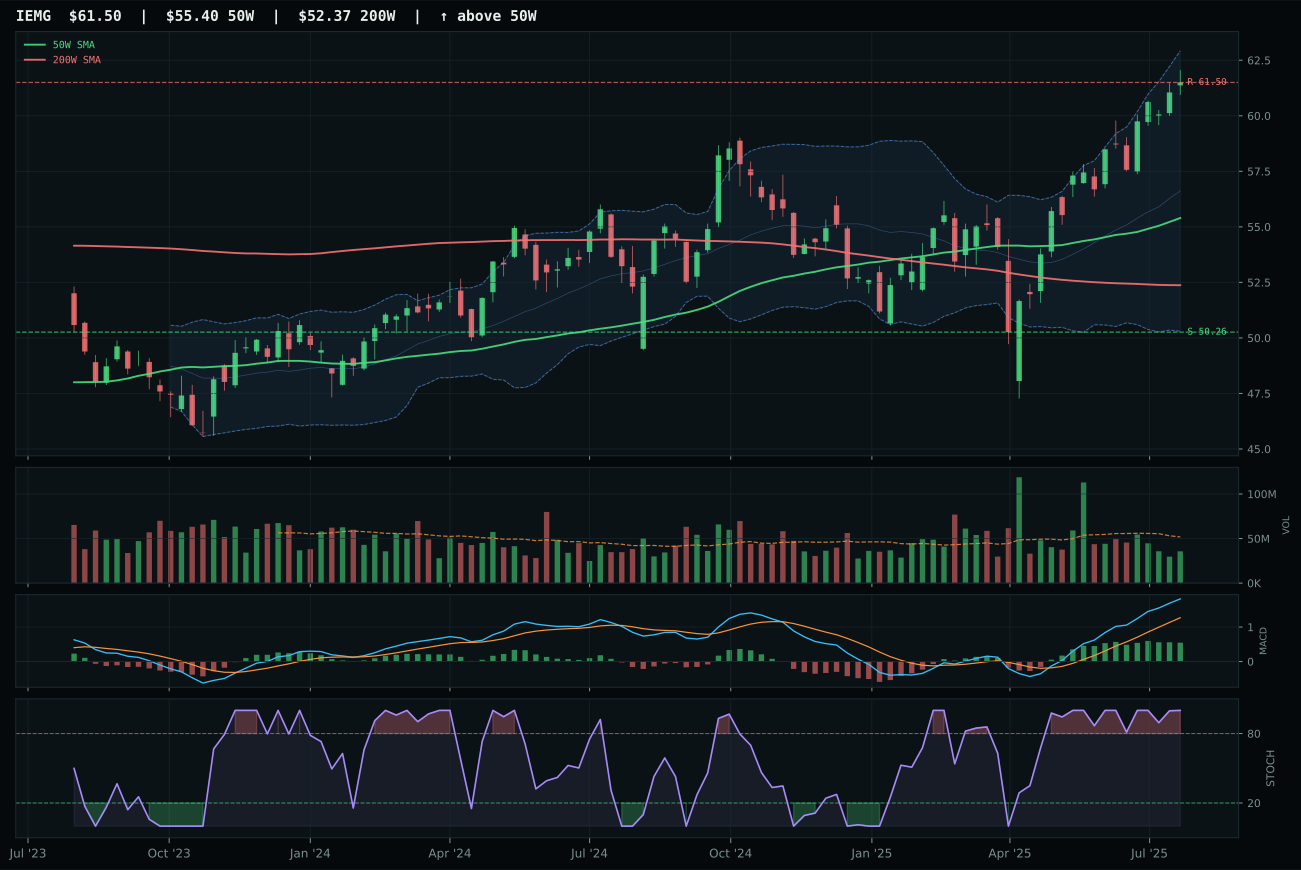
IEMG has a neutral structure profile with -1.3% 13-week relative strength versus SPY.
A failed hold above support would weaken the setup.
Actionable but governed by invalidation levels.
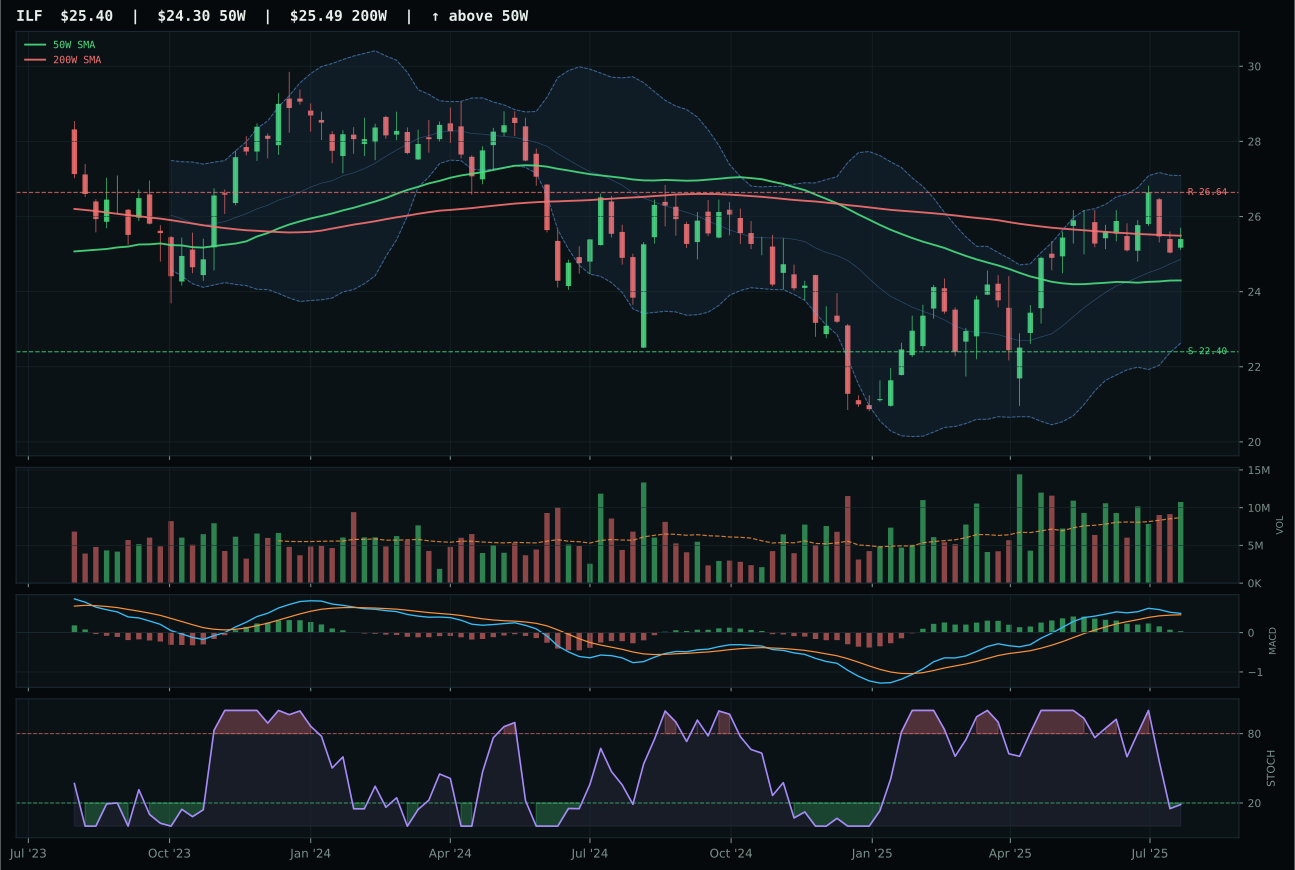
ILF has a neutral structure profile with -13.7% 13-week relative strength versus SPY.
A failed hold above support would weaken the setup.
Actionable but governed by invalidation levels.
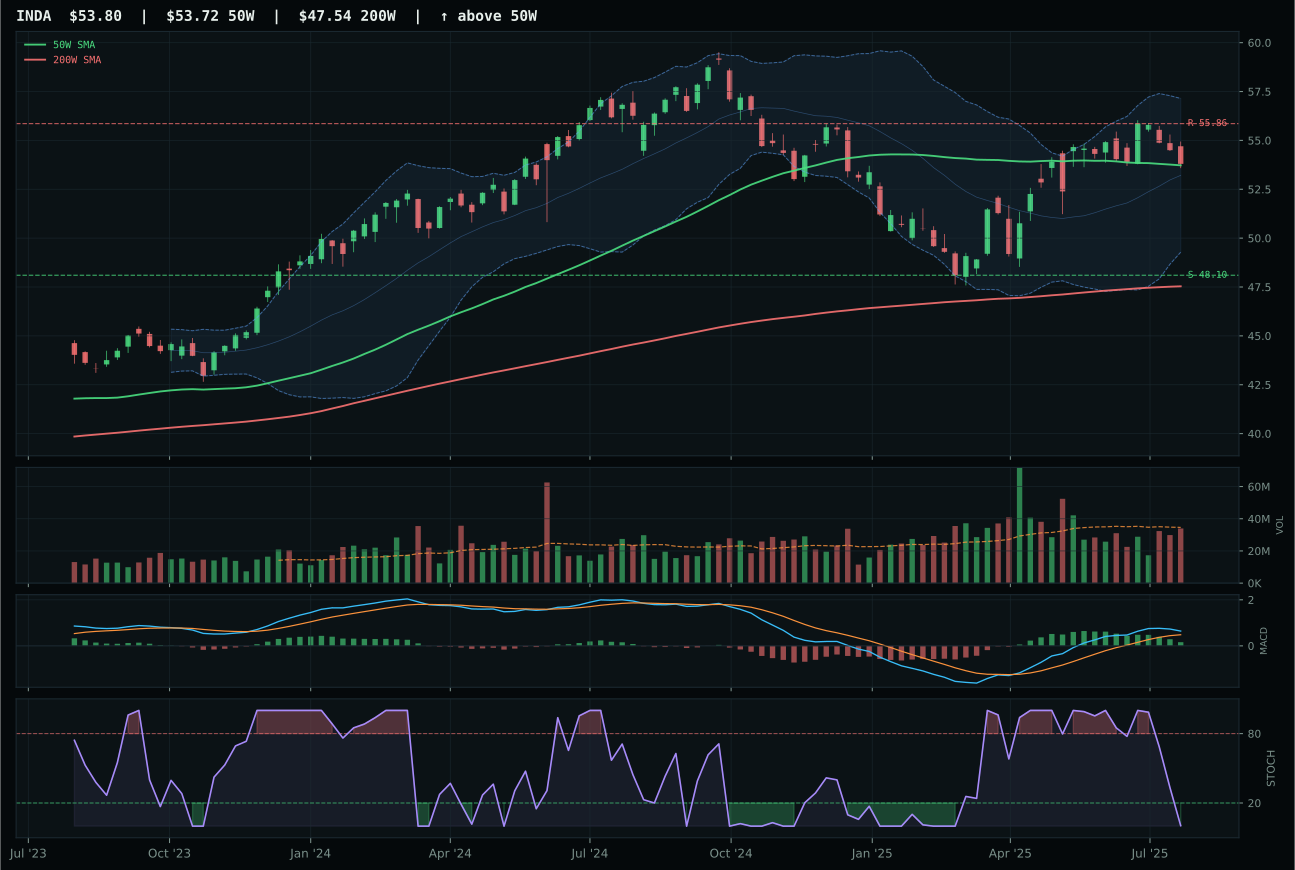
INDA has a compression near 50W profile with -13.9% 13-week relative strength versus SPY.
A failed hold above support would weaken the setup.
Actionable but governed by invalidation levels.
IEMG won the emerging-markets category despite its parent category receiving 0% allocation, claiming the title through superior MACD confirmation and category-relative strength that proved decisive in a fragmented peer set. The 14.4% 13-week return with category-relative strength of 12.4% indicates broad-based emerging-market participation rather than a single-country or thematic bet, and IEMG's bullish-and-improving MACD combined with 88.0% trend score creates a setup that is technically cleaner than ILF's bullish-but-flattening momentum structure. At 11.0% from the 50W in neutral structure, IEMG occupies the entry-quality zone that rewards patient accumulation, and the 76.1% volume-price confirmation supports that pattern even though volume participation is thin at 0.69x the 20-week average. ILF lost despite the macro narrative around commodity-breadth-positive and real-asset-sponsorship because MACD is flattening, stochastic RSI is oversold, and the 13-week return of just 2.0% with negative 13.7% SPY relative strength indicates this Latin-America play is deteriorating in real time. IEMG's 82.3% technical evidence towers over ILF's 51.0%, making this an unambiguous category decision.
Emerging Markets earned 0% allocation this week and ranks outside the portfolio entirely, occupying ninth or tenth position with a final score of just 23.4—the second-lowest in the category set. The category's 26.0% macro fit reveals the core problem: risk-off deterioration applies minus-12, liquidity stress is active at minus-10, and credit stress is active at minus-10, creating a triple headwind that overwhelms the plus-8 from risk-appetite-positive. Emerging-market currency weakness, hard-asset outflows from EM debt positions, and the flight-to-quality rotation that defines risk-off deterioration regimes mean EM equities typically lag even when broad SPY relative strength is positive. IEMG's 67.3 reasoned proof score reflects technical adequacy, not conviction, and the 82.3% technical evidence cannot overcome a regime that is structurally hostile to high-beta international exposure. For emerging markets to earn allocation, either risk-off deterioration would need to reverse into risk-on recovery (removing the minus-12 regime penalty), or credit spreads would need to compress sharply and activate major emerging-market central-bank support narratives that currently don't exist. At current positioning, emerging markets are the clearest exclusion in the portfolio because the macro environment is explicitly unfavorable and technical evidence, while adequate for category leadership, is insufficient to justify 5% or 10% allocation in a regime prioritizing scarcity and deflation hedges.