
2025-07-18
Informational purposes only. The content in this report, including allocations, analysis, and commentary, is provided solely for informational and educational purposes. It does not constitute financial advice, investment advice, trading advice, or any other type of advice. Past performance does not guarantee future results. Always conduct your own research and consult a qualified financial professional before making investment decisions.
Weekly Allocation
| Ticker | Category | Weight | Role |
|---|---|---|---|
| FBTC | 50% | Overlay | |
| URA | Nuclear Energy | 10% | Top-2 (10%) |
| COPX | Industrial Metals | 10% | Top-2 (10%) |
| XAR | Defense & Aerospace | 5% | Tier-2 (5%) |
| SMH | AI | 5% | Tier-2 (5%) |
| XLK | Technology | 5% | Tier-2 (5%) |
| PAVE | Utilities & Infrastructure | 5% | Tier-2 (5%) |
| XLE | Traditional Energy | 5% | Tier-2 (5%) |
| SLV | Precious Metals | 5% | Tier-2 (5%) |
Trade Instructions — Monday Open
Sell the tranche from 2025-06-20 (completing its 4-week hold). Buy the new tranche. Instructions show net portfolio changes — same-asset positions cancel, weight changes show the delta.
| Action | Ticker | Instruction |
|---|---|---|
| SELL | SLV | Sell 25% of SLV position (reduce 5.00% → 3.75%) |
| SELL | XLU | Sell entire XLU position (1.25% of portfolio) |
| SELL | FCG | Sell entire FCG position (1.25% of portfolio) |
| BUY | COPX | Buy COPX — 33.33% of freed cash (adds 1.25% to portfolio) |
| BUY | PAVE | Buy PAVE — 33.33% of freed cash (adds 1.25% to portfolio) |
| BUY | XLE | Buy XLE — 33.33% of freed cash (adds 1.25% to portfolio) |
Current Portfolio After Trade
Combined holdings across all 4 active tranches. Each tranche is 25% of the portfolio.
| Ticker | % of Portfolio | Weight Bar |
|---|---|---|
| FBTC | 50.00% | |
| XLK | 6.25% | |
| SMH | 6.25% | |
| COPX | 6.25% | |
| XAR | 5.00% | |
| URNM | 5.00% | |
| PAVE | 5.00% | |
| XLE | 5.00% | |
| SLV | 3.75% | |
| REMX | 2.50% | |
| URA | 2.50% | |
| IEMG | 1.25% | |
| MOO | 1.25% |
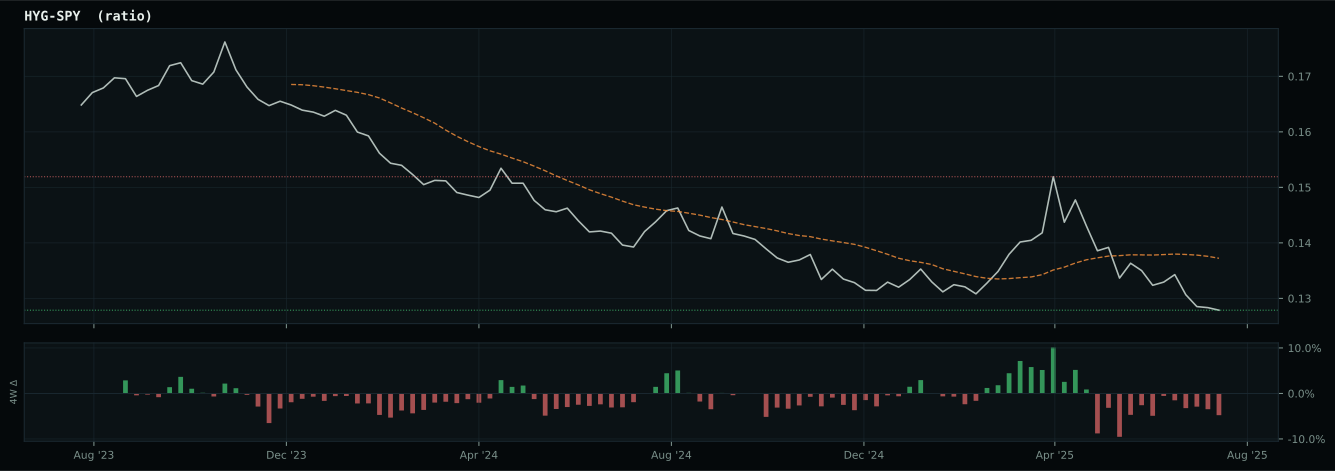
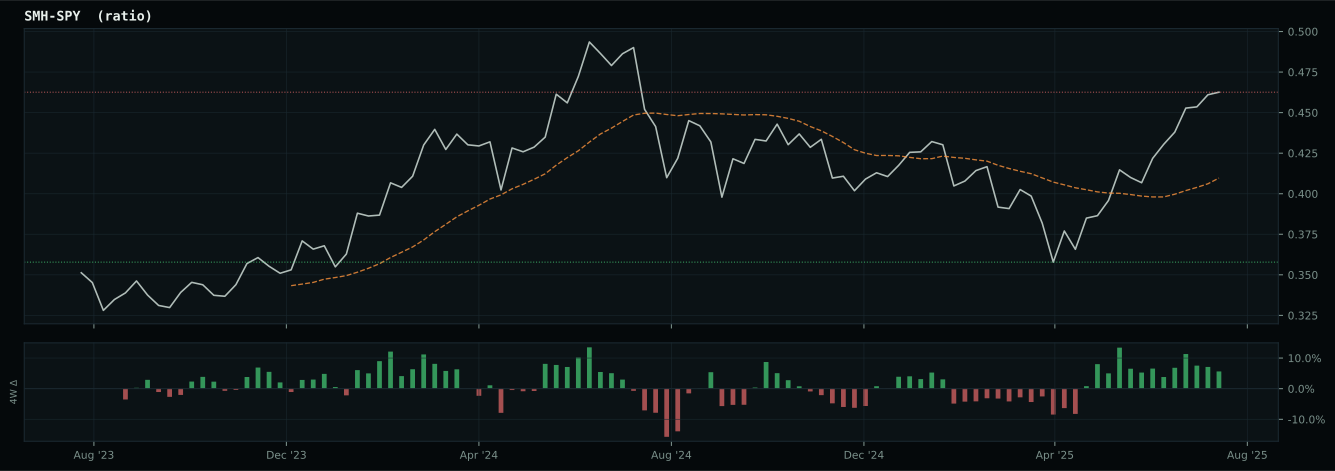
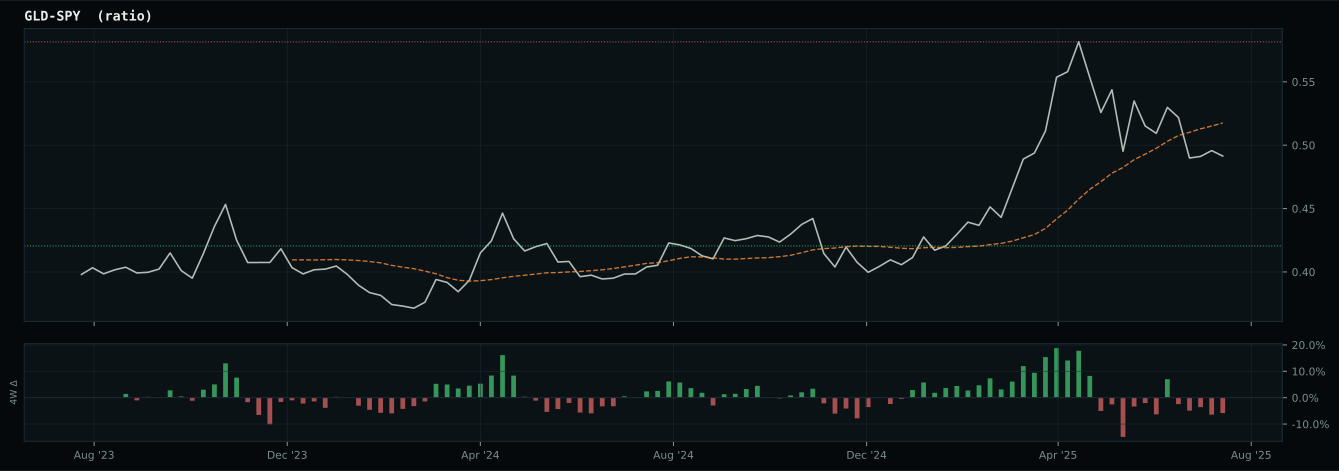
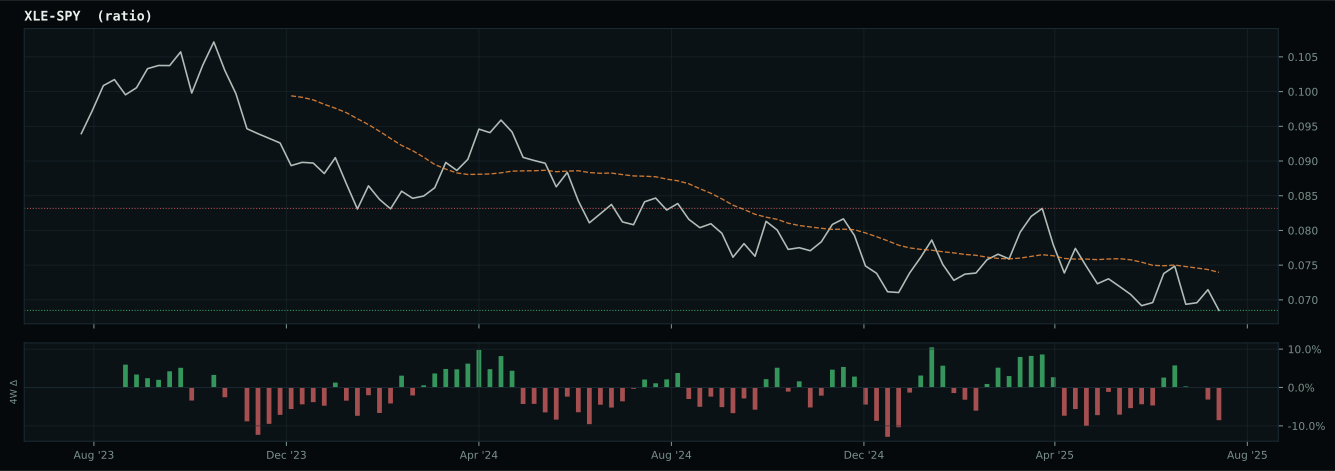
Macro Regime — Risk-Off Deterioration
Macro Evidence Charts
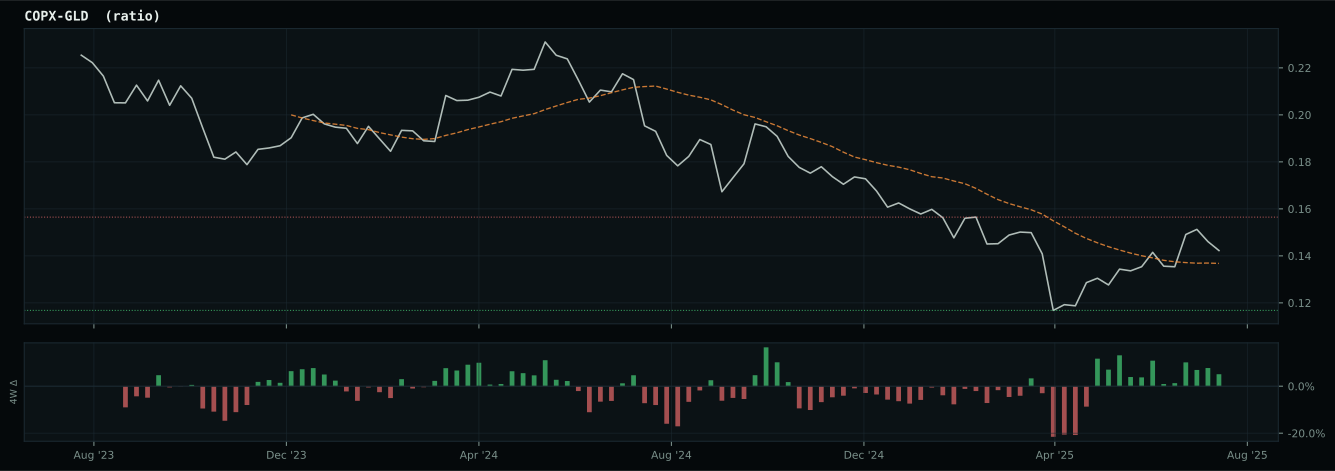
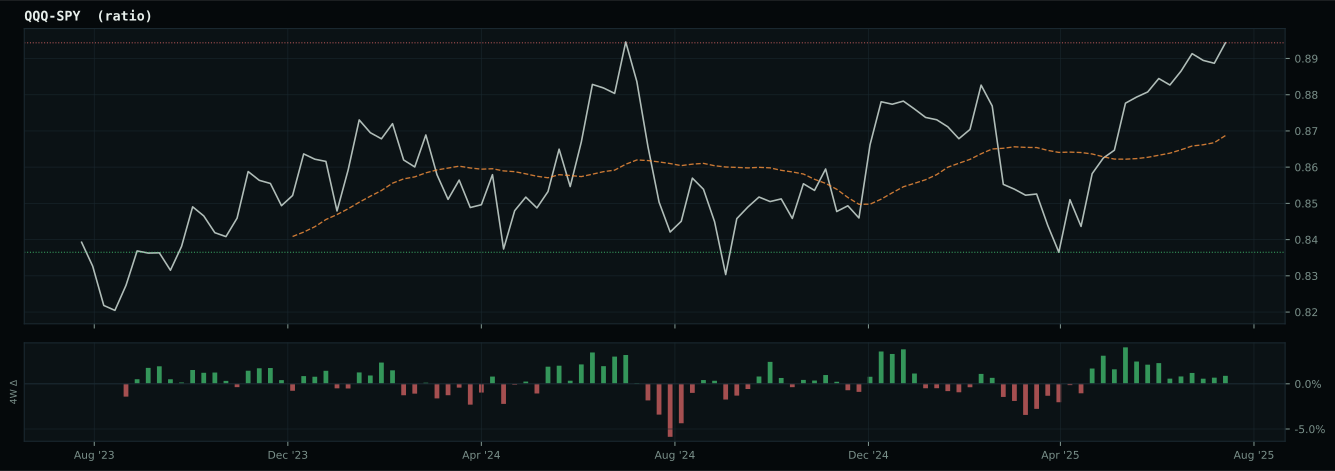
Market-implied signals behind the macro regime scores. Each ratio compares two assets; the direction and slope of the ratio is what the macro engine reads.
Crypto Regime — TrendBTC
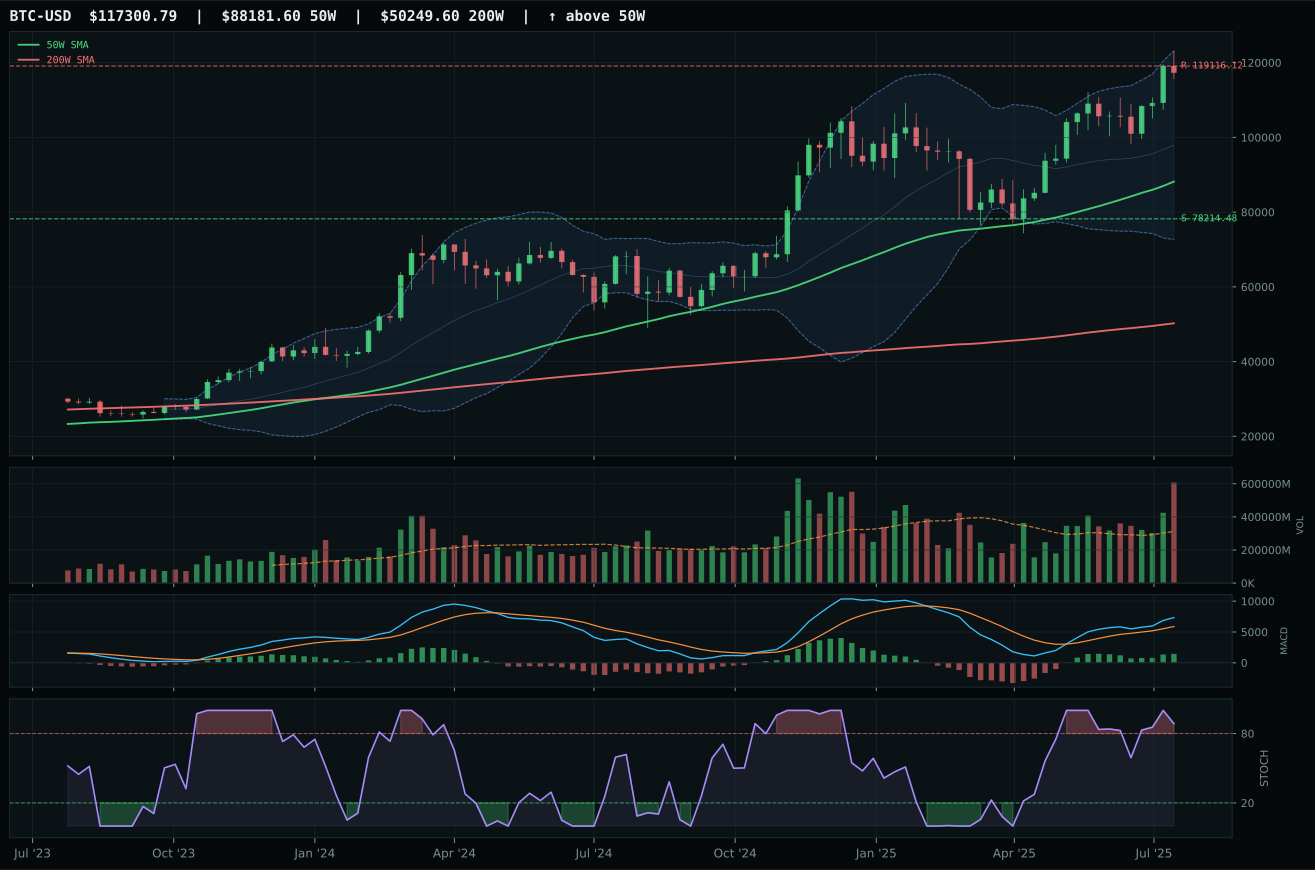
ValueBTC not armed: BTC has not made the first post-breakdown touch of the 200W buy zone after losing the 50W
TrendBTC confirmed: 2 consecutive closes above rising/flat 50W SMA
one or more available conditions failed
Category Rankings
| Rank | Category | Winner | Score | Alloc | 4W Ret | Peers (4W) |
|---|---|---|---|---|---|---|
| 1 | Nuclear Energy | URA | 78.5 | 20% | -6.54% | URNM -3.9% · NLR -2.6% |
| 2 | Industrial Metals | COPX | 71.3 | 20% | +4.70% | REMX +13.0% · PICK +0.8% |
| 3 | Defense & Aerospace | XAR | 65.9 | 10% | -3.28% | ITA -0.7% · ROKT +1.7% |
| 4 | AI | SMH | 62.9 | 10% | +1.46% | BOTZ +1.2% · AIQ +1.4% |
| 5 | Technology | XLK | 57.1 | 10% | +1.60% | IGV -2.2% · CIBR -3.4% |
| 6 | Utilities & Infrastructure | PAVE | 55.8 | 10% | +0.94% | XLU +2.1% · IGF +2.7% |
| 7 | Traditional Energy | XLE | 44.7 | 10% | -1.06% | FCG -2.9% · XOP -4.6% |
| 8 | Precious Metals | SLV | 36.8 | 10% | -1.28% | GLD -1.3% · GDX +12.1% |
| 9 | Agriculture & Livestock | MOO | 33.9 | 0% | +0.39% | VEGI -0.9% · WEAT -6.9% |
| 10 | Emerging Markets | IEMG | 21.9 | 0% | +1.76% | ILF +4.0% · INDA -2.7% |
Nuclear Energy — URA
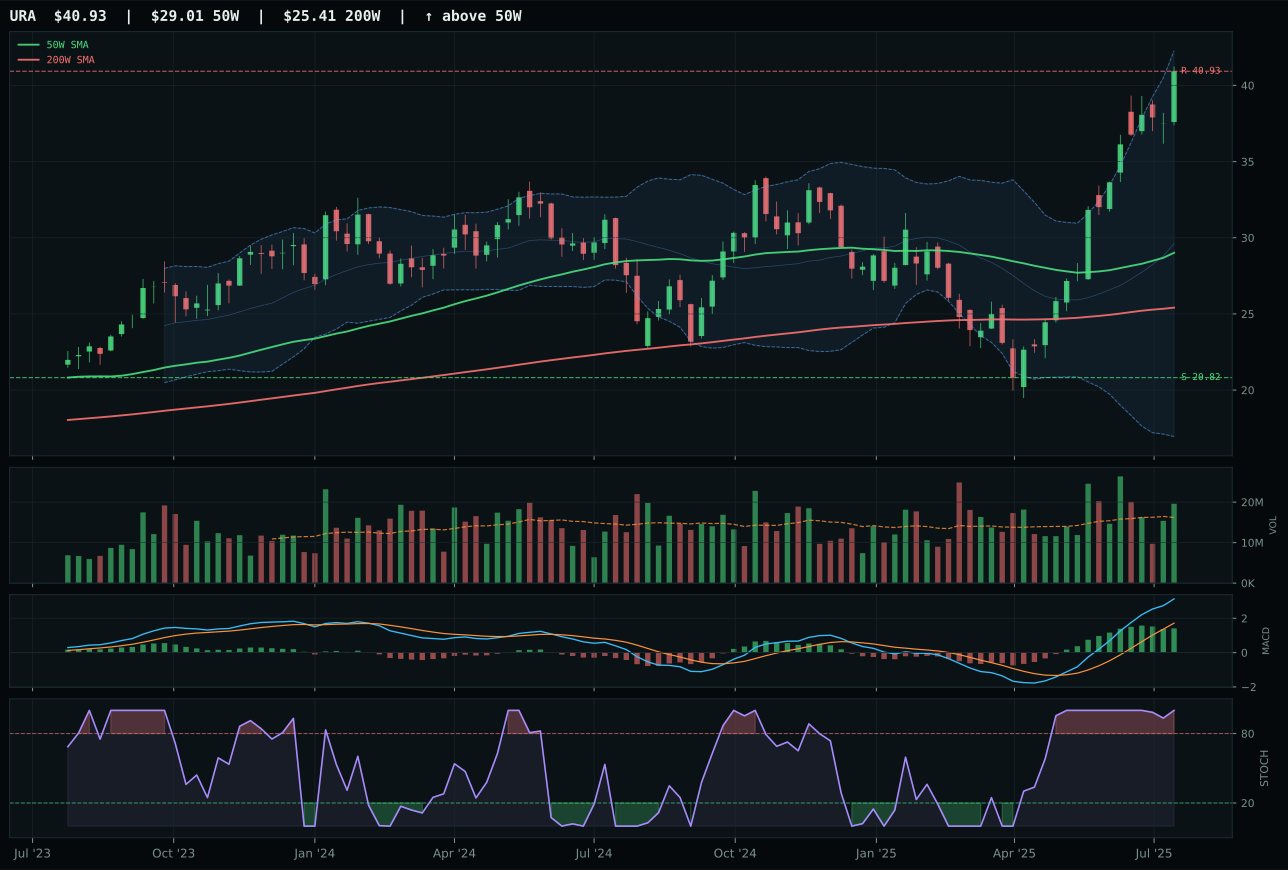
URA has a vertical extension profile with 59.7% 13-week relative strength versus SPY.
A failed hold above support would weaken the setup.
Actionable but governed by invalidation levels.
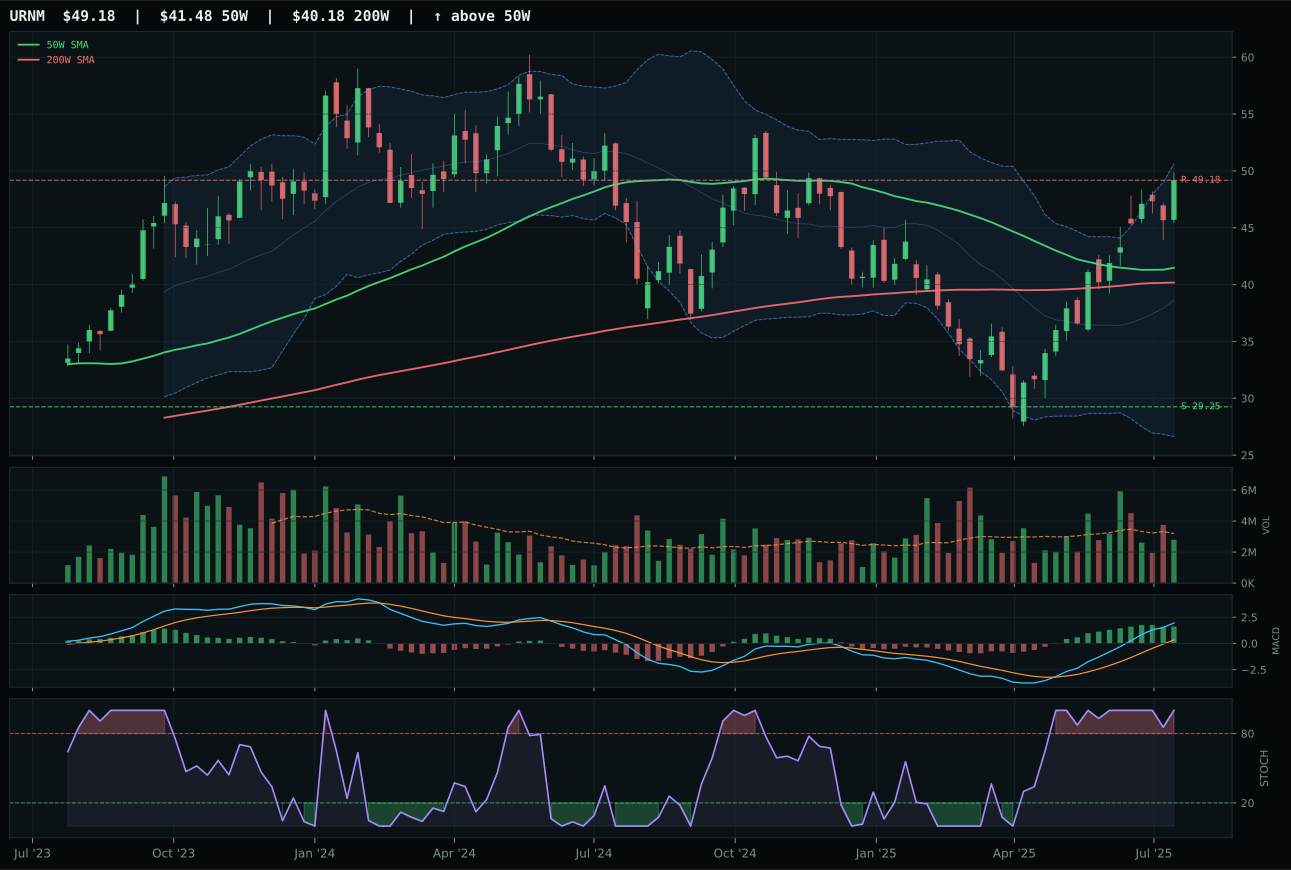
URNM has a vertical extension profile with 36.0% 13-week relative strength versus SPY.
A failed hold above support would weaken the setup.
Actionable but governed by invalidation levels.
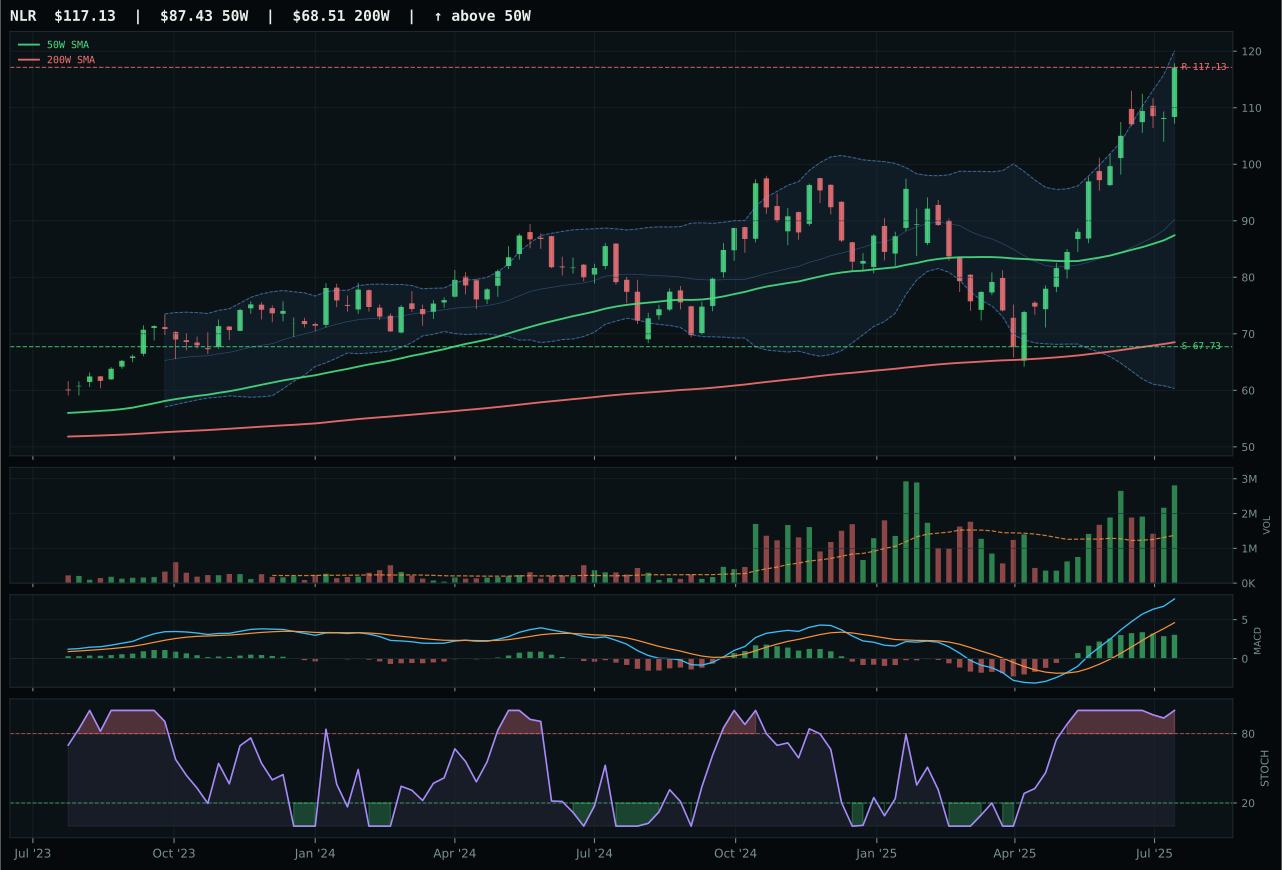
NLR has a vertical extension profile with 37.3% 13-week relative strength versus SPY.
A failed hold above support would weaken the setup.
Actionable but governed by invalidation levels.
URA wins the category by combining the highest relative strength score in the portfolio (59.7% versus SPY) with perfect momentum confirmation at 100/100, despite sitting extended at 41.1% from the 50-week moving average. The extension is brutal for timing (32/100), yet persistence reaches 100/100 and volume-price confirmation is 94.1/100, meaning the extended rally is being continuously accumulated rather than distributed into weakness. URNM's technical evidence of 82.6/100 exceeds URA's 89.6 in one view, but category-relative strength of minus 1.3% versus URA's 22.4% proves that URA is capturing the uranium scarcity narrative while URNM has stalled. MACD is bullish but flattening for both, yet URA's volume at above-average participation (1.21x twenty-week average) versus URNM's neutral volume suggests new buyers are entering URA into the overbought stochastic RSI (1.00), a contrarian signal of continuation.
Nuclear Energy earns 10% as the second top-2 overweight category, ranking 78.5 and claiming the second allocation slot. Macro fit reaches 64/100, with energy scarcity worth nine points and real asset sponsorship adding seven, while Late-Cycle Reflation contributes another seven points—a favorable combination that only partially offsets the minus five penalty from Risk-Off Deterioration. URA's technical evidence of 89.6/100 ranks among the highest in the portfolio, yet timing of only 32/100 and risk/reward at 38.5/100 (with ninety-six point one percent downside to support) signal asymmetric entry risk. The allocation is justified by momentum persistence and relative strength leadership, not by entry safety. Current holders should set profit targets above 40.93 resistance; new capital should wait for a consolidation back into the upper retracement zone with MACD turning decisively bullish again. The 10% slot acknowledges uranium's scarcity premium while respecting the technical maturity of the move.
Industrial Metals — COPX
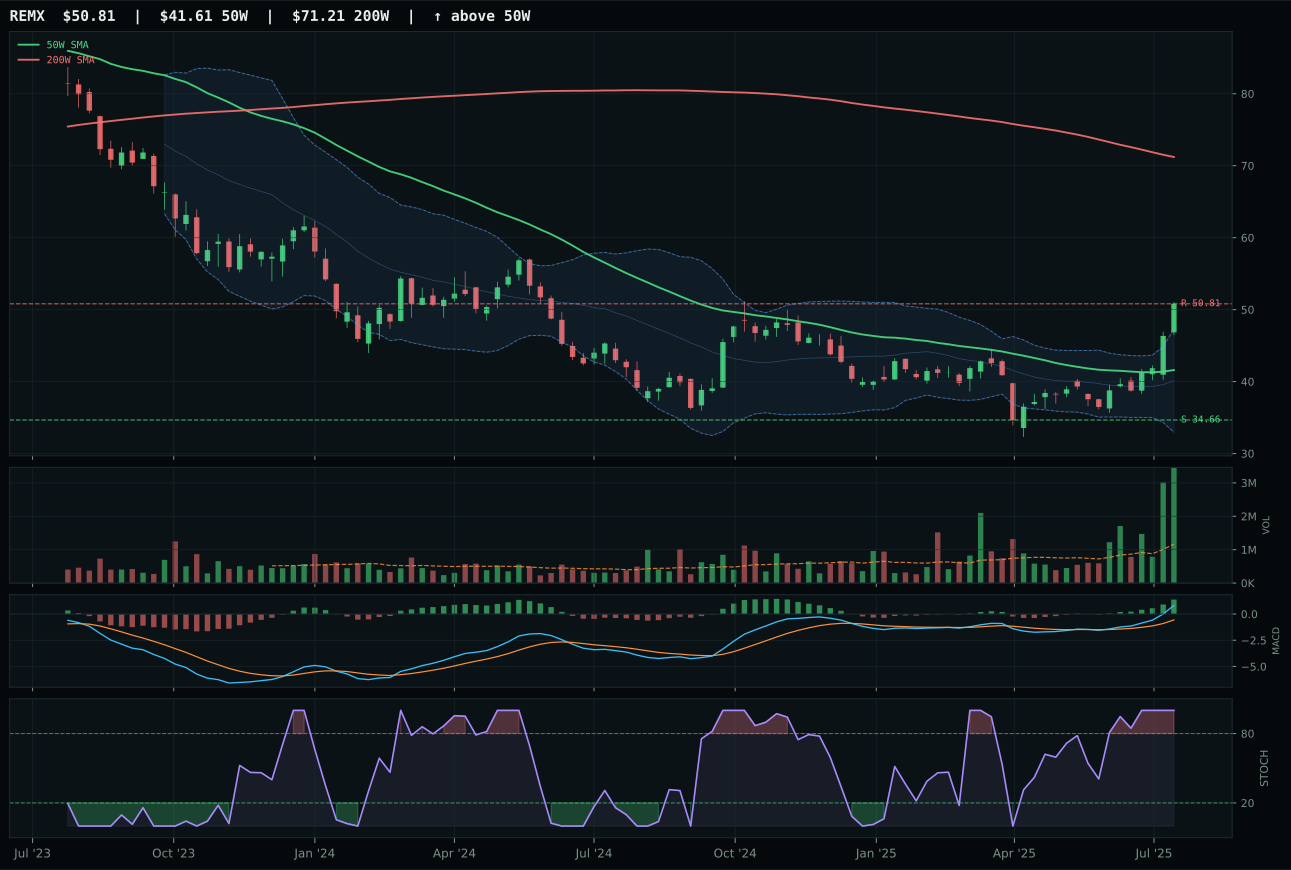
REMX has a vertical extension profile with 17.5% 13-week relative strength versus SPY.
A failed hold above support would weaken the setup.
Actionable but governed by invalidation levels.
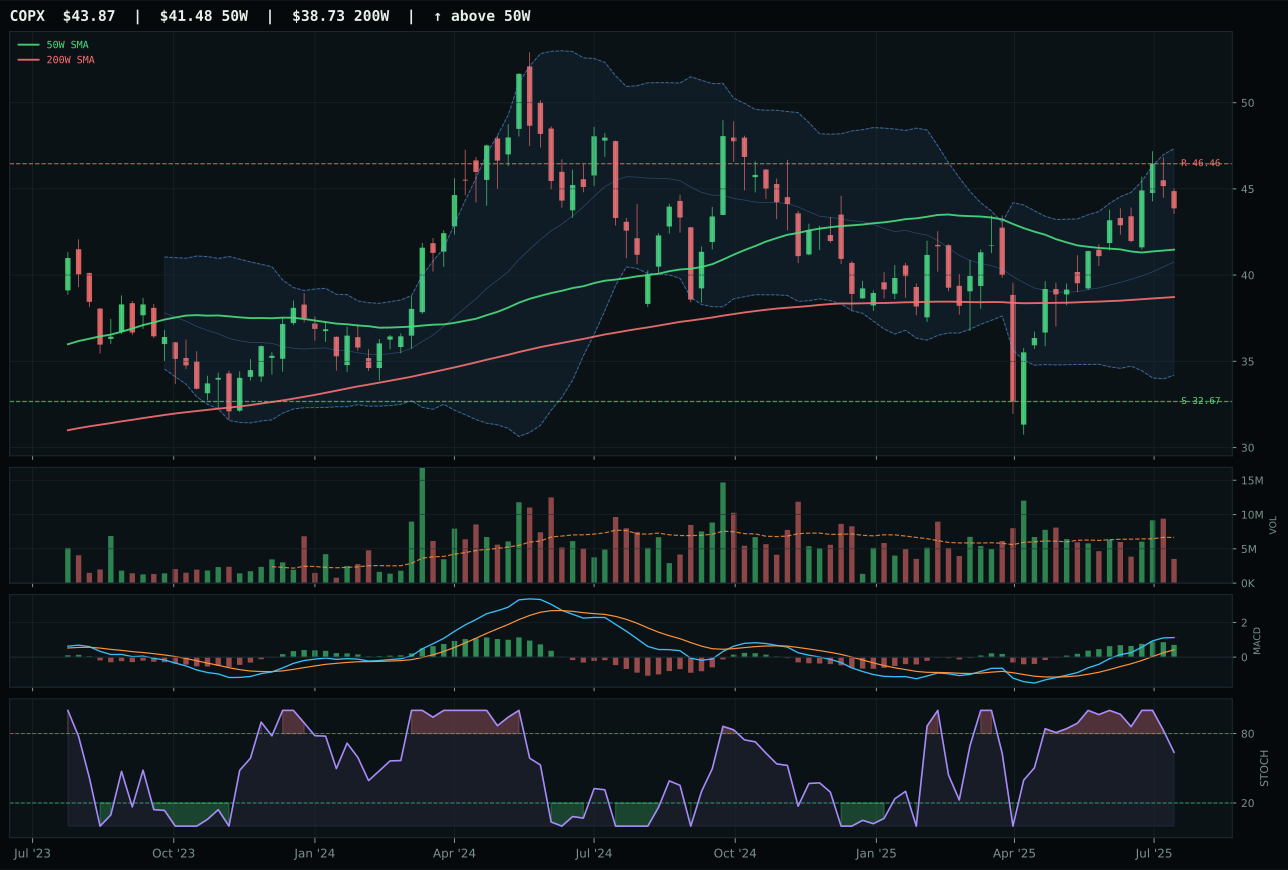
COPX has a neutral structure profile with 1.5% 13-week relative strength versus SPY.
A failed hold above support would weaken the setup.
Actionable but governed by invalidation levels.
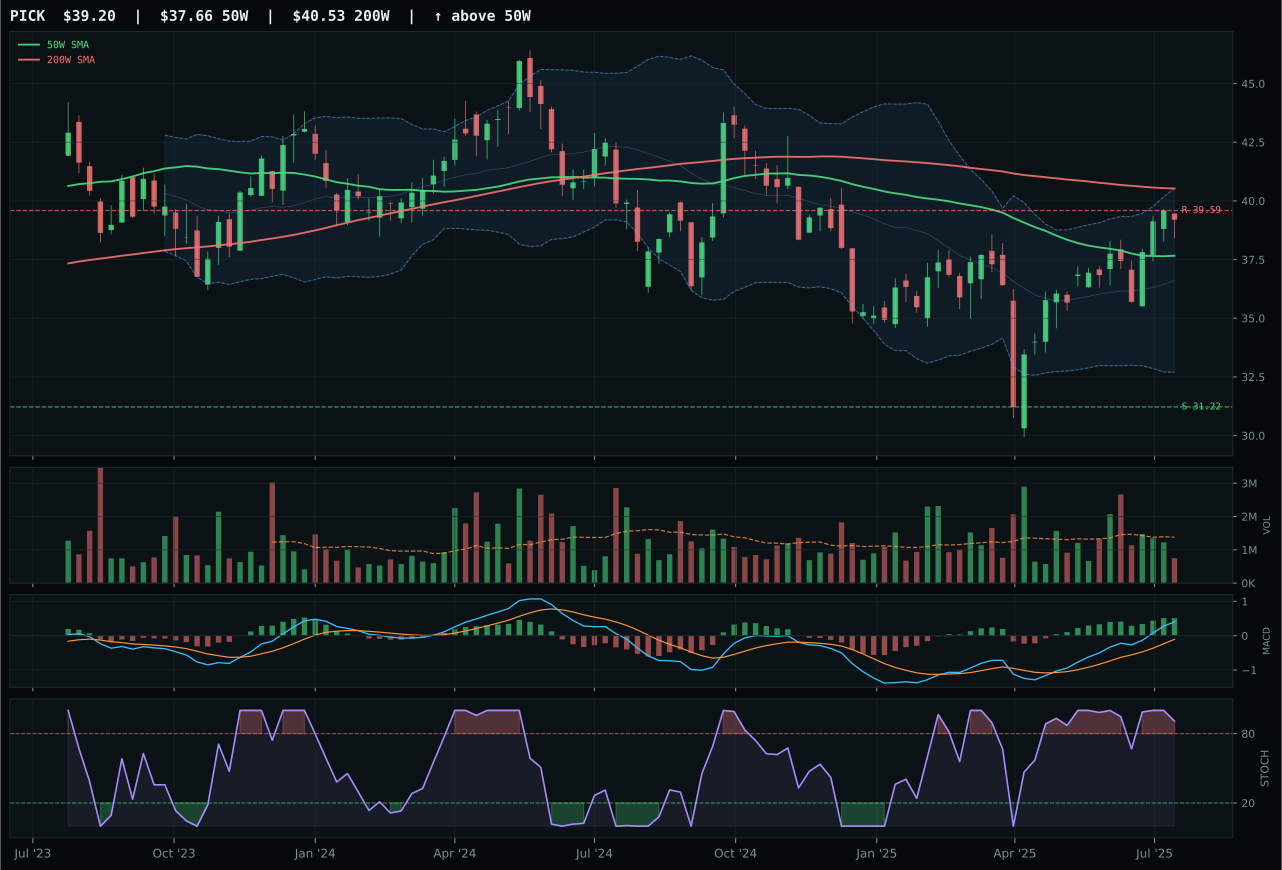
PICK has a neutral structure profile with -3.9% 13-week relative strength versus SPY.
A failed hold above support would weaken the setup.
Actionable but governed by invalidation levels.
COPX wins the category despite REMX's superior technical evidence of 100/100 versus COPX's 72.5, because timing and setup quality overwhelm raw momentum strength. COPX sits only 5.8% extended from the 50-week moving average in the upper retracement zone, scoring 75/100 on timing versus REMX's punishing 37/100 at 22.1% extension near the fifty-two week high. MACD remains bullish and improving for COPX while REMX's is bullish but flattening, and stochastic RSI for COPX falls neutral (0.64) while REMX remains overbought (1.00), a critical distinction when entry risk escalates. The category-relative strength tie at zero and 16.0% respectively favors REMX technically, but volume tells the true story: COPX's thin participation at 0.53x twenty-week average means the move has room to run without distribution pressure, while REMX's accumulation/confirmation volume suggests it has already pulled in most available buying.
Industrial Metals earns 10% as a top-2 overweight category, ranking 71.3 and claiming one of the two allocation slots alongside Nuclear Energy. Macro fit reaches 67/100, with metals scarcity worth fourteen points and Late-Cycle Reflation adding ten more, offsetting Risk-Off Deterioration's minus eight penalty. COPX's technical evidence of 72.5 sits below the category's 71.3 final score because the reasoned proof order ranks REMX first (88.5) and COPX second (70.2), yet COPX wins the representative role due to superior setup quality and entry asymmetry. The thin volume at 0.53x twenty-week average means COPX can extend without distribution, whereas REMX shows signs of saturation from accumulation. Allocate the 10% to COPX and reserve REMX for a secondary position if COPX stalls; the current tiering reflects risk-adjusted opportunity, not pure momentum leadership.
Defense & Aerospace — XAR
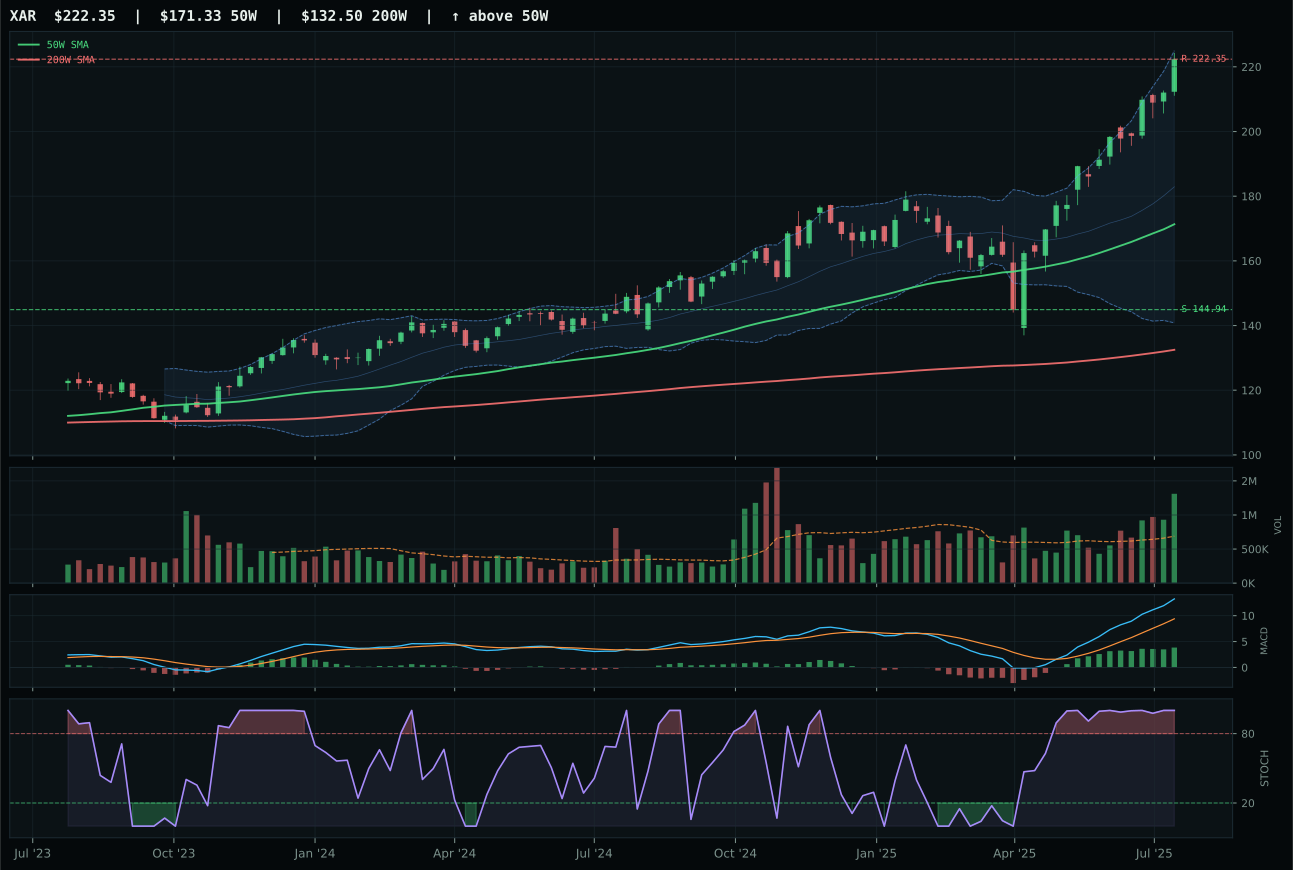
XAR has a vertical extension profile with 17.3% 13-week relative strength versus SPY.
A failed hold above support would weaken the setup.
Actionable but governed by invalidation levels.
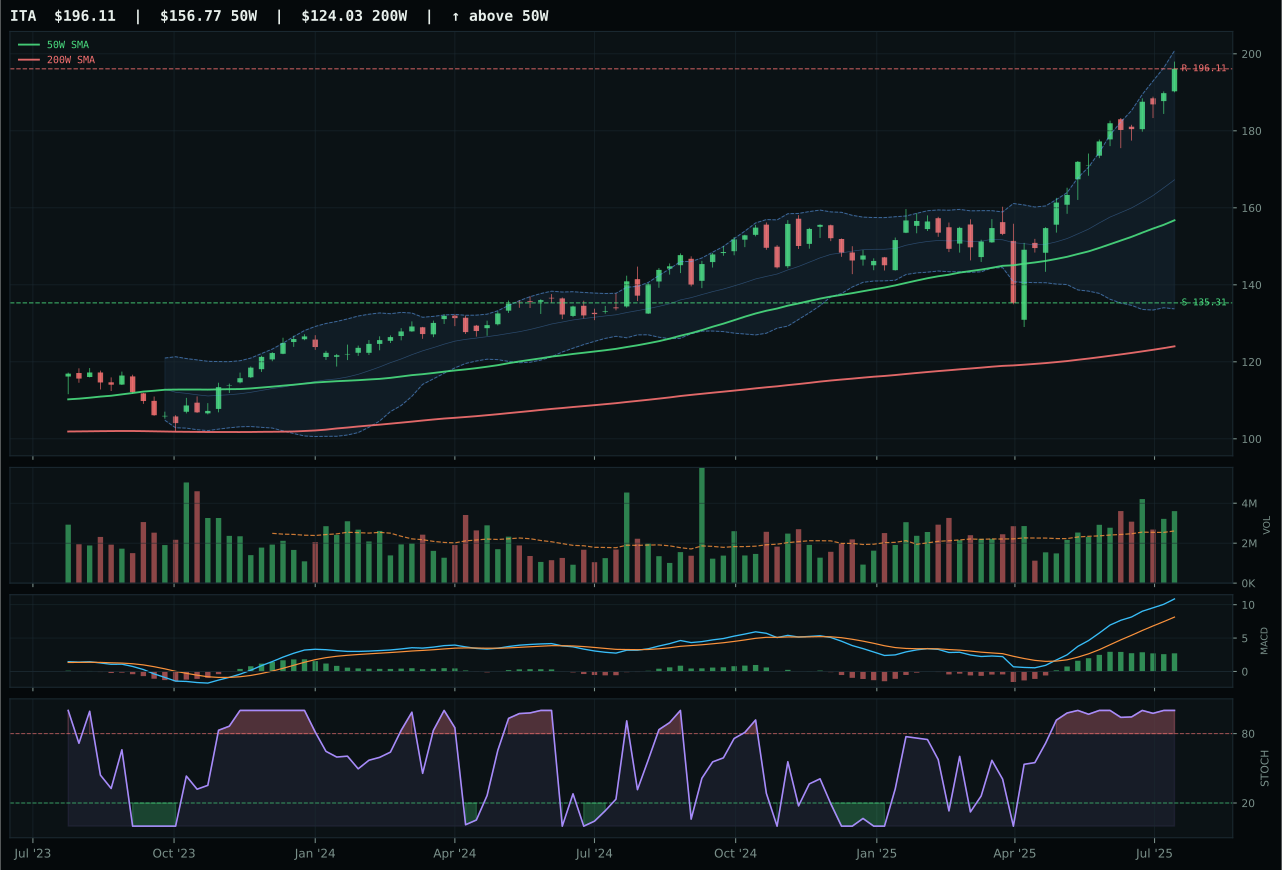
ITA has a vertical extension profile with 11.9% 13-week relative strength versus SPY.
A failed hold above support would weaken the setup.
Actionable but governed by invalidation levels.
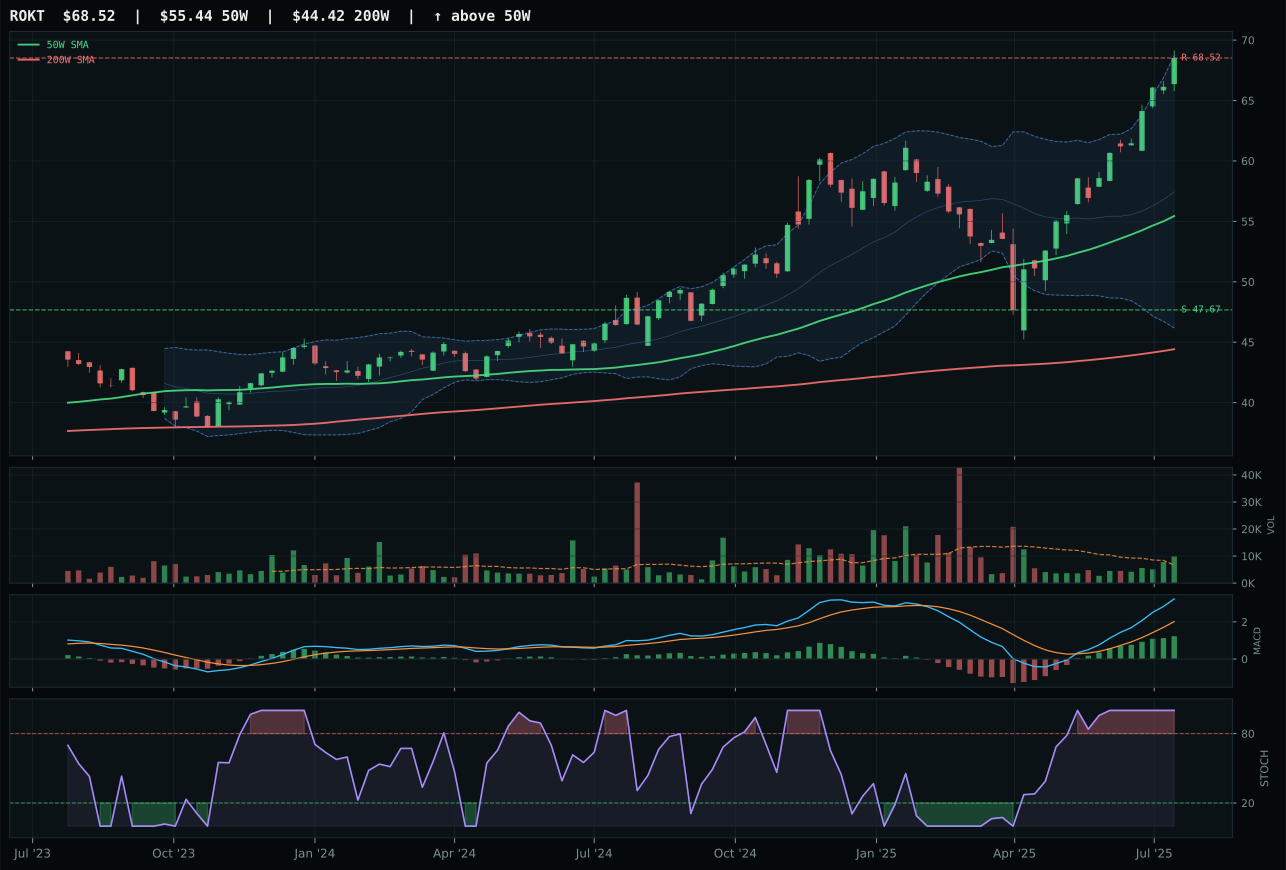
ROKT has a vertical extension profile with 14.8% 13-week relative strength versus SPY.
A failed hold above support would weaken the setup.
Tracked, but not top-2 eligible because: .
XAR captures the category by pairing near-perfect trend confirmation (100/100) with the highest volume-price conviction in the basket: accumulation/confirmation at 1.90x twenty-week average volume separates it clearly from ITA's above-average participation. The 36.5% thirteen-week return sits extended at 29.8% from the 50-week moving average, but that extension is being actively accumulated rather than distributed, shown in persistence scoring 94.1/100. Where ITA falters is on MACD: bullish but flattening versus XAR's bullish and improving, a signal that buying momentum is slowing in the defense-prime durability play while remaining intact in XAR's broader expression. The category-relative strength advantage of 2.5% for XAR versus negative 2.9% for ITA may appear marginal, but it reflects institutional accumulation into a setup that still has room to extend.
Defense & Aerospace earns 5% as tier-2, ranked below Industrial Metals and Nuclear Energy despite a respectable 65.9 category score. The allocation stems from macro fit that ranks 61/100, benefiting from Risk-Off Deterioration helping this exposure by seven points and Late-Cycle Reflation adding six more. Credit stress is actually neutral at plus two points for defense spending, a rare tailwind. Yet two stronger categories occupy the 10% top-2 slots, leaving XAR with sector-rotation capital rather than conviction allocation. The extended 29.8% distance from the 50-week moving average, combined with timing scoring only 37/100, means new entry risk is asymmetric to the downside at 53.4% to support. Hold 5% and monitor for XAR to consolidate back into the upper retracement zone; a fresh MACD cross above the signal line would merit a promotion to overweight.
AI — SMH
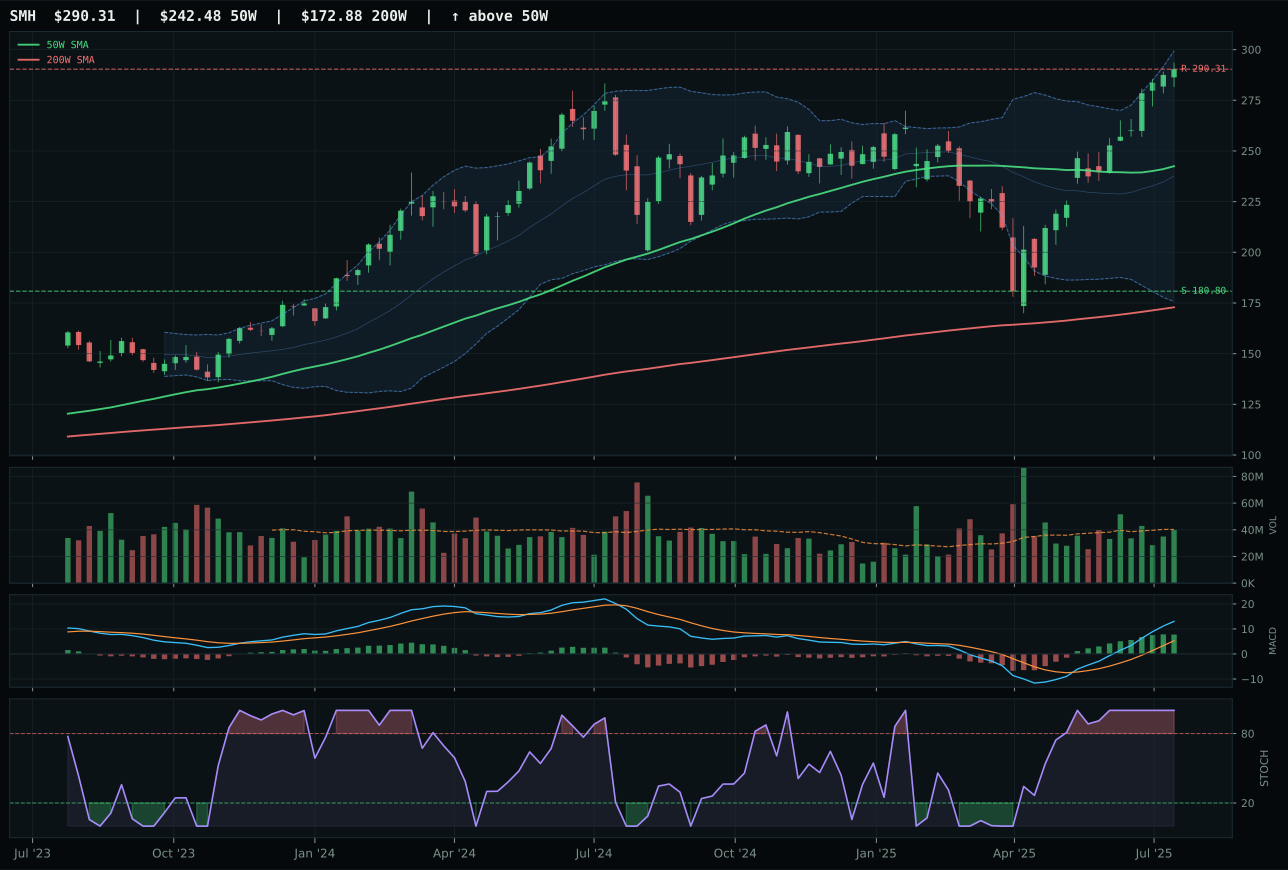
SMH has a vertical extension profile with 31.6% 13-week relative strength versus SPY.
A failed hold above support would weaken the setup.
Actionable but governed by invalidation levels.
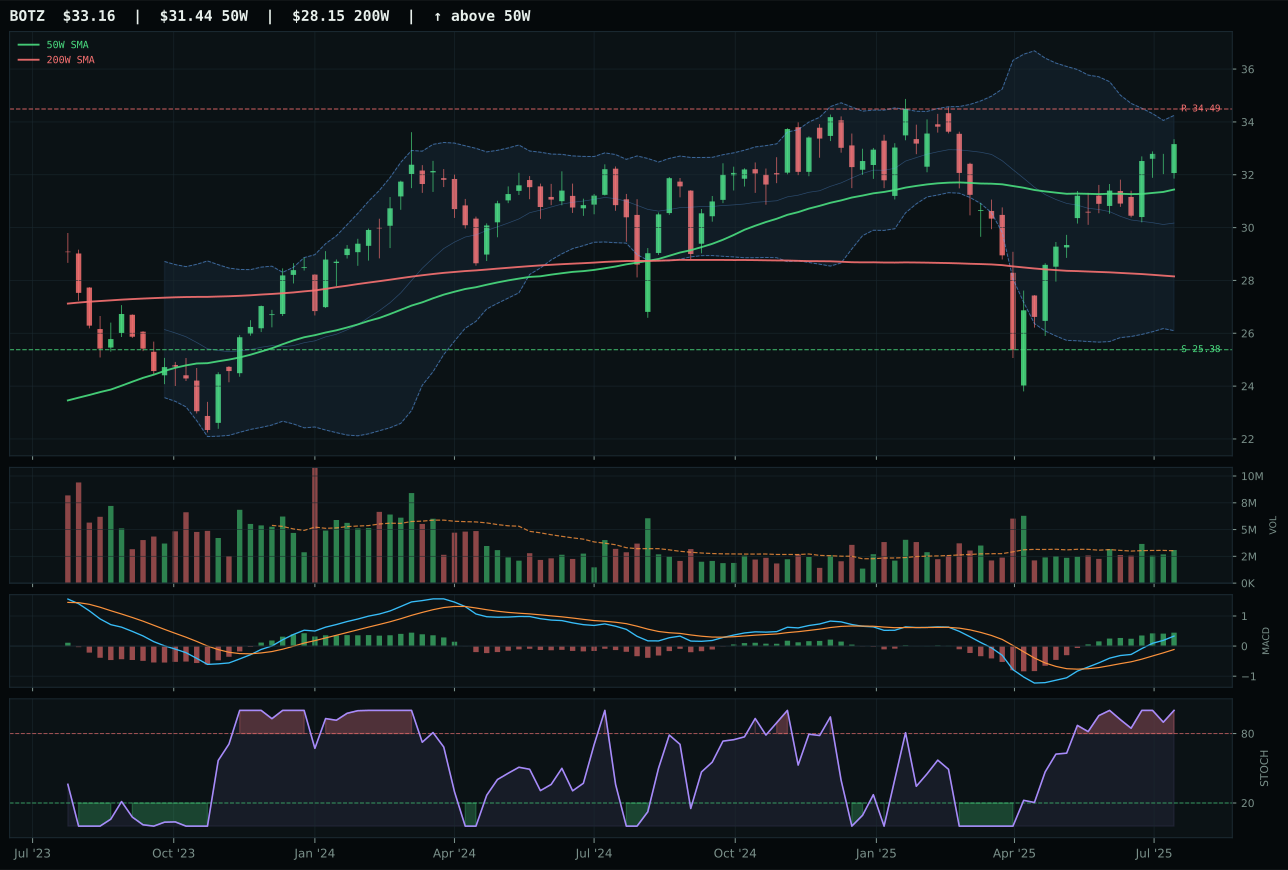
BOTZ has a neutral structure profile with 5.3% 13-week relative strength versus SPY.
A failed hold above support would weaken the setup.
Actionable but governed by invalidation levels.
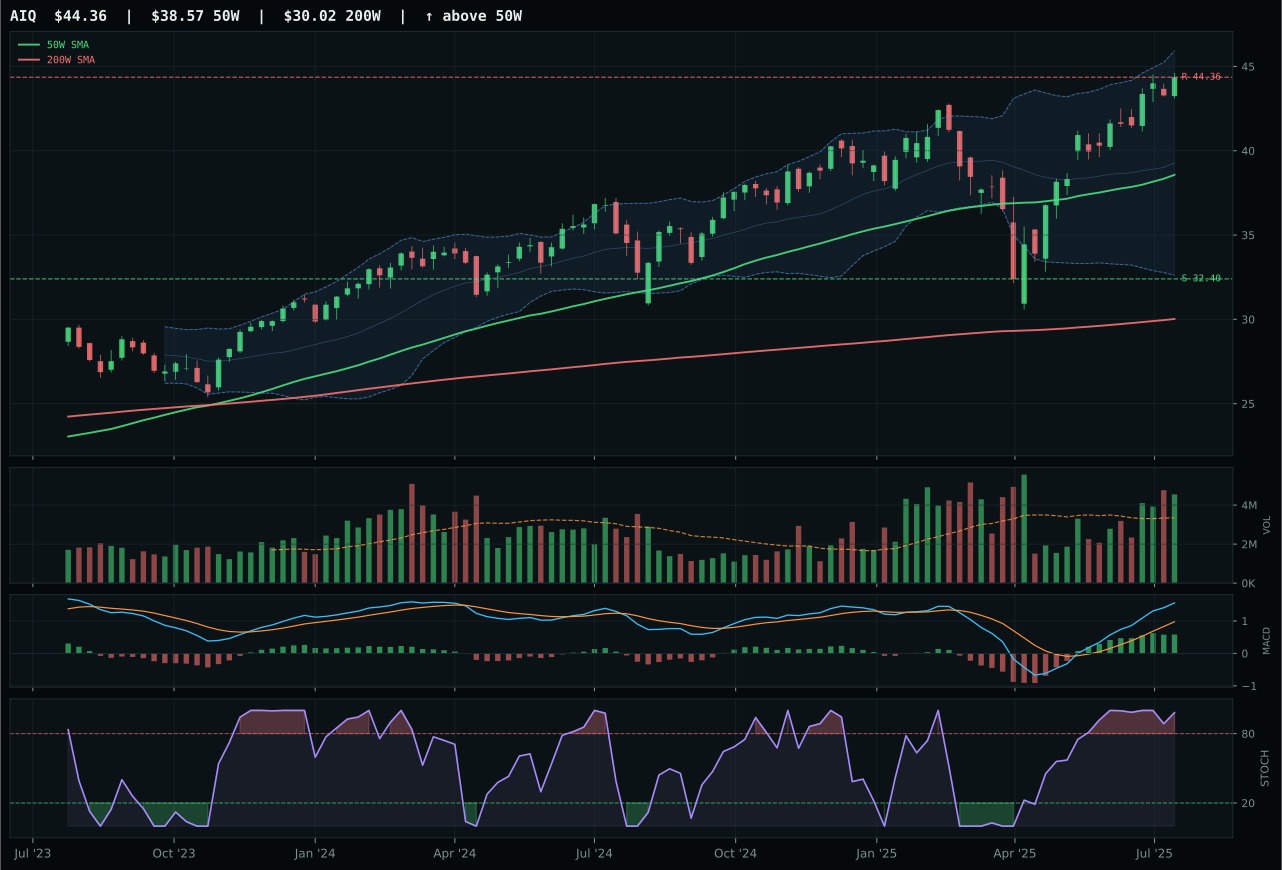
AIQ has a vertical extension profile with 11.6% 13-week relative strength versus SPY.
A failed hold above support would weaken the setup.
Actionable but governed by invalidation levels.
SMH wins despite its most obvious liability: a 50.8% thirteen-week return that puts the chart 19.7% extended from the 50-week moving average. That extension is precisely why the timing score falls to 37/100, yet momentum confirmation reaches a perfect 100 because category-relative strength of 19.9% towers over BOTZ's negative 6.3%—meaning every point of SMH's rally is being led by the semiconductor compute thesis, not scattered across robotics or other AI expressions. The 31.6% SPY-relative strength combined with persistence at 100/100 tells a story of consistent accumulation despite the entry risk: volume sits neutral, but MACD remains bullish and improving while BOTZ's only advantages are better timing (75 vs 37) and structure cleanliness (76.5 vs 82.4 inverted). Buyers are paying for leadership, not safety, and that leadership is real.
AI receives 5% as tier-2, subordinate to Industrial Metals and Nuclear Energy despite scoring 62.9 against their respective 71.3 and 78.5. The category's technical evidence of 77.1 (SMH's reasoned score) ranks solidly, but macro/narrative fit collapses to 44/100 because Risk-Off Deterioration costs ten points and liquidity stress shaves another twelve. The active 'AI growth sponsorship' descriptor adds fourteen points, partially offsetting the damage, yet credit stress removes eight more. SMH's overbought stochastic RSI at 1.00 and price in the upper retracement zone mean the setup demands immediate confirmation on any pullback or risk rolls over entirely. For AI to claim a top-2 slot, macro conditions must shift toward risk appetite or the category's leverage to liquidity stress must ease—currently neither has occurred.
Technology — XLK
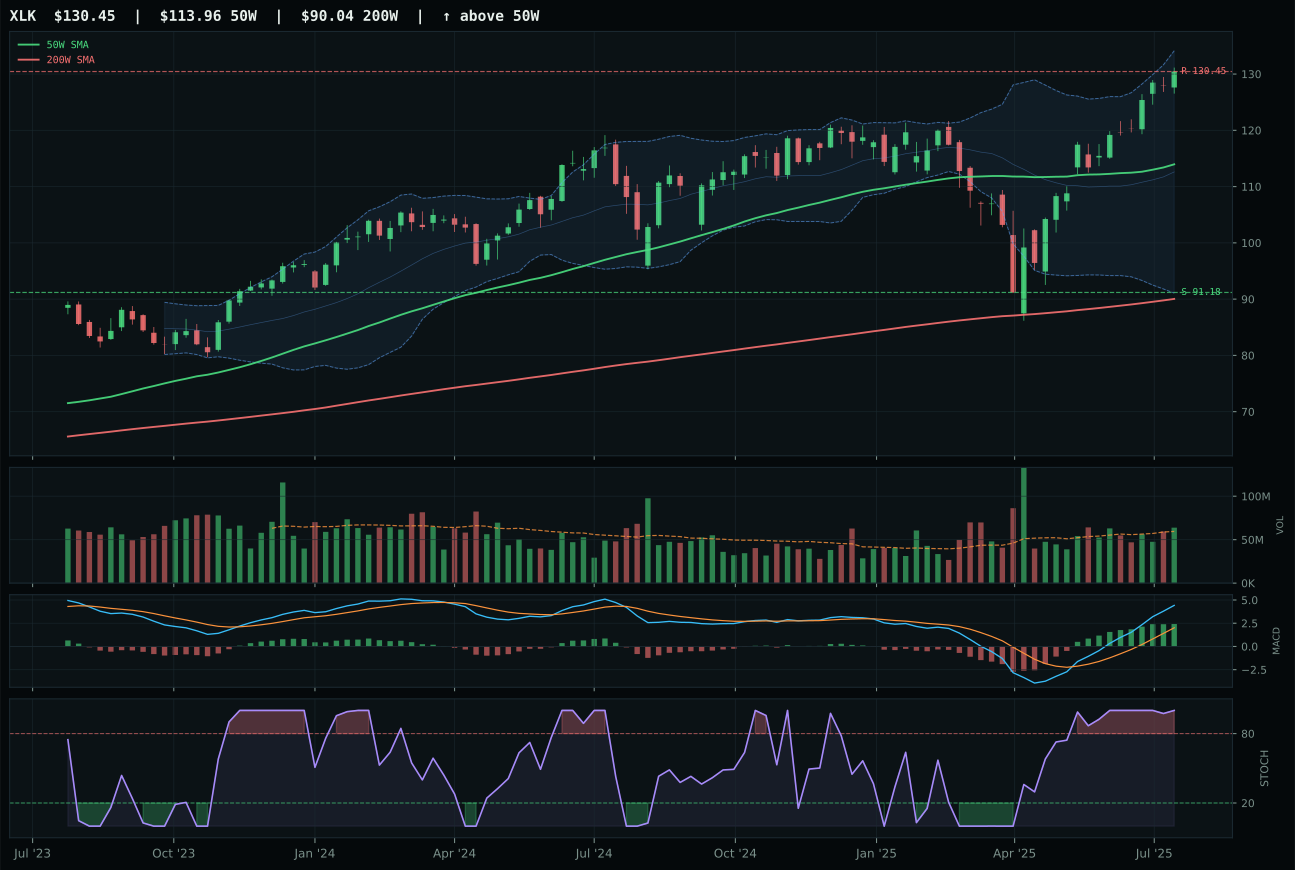
XLK has a neutral structure profile with 16.1% 13-week relative strength versus SPY.
A failed hold above support would weaken the setup.
Actionable but governed by invalidation levels.
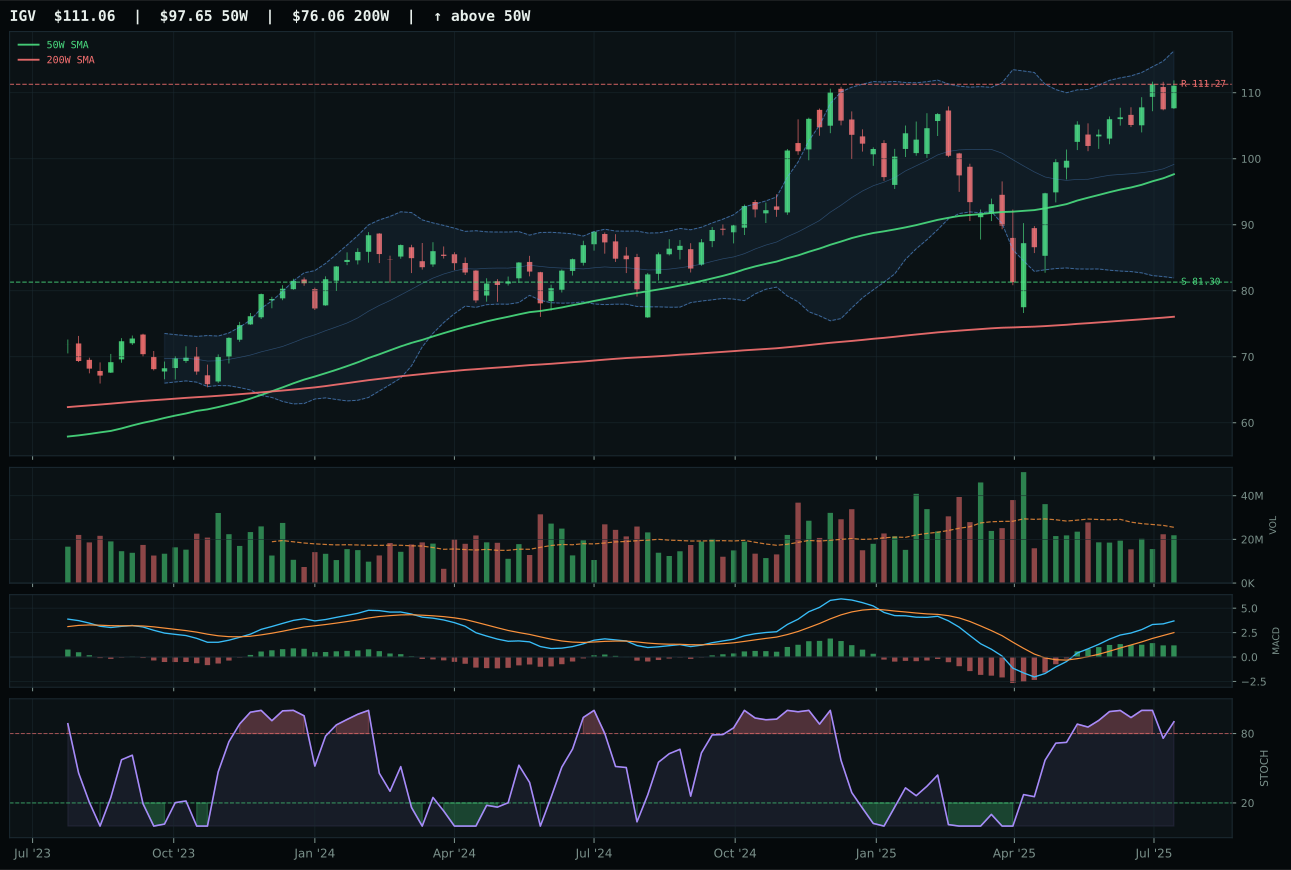
IGV has a neutral structure profile with 9.0% 13-week relative strength versus SPY.
A failed hold above support would weaken the setup.
Actionable but governed by invalidation levels.
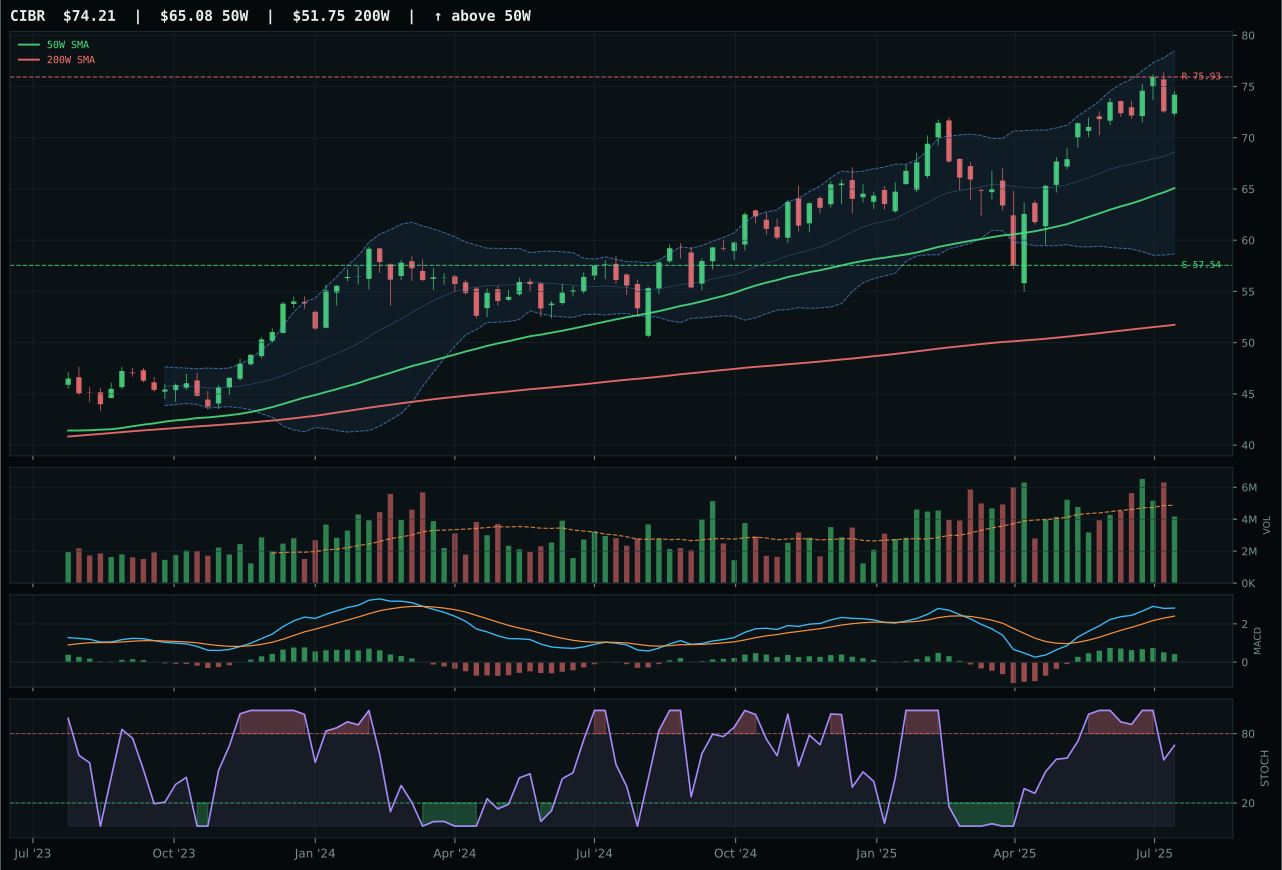
CIBR has a neutral structure profile with 0.9% 13-week relative strength versus SPY.
A failed hold above support would weaken the setup.
Actionable but governed by invalidation levels.
XLK wins the category by delivering cleaner momentum confirmation than its peers in a risk-off environment. The 16.1% relative strength advantage over SPY combined with a 35.3% thirteen-week return demonstrates real buying pressure, and the 7.0% category-relative strength edge over IGV proves XLK is capturing the best of profitable technology leadership. Timing separates the winner here: XLK sits at optimal distance from the 50-week moving average at 14.7% extension with MACD bullish and improving, while IGV's MACD is already flattening and stochastic RSI rolling over, signaling fatigue in the setup. Volume sits neutral across both, so the structural advantage belongs to XLK's cleaner 83.3 compression score versus IGV's 79.2—a small but persistent edge in chart integrity that matters when entry risk rises.
Technology earns 5% allocation as a tier-2 category, ranking below the top two overweights but justifying its position against the current macro regime. Risk-Off Deterioration penalizes growth exposure by five points, yet the active 'risk appetite positive' descriptor adds nine, creating a wash that keeps the category neutral in a defensive tape. The real issue is execution: XLK's technical evidence scores 92.5/100, but category-level macro fit only reaches 39/100 because liquidity stress and credit stress are active headwinds worth ten and seven points respectively. With two categories (Nuclear Energy and Industrial Metals) scoring above 70 and both carrying stronger macro sponsorship, Technology must yield to them despite having cleaner individual technicals. Push XLK back to a setup closer to support with fresh MACD confirmation and the category advances.
Utilities & Infrastructure — PAVE
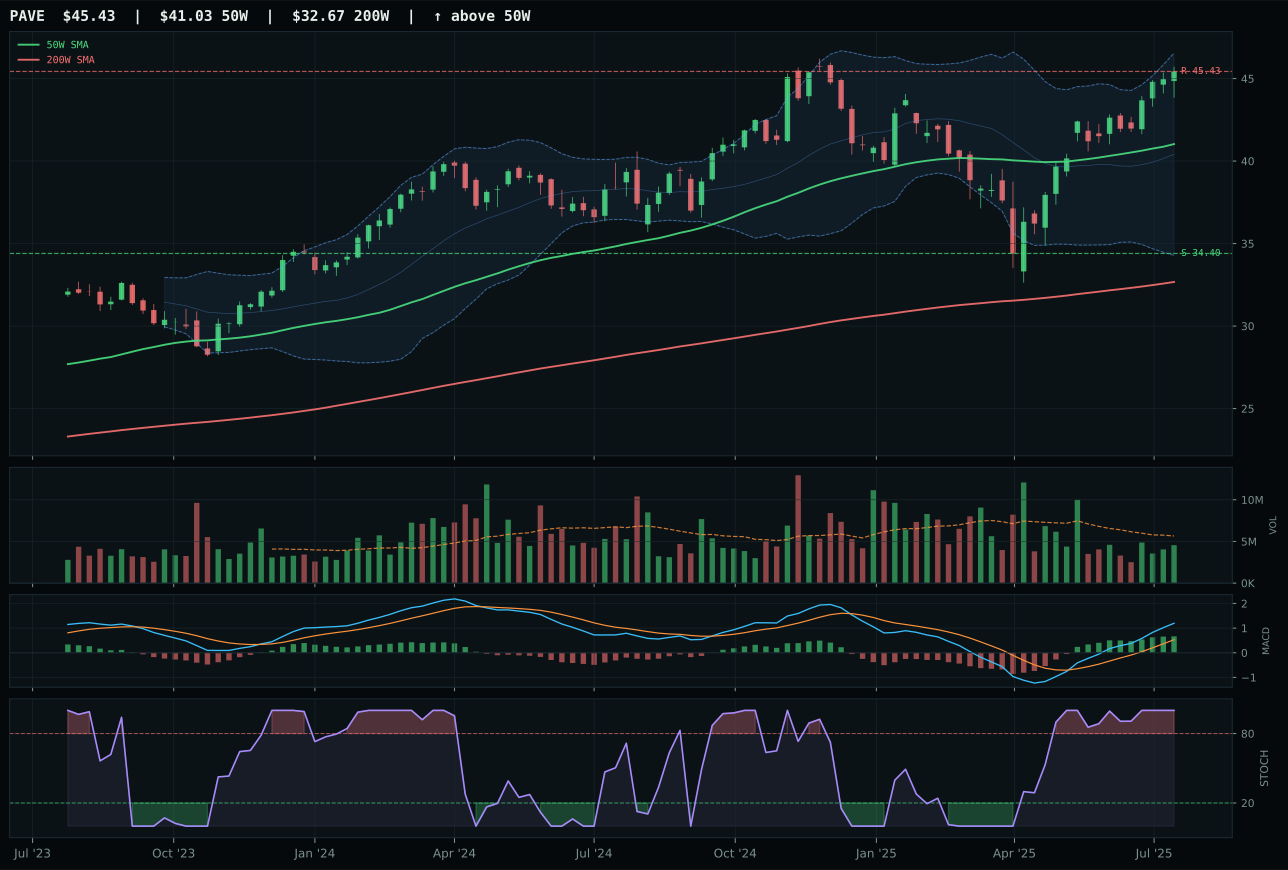
PAVE has a neutral structure profile with 6.2% 13-week relative strength versus SPY.
A failed hold above support would weaken the setup.
Actionable but governed by invalidation levels.
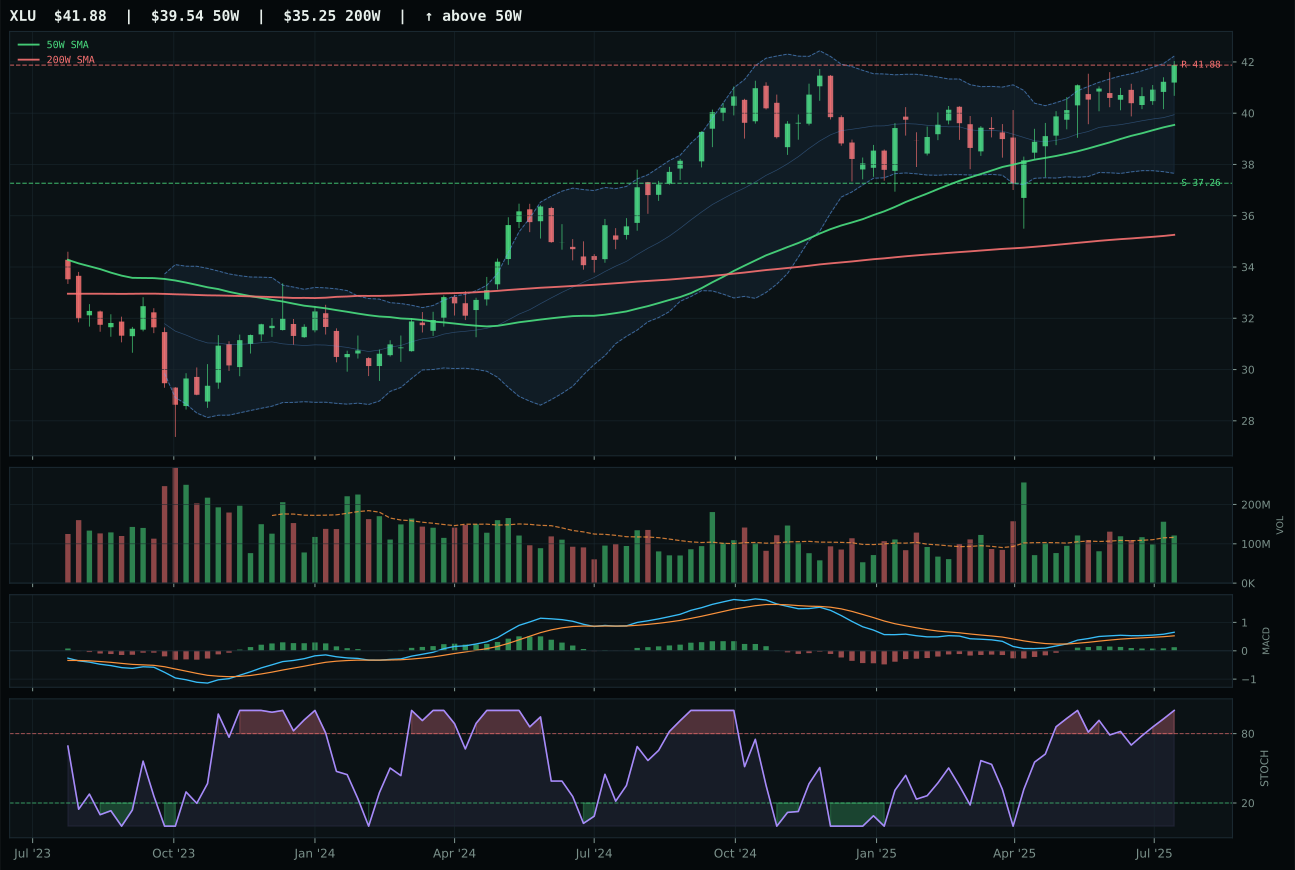
XLU has a neutral structure profile with -11.5% 13-week relative strength versus SPY.
A failed hold above support would weaken the setup.
Actionable but governed by invalidation levels.
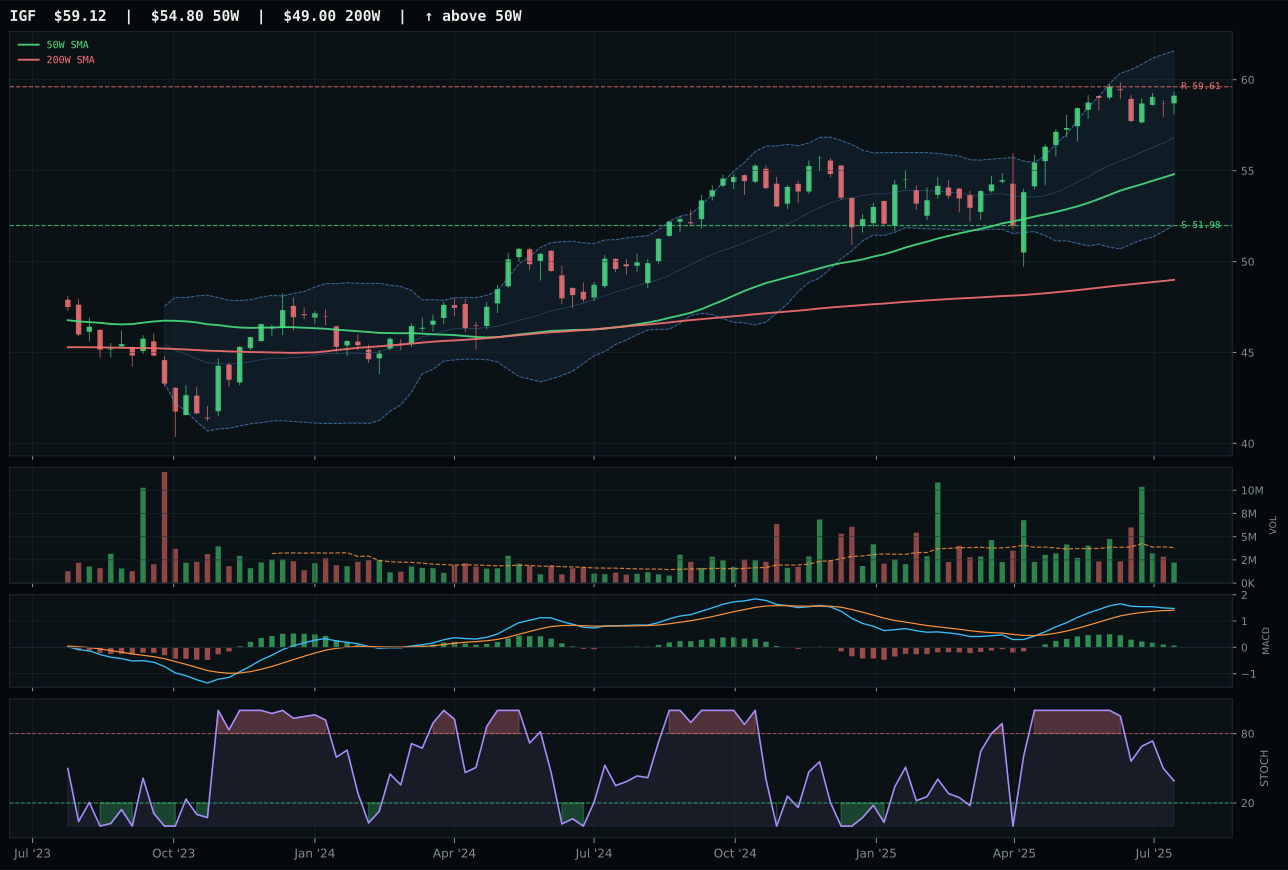
IGF has a neutral structure profile with -12.6% 13-week relative strength versus SPY.
A failed hold above support would weaken the setup.
Actionable but governed by invalidation levels.
PAVE wins by delivering 17.8% category-relative strength against XLU's zero, meaning the infrastructure capex narrative is outperforming regulated utility defense in the current cycle. PAVE's structure ranks 81.8/100 versus XLU's 80.1, and cleanliness of 83.3 exceeds XLU's slightly lower integrity, but the real separation comes from momentum confirmation at 100/100 for PAVE versus 56/100 for XLU. PAVE sits 10.7% extended from the fifty-week moving average in the optimal timing zone (59/100 for PAVE versus 75/100 for XLU inverted as a quality measure), and volume-price confirmation reaches 89.3/100 with persistent accumulation. The near fifty-two week high signal in the extension zone for both, yet PAVE's neutral volume at 0.80x twenty-week average means the move retains expansion potential, whereas XLU's neutral volume combined with negative SPY-relative strength of minus 11.5% suggests defensive rotation rather than domestic growth accumulation.
Utilities & Infrastructure earns 5% as tier-2, ranking 55.8 and sixth among the ten categories. Macro fit reaches 47/100, with Risk-Off Deterioration helping the exposure by eight points (defensive shelter), offsetting inflation pressure's minus six penalty and liquidity stress's minus three. PAVE's technical evidence of 92.5/100 stands among the portfolio's highest, yet it ranks below two categories (Nuclear Energy and Industrial Metals) that score above 70 in final category strength. The allocation reflects PAVE's clean momentum and infrastructure theme relevance without claiming conviction status. Risk/reward at 41.5/100 shows limited upside to the 45.43 resistance but downside of 32.1% to support, a profile suited to defensive positioning rather than alpha capture. Maintain the 5% and monitor for PAVE's price to consolidate and form a higher low near support (34.40) with MACD maintaining its bullish slope; a test of the fifty-two week high near 43.00 with fresh volume confirmation would elevate this category to overweight consideration.
Traditional Energy — XLE
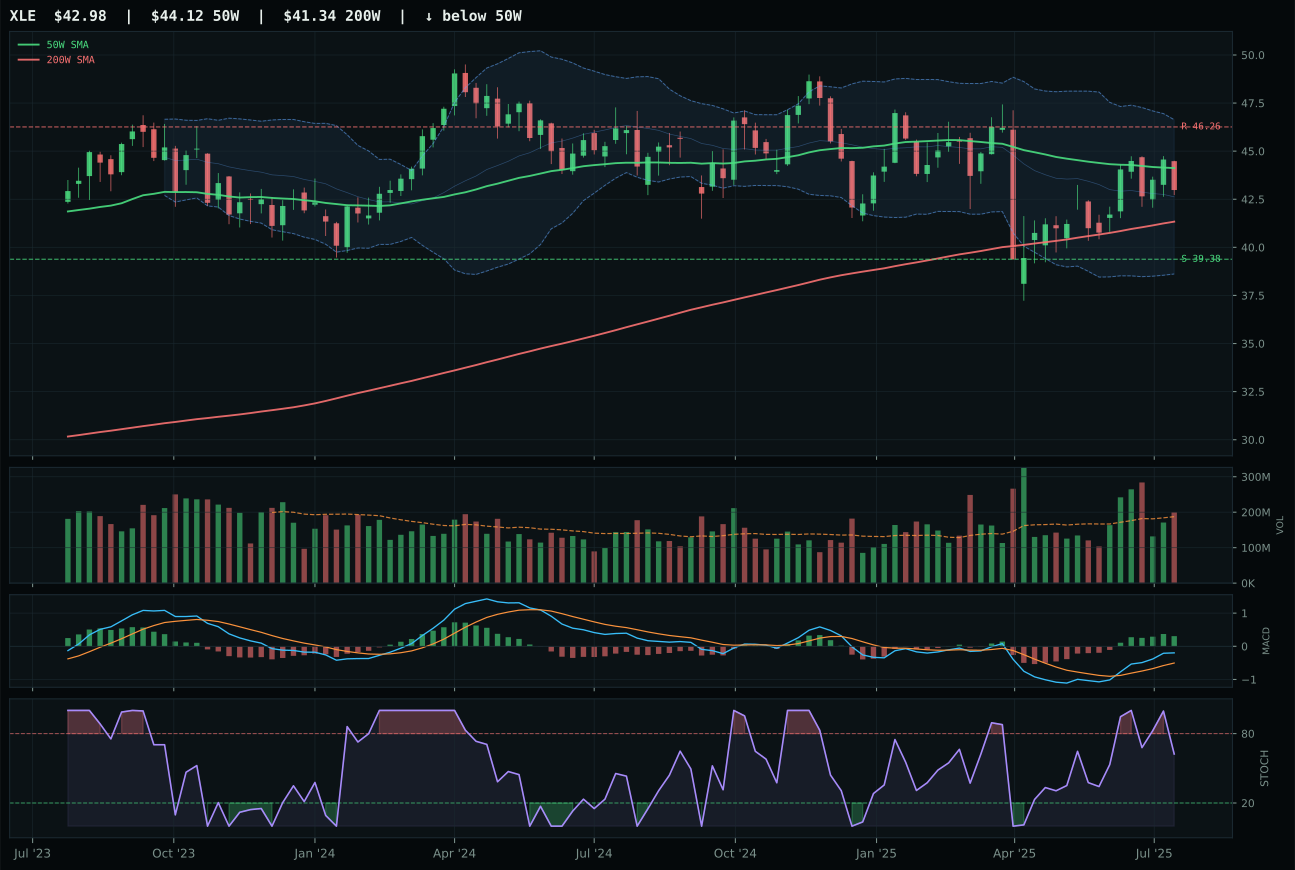
XLE has a compression near 50W profile with -13.7% 13-week relative strength versus SPY.
A failed hold above support would weaken the setup.
Actionable but governed by invalidation levels.
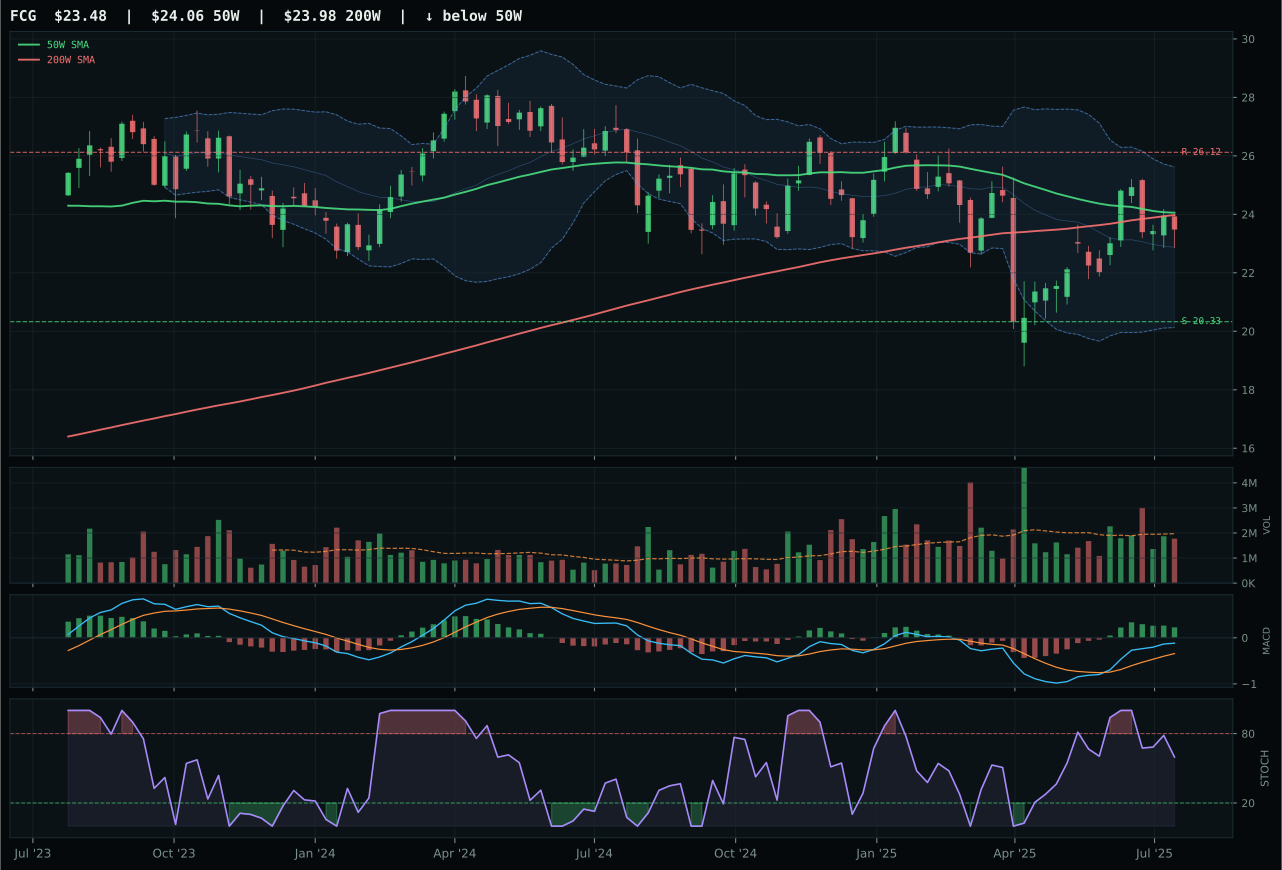
FCG has a compression near 50W profile with -9.3% 13-week relative strength versus SPY.
A failed hold above support would weaken the setup.
Actionable but governed by invalidation levels.
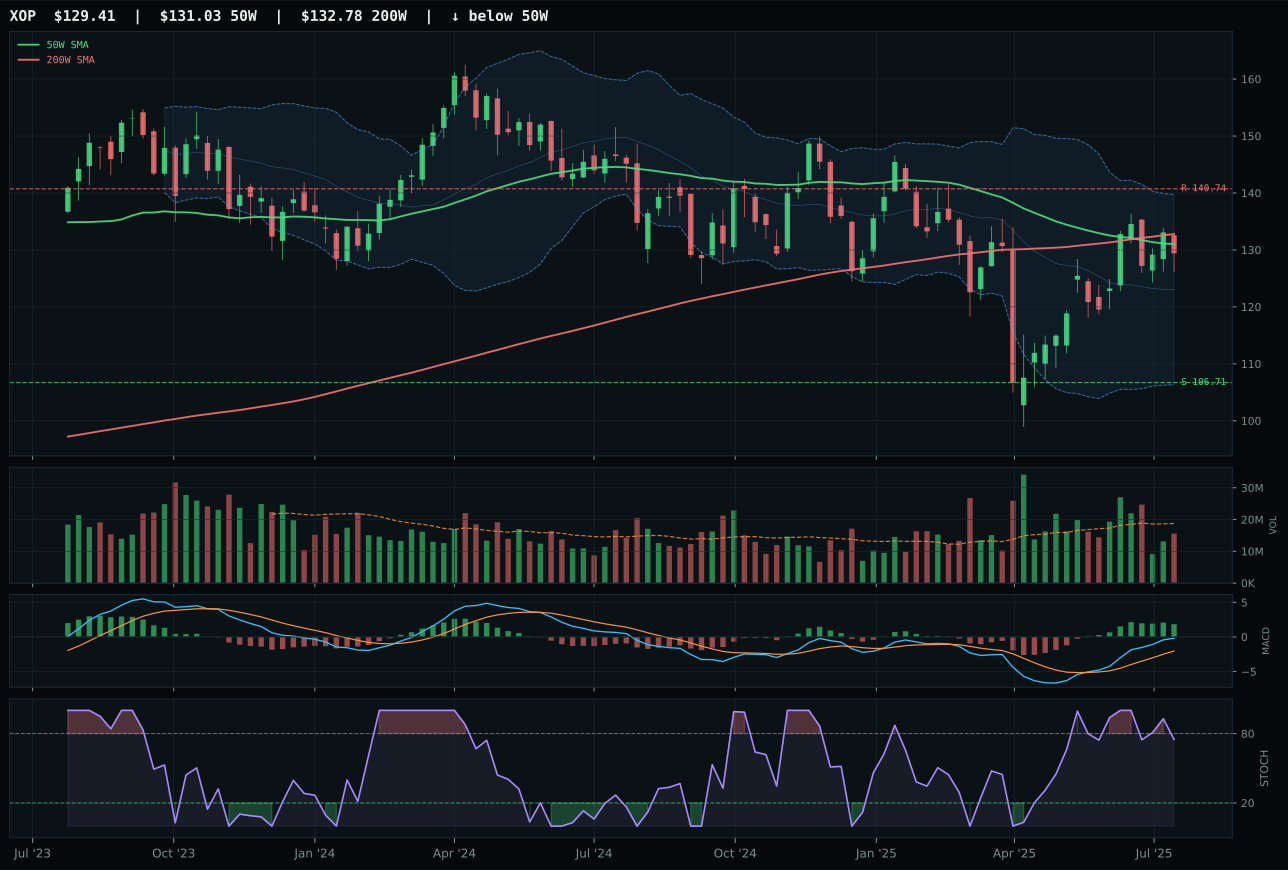
XOP has a compression near 50W profile with -3.6% 13-week relative strength versus SPY.
Extension and support failure are the main tactical risks.
Tracked, but not top-2 eligible because: structurally broken.
XLE wins the category not by strength but by resilience: price sits 2.5% below the 50-week moving average in a compression setup, yet MACD is bullish and improving while stochastic RSI falls neutral, creating a mean-reversion configuration with timing scoring a perfect 100/100. FCG's only structural advantage comes from a weaker 95/100 timing score despite sharing the same compression setup, because its MACD is bullish but flattening—a subtle but decisive fade in confirmation. XLE's 5.5% thirteen-week return sits near flat on SPY-relative strength at minus 13.7%, meaning this is a reset play, not a momentum extension. The category-relative strength advantage of minus 4.5% for XLE versus zero for FCG is negative absolute but positive relative, a sign that XLE is holding better against a broad energy sector pullback. Volume sits neutral for both, so the win belongs entirely to MACD durability and the opportunity to accumulate a beaten-down sector expression.
Traditional Energy receives 5% as tier-2, ranked sixth despite scoring only 44.7, because macro fit reaches 80/100 with energy scarcity worth sixteen points, inflation pressure adding ten, and supply shortage contributing nine. Late-Cycle Reflation adds twelve points, offsetting the minus ten penalty from Risk-Off Deterioration. Yet XLE's technical evidence of only 53.8/100 reflects the pullback into support: price is below the 50-week moving average, momentum confirmation reaches only 30.8/100, and volume-price confirmation at 33.4/100 signals accumulation has not yet restarted. The 100/100 timing score reflects proximity to decision point, not confirmed strength. Allocate 5% as a hedge against further risk-off compression forcing yield and energy supply themes higher; if XLE breaks above the 50-week moving average with fresh MACD confirmation and volume above 1.2x twenty-week average, the allocation candidate for promotion to 10% emerges.
Precious Metals — SLV
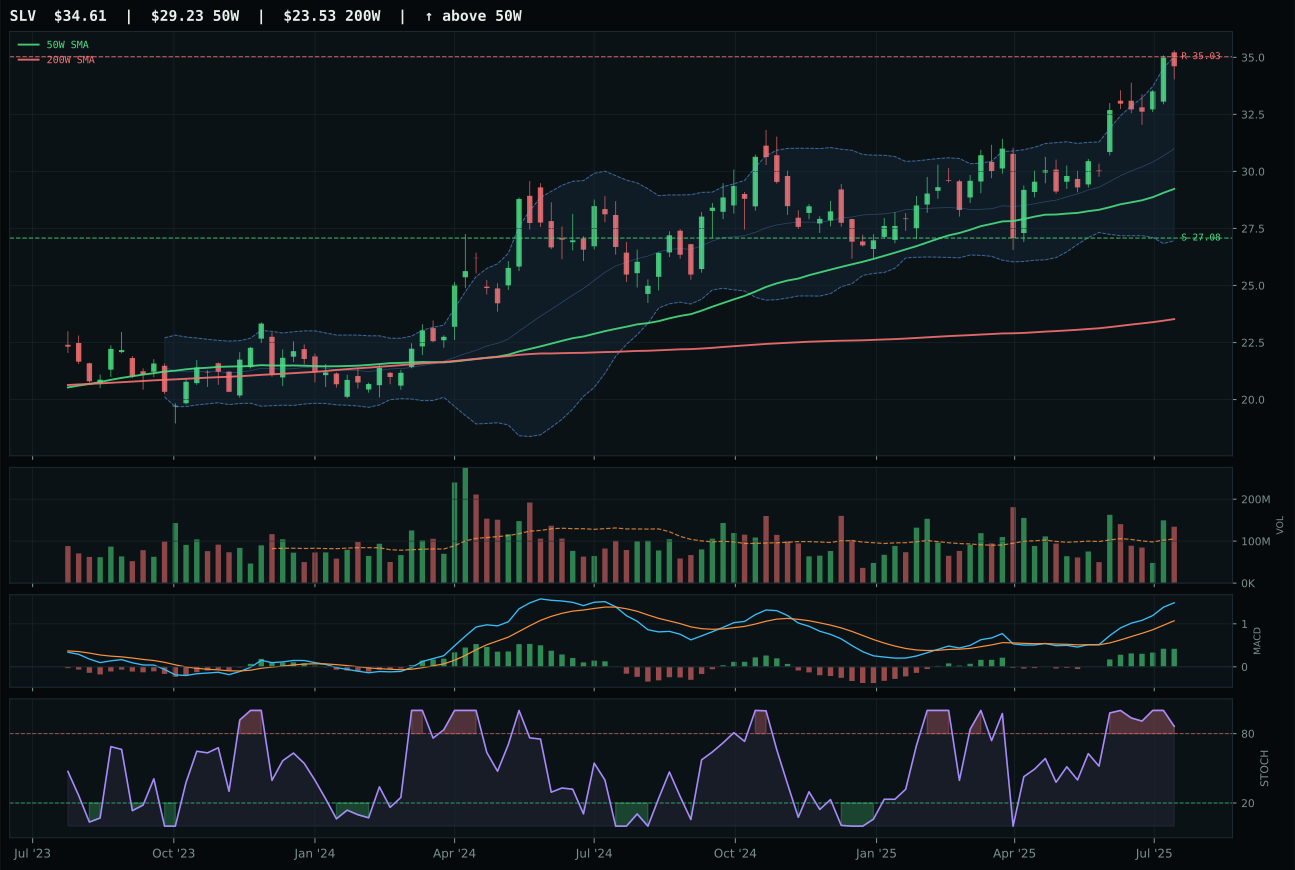
SLV has a vertical extension profile with -2.1% 13-week relative strength versus SPY.
A failed hold above support would weaken the setup.
Actionable but governed by invalidation levels.
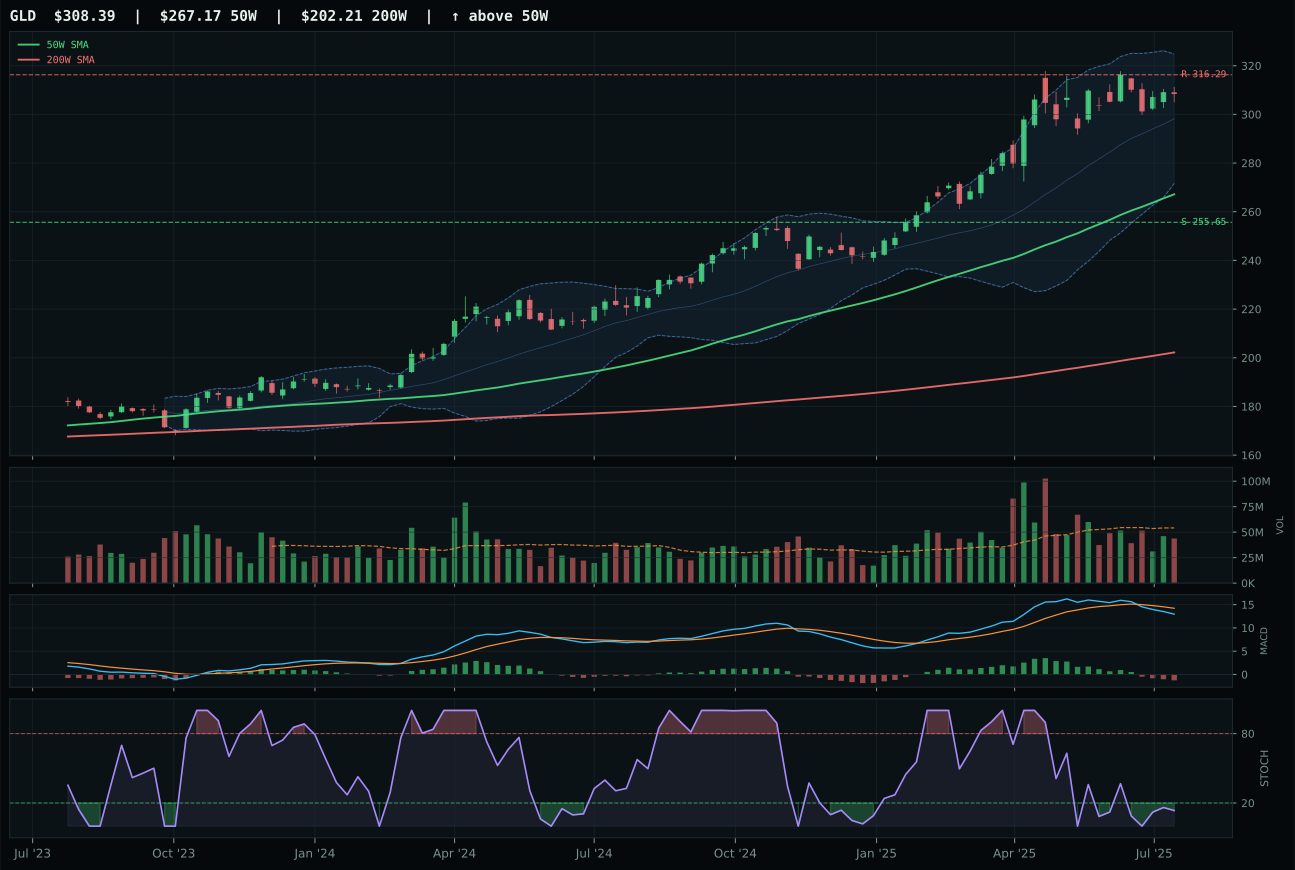
GLD has a vertical extension profile with -18.5% 13-week relative strength versus SPY.
A failed hold above support would weaken the setup.
Actionable but governed by invalidation levels.
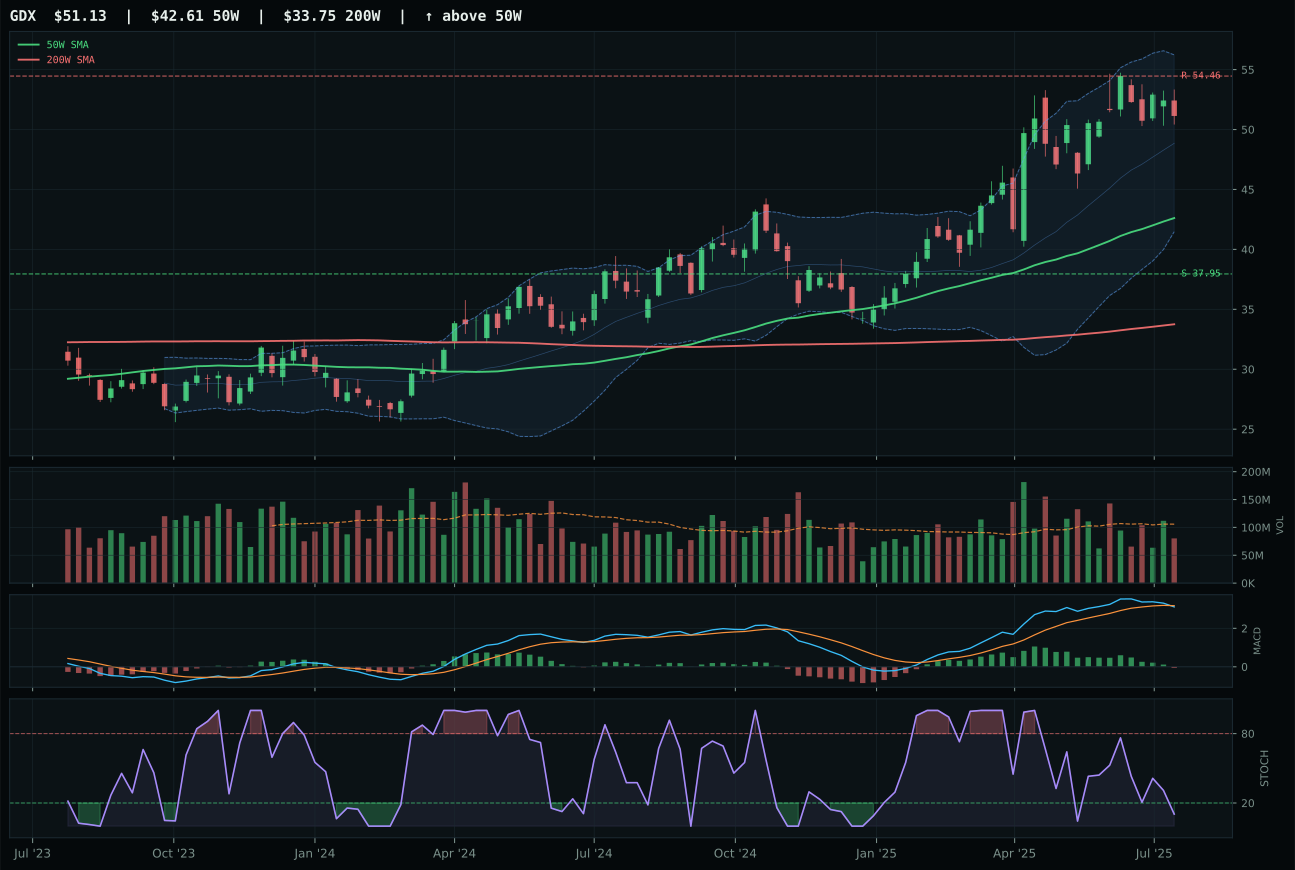
GDX has a vertical extension profile with -18.8% 13-week relative strength versus SPY.
A failed hold above support would weaken the setup.
Actionable but governed by invalidation levels.
SLV wins the category with category-relative strength of 16.4% that dwarfs GLD's zero percent—a clear signal that silver's hybrid monetary and industrial beta is capturing the scarcity narrative while gold's clean monetary hedge lags. SLV's momentum confirmation reaches 100/100 despite extended pricing at 18.4% from the 50-week moving average, because above-average participation volume at 1.28x twenty-week average proves accumulation into the strength. GLD's MACD has rolled bearish and weakening, stochastic RSI is oversold rolling up, and volume sits neutral—a bounce setup masquerading as strength. The structure difference is small (SLV 74.5 vs GLD 71.8), but SLV's cleanliness of 50.0 captures the industrial demand case better than GLD's bearish momentum action. At the margin, buyers prefer the metal with industrial utility and inflation linkage when monetary metals are contested.
Precious Metals receives 5% as tier-2, ranking below top-2 categories but justified by its 54/100 macro fit benefiting from Risk-Off Deterioration at plus eight points. Yet the category score of only 36.8 reflects a wider technical surrender: GLD's technical evidence of just 20.5/100 drags the 3/2/1 weighted basket despite SLV's 77.2. The extended setup at 18.4% from the 50-week moving average combined with timing of only 27/100 suggests the rally has outrun near-term conviction. Risk/reward at 37.8/100 shows downside to support at 27.8% against minimal upside, a profile suitable for 5% defensive allocation but not overweight. SLV must consolidate and retest support at 27.08 with MACD holding above the signal line to earn consideration for a larger role; until then, the precious metals thesis remains tactically positioned rather than strategically committed.
Agriculture & Livestock — MOO
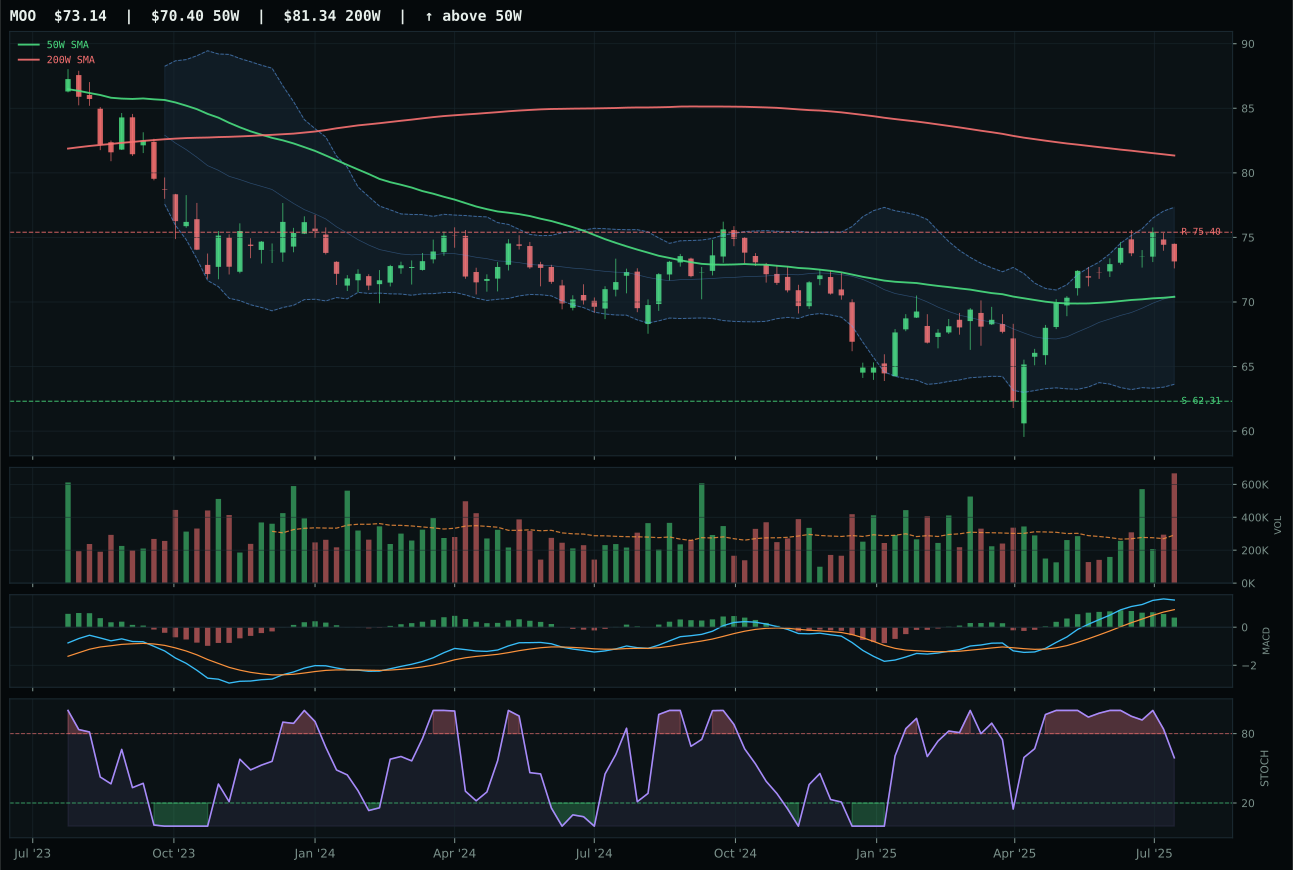
MOO has a neutral structure profile with -8.5% 13-week relative strength versus SPY.
A failed hold above support would weaken the setup.
Actionable but governed by invalidation levels.
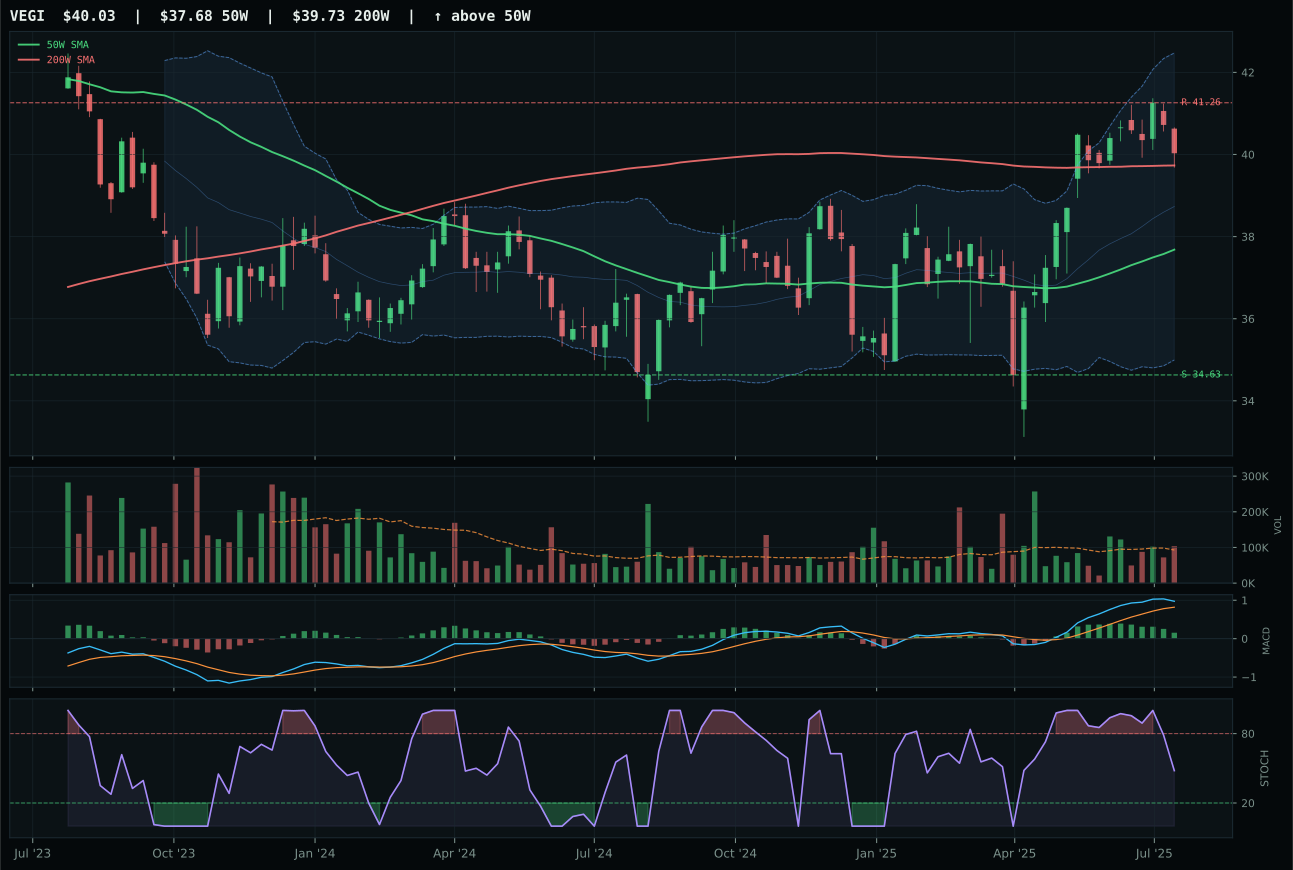
VEGI has a neutral structure profile with -10.0% 13-week relative strength versus SPY.
A failed hold above support would weaken the setup.
Tracked, but not top-2 eligible because: .
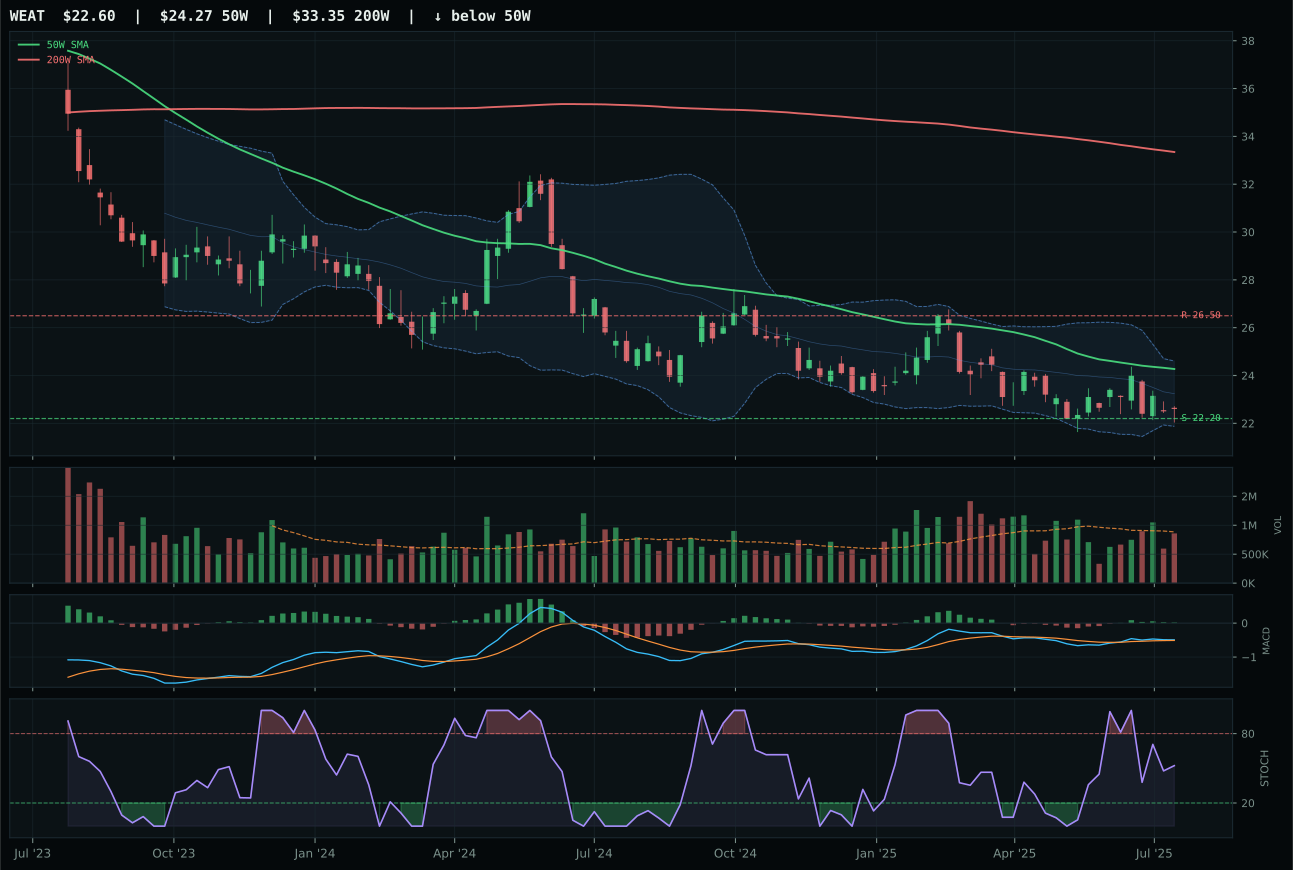
WEAT has a pullback into support profile with -24.3% 13-week relative strength versus SPY.
Extension and support failure are the main tactical risks.
Tracked, but not top-2 eligible because: structurally broken.
MOO wins the category despite the lowest technical evidence score of any portfolio holding at 28.9/100, a reflection of price sitting above the 50-week moving average but below the 200-week—the hallmark of a recovery attempt without confirmed uptrend. The win comes through timing optimization: MOO sits only 3.9% from the 50-week moving average in the upper retracement zone, scoring 85/100 on timing despite MACD flattening and stochastic RSI falling neutral. The 2.28x twenty-week volume at distribution pressure signals selling, not buying, yet category-relative strength of 1.5% edges out VEGI's 0.0%, and timing edge of 15 points (85 vs 70) proves decisive. This is not a category won on strength but on mean-reversion positioning: MOO offers the least-bad setup to fade into agricultural demand if supply pressures persist.
Agriculture & Livestock receives 0% allocation this week, excluded entirely from the portfolio despite ranking ninth. The category scores only 33.9, pulled down by technical evidence that averages 28.9 for MOO and worsens across the basket. Risk-Off Deterioration costs five points, and while macro fit reaches 90/100 thanks to supply shortage (+13), inflation pressure (+10), and real asset sponsorship (+8), the category lacks the relative strength or chart integrity to overcome the regime headwind. Price action shows distribution pressure, flattening MACD, and falling stochastics across all three ETFs, meaning the entire basket is stuck between two moving averages. Supply shortage is real, yet the portfolio has already captured that thesis through COPX and URA with cleaner setups. For MOO to earn allocation, either price must break definitively above the 200-week moving average or MACD must restart its bull cycle with fresh institutional accumulation—neither has occurred.
Emerging Markets — IEMG
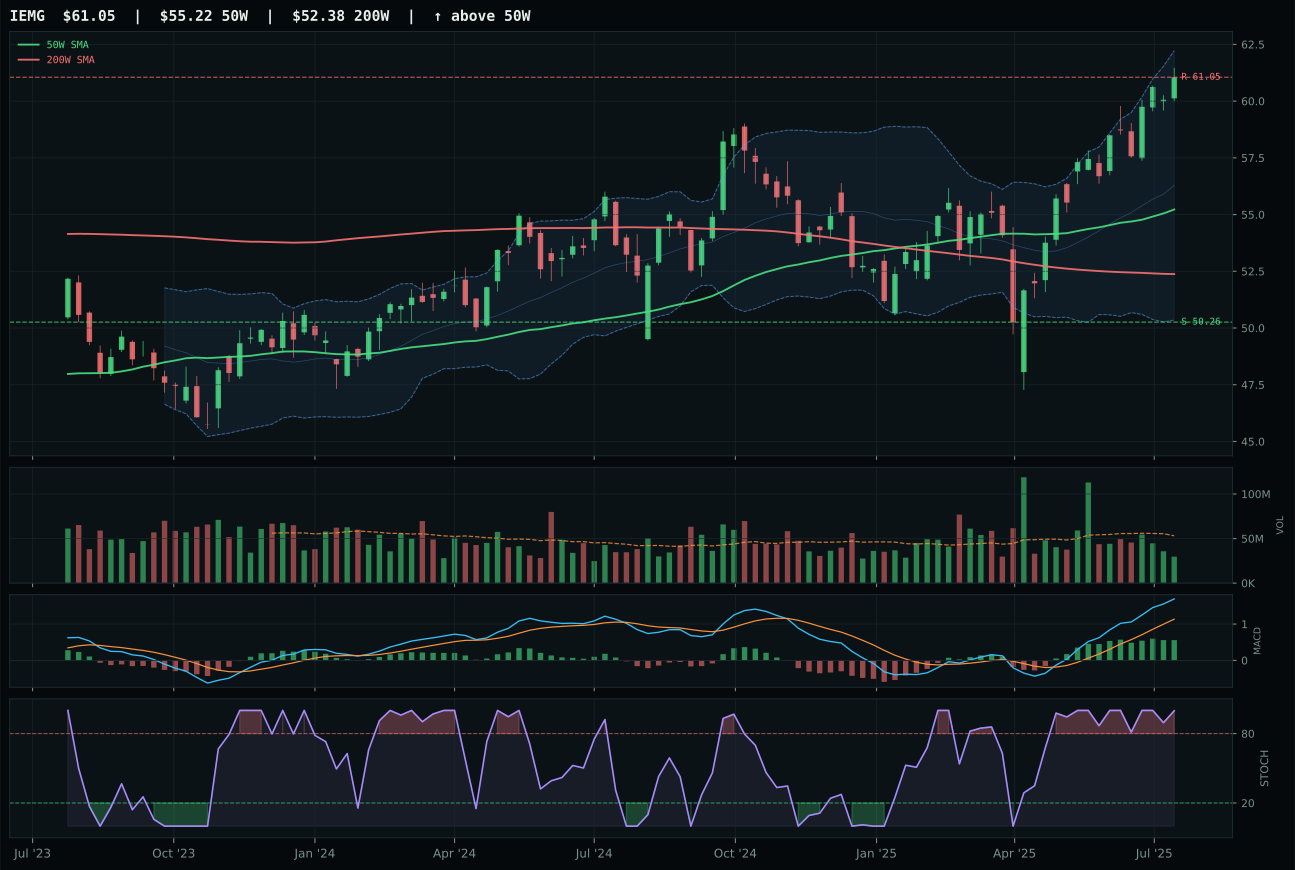
IEMG has a neutral structure profile with -1.7% 13-week relative strength versus SPY.
A failed hold above support would weaken the setup.
Actionable but governed by invalidation levels.
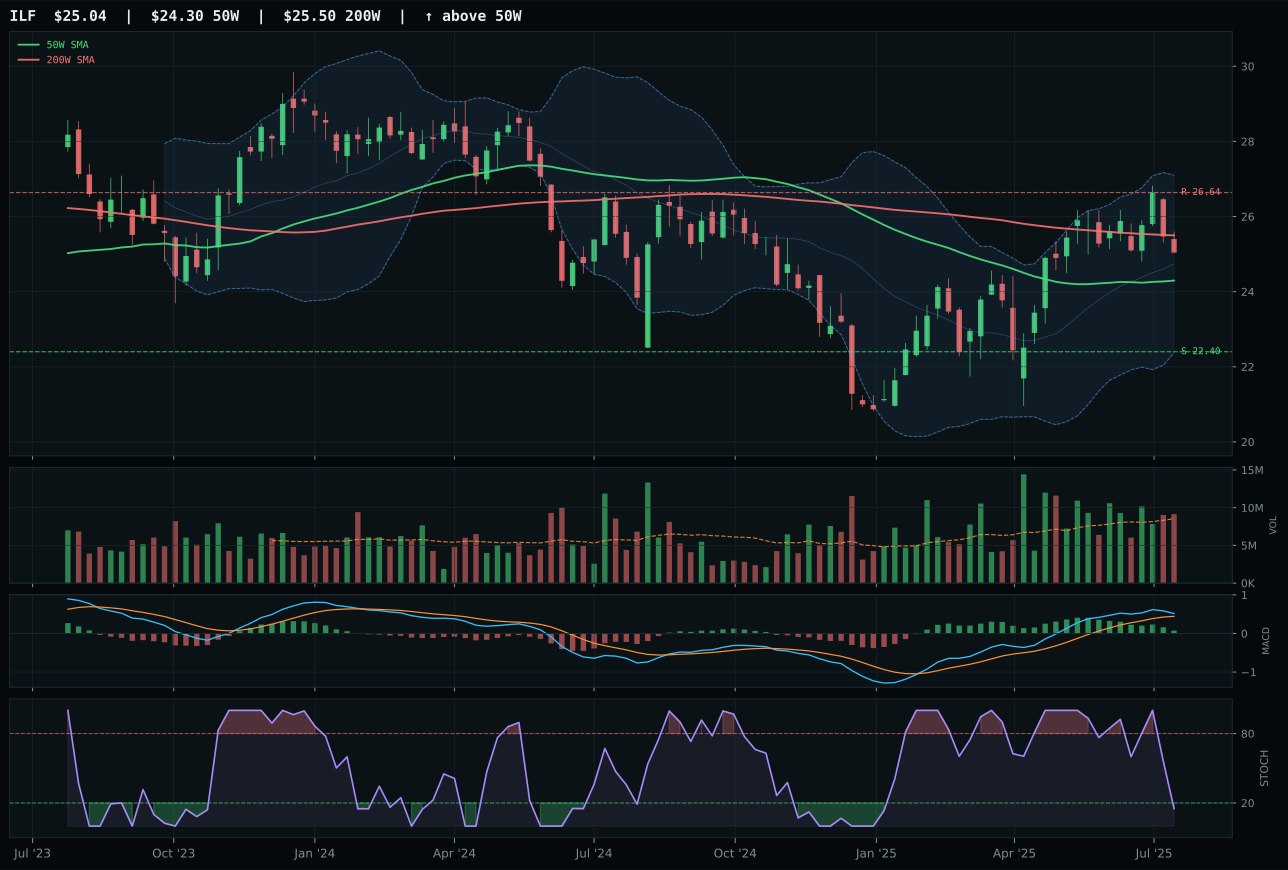
ILF has a neutral structure profile with -12.4% 13-week relative strength versus SPY.
A failed hold above support would weaken the setup.
Actionable but governed by invalidation levels.
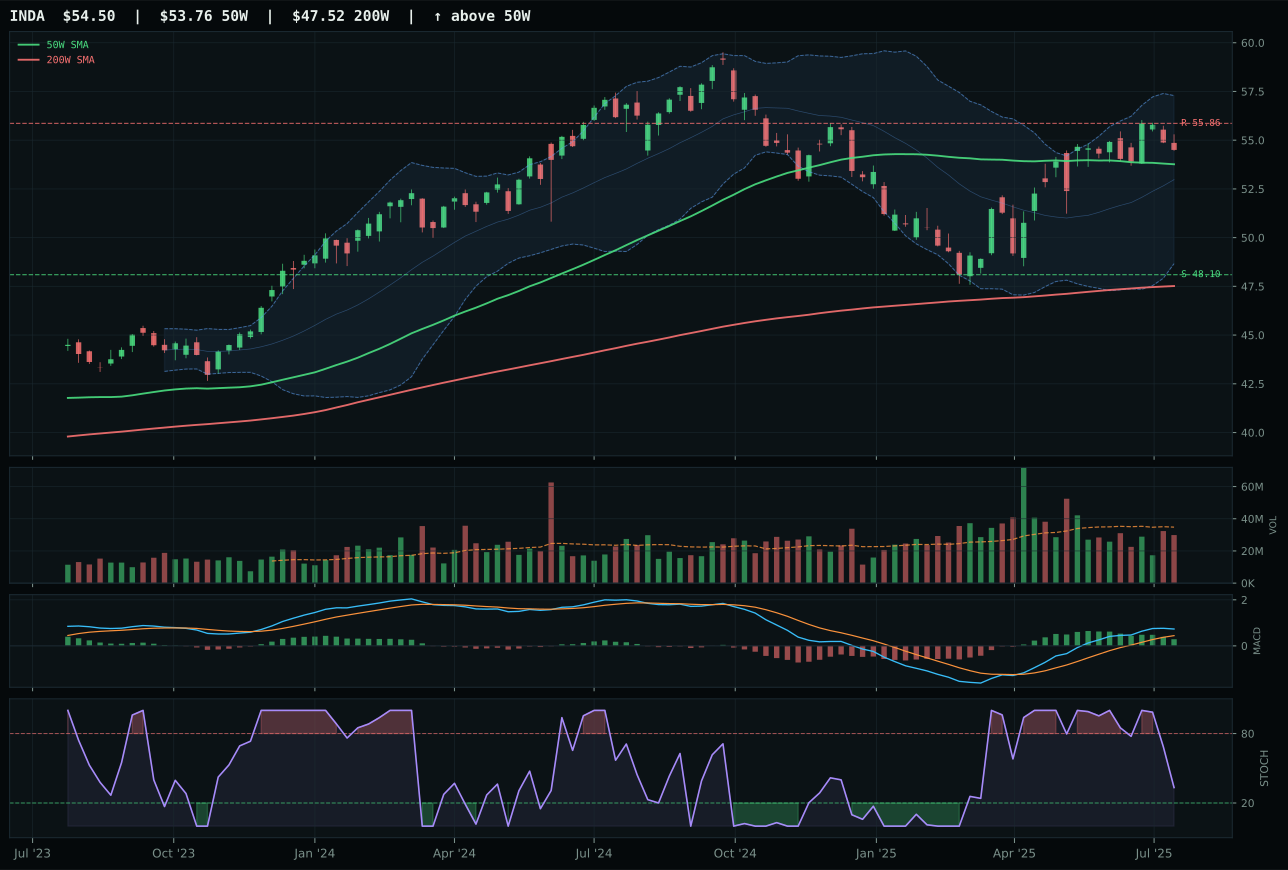
INDA has a compression near 50W profile with -14.9% 13-week relative strength versus SPY.
A failed hold above support would weaken the setup.
Actionable but governed by invalidation levels.
IEMG wins the category by scoring 60/100 technical evidence, above ILF's 53.3, based on superior MACD confirmation that remains bullish and improving versus ILF's bullish but flattening. The category-relative strength advantage of 10.6% for IEMG versus zero for ILF proves decisive, meaning broad emerging-market exposure is capturing more of the rally than Latin America commodity beta. Both sit near the fifty-two week high in the extension zone, with IEMG at 10.6% from the fifty-week moving average and timing scoring 49/100—neither setup is pristine. Volume is thin for both, and risk/reward favors neither: IEMG shows 21.5% downside to support against zero upside to resistance. The win reflects category relative positioning rather than absolute strength; in a risk-off regime, this is the thinnest possible victory.
Emerging Markets receives 0% allocation this week, ranking ninth or tenth in the portfolio exclusion. The category scores only 21.9, hamstrung by macro fit collapsing to 26/100 as Risk-Off Deterioration costs twelve points, credit stress and liquidity stress each remove ten, offsetting the plus eight benefit from risk appetite positive. IEMG's technical evidence of 60/100 sits below the threshold for tier-2 consideration, and the thin volume at 0.56x twenty-week average signals low conviction accumulation. The reasoned ETF proof order places IEMG first, ILF second, and INDA third, yet all three struggle with negative SPY-relative strength (minus 1.7%, minus 12.4%, minus 14.9% respectively), proving that emerging markets are rolling over during this risk-off cycle. Price sits in the overbought stochastic RSI zone with MACD set to flatten, a setup that requires fresh below-support accumulation before re-entry is justified. The category is excluded until either risk appetite reverses or emerging markets stabilize with volume confirmation above 1.2x twenty-week average.