
2025-07-11
Informational purposes only. The content in this report, including allocations, analysis, and commentary, is provided solely for informational and educational purposes. It does not constitute financial advice, investment advice, trading advice, or any other type of advice. Past performance does not guarantee future results. Always conduct your own research and consult a qualified financial professional before making investment decisions.
Weekly Allocation
| Ticker | Category | Weight | Role |
|---|---|---|---|
| FBTC | 50% | Overlay | |
| REMX | Industrial Metals | 10% | Top-2 (10%) |
| XLE | Traditional Energy | 10% | Top-2 (10%) |
| URNM | Nuclear Energy | 5% | Tier-2 (5%) |
| SMH | AI | 5% | Tier-2 (5%) |
| XAR | Defense & Aerospace | 5% | Tier-2 (5%) |
| XLK | Technology | 5% | Tier-2 (5%) |
| PAVE | Utilities & Infrastructure | 5% | Tier-2 (5%) |
| MOO | Agriculture & Livestock | 5% | Tier-2 (5%) |
Trade Instructions — Monday Open
Sell the tranche from 2025-06-13 (completing its 4-week hold). Buy the new tranche. Instructions show net portfolio changes — same-asset positions cancel, weight changes show the delta.
| Action | Ticker | Instruction |
|---|---|---|
| SELL | SLV | Sell 33% of SLV position (reduce 7.50% → 5.00%) |
| SELL | URA | Sell 50% of URA position (reduce 5.00% → 2.50%) |
| SELL | IGF | Sell entire IGF position (1.25% of portfolio) |
| SELL | ITA | Sell entire ITA position (1.25% of portfolio) |
| SELL | FCG | Sell 50% of FCG position (reduce 2.50% → 1.25%) |
| SELL | COPX | Sell 20% of COPX position (reduce 6.25% → 5.00%) |
| BUY | XAR | Buy XAR — 12.50% of freed cash (adds 1.25% to portfolio) |
| BUY | URNM | Buy URNM — 12.50% of freed cash (adds 1.25% to portfolio) |
| BUY | PAVE | Buy PAVE — 12.50% of freed cash (adds 1.25% to portfolio) |
| BUY | XLE | Buy XLE — 25.00% of freed cash (adds 2.50% to portfolio) |
| BUY | REMX | Buy REMX — 25.00% of freed cash (adds 2.50% to portfolio) |
| BUY | MOO | Buy MOO — 12.50% of freed cash (adds 1.25% to portfolio) |
Current Portfolio After Trade
Combined holdings across all 4 active tranches. Each tranche is 25% of the portfolio.
| Ticker | % of Portfolio | Weight Bar |
|---|---|---|
| FBTC | 50.00% | |
| XLK | 6.25% | |
| SMH | 6.25% | |
| COPX | 5.00% | |
| XAR | 5.00% | |
| URNM | 5.00% | |
| SLV | 5.00% | |
| PAVE | 3.75% | |
| XLE | 3.75% | |
| URA | 2.50% | |
| REMX | 2.50% | |
| FCG | 1.25% | |
| XLU | 1.25% | |
| IEMG | 1.25% | |
| MOO | 1.25% |
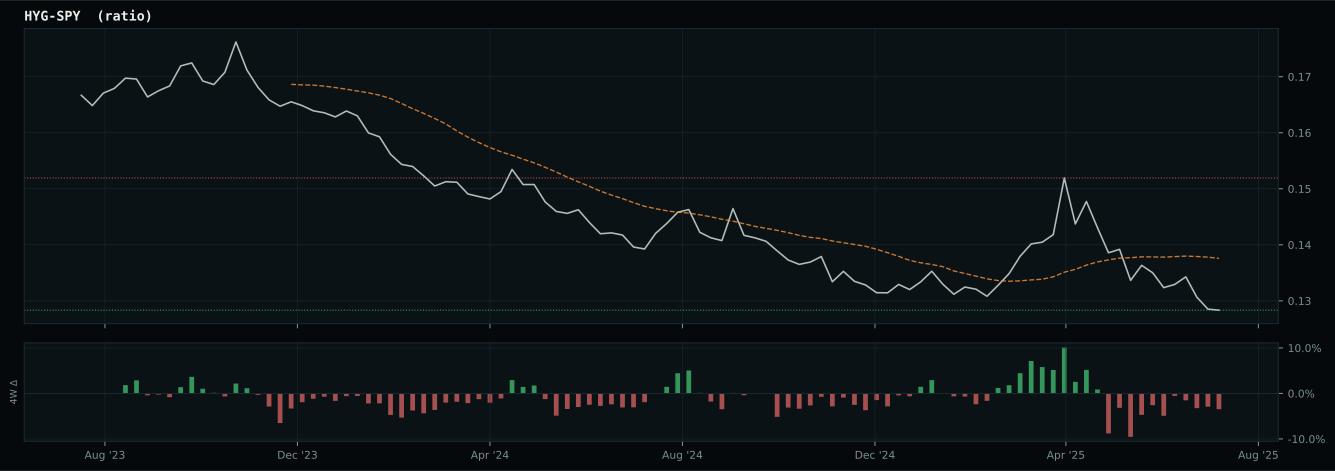
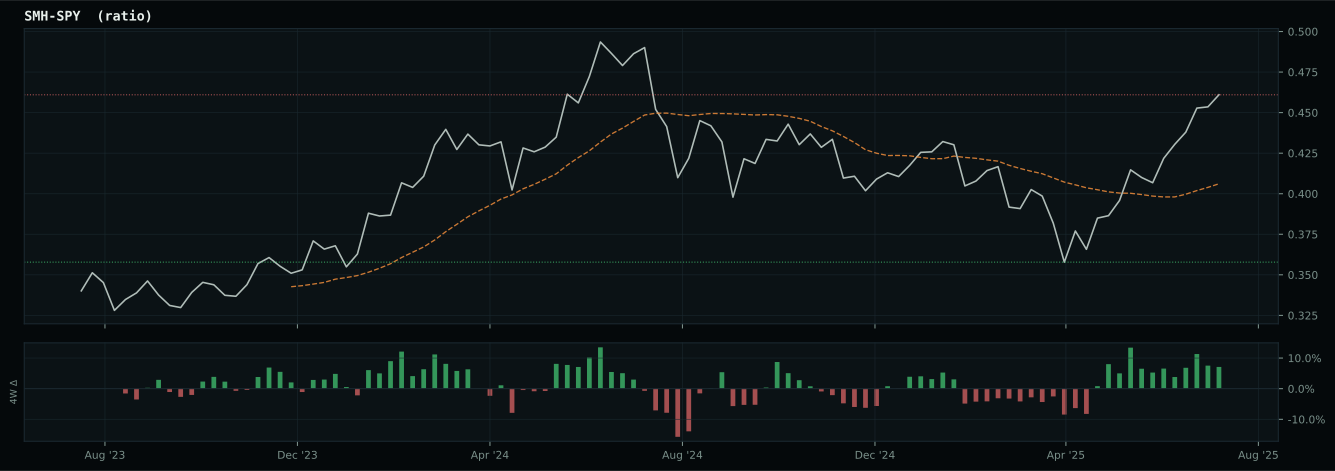
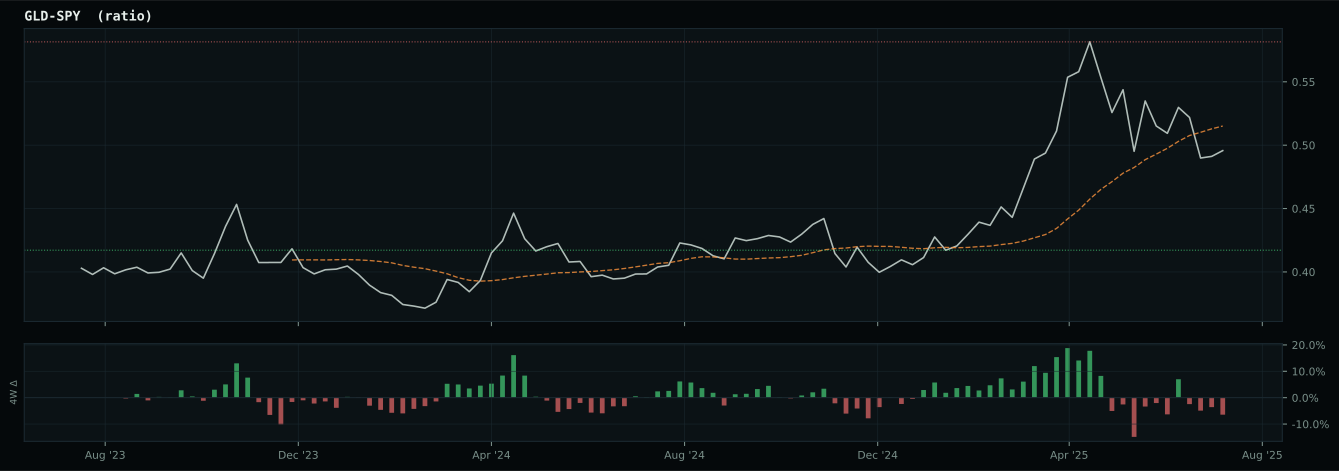
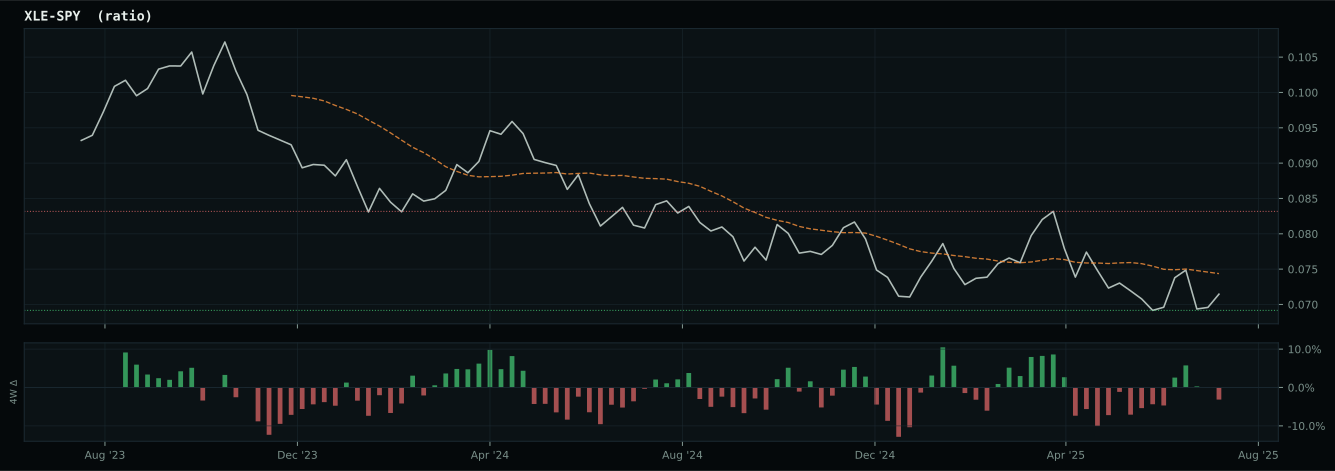
Macro Regime — Late-Cycle Reflation
Macro Evidence Charts
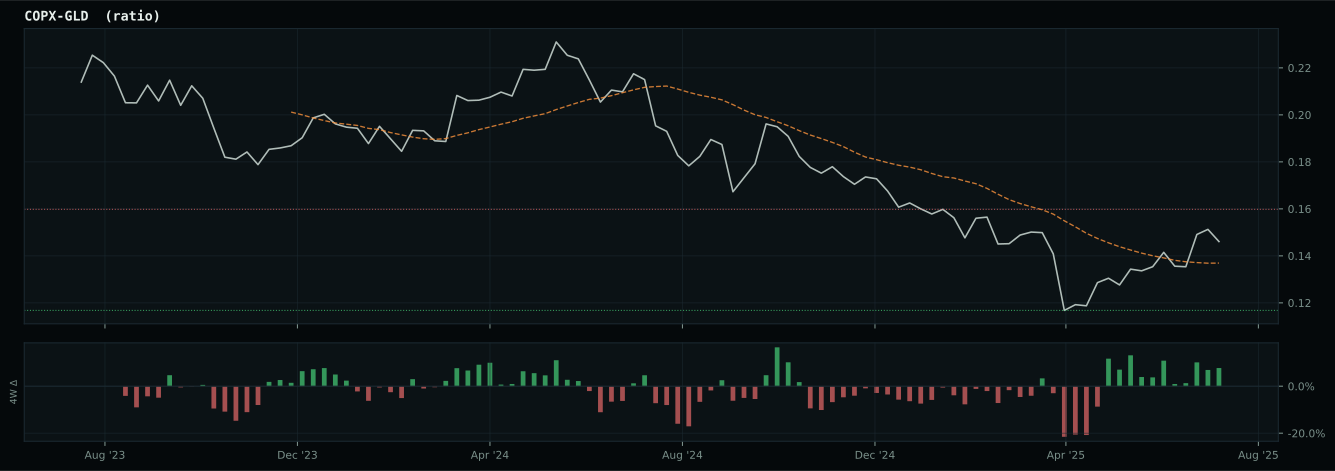
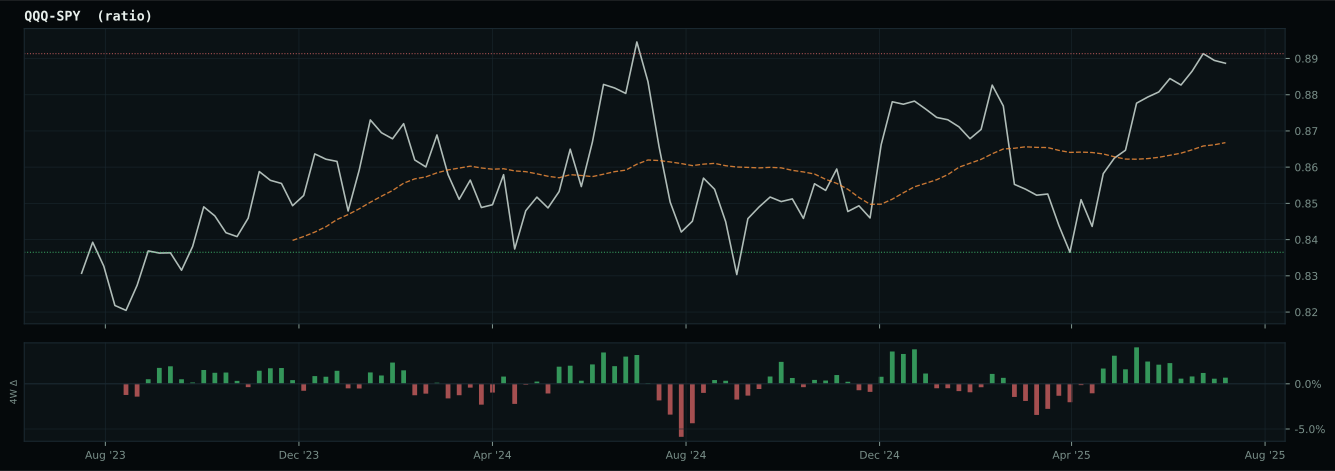
Market-implied signals behind the macro regime scores. Each ratio compares two assets; the direction and slope of the ratio is what the macro engine reads.
Crypto Regime — TrendBTC
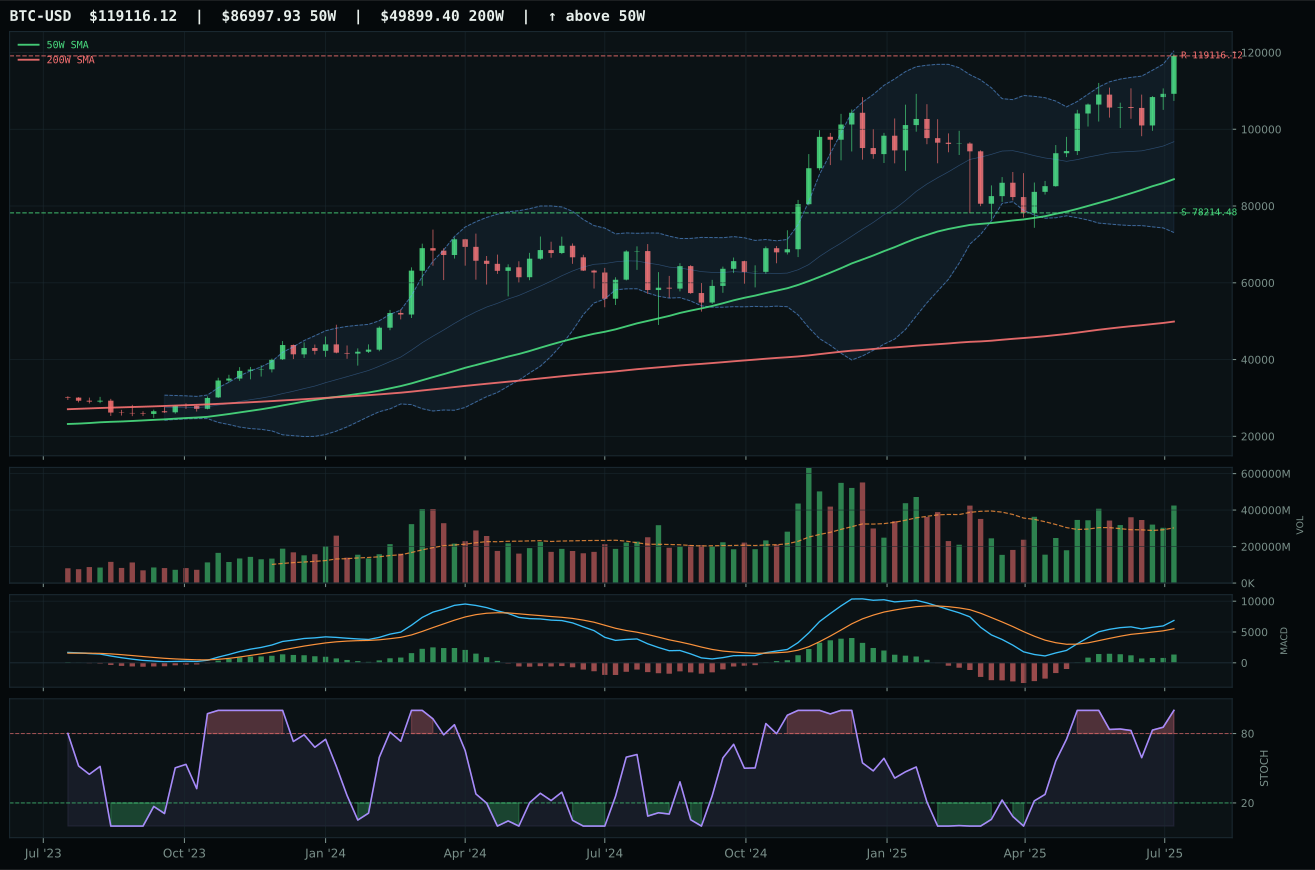
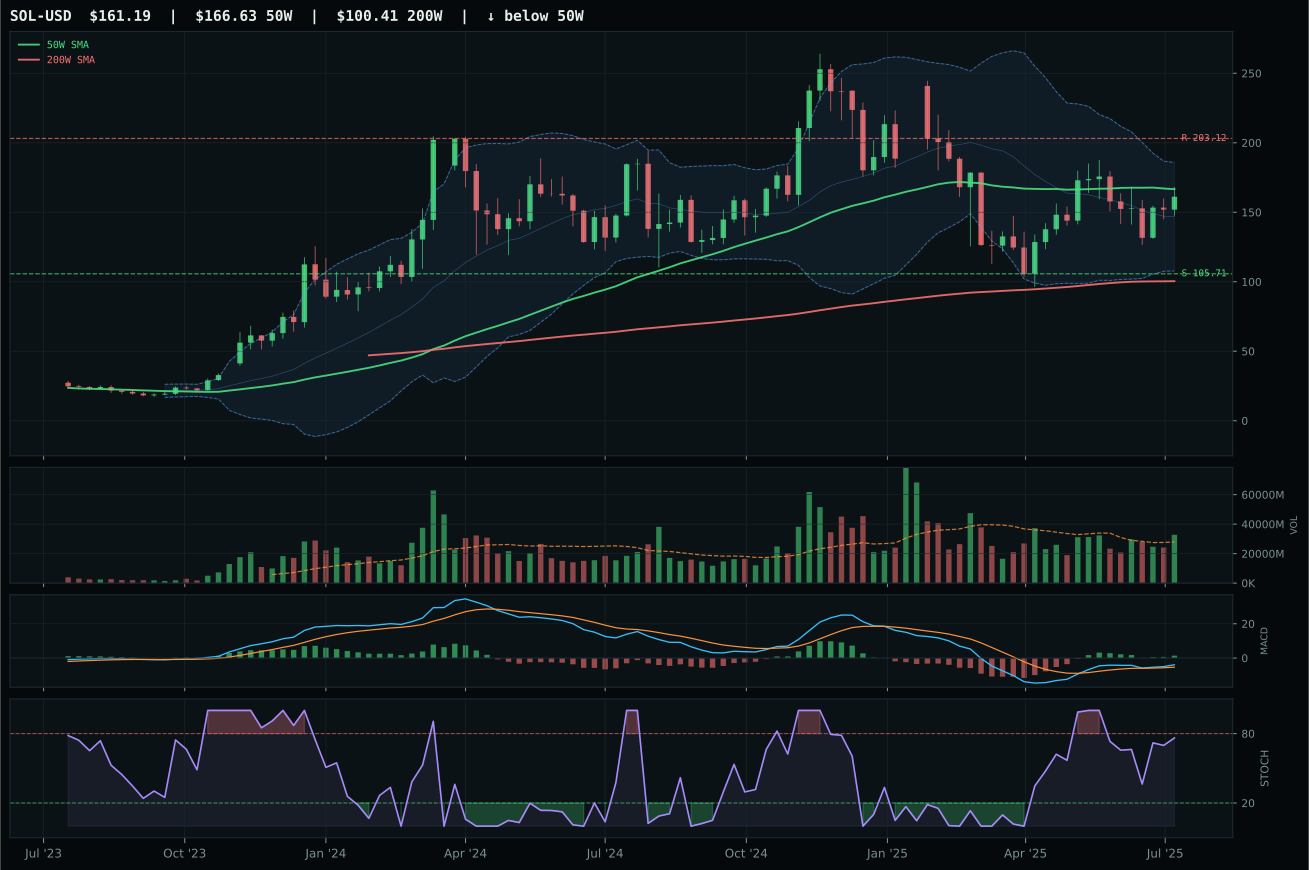
ValueBTC not armed: BTC has not made the first post-breakdown touch of the 200W buy zone after losing the 50W
TrendBTC confirmed: 2 consecutive closes above rising/flat 50W SMA
one or more available conditions failed
Category Rankings
| Rank | Category | Winner | Score | Alloc | 4W Ret | Peers (4W) |
|---|---|---|---|---|---|---|
| 1 | Industrial Metals | REMX | 79.2 | 20% | +22.72% | COPX +2.8% · PICK +1.2% |
| 2 | Traditional Energy | XLE | 76.3 | 20% | -4.34% | XOP -6.9% · FCG -4.2% |
| 3 | Nuclear Energy | URNM | 70.6 | 10% | +2.84% | URA +6.3% · NLR +9.5% |
| 4 | AI | SMH | 66.8 | 10% | +2.87% | AIQ +3.8% · BOTZ +4.4% |
| 5 | Defense & Aerospace | XAR | 61.0 | 10% | +1.20% | ITA +3.4% · ROKT +4.1% |
| 6 | Technology | XLK | 58.7 | 10% | +4.13% | IGV +1.6% · CIBR -1.7% |
| 7 | Utilities & Infrastructure | PAVE | 47.4 | 10% | +2.23% | XLU +4.9% · IGF +2.9% |
| 8 | Agriculture & Livestock | MOO | 40.9 | 10% | -2.32% | VEGI -1.6% · WEAT -5.3% |
| 9 | Precious Metals | SLV | 35.4 | 0% | -2.50% | GLD -0.1% · GDX +8.0% |
| 10 | Emerging Markets | IEMG | 30.8 | 0% | +2.13% | ILF +1.7% · INDA -4.6% |
Industrial Metals — REMX
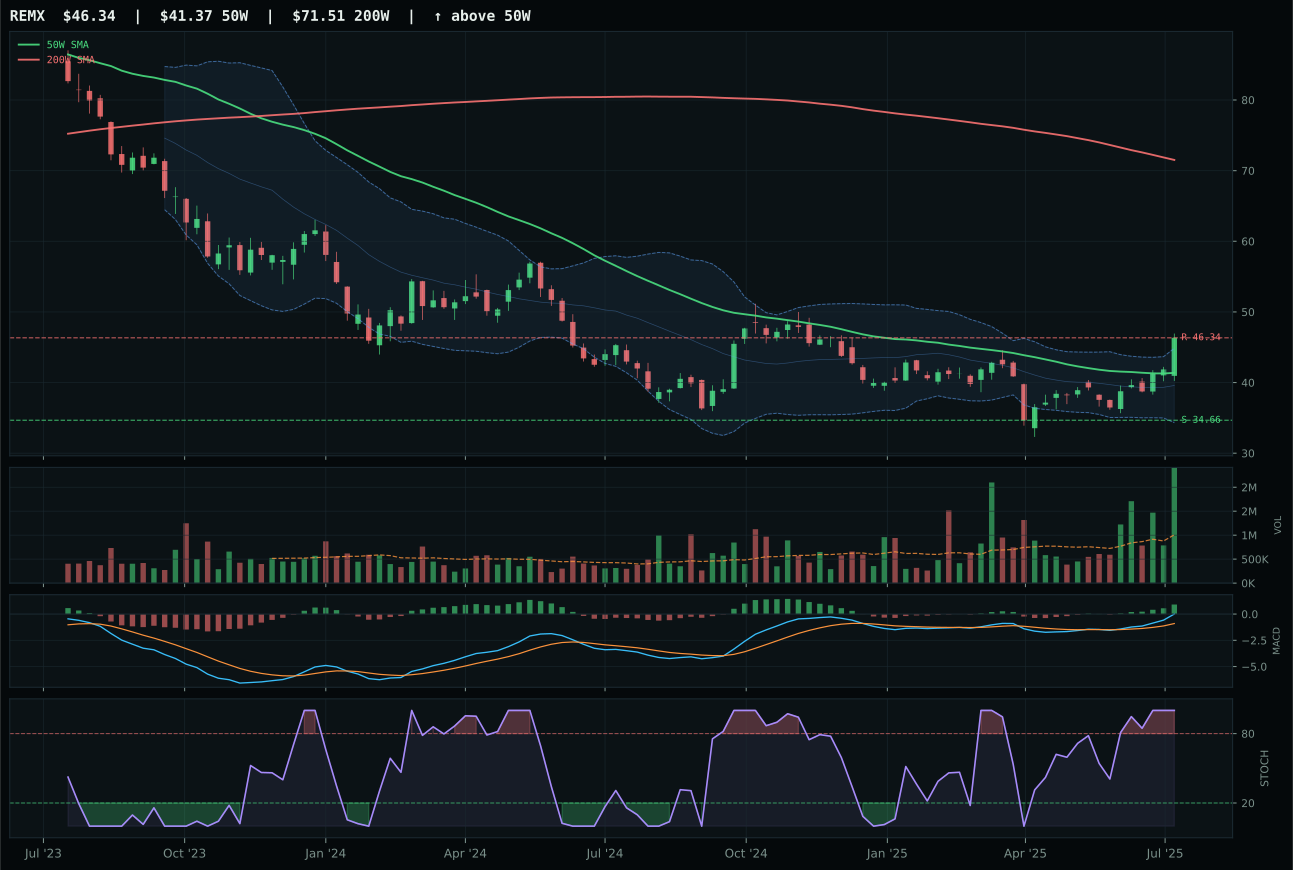
REMX has a neutral structure profile with 10.2% 13-week relative strength versus SPY.
A failed hold above support would weaken the setup.
Actionable but governed by invalidation levels.
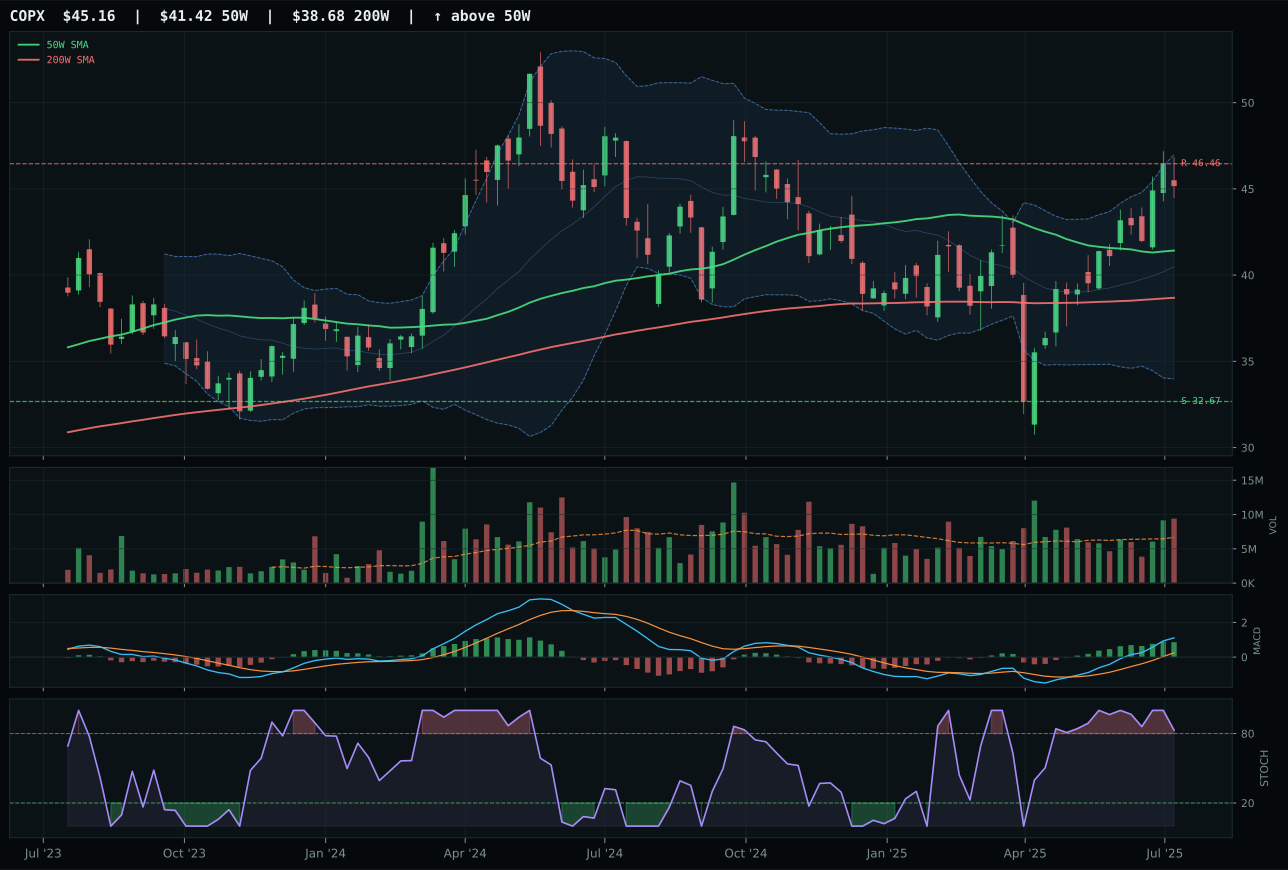
COPX has a neutral structure profile with 10.3% 13-week relative strength versus SPY.
A failed hold above support would weaken the setup.
Actionable but governed by invalidation levels.
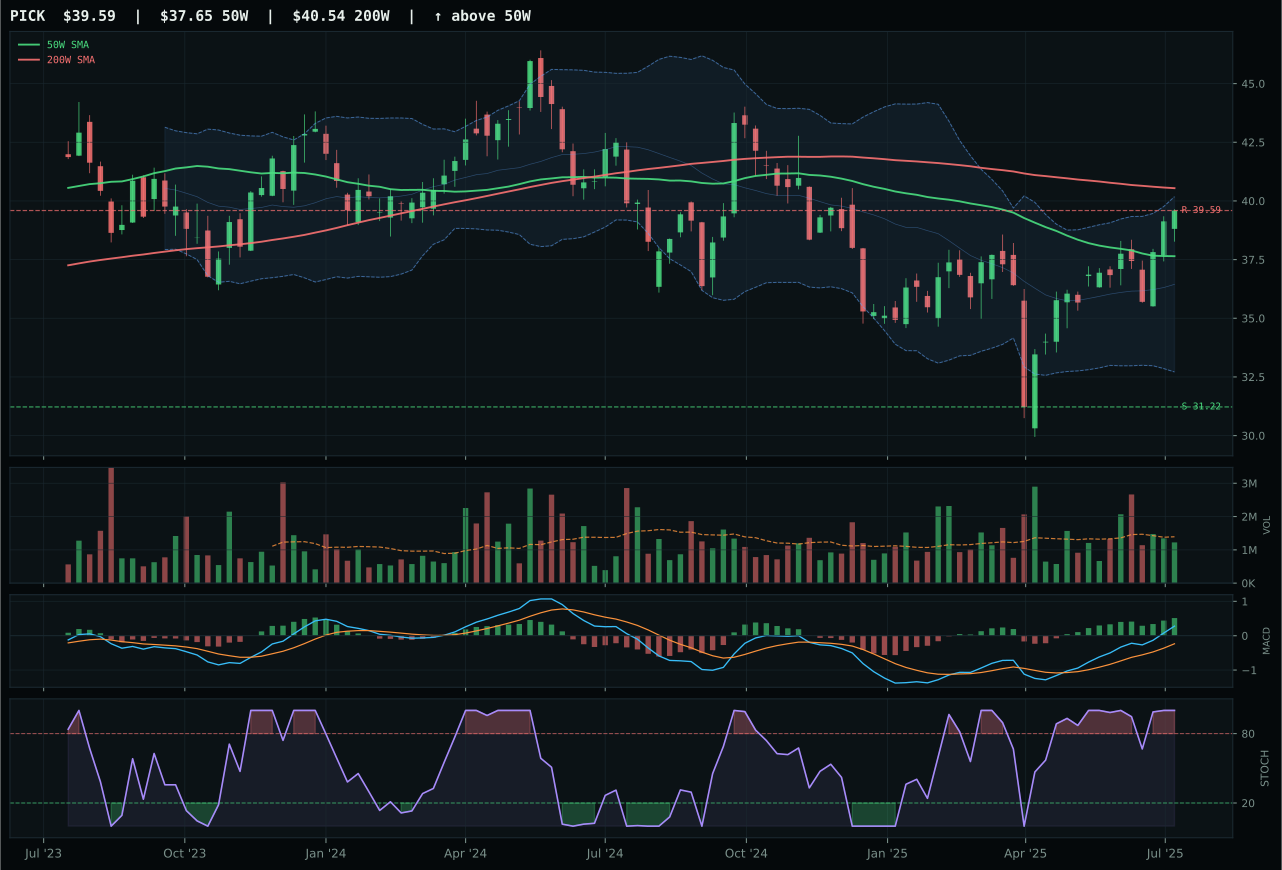
PICK has a neutral structure profile with 1.5% 13-week relative strength versus SPY.
A failed hold above support would weaken the setup.
Actionable but governed by invalidation levels.
REMX claims the top-2 slot on the strength of accumulation-grade volume at two-point nine-eight-times the twenty-day average—the thickest participation in the entire portfolio—combined with bullish-and-improving MACD and overbought-momentum stochastic RSI at 1.00. Its twenty-seven-point zero percent thirteen-week return is authentic; the volume surge tells us that rare earth supply-chain scarcity narrative is moving real capital, not just sentiment. Distance from the fifty-week is conservative at twelve percent, placing price in the upper retracement zone near Fibonacci 0.236—a zone that typically marks accumulation before extension. Its eighty-point technical evidence score lags COPX's near-perfect trend at 100, but REMX's volume-price confirmation at 89.8 out of 100 is the decisive separator; COPX shows bullish-but-flattening MACD and volume only at above-average participation, not accumulation. The persistence score of 87.8 out of 100 reflects that the move is being sustained by real buying, not just bounce mechanics. Five-point eight-point gap versus COPX is definitive.
Industrial Metals earns 10% allocation—top-2 overweight—because its final score of 79.2 ranks among the two highest eligible categories and because the macro regime explicitly backs industrial metals scarcity. Metals scarcity active descriptor contributes fourteen points, commodity breadth positive adds ten, Late-Cycle Reflation environment contributes ten, and real asset sponsorship adds six, netting to category-level macro fit of seventy-five out of 100. The technical evidence from REMX is exceptional: ninety-five-point eight out of 100, anchored by accumulation-grade volume that no other category can match this week. REMX's positioning below the two-hundred-week but above the fifty-week with compressed distance gives the setup genuine mean-reversion potential; if support at 34.66 holds and volume sustains above two-times the twenty-day, the next resistance breakout targets the structure resistance at 46.34 and beyond. This is the most asymmetric setup in the portfolio right now—tight entry, institutional volume, and macro sponsorship all aligned.
Traditional Energy — XLE
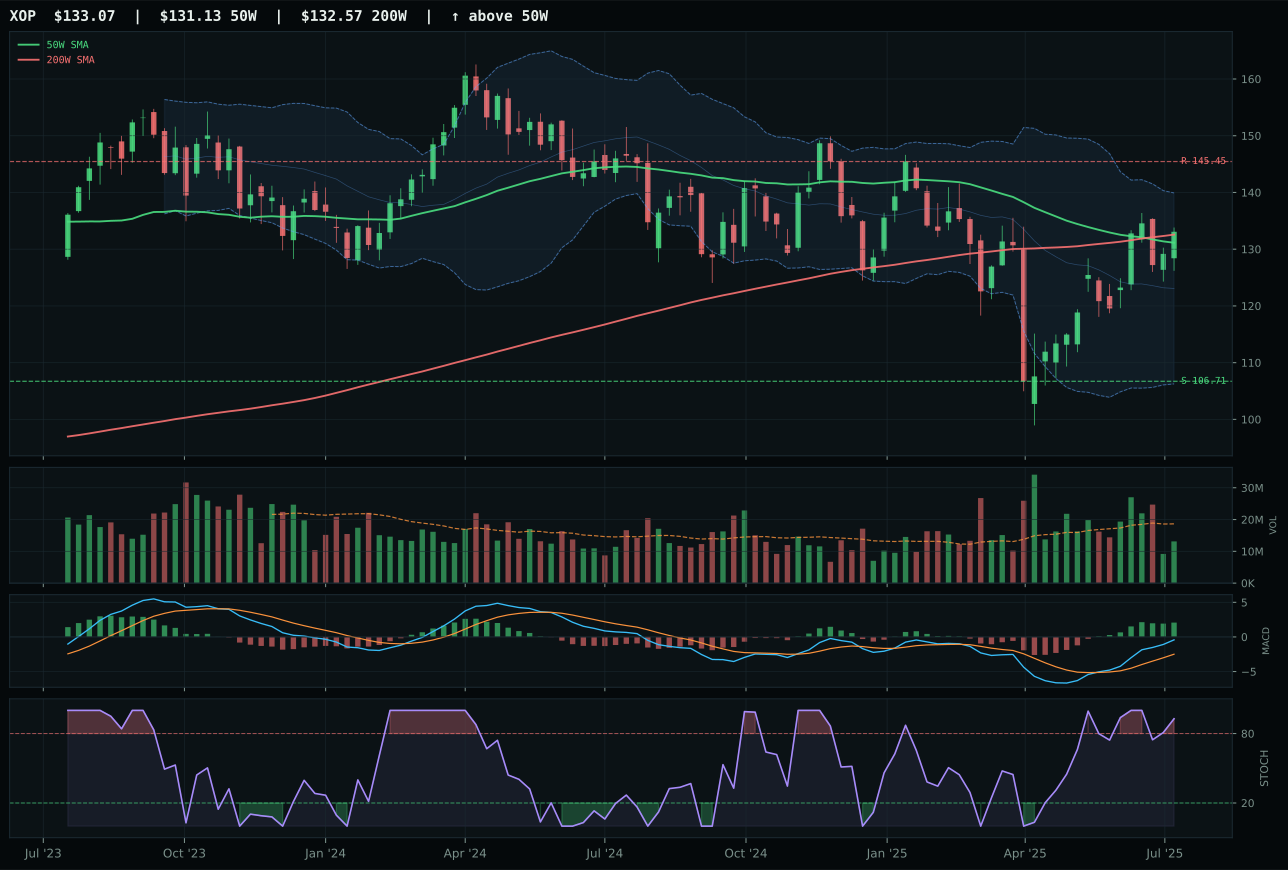
XOP has a compression near 50W profile with 6.9% 13-week relative strength versus SPY.
A failed hold above support would weaken the setup.
Actionable but governed by invalidation levels.
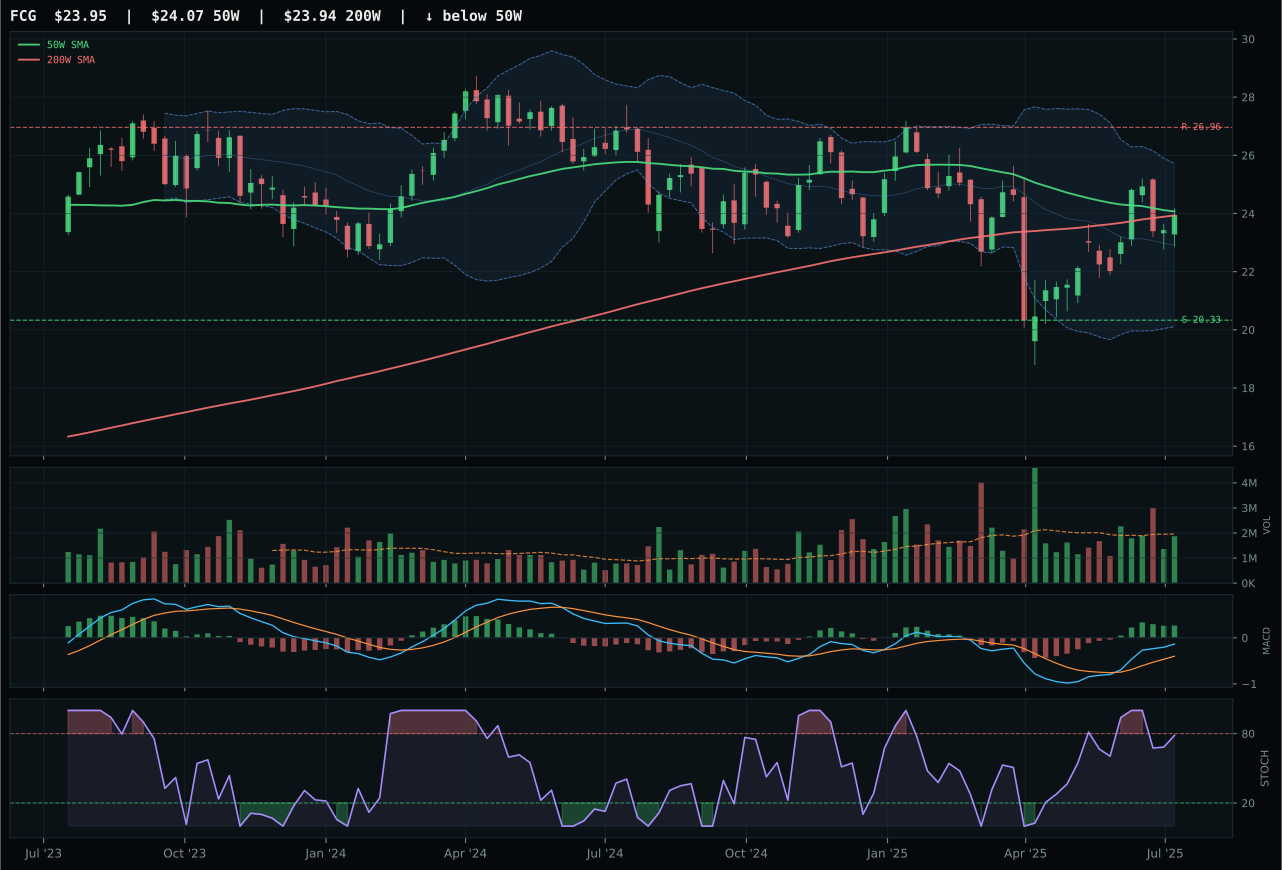
FCG has a compression near 50W profile with 0.3% 13-week relative strength versus SPY.
A failed hold above support would weaken the setup.
Actionable but governed by invalidation levels.
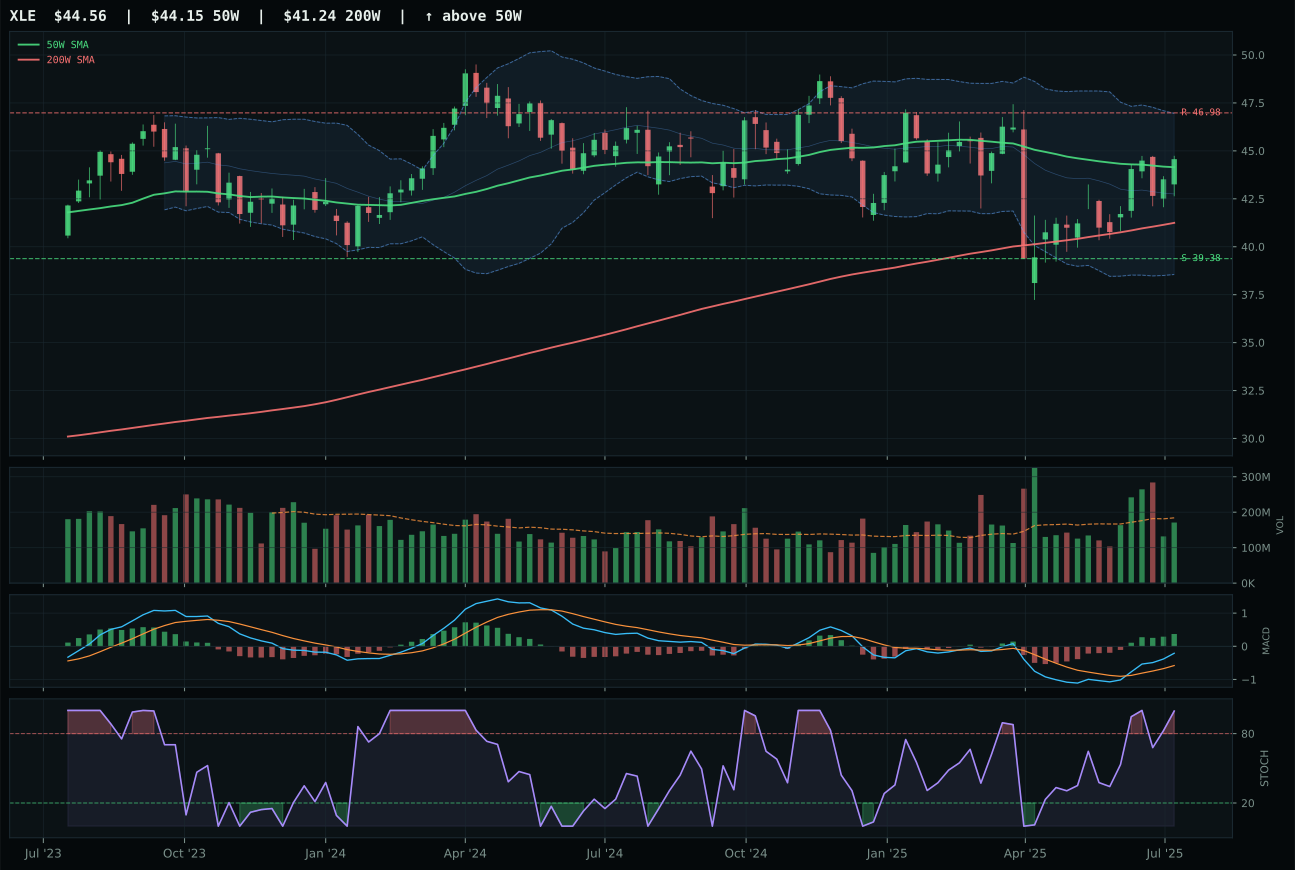
XLE has a compression near 50W profile with -3.8% 13-week relative strength versus SPY.
A failed hold above support would weaken the setup.
Actionable but governed by invalidation levels.
XLE wins the category despite ranking third in the reasoned-proof order because the category-selection process evaluates risk-adjusted opportunity, not absolute technicals. XLE sits in compression near the fifty-week moving average at just one percent distance—the tightest setup in the portfolio—with bullish-and-improving MACD, overbought-but-rolling-over stochastic RSI, and a eighty-point-two timing score that reflects the highest conviction timing entry of any category representative. While XOP shows stronger absolute relative strength at six-point nine percent versus XLE's minus three-point eight percent, XOP trades with thin-participation volume and sits higher in the retracement zone; XLE's neutral volume and repair-zone placement near Fibonacci 0.786 set the stage for institutional accumulation if energy scarcity narrative persists. Eighty-four-point-three trend component confirms price action is genuine, and the eighty-two-point timing creates a rare high-conviction pullback-and-hold setup rather than chase-the-extended-move risk.
Traditional Energy earns 10% allocation—top-2 overweight—because Late-Cycle Reflation regime explicitly rewards energy scarcity, with the active descriptor contributing sixteen points and inflation pressure adding ten to a category-level macro fit of ninety out of 100. XLE's fifty-eight-point-two technical evidence score is lower than REMX's and lower than many tier-2 names, but the macro overlay—energy scarcity, supply shortage, and real asset sponsorship all active—brings the final category score to seventy-six-point-three, sufficient for top-2 ranking. The asymmetry here is different from Industrial Metals: XLE offers a coiled compression setup where every basis point of oil-price strength flows through to the cash flow story, whereas REMX offers pure volume-driven accumulation. Defensively, XLE trades on integrated-energy cash-flow stability; if macro turns or if energy scarcity narrative fades, the downside cushion of thirteen-point-two percent to support provides breathing room. The timing component at eighty-two out of 100 is the highest in the portfolio, signaling that the chart entry is optimal and institutional buyers can load without extension risk. This is the portfolio's macro-hedge-meets-technicals opportunity.
Nuclear Energy — URNM
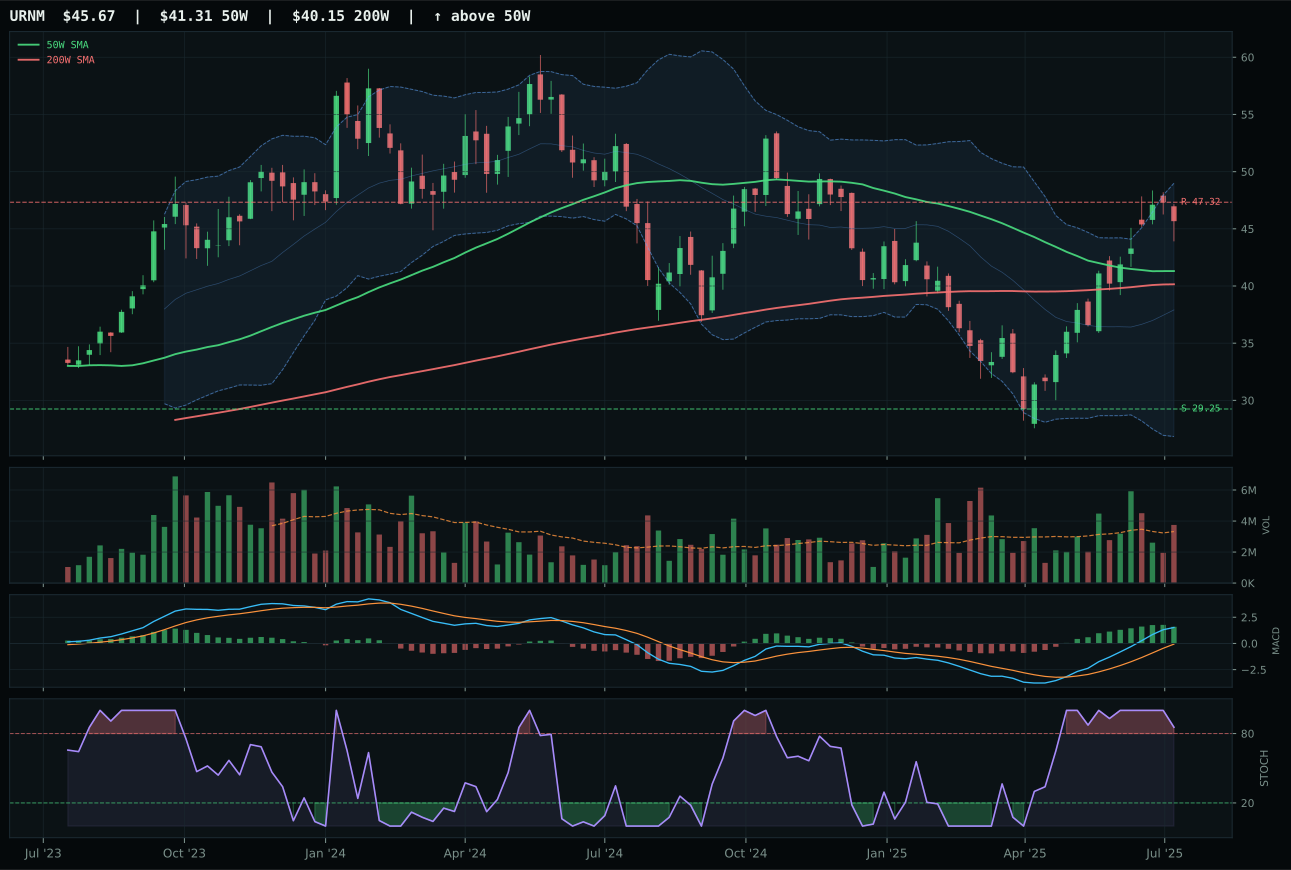
URNM has a neutral structure profile with 28.7% 13-week relative strength versus SPY.
A failed hold above support would weaken the setup.
Actionable but governed by invalidation levels.
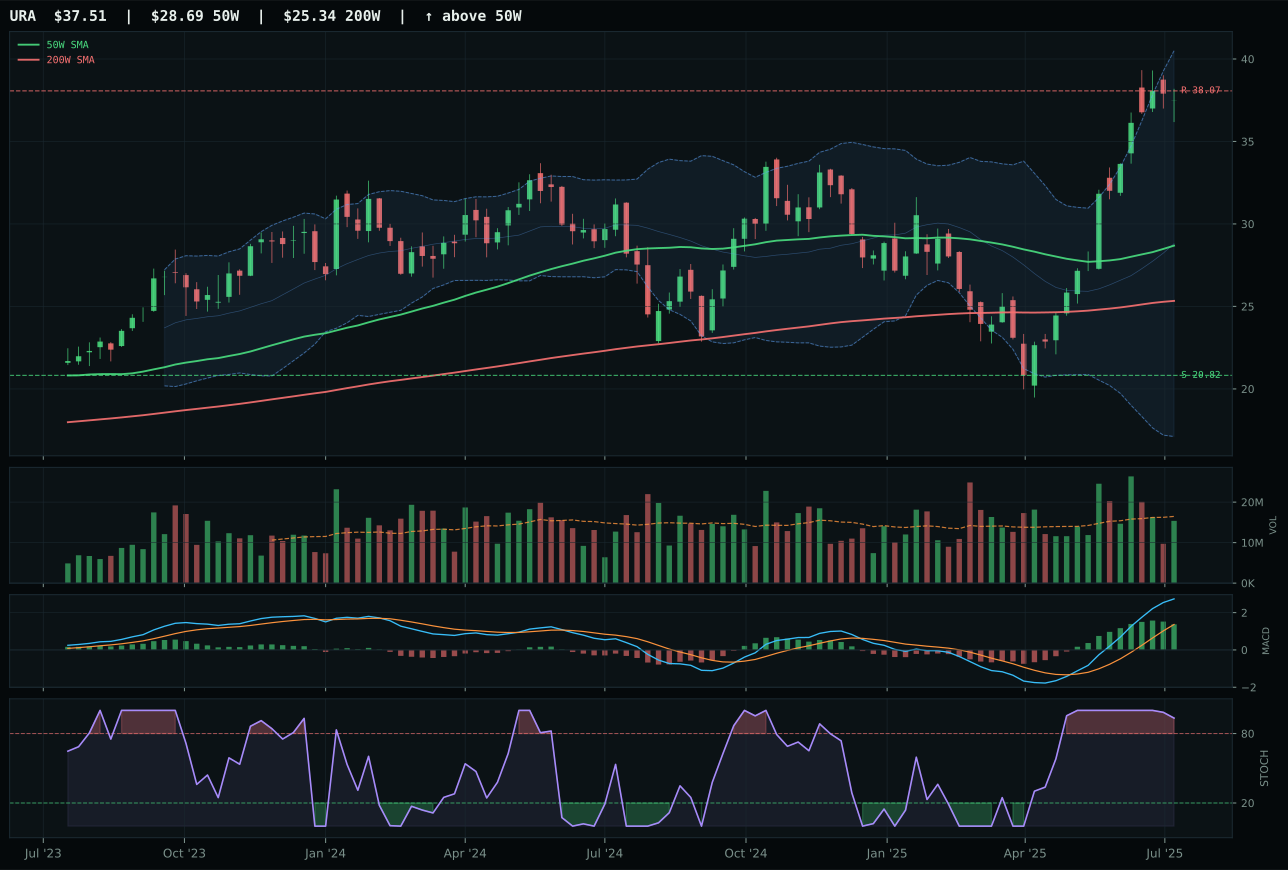
URA has a vertical extension profile with 48.8% 13-week relative strength versus SPY.
A failed hold above support would weaken the setup.
Actionable but governed by invalidation levels.
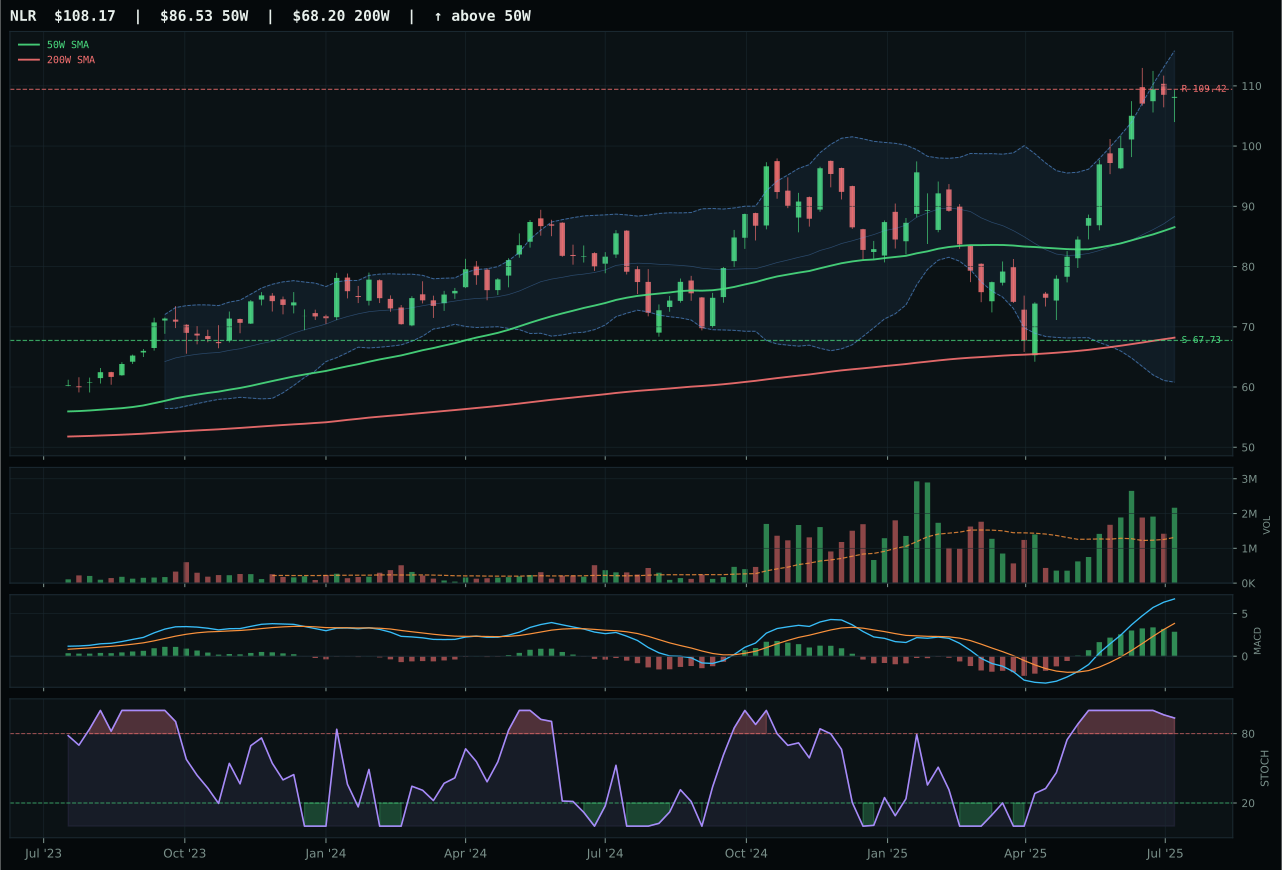
NLR has a vertical extension profile with 29.7% 13-week relative strength versus SPY.
A failed hold above support would weaken the setup.
Actionable but governed by invalidation levels.
URNM wins the category by delivering perfect-score trend confirmation (100 out of 100), bullish-and-improving MACD, above-average volume participation at one-point one-three-times the twenty-day average, and an extraordinary forty-five-point-five percent thirteen-week return that dwarfs URA's near-vertical fifty-week extension at thirty-point-eight percent distance from the fifty-week. Category-relative strength at minus one point shows that URNM is not outperforming URA internally, but timing is the separator: URNM's fifty-seven-point timing score reflects a neutral structure at only ten-point-six percent distance from the fifty-week, whereas URA sits in vertical extension with a twenty-two-point timing score—a move already completed. URNM's persistence score of ninety-four-point-two out of 100 is the highest in its peer set, confirming that the move is being sustained by real capital flow. URA's bullish-but-flattening MACD against URNM's bullish-and-improving signals that URNM's momentum is accelerating while URA's is rolling over. The twenty-one-point-seven-point gap is decisive.
Nuclear Energy earns 5% allocation—tier-2 status—because its final score of 70.6 trails both REMX and XLE but exceeds all other tier-2 candidates. The macro support is material: energy scarcity active descriptor contributes nine points, real asset sponsorship adds seven, and Late-Cycle Reflation contributes seven, netting to category-level macro fit of sixty-nine out of 100. URNM's technical evidence of eighty-four out of 100 is strong, but the constraint is risk-reward at only forty-six-point-one out of 100, reflecting minus-three-point-five percent upside to resistance and fifty-six-point-one percent downside to support—an inverse asymmetry that makes new entries feel like buyers are paying for the news already printed. For Nuclear to leap to top-2, URA would need to correct sharply back toward the fifty-week (which would reset URNM's category leadership), or if the uranium-supply scarcity narrative accelerates, the upside resistance could extend materially. Right now, the category is solid conviction on energy transition thesis but lacks the technical cushion to justify overweight sizing; tier-2 5% allocation appropriately reflects real macro sponsorship with measured chart risk.
AI — SMH
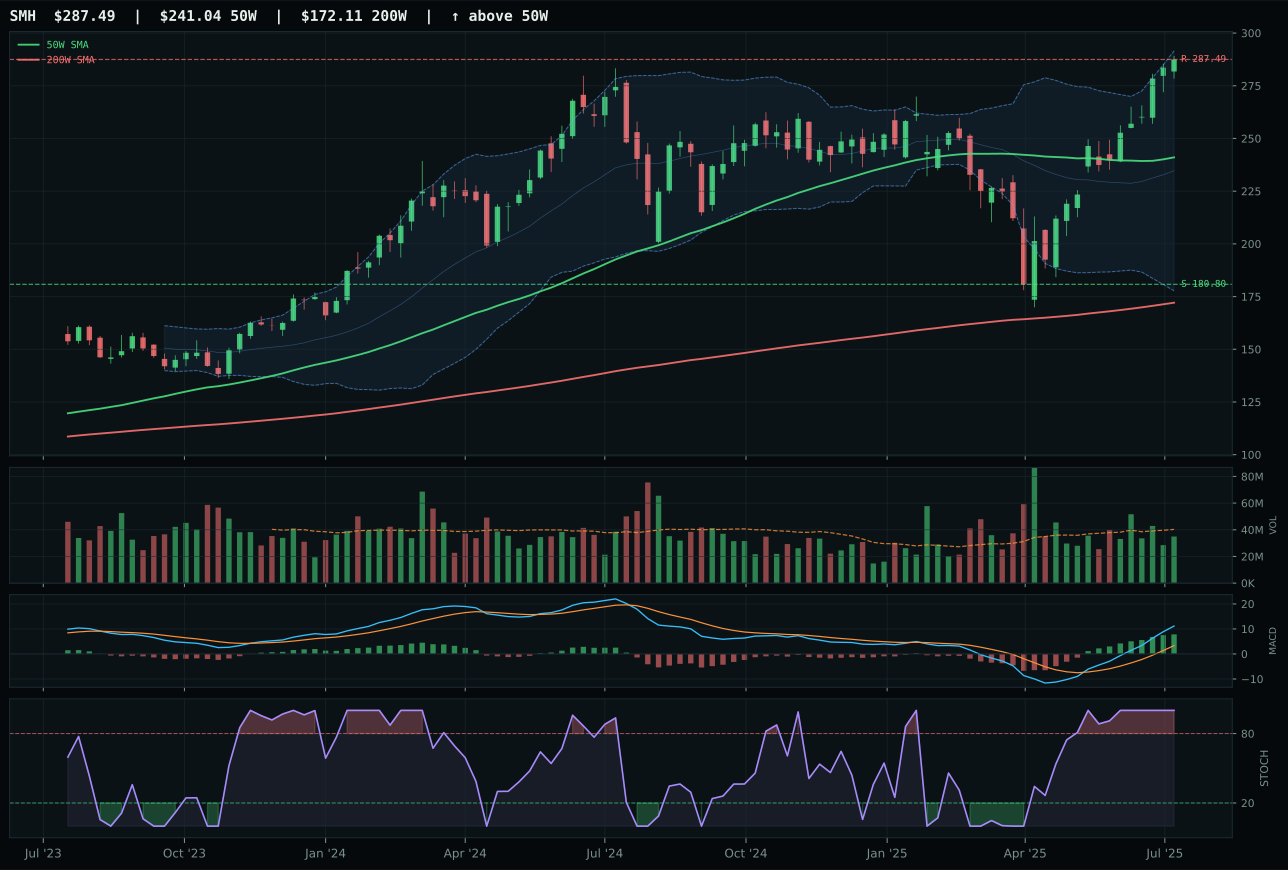
SMH has a vertical extension profile with 26.0% 13-week relative strength versus SPY.
A failed hold above support would weaken the setup.
Actionable but governed by invalidation levels.
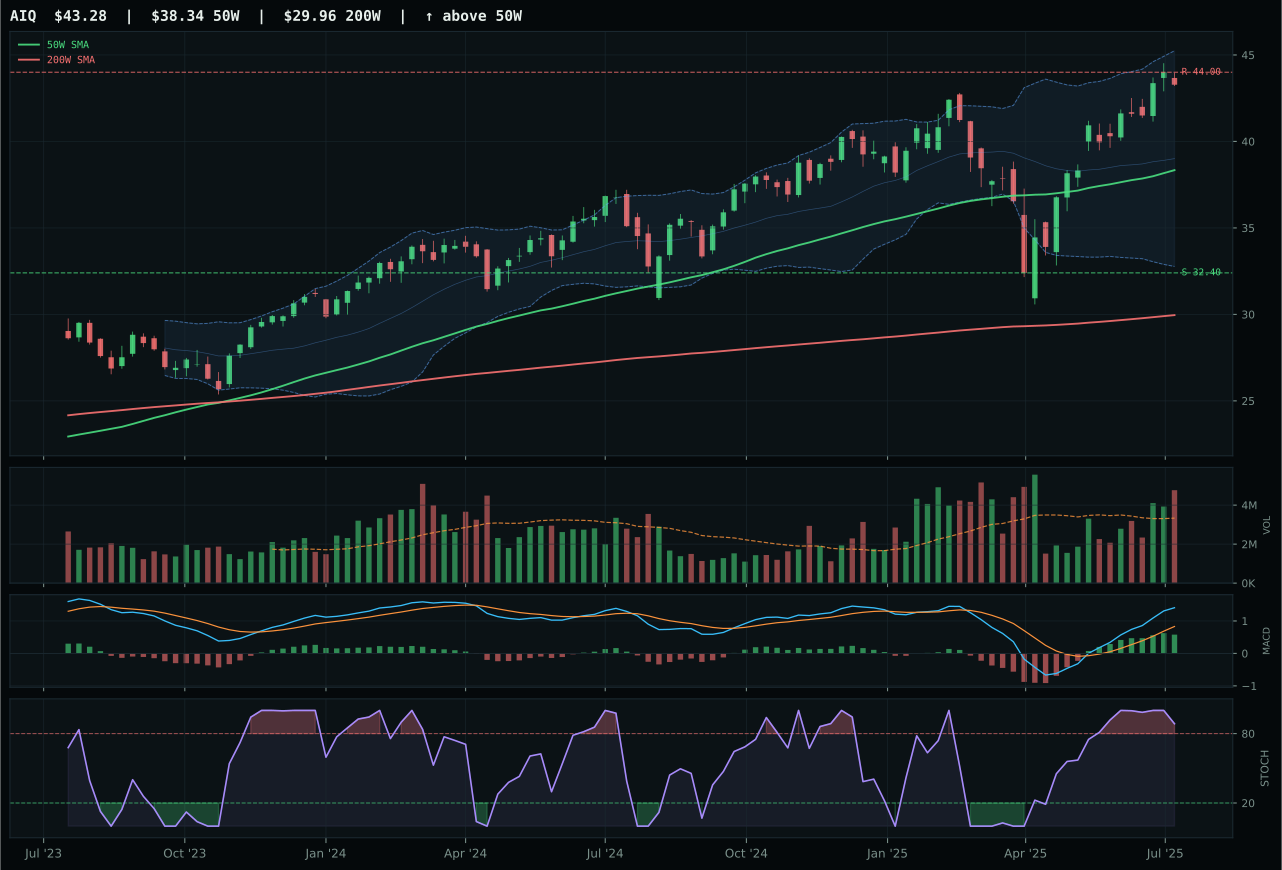
AIQ has a neutral structure profile with 8.8% 13-week relative strength versus SPY.
A failed hold above support would weaken the setup.
Actionable but governed by invalidation levels.
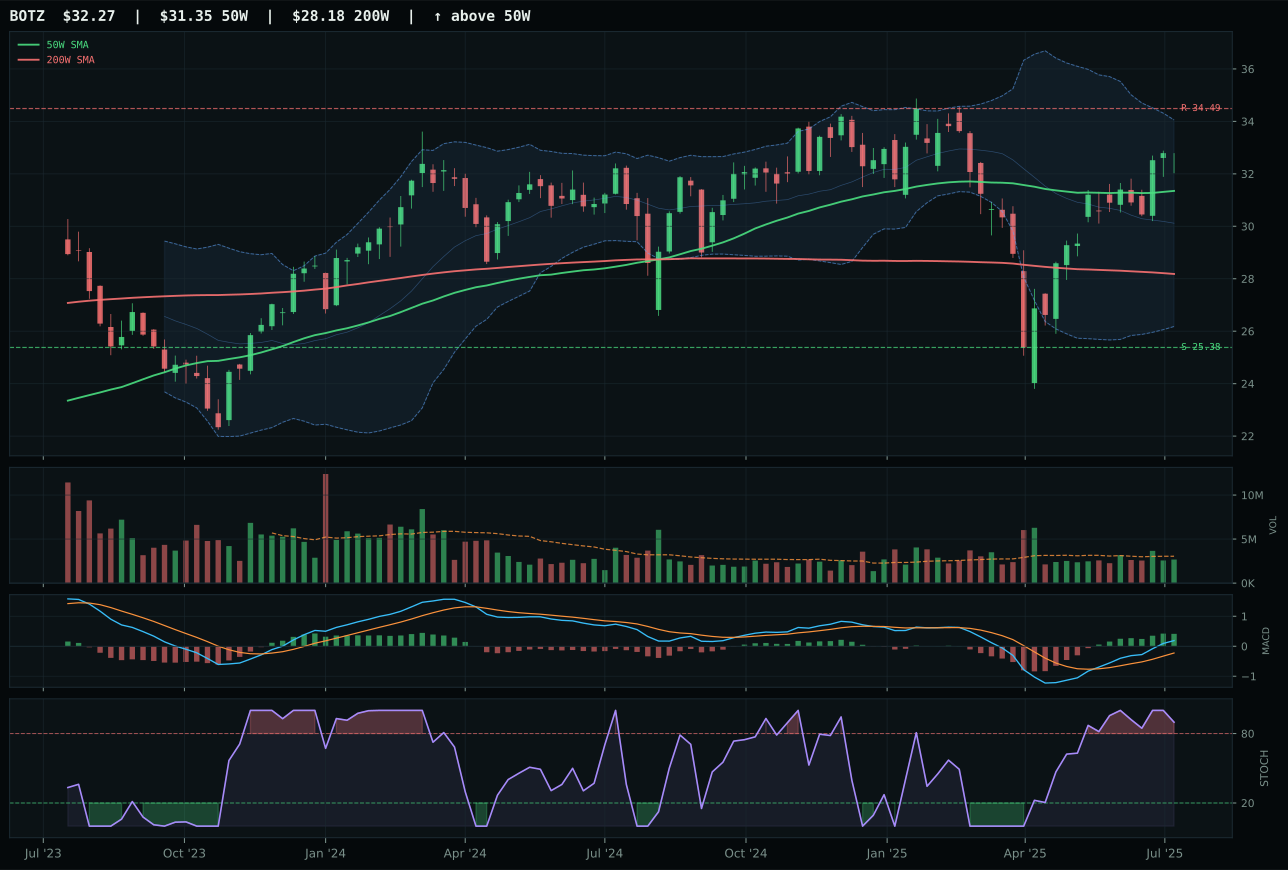
BOTZ has a compression near 50W profile with 3.3% 13-week relative strength versus SPY.
A failed hold above support would weaken the setup.
Actionable but governed by invalidation levels.
SMH claims the category despite bearing the highest entry risk in the peer set, sitting 19.3% above its fifty-week moving average with vertical extension structure and Fibonacci placement near the fifty-two-week high. The separator is pure persistence: a 42.8% thirteen-week return, 26.0% relative strength versus SPY, and a 17.2% beat against the category median prove that AI compute and semiconductor leadership is being accumulated, not bounced. Its MACD is bullish and improving while stochastic RSI sits at overbought momentum—a setup that typically fails if macro turns, but currently holding because volume is neutral and the risk/reward at 39.4 out of 100 is penalizing entry risk transparently. AIQ posted 25.6% thirteen-week return against SMH's 42.8%, and its category-relative strength flatlined at 0.0%, meaning the AI software and application bucket is lagging the compute narrative entirely. The eight-point gap between SMH's reasoned score of 77.3 and AIQ's 70.1 is clean and decisive.
AI earns 5% allocation—tier-2 status—even though it carries one of the highest technical scores at 66.8 because REMX and XLE rank higher on the final list. The macro regime strongly backs AI: AI growth sponsorship contributes fourteen points, risk appetite positive adds ten, but liquidity stress cuts twelve and credit stress removes eight, leaving category-level macro fit at 54.0 out of 100. The tension is clear: Technical excellence (86.5 out of 100 for SMH) is real, but market structure is thin—the category-relative strength weakness in AIQ and the vertical extension in SMH both signal late-stage absorption of fresh capital. For AI to leapfrog to top-2, MACD would need to shift from bullish-and-improving to sustained vertical acceleration, and SMH's timing component would need to compress below 10% distance from the fifty-week rather than sitting at 19.3%. Volume confirmation is neutral; if that turns to accumulation, the case strengthens materially.
Defense & Aerospace — XAR
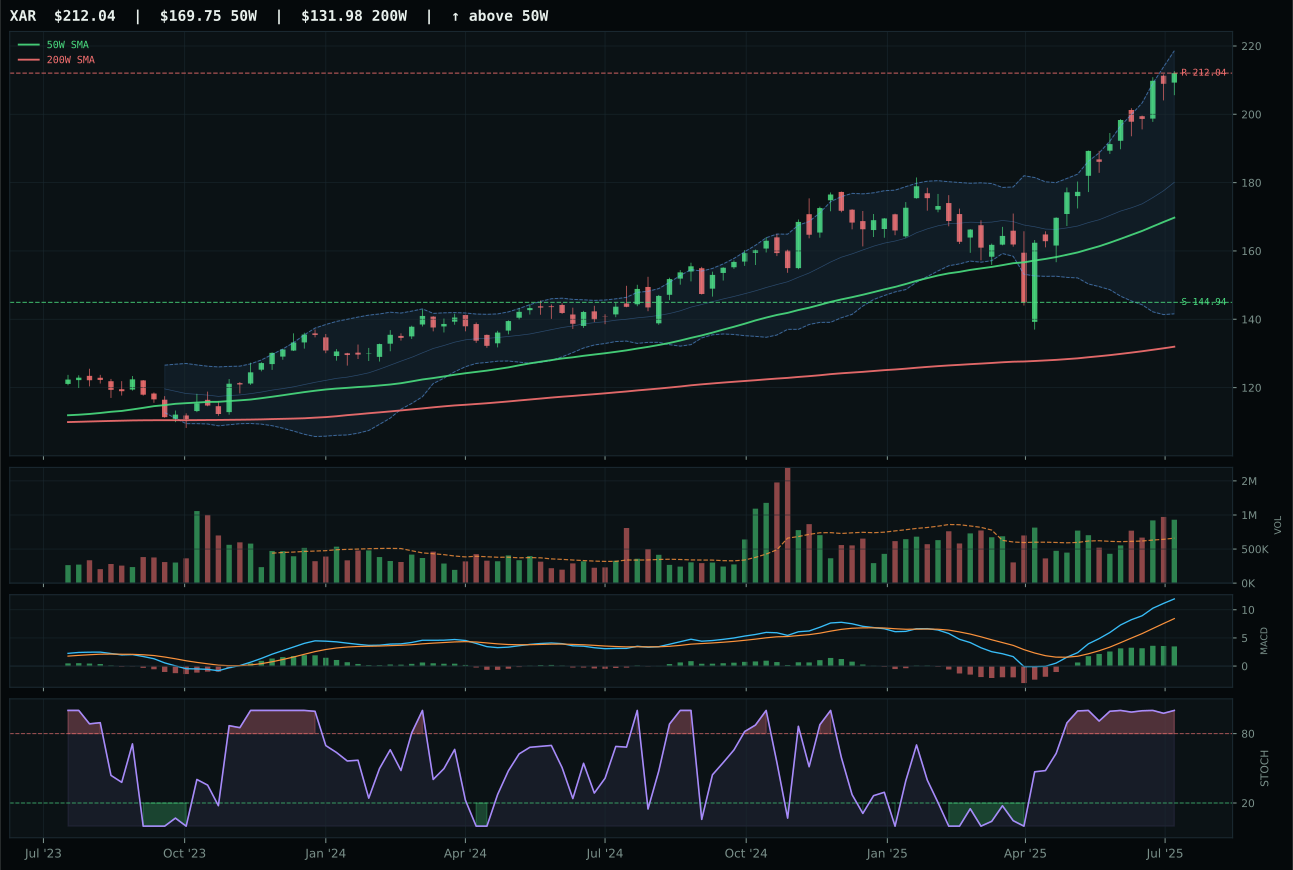
XAR has a vertical extension profile with 13.8% 13-week relative strength versus SPY.
A failed hold above support would weaken the setup.
Actionable but governed by invalidation levels.
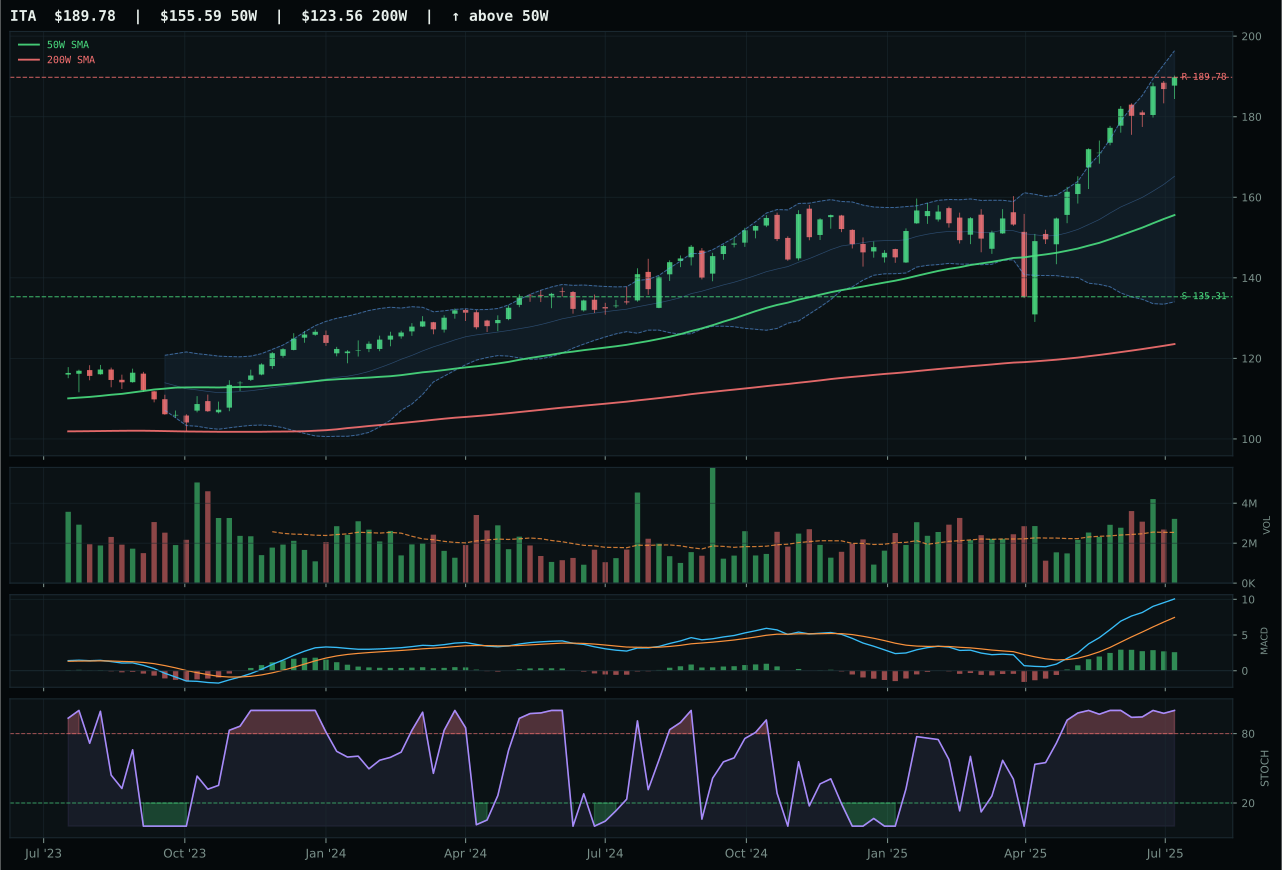
ITA has a vertical extension profile with 10.5% 13-week relative strength versus SPY.
A failed hold above support would weaken the setup.
Actionable but governed by invalidation levels.
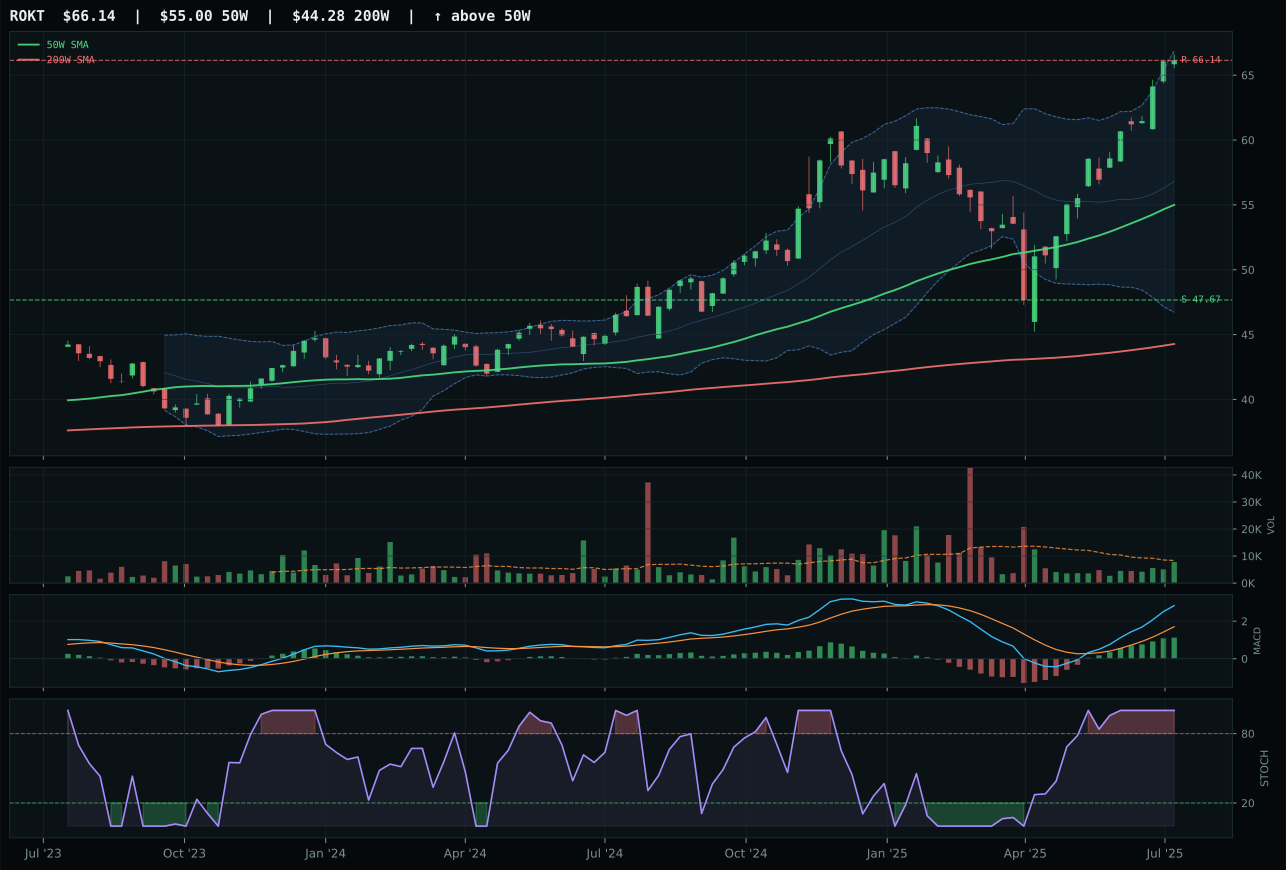
ROKT has a vertical extension profile with 12.8% 13-week relative strength versus SPY.
A failed hold above support would weaken the setup.
Tracked, but not top-2 eligible because: .
XAR wins on technical evidence of 87.7 out of 100, delivering trend confirmation at 100, sustained MACD improvement, overbought momentum at stochastic RSI 1.00, and above-average volume participation at 1.41x the twenty-day average—the thickest accumulation in the category. Its thirty-point six percent thirteen-week return and thirteen-point eight percent relative strength versus SPY are backed by a clean 81.2 structure score, though the vertical extension twenty-four-point nine percent above the fifty-week and zero percent upside to resistance both penalize the risk-reward calculation to 40.1 out of 100. ITA ran a tighter entry at just five-point three percent above the fifty-week but its MACD shows bullish-but-flattening momentum—the technical signature of slowing accumulation—and its category-relative strength is negative at minus two-point three percent, meaning the defense-prime durability narrative is not outperforming the broader aerospace trade. The one-point nine-point gap between the two is genuine but reflects late-cycle reflation tailwinds affecting category-wide strength, not XAR's outlier positioning.
Defense & Aerospace secures 5% allocation—tier-2 status—as a beneficiary of Late-Cycle Reflation policy sponsorship, which contributes six points to category-level macro fit of 57.0 out of 100. The final score of 61.0 ranks below the top two categories, but its technical setup is robust: MACD bullish and improving, volume participation above average, and momentum confirmation at 100 all signal authentic accumulation rather than sentiment reversal. Liquidity stress subtracts four points and credit stress adds an unexpected two-point credit (the system flags defense as defensive duration), suggesting positioning is already tilted toward this exposure. For the category to leapfrog to top-2, timing would need to compress—XAR's fifty-point zero percent upside to resistance and only forty-six-point three percent downside to support leave asymmetry in favor of the macro case, but not the chart. If XLE or REMX falter or if new macro data favors geopolitical stress outright, Defense moves up the queue.
Technology — XLK
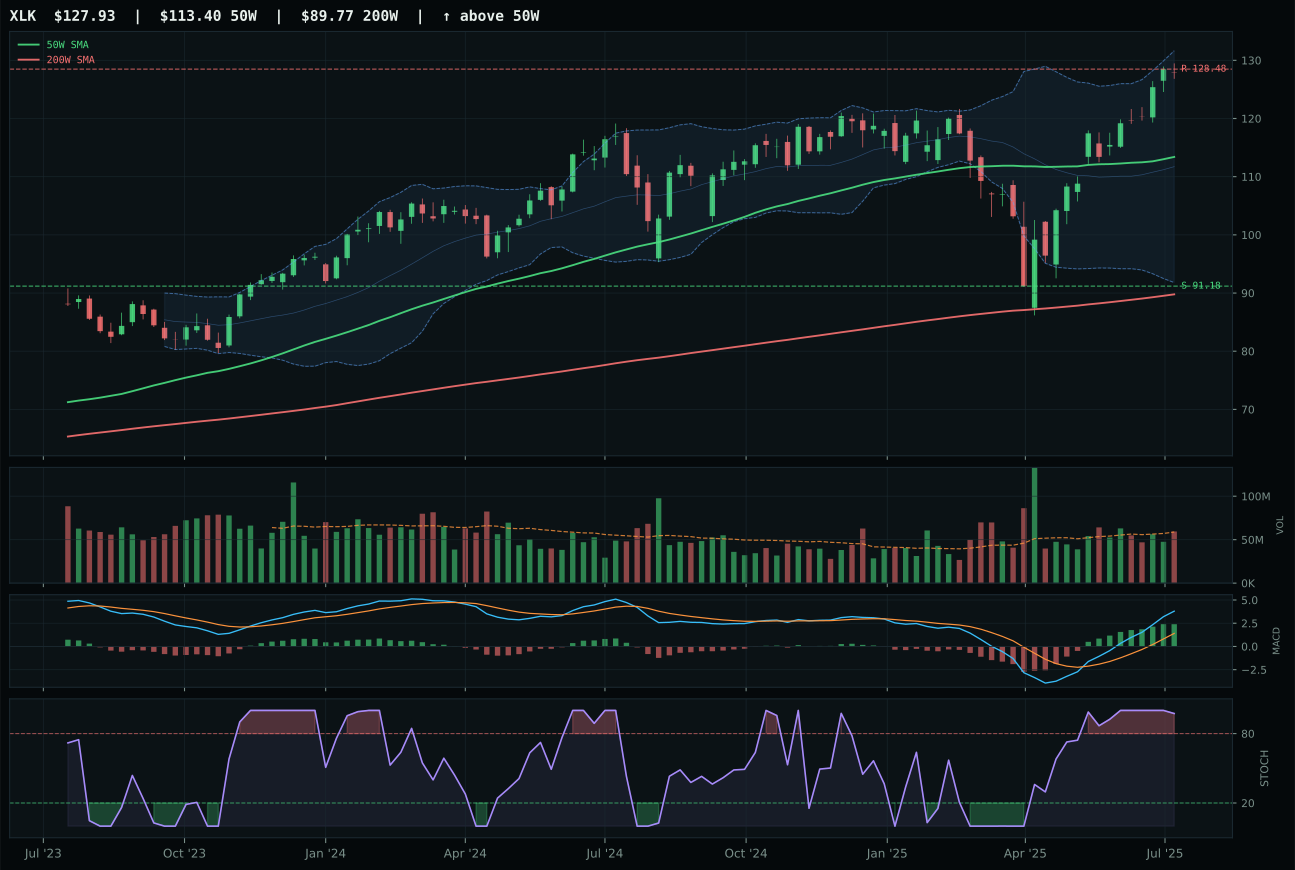
XLK has a neutral structure profile with 12.2% 13-week relative strength versus SPY.
A failed hold above support would weaken the setup.
Actionable but governed by invalidation levels.
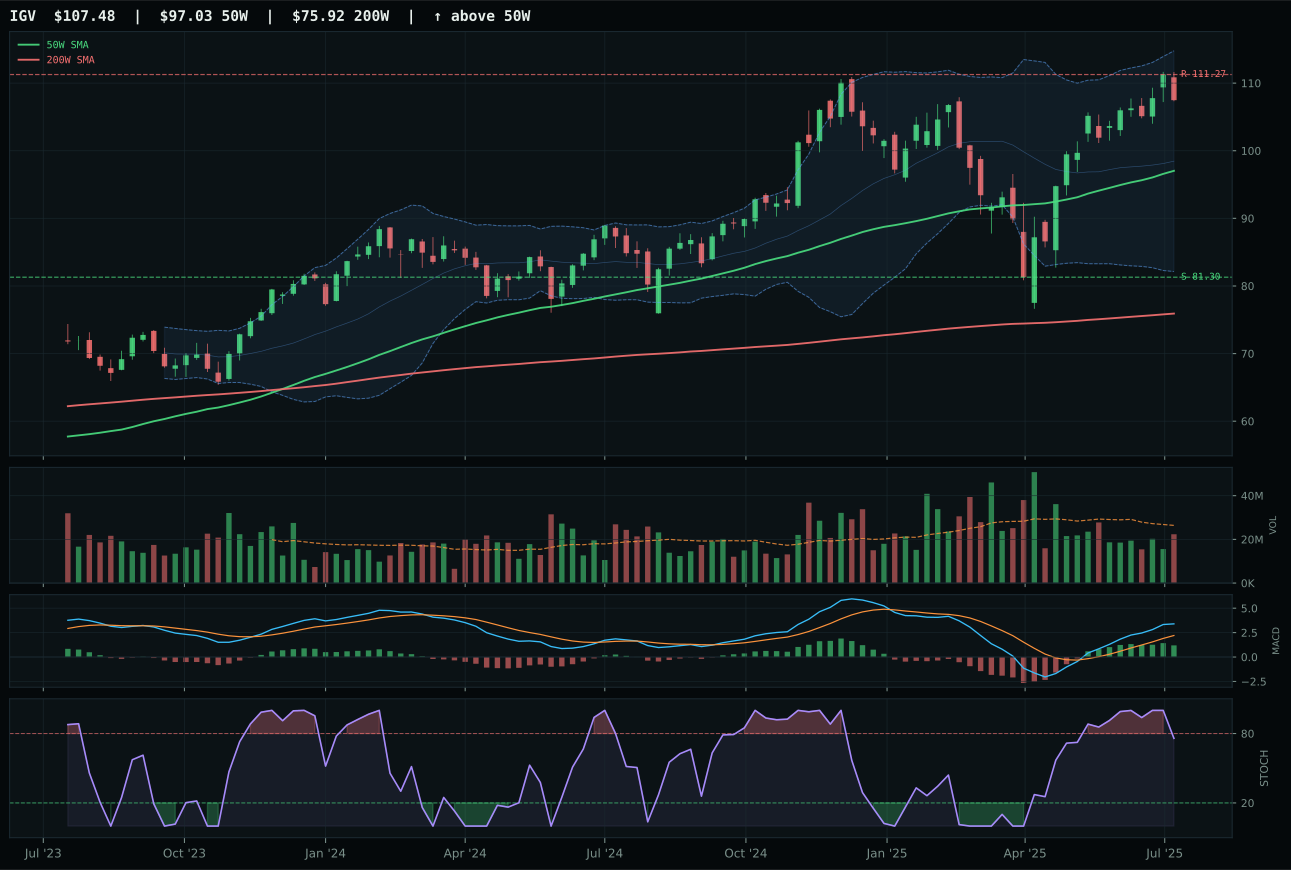
IGV has a neutral structure profile with 6.5% 13-week relative strength versus SPY.
A failed hold above support would weaken the setup.
Actionable but governed by invalidation levels.
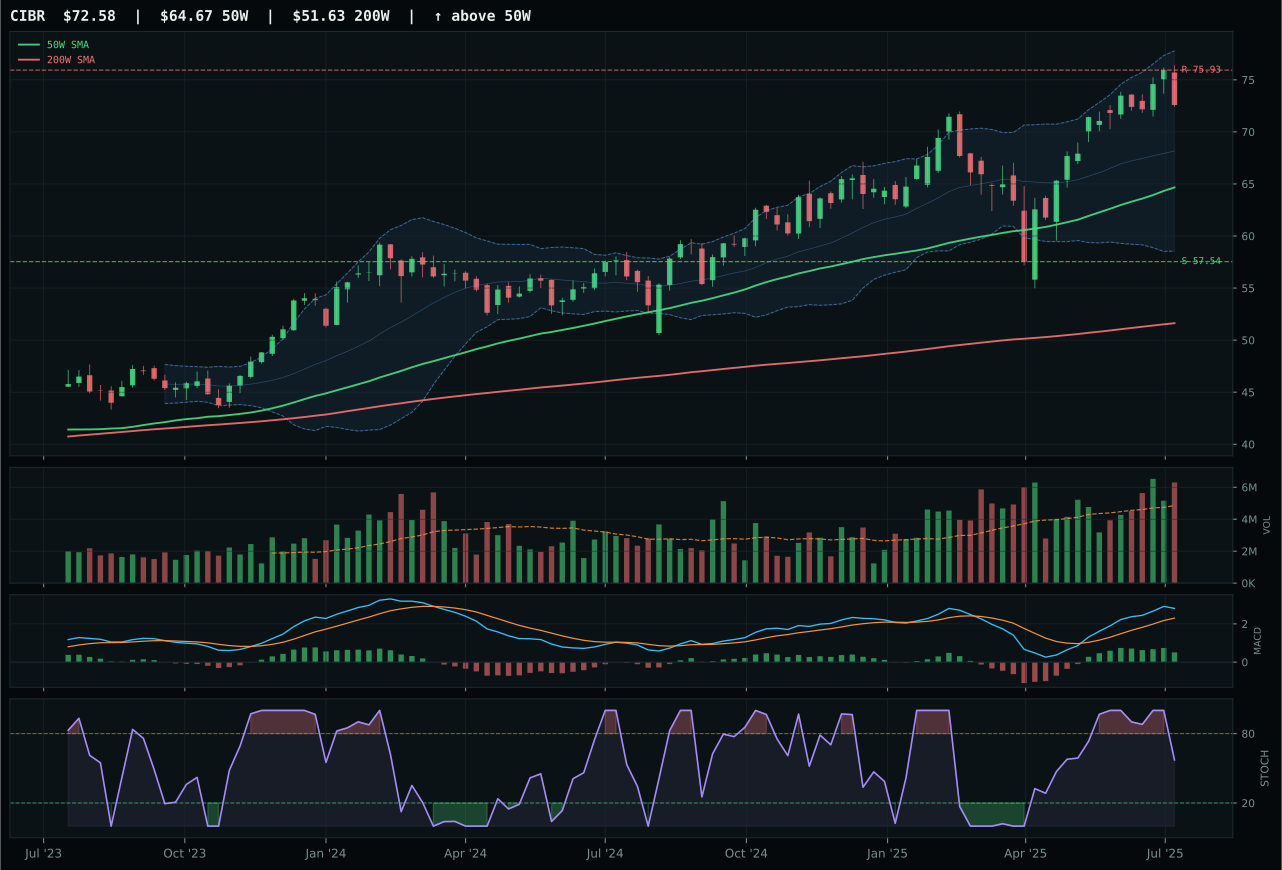
CIBR has a neutral structure profile with -0.8% 13-week relative strength versus SPY.
A failed hold above support would weaken the setup.
Actionable but governed by invalidation levels.
XLK wins the category on the strength of its internal dominance within the peer set, delivering a 5.7% outperformance versus the category median while posting a 29.0% thirteen-week return and 12.2% relative strength against SPY. Its MACD is bullish and improving—the real differentiator against IGV, which shows bullish but flattening momentum—and its 83.3 cleanliness score reflects a setup free of structural noise. The 13.0% distance from the 50W puts the ETF in the deep retracement zone near Fibonacci 0.618, offering risk-adjusted entry; volume is neutral at 1.01x the twenty-day average, so accumulation is steady without the false-demand signals that plague extended moves. IGV's category-relative strength languished at 0.0%, a decisive gap when both are trading above their major moving averages and macro regime is favoring risk appetite.
Technology lands at 5% allocation—tier-2 status—because its final score of 58.7 ranked below two higher-scoring eligible categories this week. The macro backdrop is mixed for broad tech: risk appetite positive adds nine points and AI growth sponsorship contributes six, but liquidity stress subtracts ten and credit stress removes seven, netting to a category-level macro fit of just 44.0 out of 100. Late-Cycle Reflation ordinarily favors cyclical rotation away from duration-sensitive growth names like IGV, and that friction shows in the timing component. XLK's lean toward profitable hardware and systems—less sensitive to rate pressure—edges ahead on technical merit, but the category itself remains structurally challenged. For Technology to earn top-2 status, the stochastic RSI would need to stop rolling over at overbought, MACD would need to show genuine acceleration rather than improvement from a base, and category-relative breadth in IGV and CIBR would need to narrow the gap.
Utilities & Infrastructure — PAVE
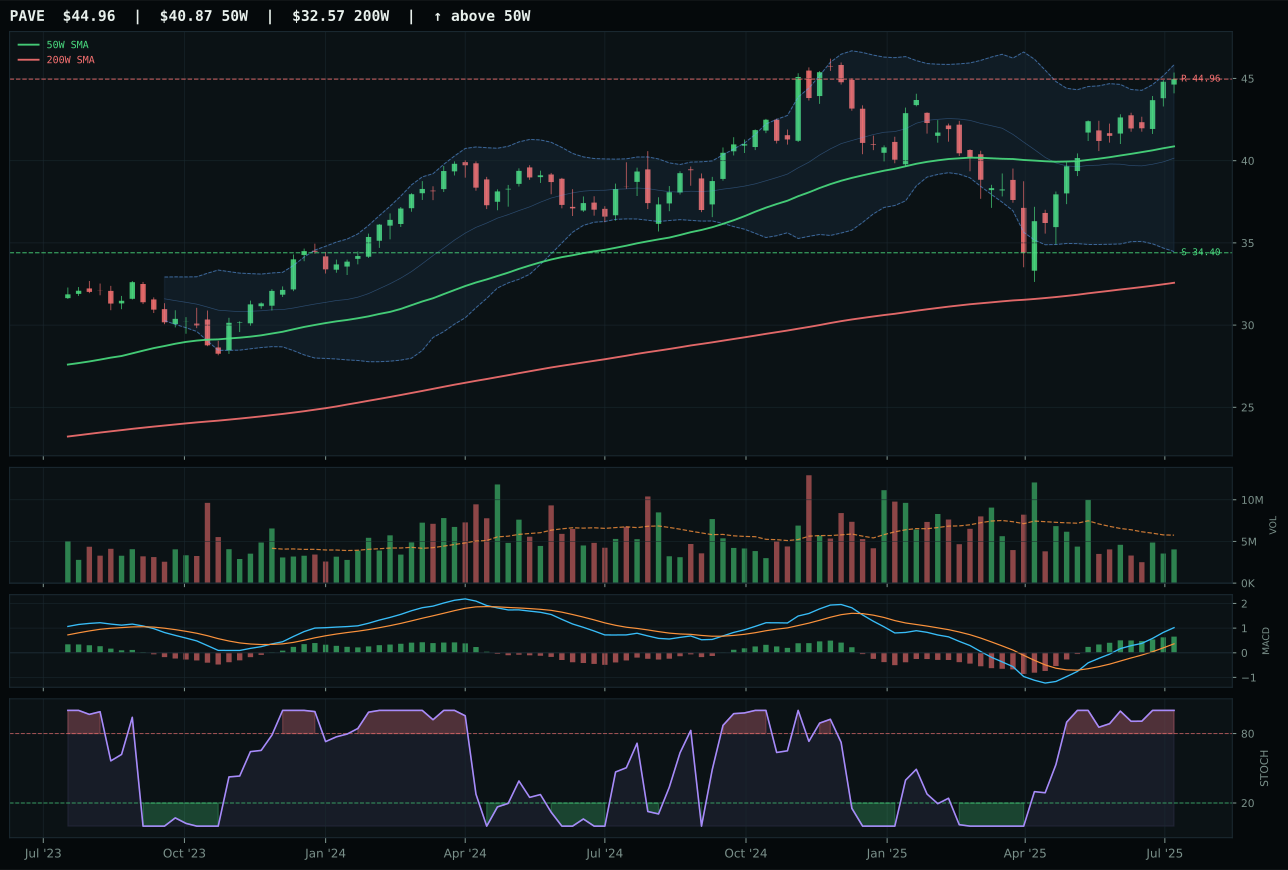
PAVE has a neutral structure profile with 7.0% 13-week relative strength versus SPY.
A failed hold above support would weaken the setup.
Actionable but governed by invalidation levels.
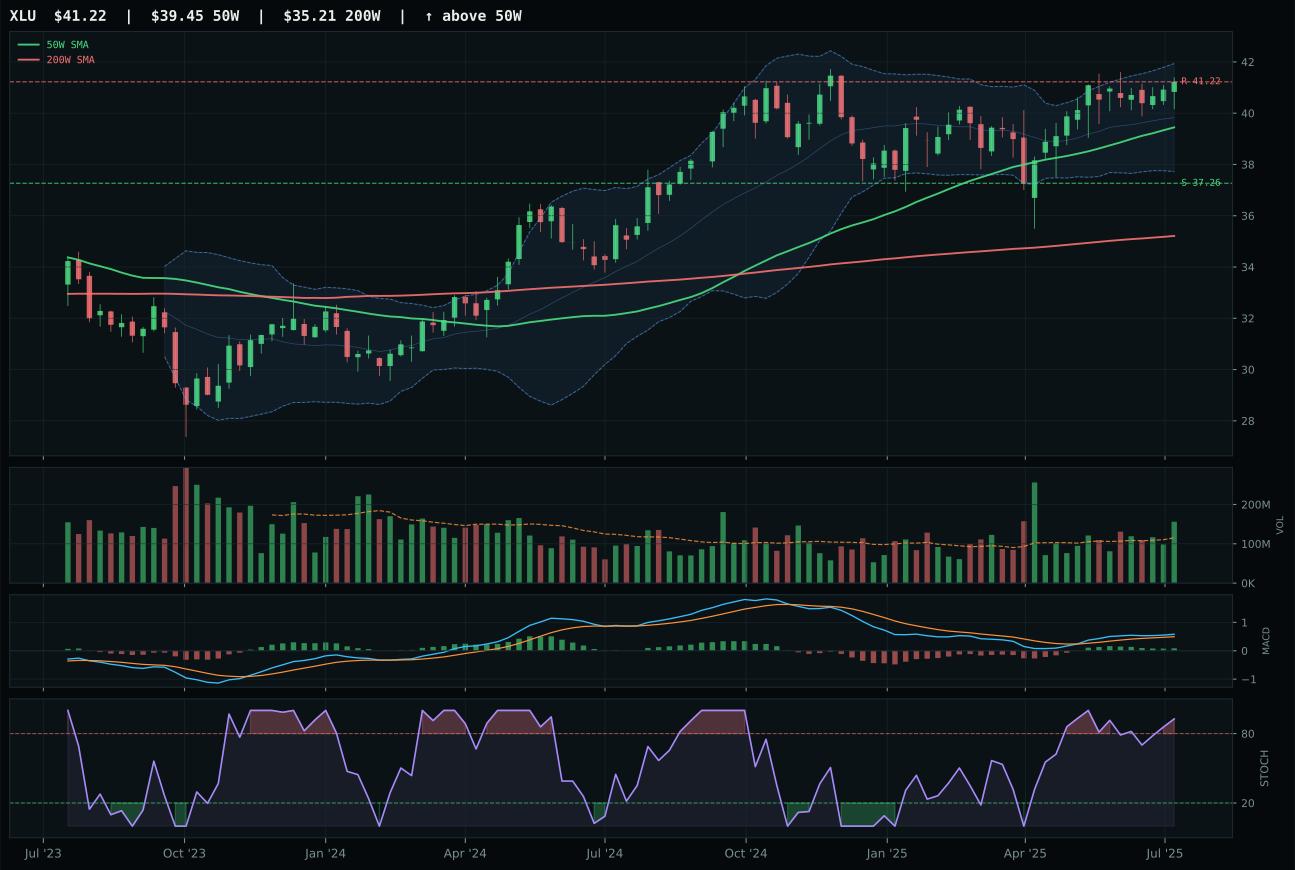
XLU has a neutral structure profile with -8.8% 13-week relative strength versus SPY.
A failed hold above support would weaken the setup.
Actionable but governed by invalidation levels.
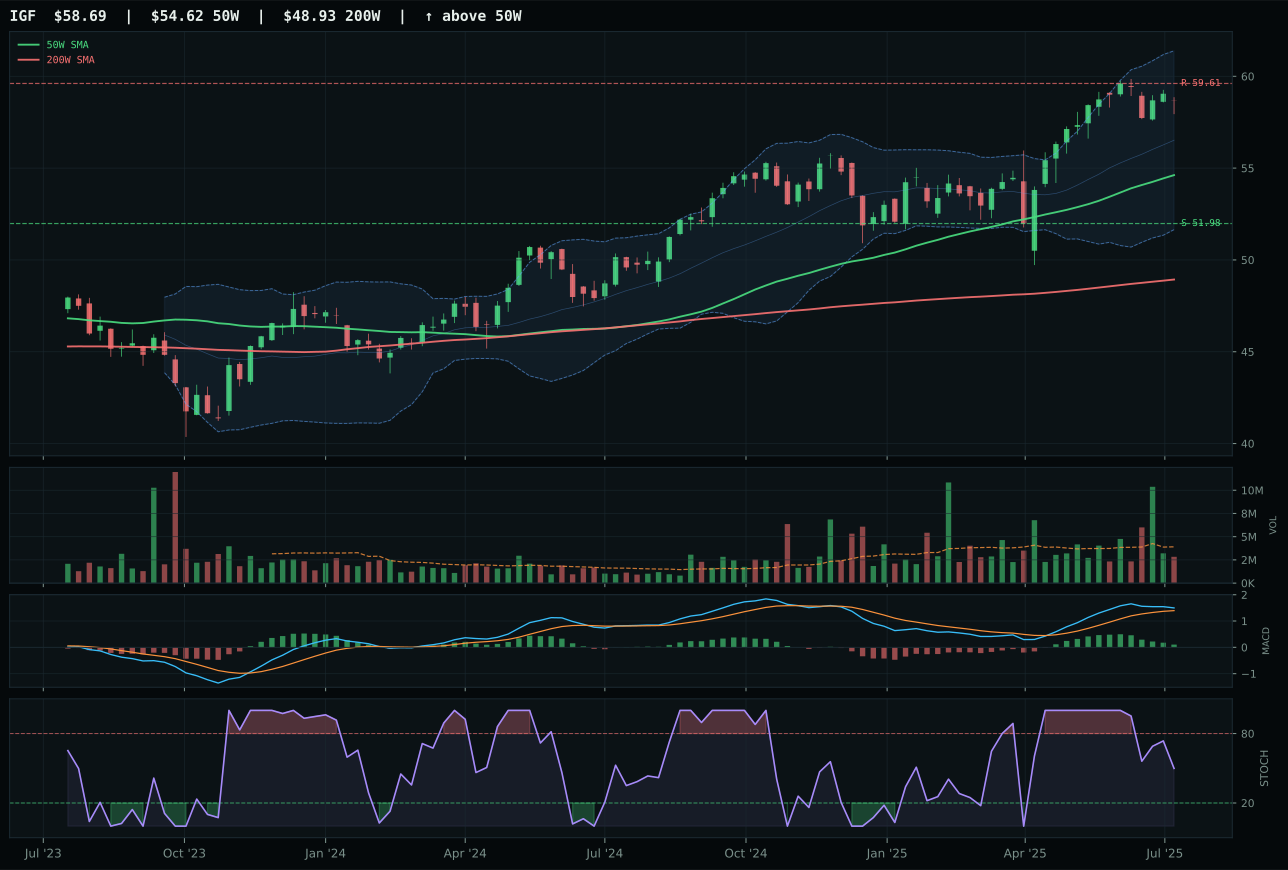
IGF has a neutral structure profile with -7.7% 13-week relative strength versus SPY.
A failed hold above support would weaken the setup.
Actionable but governed by invalidation levels.
PAVE wins on category-relative strength dominance at plus-fourteen-point-seven percent and bullish-and-improving MACD that separates it cleanly from XLU's bullish-but-flattening momentum signature. Both names show overbought stochastic RSI at momentum, yet PAVE's trend component at 100 out of 100 and full-price-above-both-moving-averages structure signal genuine strength, while XLU's eighty-three-point trend reflects less conviction. PAVE's twenty-three-point-eight percent thirteen-week return versus XLU's eight percent tells the domestic infrastructure and capex-beta narrative story: policy stimulus is flowing to pave-and-build, not regulated-utility duration. PAVE's thin-participation volume at zero-point-seven-times the twenty-day is a constraint on size, but it's paired with MACD improvement suggesting institutional accumulation is just beginning. The eight-point-six-point gap between PAVE's seventy-point-seven reasoned score and XLU's fifty-seven-point-seven is decisive; XLU is a defensive utility trade, PAVE is a capex-sponsorship trade.
Utilities & Infrastructure earns 5% allocation—tier-2 status—despite strong technical confirmation in PAVE (eighty-one-point-eight technical evidence) because category-level macro fit is only forty-three out of 100, dragged down by inflation-pressure active descriptor at minus-six and risk-appetite-positive at minus-two. Late-Cycle Reflation regime typically punishes rate-sensitive utilities due to Fed tightening bias, but PAVE's domestic infrastructure angle partially offsets that drag. The category's ranking below REMX, XLE, URNM, XAR, MOO, SMH, and XLK reflects a structural tension: technical strength exists in PAVE's momentum and trend confirmation, but macro regime headwinds constrain allocation sizing. For Utilities to climb to top-2, inflation-pressure descriptor would need to flip inactive, or new macro data would need to signal policy pivot toward infrastructure spending that overrides rate concerns. Alternatively, if credit stress descriptors show stress, XLU's duration profile could suddenly become attractive. Right now, tier-2 5% appropriately reflects real capex narrative (PAVE) without overcommitting to a category where macro regime is headwind.
Agriculture & Livestock — MOO
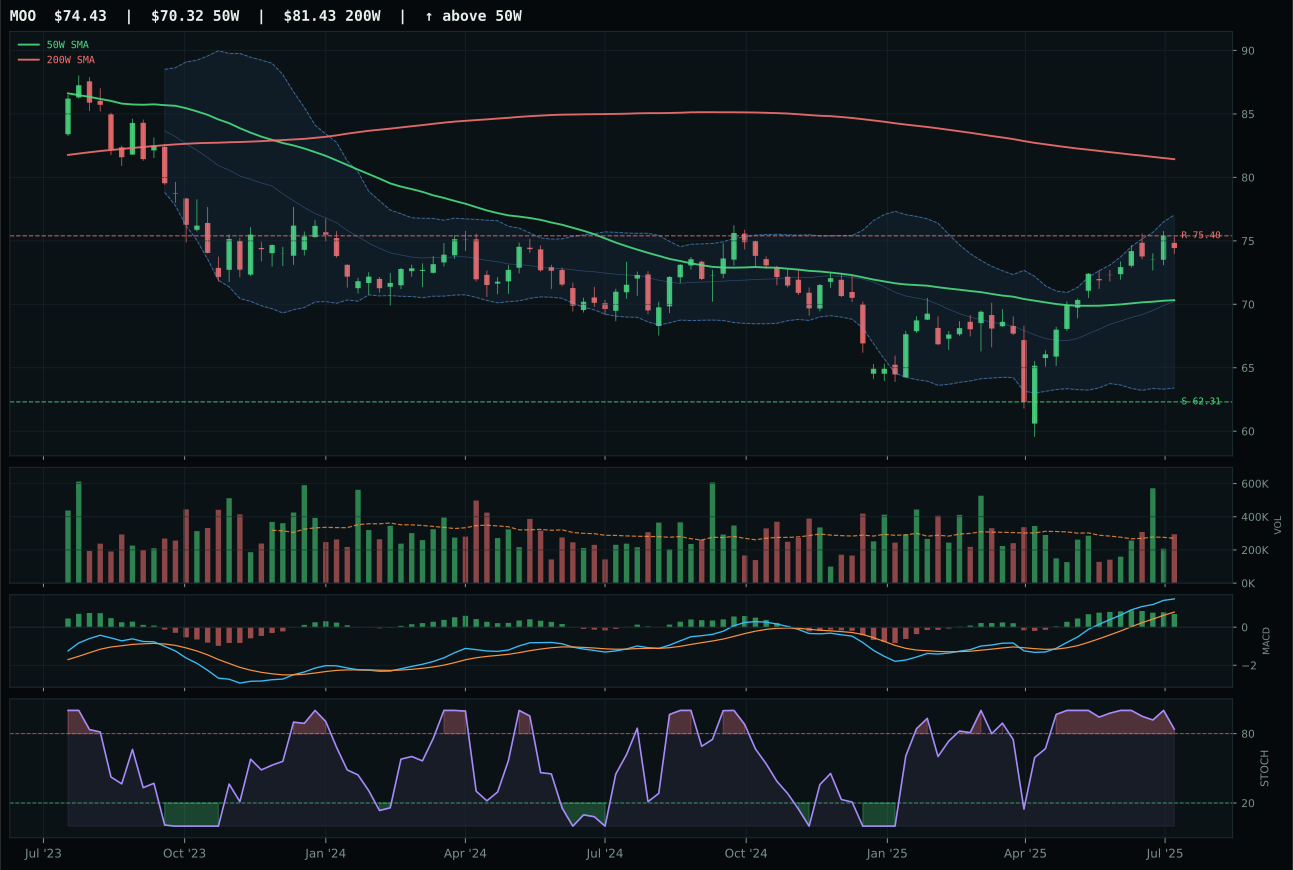
MOO has a neutral structure profile with -2.6% 13-week relative strength versus SPY.
A failed hold above support would weaken the setup.
Actionable but governed by invalidation levels.
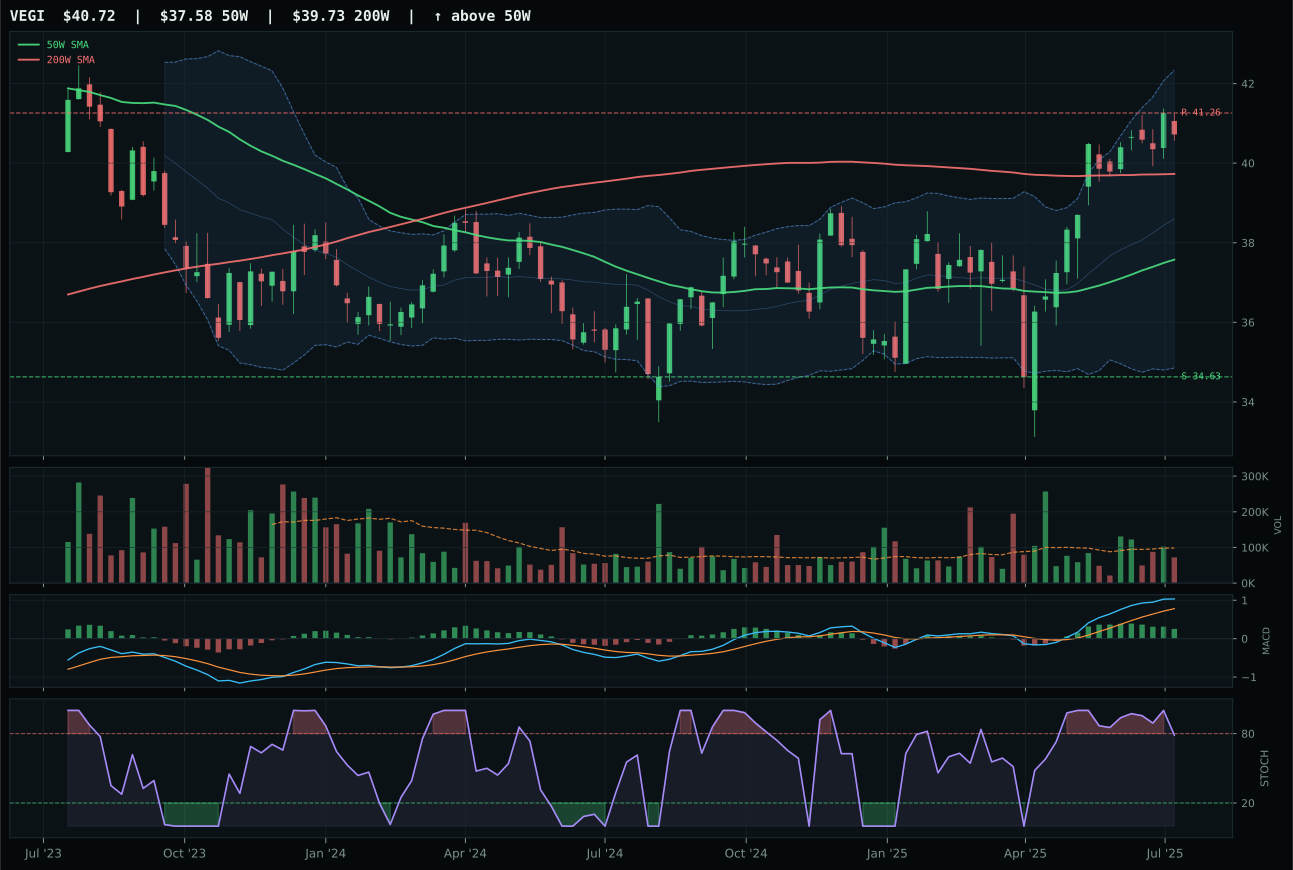
VEGI has a neutral structure profile with -4.5% 13-week relative strength versus SPY.
A failed hold above support would weaken the setup.
Tracked, but not top-2 eligible because: .
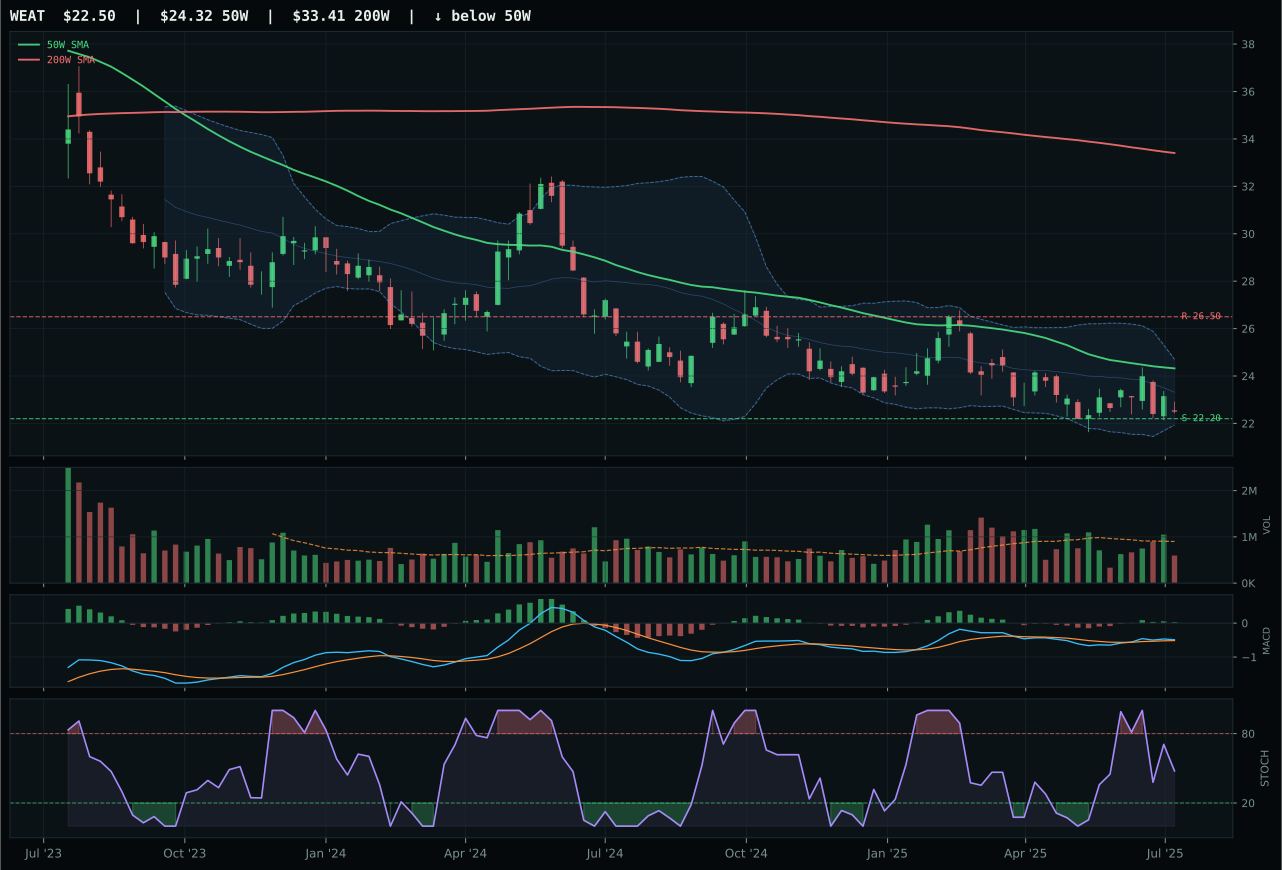
WEAT has a pullback into support profile with -23.6% 13-week relative strength versus SPY.
Extension and support failure are the main tactical risks.
Tracked, but not top-2 eligible because: structurally broken.
MOO wins because it is the only name in the category where technical evidence and macro narrative align; its fifty-point four technical score is low relative to VEGI's clean setup, but its macro fit of seventy out of 100 reflects authentic supply-shortage sponsorship, real asset momentum, and inflation pressure all pointing to agribusiness equity. The thirty-point eight percent downside to support (62.31) and minus-one-point three percent upside to resistance (75.40) offer a steep asymmetry against fresh entrants, yet MOO's MACD is bullish-but-flattening and momentum confirmation sits at just 61.0 out of 100—clear signals that the move is stalling. Its thirteen-week return of fourteen-point two percent is modest next to the category's macro thesis, yet category-relative strength of two percent edges out VEGI's zero percent, and the structure at 78.0 is cleaner than VEGI's 73.5. The fourteen-point six-point gap is decisive only because VEGI's technical evidence deteriorates faster; both are weak on the chart.
Agriculture earns 5% allocation—tier-2 status—on the strength of its category-level macro fit of ninety out of 100, the highest in the entire portfolio, driven by supply shortage at plus thirteen, inflation pressure at plus ten, and real asset sponsorship at plus eight. Yet the final category score drops to forty-point nine out of 100 because technical evidence is weak across all three names; MOO's fifty-point four technical score is the category high, and its trend component is only 72.2 out of 100 because price sits above the fifty-week but below the two-hundred-week—a pattern that typically marks the tail end of a corrective bounce. VEGI's thin-participation volume and falling stochastic RSI suggest the category's conviction is evaporating. For Agriculture to justify top-2 status, MACD would need to shift from bullish-but-flattening to bullish-and-accelerating, volume would need to spike above one-point five-times the twenty-day average, and the risk-reward would need to invert—right now the downside cushion far exceeds any upside target. Macro support is real, but technicals are fading.
Precious Metals — SLV
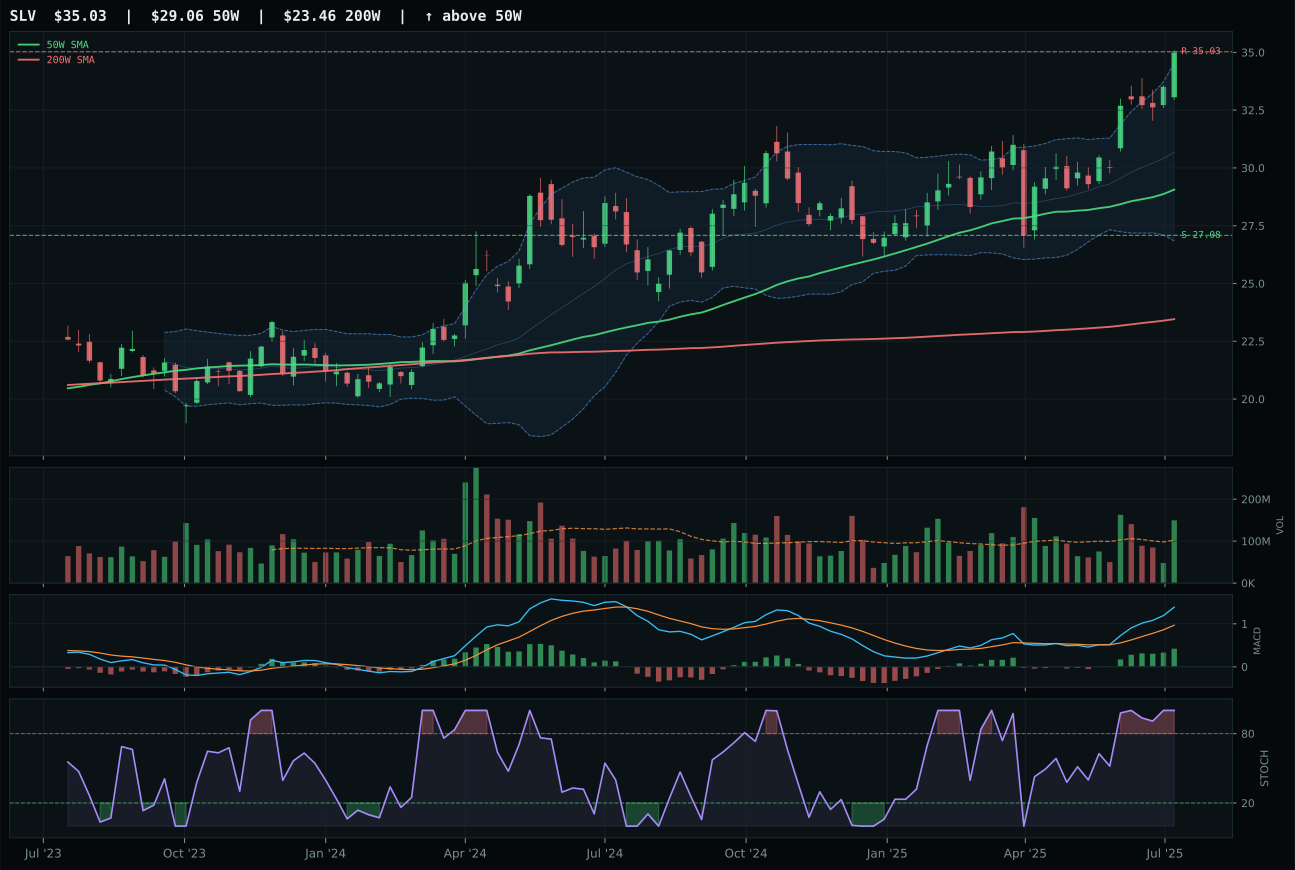
SLV has a vertical extension profile with 3.2% 13-week relative strength versus SPY.
A failed hold above support would weaken the setup.
Actionable but governed by invalidation levels.
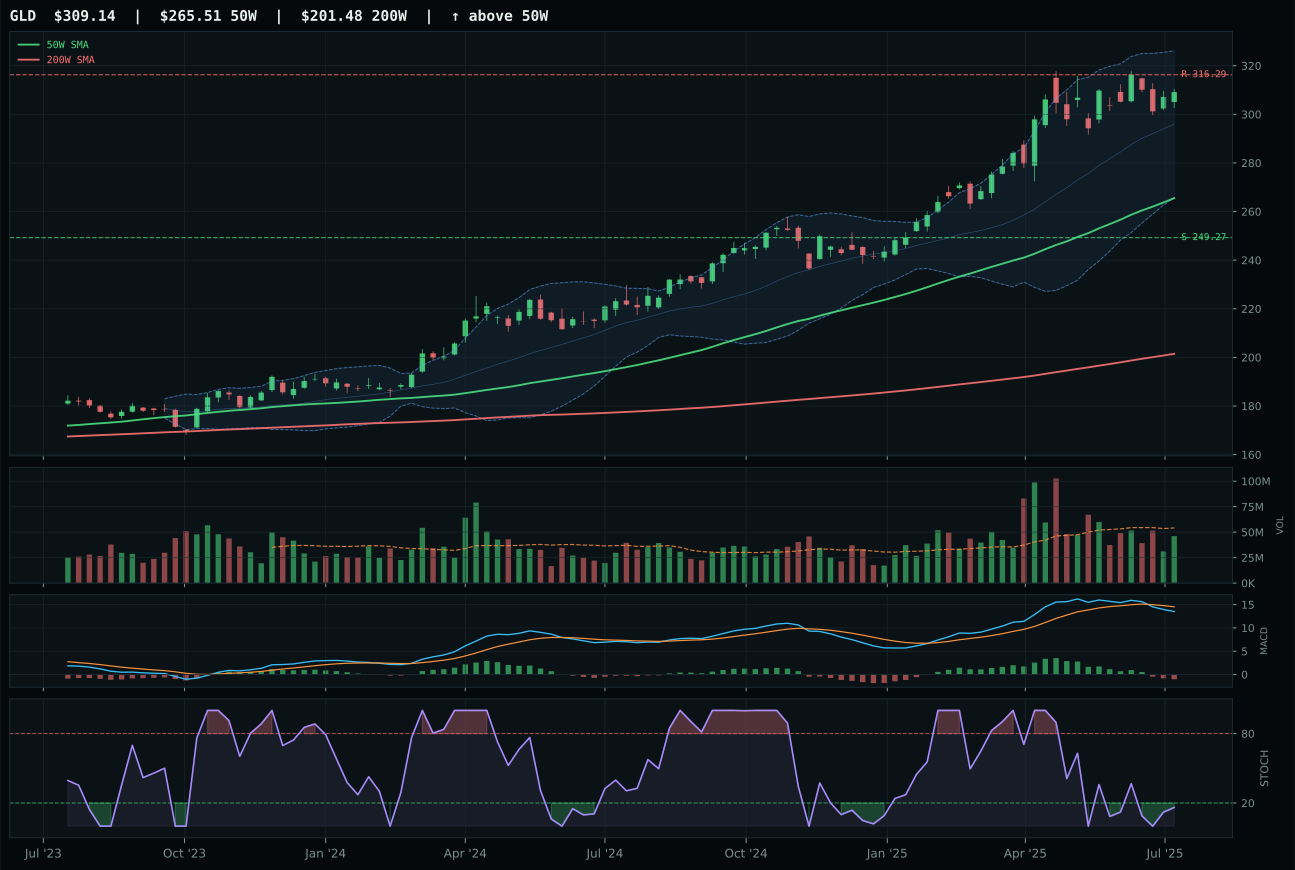
GLD has a vertical extension profile with -13.0% 13-week relative strength versus SPY.
A failed hold above support would weaken the setup.
Actionable but governed by invalidation levels.
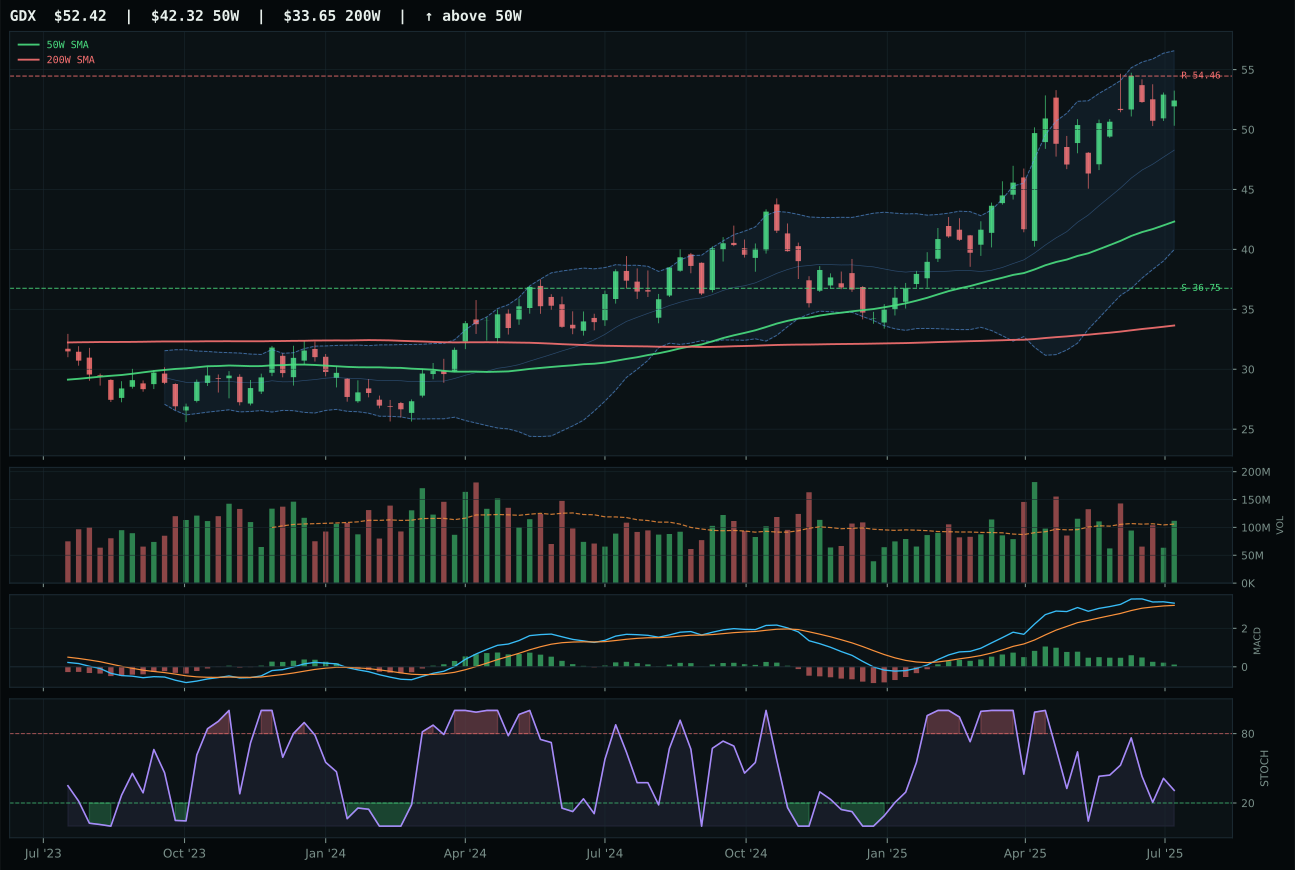
GDX has a vertical extension profile with -11.3% 13-week relative strength versus SPY.
A failed hold above support would weaken the setup.
Actionable but governed by invalidation levels.
SLV wins the category decisively against GLD despite both sitting in vertical extension—a setup ordinarily flagged as late-stage momentum—because SLV delivers sustained MACD improvement, above-average volume participation at one-point four-six-times the twenty-day average, and a category-relative strength advantage of fourteen-point five percent that proves silver's hybrid monetary-and-industrial beta is being accumulated actively. Its twenty-point zero percent thirteen-week return and technical evidence of ninety-point two out of 100 stand in stark contrast to GLD's bearish-and-weakening MACD, oversold stochastic RSI, and minus-thirteen percent relative weakness versus SPY. The twenty-three-point seven-point gap between SLV's reasoned score of 78.5 and GLD's 26.5 reflects a category fracture: silver is being bought as a real asset inflation hedge, while gold's monetary-pure positioning is being rejected in a late-cycle reflation regime where risk appetite is positive and credit stress is active.
Precious Metals earns 0% allocation this week, excluded from portfolio deployment despite SLV's strong technical setup. The category ranks ninth or tenth because its final score of 35.4 trails all tier-2 candidates; category-level macro fit is only forty-six out of 100, anchored by negative ten-point weighting for risk-appetite-positive active descriptor. Late-Cycle Reflation explicitly favors real assets like energy and industrial metals over traditional safe-haven metals, and that shift is showing in GLD's bearish MACD divergence—a rare technical breakdown in a name that usually benefits from currency or liquidity stress. For Precious Metals to earn even 5% allocation, SLV's timing component would need to compress—the thirty-seven-point zero out of 100 timing score shows it is extended and vulnerable to pullback—and the risk-reward would need to invert meaningfully. Additionally, liquidity stress would need to flip from inactive to active, or inflation-pressure magnitude would need to spike sharply. Right now, the portfolio's exposure to real assets is better served through energy scarcity and industrial metals accumulation, which are both technically and macro-normalized superior.
Emerging Markets — IEMG
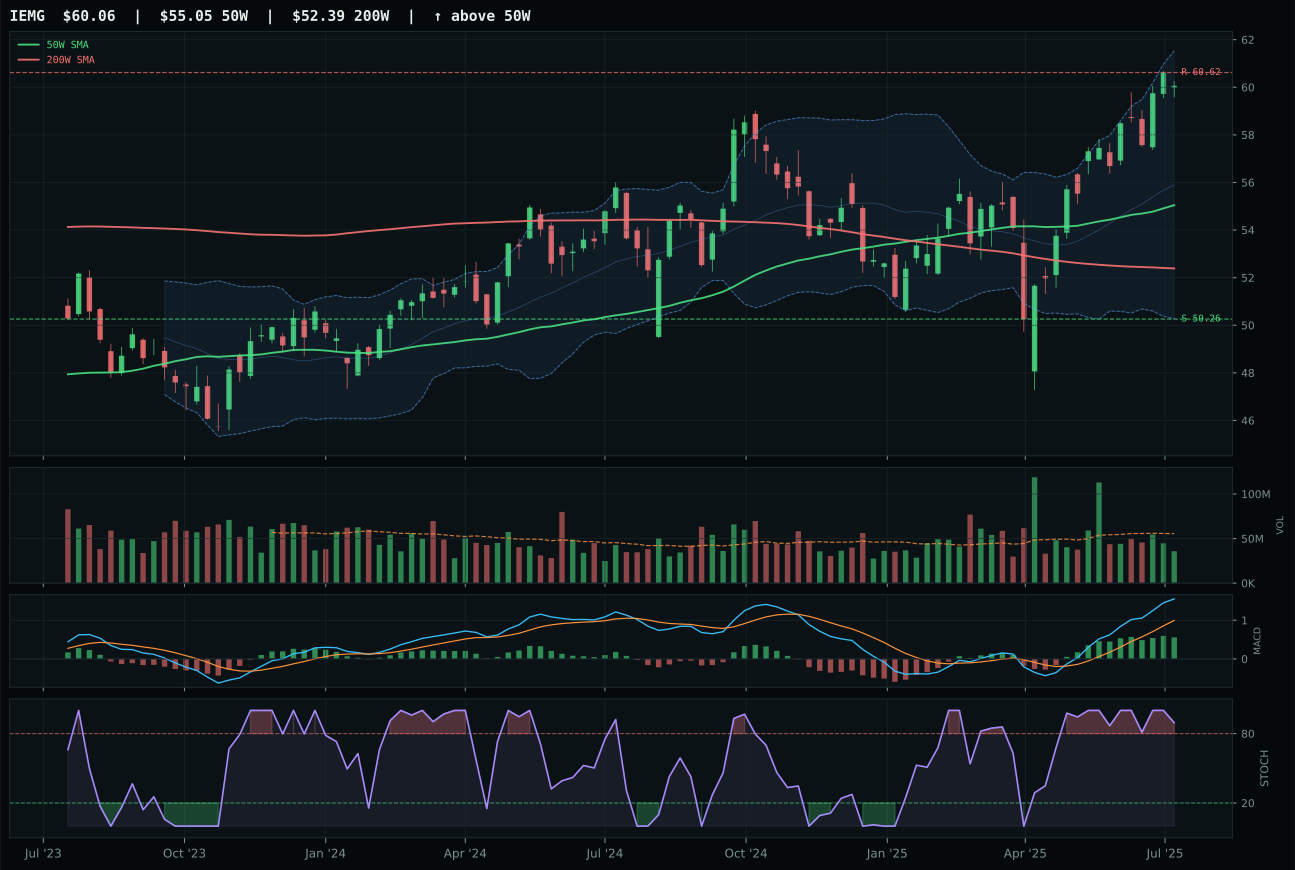
IEMG has a neutral structure profile with -0.5% 13-week relative strength versus SPY.
A failed hold above support would weaken the setup.
Actionable but governed by invalidation levels.
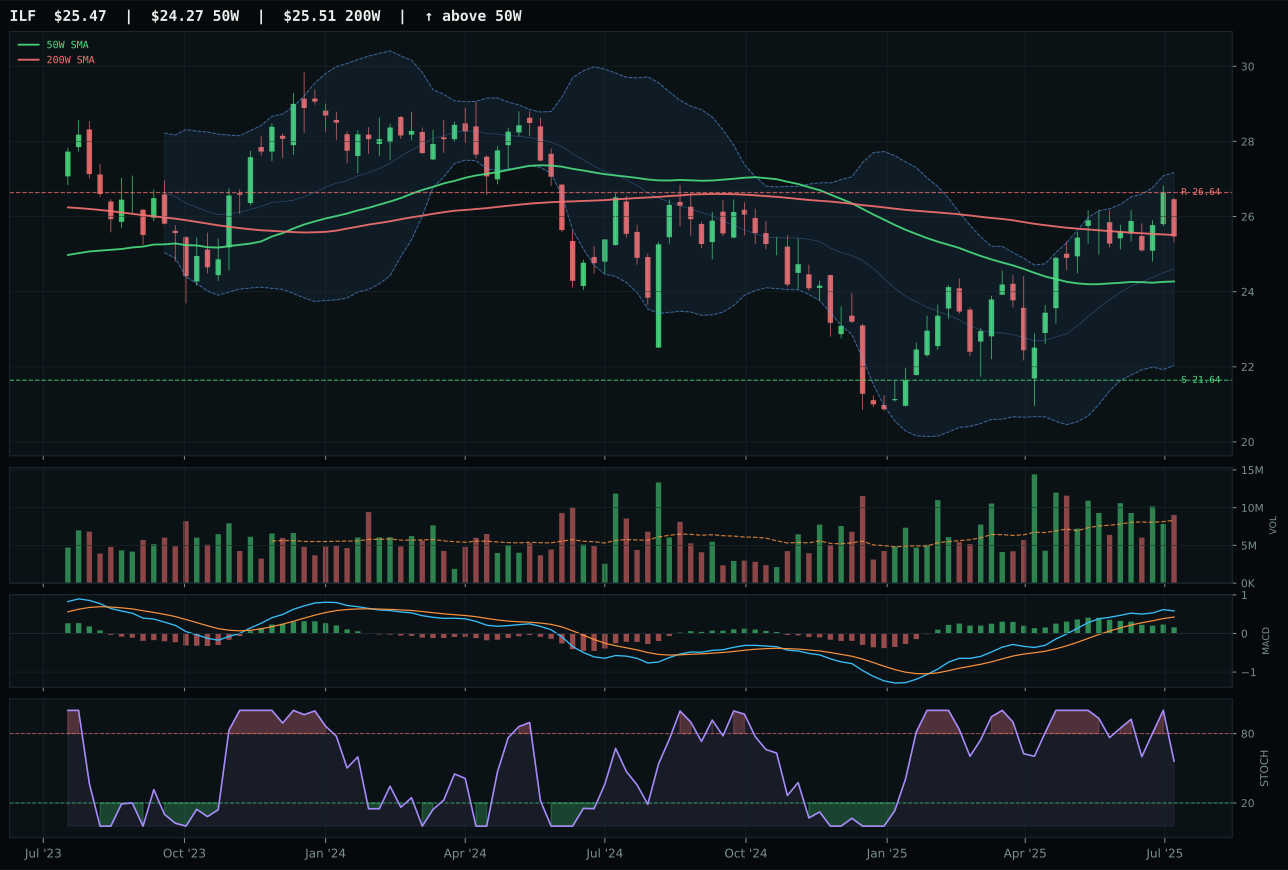
ILF has a neutral structure profile with -3.6% 13-week relative strength versus SPY.
A failed hold above support would weaken the setup.
Actionable but governed by invalidation levels.
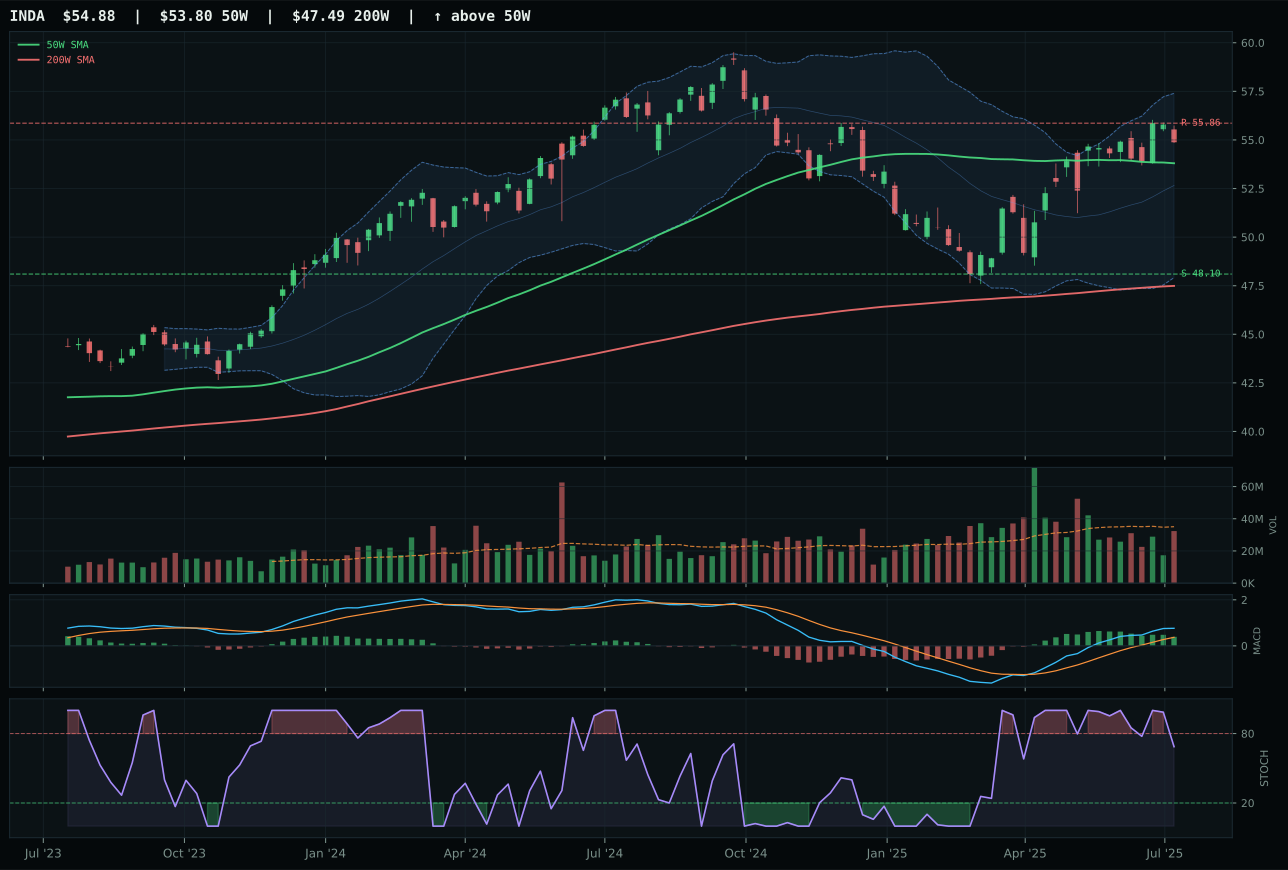
INDA has a compression near 50W profile with -8.7% 13-week relative strength versus SPY.
A failed hold above support would weaken the setup.
Actionable but governed by invalidation levels.
IEMG wins the category by thin margin over ILF, posting eighty-five-point-two trend score reflecting price above both the fifty-week and two-hundred-week, versus IEMG's neutral structure that does not compress or extend. Its thirteen-week return of sixteen-point-three percent and category-relative strength of three-point-one percent edge out ILF's equivalent metrics, but the real separator is MACD: IEMG's bullish-but-flattening MACD is standard late-cycle tech, whereas ILF shows falling-neutral stochastic RSI, suggesting Latin America's commodity beta is rolling over. IEMG's broad emerging-market beta is in compression near its fifty-week with nine-point-one percent distance, offering a coiled setup, whereas ILF sits higher in the retracement zone with stochastic falling. The risk-reward asymmetry slightly favors IEMG at thirty-seven-point-nine out of 100, but both names carry thin-participation volume that signals institutional conviction is low across the category.
Emerging Markets receives 0% allocation this week, ranked ninth or tenth, because its final score of thirty-point-eight is the lowest of all categories despite IEMG showing valid technical evidence. Category-level macro fit is only thirty-eight out of 100, anchored by minus-ten-point weighting for both credit stress and liquidity stress active descriptors, which are headwinds to EM structural flows. Risk appetite positive adds eight points, but the negative feedback dominates. Late-Cycle Reflation regime typically rotates capital away from emerging markets toward domestic infrastructure and real assets, and that rotation is visible in both IEMG and ILF showing bullish-but-flattening MACD rather than improving momentum. For Emerging Markets to earn a 5% allocation slot, credit stress would need to flip from active to inactive, or liquidity stress would need to show signs of release. Alternatively, if commodity breadth positive narrator strengthens materially (currently only ILF is capturing that signal at plus five), category macro fit could improve. Right now, the portfolio's risk-appetite positioning is better served through AI, Defense, and Energy rather than broad EM exposure, which is technically stalling and macro-constrained.