
2025-07-04
Informational purposes only. The content in this report, including allocations, analysis, and commentary, is provided solely for informational and educational purposes. It does not constitute financial advice, investment advice, trading advice, or any other type of advice. Past performance does not guarantee future results. Always conduct your own research and consult a qualified financial professional before making investment decisions.
Weekly Allocation
| Ticker | Category | Weight | Role |
|---|---|---|---|
| FBTC | 50% | Overlay | |
| COPX | Industrial Metals | 10% | Top-2 (10%) |
| URNM | Nuclear Energy | 10% | Top-2 (10%) |
| SMH | AI | 5% | Tier-2 (5%) |
| XLK | Technology | 5% | Tier-2 (5%) |
| PAVE | Utilities & Infrastructure | 5% | Tier-2 (5%) |
| XLE | Traditional Energy | 5% | Tier-2 (5%) |
| SLV | Precious Metals | 5% | Tier-2 (5%) |
| XAR | Defense & Aerospace | 5% | Tier-2 (5%) |
Trade Instructions — Monday Open
Sell the tranche from 2025-06-06 (completing its 4-week hold). Buy the new tranche. Instructions show net portfolio changes — same-asset positions cancel, weight changes show the delta.
| Action | Ticker | Instruction |
|---|---|---|
| SELL | SLV | Sell 14% of SLV position (reduce 8.75% → 7.50%) |
| SELL | XLK | Sell 17% of XLK position (reduce 7.50% → 6.25%) |
| SELL | XLU | Sell 50% of XLU position (reduce 2.50% → 1.25%) |
| SELL | URA | Sell 20% of URA position (reduce 6.25% → 5.00%) |
| SELL | IEMG | Sell 50% of IEMG position (reduce 2.50% → 1.25%) |
| BUY | COPX | Buy COPX — 20.00% of freed cash (adds 1.25% to portfolio) |
| BUY | URNM | Buy URNM — 40.00% of freed cash (adds 2.50% to portfolio) |
| BUY | PAVE | Buy PAVE — 20.00% of freed cash (adds 1.25% to portfolio) |
| BUY | XLE | Buy XLE — 20.00% of freed cash (adds 1.25% to portfolio) |
Current Portfolio After Trade
Combined holdings across all 4 active tranches. Each tranche is 25% of the portfolio.
| Ticker | % of Portfolio | Weight Bar |
|---|---|---|
| FBTC | 50.00% | |
| SLV | 7.50% | |
| XLK | 6.25% | |
| SMH | 6.25% | |
| COPX | 6.25% | |
| URA | 5.00% | |
| XAR | 3.75% | |
| URNM | 3.75% | |
| FCG | 2.50% | |
| PAVE | 2.50% | |
| XLU | 1.25% | |
| IEMG | 1.25% | |
| IGF | 1.25% | |
| ITA | 1.25% | |
| XLE | 1.25% |
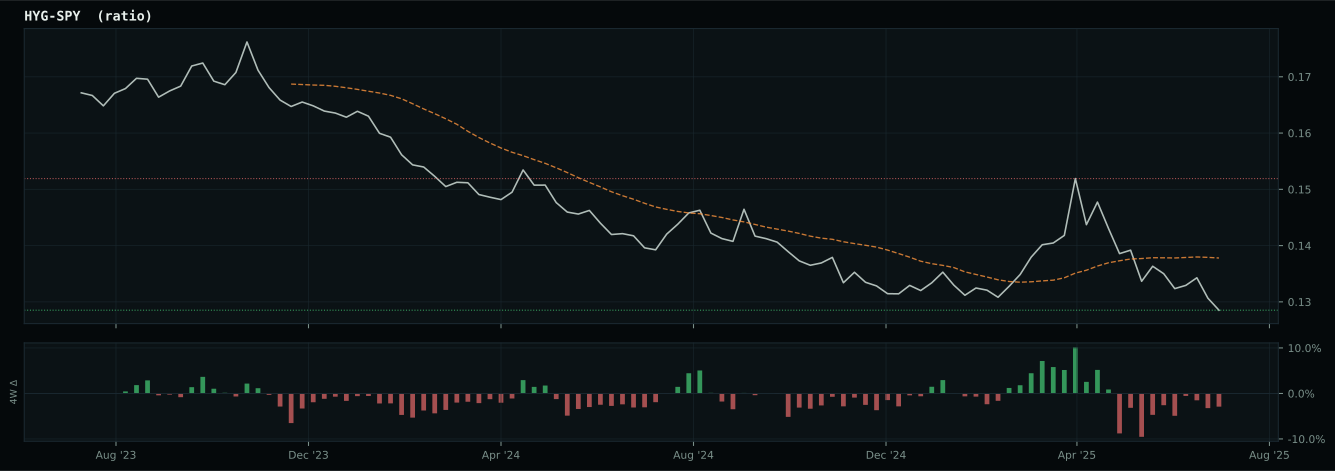
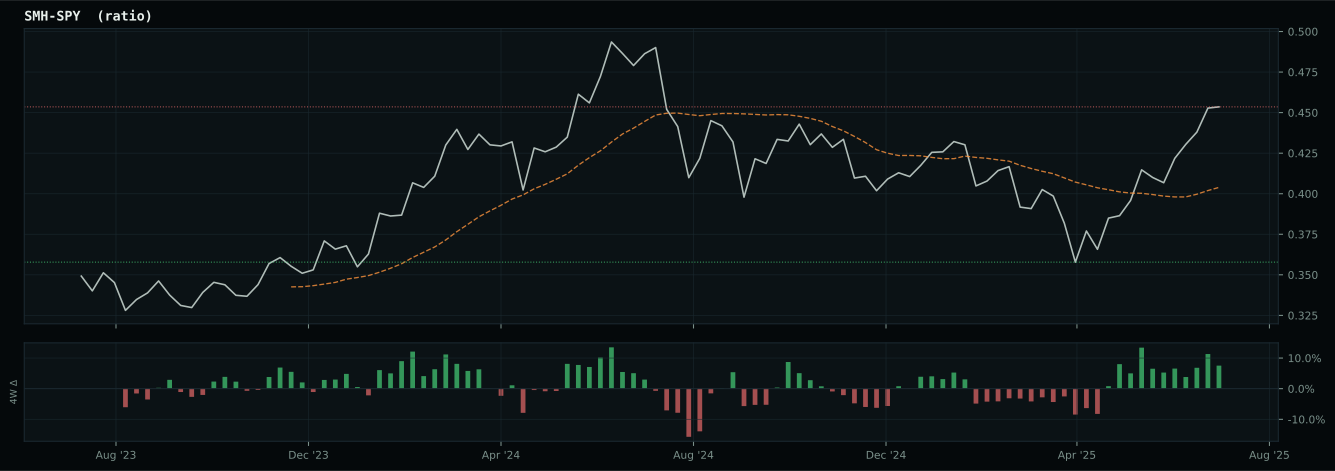
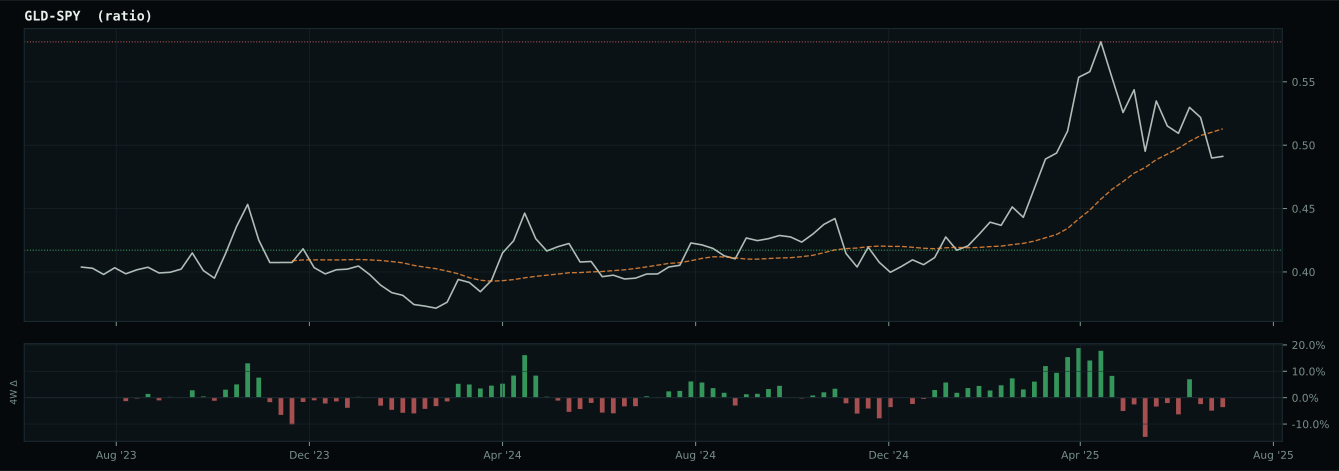
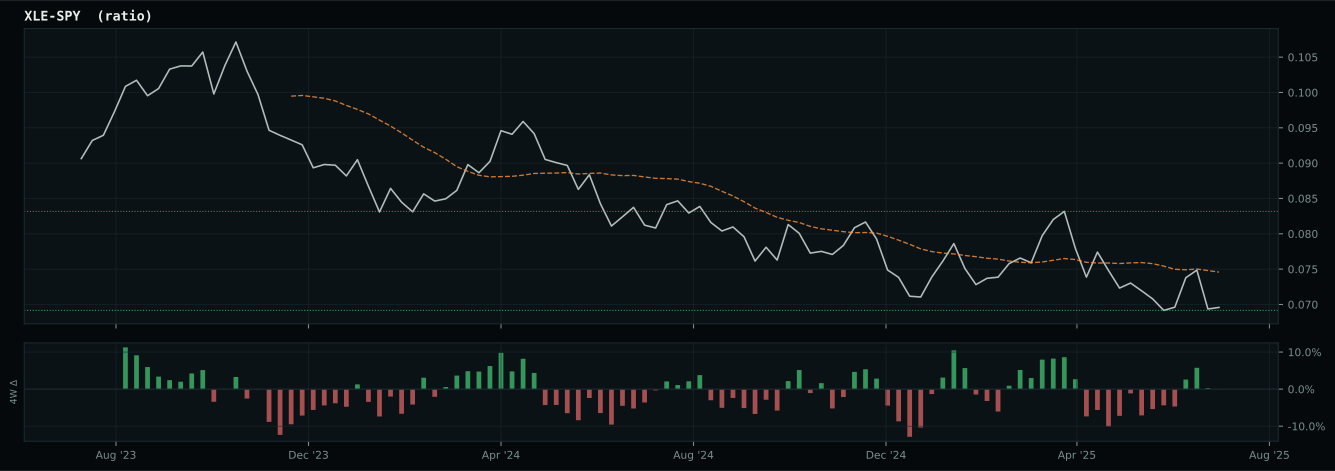
Macro Regime — Risk-Off Deterioration
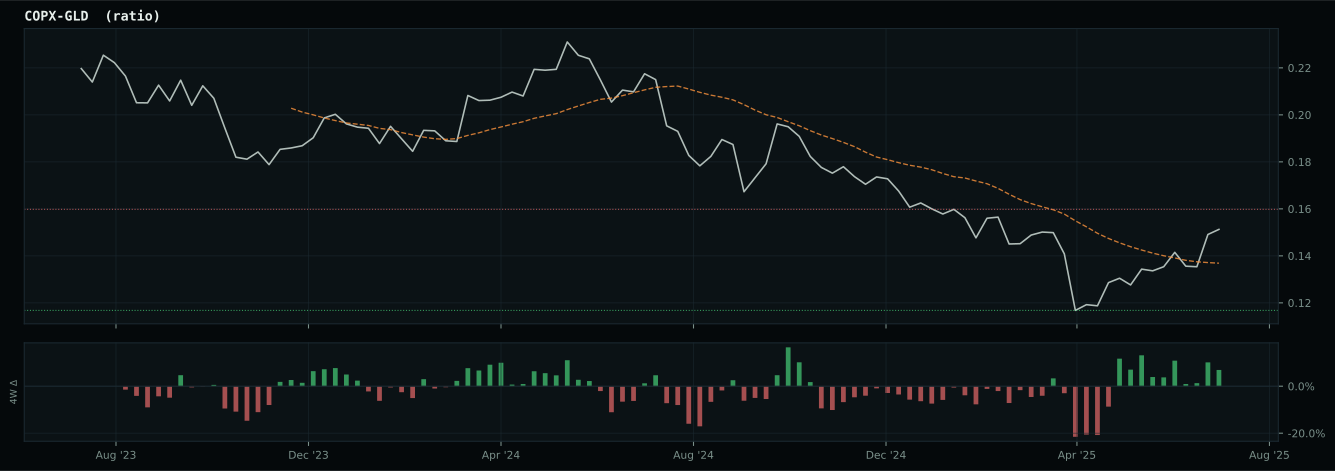
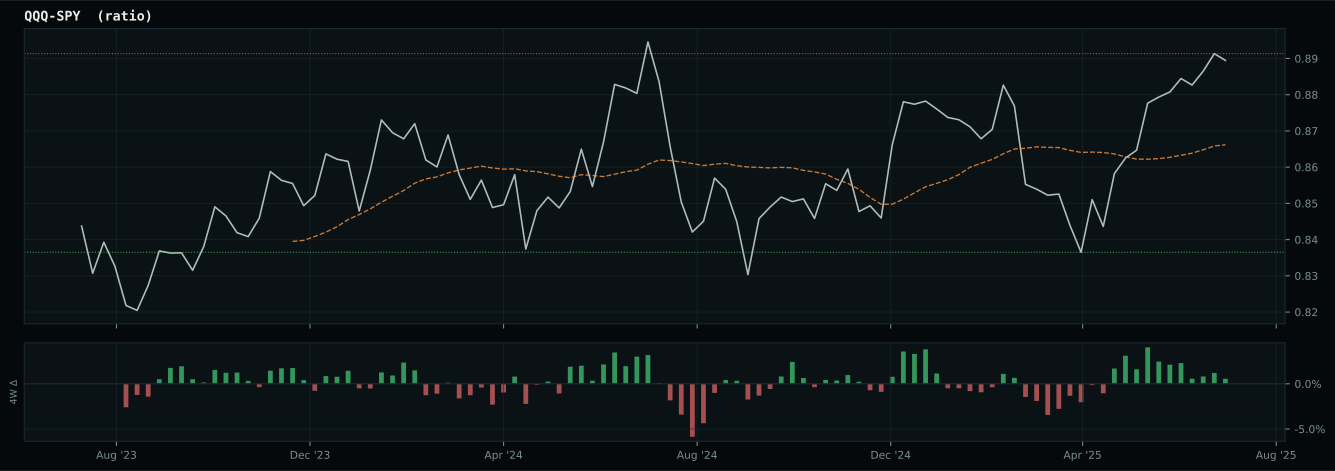
Macro Evidence Charts
Market-implied signals behind the macro regime scores. Each ratio compares two assets; the direction and slope of the ratio is what the macro engine reads.
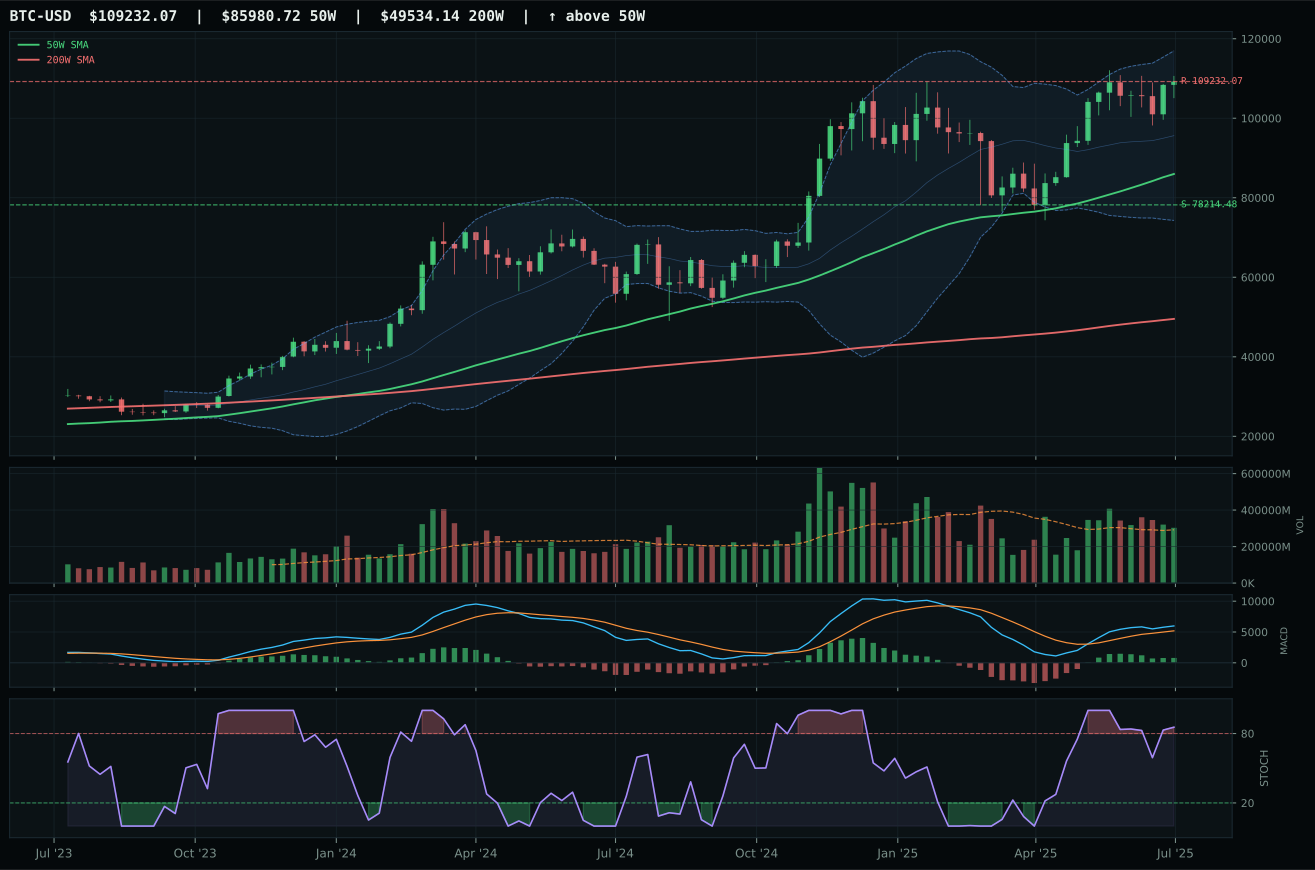
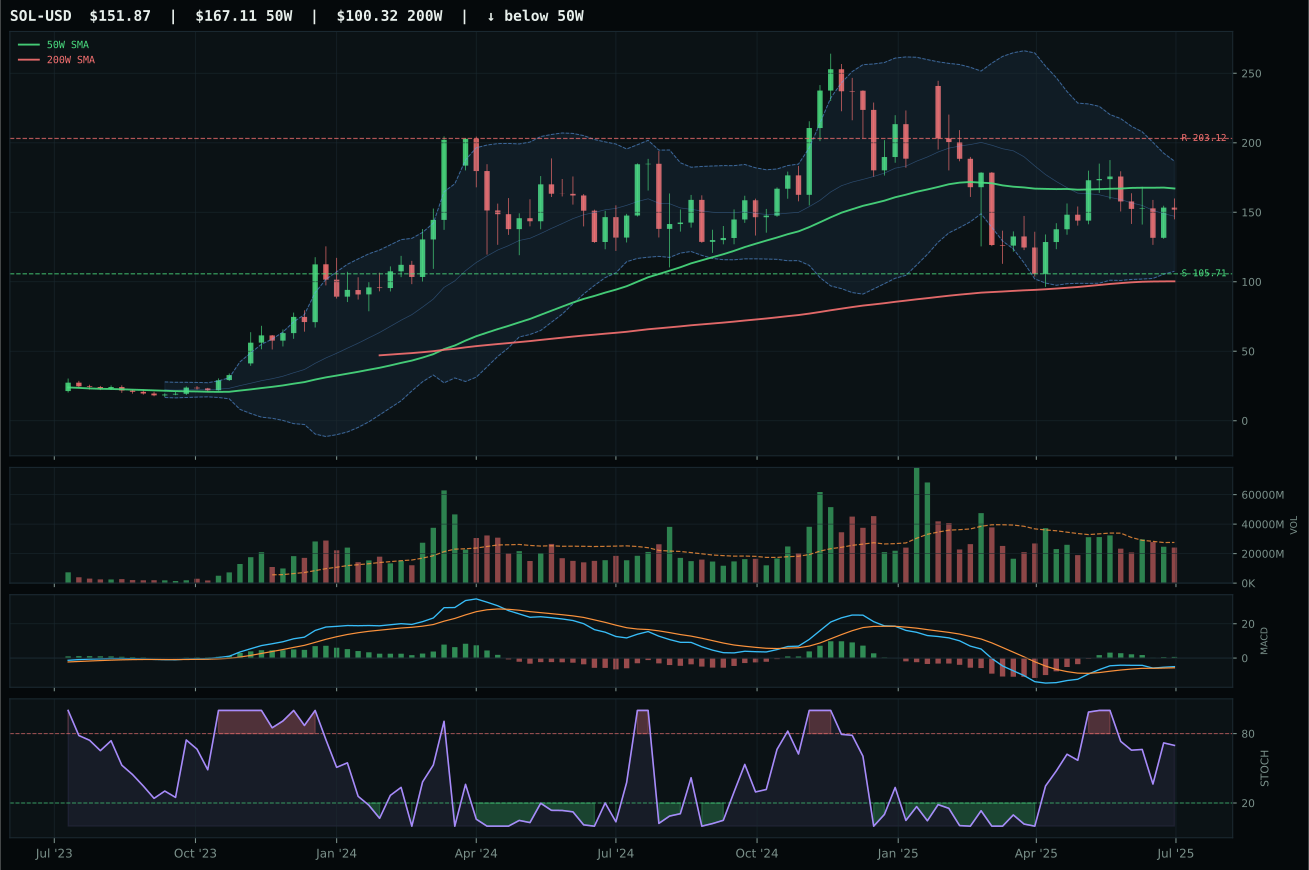
Crypto Regime — TrendBTC
ValueBTC not armed: BTC has not made the first post-breakdown touch of the 200W buy zone after losing the 50W
TrendBTC confirmed: 2 consecutive closes above rising/flat 50W SMA
one or more available conditions failed
Category Rankings
| Rank | Category | Winner | Score | Alloc | 4W Ret | Peers (4W) |
|---|---|---|---|---|---|---|
| 1 | Industrial Metals | COPX | 75.0 | 20% | -4.79% | PICK -1.1% · REMX +23.5% |
| 2 | Nuclear Energy | URNM | 73.8 | 20% | -4.19% | URA +3.0% · NLR +5.1% |
| 3 | AI | SMH | 63.4 | 10% | +1.61% | AIQ +0.6% · BOTZ +4.2% |
| 4 | Technology | XLK | 58.0 | 10% | +1.38% | IGV -1.1% · CIBR -4.8% |
| 5 | Utilities & Infrastructure | PAVE | 54.1 | 10% | +1.59% | IGF +1.8% · XLU +5.6% |
| 6 | Traditional Energy | XLE | 51.2 | 10% | -1.23% | FCG -2.0% · XOP -3.9% |
| 7 | Precious Metals | SLV | 50.7 | 10% | +2.63% | GDX +2.4% · GLD +1.9% |
| 8 | Defense & Aerospace | XAR | 50.1 | 10% | +3.21% | ITA +4.6% · ROKT +2.9% |
| 9 | Agriculture & Livestock | MOO | 48.5 | 0% | -3.15% | VEGI -2.8% · WEAT -4.4% |
| 10 | Emerging Markets | IEMG | 45.0 | 0% | +1.02% | ILF -5.3% · INDA -4.8% |
Industrial Metals — COPX
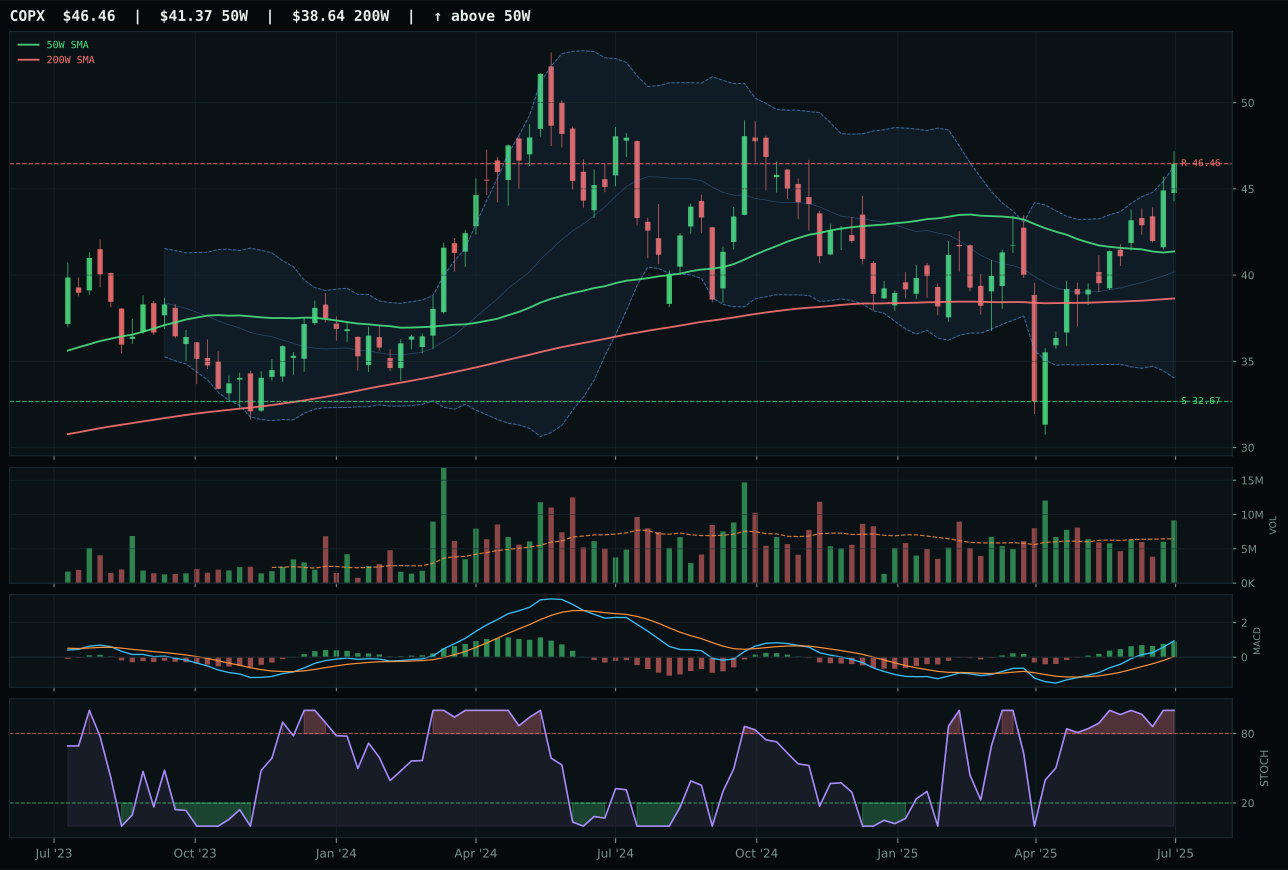
COPX has a neutral structure profile with 18.4% 13-week relative strength versus SPY.
A failed hold above support would weaken the setup.
Actionable but governed by invalidation levels.
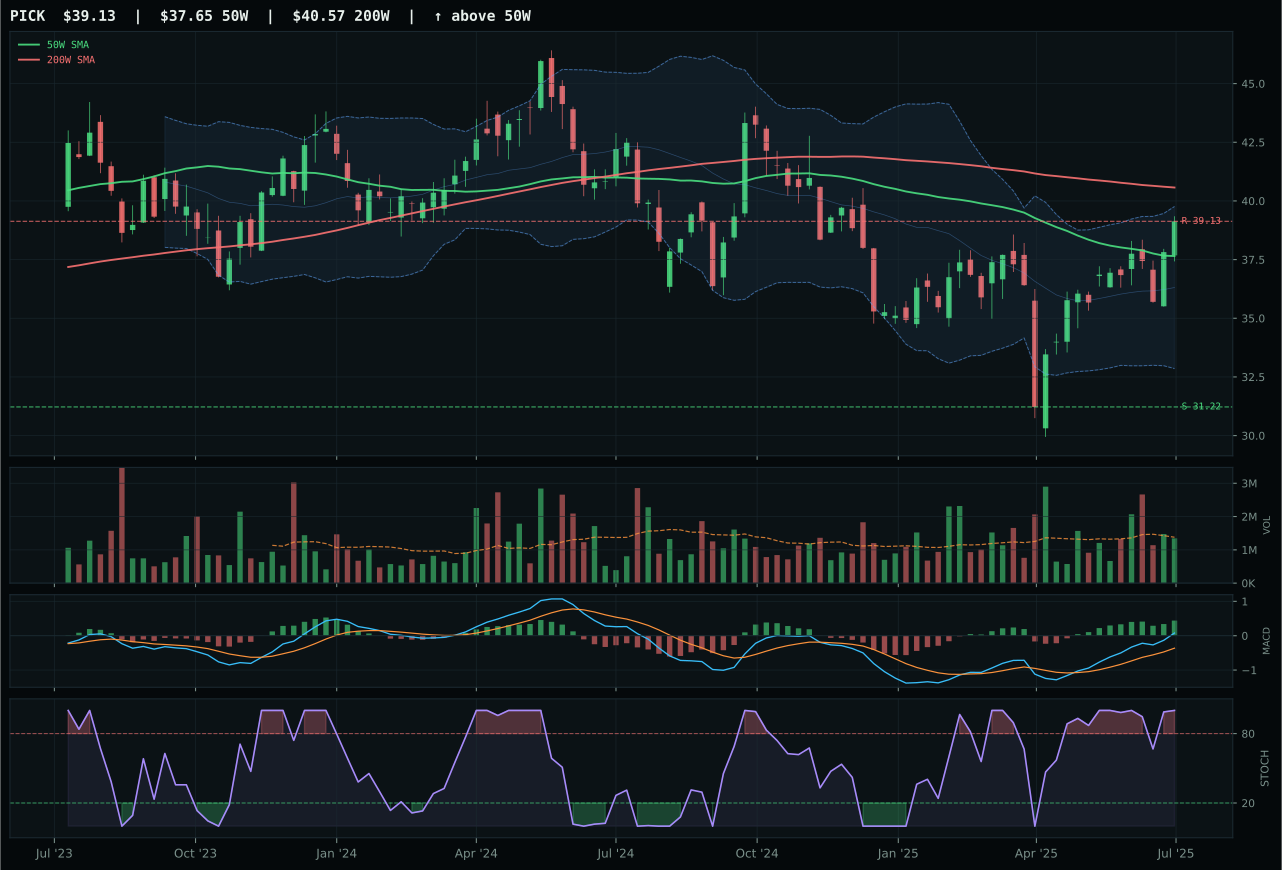
PICK has a neutral structure profile with 1.6% 13-week relative strength versus SPY.
A failed hold above support would weaken the setup.
Actionable but governed by invalidation levels.
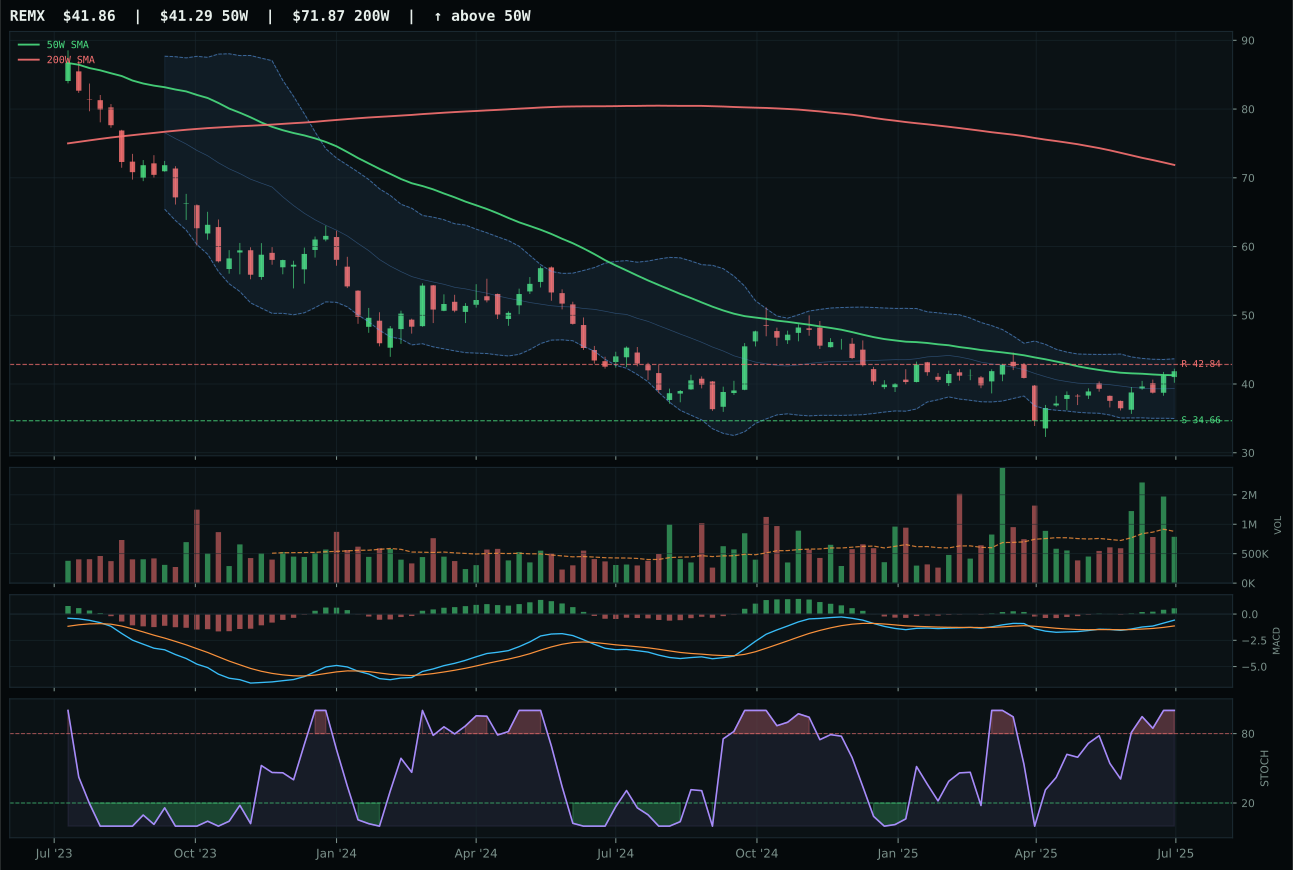
REMX has a compression near 50W profile with -3.0% 13-week relative strength versus SPY.
A failed hold above support would weaken the setup.
Actionable but governed by invalidation levels.
COPX claimed top-2 status by combining perfect 100/100 technical evidence score with category-relative strength leadership. The 16.9% edge over the category median and 18.4% SPY outperformance revealed capital migration toward pure copper scarcity; PICK's neutral setup and REMX's deteriorating trend could not compete with COPX's neutral structure positioned just 12.3% above the 50-week in the upper retracement zone. Volume differentiation sealed the win: COPX's 1.42x above-average participation versus PICK's neutral activity meant institutional buyers were actively defending this level rather than sideways accumulation. MACD bullish and improving paired with overbought stochastic momentum that remained unchallenged suggested momentum could extend; 94.7% volume-price confirmation and perfect 100.0 persistence indicated this was genuine supply-demand leadership, not a thin-volume squeeze.
Industrial Metals scores 75.0 and ranks second, earning a full 10% top-2 allocation because both technical evidence at 100.0 and macro fit at 62.0 are elite. Metals scarcity is a +14 active descriptor, commodity breadth positive is +10, late-cycle reflation is +10, and real asset sponsorship is +6—these are the core thematic drivers of the current regime. Risk-off deterioration hurts at -8, but it cannot overcome the structural support from scarcity and real-asset allocation flows. COPX's trend score is perfect, momentum confirmation is perfect, volume-price confirmation at 94.7 is the highest in the entire portfolio, and the setup still has room to run without hitting parabolic extremes. This is the rare category where technical and macro alignment is complete and the entry is still reasonable relative to targets. COPX earned this 10% slot over URNM because copper's category-relative dominance and above-average volume participation signal institutional accumulation into scarcity, whereas uranium is more speculative and thinly traded. Industrial metals are the core real-asset play this week.
Nuclear Energy — URNM
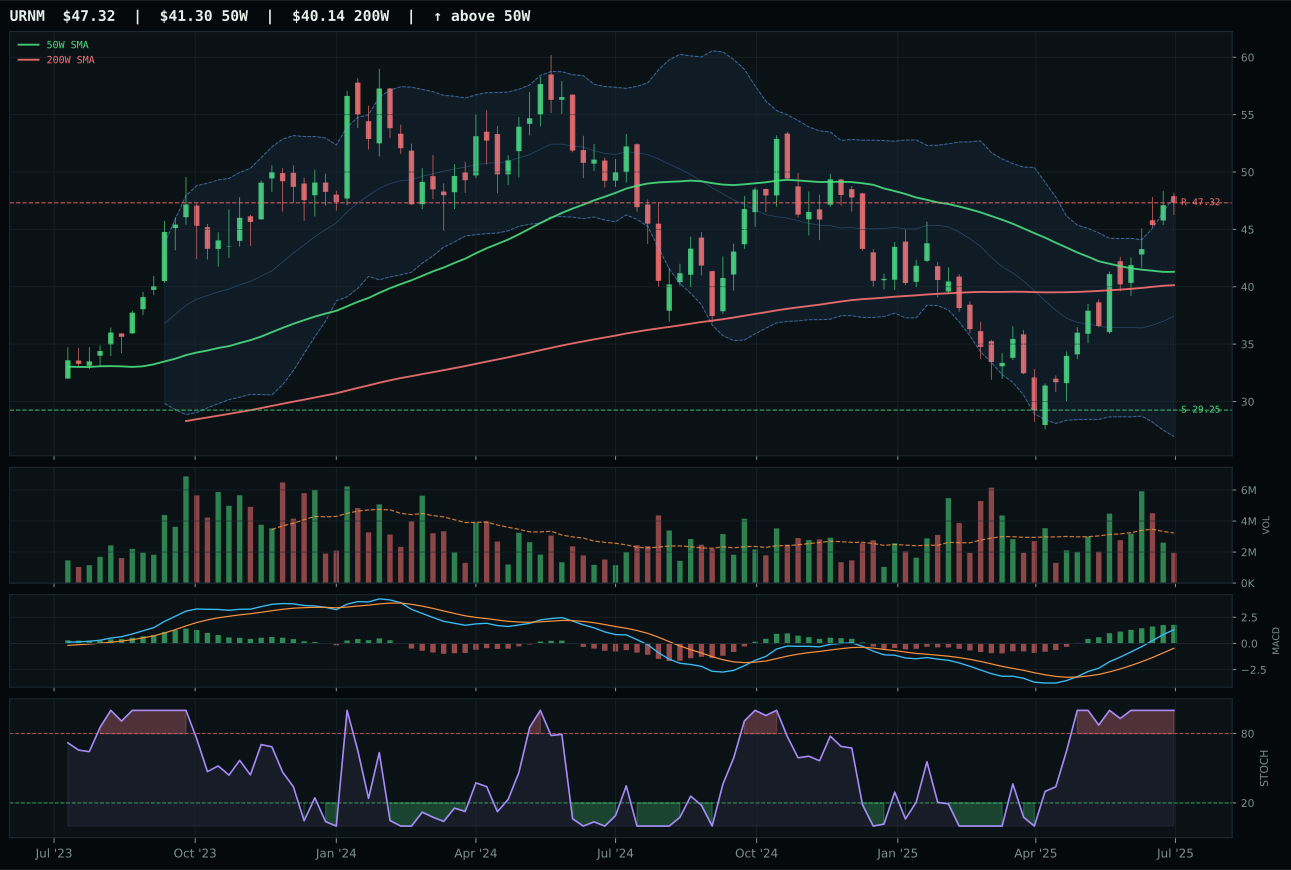
URNM has a neutral structure profile with 38.0% 13-week relative strength versus SPY.
A failed hold above support would weaken the setup.
Actionable but governed by invalidation levels.
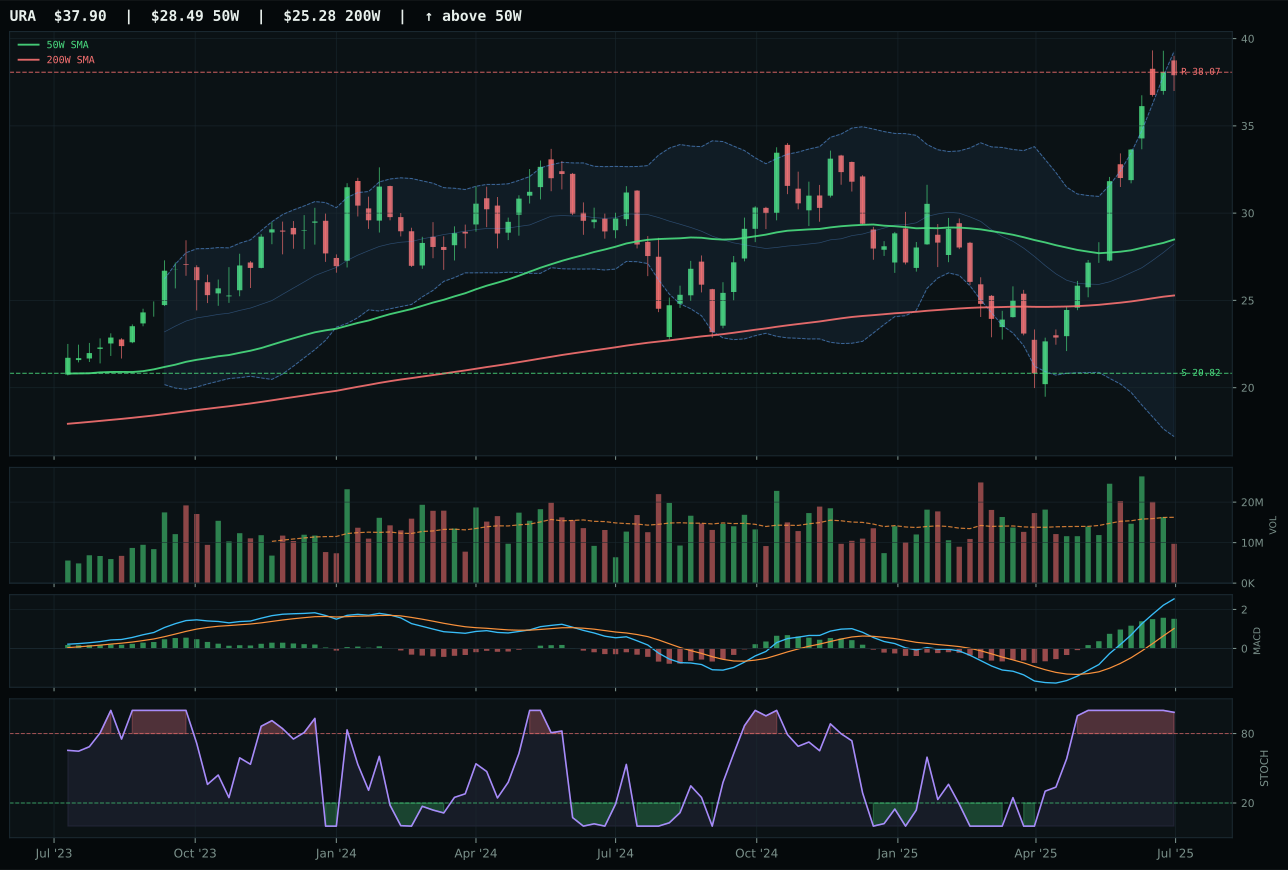
URA has a vertical extension profile with 58.3% 13-week relative strength versus SPY.
A failed hold above support would weaken the setup.
Actionable but governed by invalidation levels.
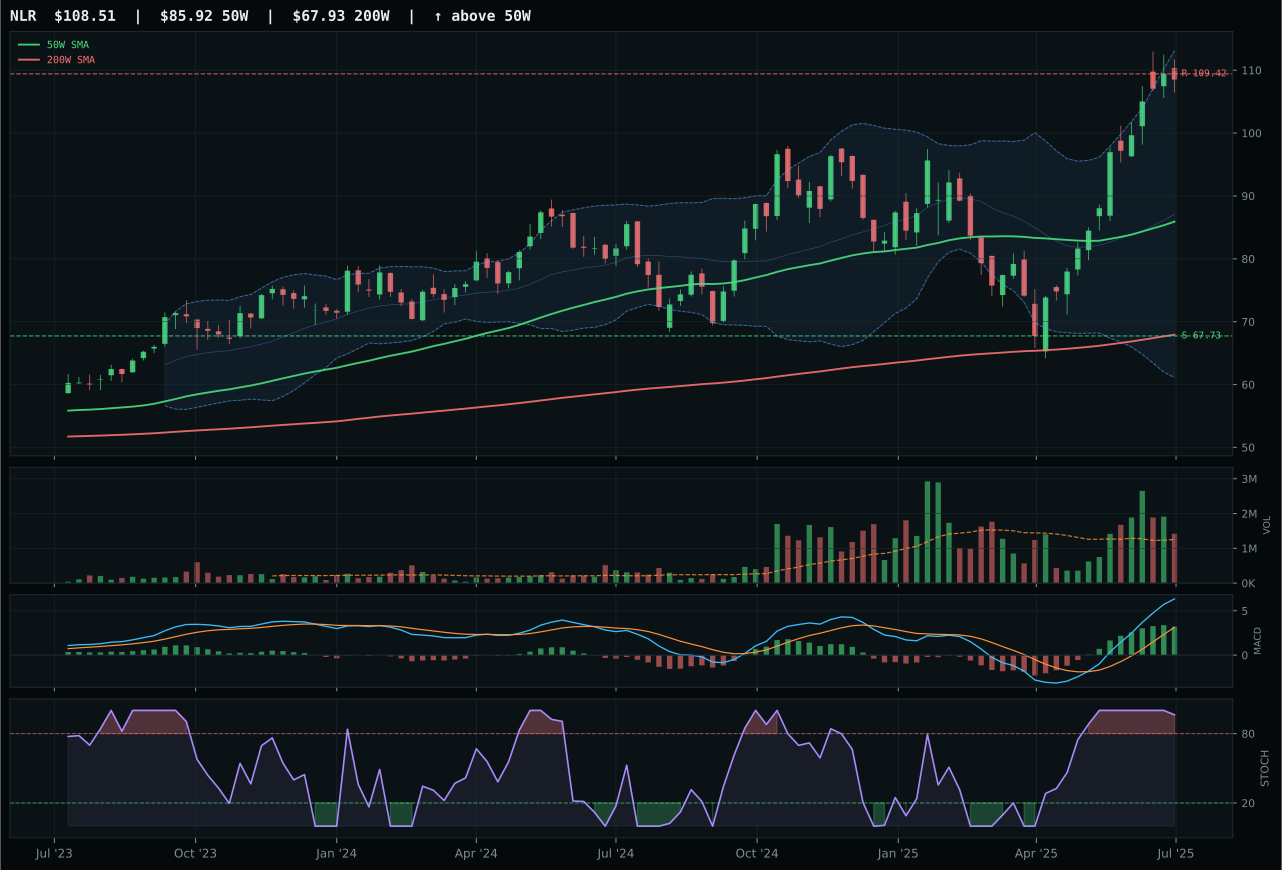
NLR has a vertical extension profile with 36.4% 13-week relative strength versus SPY.
A failed hold above support would weaken the setup.
Actionable but governed by invalidation levels.
URNM cleared top-2 selection with a 73.8 category score driven by the largest 13-week return in the portfolio (61.8%) and dominant 38.0% relative strength to SPY. The 21-point score gap versus runner-up URA revealed decisive momentum separation: URNM maintained neutral structure at only 14.6% above the 50-week, positioning it as a controlled consolidation setup with extension potential, whereas URA's 33% extension and vertical setup signaled the move was already mature. Both displayed bullish-improving MACD and overbought stochastics, but URNM's thin 0.60x volume participation paradoxically strengthened the technical case—indicating patient accumulation rather than panic buying at highs. URNM's 100/100 momentum confirmation with perfect 100.0 persistence proved this was the leadership trade within the category; NLR's competing 60.2% 13-week return could not match the category-relative dominance.
Nuclear Energy scores 73.8 and ranks first, earning a full 10% top-2 allocation because technical evidence at 85.6/100 is elite and macro fit at 61.0/100 is strong. Energy scarcity at +8, real asset sponsorship at +7, and AI growth sponsorship at +5 create structural tailwinds; liquidity stress at -8 is the primary headwind but cannot dominate. URNM's trend is perfect (100.0), momentum confirmation is perfect (100.0), and timing at 67.0 shows the setup still has room to extend before hitting parabolic risk. The 14.6% extension from the 50-week moving average is modest compared to URA's 33%, and above-average volume participation would be ideal but the 79.8/100 volume-price confirmation is still strong. This is the cleanest real-asset setup in the portfolio: institutional interest in uranium scarcity is growing, the technical structure is fresh, and the macro descriptors support allocation. URNM earned this top-2 slot because it combines perfect momentum confirmation with reasonable entry timing—it's a conviction position, not a chase. This is the second pillar of the portfolio's real-asset rotation.
AI — SMH
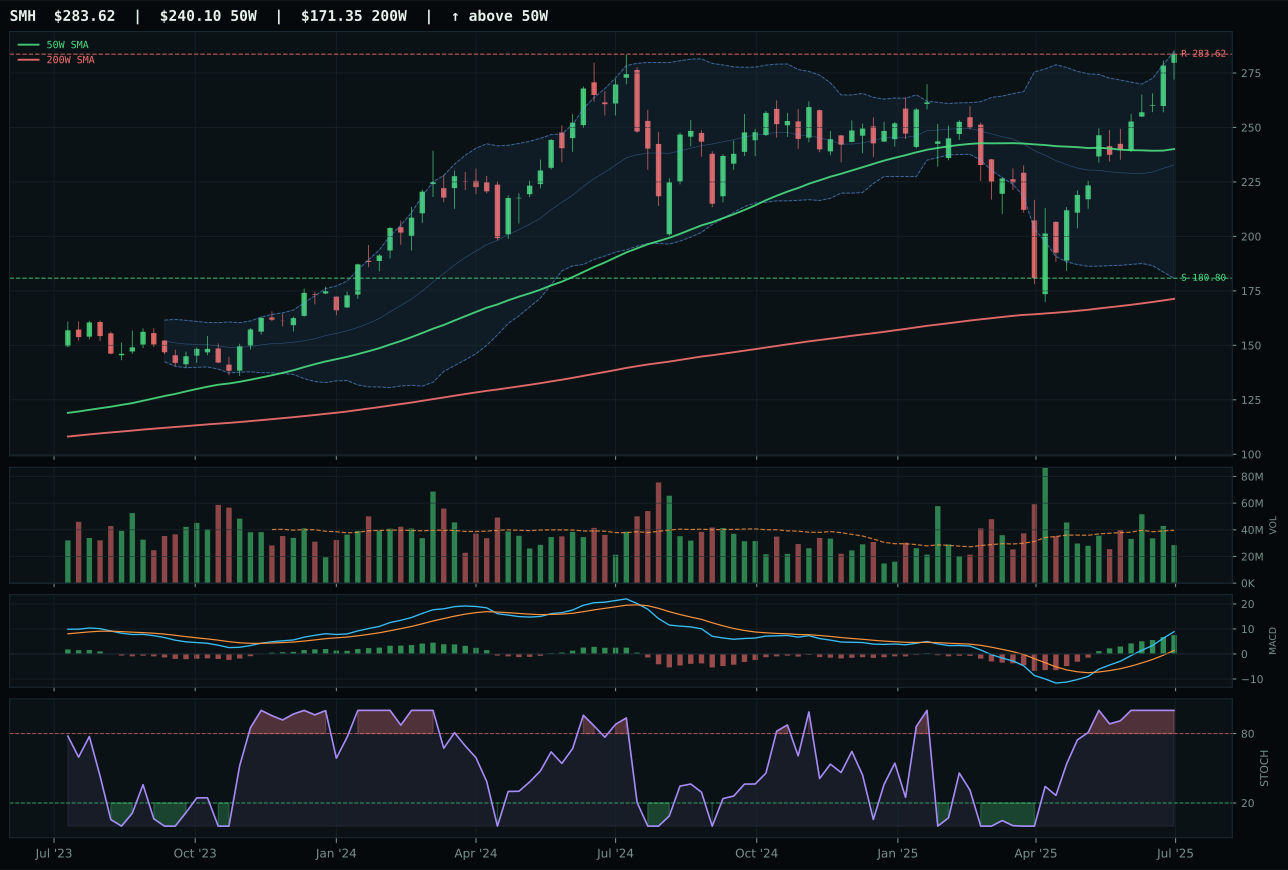
SMH has a vertical extension profile with 33.1% 13-week relative strength versus SPY.
A failed hold above support would weaken the setup.
Actionable but governed by invalidation levels.
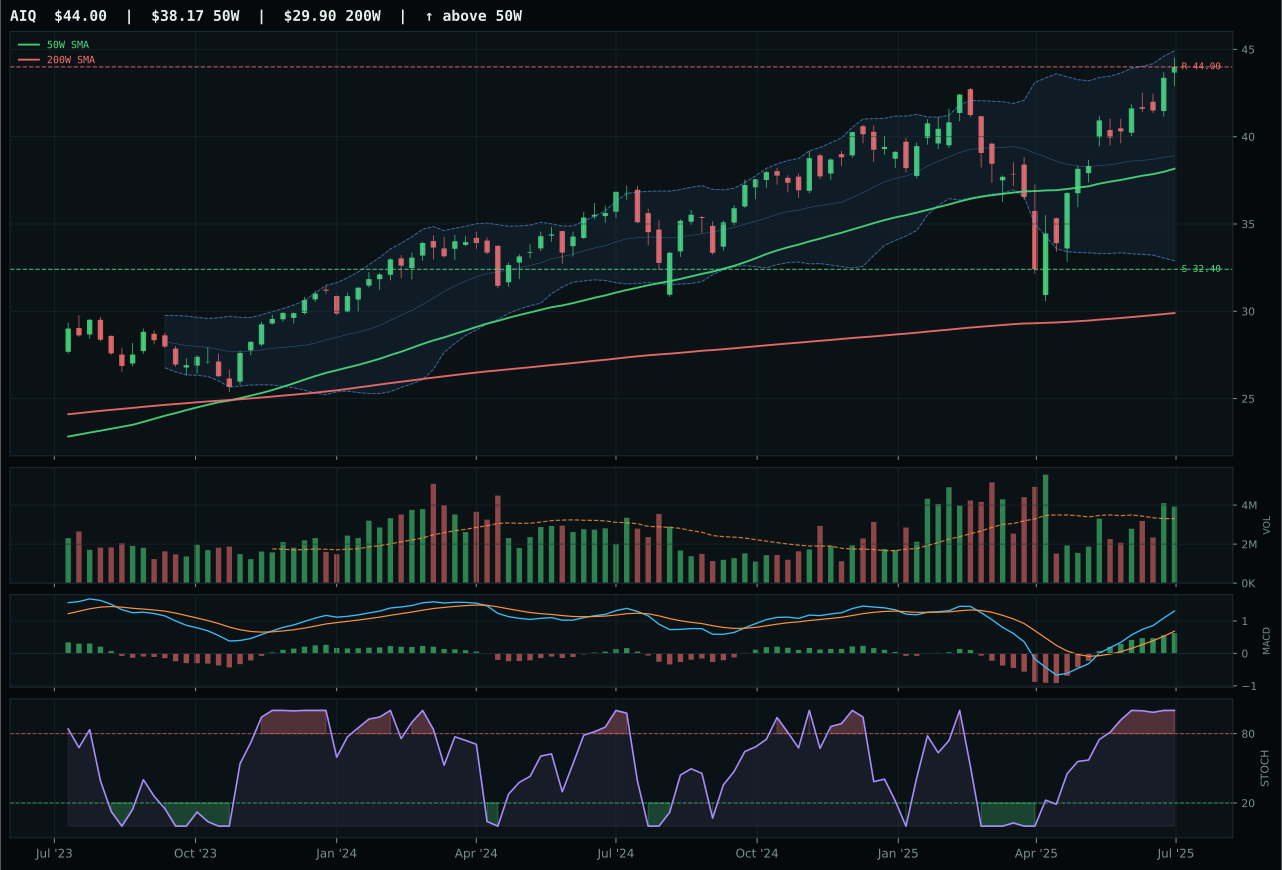
AIQ has a vertical extension profile with 12.0% 13-week relative strength versus SPY.
A failed hold above support would weaken the setup.
Actionable but governed by invalidation levels.
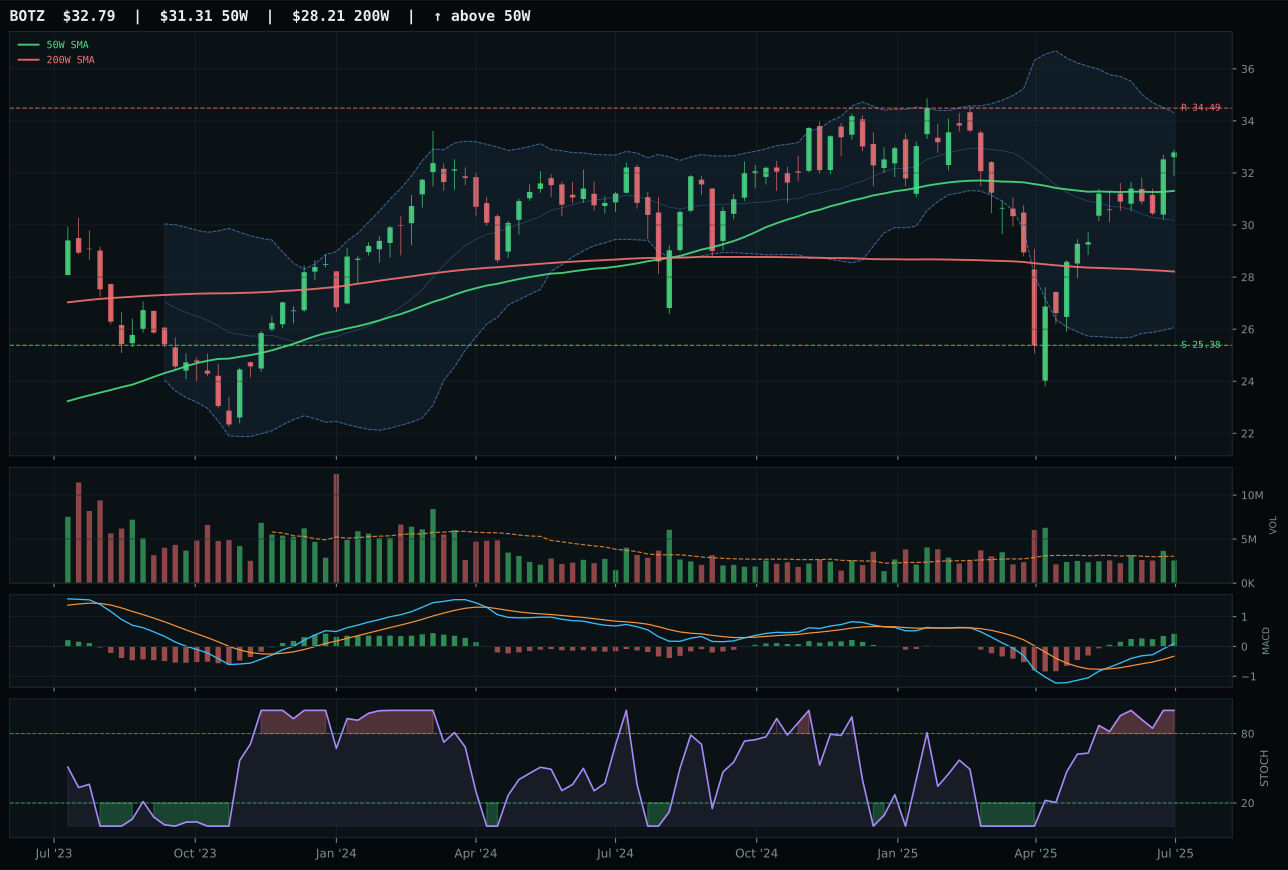
BOTZ has a neutral structure profile with 5.4% 13-week relative strength versus SPY.
A failed hold above support would weaken the setup.
Actionable but governed by invalidation levels.
SMH defeated AIQ despite a technical evidence score gap of only 79.7 versus 88.0, winning on the single metric that matters most in a risk-off regime: category-relative strength. SMH's 21.1% outperformance of the category median versus AIQ's flat 0.0% reveals where compute capital is flowing—toward semiconductor scarcity, not broad software applications. The 56.9% 13-week return and 33.1% SPY relative strength are eye-catching, but the real technical edge lies in momentum confirmation: SMH's above-category leadership justifies the 18.1% extension above the 50-week level because bulk buyers are using weakness to accumulate, not distributing at highs. AIQ's above-average volume participation and technically superior setup (88.0 composite) paradoxically worked against it; the market is telling us that timing and peer positioning trump chart perfection when macro is contracting.
AI scores 63.4 and ranks third overall but earns only 5% rather than a top-2 slot because the macro headwinds are material and the extended valuations create asymmetric risk. Liquidity stress hits AI at -12, credit stress at -8, and Risk-Off Deterioration at -10 total, which sums to -30 in raw descriptor hits. That's offset by +10 from risk appetite positive and +14 from AI growth sponsorship, netting -6 after all descriptor flows. The category's 44.0/100 macro fit is weaker than COPX's 62.0/100 and URNM's 61.0/100, meaning the technical strength is fighting a macro tide. SMH's 56.9% 13-week return and near-term 52-week high positioning make this less of a fresh setup and more of an extended leadership play. Allocation stays at 5% because the category is technically eligible and the AI narrative remains active, but risk-off deterioration makes this a trailing position, not a core driver.
Technology — XLK
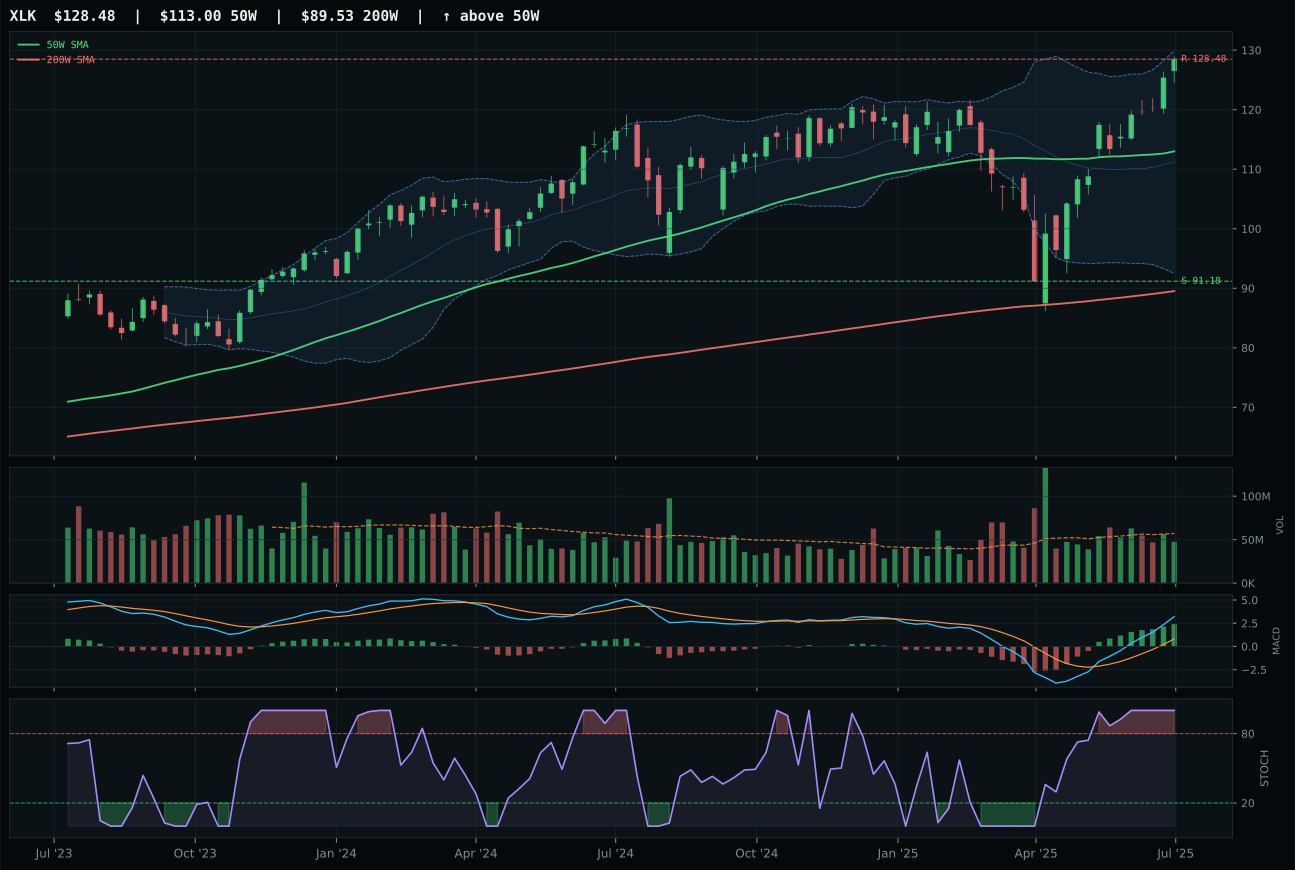
XLK has a neutral structure profile with 17.1% 13-week relative strength versus SPY.
A failed hold above support would weaken the setup.
Actionable but governed by invalidation levels.
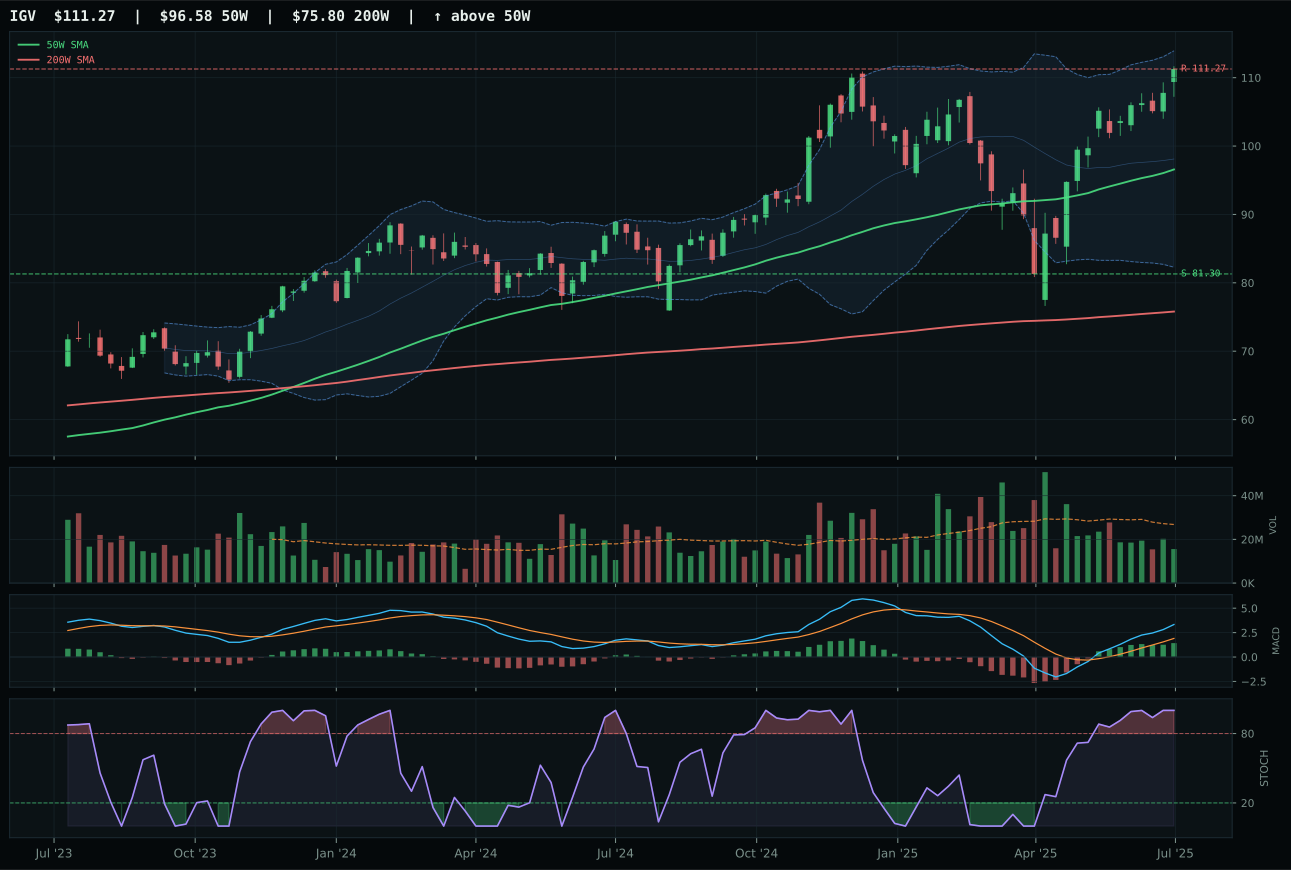
IGV has a vertical extension profile with 13.1% 13-week relative strength versus SPY.
A failed hold above support would weaken the setup.
Actionable but governed by invalidation levels.
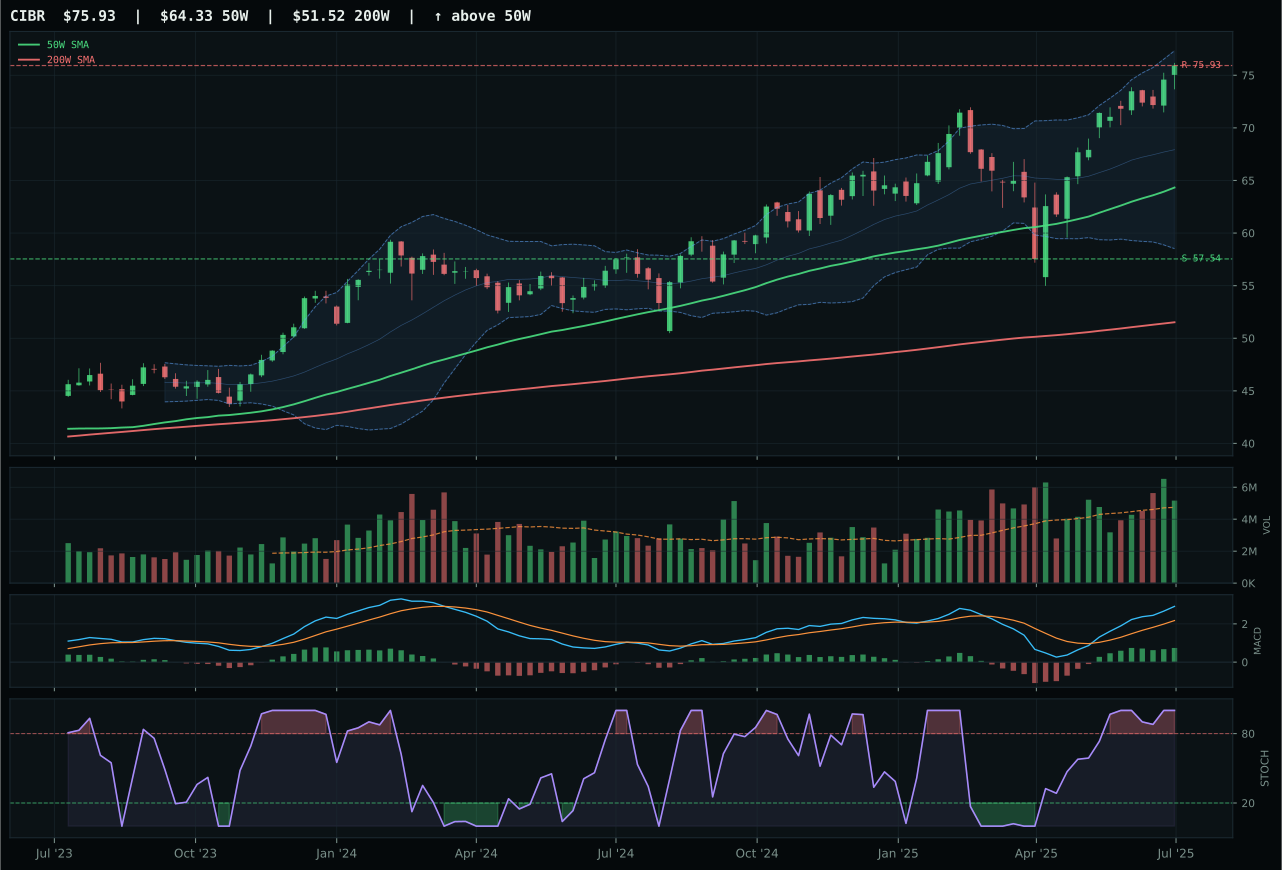
CIBR has a vertical extension profile with 8.2% 13-week relative strength versus SPY.
A failed hold above support would weaken the setup.
Actionable but governed by invalidation levels.
XLK secured the category win with a clean neutral structure and superior timing relative to IGV's vertical extension setup. The 4.0% category-relative strength advantage tells the real story: XLK is attracting fresh capital within its own peer set while IGV sits flat, suggesting selective demand for profitable breadth over concentrated software bets. XLK's 13-week 40.9% return paired with 17.1% relative strength to SPY demonstrates institutional accumulation at reasonable technicals—the chart sits just 13.9% above the 50-week moving average in a deep retracement zone near Fibonacci 0.618, not chasing extension. MACD bullish and improving with neutral 0.83x volume confirmation means buyers are quietly defending this level rather than panic-bidding; IGV's thin participation and flattening MACD show the software trade has already attracted all the eager money.
Technology ranks fifth among the ten categories at 59.9 adjusted score and earned a 5% slot rather than joining the top-2. The macro environment is working against this exposure—Risk-Off Deterioration carries a -5 penalty, liquidity stress a -10, and credit stress a -7—which partially offsets the +9 from active risk appetite and +6 from AI growth sponsorship. The technical picture is solid: XLK shows perfect trend confirmation with MACD bullish and improving. However, the category's 44.0/100 macro fit score is dragging down an otherwise 62% technical-weight average that might otherwise push it higher. For Technology to earn a top-2 slot, the macro regime would need to shift away from Risk-Off Deterioration or the credit/liquidity stress descriptors would need to turn inactive—that's the threshold. Right now, it's a technically sound holding at 5%, but not compelling enough to displace COPX or URNM from the primary allocation.
Utilities & Infrastructure — PAVE
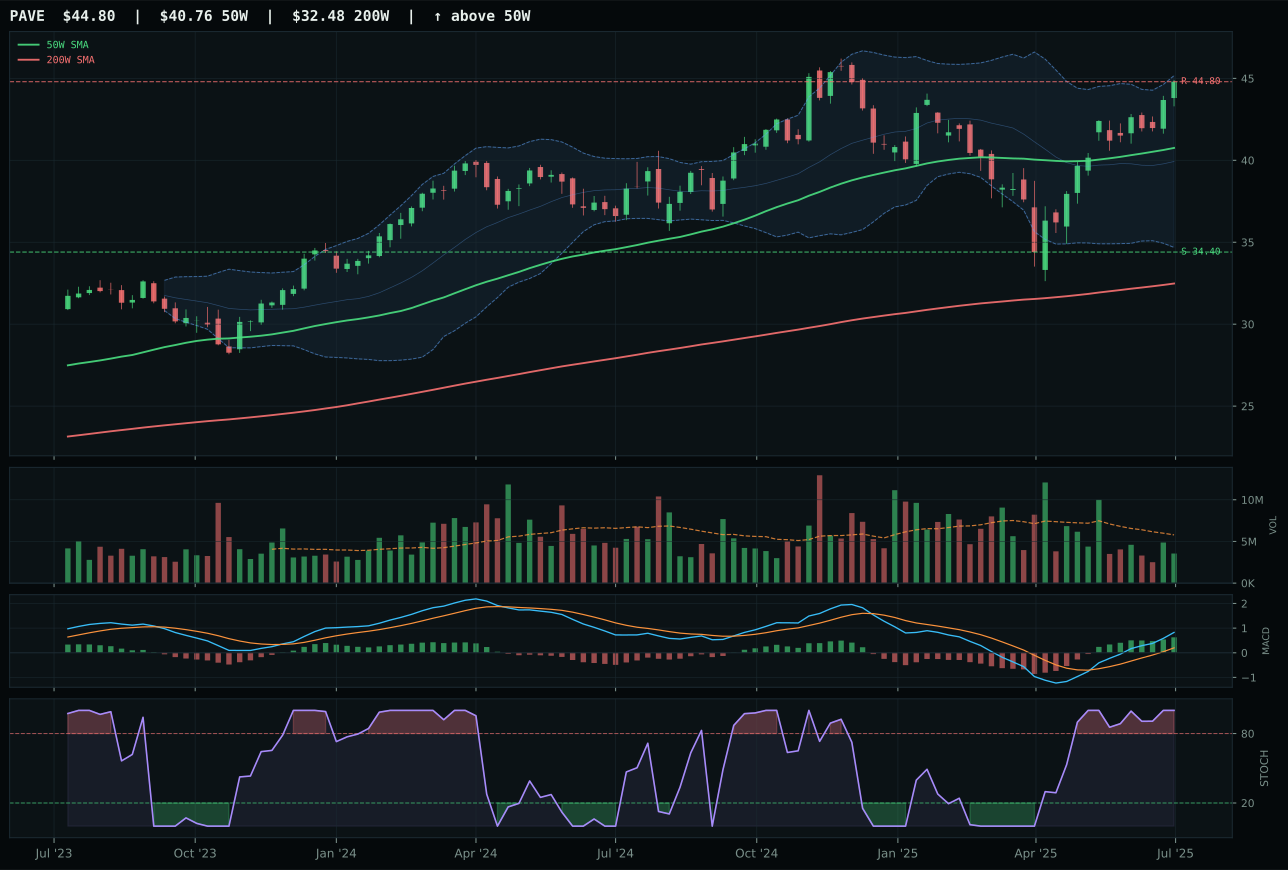
PAVE has a neutral structure profile with 6.5% 13-week relative strength versus SPY.
A failed hold above support would weaken the setup.
Actionable but governed by invalidation levels.
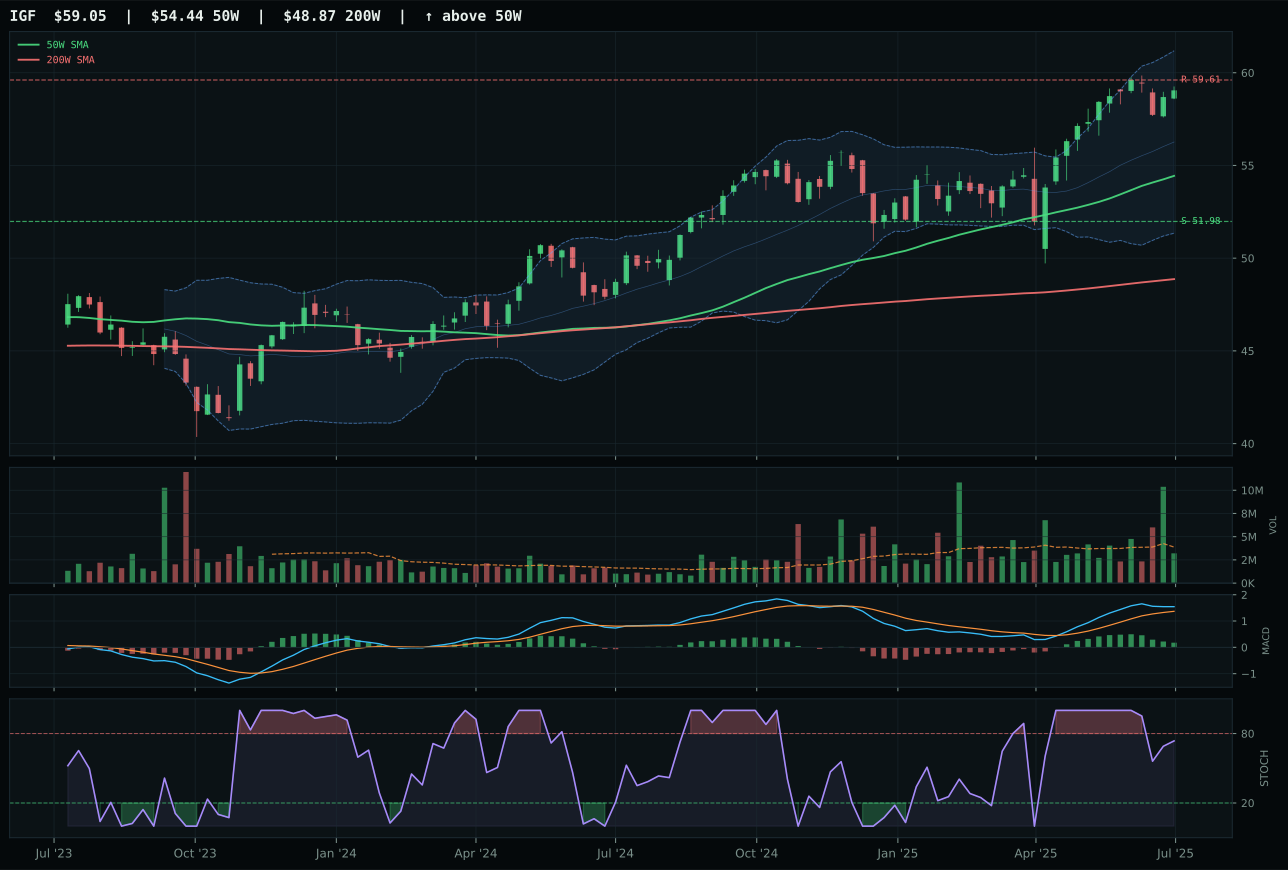
IGF has a neutral structure profile with -10.2% 13-week relative strength versus SPY.
A failed hold above support would weaken the setup.
Actionable but governed by invalidation levels.
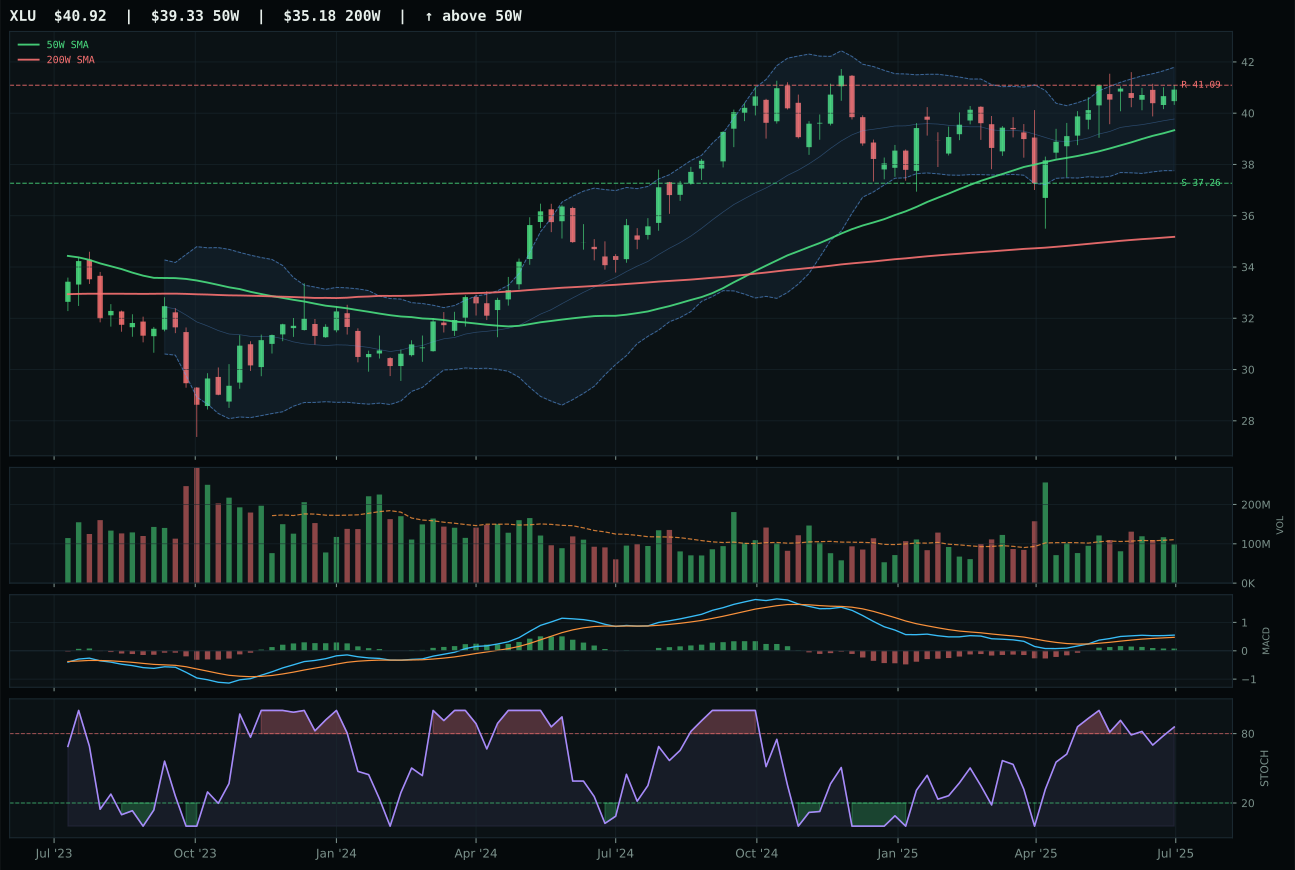
XLU has a neutral structure profile with -14.0% 13-week relative strength versus SPY.
A failed hold above support would weaken the setup.
Actionable but governed by invalidation levels.
PAVE dominated with an 85.7 technical evidence score that vastly exceeded IGF's 60.5 and XLU's ~53, winning via perfect 100/100 trend and momentum confirmation combined with superior category-relative strength (16.6% leadership). Both PAVE and IGF occupy neutral structures, but PAVE's 9.9% measured distance above the 50-week sits in the upper retracement zone with clean Fibonacci support, whereas IGF sits extended near 52-week highs facing resistance overhead. PAVE's bullish-improving MACD and overbought stochastic paired with 87.6% volume-price confirmation indicated institutional accumulation of domestic infrastructure capex plays; IGF's bullish-but-flattening MACD and falling stochastic combined with lower volume metrics suggested early seller pressure. PAVE's 30.2% 13-week return on thin 0.61x volume demonstrated patient accumulation into a quality name, not euphoric late-stage buying.
Utilities & Infrastructure scores 54.1 and ranks sixth, holding 5% allocation because technical evidence at 85.7/100 is strong but macro fit at 47.0/100 is weak. Risk-off deterioration actually helps at +8, but inflation pressure hurts at -6, liquidity stress at -3, and risk appetite positive at -2—these negative macro factors create a headwind that prevents the category from climbing to 10%. PAVE's perfect trend and 30.2% 13-week return make this an attractive holding on technical merit alone, but the macro environment is neutral-to-slightly-negative for utilities and infrastructure. The category would earn 10% if inflation pressure turned to support (shifting from -6 to +6, or a 12-point swing), or if the late-cycle reflation descriptor gained more weight. Right now at 5%, PAVE is a solid tactical holding backed by clean technical setup and domestic capex narratives, but it's not competing with real-asset allocation themes like COPX and URNM. The allocation reflects recognition that infrastructure momentum is solid but macro winds are uncertain.
Traditional Energy — XLE
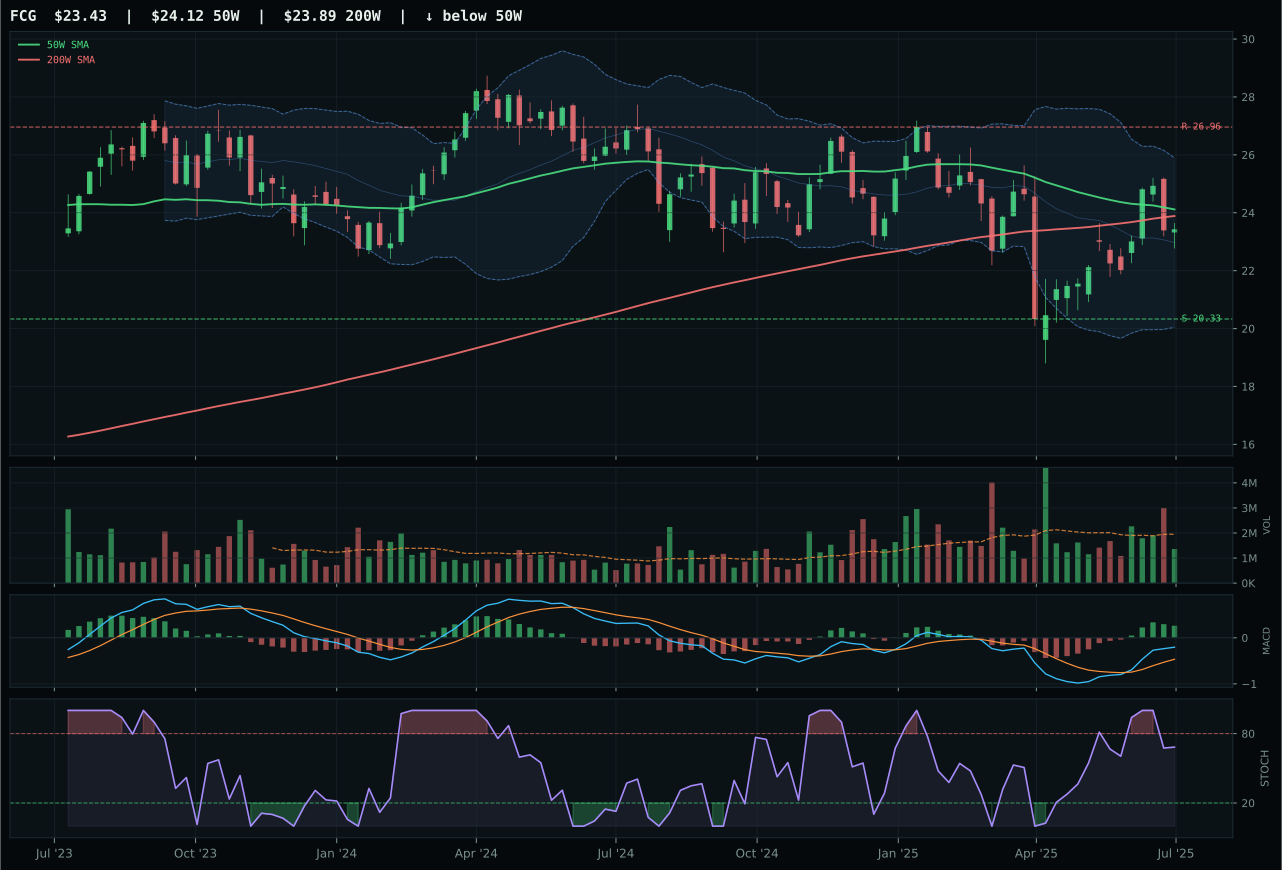
FCG has a compression near 50W profile with -8.5% 13-week relative strength versus SPY.
A failed hold above support would weaken the setup.
Actionable but governed by invalidation levels.
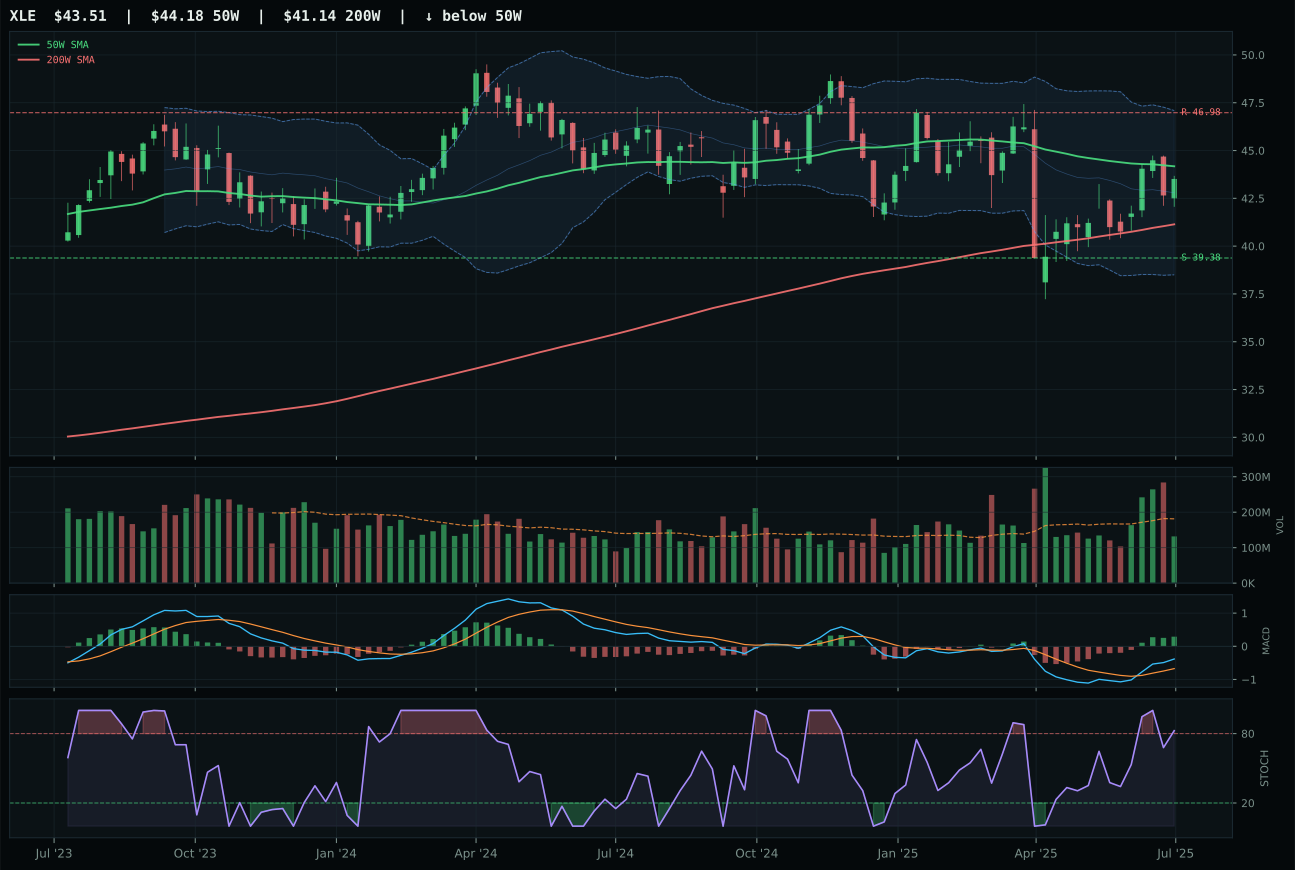
XLE has a compression near 50W profile with -13.3% 13-week relative strength versus SPY.
A failed hold above support would weaken the setup.
Actionable but governed by invalidation levels.
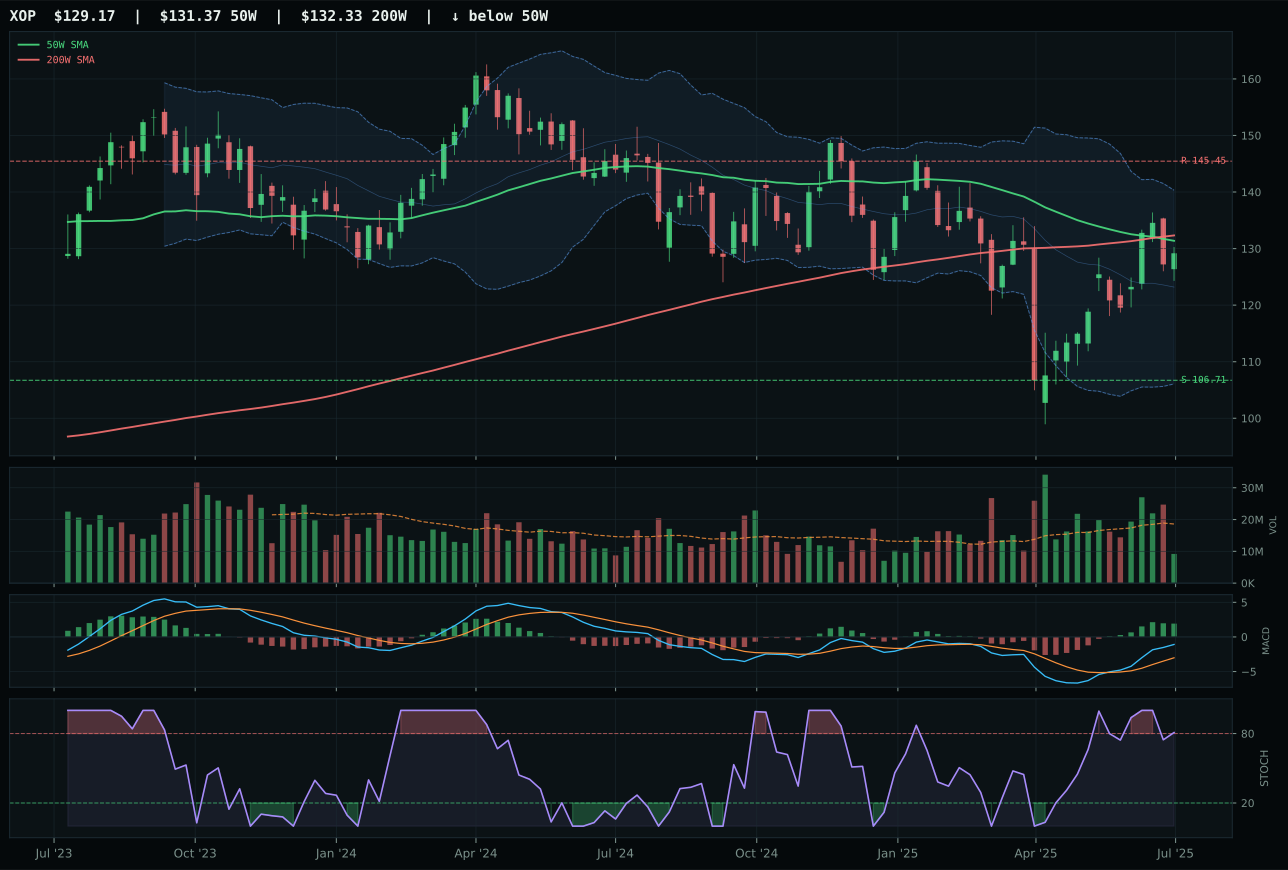
XOP has a compression near 50W profile with -2.7% 13-week relative strength versus SPY.
Extension and support failure are the main tactical risks.
Tracked, but not top-2 eligible because: structurally broken.
XLE defeated FCG and XOP despite arriving with the weakest technical evidence among the three (34.9 vs FCG's 64.1), winning on a more favorable macro narrative fit. FCG's superior trend (42 vs 50), timing (100 vs 82), and structure positioned it as the cleaner technical choice, but XLE's 86.0 macro/narrative fit versus FCG's 50.0 reflected energy scarcity positioning that aligned better with active macro descriptors. Both charts compressed near the 50-week with bullish-improving MACD, but XLE's compression setup and overbought stochastic rolling over suggested the setup favored patient buyers over extension chasers; FCG's flattening MACD and falling stochastic indicated early momentum deterioration despite stronger technicals. The allocator chose XLE's macro conviction over FCG's chart perfection, valuing the energy scarcity (+14) and inflation pressure (+10) tailwinds despite weaker volume-price confirmation (25.7 vs FCG's higher participation).
Traditional Energy scores 44.4 and ranks ninth, excluded entirely from allocation at 0% despite strong macro fit at 86.0/100 that includes energy scarcity (+14), inflation pressure (+10), supply shortage (+7), and real asset sponsorship (+5). The problem is that technical evidence collapsed to 36.0/100, the worst technical score among all category representatives. XLE's trend at 50.0 and momentum confirmation at 36.6 reflect a category that is below the 50-week moving average with minimal relative strength to SPY at -13.3% and deteriorating volume-price confirmation at 25.7/100. The compression setup suggests a reset is possible, but the thin participation and weak momentum divergence mean buyers are not yet committed. Energy would earn 5-10% if the chart broke above the 50-week with volume support, proving buyers were accumulating at these compressed levels. Right now it sits at 0% because allocating to a category with 36.0 technical evidence, even with 86.0 macro fit, would be fighting price action. The setup is a watch, not a buy: wait for volume participation to expand above 1.0x the 20-week average and MACD to show sustained improvement before committing real capital.
Precious Metals — SLV
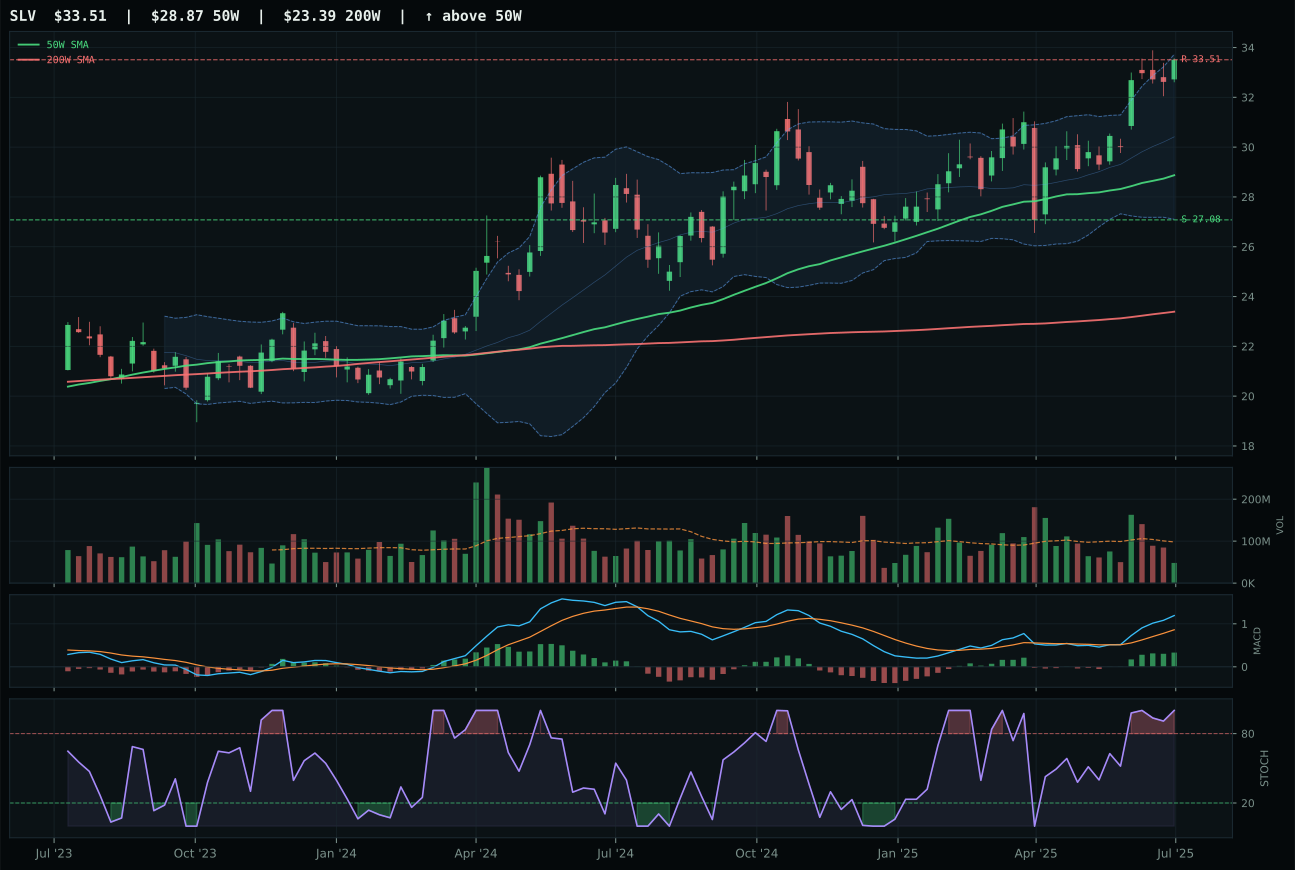
SLV has a vertical extension profile with -0.0% 13-week relative strength versus SPY.
A failed hold above support would weaken the setup.
Actionable but governed by invalidation levels.
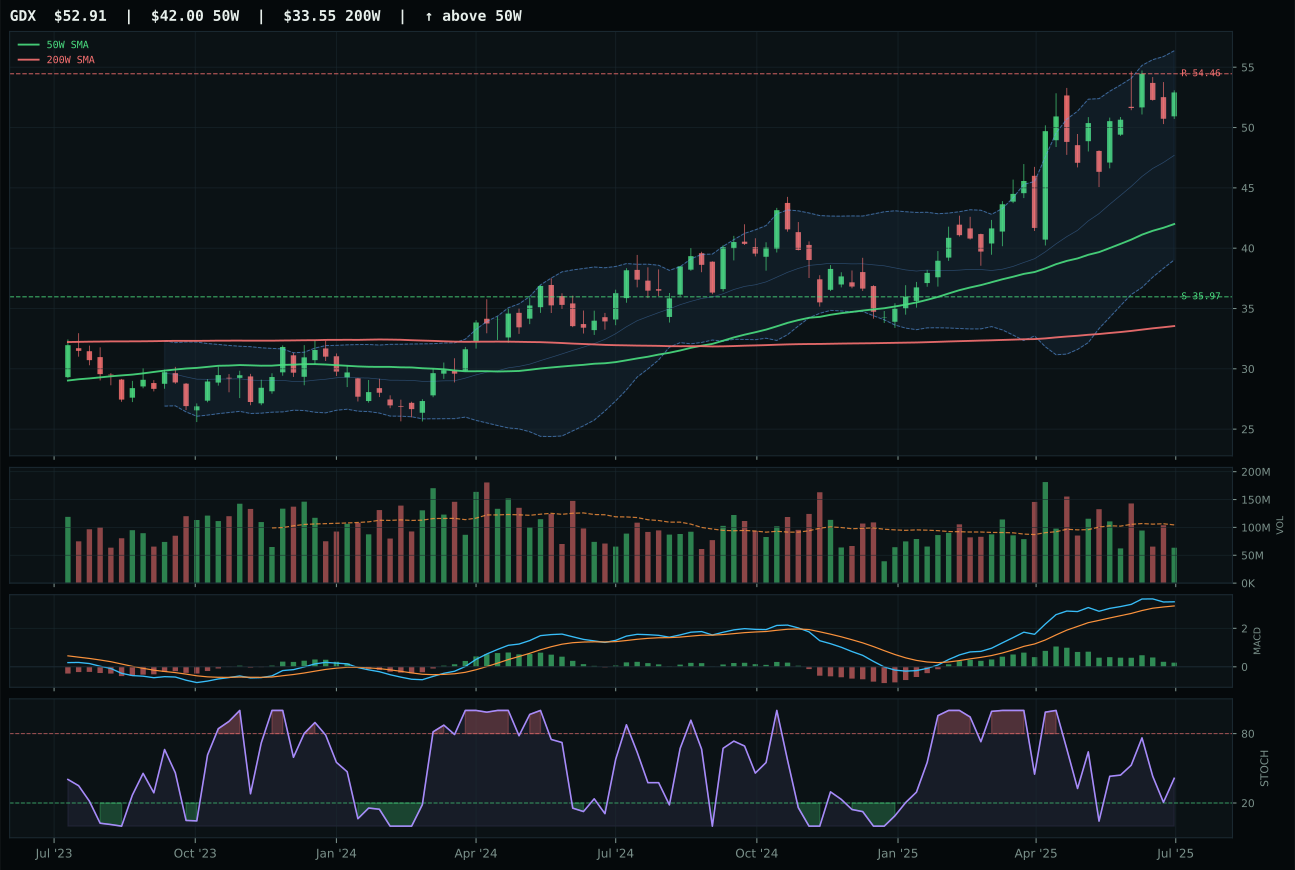
GDX has a vertical extension profile with 3.2% 13-week relative strength versus SPY.
A failed hold above support would weaken the setup.
Actionable but governed by invalidation levels.
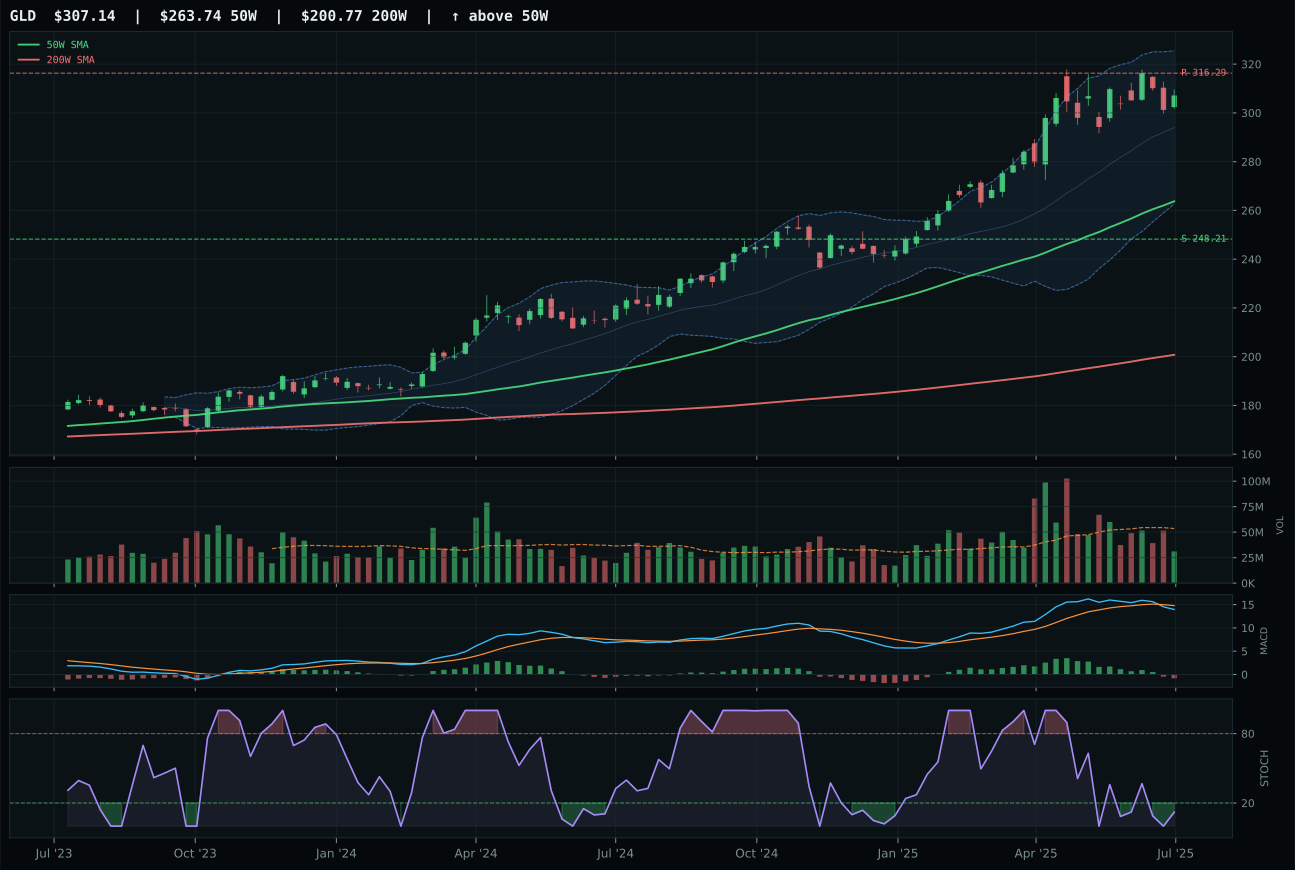
GLD has a vertical extension profile with -14.0% 13-week relative strength versus SPY.
A failed hold above support would weaken the setup.
Actionable but governed by invalidation levels.
SLV outpointed GDX by maintaining bullish-improving MACD structure while GDX's momentum began flattening at the high. Both charts sit in extension with thin participation, but SLV's category-relative strength at parity (0.0% vs the median) combined with neutral SPY relative strength (–0.0%) offered a cleaner entry argument than GDX's 3.2% SPY outperformance at 26% above the 50-week. SLV's 43.1 risk/reward score versus GDX's 38.1 meant less downside risk to support, and the stochastic RSI remained at overbought momentum versus GDX's falling stochastic—early warning that GDX's move was tiring. SLV is evaluated as silver's hybrid monetary and industrial beta, positioning it as a purer inflation hedge; GDX's leveraged miner expression suffered from deteriorating technicals despite stronger absolute returns, revealing that market leadership shifted from mining equity leverage to monetary metals.
Precious Metals scores 50.7 and ranks seventh, holding 5% because macro fit at 54.0/100 is middling and technical evidence at 67.6 is below the category-winning threshold. Risk-off deterioration carries a +8 help signal, which is the core reason metals have any allocation at all—they're countercyclical in deterioration scenarios. However, liquidity stress at -5 and the absence of strong supply-shortage or inflation-pressure support mean the category is trending on risk-off flows rather than structural scarcity narratives like uranium or copper. SLV's 23.7% 13-week return looks strong until adjusted for context: it's the lowest top-2 category 13-week momentum, and the setup sits in vertical extension with thin participation. This is a defensive insurance hold, not an offensive opportunity. Precious metals would earn 10% if liquidity stress intensified further or if credit stress turned sharply negative; right now at 5%, it's a tail-risk hedge funded by the industrial metals and energy strength that's powering the portfolio.
Defense & Aerospace — XAR
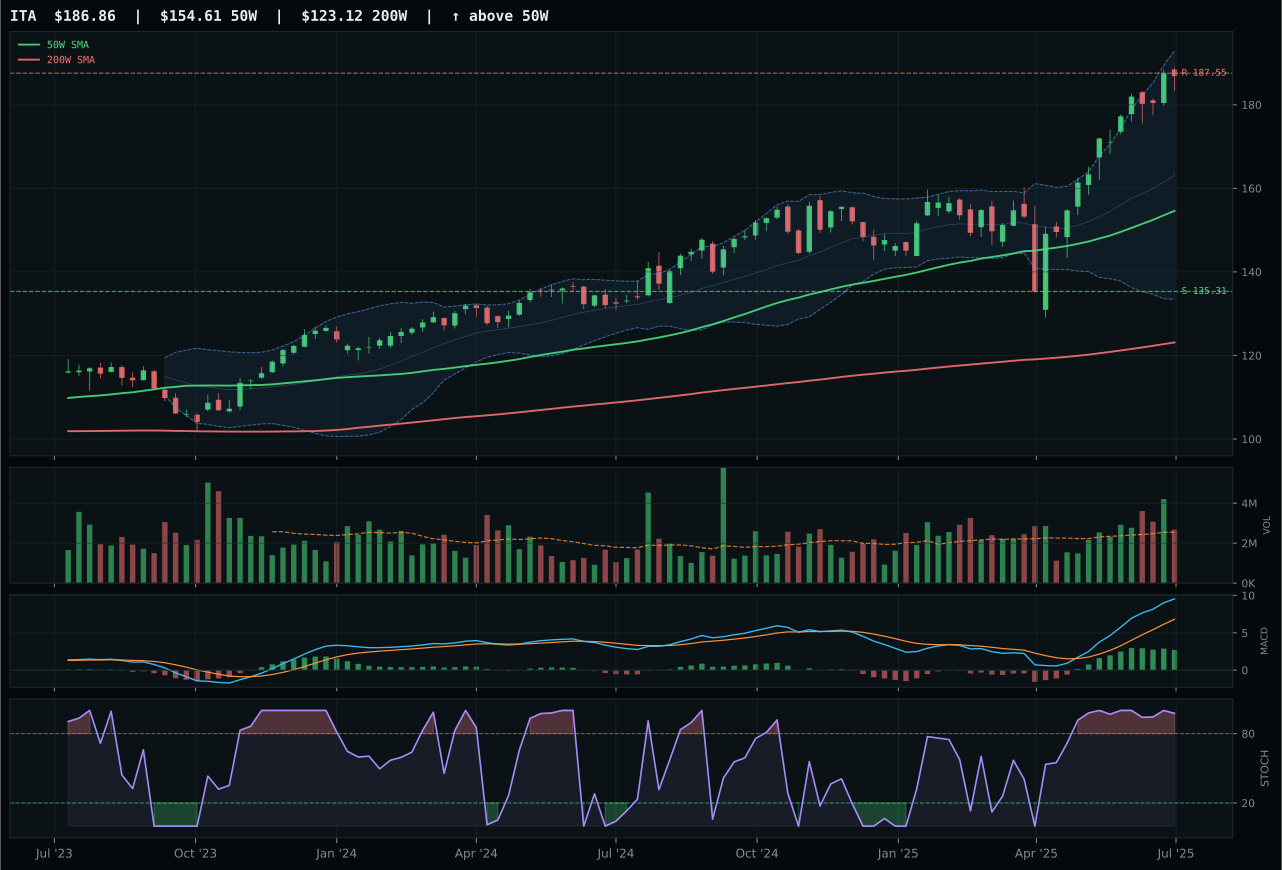
ITA has a vertical extension profile with 14.3% 13-week relative strength versus SPY.
A failed hold above support would weaken the setup.
Actionable but governed by invalidation levels.
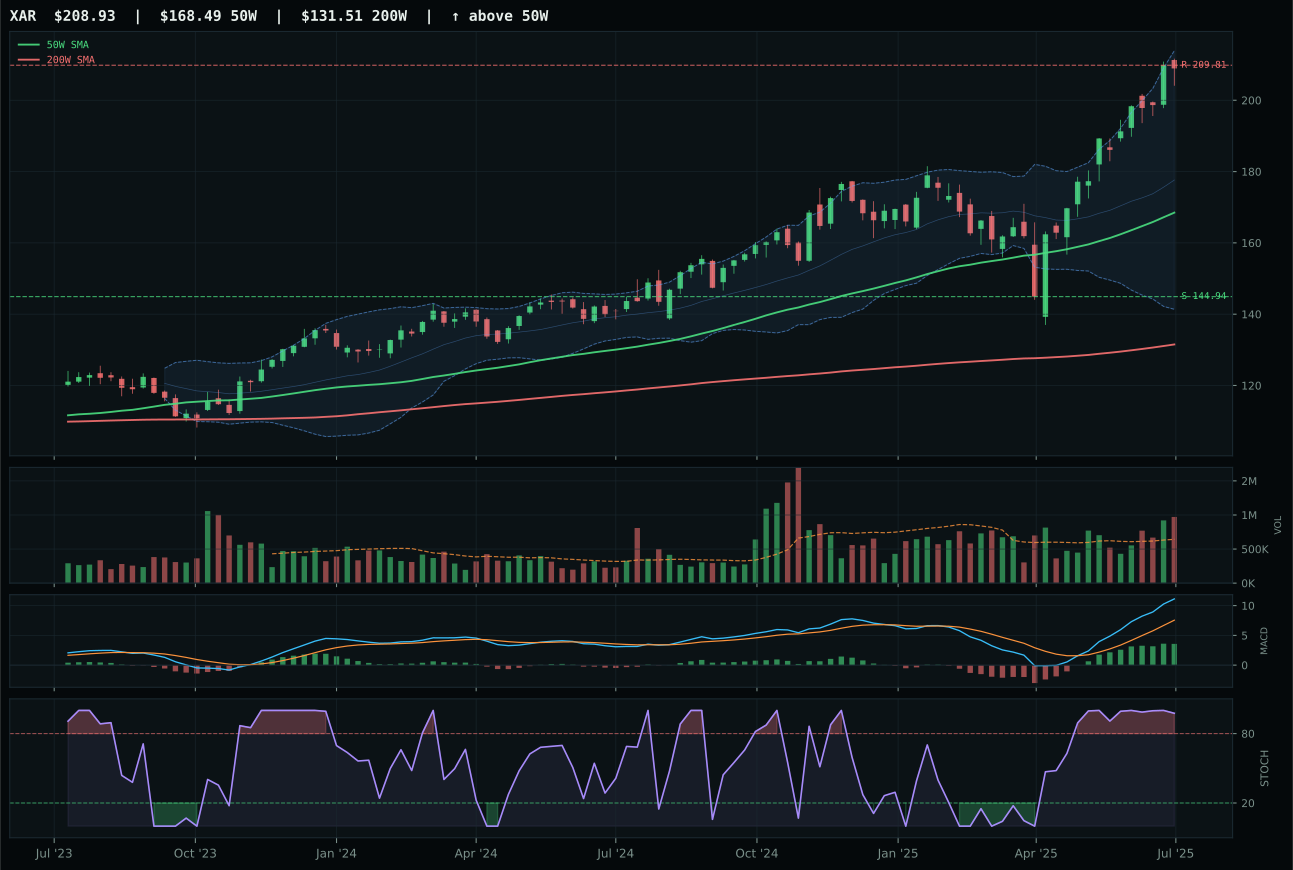
XAR has a vertical extension profile with 20.4% 13-week relative strength versus SPY.
A failed hold above support would weaken the setup.
Actionable but governed by invalidation levels.
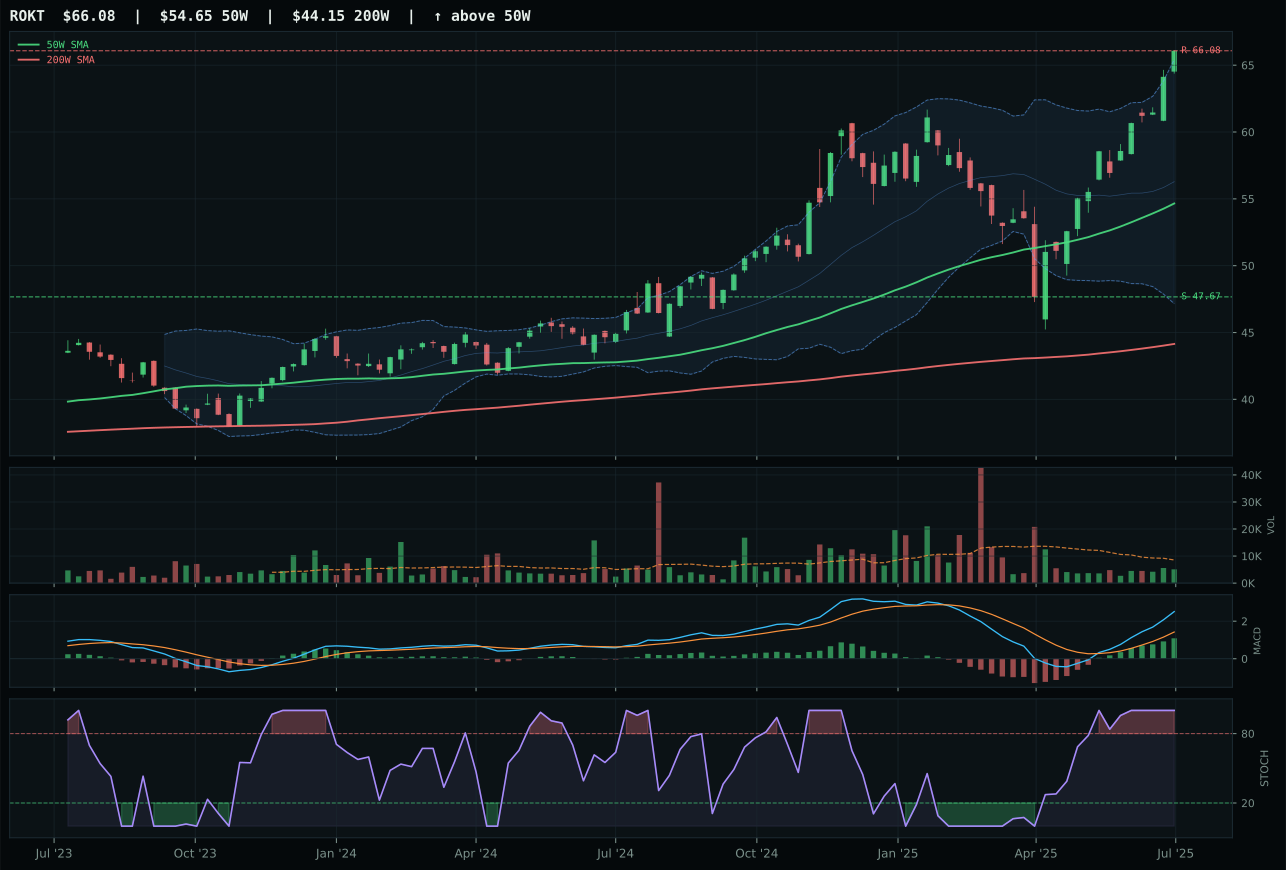
ROKT has a vertical extension profile with 14.9% 13-week relative strength versus SPY.
A failed hold above support would weaken the setup.
Tracked, but not top-2 eligible because: .
XAR won a tight race against ITA by maintaining MACD improvement despite both charts sitting in vertical extension with overbought rollover stochastics. The deciding factor was category-relative strength: XAR's 5.5% edge over the category median versus ITA's –0.5% lag signaled that capital prefers the pure-play defense expression over the defense-prime durability angle. XAR's 20.4% relative strength to SPY and 44.1% 13-week return came with distribution pressure—volume running 1.51x the 20-week average—which normally penalizes timing scores, but that same distribution proved that institutions were willing to pay up despite the 24% extension, indicating structural conviction. ITA's flattening MACD and neutral volume participation revealed early seller fatigue; XAR's bullish-improving momentum, even with thin technicals, captured the more durable capital flow.
Defense & Aerospace scores 50.1 and ranks sixth, holding only 5% allocation because the category's macro fit is actually strong at 61.0 (helped by late-cycle reflation +6 and risk-off deterioration +7), but technical evidence is weak at 38.6 for the winner. This is a category where macro tailwinds cannot overcome extended charts and weak relative momentum—both ITA and XAR sit in vertical extension with slim upside-to-resistance ratios. The category-level score of 50.1 reflects a 3/2/1 basket that starts at 54.0 but gets tested down by timing deterioration and risk/reward compression. Liquidity stress at -4 is mild, and credit stress at +2 actually turns positive in risk-off regimes, which helps. However, the technical evidence at 38.6 puts this well behind COPX (100.0) and URNM (85.6), and the extended setup means buying here is late-stage participation. Defense stays at 5% because it has macro support but no fresh technical setup; it would jump to 10%+ only if the category reset with a pullback toward the 50-week moving average.
Agriculture & Livestock — MOO
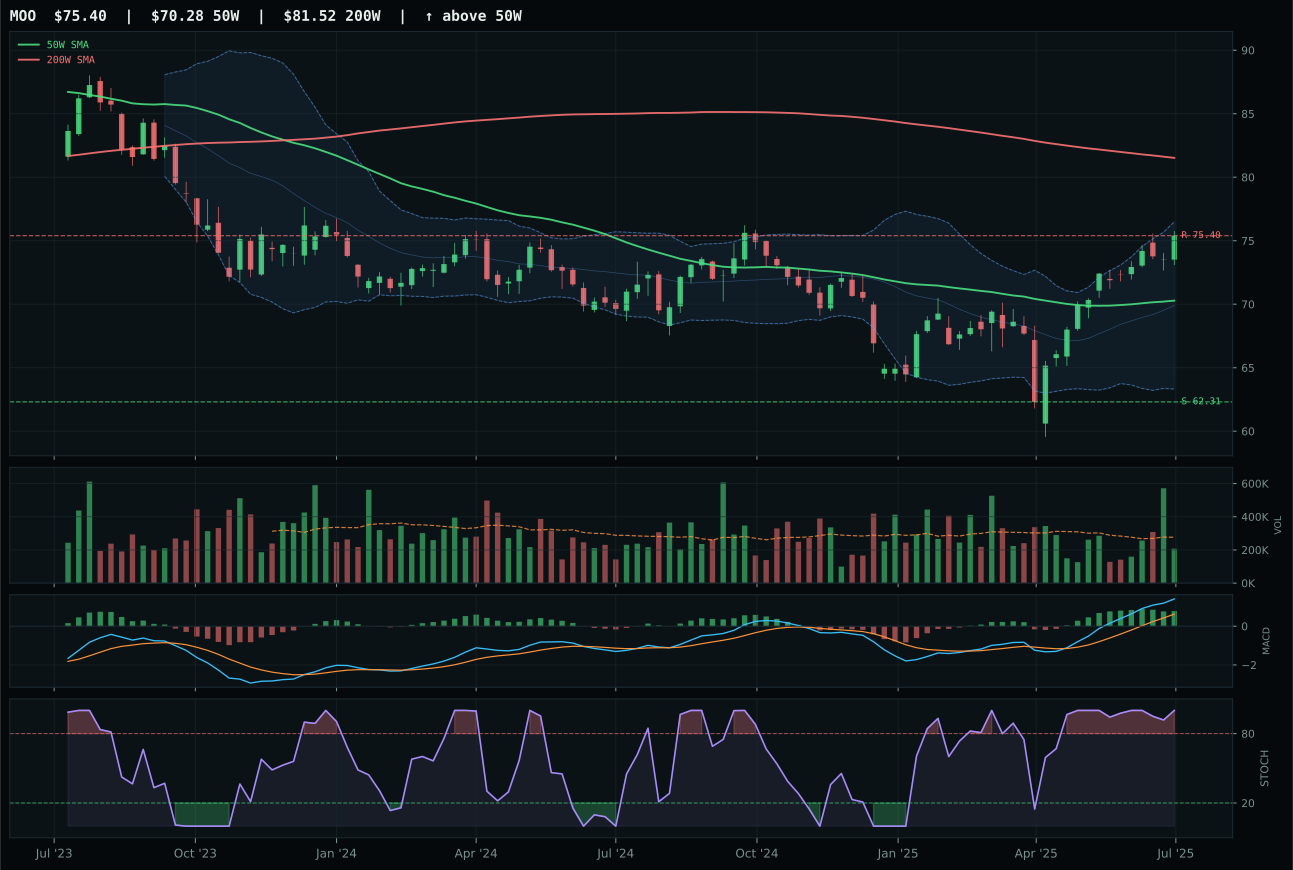
MOO has a neutral structure profile with -2.8% 13-week relative strength versus SPY.
A failed hold above support would weaken the setup.
Actionable but governed by invalidation levels.
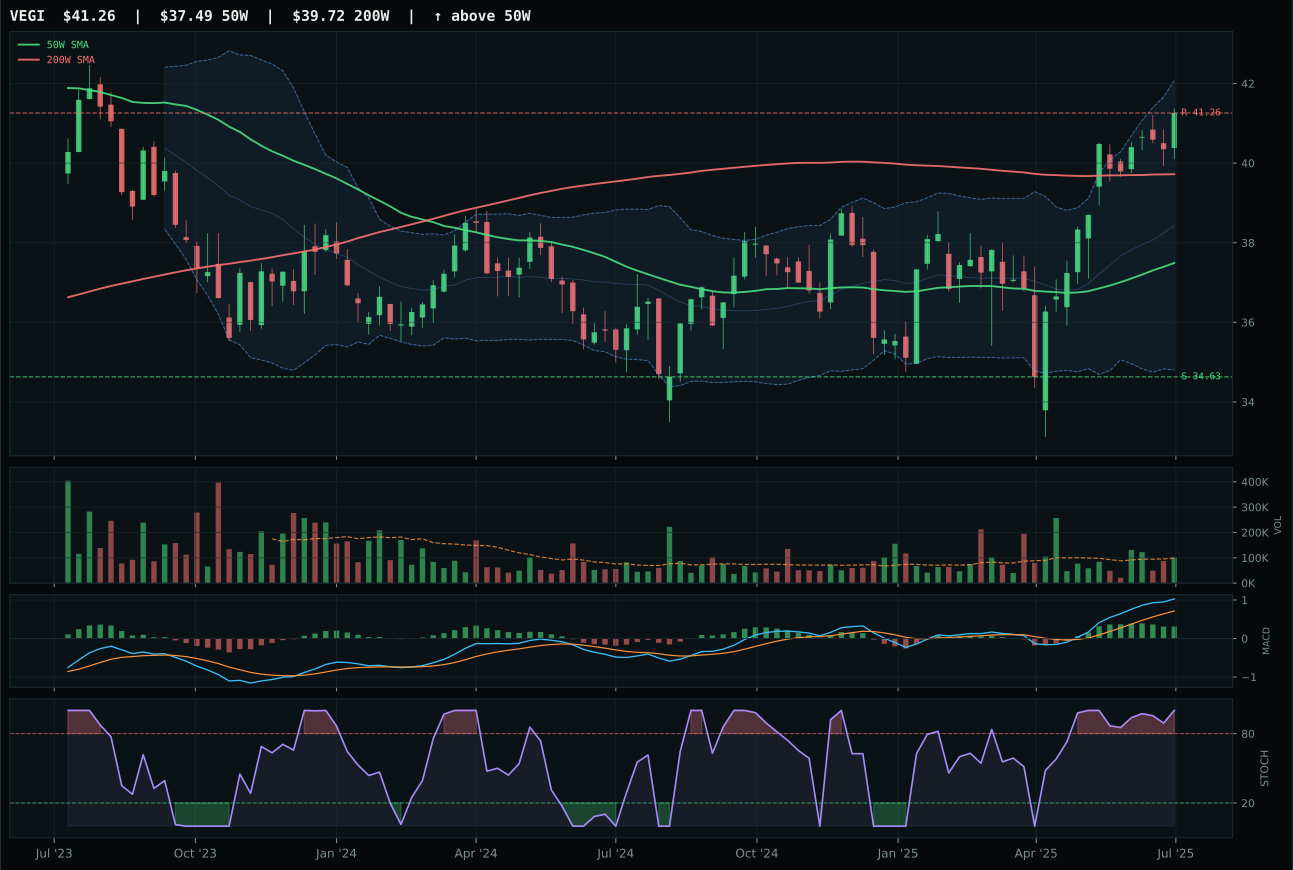
VEGI has a neutral structure profile with -4.6% 13-week relative strength versus SPY.
A failed hold above support would weaken the setup.
Tracked, but not top-2 eligible because: .
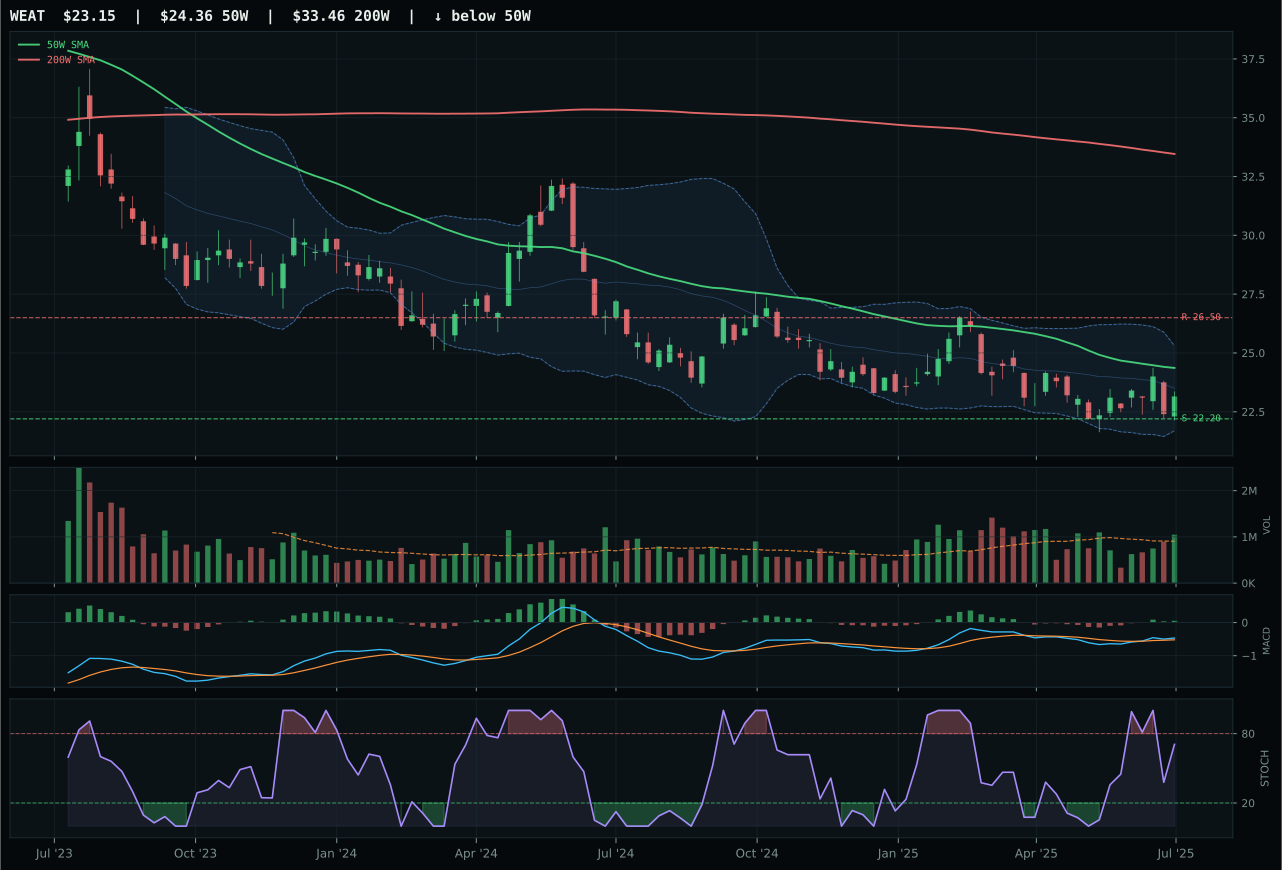
WEAT has a pullback into support profile with -23.5% 13-week relative strength versus SPY.
Extension and support failure are the main tactical risks.
Tracked, but not top-2 eligible because: structurally broken.
MOO dominated VEGI with superior trend, timing, and structure scores despite both charts posting bullish-but-flattening MACD and overbought stochastics near 52-week highs. MOO's 71.9 trend score versus VEGI's 89.0 reflects the critical technical difference: MOO trades above the 50-week but below the 200-week, creating a pullback-into-structure setup that still has room to extend, whereas VEGI's extended trend already priced in the upside. MOO's 1.9% category-relative strength and cleaner neutral structure (80.0 vs 77.4) captured fresh accumulation; VEGI's flat 0.0% relative strength and foreign exposure disadvantaged it in a liquidity-stress environment. The 18.7-point score gap translated to MOO's positioning as domestic agribusiness cash-generation play rather than global commodity production, aligning better with supply-shortage and inflation-pressure macro tailwinds.
Agriculture scores 48.5 and ranks eighth, yet earned 5% allocation because its macro fit at 90.0/100 is exceptional—supply shortage at +13, inflation pressure at +10, late-cycle reflation at +8, real asset sponsorship at +8, and commodity breadth positive at +5. This is one of the few categories where macro fit actually exceeds technical evidence (67.1), creating a 38% weighting toward descriptors that are currently active and supporting real-asset allocations. The risk-off deterioration hurts only modestly at -5 because commodities are countercyclical in true deterioration regimes. However, MOO's trend score of 71.9 is the lowest trend score among category winners, and the MACD is flattening rather than improving, signaling that momentum is peaking. This is a macro-driven conviction hold rather than a technical momentum position. Agriculture would climb to 10% if supply-shortage and inflation-pressure descriptors intensify, or if MOO's price pulls back to the 50-week moving average to reset timing; at current valuations it's a 5% real-asset kicker rather than a core engine.
Emerging Markets — IEMG
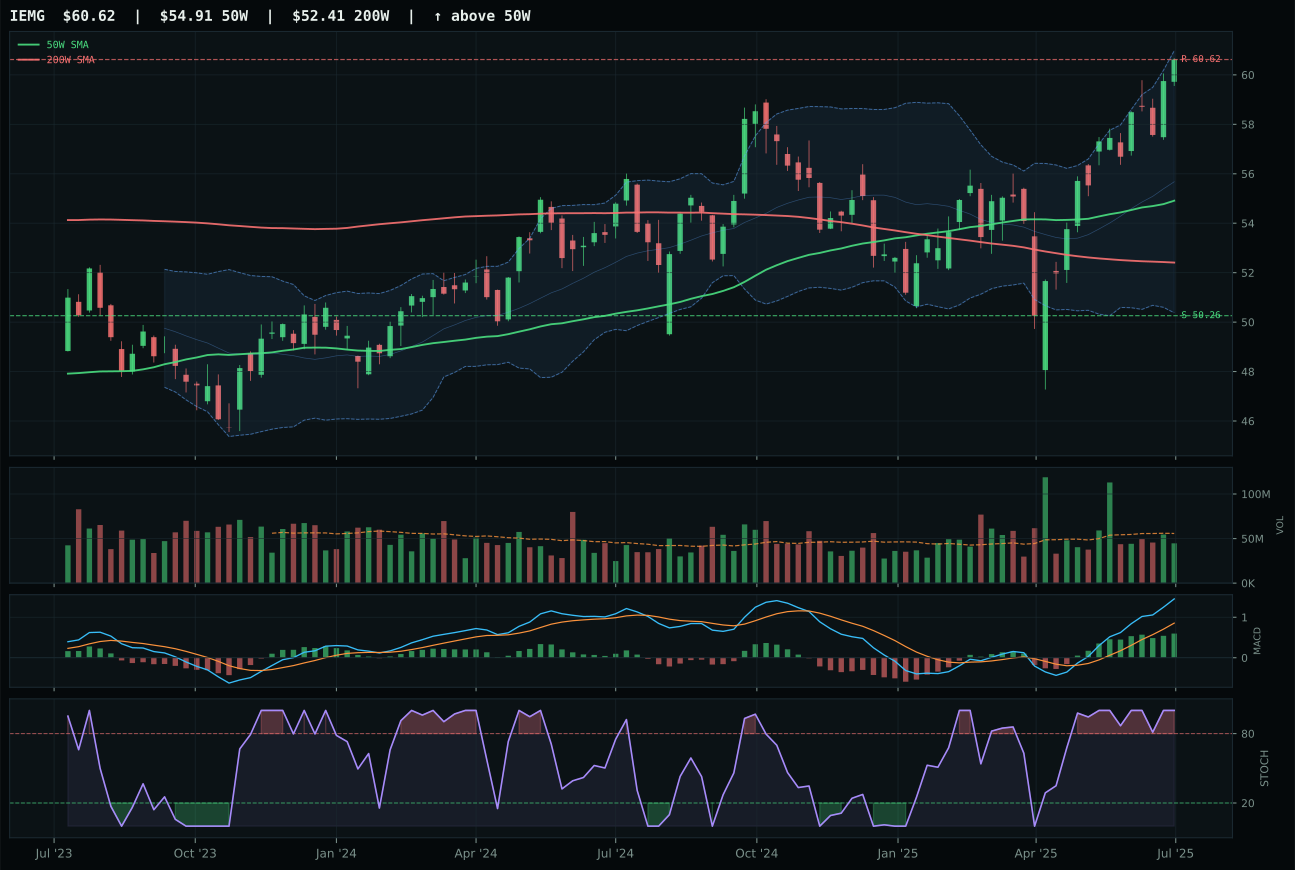
IEMG has a neutral structure profile with -3.1% 13-week relative strength versus SPY.
A failed hold above support would weaken the setup.
Actionable but governed by invalidation levels.
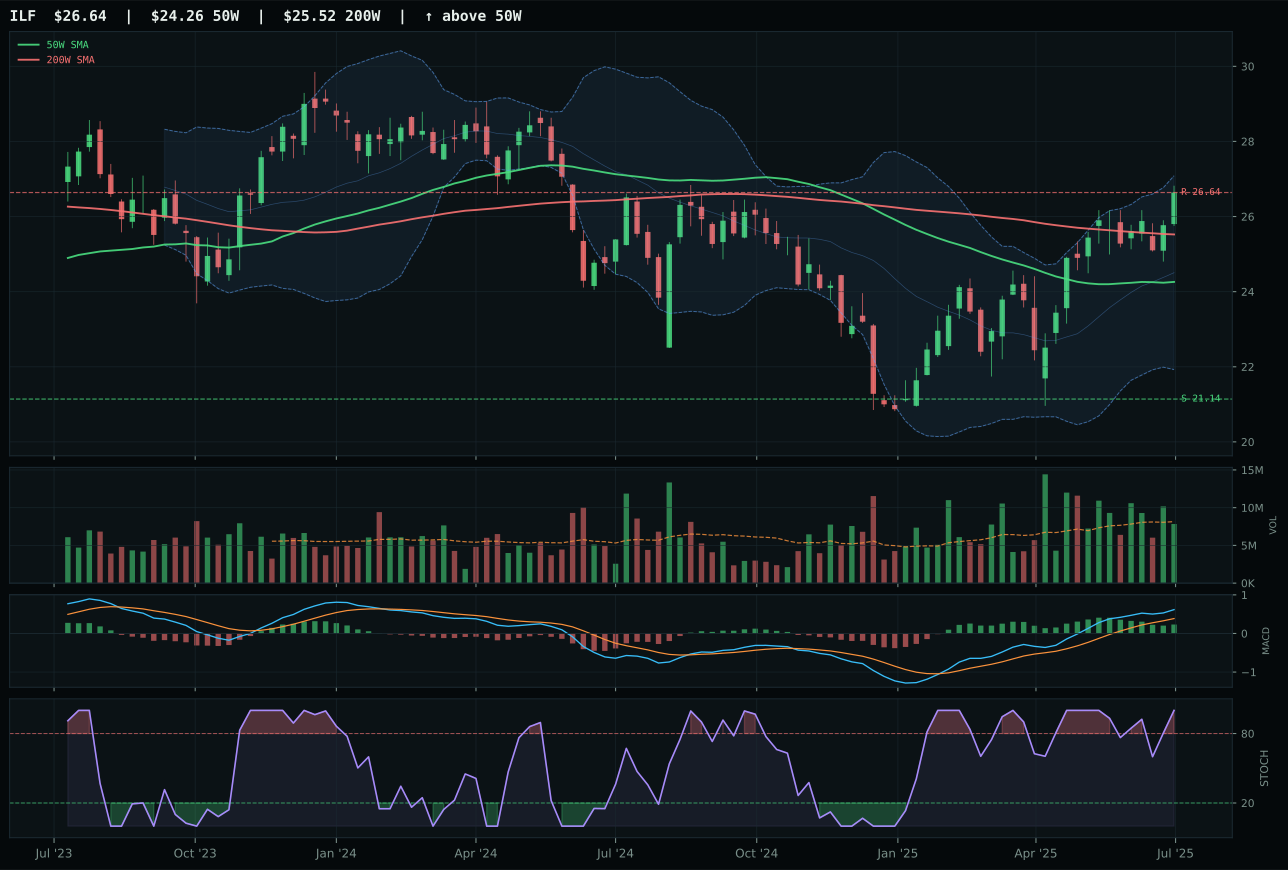
ILF has a neutral structure profile with -5.0% 13-week relative strength versus SPY.
A failed hold above support would weaken the setup.
Actionable but governed by invalidation levels.
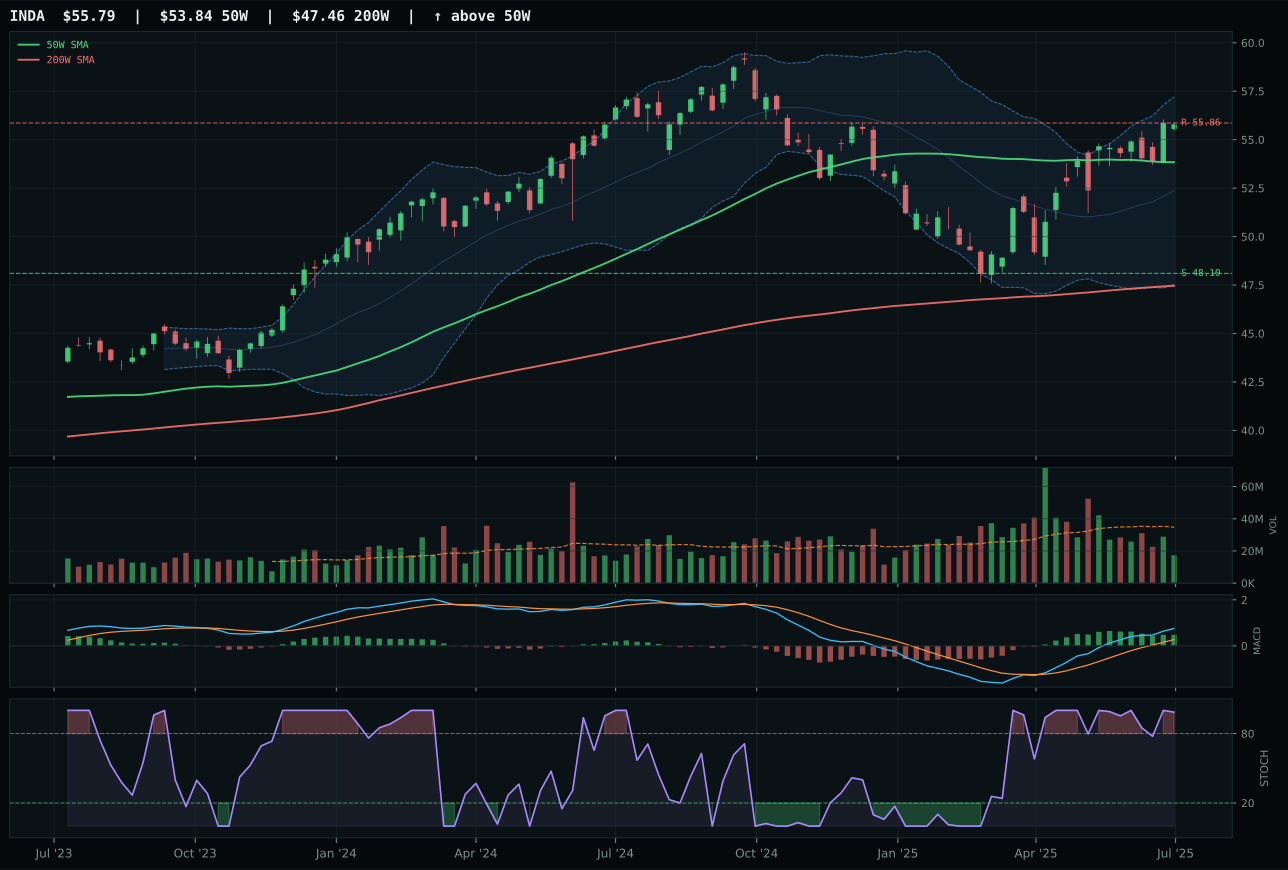
INDA has a neutral structure profile with -10.3% 13-week relative strength versus SPY.
A failed hold above support would weaken the setup.
Actionable but governed by invalidation levels.
IEMG won a tight 2.8-point race against ILF by maintaining MACD bullish and improving versus ILF's flattening momentum and capturing 1.9% category-relative strength versus ILF's flat positioning. Both charts sit above the 50-week and 200-week in neutral structure near 52-week highs, but IEMG's broader emerging-market beta outperformed ILF's Latin America commodity tilt on relative strength within the category. IEMG's 59.0 timing score exceeded ILF's 70.0 (ILF arrived at better Fibonacci levels), but the bullish-improving MACD and stronger volume-price confirmation (71.5 vs ILF's lower participation) indicated fresher capital supporting the broad EM trade. IEMG's neutral 0.80x volume and overbought stochastic matched ILF's, but the structure score advantage (79.8 vs 78.7) and cleaner MACD progression made IEMG the more disciplined representative.
Emerging Markets scores 45.0 and ranks tenth, excluded entirely from allocation at 0% because macro fit at 26.0/100 is the worst in the entire portfolio. Risk-off deterioration hits at -12, credit stress at -10, and liquidity stress at -10—that's -32 in raw descriptor penalties with only +8 from risk appetite positive to offset. The category is frontally exposed to the risk-off deterioration regime and has no thematic scarcity or supply-shortage support like real assets do. IEMG's technical evidence at 76.8/100 is solid, but it cannot overcome a macro fit that's only 26.0. The 20.6% 13-week return looks attractive until contextualized: it's still lagging SPY by -3.1%, and the setup sits in near 52-week high territory with overbought momentum and only neutral volume participation. Emerging markets would return to allocation if risk appetite reversed or if credit stress indicators began to normalize; right now the portfolio has FBTC, COPX, and URNM providing the growth/risk exposure, and PAVE/IEMG-type exposures would dilute capital from the clearer opportunities. Emerging markets stay at 0% until the risk-off regime shows signs of fatigue.