
2025-06-27
Informational purposes only. The content in this report, including allocations, analysis, and commentary, is provided solely for informational and educational purposes. It does not constitute financial advice, investment advice, trading advice, or any other type of advice. Past performance does not guarantee future results. Always conduct your own research and consult a qualified financial professional before making investment decisions.
Weekly Allocation
| Ticker | Category | Weight | Role |
|---|---|---|---|
| FBTC | 50% | Overlay | |
| XLK | Technology | 10% | Top-2 (10%) |
| SMH | AI | 10% | Top-2 (10%) |
| URNM | Nuclear Energy | 5% | Tier-2 (5%) |
| PAVE | Utilities & Infrastructure | 5% | Tier-2 (5%) |
| XAR | Defense & Aerospace | 5% | Tier-2 (5%) |
| SLV | Precious Metals | 5% | Tier-2 (5%) |
| IEMG | Emerging Markets | 5% | Tier-2 (5%) |
| COPX | Industrial Metals | 5% | Tier-2 (5%) |
Trade Instructions — Monday Open
Sell the tranche from 2025-05-30 (completing its 4-week hold). Buy the new tranche. Instructions show net portfolio changes — same-asset positions cancel, weight changes show the delta.
| Action | Ticker | Instruction |
|---|---|---|
| SELL | GLD | Sell entire GLD position (2.50% of portfolio) |
| SELL | XLU | Sell 50% of XLU position (reduce 5.00% → 2.50%) |
| SELL | URA | Sell 17% of URA position (reduce 7.50% → 6.25%) |
| SELL | ITA | Sell 50% of ITA position (reduce 2.50% → 1.25%) |
| BUY | XLK | Buy XLK — 16.67% of freed cash (adds 1.25% to portfolio) |
| BUY | SMH | Buy SMH — 16.67% of freed cash (adds 1.25% to portfolio) |
| BUY | SLV | Buy SLV — 16.67% of freed cash (adds 1.25% to portfolio) |
| BUY | XAR | Buy XAR — 16.67% of freed cash (adds 1.25% to portfolio) |
| BUY | URNM | Buy URNM — 16.67% of freed cash (adds 1.25% to portfolio) |
| BUY | PAVE | Buy PAVE — 16.67% of freed cash (adds 1.25% to portfolio) |
Current Portfolio After Trade
Combined holdings across all 4 active tranches. Each tranche is 25% of the portfolio.
| Ticker | % of Portfolio | Weight Bar |
|---|---|---|
| FBTC | 50.00% | |
| SLV | 8.75% | |
| XLK | 7.50% | |
| URA | 6.25% | |
| SMH | 6.25% | |
| COPX | 5.00% | |
| XAR | 3.75% | |
| XLU | 2.50% | |
| IEMG | 2.50% | |
| FCG | 2.50% | |
| ITA | 1.25% | |
| IGF | 1.25% | |
| URNM | 1.25% | |
| PAVE | 1.25% |
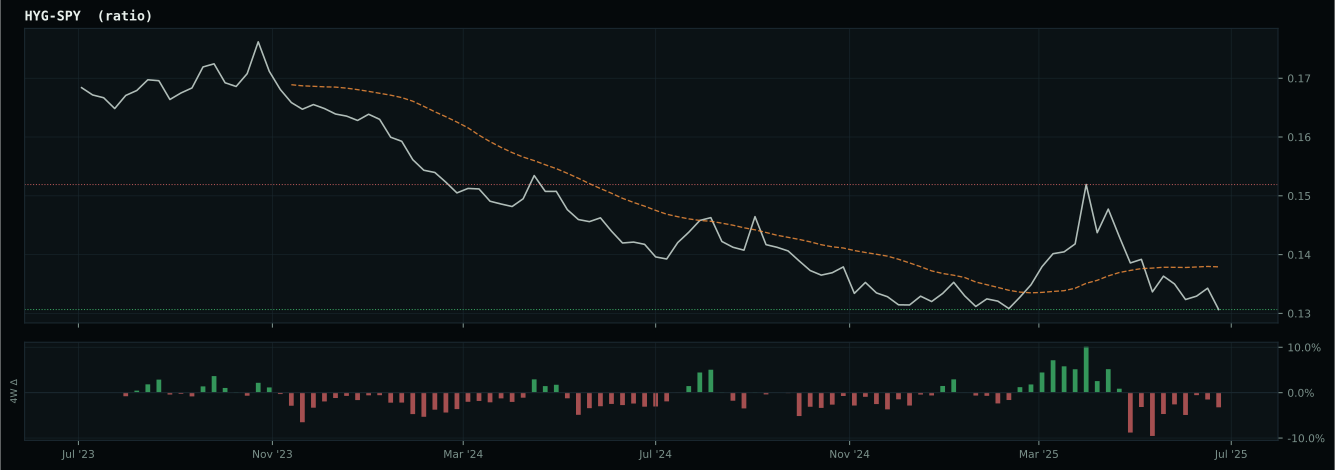
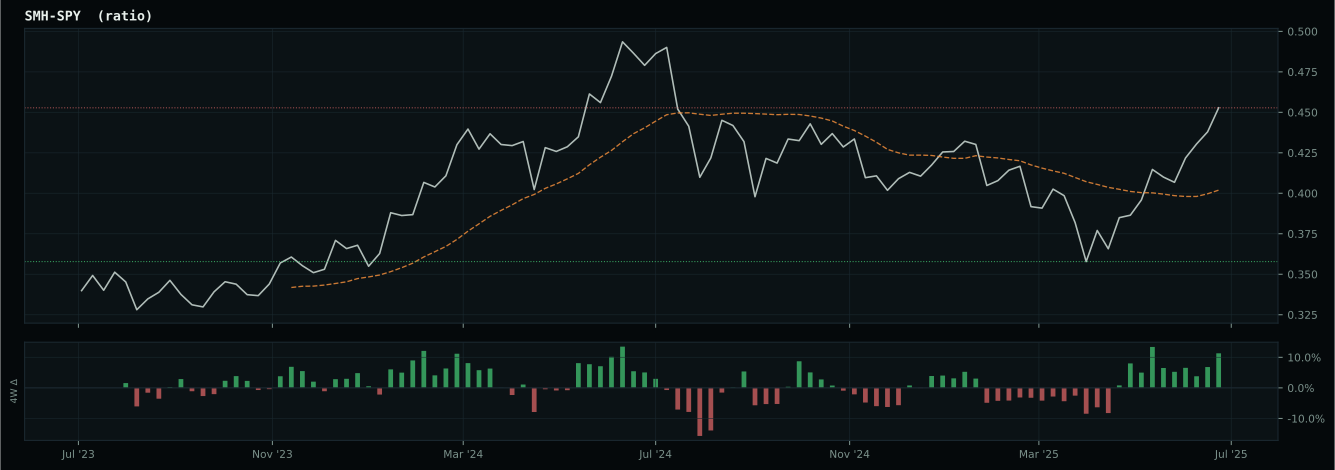
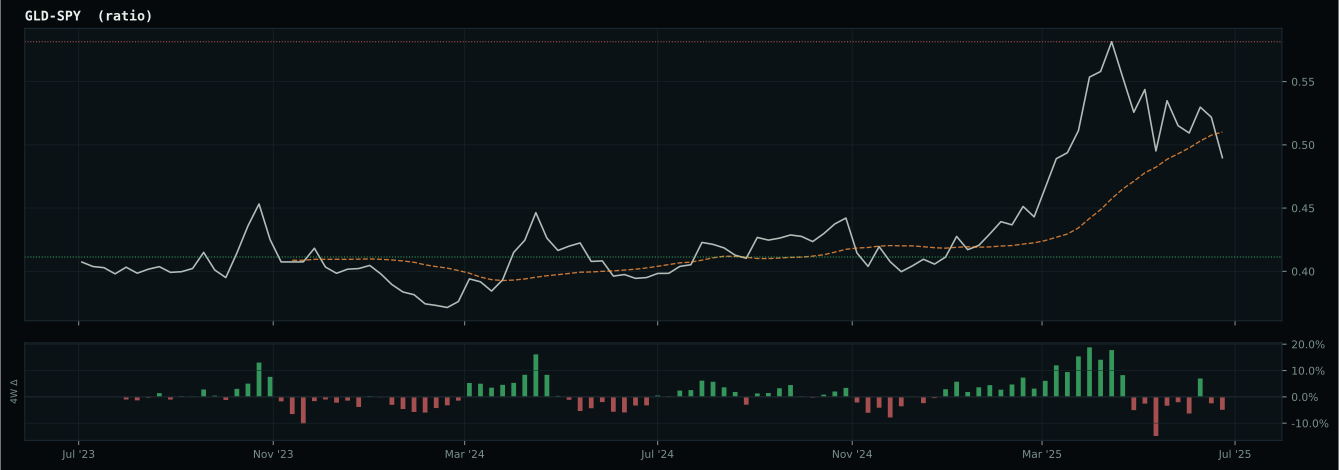
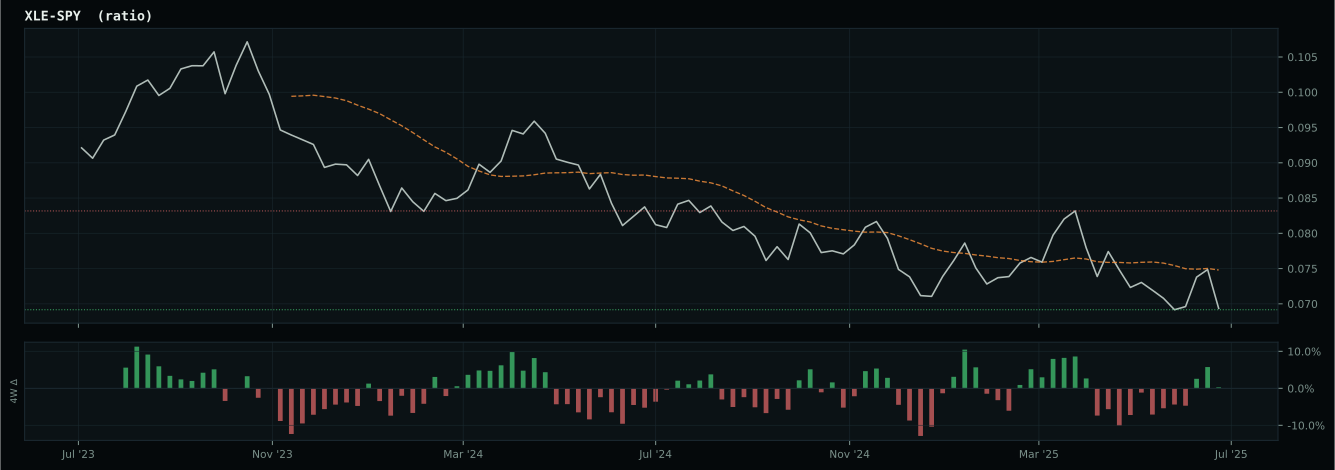
Macro Regime — Disinflation
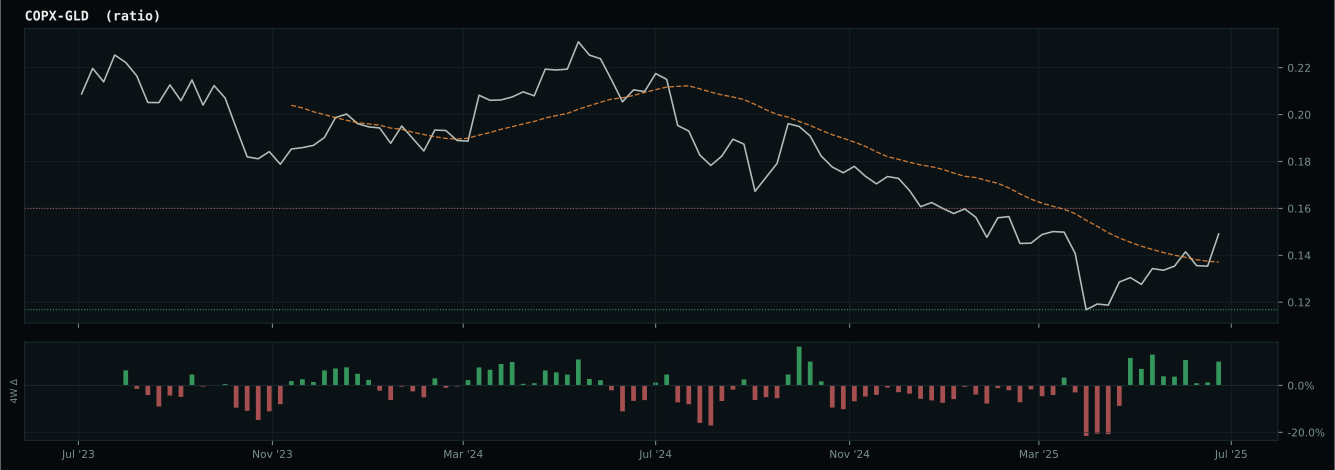
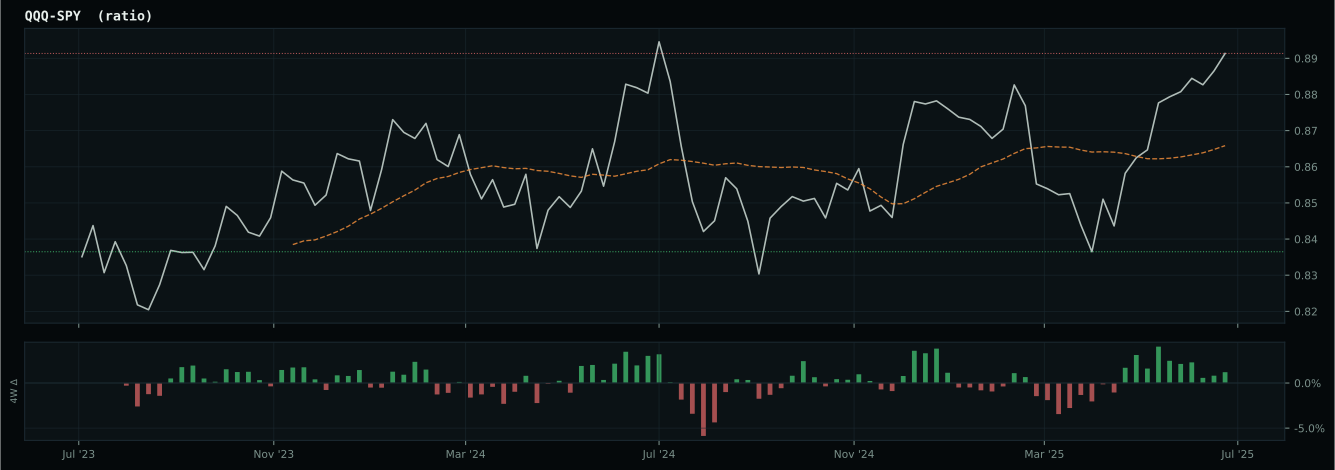
Macro Evidence Charts
Market-implied signals behind the macro regime scores. Each ratio compares two assets; the direction and slope of the ratio is what the macro engine reads.
Crypto Regime — TrendBTC
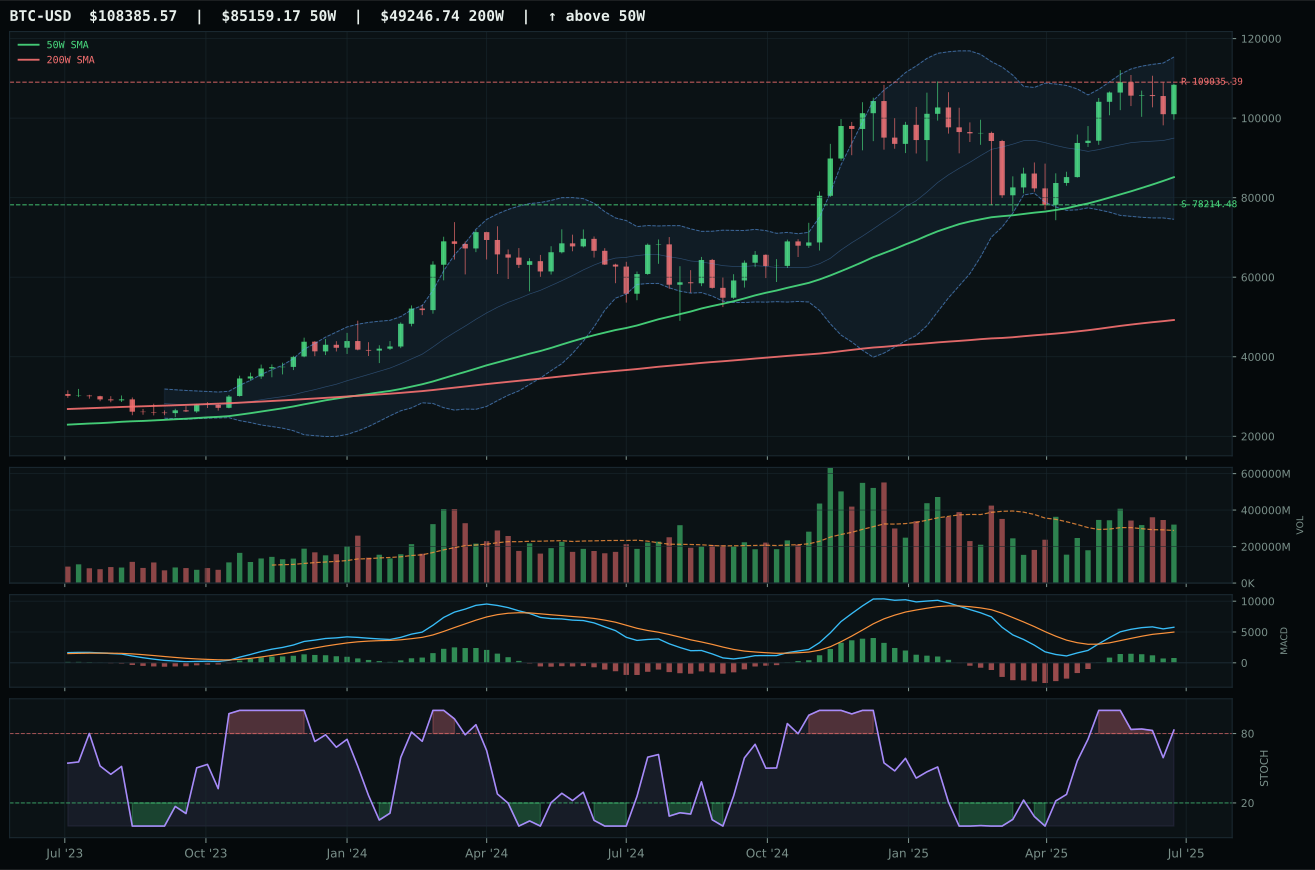
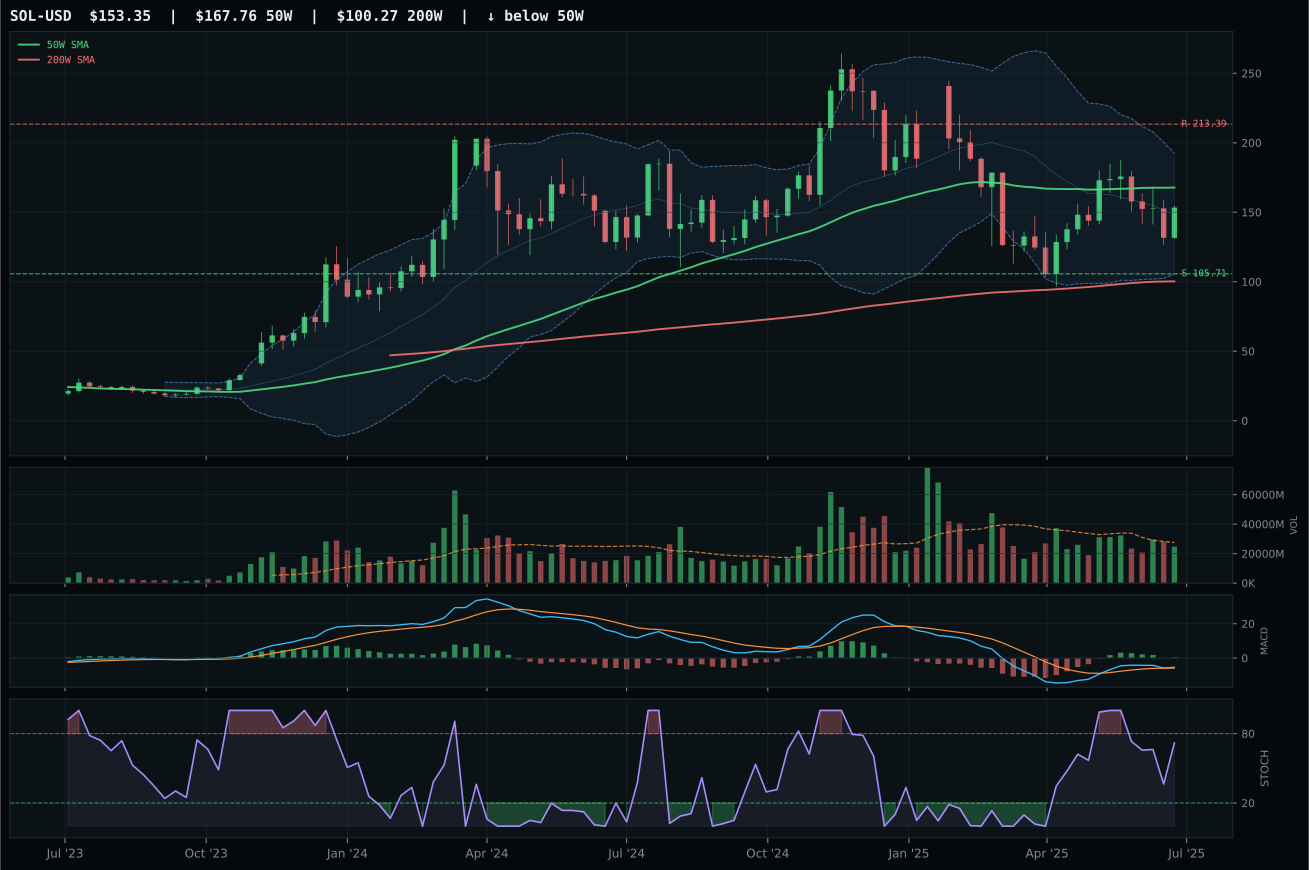
ValueBTC not armed: BTC has not made the first post-breakdown touch of the 200W buy zone after losing the 50W
TrendBTC confirmed: 2 consecutive closes above rising/flat 50W SMA
one or more available conditions failed
Category Rankings
| Rank | Category | Winner | Score | Alloc | 4W Ret | Peers (4W) |
|---|---|---|---|---|---|---|
| 1 | Technology | XLK | 73.1 | 20% | +3.96% | CIBR -0.6% · IGV +3.5% |
| 2 | AI | SMH | 72.9 | 20% | +3.60% | AIQ +2.9% · BOTZ +5.5% |
| 3 | Nuclear Energy | URNM | 70.0 | 10% | +2.32% | URA +7.3% · NLR +9.3% |
| 4 | Utilities & Infrastructure | PAVE | 68.2 | 10% | +7.24% | IGF +1.0% · XLU +4.4% |
| 5 | Defense & Aerospace | XAR | 59.8 | 10% | +5.19% | ITA +6.1% · ROKT +6.5% |
| 6 | Precious Metals | SLV | 51.2 | 10% | +5.90% | GDX +4.4% · GLD +1.3% |
| 7 | Emerging Markets | IEMG | 50.9 | 10% | +2.55% | INDA -3.8% · ILF -2.2% |
| 8 | Industrial Metals | COPX | 48.2 | 10% | -0.09% | PICK +5.8% · REMX +32.6% |
| 9 | Agriculture & Livestock | MOO | 19.3 | 0% | +1.32% | VEGI +1.4% · WEAT -0.9% |
| 10 | Traditional Energy | XLE | — | 0% | +3.19% | XOP +2.5% · FCG +1.5% |
Technology — XLK
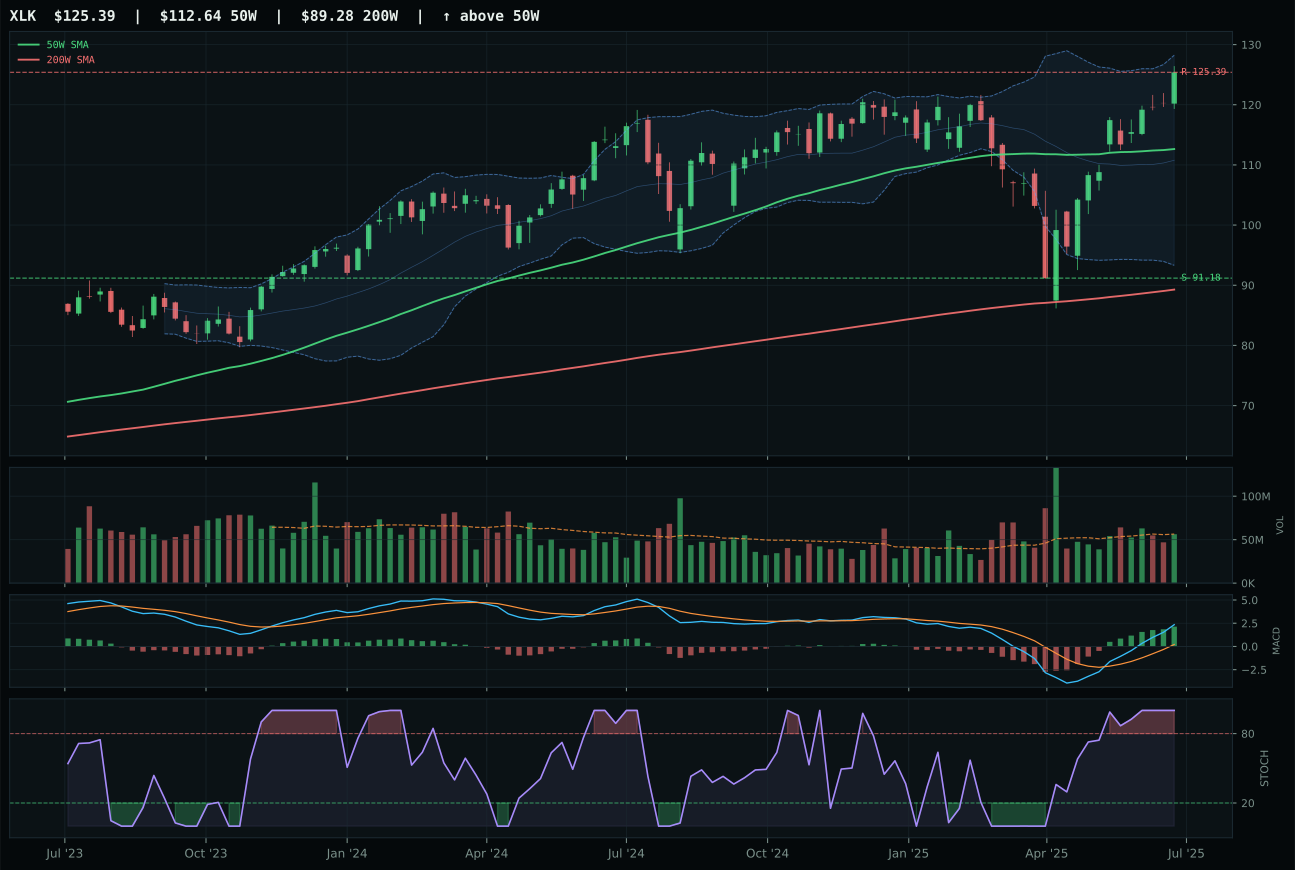
XLK has a neutral structure profile with 10.8% 13-week relative strength versus SPY.
A failed hold above support would weaken the setup.
Actionable but governed by invalidation levels.
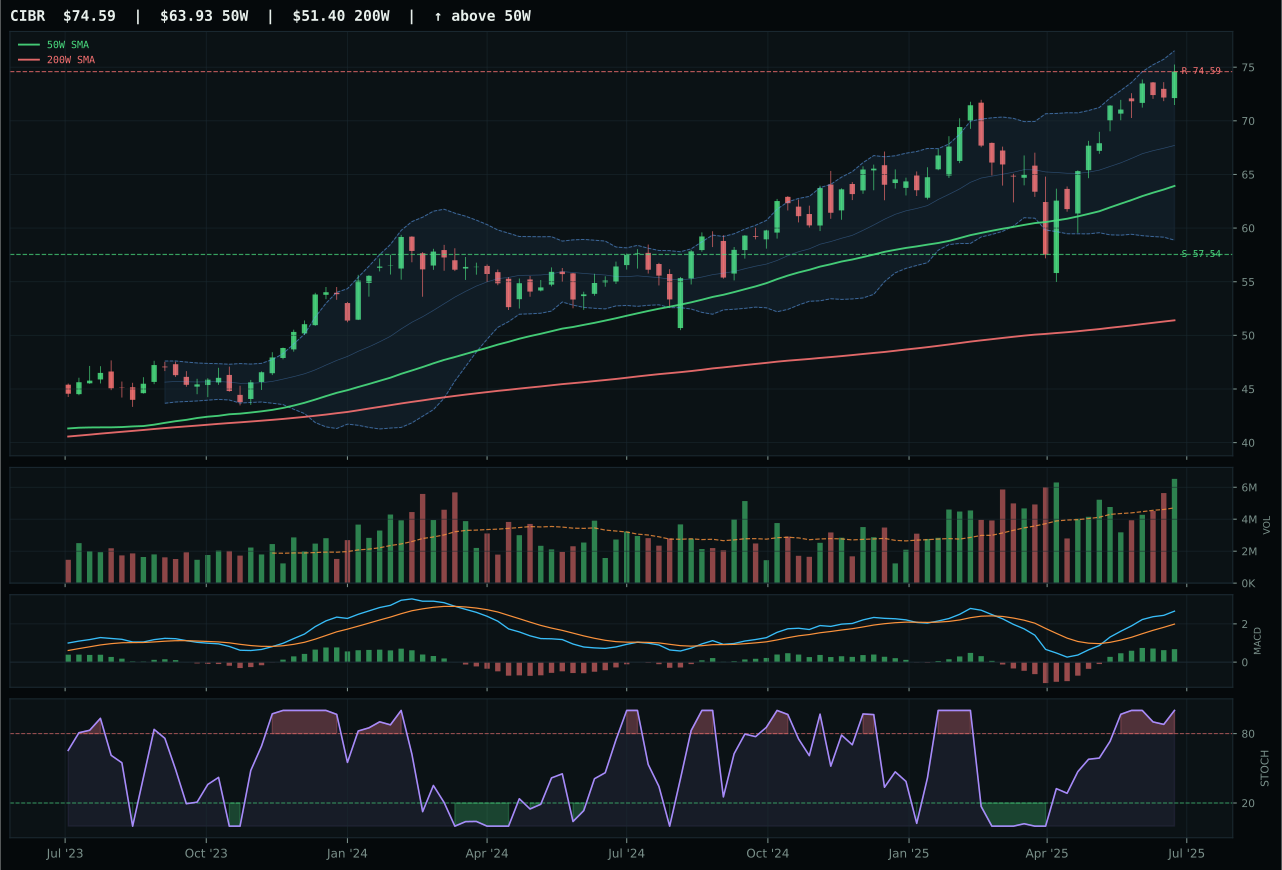
CIBR has a vertical extension profile with 7.0% 13-week relative strength versus SPY.
A failed hold above support would weaken the setup.
Actionable but governed by invalidation levels.
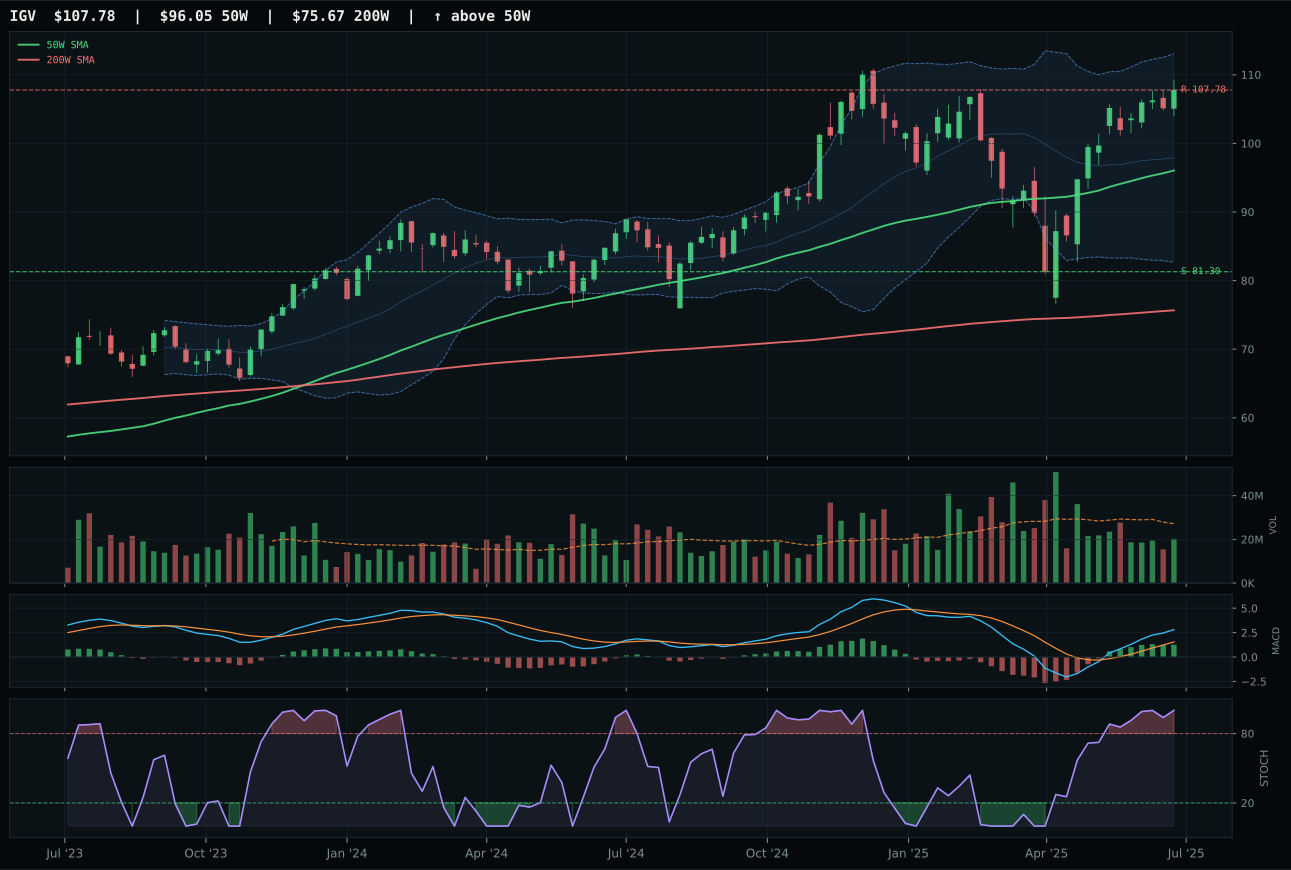
IGV has a neutral structure profile with 9.3% 13-week relative strength versus SPY.
A failed hold above support would weaken the setup.
Actionable but governed by invalidation levels.
XLK wins the category because it sits in the sweet spot between confirmed trend and reasonable entry risk. Price above both the 50W and 200W at just 11.5% extension signals a neutral setup rather than a late-stage chase, and the 50W slope at 0.2% confirms the trend is still forming rather than rolling over. The 13W return of 21.5% paired with 10.8% relative strength versus SPY shows sustained institutional accumulation—not a gap-and-fade bounce. Volume remains neutral at 1.00x the 20W average while MACD improves, creating the exact sponsorship pattern that justifies entry. CIBR lost ground despite identical bullish technicals because it sits 16.7% above the 50W in a vertical extension setup, making every new buyer late; its category-relative strength turned negative at -2.3% versus XLK's +1.6%, signaling that within the three-ETF basket, broad profitable tech is winning over the narrower cybersecurity thesis.
Technology earns the 10% top-2 overweight because it ranked among the two highest eligible category scores this week at 73.1. The setup is clean: XLK's neutral structure allows a long-duration position without the entry friction of extended setups, while the macro environment—disinflation, active risk appetite, and AI growth sponsorship—favors capital allocation into profitable growth rather than defensive strategies. MACD improvement on neutral volume suggests accumulation is happening below the resistance line at 125.39, a textbook rewarding timing for fresh money. The category's macro fit of 60.0 is adequate; disinflation helps technology by reducing funding costs, and the active descriptors (risk appetite positive at +9, AI sponsorship at +6) more than offset liquidity stress at -10. This is not a crowded positioning call—it is a setup where the chart confirms the narrative and entry risk remains manageable relative to the 37.5% downside cushion to support.
AI — SMH
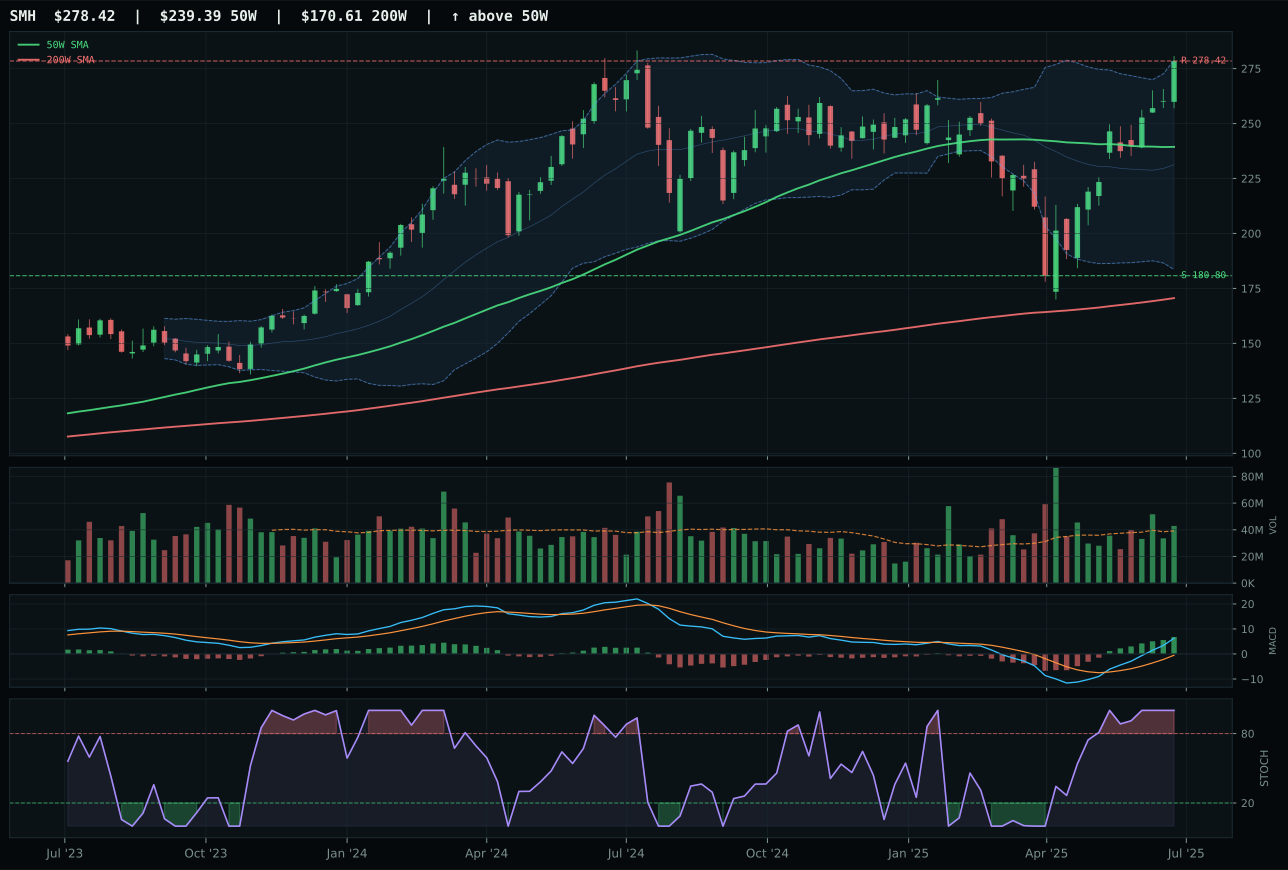
SMH has a vertical extension profile with 20.6% 13-week relative strength versus SPY.
A failed hold above support would weaken the setup.
Actionable but governed by invalidation levels.
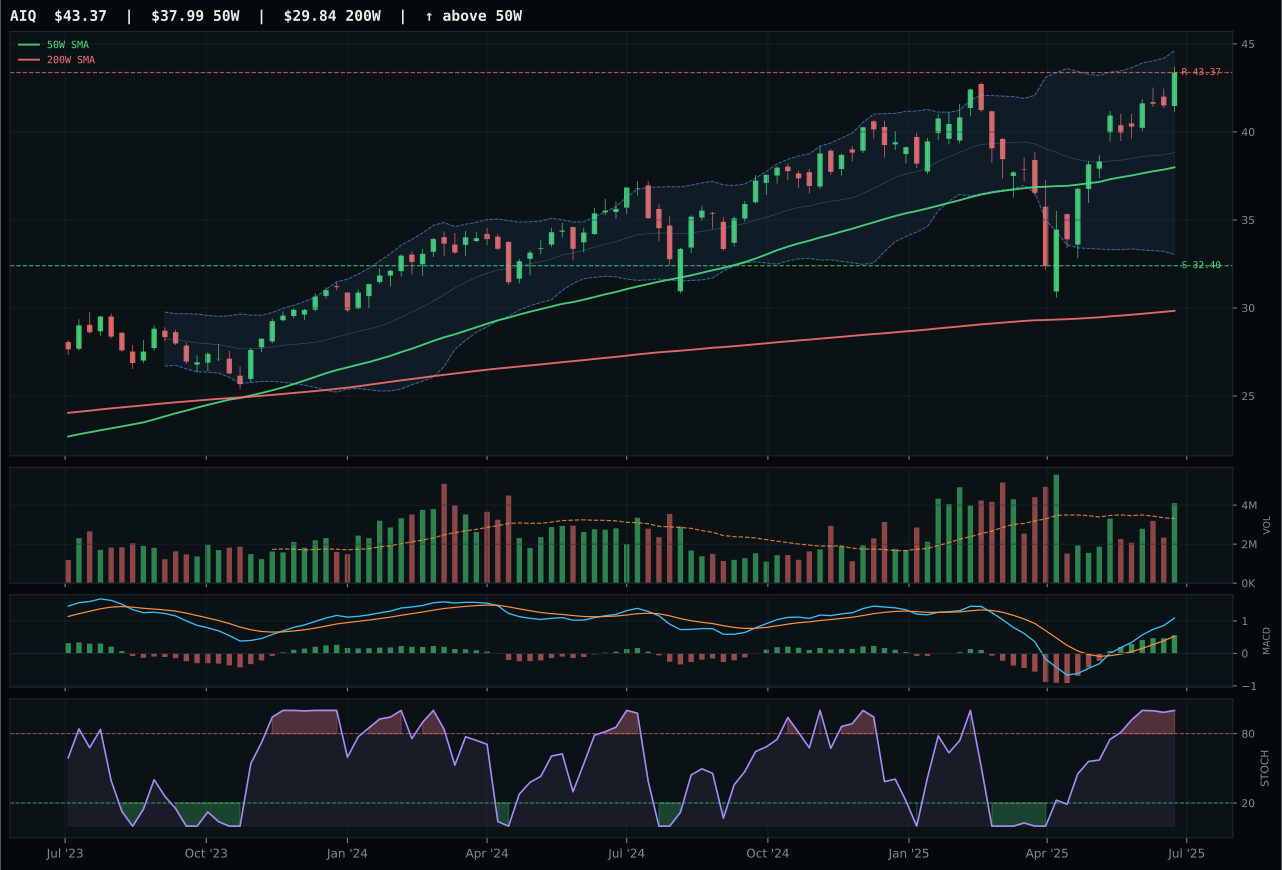
AIQ has a neutral structure profile with 8.0% 13-week relative strength versus SPY.
A failed hold above support would weaken the setup.
Actionable but governed by invalidation levels.
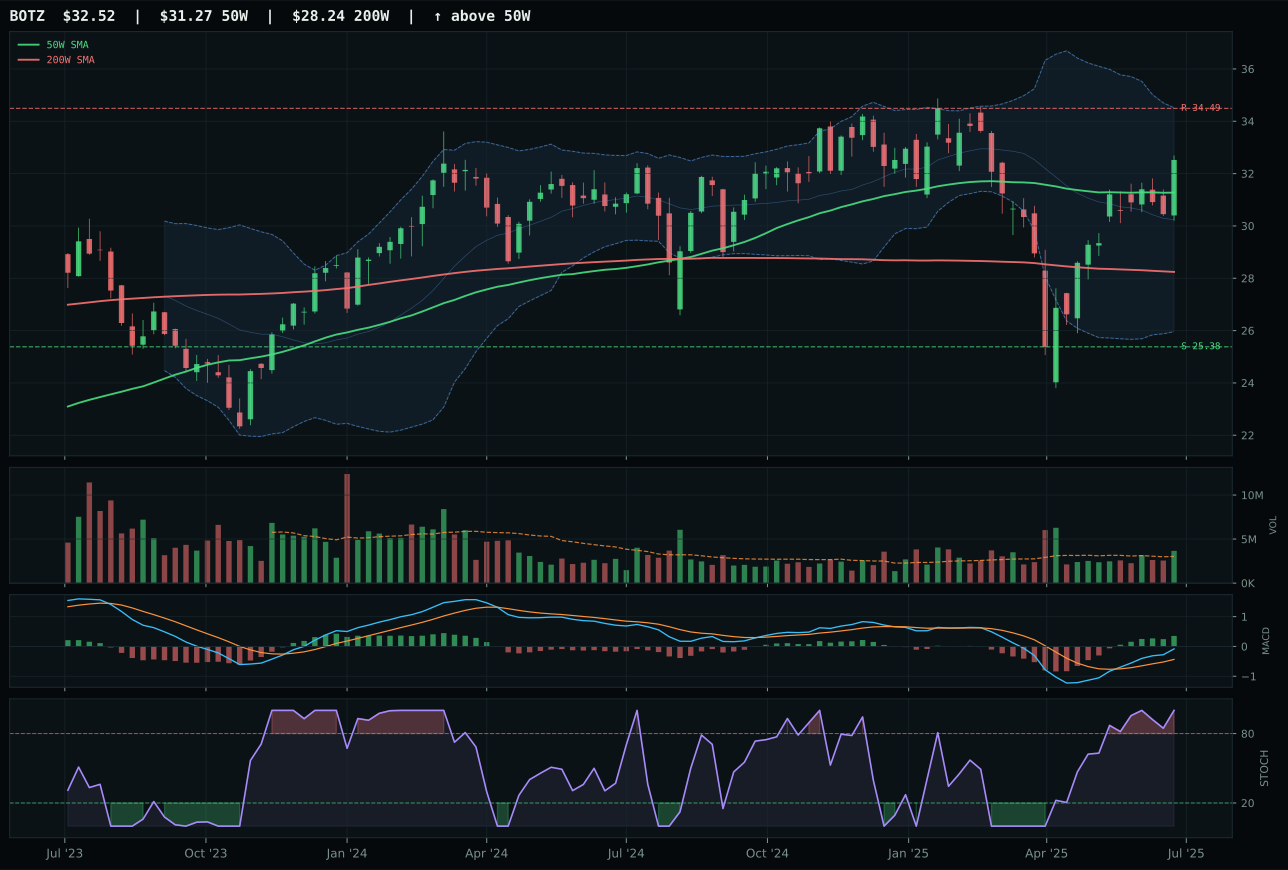
BOTZ has a neutral structure profile with 1.7% 13-week relative strength versus SPY.
A failed hold above support would weaken the setup.
Actionable but governed by invalidation levels.
SMH wins by delivering the highest momentum relative strength at 20.6% versus SPY, yet it absorbs that strength more credibly than AIQ because the 13W return of 31.2% is paired with a 12.5% category-relative edge and persistence score of 92.7—meaning the move is neither a short squeeze nor a technical reversion. The risk to the entry is real: SMH sits 16.3% above the 50W in a vertical extension with the 52W high sitting near Fib 0.236, leaving just 0.0% upside to resistance. However, the volume signature (neutral at 1.09x 20W average) combined with MACD bullish and improving rules out distribution pressure, suggesting this is true accumulation in the compute cycle. AIQ's structure is cleaner and its technical evidence score higher at 88.6, but the category-relative strength collapsed to 0.0%—it is gaining on SPY but losing within its own cohort, a tell that AI software/application breadth is lagging the semiconductor scarcity narrative.
AI earns the 10% top-2 overweight because it ranked second among all eligible categories at 72.9, just 0.2 points below Technology. SMH's aggressive momentum—45.1% longer 13W return than the category median—makes sense in a disinflation regime where real yields fall and cost-of-capital-intensive capex becomes cheaper. The macro fit is 59.0 and the active descriptors strongly support this: AI growth sponsorship at +14, risk appetite positive at +10, but liquidity stress at -12 and credit stress at -8 create real near-term headwinds. The allocation holds because the technical evidence (82.2) overwhelms the macro concerns via the 62% / 38% weighting, and because persistence at 92.7 proves that the move has legs rather than being a late-stage rip. Entry risk is real, but the dual-tail asymmetry (strong momentum confirmation, but extended on the chart) is exactly what a top-2 position should hold: rewarding but not free.
Nuclear Energy — URNM
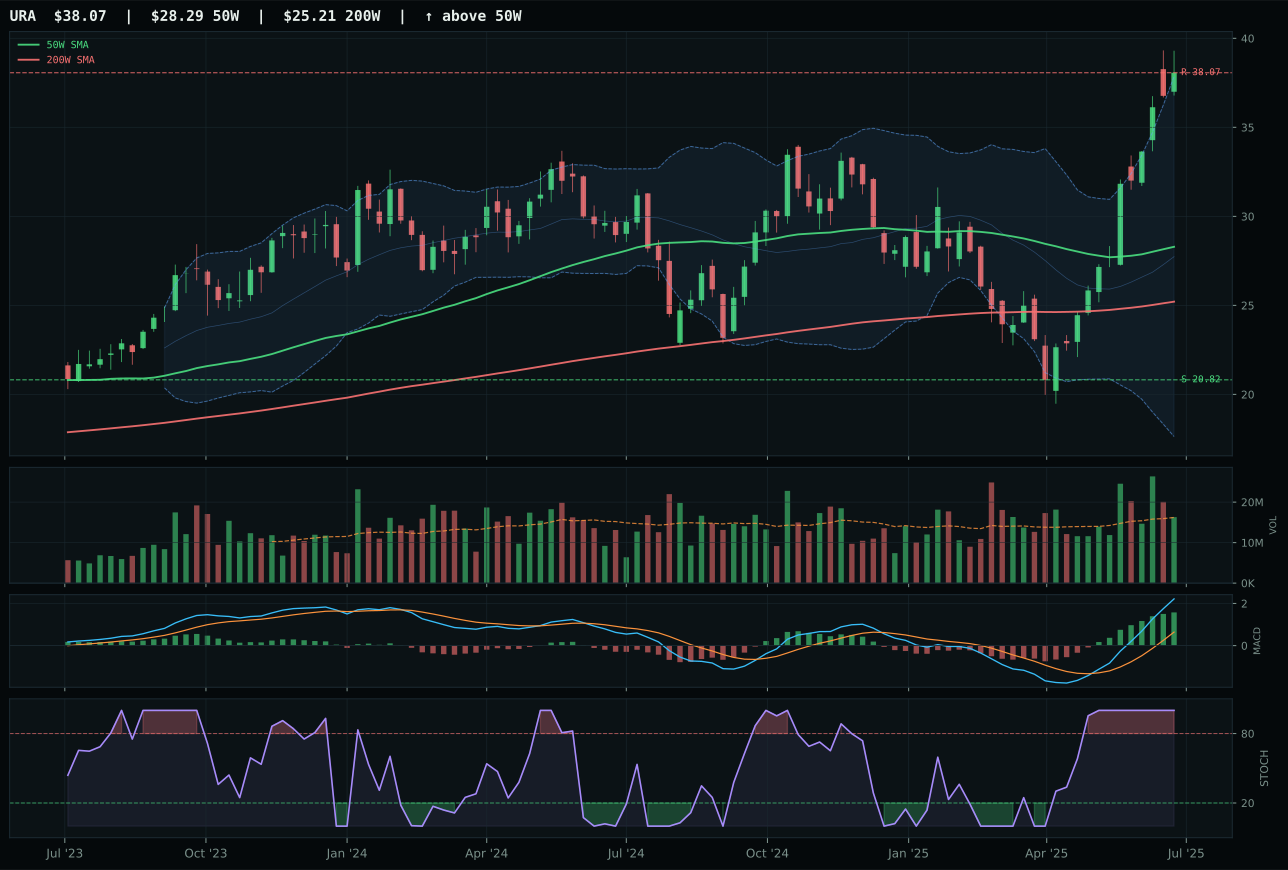
URA has a vertical extension profile with 54.1% 13-week relative strength versus SPY.
A failed hold above support would weaken the setup.
Actionable but governed by invalidation levels.
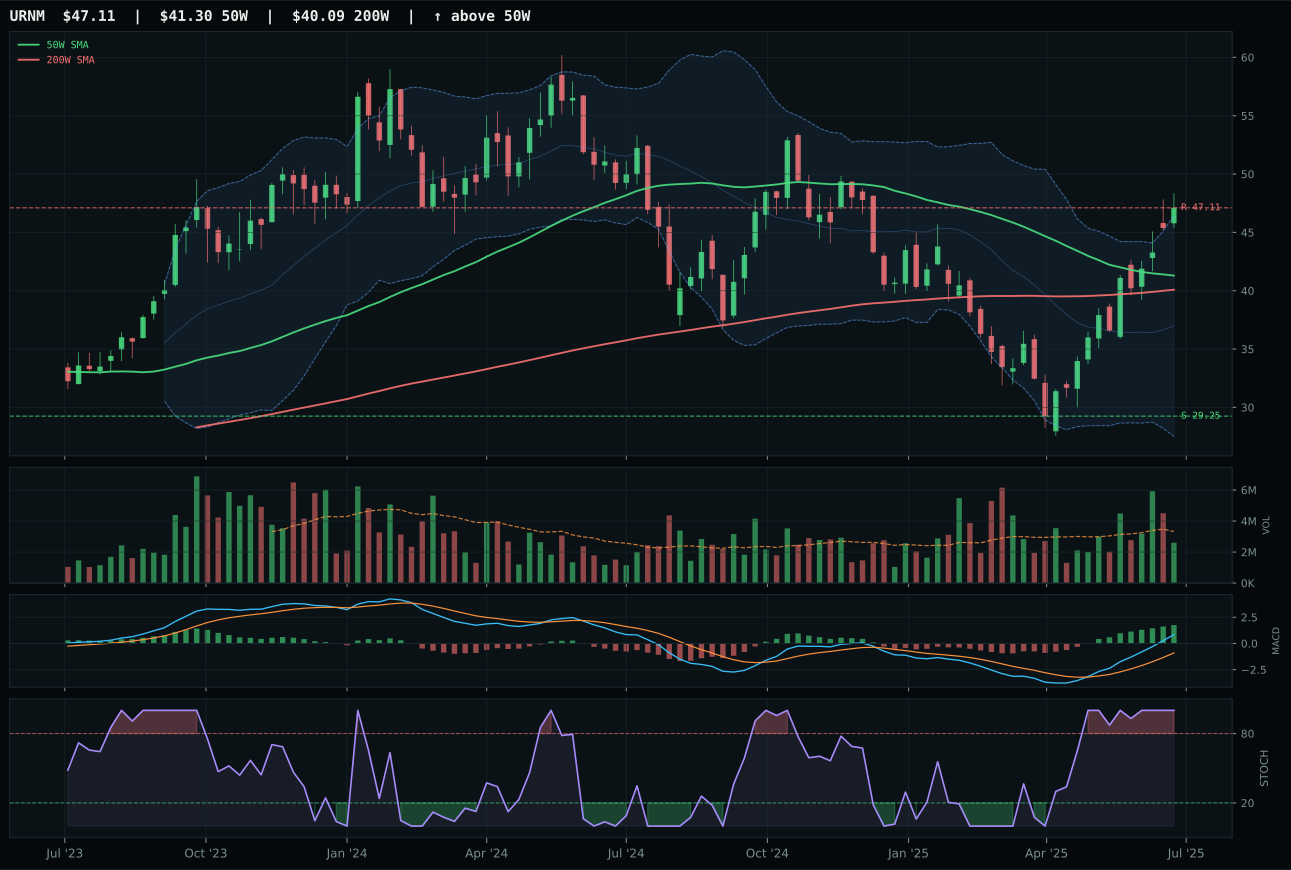
URNM has a neutral structure profile with 34.5% 13-week relative strength versus SPY.
A failed hold above support would weaken the setup.
Actionable but governed by invalidation levels.
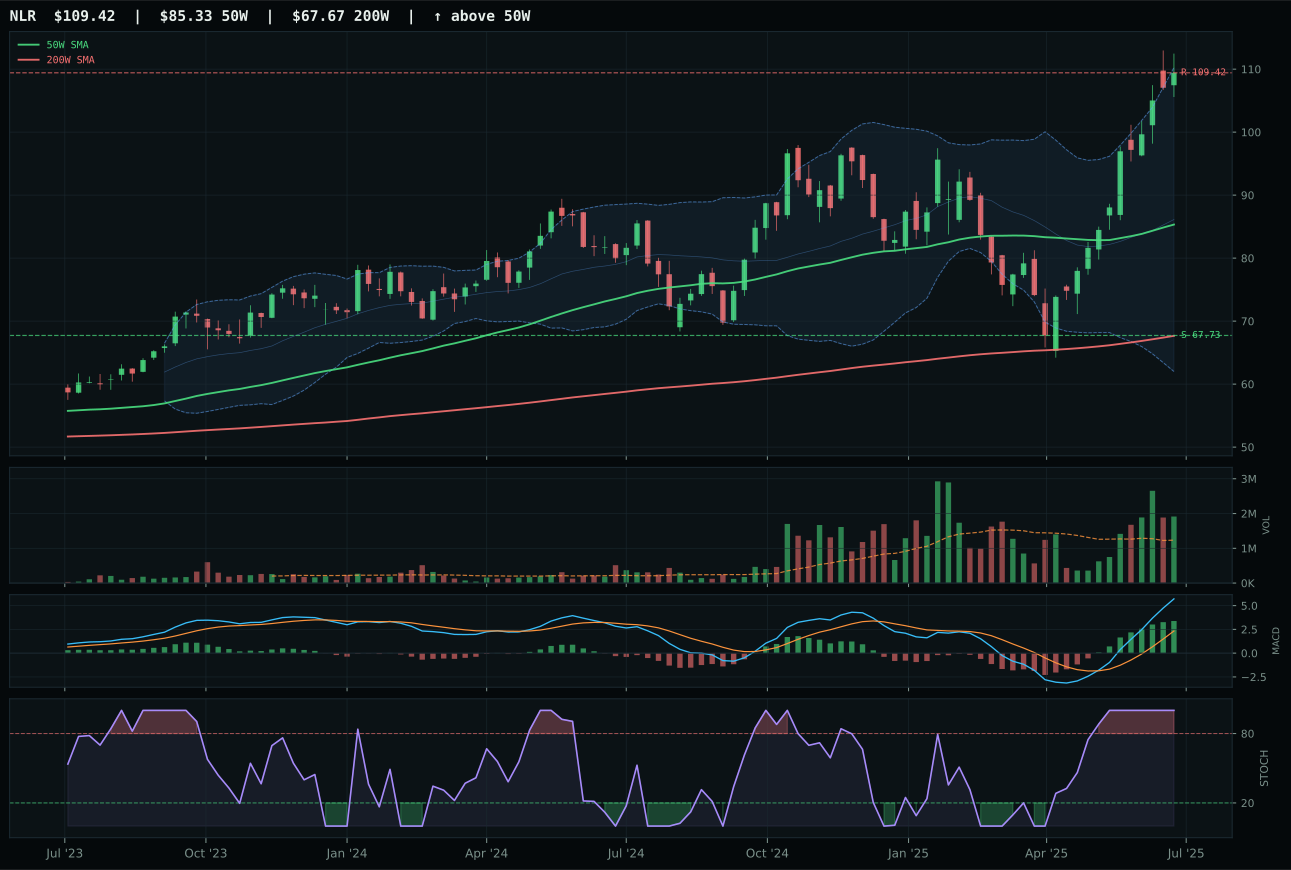
NLR has a vertical extension profile with 36.9% 13-week relative strength versus SPY.
A failed hold above support would weaken the setup.
Actionable but governed by invalidation levels.
URNM wins because it combines the highest SPY-relative strength in the entire portfolio at 34.5% with a neutral structure that permits long-duration holding. The 45.1% 13W return is extraordinary, but what matters for the selection is that it sits only 14.1% above the 50W despite that extraordinary momentum—meaning the pace of new highs is controlled rather than parabolic. The support/resistance levels at 29.25 / 47.11 create a 61.1% downside cushion that is attractive for a trend-following position, and the momentum confirmation score of 100.0 is backed by clean MACD improvement and overbought stochastic that is in the 1.00 zone (exhaustion-resistant overbought). URA loses despite higher category-relative strength at 17.2% because it is extended 34.6% from the 50W, placing it at the tail of the distribution where late entries have unfavorable risk-reward ratios.
Nuclear Energy earns 5% as a tier-2 allocation because it ranked 70.0 among eligible categories, placing it third overall. This is a real asset sponsorship trade: the active descriptors show real asset sponsorship at +7 and AI growth sponsorship at +5 (nuclear as AI power infrastructure), which dominate liquidity stress at -8 and credit stress at -5. The category macro fit of 50.0 is neutral-to-supportive, and URNM's 91.5 technical evidence score is exceptional. The position is sized at 5% not as a crowded-growth call but as a real-asset hedge within the allocation: uranium is constrained by supply, and the technical setup shows institutional accumulation rather than retail chasing. The risk is real—URNM's 61.1% downside to support means a reversal in risk appetite could force a rapid exit—but the allocation rationale is sound: hold this sector-momentum position alongside metals and infrastructure to maintain real-asset diversification within the disinflation regime.
Utilities & Infrastructure — PAVE
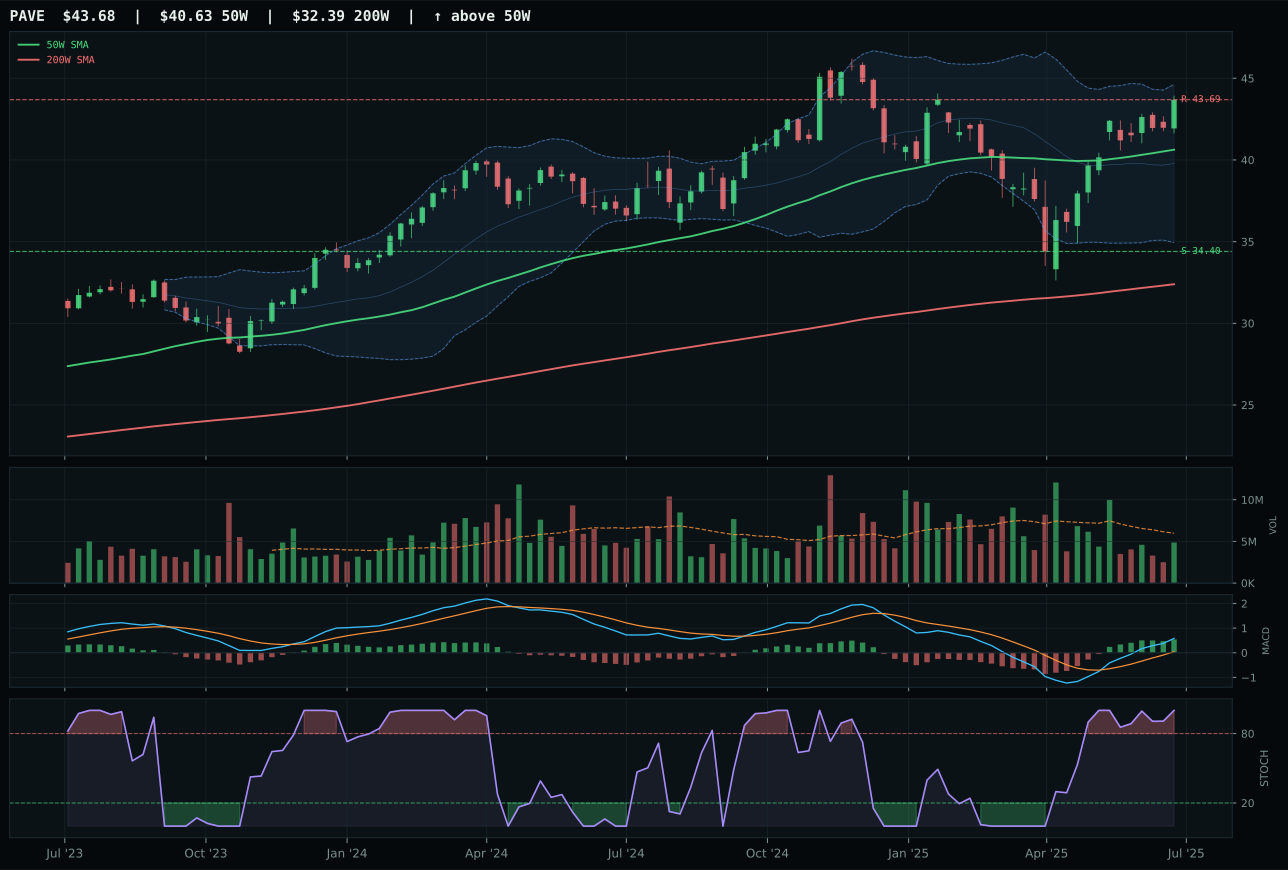
PAVE has a neutral structure profile with 5.5% 13-week relative strength versus SPY.
A failed hold above support would weaken the setup.
Actionable but governed by invalidation levels.
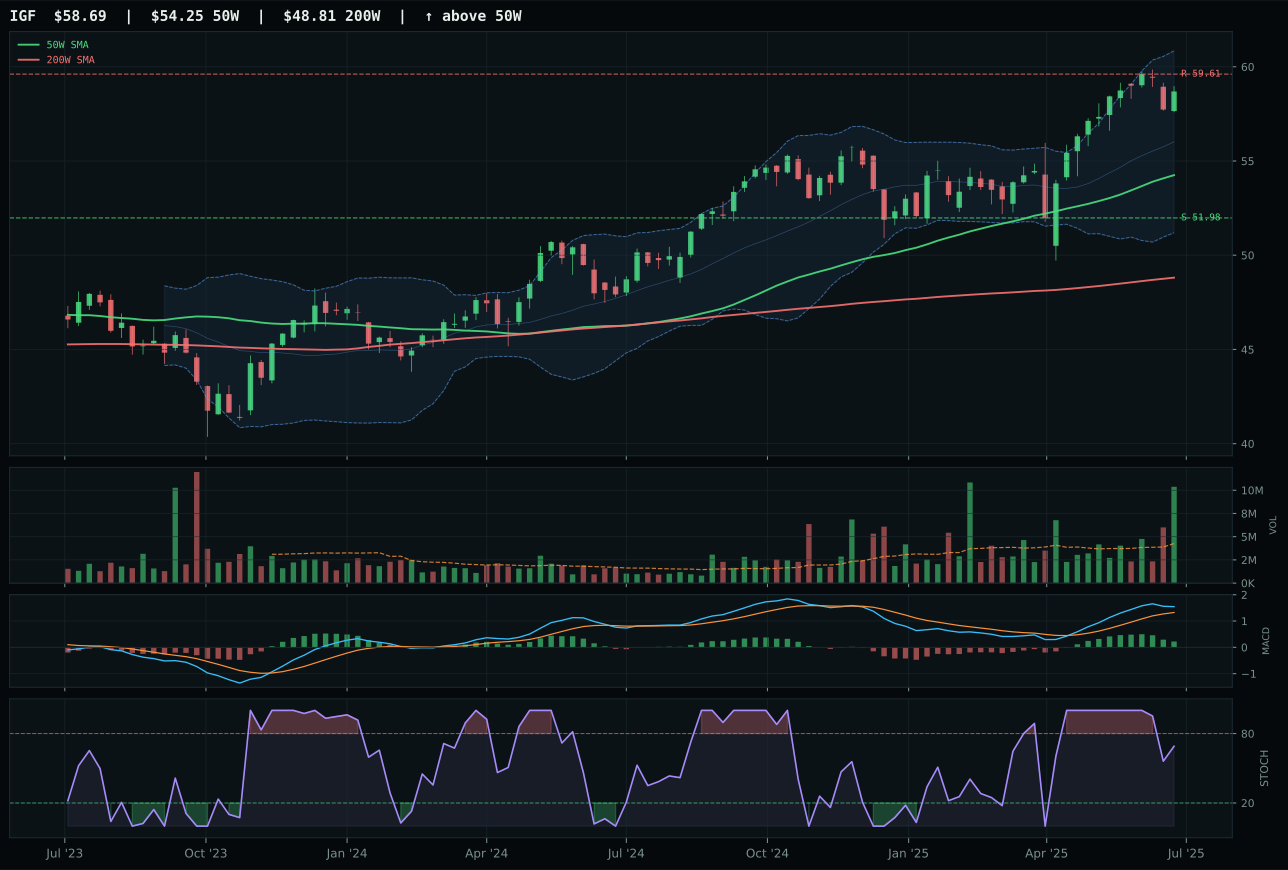
IGF has a neutral structure profile with -2.9% 13-week relative strength versus SPY.
A failed hold above support would weaken the setup.
Actionable but governed by invalidation levels.
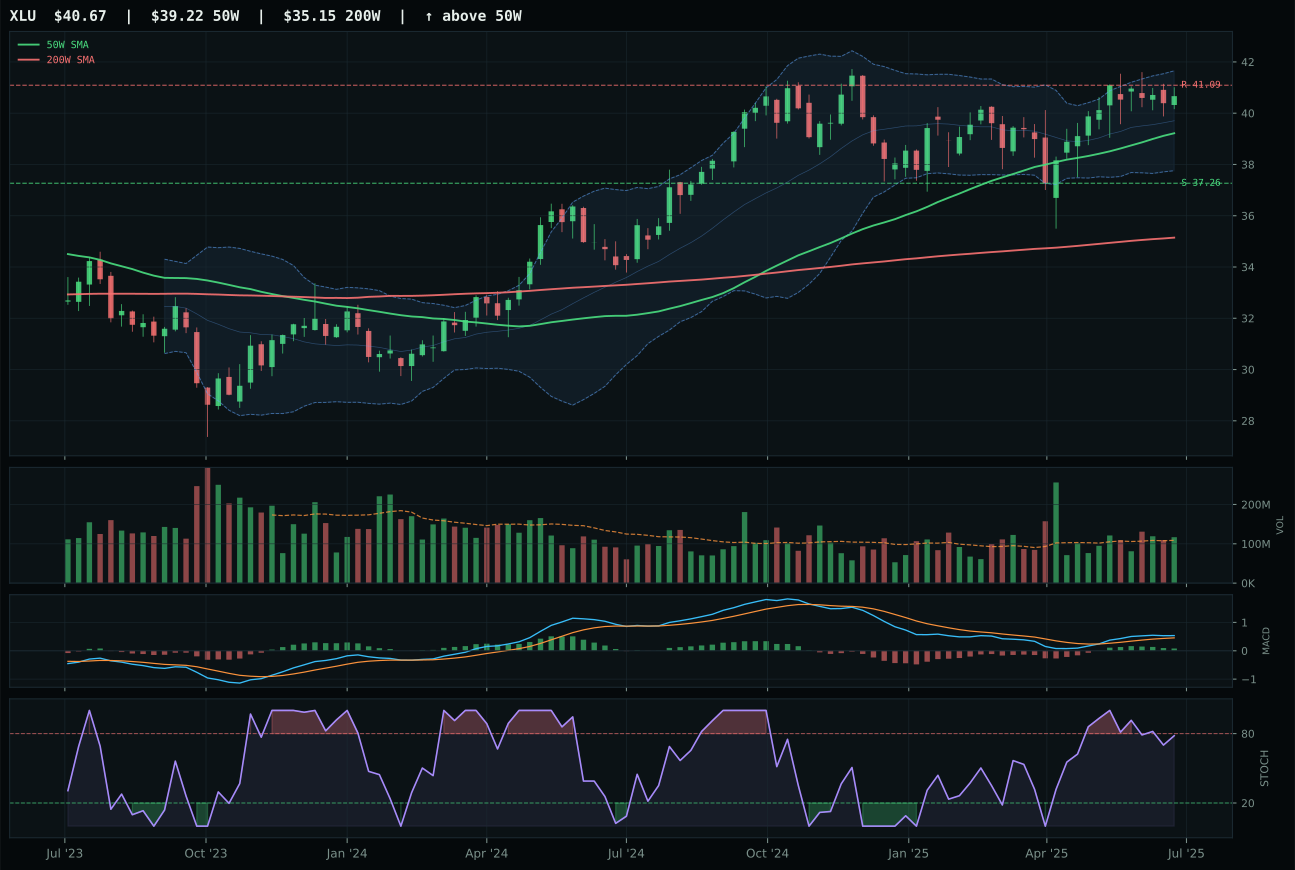
XLU has a neutral structure profile with -6.4% 13-week relative strength versus SPY.
A failed hold above support would weaken the setup.
Actionable but governed by invalidation levels.
PAVE wins by delivering both the highest momentum confirmation at 100.0 and category-relative strength at 8.4% while maintaining a neutral, low-risk structure. The 16.1% 13W return is solid, but the entry risk is minimal at just 7.5% above the 50W in a neutral setup—not a vertical extension. The MACD is bullish and improving at 75.0 timing, and volume-price confirmation of 83.2 is the highest in the basket, signaling that accumulation is active rather than distributed. The support/resistance at 34.40 / 43.69 creates a 27.0% downside cushion while leaving just -0.0% upside to resistance, making this a defensive position with positive near-term momentum. IGF loses because its MACD is flattening (not improving), its stochastic is falling (not overbought), and its category-relative strength flatlined at 0.0%—it is a higher-quality bond proxy but not a momentum leader.
Utilities & Infrastructure earns 5% as a tier-2 holding because it ranked 68.2, placing it in the fourth-highest category score. PAVE wins this allocation not on macro sponsorship alone, but on the combination of clean technicals and adequate macro fit. The category macro fit of 62.0 is the strongest among tier-2 holdings, benefiting from a +7 boost for disinflation and a +6 from disinflation pressure—utilities benefit directly from falling bond yields and lower funding costs. PAVE's 88.3 technical evidence score is exceptional, and the position size at 5% reflects its role as a duration hedge alongside metals and infrastructure. The 100.0 momentum confirmation paired with 77.5 persistence suggests that the move is not a late-stage chase but rather the beginning of an infrastructure cycle. Risk appetite negative at -2 creates a modest headwind, but the allocation is justified because disinflation support is strong and the chart setup allows for holding through near-term volatility without capitulation.
Defense & Aerospace — XAR
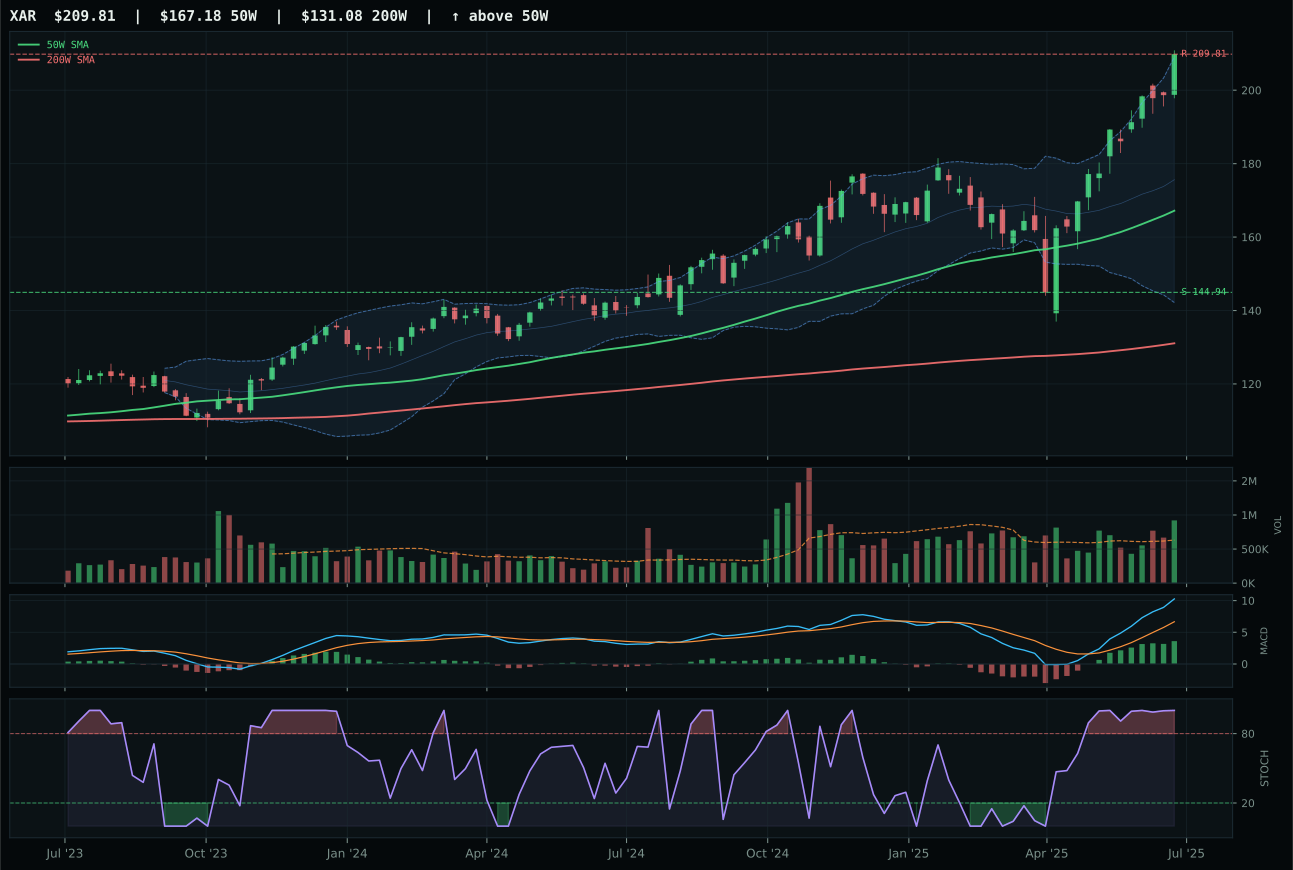
XAR has a vertical extension profile with 18.9% 13-week relative strength versus SPY.
A failed hold above support would weaken the setup.
Actionable but governed by invalidation levels.
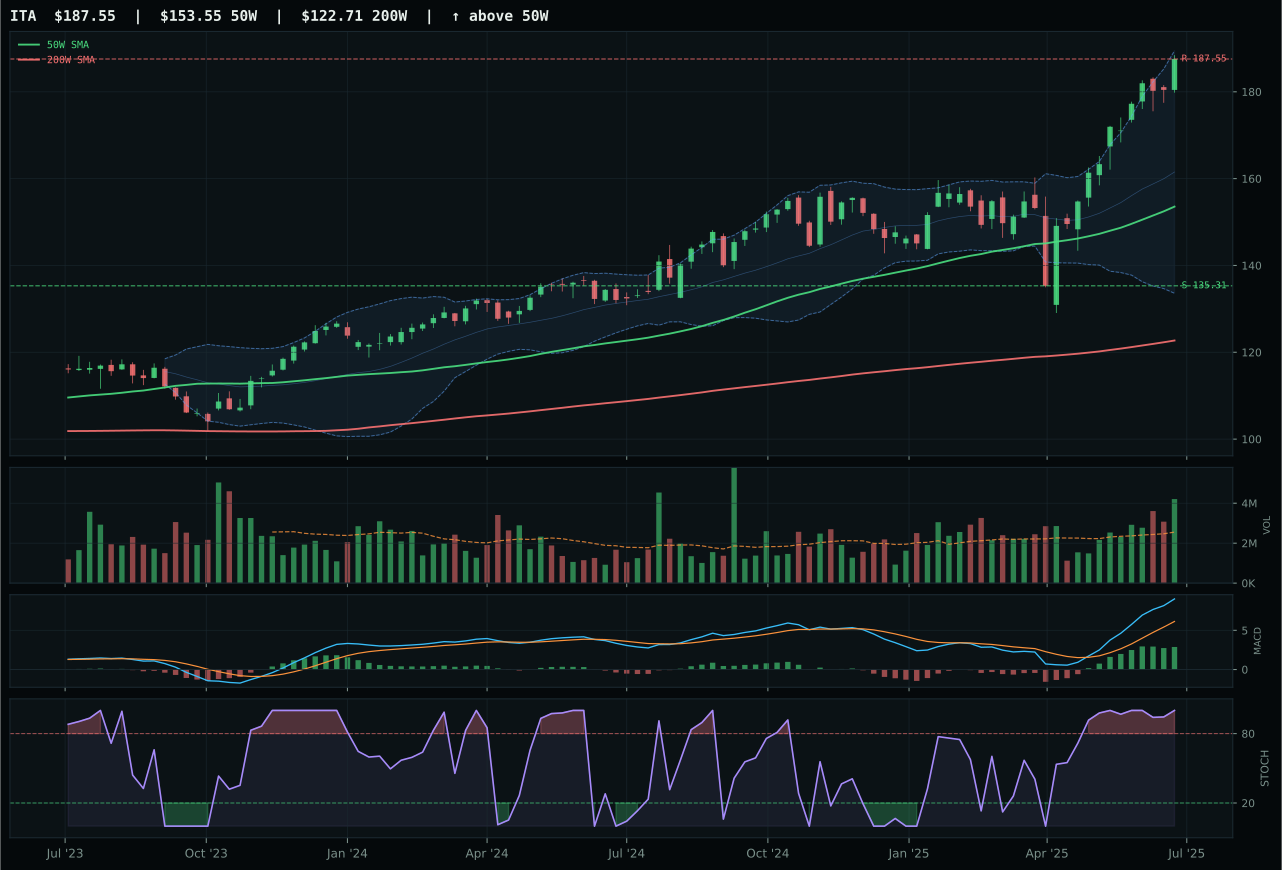
ITA has a vertical extension profile with 11.7% 13-week relative strength versus SPY.
A failed hold above support would weaken the setup.
Actionable but governed by invalidation levels.
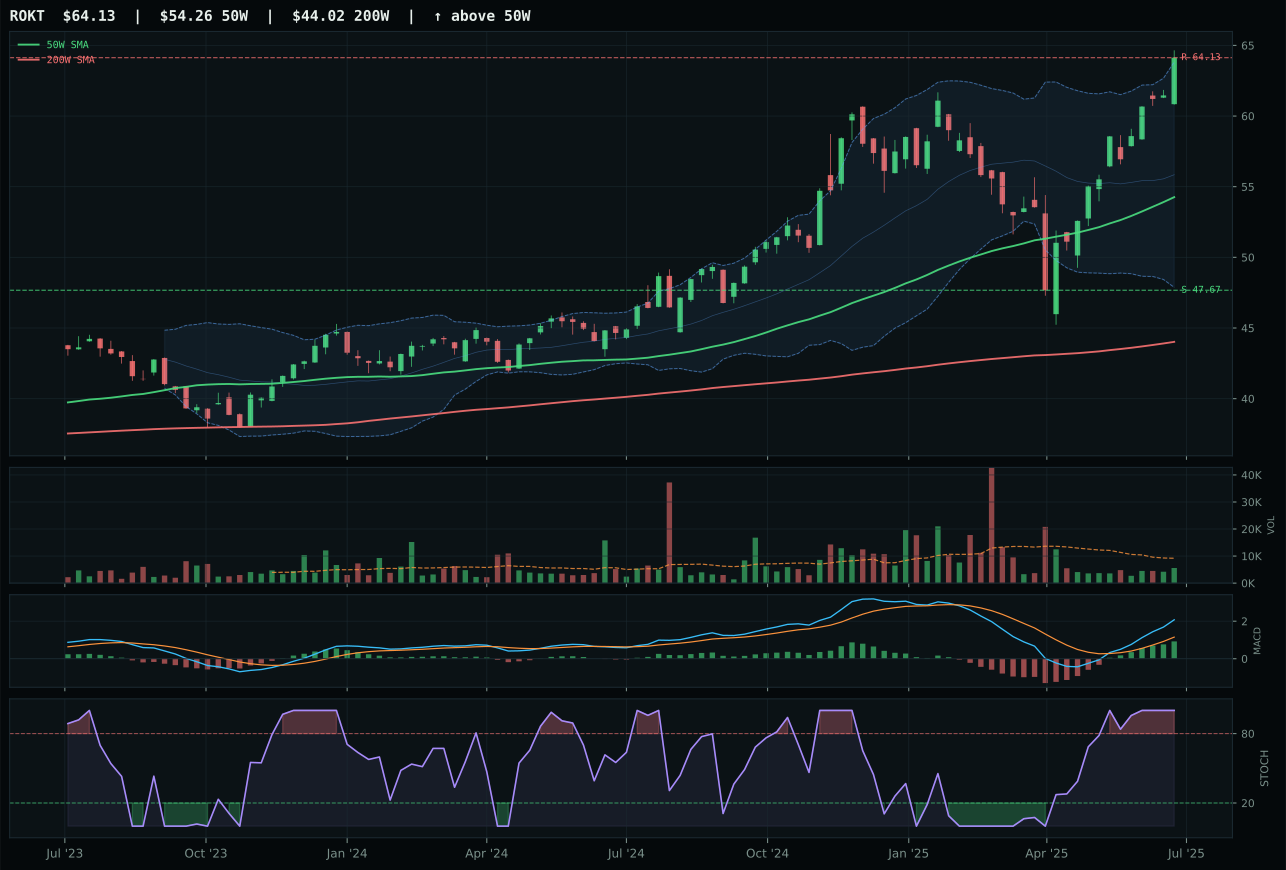
ROKT has a vertical extension profile with 9.1% 13-week relative strength versus SPY.
A failed hold above support would weaken the setup.
Tracked, but not top-2 eligible because: .
XAR wins because it shows the highest category-relative strength at 7.2% and delivers 29.6% over 13 weeks despite being positioned as the most extended setup in its basket at 25.5% from the 50W. This apparent contradiction resolves when examining the volume signature: at 1.46x the 20W average, XAR is the only category entry with above-average participation, meaning the extension is being bought aggressively rather than squeezed higher. The 18.9% relative strength versus SPY justifies the leadership inside the aerospace complex, and the MACD/stochastic pairing (bullish and improving, overbought momentum) confirms the sponsorship is current rather than lagging. ITA loses ground despite superior technical evidence (95.7) and better volume-price confirmation because its category-relative strength flatlined at 0.0%—it is a durability play that is not winning the race against XAR's scarcity narrative in the aerospace supply chain.
Defense & Aerospace earns 5% as a tier-2 holding because it ranked below the top-2 cutoff at 59.8, placing it in the third tier of eligible categories. The position exists not because the setup is exceptional, but because the category itself is eligible and the macro environment is not actively hostile. XAR's vertical extension at 25.5% from the 50W creates real downside risk to the 44.8% support level, and the macro fit of 50.0 is neutral—no strong tailwind from the active descriptor checklist beyond the broad +3 for transition/mixed regime. The allocation holds because relative strength within the basket is clear and because a 5% tier-2 position does not require an exceptional setup, only a better one than the alternatives outside the allocation. If XAR's category-relative strength deteriorates or the extension exceeds 30%, this slot should rotate to the next eligible alternative.
Precious Metals — SLV
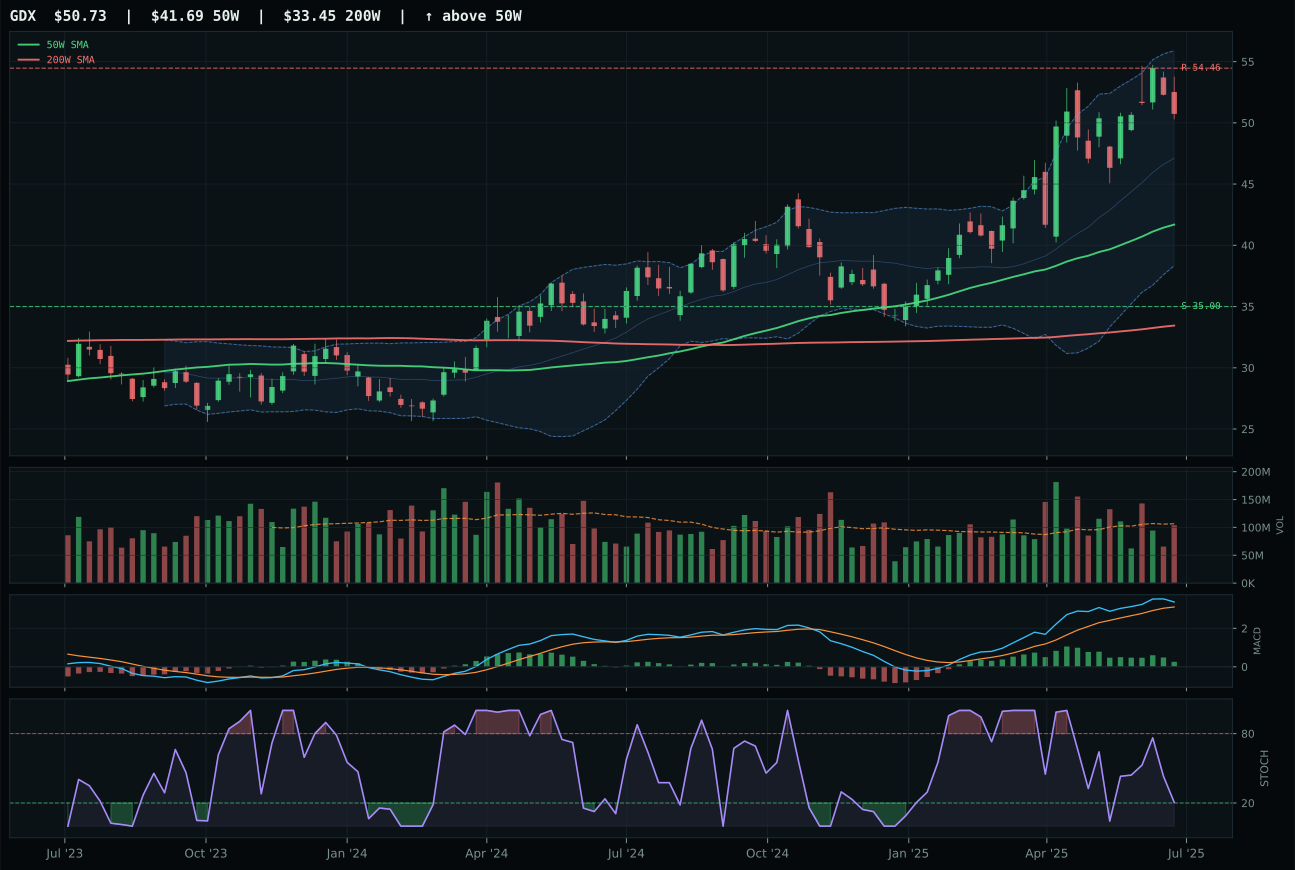
GDX has a vertical extension profile with 0.7% 13-week relative strength versus SPY.
A failed hold above support would weaken the setup.
Actionable but governed by invalidation levels.
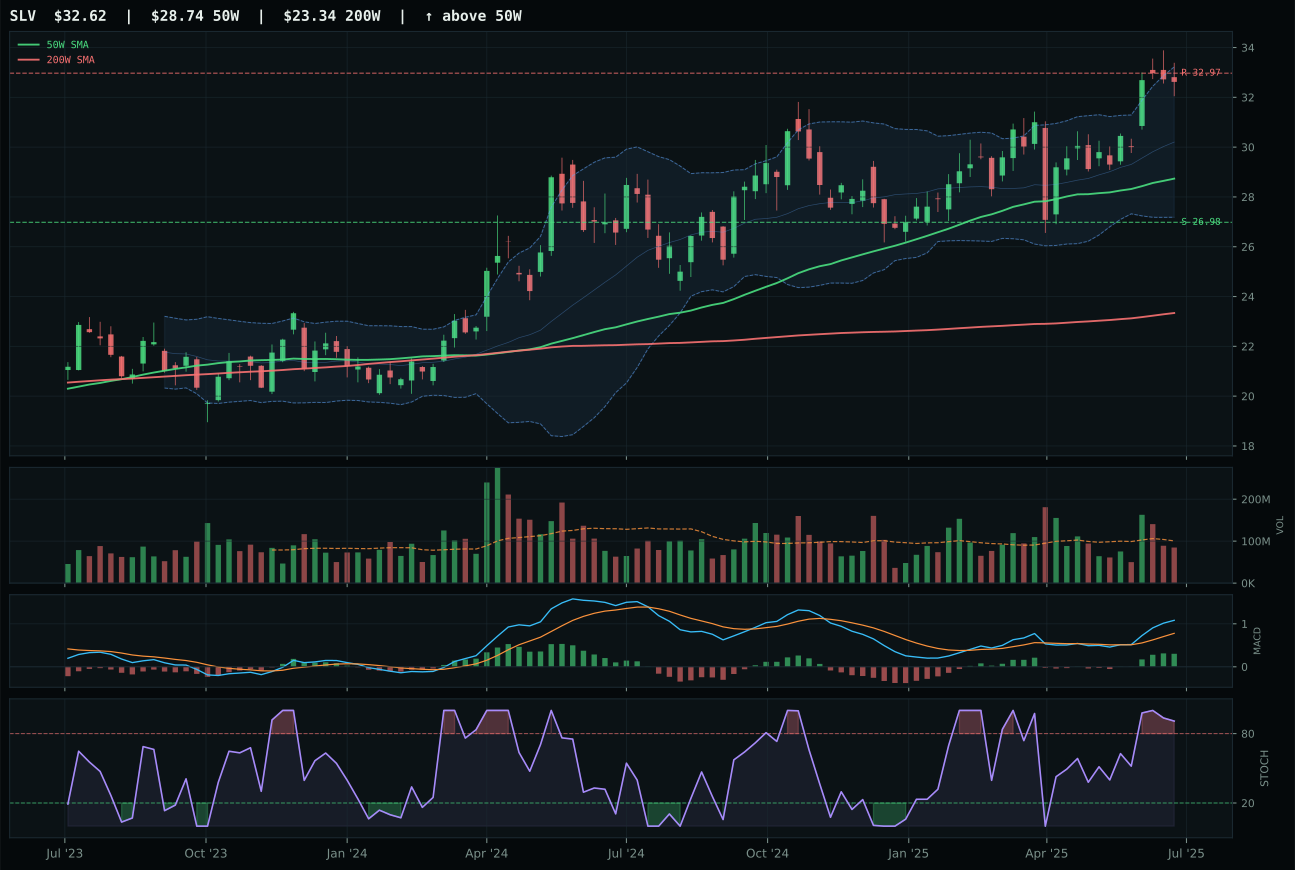
SLV has a neutral structure profile with -5.4% 13-week relative strength versus SPY.
A failed hold above support would weaken the setup.
Actionable but governed by invalidation levels.
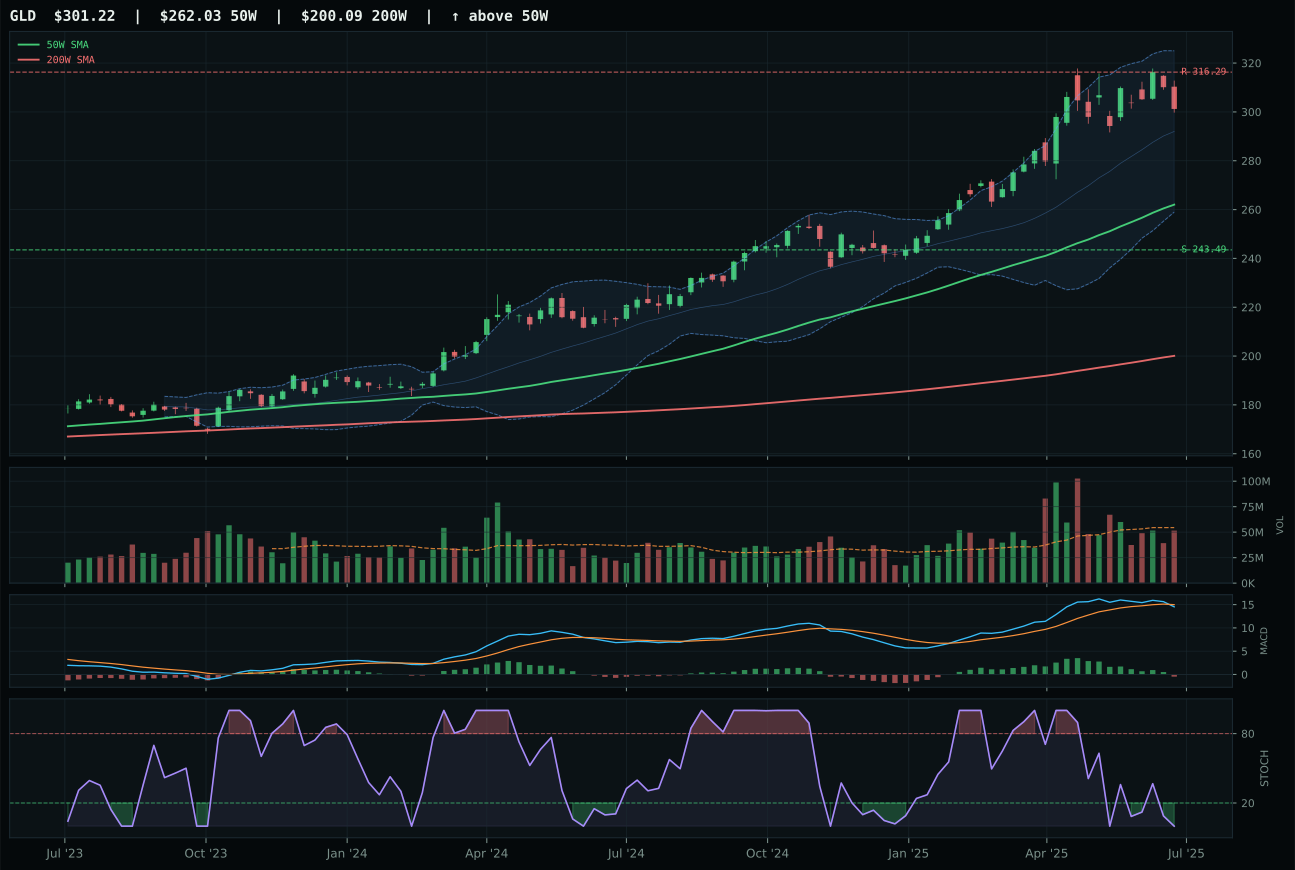
GLD has a neutral structure profile with -4.6% 13-week relative strength versus SPY.
A failed hold above support would weaken the setup.
Actionable but governed by invalidation levels.
SLV wins by offering cleaner structure than GDX despite lower absolute momentum. SLV sits 13.5% above the 50W in a neutral setup with cleanliness at 58.3 and compression at 75.4, whereas GDX is extended 21.7% in a vertical setup that penalizes the entry. More critically, SLV's MACD is bullish and improving while GDX's is bullish but flattening, signaling that the sponsorship inside silver is current whereas gold miners are entering a confirmation fade. The timing score gap is decisive: SLV's 57.0 versus GDX's 48.0 reflects that silver's setup sits in the upper retracement zone at a clearer Fib level, while GDX has already reached its extension. The category-relative strength favors GDX at +5.3, but SLV's +1.6% inside the three-ETF basket still captures the winning narrative: monetary metals sponsorship beats mining leverage when the trend is young.
Precious Metals earns 5% as a tier-2 allocation because it ranked 51.2 among eligible categories. The position is defensible despite the weak macro environment: metals scarcity is active at +7, which offsets liquidity stress at -5. SLV's trend score of 91.8 is respectable, and the fact that it sits above both moving averages with improving MACD creates a low-friction entry into a disinflation trade. The macro fit of 60.0 is adequate because the disinflation narrative directly supports monetary metals demand—lower real yields make non-yielding silver more attractive as a duration hedge. However, the category does not rank high enough to justify a 10% slot because the absolute momentum is weak (5.2% 13W return, -5.4% versus SPY), and the risk/reward is constrained with just -1.1% upside to resistance. This is a satellite position: hold it for disinflation protection, but recognize that a break below the 26.98 support would force a rapid exit.
Emerging Markets — IEMG
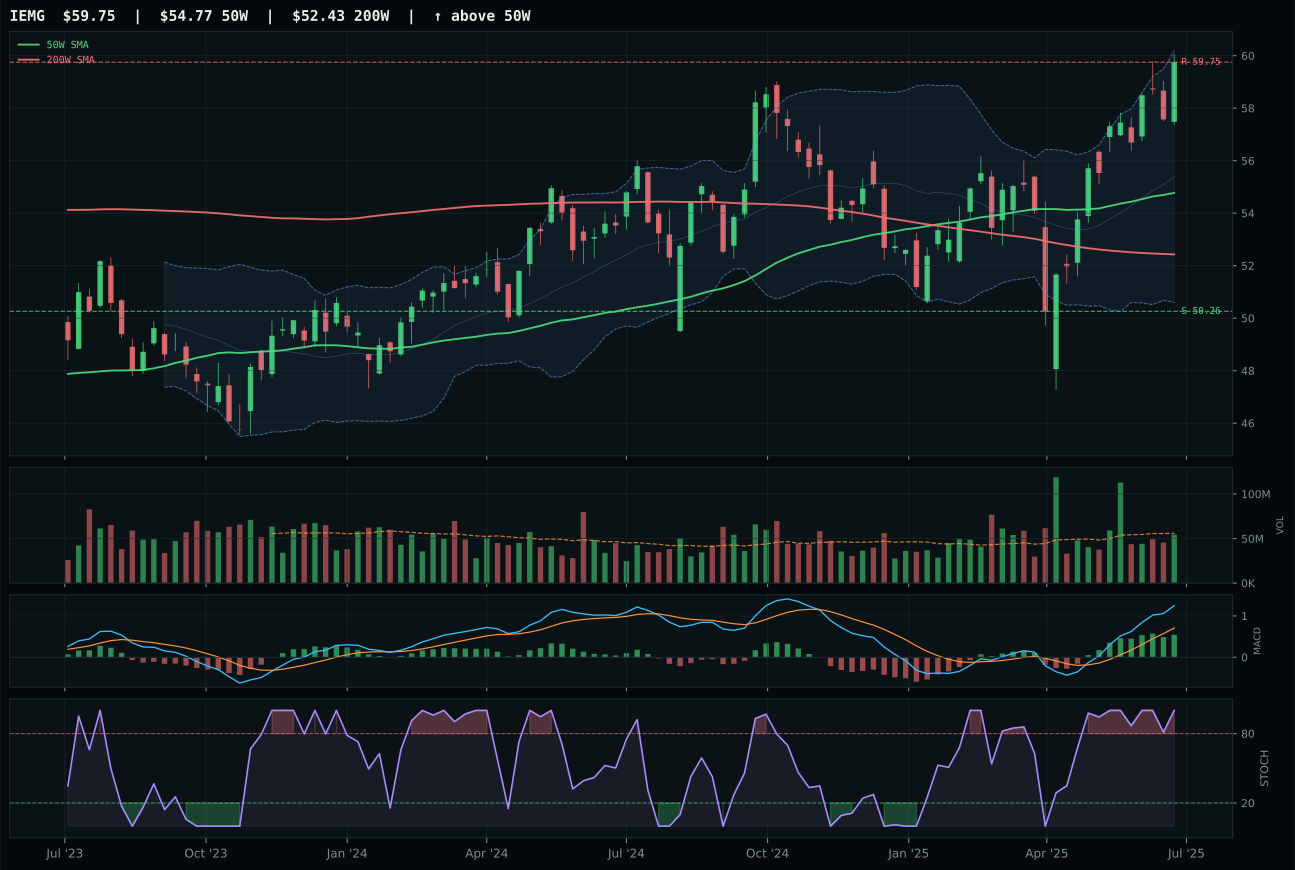
IEMG has a neutral structure profile with -0.2% 13-week relative strength versus SPY.
A failed hold above support would weaken the setup.
Actionable but governed by invalidation levels.
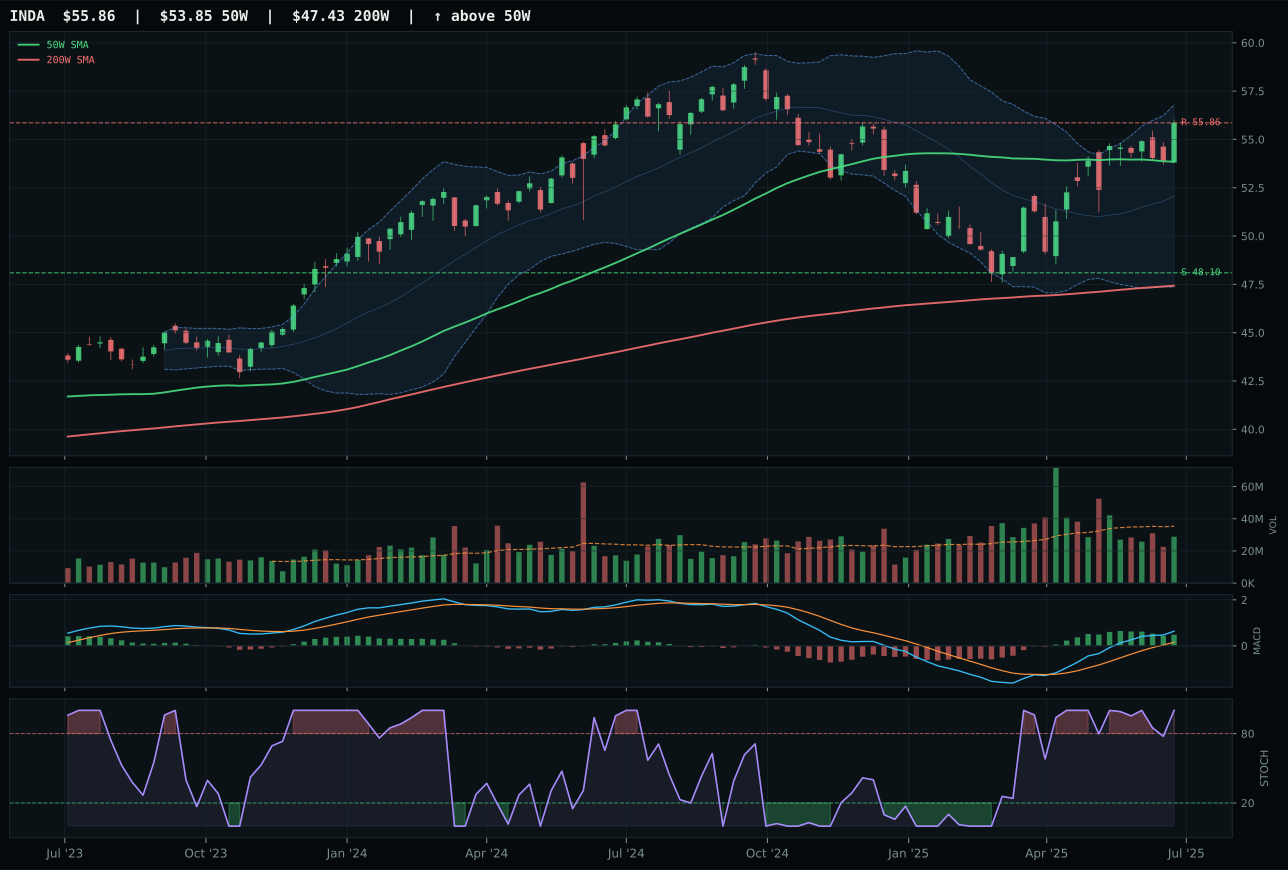
INDA has a neutral structure profile with -1.7% 13-week relative strength versus SPY.
A failed hold above support would weaken the setup.
Actionable but governed by invalidation levels.
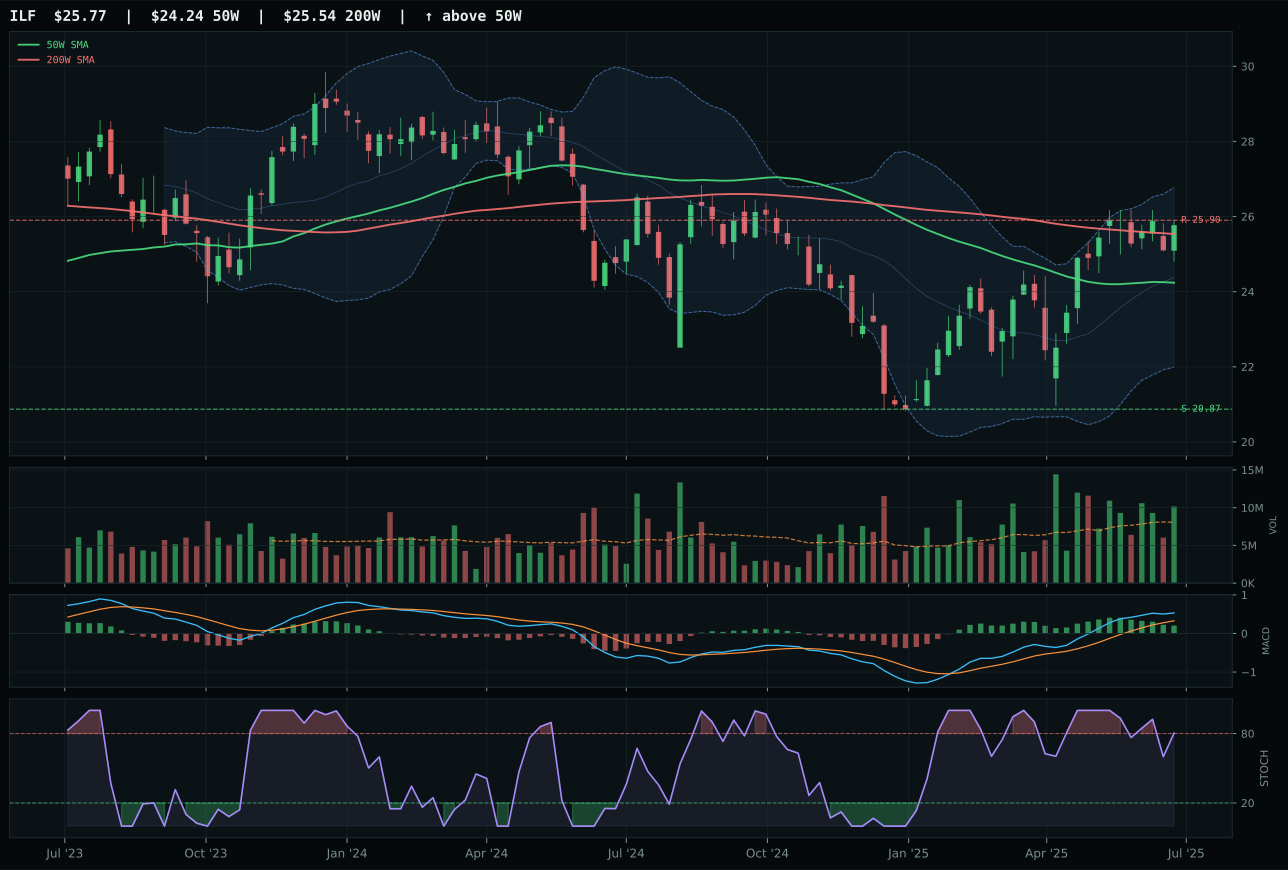
ILF has a neutral structure profile with -2.2% 13-week relative strength versus SPY.
A failed hold above support would weaken the setup.
Actionable but governed by invalidation levels.
IEMG wins with a structure advantage over INDA rather than a momentum advantage. Both sit above the 50W with bullish MACD, but IEMG's structure is cleaner at 79.7 versus INDA's 75.1, and critically, IEMG's MACD is improving while INDA's is flattening—a signal that the sponsorship inside broad emerging-market beta is currently accelerating. The category-relative strength of 1.5% is modest, but it is positive against INDA's 0.0%, confirming that broad diversification is outperforming India-specific quality. Volume is neutral across both setups, so the decision hinges on momentum direction: IEMG's improving MACD plus 10.5% 13W return is a young trend; INDA's flattening MACD at similar momentum suggests the move has stalled within India-quality equities.
Emerging Markets earns 5% as a tier-2 holding because it ranked 50.9 among eligible categories. The position exists despite a poor macro fit of 40.0, driven by credit stress at -10 and liquidity stress at -10 that create significant near-term headwinds. However, IEMG's trend score of 89.7 and structure at 79.7 are strong enough to justify the allocation on technical grounds. The category ranks above tier-2 exclusion because the 78.2 technical evidence score overwhelms the weak macro backdrop via the 62% / 38% weighting, and because the setup is clean (neutral structure, improving MACD) rather than forced. This is a value allocation: emerging markets are being sold off due to liquidity and credit concerns, and IEMG's chart is holding above key moving averages. Risk appetite positive at +6 provides a small tailwind, but the position should be watched closely—a break below the 50.26 support would signal that the macro headwinds have overcome technicals, forcing an exit.
Industrial Metals — COPX
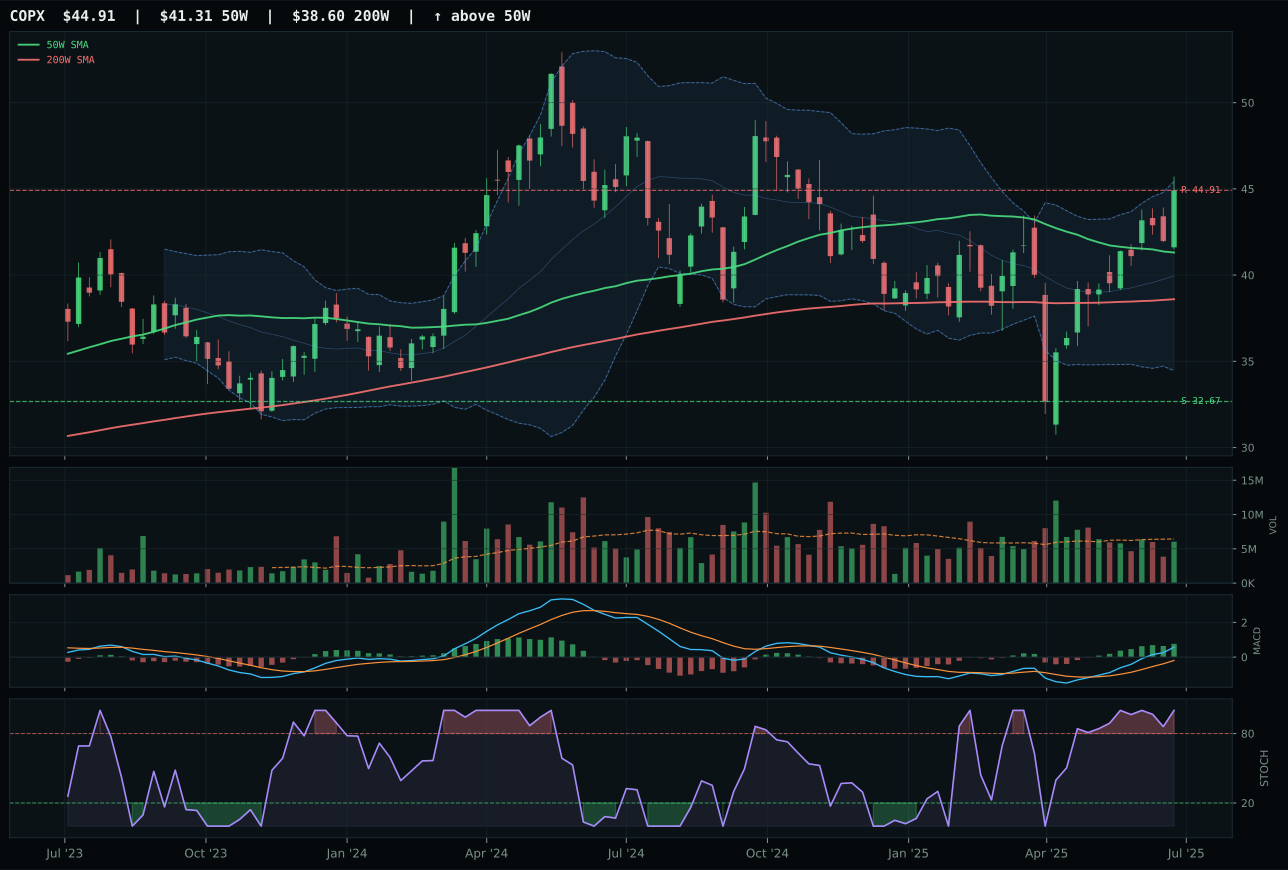
COPX has a neutral structure profile with 1.6% 13-week relative strength versus SPY.
A failed hold above support would weaken the setup.
Actionable but governed by invalidation levels.
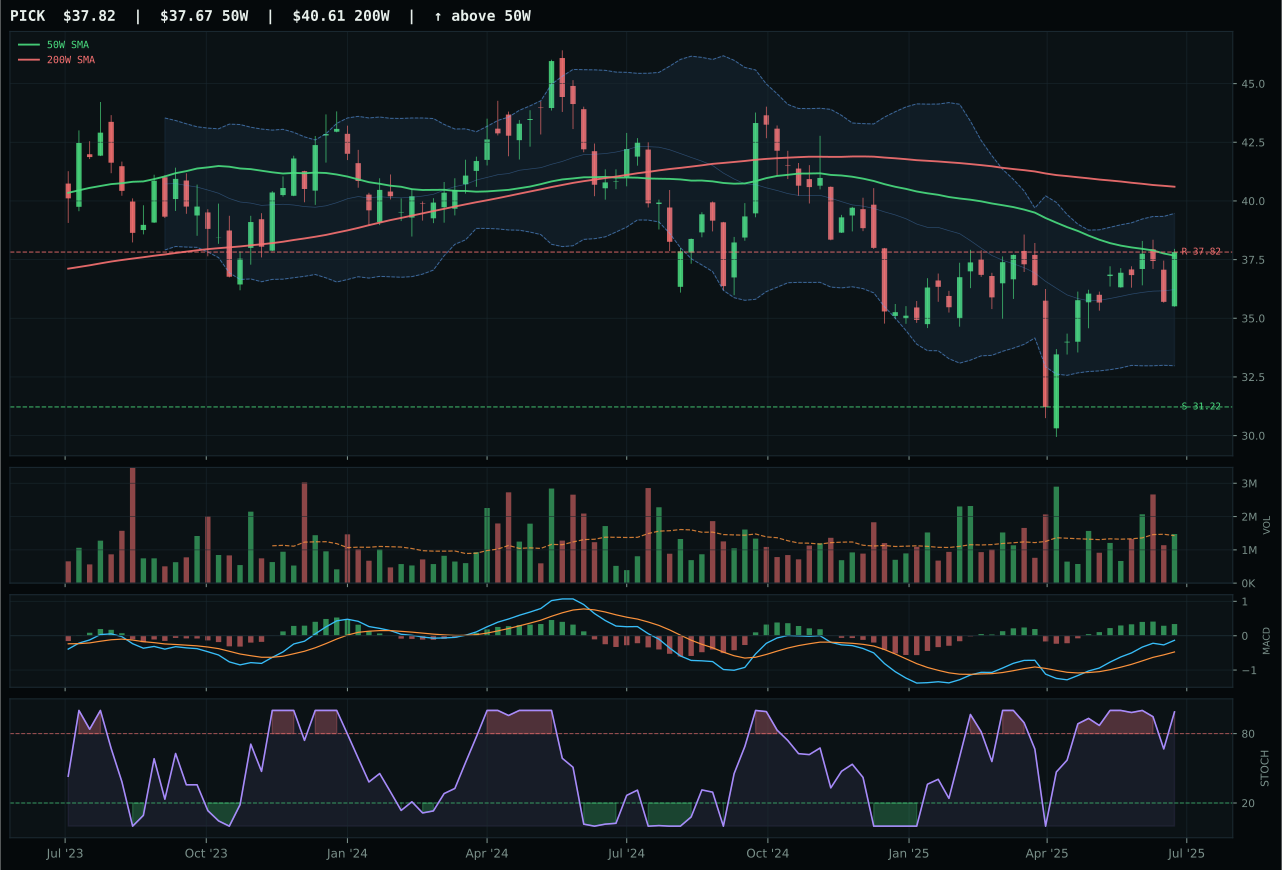
PICK has a compression near 50W profile with -6.8% 13-week relative strength versus SPY.
A failed hold above support would weaken the setup.
Actionable but governed by invalidation levels.
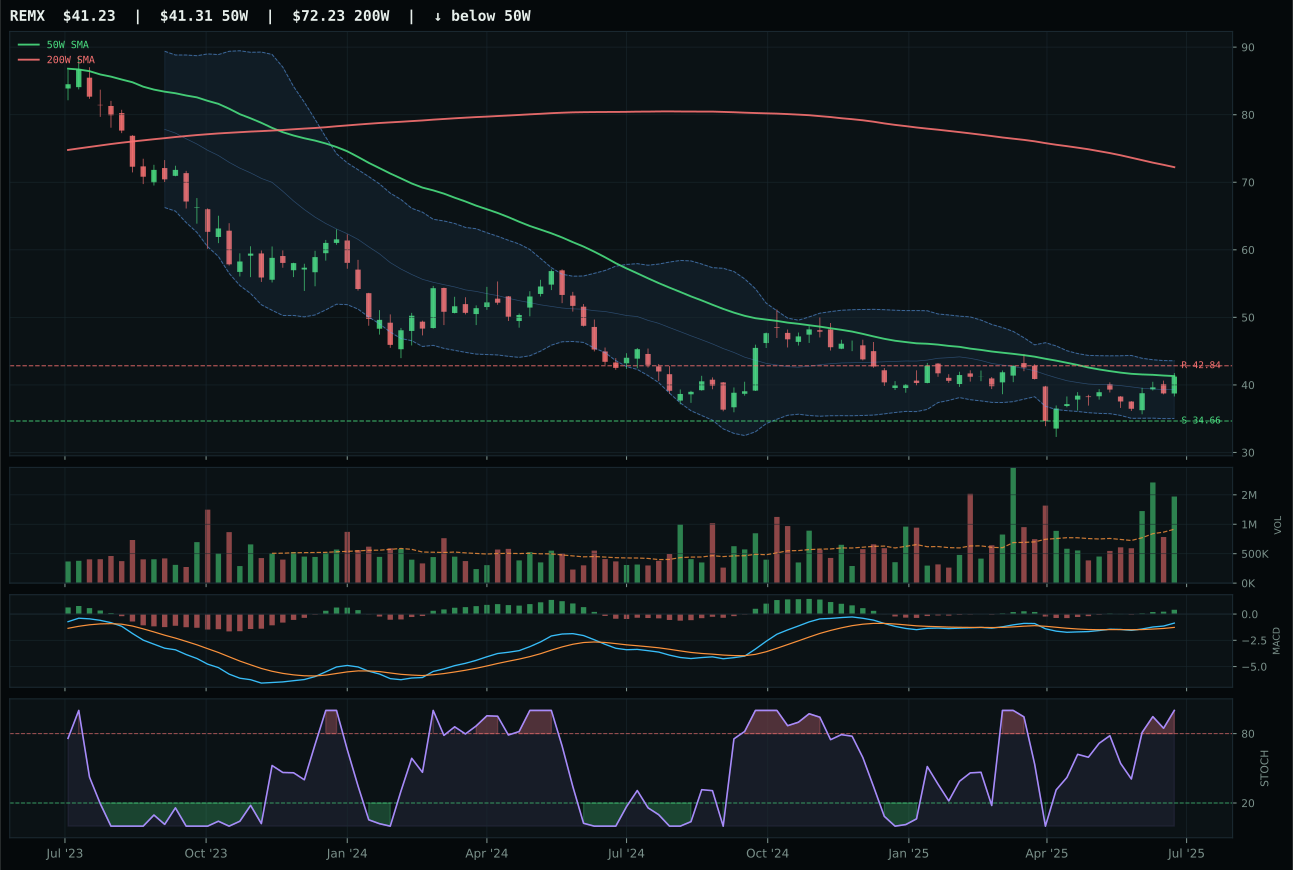
REMX has a compression near 50W profile with -9.8% 13-week relative strength versus SPY.
Extension and support failure are the main tactical risks.
Tracked, but not top-2 eligible because: structurally broken.
COPX wins decisively because it delivers the highest category-relative strength at 8.4% while sitting in a neutral, cleaner structure than PICK and REMX. The setup is textbook: price 8.7% above the 50W in neutral structure with MACD bullish and improving, stochastic RSI overbought momentum at 1.00, and volume neutral at 0.94x the 20W average. The 13W return of 12.2% combined with 1.6% SPY-relative strength shows that copper buyers are not chasing momentum into crowded trades; they are building positions at a reasonable distance from the 50W. PICK's compression near the 50W creates timing uncertainty, and REMX's technical evidence collapses to 30 due to distribution pressure at 1.50x volume. COPX's timing score of 75.0 dominates because the distance-to-50W of 8.7% places it in the sweet spot where MACD is still in its improving phase rather than rolling over.
Industrial Metals earns 5% as a tier-2 holding because it ranked 48.2 among eligible categories. This is a contrarian position relative to the macro narrative: disinflation typically pressures industrial metals, yet COPX holds because the metals scarcity descriptor is active at +14 and commodity breadth positive at +10, which more than offset the disinflation headwind. The category macro fit of 65.0 is strong—the highest among tier-2 holdings—because copper is positioned at the intersection of energy transition (EV demand) and traditional industrial capex. COPX's 85.2 technical evidence score is exceptional, creating asymmetry: even if the disinflation trade reverses moderately, the chart setup is clean enough to weather a pullback to the 32.67 support (37.5% downside) with only 0.0% upside to resistance. The position is sized at 5% not because it is a screaming buy, but because it is the highest-ranked category representative in an excluded macro regime, and the technical evidence is strong enough to justify including it.
Agriculture & Livestock — MOO
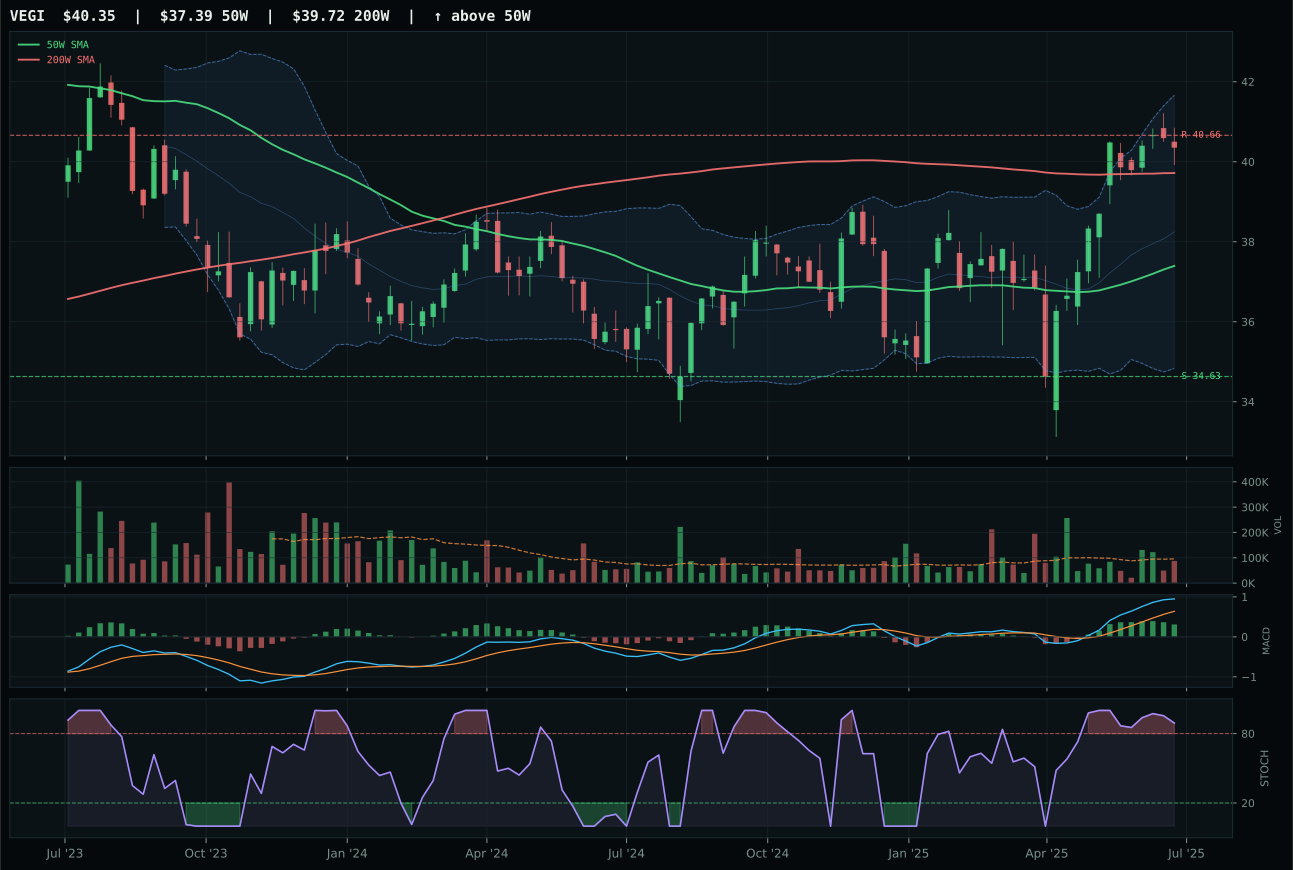
VEGI has a neutral structure profile with -1.2% 13-week relative strength versus SPY.
A failed hold above support would weaken the setup.
Tracked, but not top-2 eligible because: .
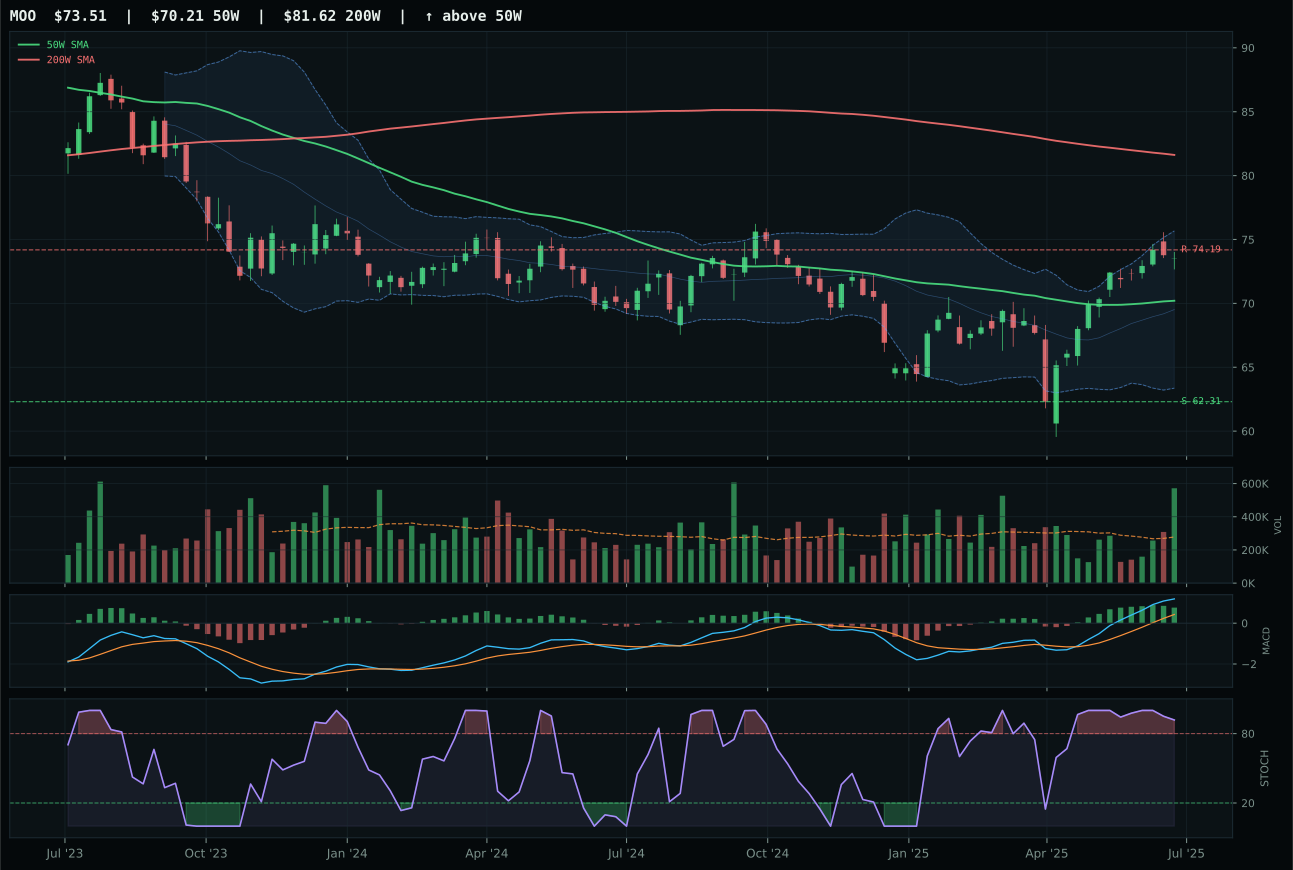
MOO has a neutral structure profile with -2.1% 13-week relative strength versus SPY.
A failed hold above support would weaken the setup.
Actionable but governed by invalidation levels.
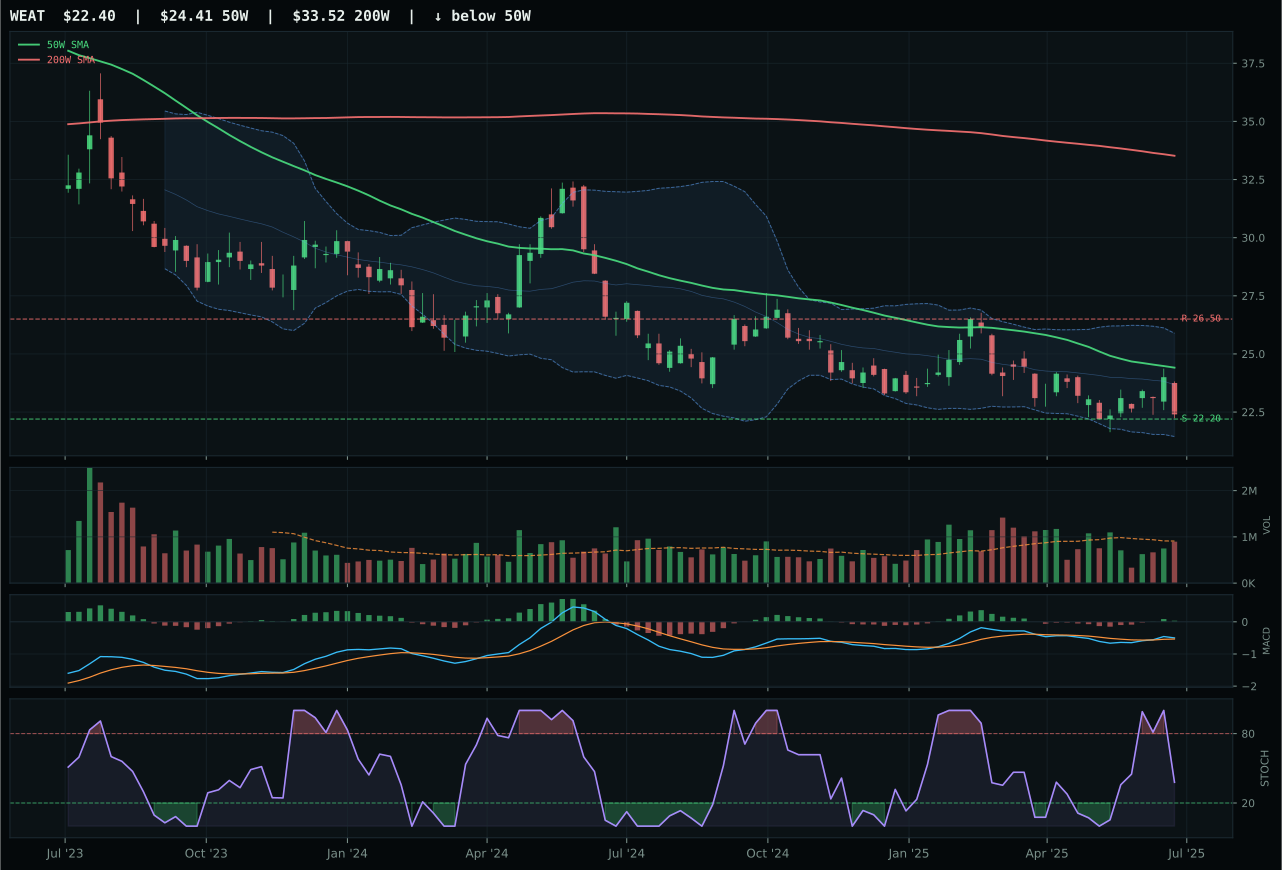
WEAT has a pullback into support profile with -13.7% 13-week relative strength versus SPY.
Extension and support failure are the main tactical risks.
Tracked, but not top-2 eligible because: structurally broken.
MOO wins the category not because the setup is attractive, but because it is the least unattractive alternative within an unattractive basket. Price sits above the 50W by only 4.7%, but below the 200W, which creates a reset/pullback setup where upside requires a recapture of the longer-term trend rather than an extension from current levels. The timing score of 67.0 exceeds VEGI's 52.0 solely because MOO sits closer to support (4.7% vs the distance to support at the VEGI level), offering better risk-reward geometry if support holds. The momentum confirmation score of 44.2 reflects the reality: MOO's 13W return of 8.6% is weak, the MACD is bullish but flattening (not improving), and stochastic RSI is rolling over at 0.92. The volume signature at 2.06x the 20W average signals distribution pressure, confirming that large holders are using strength to exit, not accumulate.
Agriculture & Livestock receives 0% allocation because the category scored 19.3, placing it in the excluded tier. This is not a marginal call—the category's macro fit of 45.0 reflects active headwinds that outweigh any technical argument. Disinflation pressure scores -8 and real asset sponsorship scores only +8, a net negative that compounds the technical collapse. MOO's distribution pressure at 2.06x volume, combined with MACD flattening and stochastic rolling over, leaves no window for accumulation. The runner-up VEGI scored even lower because its timing deteriorated further to 52.0, and the third-ranked WEAT is structurally broken with -13.7% SPY-relative strength and negative 13W return. To earn a tier-2 allocation slot, this category would need either (1) a reversal of the disinflation narrative to fuel commodity demand, (2) XLP rotation into agriculture-linked processors, or (3) a clean support hold with MACD inflection. None are present, so capital stays deployed in categories with active technical and macro sponsorship.
Traditional Energy — XLE
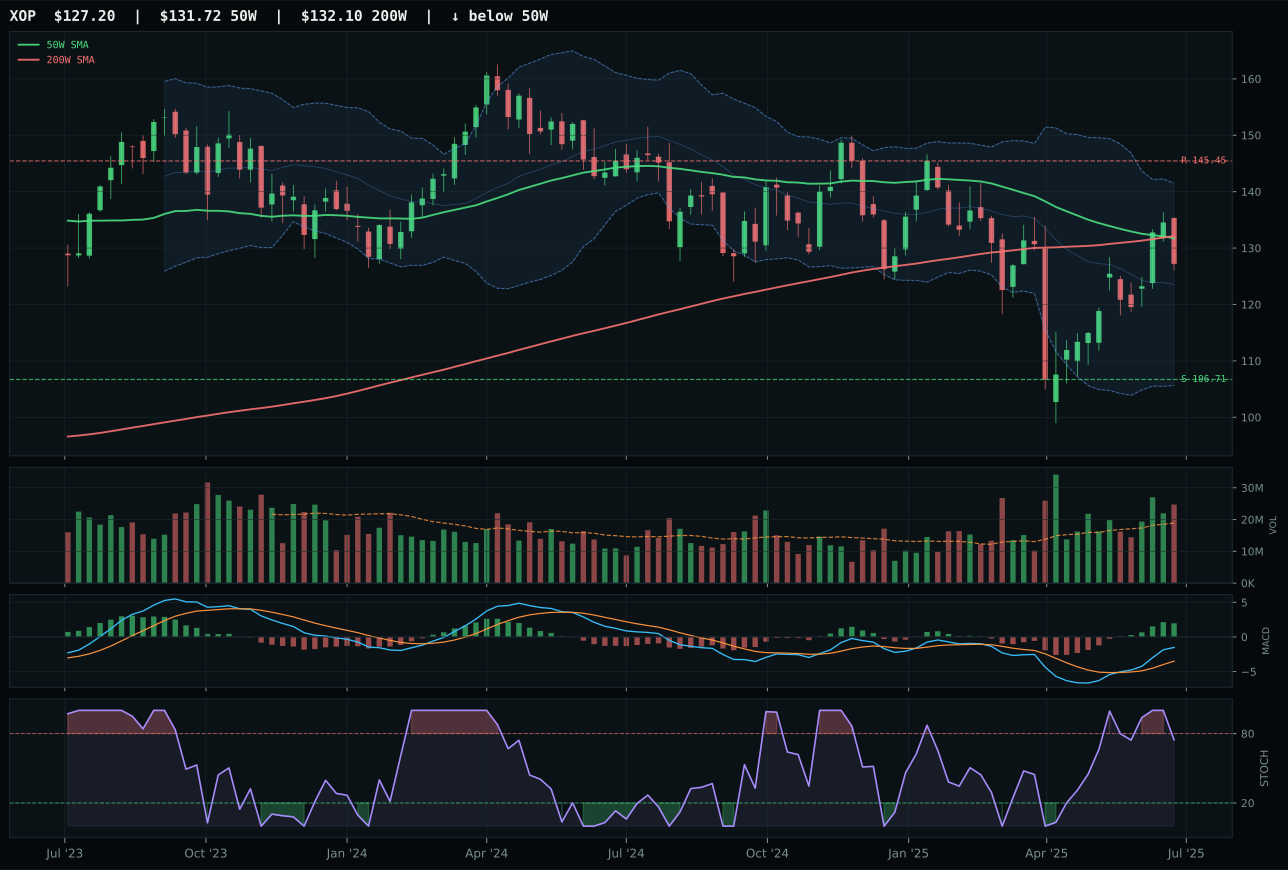
XOP has a neutral structure profile with -13.3% 13-week relative strength versus SPY.
Extension and support failure are the main tactical risks.
Tracked, but not top-2 eligible because: structurally broken.
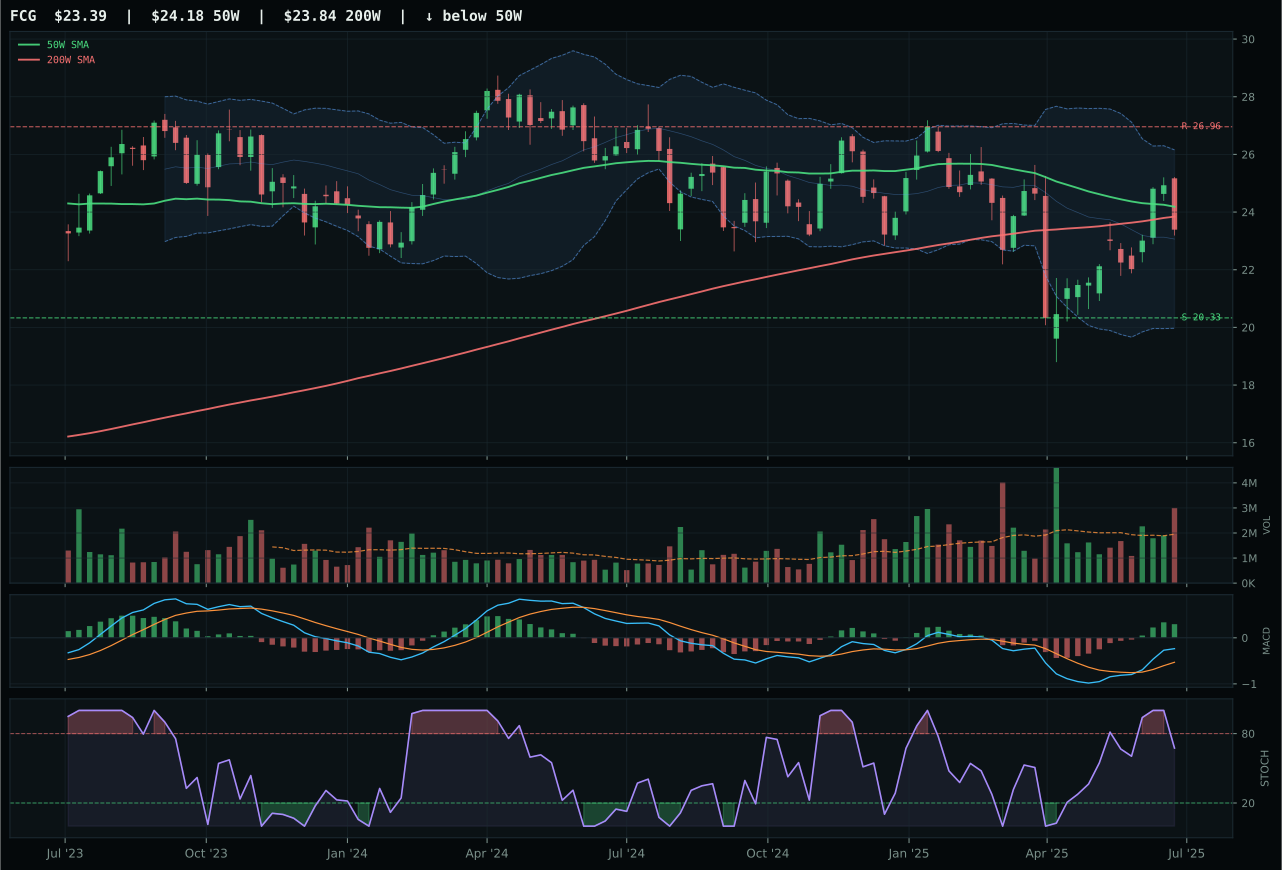
FCG has a neutral structure profile with -15.7% 13-week relative strength versus SPY.
A failed hold above support would weaken the setup.
Actionable but governed by invalidation levels.
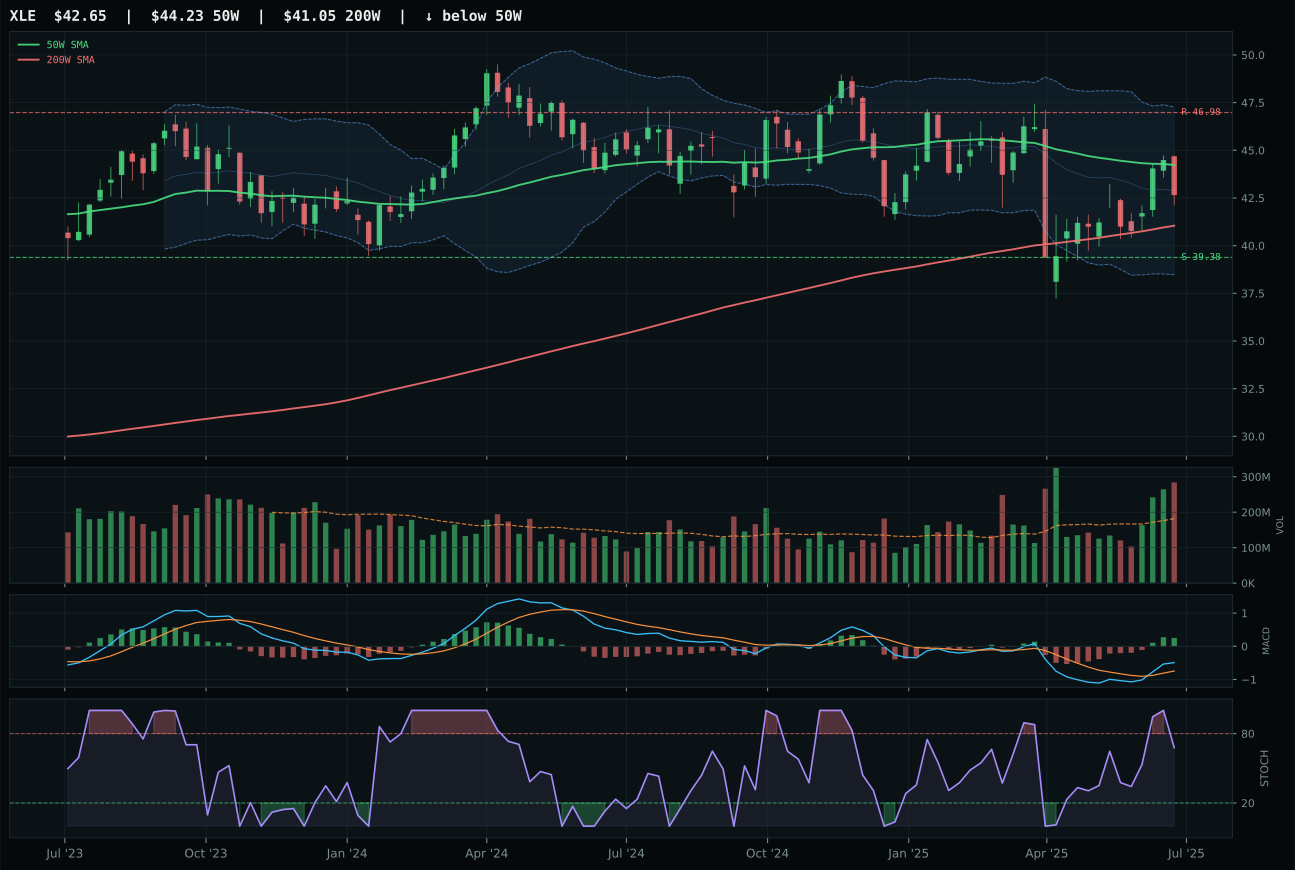
XLE has a neutral structure profile with -18.4% 13-week relative strength versus SPY.
A failed hold above support would weaken the setup.
Actionable but governed by invalidation levels.
XLE wins by default in a broken category, and the win itself signals why the entire category is excluded from allocation. Price is below the 50W (negative 3.5%), which ordinarily creates a pullback-into-support timing opportunity—and the timing score of 98.0 reflects that accuracy. However, the 13W return is negative at -7.7%, and the relative strength versus SPY collapsed to -18.4%, which means the pullback is not being accumulated but rather continues to distribute. The volume signature at 1.56x the 20W average with MACD that is bullish but stochastic that is rising from the middle zone confirms the setup is a repair attempt, not a genuine accumulation pattern. XOP loses to XLE solely because its stochastic is falling (weaker timing) and its structure is less clean (48.1 vs 71.9), but both are mathematically broken.
Traditional Energy receives 0% allocation because the category scored 0.0, the floor of the system. This is not a valuation call—it is a technical exclusion. The category's macro fit of 23.0 is the lowest in the entire portfolio, driven by disinflation pressure at -10, credit stress at -7, and liquidity stress at -7. XLE's negative 13W return, -18.4% relative strength versus SPY, and distribution-pressure volume signature at 1.56x indicate structural weakness that even a 98.0 timing score cannot overcome. The MACD is bullish and improving, but only because it started from deeply oversold levels; the move has no volume confirmation and no category-relative strength. To earn a tier-2 slot, energy would need (1) a reversal in disinflation expectations that lifts commodity demand, (2) evidence of accumulation at current levels rather than continued distribution, or (3) a complete technical rebuild with the 50W inflecting higher. None are present, and the macro regime actively opposes entry.