
2025-06-20
Informational purposes only. The content in this report, including allocations, analysis, and commentary, is provided solely for informational and educational purposes. It does not constitute financial advice, investment advice, trading advice, or any other type of advice. Past performance does not guarantee future results. Always conduct your own research and consult a qualified financial professional before making investment decisions.
Weekly Allocation
| Ticker | Category | Weight | Role |
|---|---|---|---|
| FBTC | 50% | Overlay | |
| SLV | Precious Metals | 10% | Top-2 (10%) |
| URA | Nuclear Energy | 10% | Top-2 (10%) |
| XLK | Technology | 5% | Tier-2 (5%) |
| SMH | AI | 5% | Tier-2 (5%) |
| XLU | Utilities & Infrastructure | 5% | Tier-2 (5%) |
| XAR | Defense & Aerospace | 5% | Tier-2 (5%) |
| FCG | Traditional Energy | 5% | Tier-2 (5%) |
| COPX | Industrial Metals | 5% | Tier-2 (5%) |
Trade Instructions — Monday Open
Sell the tranche from 2025-05-23 (completing its 4-week hold). Buy the new tranche. Instructions show net portfolio changes — same-asset positions cancel, weight changes show the delta.
| Action | Ticker | Instruction |
|---|---|---|
| SELL | GLD | Sell 50% of GLD position (reduce 5.00% → 2.50%) |
| SELL | PAVE | Sell entire PAVE position (2.50% of portfolio) |
| SELL | IEMG | Sell 33% of IEMG position (reduce 3.75% → 2.50%) |
| SELL | ITA | Sell 33% of ITA position (reduce 3.75% → 2.50%) |
| BUY | URA | Buy URA — 16.67% of freed cash (adds 1.25% to portfolio) |
| BUY | XLU | Buy XLU — 16.67% of freed cash (adds 1.25% to portfolio) |
| BUY | SLV | Buy SLV — 33.33% of freed cash (adds 2.50% to portfolio) |
| BUY | XAR | Buy XAR — 16.67% of freed cash (adds 1.25% to portfolio) |
| BUY | FCG | Buy FCG — 16.67% of freed cash (adds 1.25% to portfolio) |
Current Portfolio After Trade
Combined holdings across all 4 active tranches. Each tranche is 25% of the portfolio.
| Ticker | % of Portfolio | Weight Bar |
|---|---|---|
| FBTC | 50.00% | |
| URA | 7.50% | |
| SLV | 7.50% | |
| XLK | 6.25% | |
| SMH | 5.00% | |
| COPX | 5.00% | |
| XLU | 5.00% | |
| IEMG | 2.50% | |
| ITA | 2.50% | |
| GLD | 2.50% | |
| XAR | 2.50% | |
| FCG | 2.50% | |
| IGF | 1.25% |
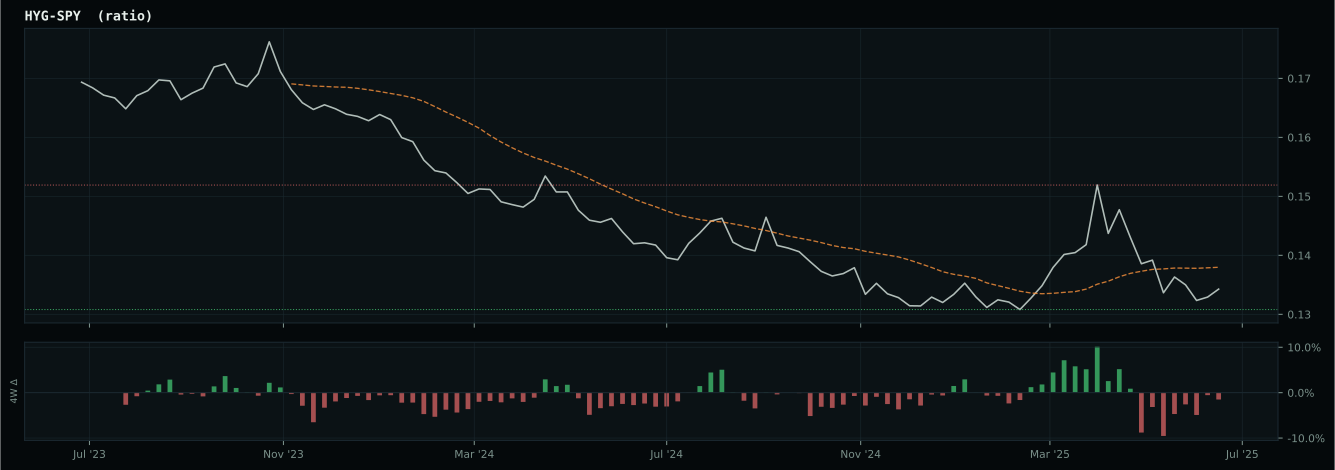
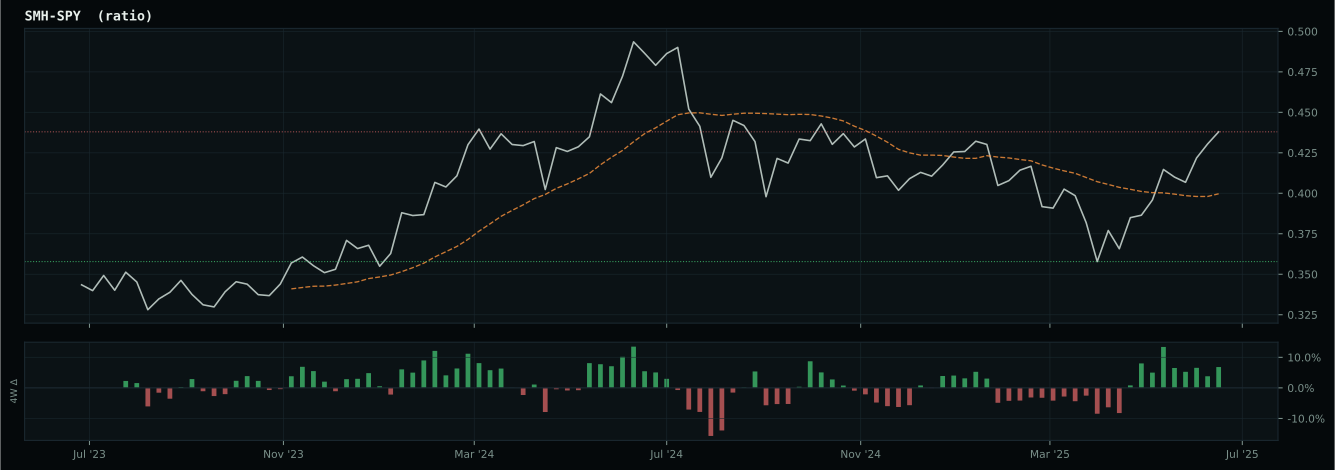
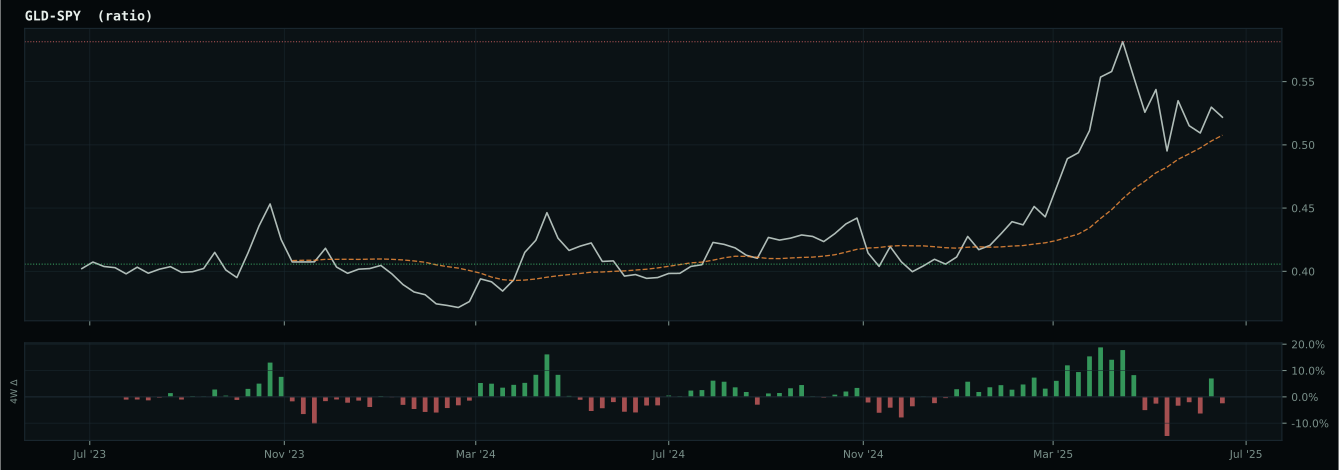
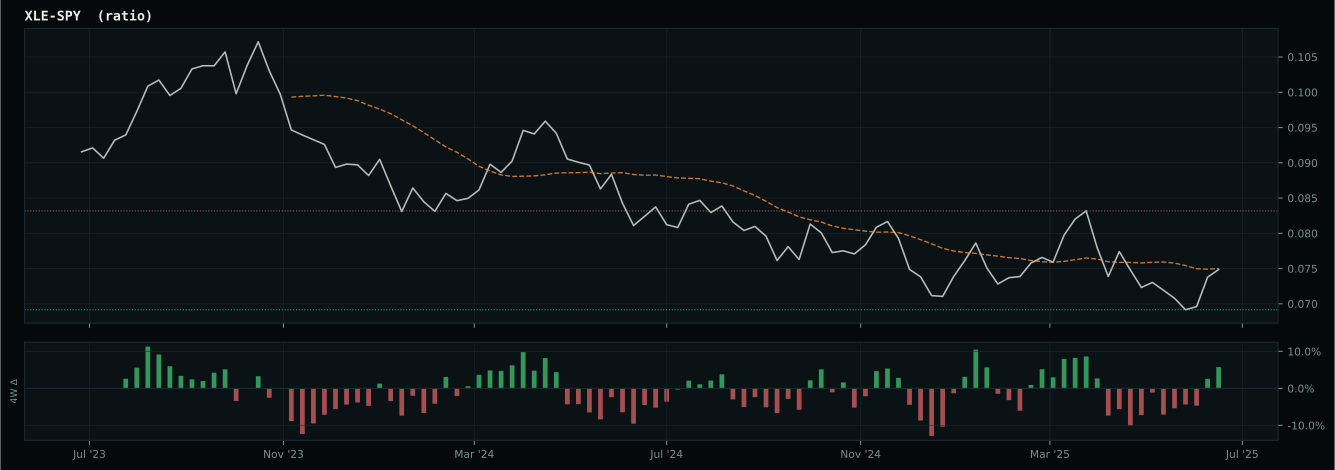
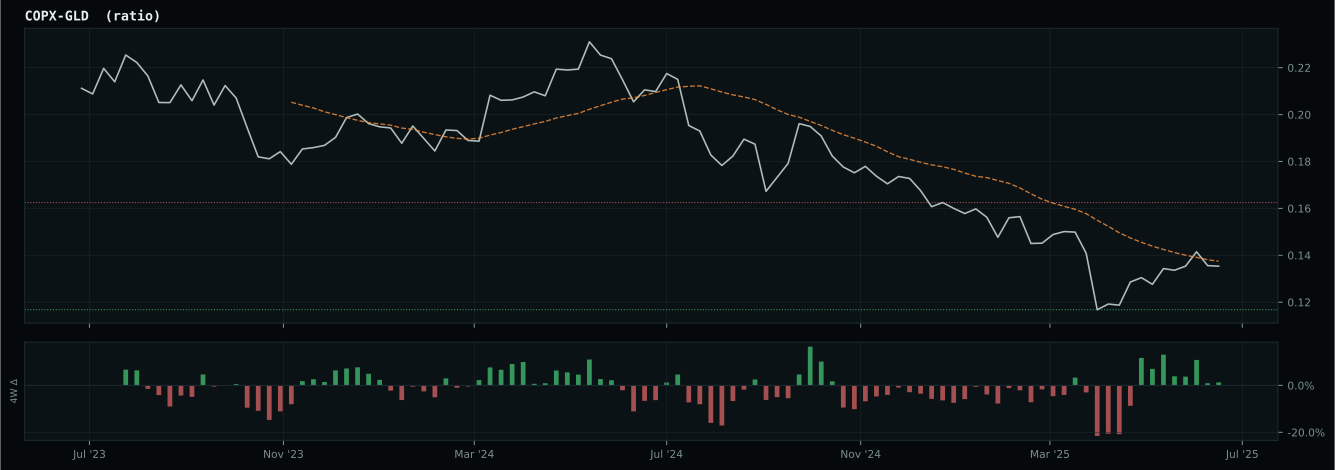
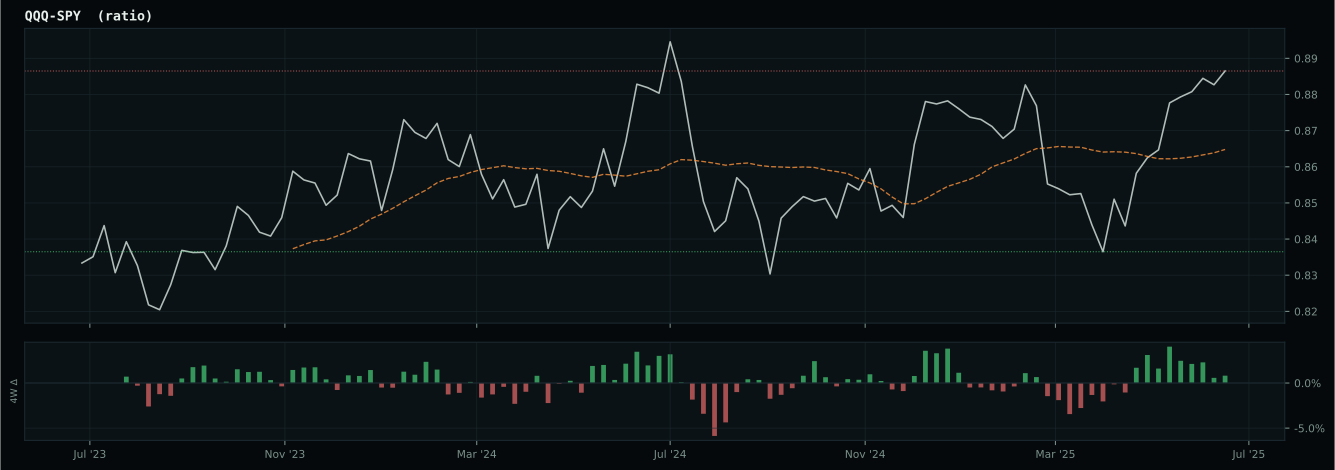
Macro Regime — Disinflation
Macro Evidence Charts
Market-implied signals behind the macro regime scores. Each ratio compares two assets; the direction and slope of the ratio is what the macro engine reads.
Crypto Regime — TrendBTC
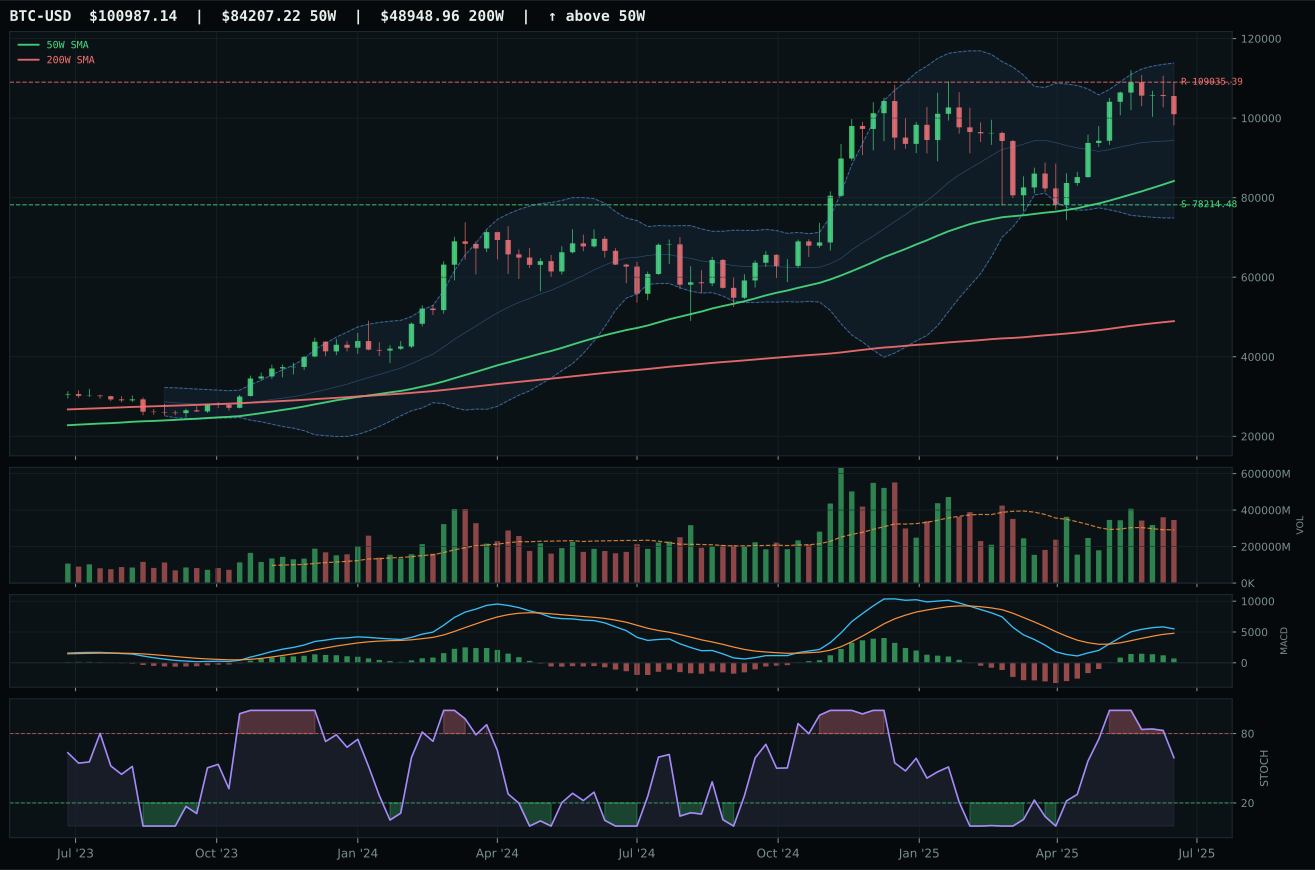
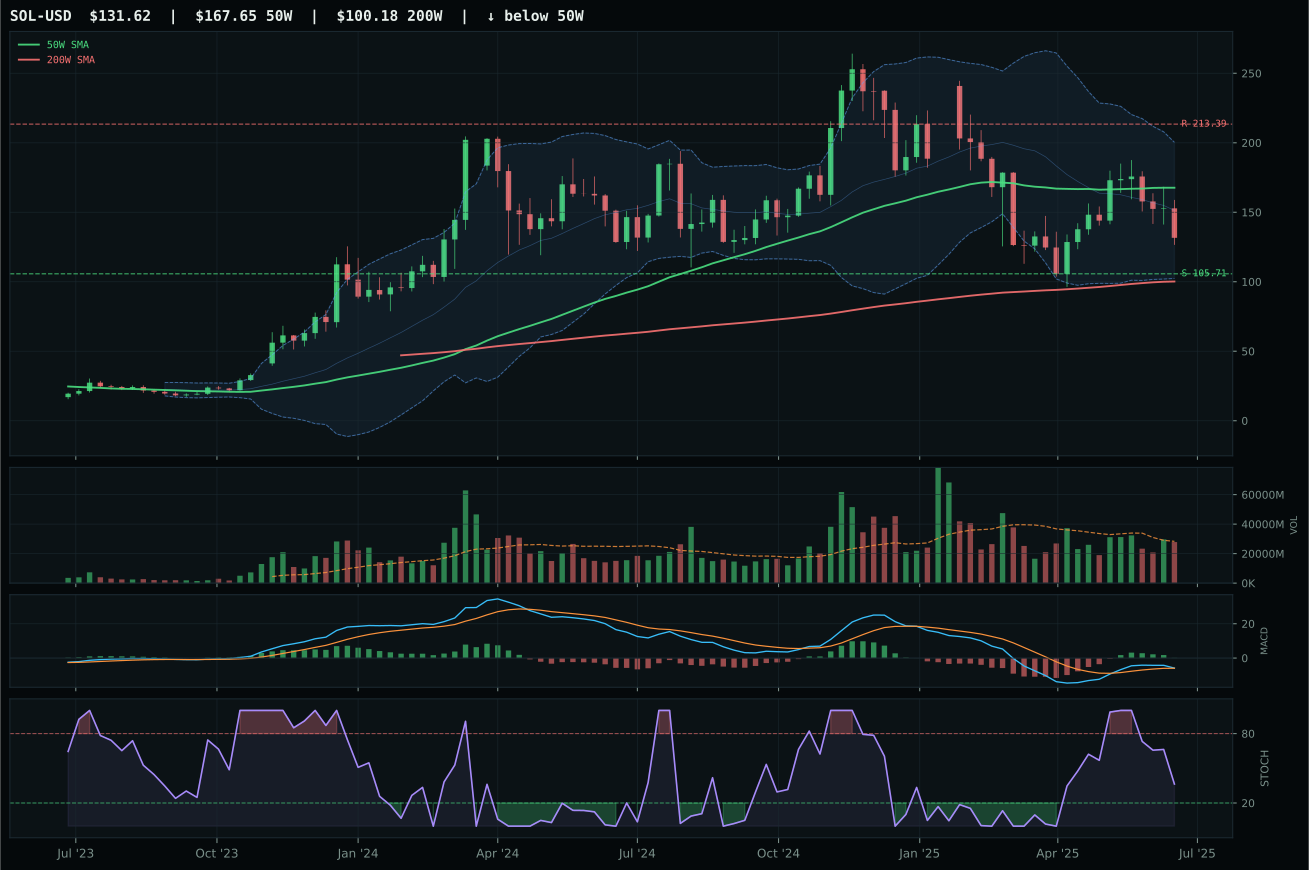
ValueBTC not armed: BTC has not made the first post-breakdown touch of the 200W buy zone after losing the 50W
TrendBTC confirmed: 2 consecutive closes above rising/flat 50W SMA
one or more available conditions failed
Category Rankings
| Rank | Category | Winner | Score | Alloc | 4W Ret | Peers (4W) |
|---|---|---|---|---|---|---|
| 1 | Precious Metals | SLV | 70.5 | 20% | +7.01% | GDX -1.1% · GLD +0.5% |
| 2 | Nuclear Energy | URA | 70.4 | 20% | +12.43% | NLR +10.7% · URNM +7.7% |
| 3 | Technology | XLK | 70.3 | 10% | +8.65% | IGV +6.0% · CIBR +3.2% |
| 4 | AI | SMH | 62.5 | 10% | +11.86% | AIQ +7.2% · BOTZ +10.0% |
| 5 | Utilities & Infrastructure | XLU | 60.2 | 10% | +4.12% | PAVE +8.8% · IGF +3.0% |
| 6 | Defense & Aerospace | XAR | 56.5 | 10% | +12.21% | ITA +8.9% · ROKT +12.6% |
| 7 | Traditional Energy | FCG | 48.5 | 10% | -6.91% | XOP -4.4% · XLE -3.7% |
| 8 | Industrial Metals | COPX | 36.6 | 10% | +7.79% | REMX +35.6% · PICK +12.5% |
| 9 | Agriculture & Livestock | MOO | 31.7 | 0% | -0.03% | VEGI -0.5% · WEAT -4.8% |
| 10 | Emerging Markets | IEMG | 30.1 | 0% | +6.77% | INDA +1.7% · ILF +0.3% |
Precious Metals — SLV
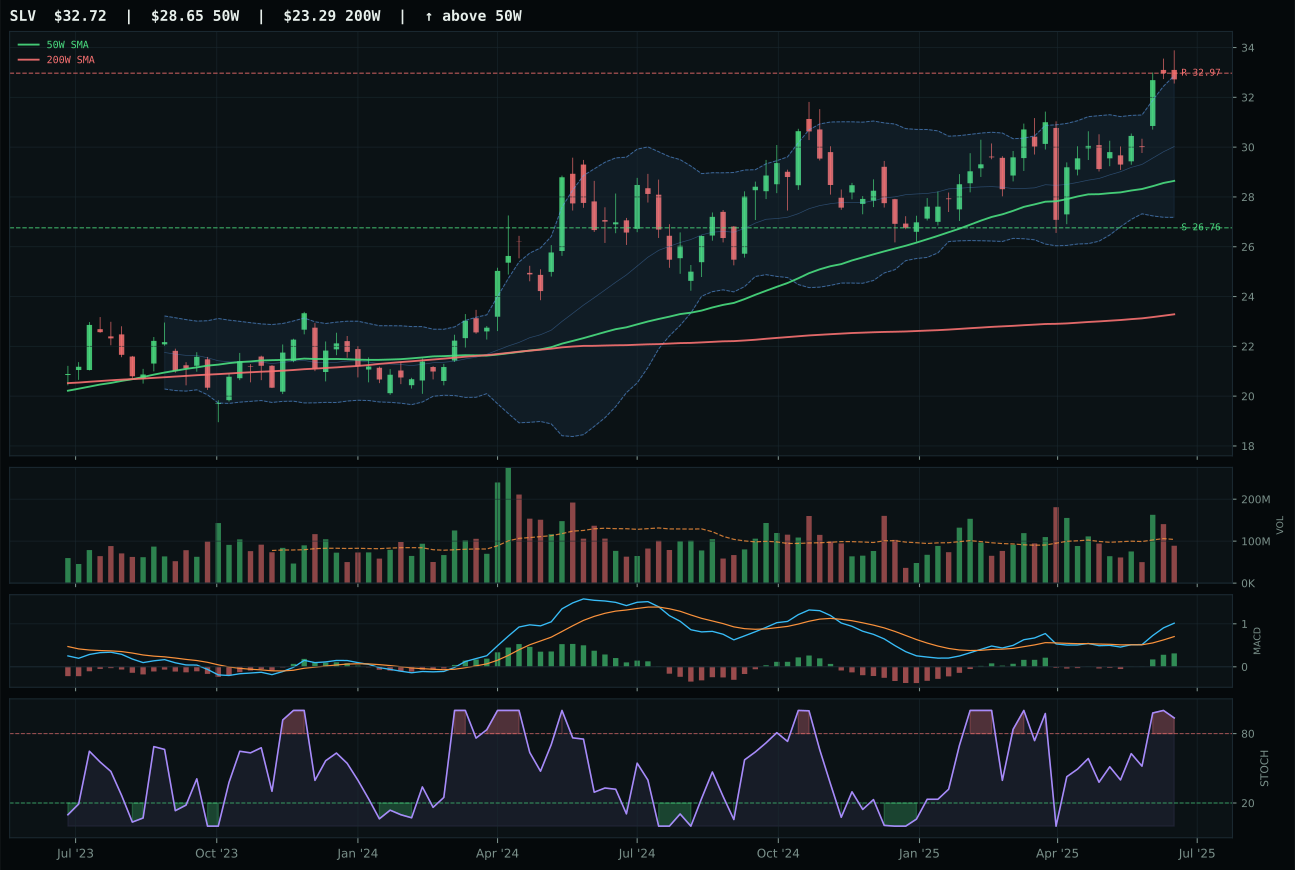
SLV has a neutral structure profile with 3.6% 13-week relative strength versus SPY.
A failed hold above support would weaken the setup.
Actionable but governed by invalidation levels.
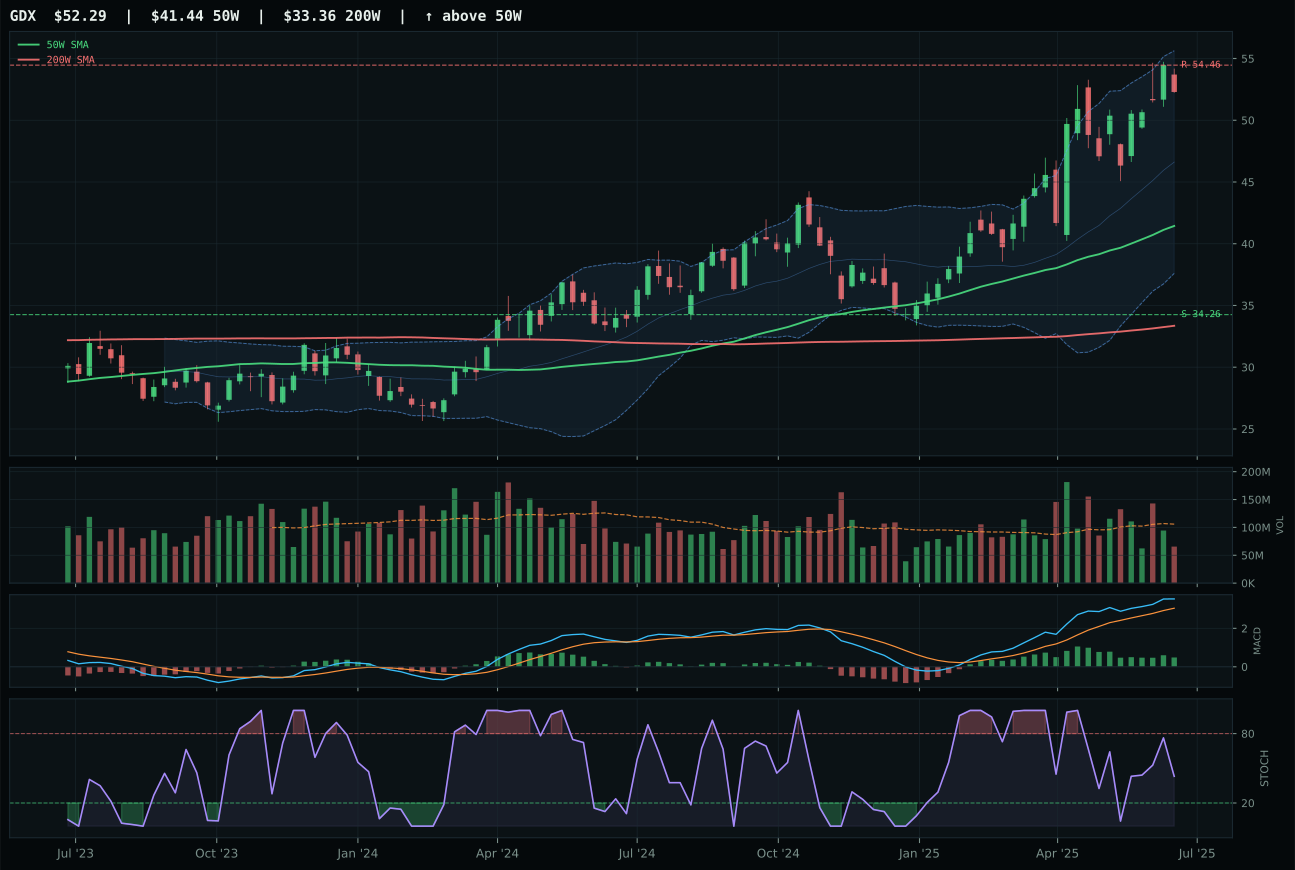
GDX has a vertical extension profile with 12.1% 13-week relative strength versus SPY.
A failed hold above support would weaken the setup.
Actionable but governed by invalidation levels.
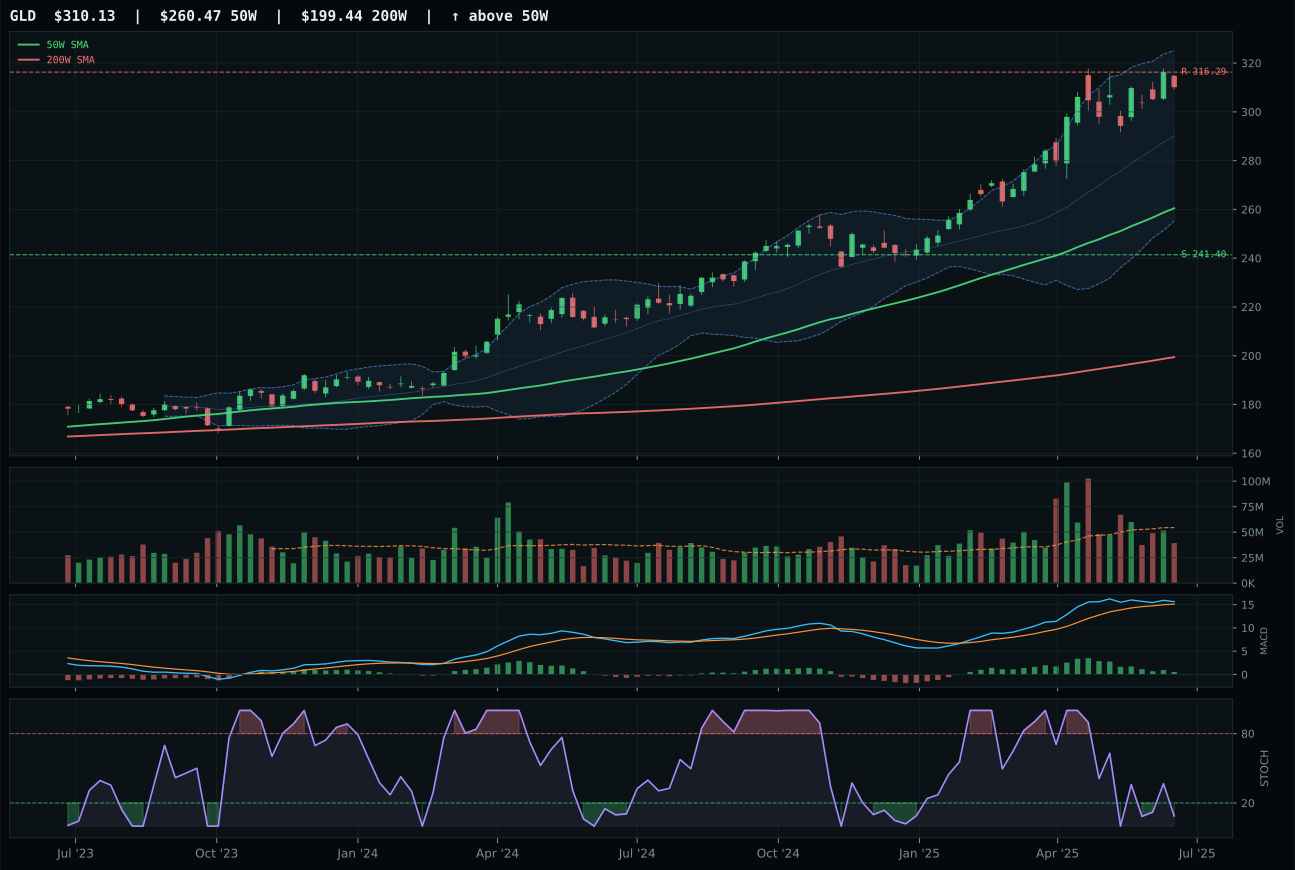
GLD has a vertical extension profile with 6.0% 13-week relative strength versus SPY.
A failed hold above support would weaken the setup.
Actionable but governed by invalidation levels.
SLV earned top-2 status and the 10% overweight allocation by delivering a clean, defensible technical setup with precisely the macro sponsorship this disinflation cycle rewards. The 9.0% thirteen-week return and 3.6% SPY-relative outperformance form a foundation that is neither explosive nor dismissible, while the neutral volume participation at 0.86x the twenty-day average signals accumulation without the thin-participation warning flags that plague GDX. SLV's structure at 73.1/100 is clean—neutral architecture with 75.3% compression—whereas GDX is extended 26.2% above the 50W and showing MACD bullish but flattening, a divergence that penalizes timing (48.0 vs 67.0). SLV sits just 14.2% above the 50W with support at 26.76 and resistance at 32.97; the positioning preserves downside protection while stochastic RSI at 0.94 signals that while overbought, buyers are still in control. The 15.4-point score gap versus GDX is decisive: silver's hybrid monetary-industrial beta is beating pure mining leverage.
Precious Metals ranked among the two highest eligible final category scores and earned 10% allocation as a top-2 overweight in this cycle. The category score of 70.5 reflects a macro fit of 74.0/100, the highest in the portfolio, driven by active monetary hedge bid (+14 basis points) and disinflation support (+8 basis points). In a 50% overlay environment, this tier-1 slot is meaningful: the system is signaling that metals represent the best risk-adjusted opportunity available right now. SLV's technical evidence of 79.3/100 is solid but not exceptional; the allocation is being driven by macro alignment more than pure momentum. Disinflation creates a regime where monetary hedges gain institutional demand, and credit stress remains active enough to keep safe-haven flows intact. The 10% weight reflects conviction that this setup will persist and that mean-reversion in metals valuations is underway. For SLV to hold top-2 status, macro conditions must remain disinflation-supportive and the monetary hedge bid must not flip to active headwind. A credit event, a surprise in core inflation data, or a pivot to rate-cut hesitation could rapidly erode the macro support that is currently driving this allocation.
Nuclear Energy — URA
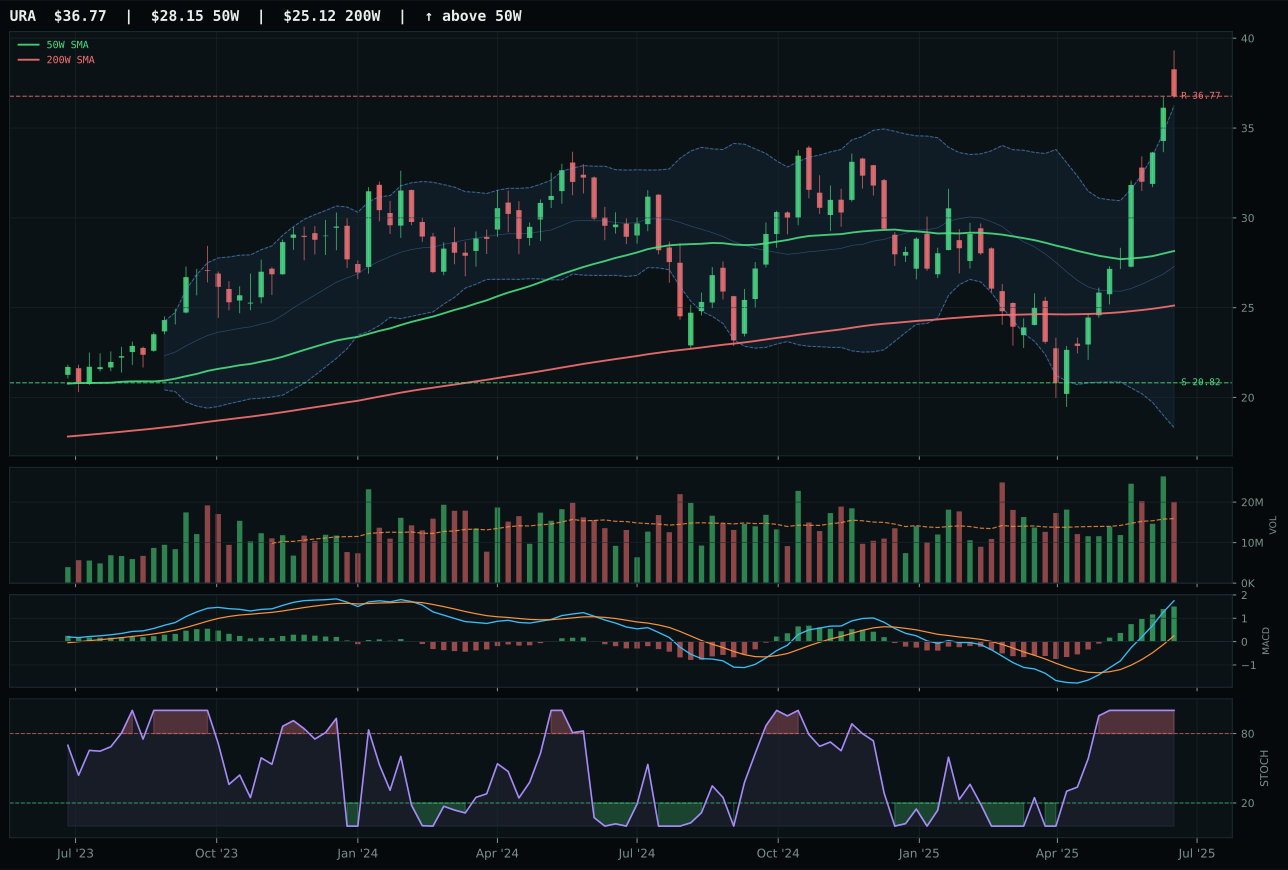
URA has a vertical extension profile with 41.7% 13-week relative strength versus SPY.
A failed hold above support would weaken the setup.
Actionable but governed by invalidation levels.
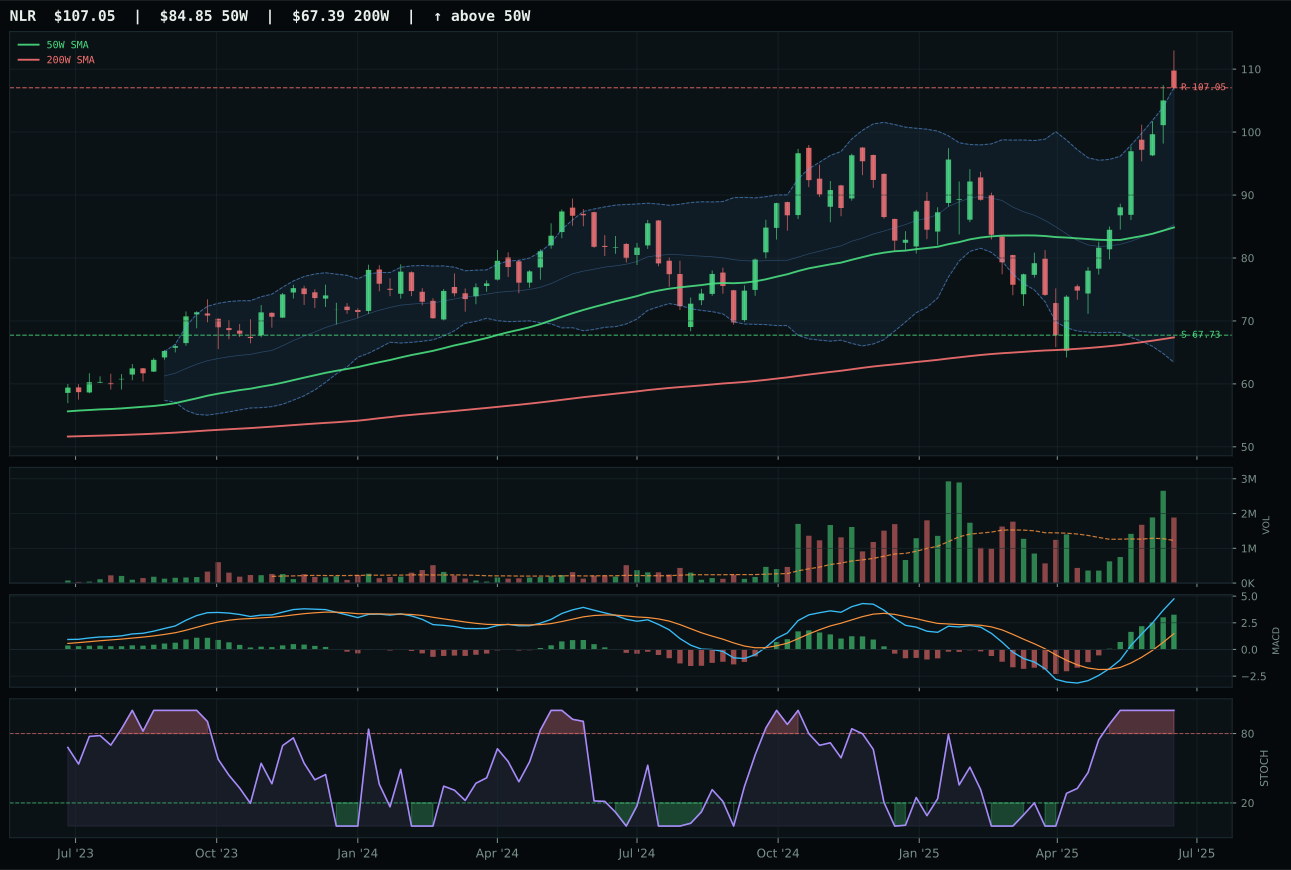
NLR has a vertical extension profile with 29.8% 13-week relative strength versus SPY.
A failed hold above support would weaken the setup.
Actionable but governed by invalidation levels.
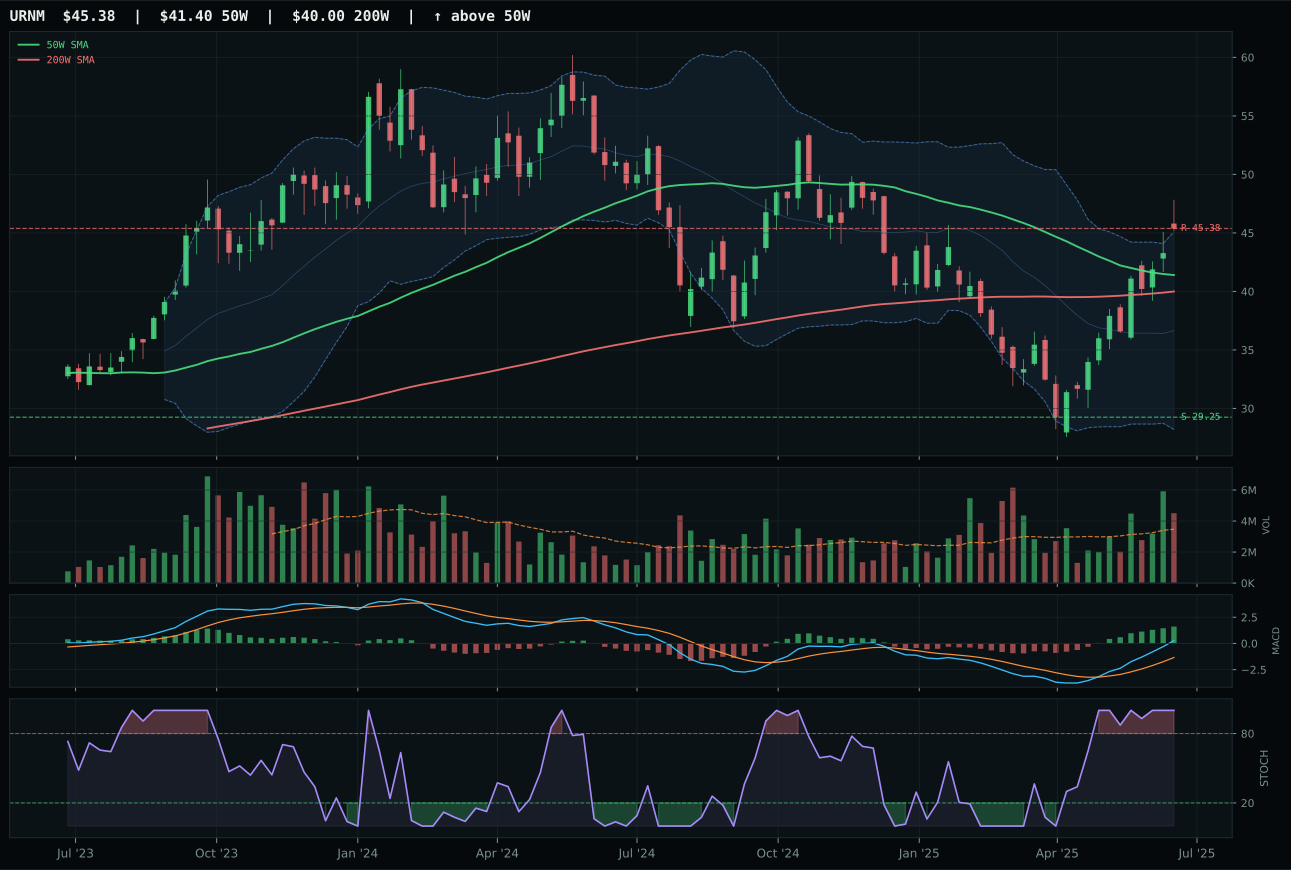
URNM has a neutral structure profile with 22.6% 13-week relative strength versus SPY.
A failed hold above support would weaken the setup.
Actionable but governed by invalidation levels.
URA earned top-2 status despite its extended 30.6% distance above the 50W by delivering unambiguous relative strength and volume confirmation that NLR simply could not match. The 47.1% thirteen-week return, 41.7% SPY-relative outperformance, and 11.9% category-relative edge are not accident—they reflect institutional demand for uranium as an energy-policy beneficiary in a disinflation regime. URA's volume-price confirmation of 85.1/100 and persistence of 100.0/100 reveal a move that is being accumulated into, not distributed into, despite the extended price. NLR's technical evidence is actually marginally stronger at 92.0/100 versus URA's 91.1/100, but where it fails is category-relative strength at 0.0% versus URA's 11.9%—a fifty-basis-point swing that reveals URA is capturing flows that NLR is not. The entry timing penalty (45.0/100) is real; every buyer entering URA at current levels is late to the move. Yet the momentum confirmation at 100.0/100 signals that the trend is still intact.
Nuclear Energy ranked as the second-highest eligible category score at 70.4 and earned 10% allocation as a top-2 overweight. The category macro fit of 50.0/100 is neutral—no specific descriptor profile was available—but real asset sponsorship (+7) and AI growth sponsorship (+5) provide enough support to offset modest headwinds. What is driving this tier-1 allocation is pure technical evidence at 91.1/100, among the highest in the portfolio, with URA delivering 47.1% thirteen-week return and 41.7% SPY-relative strength. This is conviction based on momentum and volume confirmation, not macro tailwind. The extension of 30.6% above the 50W is the real risk here: new entrants are paying prices that offer limited upside to resistance at 36.77 and meaningful downside to support at 20.82. The ten percent weight reflects belief that the uranium narrative—policy-driven, supply-constrained, benefiting from energy transition and AI power demands—will sustain momentum into new highs. If volume rolls over or if the 50W is broken on the downside, this position will need to contract sharply. For now, it is held as the best risk-adjusted long on momentum and relative strength grounds.
Technology — XLK
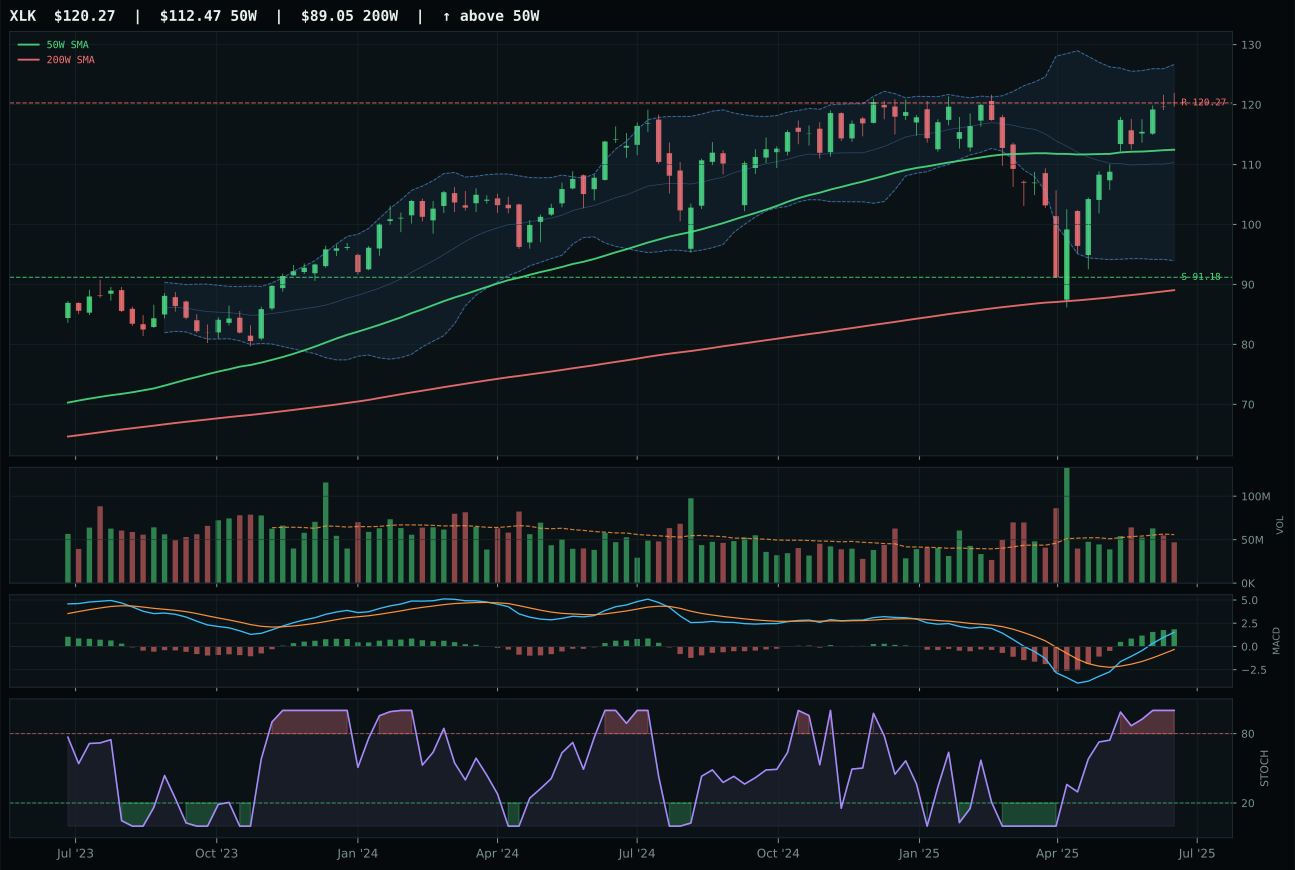
XLK has a neutral structure profile with 7.1% 13-week relative strength versus SPY.
A failed hold above support would weaken the setup.
Actionable but governed by invalidation levels.
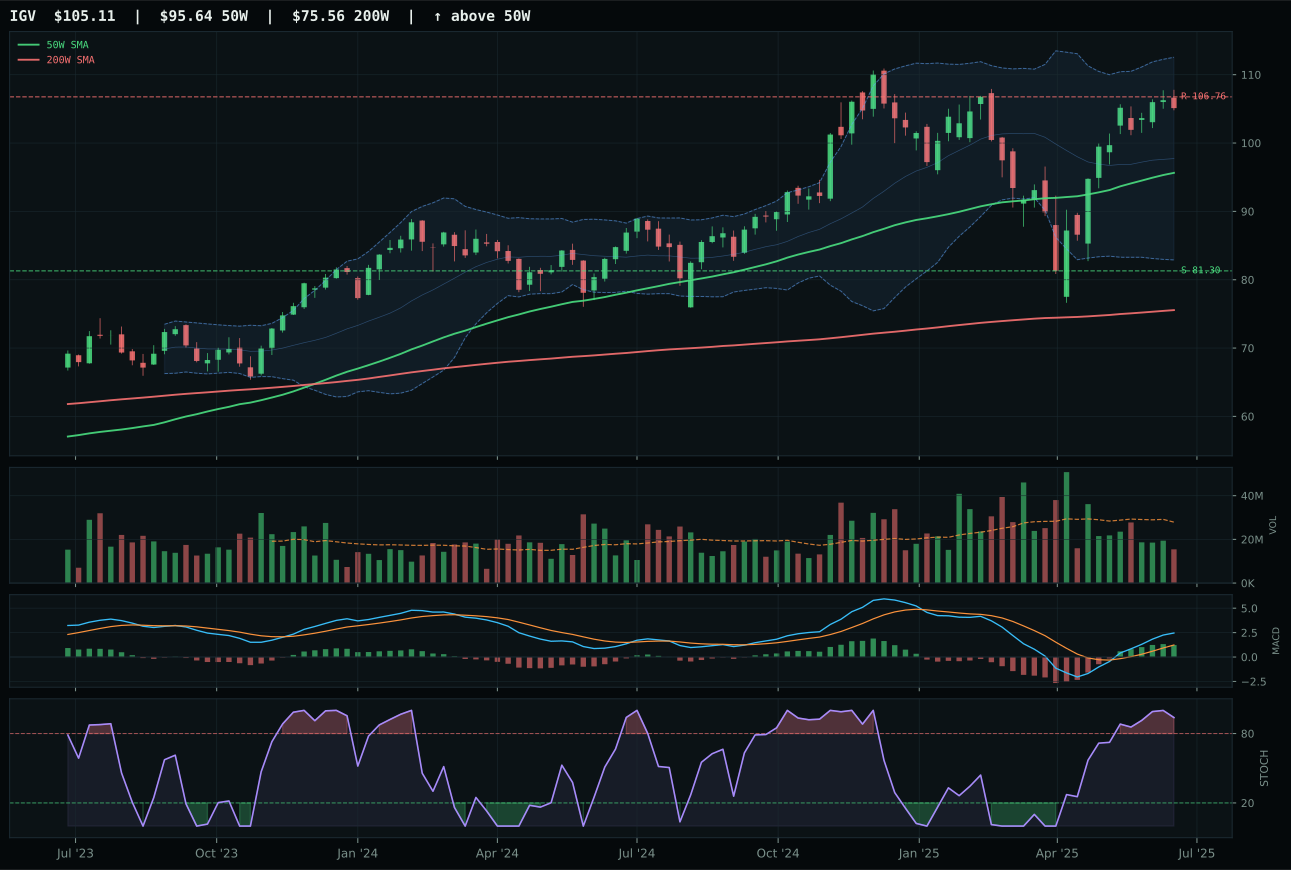
IGV has a neutral structure profile with 7.5% 13-week relative strength versus SPY.
A failed hold above support would weaken the setup.
Actionable but governed by invalidation levels.
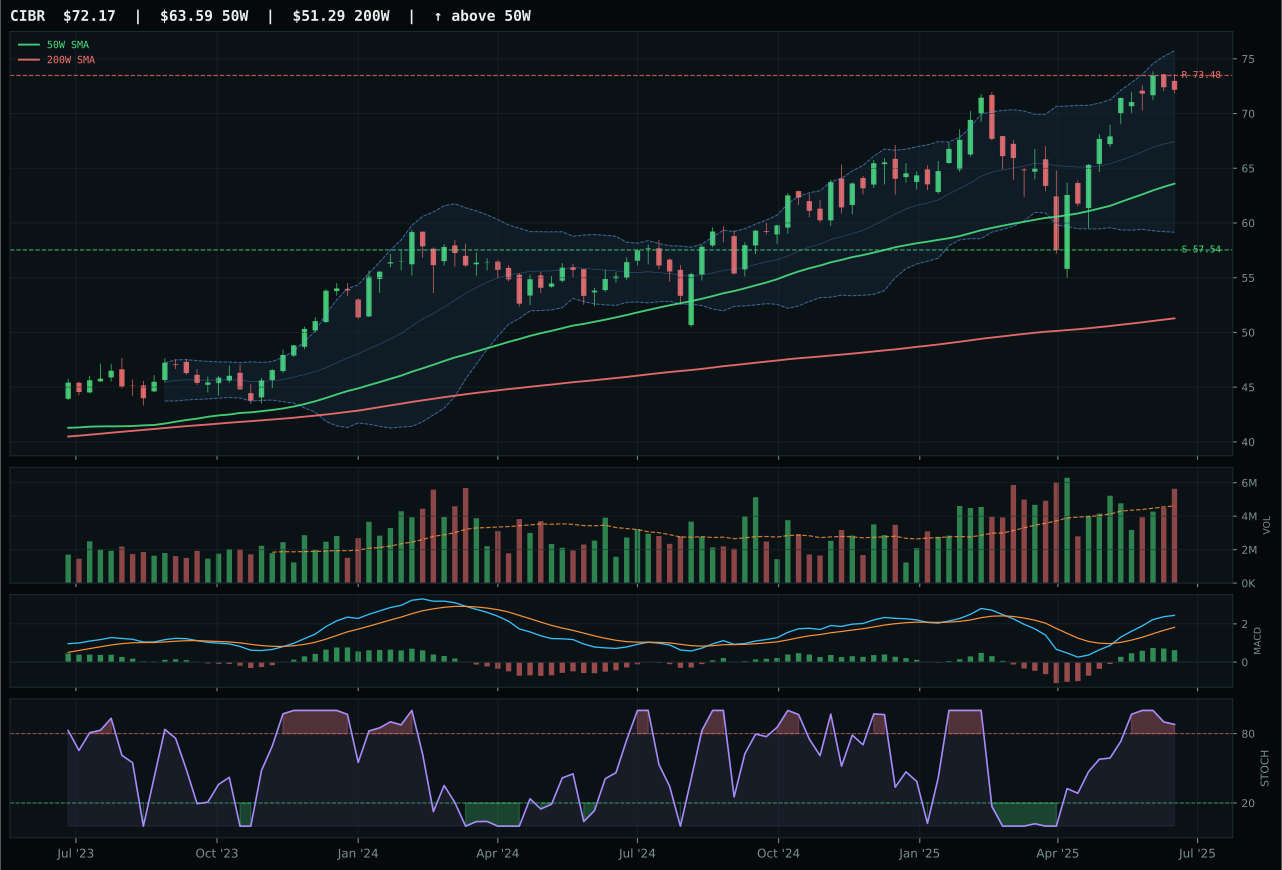
CIBR has a neutral structure profile with 5.7% 13-week relative strength versus SPY.
A failed hold above support would weaken the setup.
Actionable but governed by invalidation levels.
XLK won by assembling the cleanest technical setup and strongest breadth confirmation in a crowded field. The 7.1% relative strength advantage over SPY, paired with a 12.4% thirteen-week return and neutral volume participation, tells a story of sustained institutional demand rather than retail chasing. MACD bullish and improving with stochastic RSI at extreme overbought momentum created a tight harmonic setup that IGV couldn't match—IGV's risk/reward was penalized more heavily (46.0 vs 49.5) because its volume confirmation came in as thin participation rather than neutral sponsorship. XLK sits 7.1% above the 50W average with support at 91.18 and resistance at 120.27, a structure that preserves downside protection while maintaining upside optionality in a disinflation regime where growth multiples stay defended.
Technology earned 5% allocation as a tier-2 category, ranking third through eighth among the portfolio's ten sleeves in this cycle. The category score of 70.2 reflects technical strength being offset by a macro fit of only 60.0/100—disinflation helps the exposure, and risk appetite remains positive, but both liquidity stress and credit stress are actively restraining flows into the space. In a 50% overlay environment, this tier-2 slot translates to a meaningful but measured commitment: the setup is sound, breadth is intact, and relative strength versus SPY justifies capital allocation, but the risk/reward math becomes asymmetric beyond this position size. For Technology to move into overweight territory, macro descriptors around credit stress would need to flip from active headwind to neutral, or the category's SPY-relative spread would need to widen further. As positioned, the allocation captures the momentum without overcommitting to an extended structure.
AI — SMH
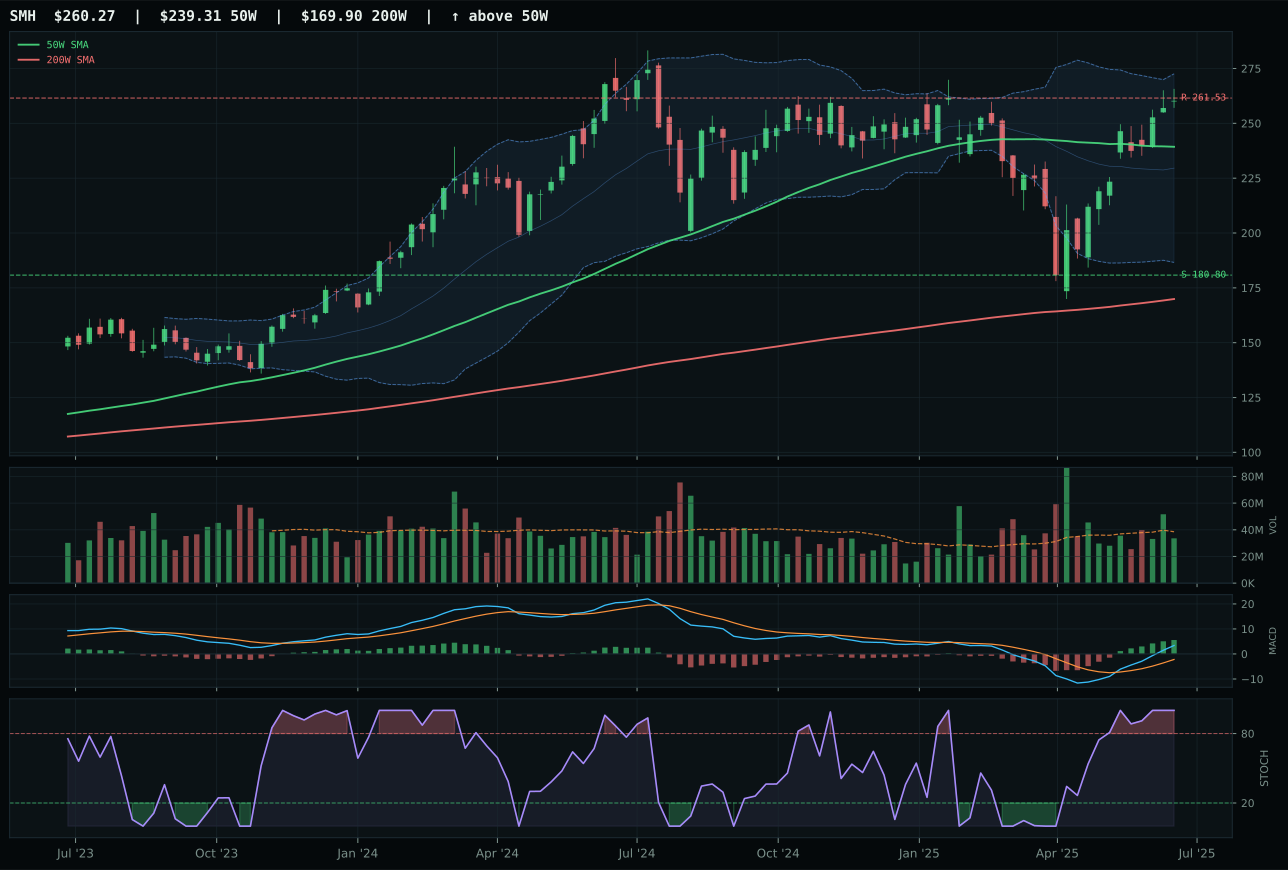
SMH has a neutral structure profile with 10.4% 13-week relative strength versus SPY.
A failed hold above support would weaken the setup.
Actionable but governed by invalidation levels.
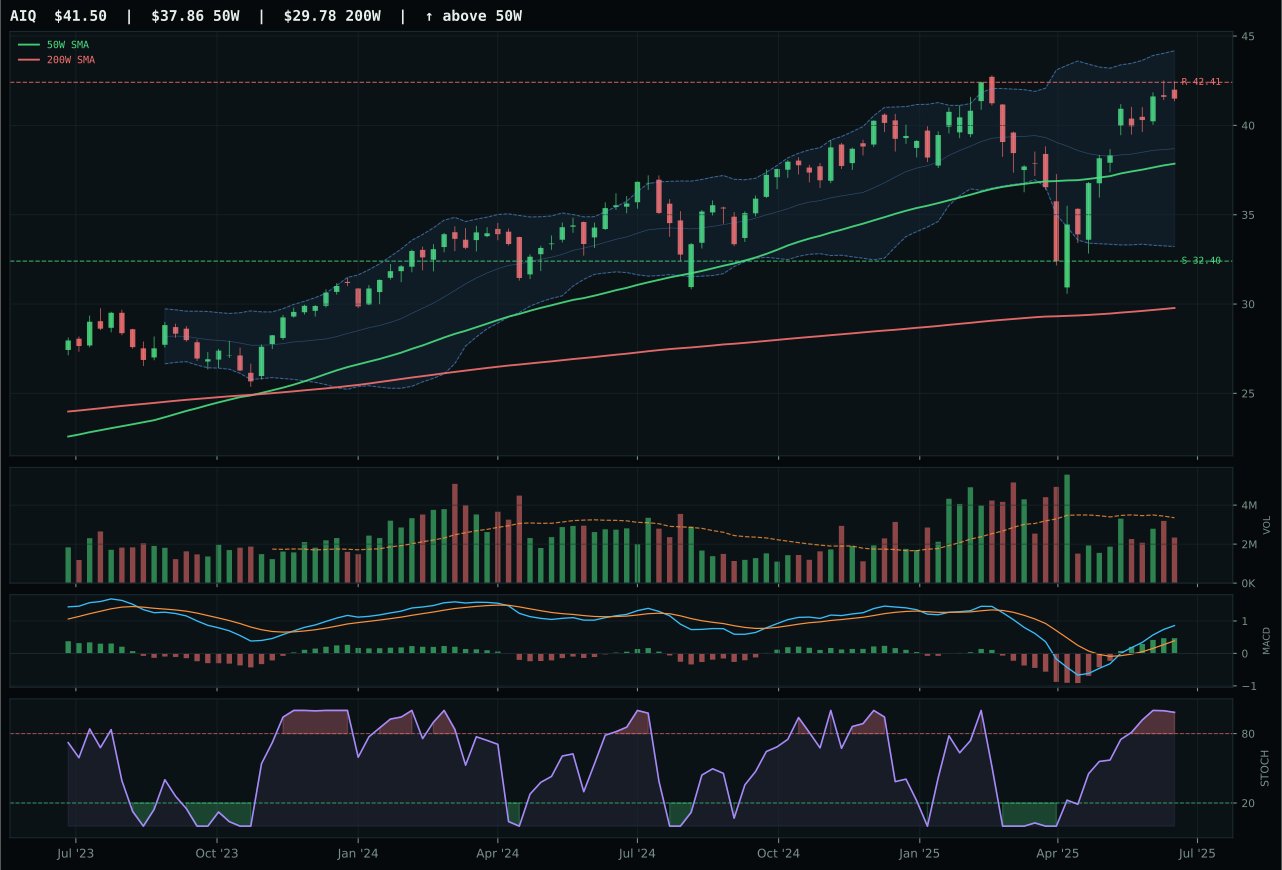
AIQ has a neutral structure profile with 4.3% 13-week relative strength versus SPY.
A failed hold above support would weaken the setup.
Actionable but governed by invalidation levels.
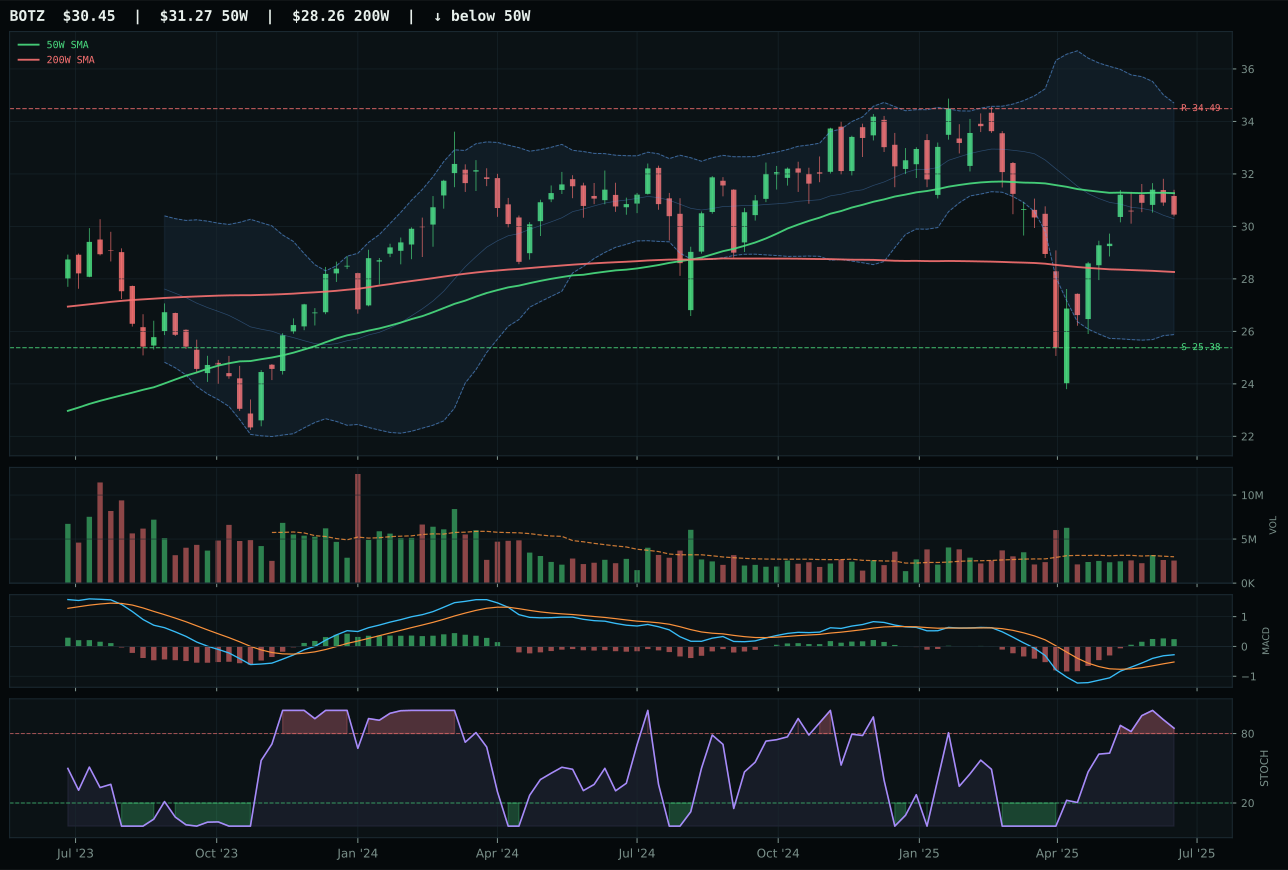
BOTZ has a compression near 50W profile with -5.0% 13-week relative strength versus SPY.
A failed hold above support would weaken the setup.
Actionable but governed by invalidation levels.
SMH prevailed on the strength of its 6.1% category-relative outperformance and more robust volume confirmation against a tight margin over AIQ. The semiconductor ETF's 15.8% thirteen-week return and 10.4% SPY-relative strength fed directly into a momentum confirmation score of 100.0/100, matching perfection on four-week and thirteen-week returns plus MACD sponsorship. Where AIQ stumbled was in structure cleanliness (70.5 vs 75.0) and volume—thin participation versus neutral—which revealed a subtle but consequential difference in accumulation quality. SMH sits only 8.8% above the 50W with support at 180.80 and resistance at 261.53, placing it in the upper retracement zone where fresh buyers still have room before exhaustion signals fully form. BOTZ was disqualified entirely due to a momentum collapse, with thirteen-week return of just 0.4% and stochastic RSI already rolling over despite MACD remaining bullish.
AI received 5% allocation in tier-2 standing, with a category score of 62.5 that lagged both the top-2 categories by meaningful margins. The macro fit of 59.0/100 is respectable—AI growth sponsorship adds fourteen basis points of support and risk appetite remains positive—but liquidity stress subtracts twelve basis points and credit stress another eight, creating structural headwinds that prevent this category from stepping into overweight. Disinflation itself contributes only five basis points, a tepid macro tailwind compared to what precious metals and nuclear energy enjoy. The tier-2 allocation captures SMH's legitimate momentum without committing fresh capital to what remains a crowded, extended structure. To earn top-2 status, AI would need category-relative strength to accelerate further or macro liquidity conditions to visibly improve. As it stands, five percent is the rational position: enough to participate in genuine breadth acceleration, not so much that you're caught leaning into a setup where every new buyer paid a higher price than the last.
Utilities & Infrastructure — XLU
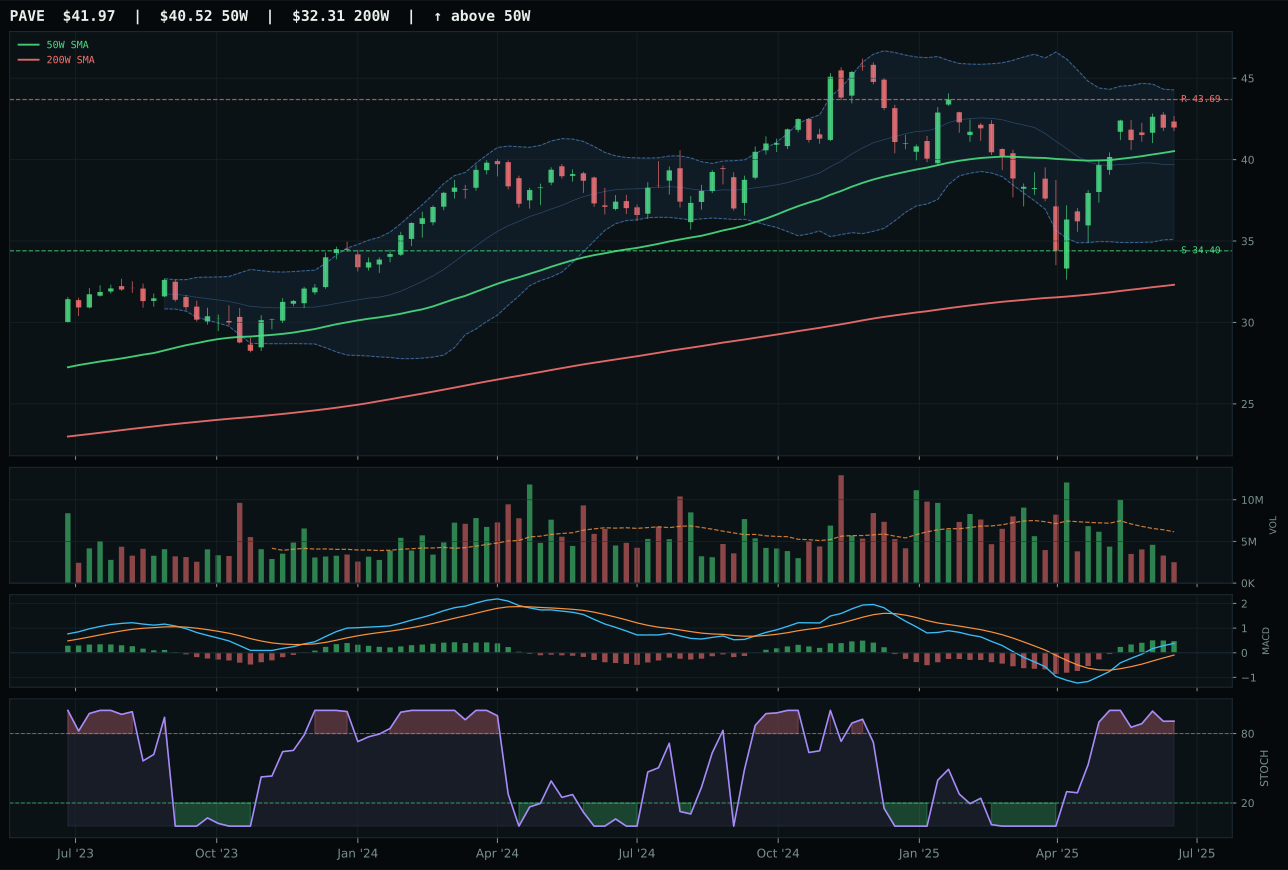
PAVE has a neutral structure profile with 4.4% 13-week relative strength versus SPY.
A failed hold above support would weaken the setup.
Actionable but governed by invalidation levels.
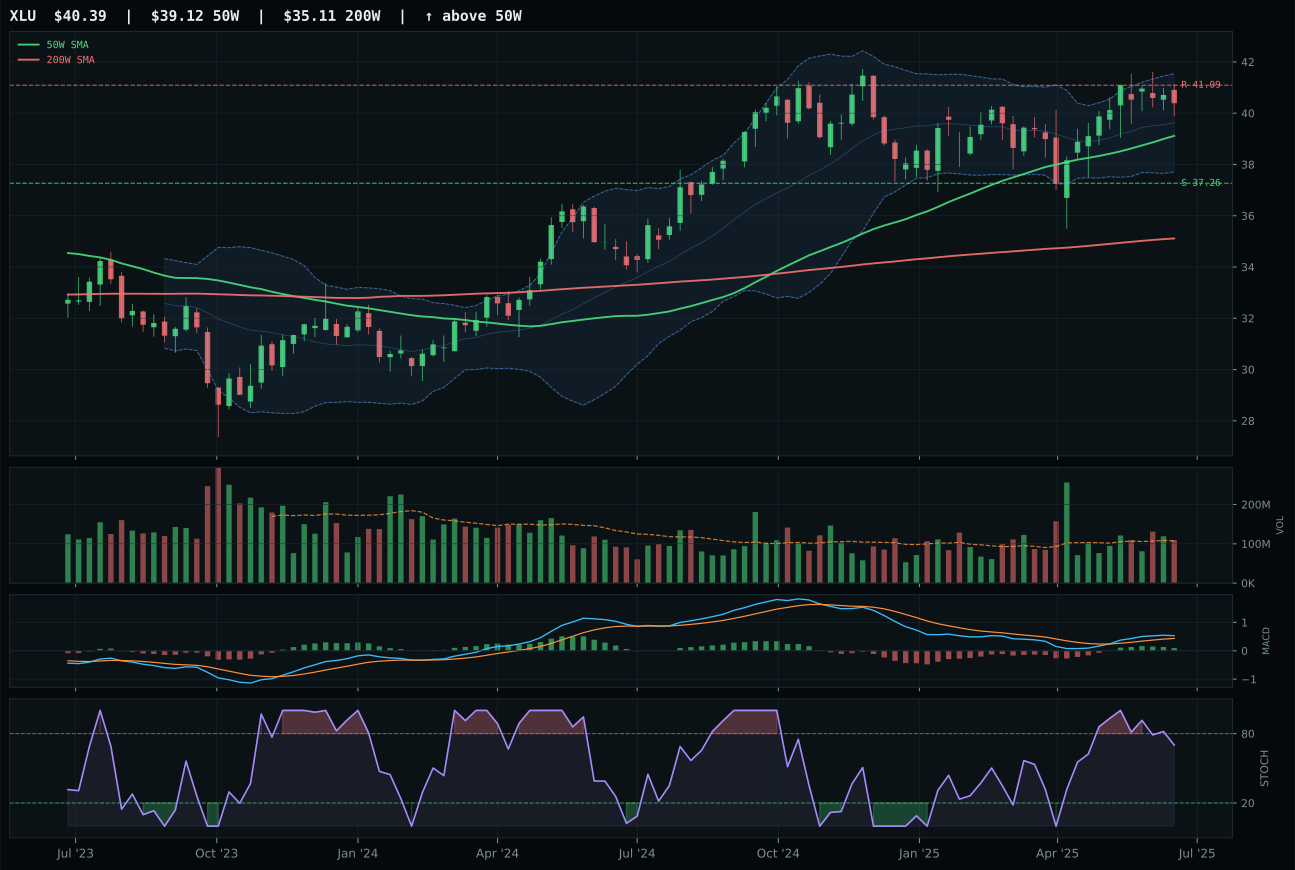
XLU has a neutral structure profile with -2.8% 13-week relative strength versus SPY.
A failed hold above support would weaken the setup.
Actionable but governed by invalidation levels.
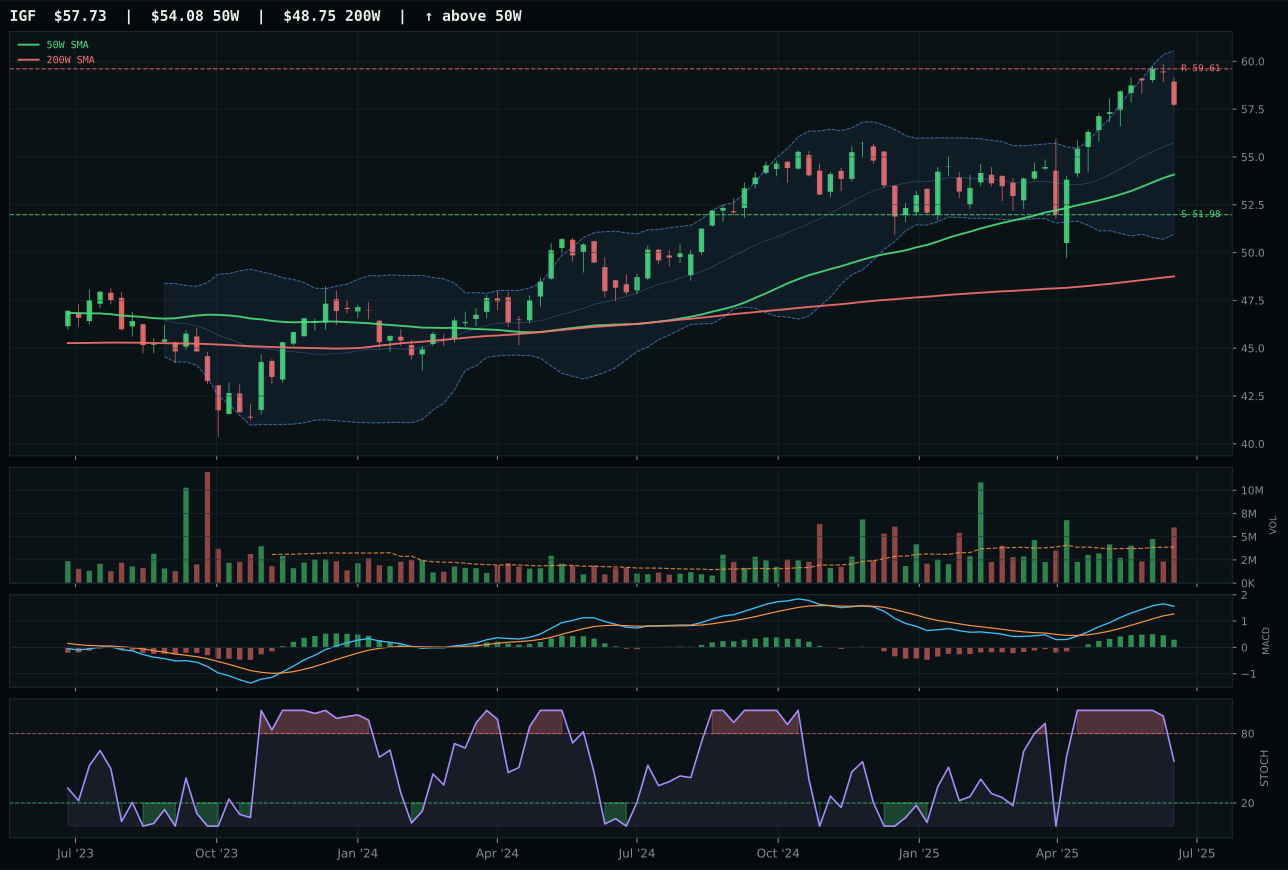
IGF has a neutral structure profile with 1.1% 13-week relative strength versus SPY.
A failed hold above support would weaken the setup.
Actionable but governed by invalidation levels.
XLU won a close category decision over PAVE by executing the better defensive setup, not by offering superior growth. Where XLU gains ground is in its trend score of 91.8/100 versus PAVE's 100.0/100 (actually a loss), but in timing XLU scores 85.0 versus PAVE's 90.0, creating a wash. The real decision is structural: XLU's neutral setup at 76.7/100 cleanliness is tighter than PAVE's 73.5, and XLU's MACD is bullish but flattening while stochastic RSI is falling/neutral, a defensive configuration in a volatile cycle. PAVE's thin participation and overbought stochastic RSI suggest it has already been accumulated into by aggressive buyers. XLU sits near the 52W low repair zone at the Fibonacci 0.786 level, a mean-reversion entry point that offers downside protection (only 8.4% to support at 37.26) versus a crowded setup in PAVE. The 9.8-point score gap masked tight technical competition; this was won on structure quality and volume confirmation, not momentum.
Utilities & Infrastructure earned 5% allocation in tier-2 standing, with a category score of 60.2 supported by a respectable macro fit of 62.0/100. Disinflation itself adds seven basis points and disinflation pressure another six, creating a total of thirteen basis points of macro support—genuine tailwind for a defensive sector in a risk-managed regime. Risk appetite being neutral rather than positive removes upside sponsorship, but the combination of disinflation support and the sector's inherent defensive characteristics explains the tier-2 allocation. XLU's thirteen-week return of 2.6% is weak, and SPY-relative strength is negative 2.8%, confirming this is a defensive rotation play, not a growth driver. The five percent weight reflects a tactical position in a mean-reversion setup near support, not conviction about utility outperformance. To earn tier-1 status, Utilities would need either XLU to break above resistance at 41.09 with sustained volume, or macro descriptors to shift in ways that signal stress-driven flight to safety. Until then, this is a measured holding in a sector where capital preservation matters more than capital appreciation.
Defense & Aerospace — XAR
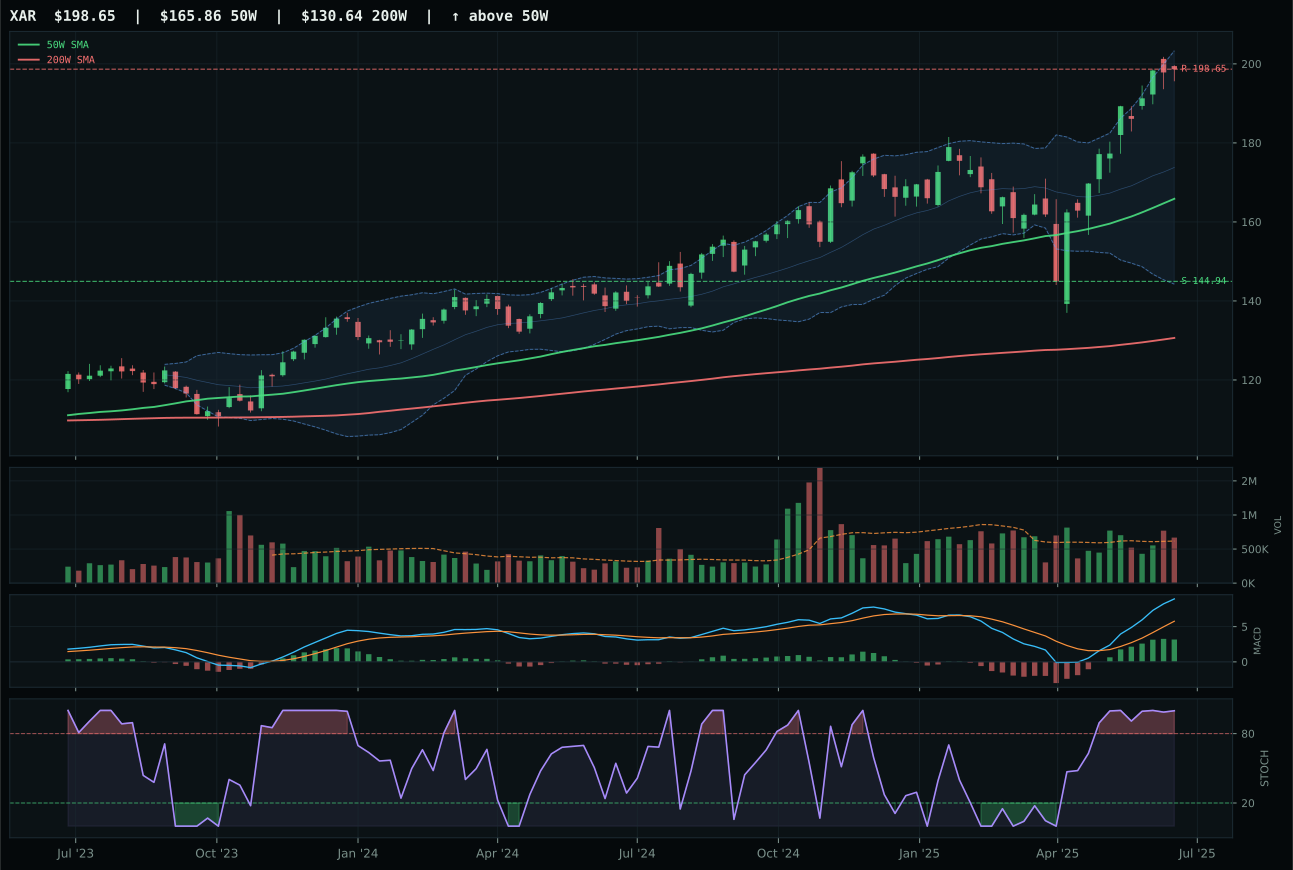
XAR has a vertical extension profile with 15.5% 13-week relative strength versus SPY.
A failed hold above support would weaken the setup.
Actionable but governed by invalidation levels.
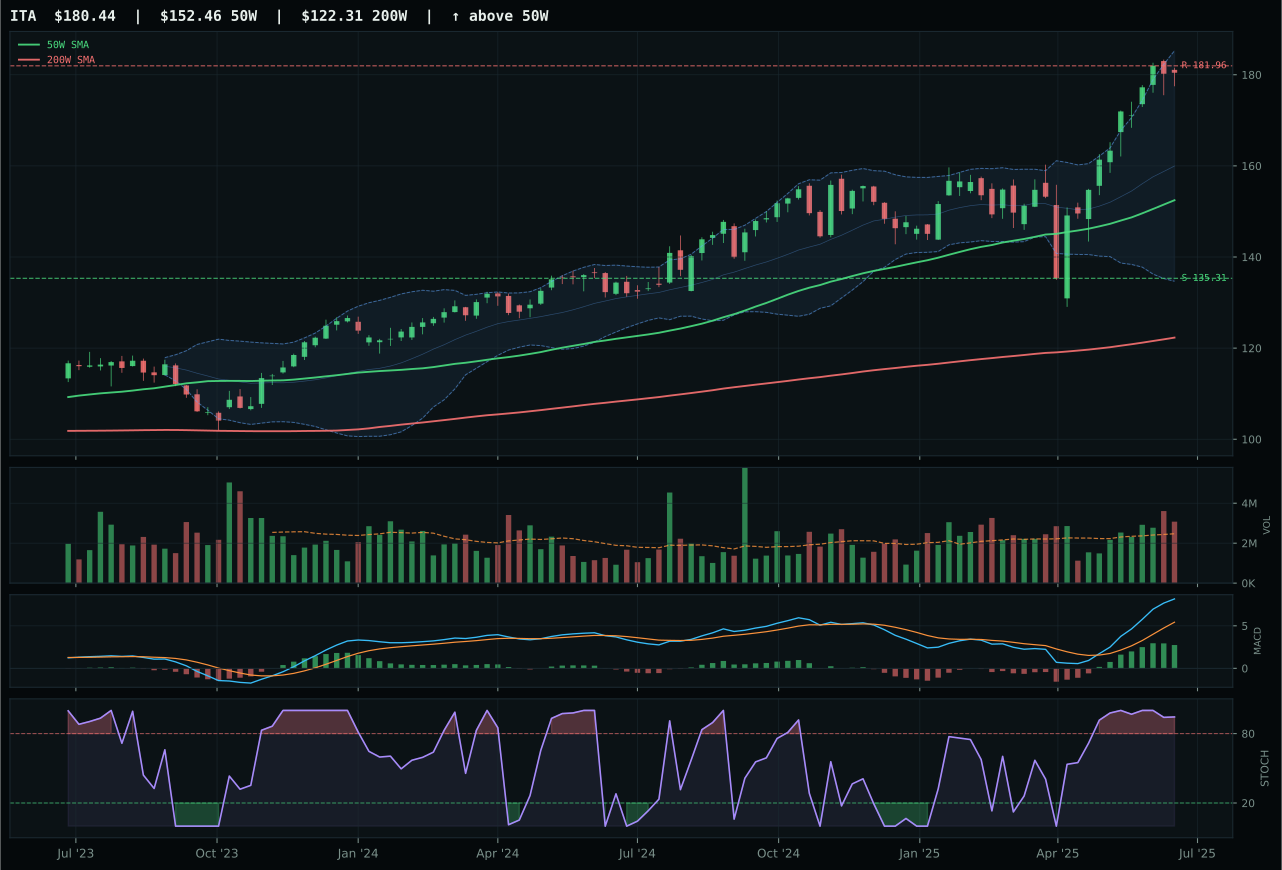
ITA has a vertical extension profile with 11.2% 13-week relative strength versus SPY.
A failed hold above support would weaken the setup.
Actionable but governed by invalidation levels.
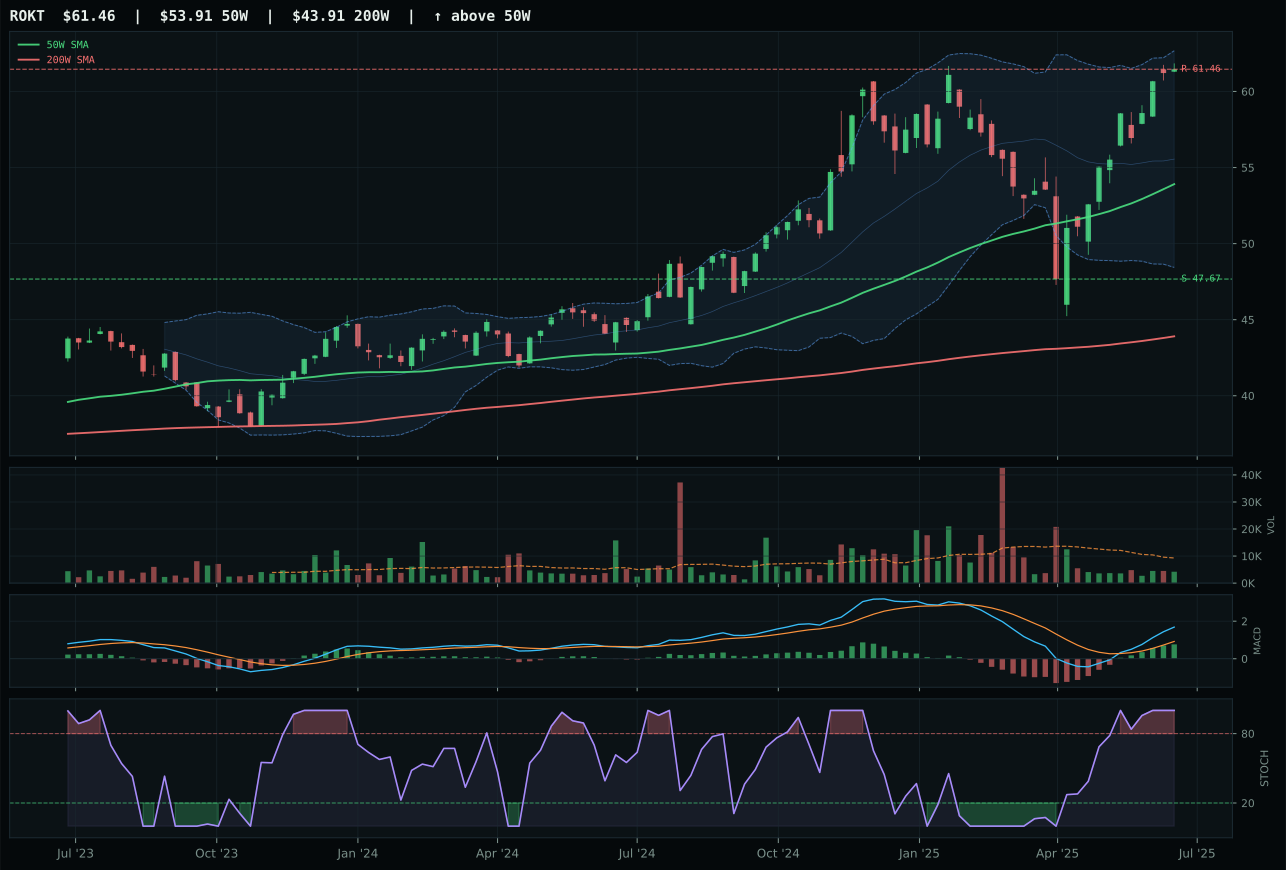
ROKT has a neutral structure profile with 9.6% 13-week relative strength versus SPY.
A failed hold above support would weaken the setup.
Tracked, but not top-2 eligible because: .
XAR won despite being extended 19.8% above the 50W—a penalty that compressed its timing score to just 37.0/100—because its persistence and relative strength inside the category were unambiguous. The 15.5% SPY-relative outperformance and 4.2% category-relative edge over ITA anchored the decision despite both setups being vertical extensions. Where XAR gains ground is in volume-price confirmation (74.4 vs 67.0) and persistence (82.6 vs a lower band), suggesting that accumulation is flowing into the extended price rather than distribution. ITA suffered from a timing score that was nearly impossible to defend at 27.0/100 given its 26.3% distance from the 50W, compounded by stochastic RSI already rolling over into weaker confirmation. XAR's neutral macro fit (50.0/100 for lack of category-specific descriptors) is the real constraint here: this is pure technical leadership with no macro sponsorship, which limits how much capital should chase the extension.
Defense & Aerospace occupies tier-2 at 5% allocation, with a category score of 56.5 that reflects clean technical execution hampered by a macro fit stuck at 51.0/100. Neither disinflation nor risk appetite provides strong category-level sponsorship; liquidity stress subtracts four basis points and credit stress adds a modest two. The portfolio is holding this position because XAR's 20.8% thirteen-week return and 15.5% relative strength are real, but the vertical extension—now at support of 144.94 and resistance at 198.65 with price near resistance—means that every new dollar committed is exposed to gap-down risk if momentum fails. The tier-2 slot is a statement: we acknowledge the trend without doubling down into the extension. What would pull Defense & Aerospace into tier-1 territory is sustained accumulation volume as price consolidates below resistance, or a pivot in macro descriptors that signals defensive rotation. Until then, five percent is the appropriate weight for a technologically clean but momentum-dependent setup.
Traditional Energy — FCG
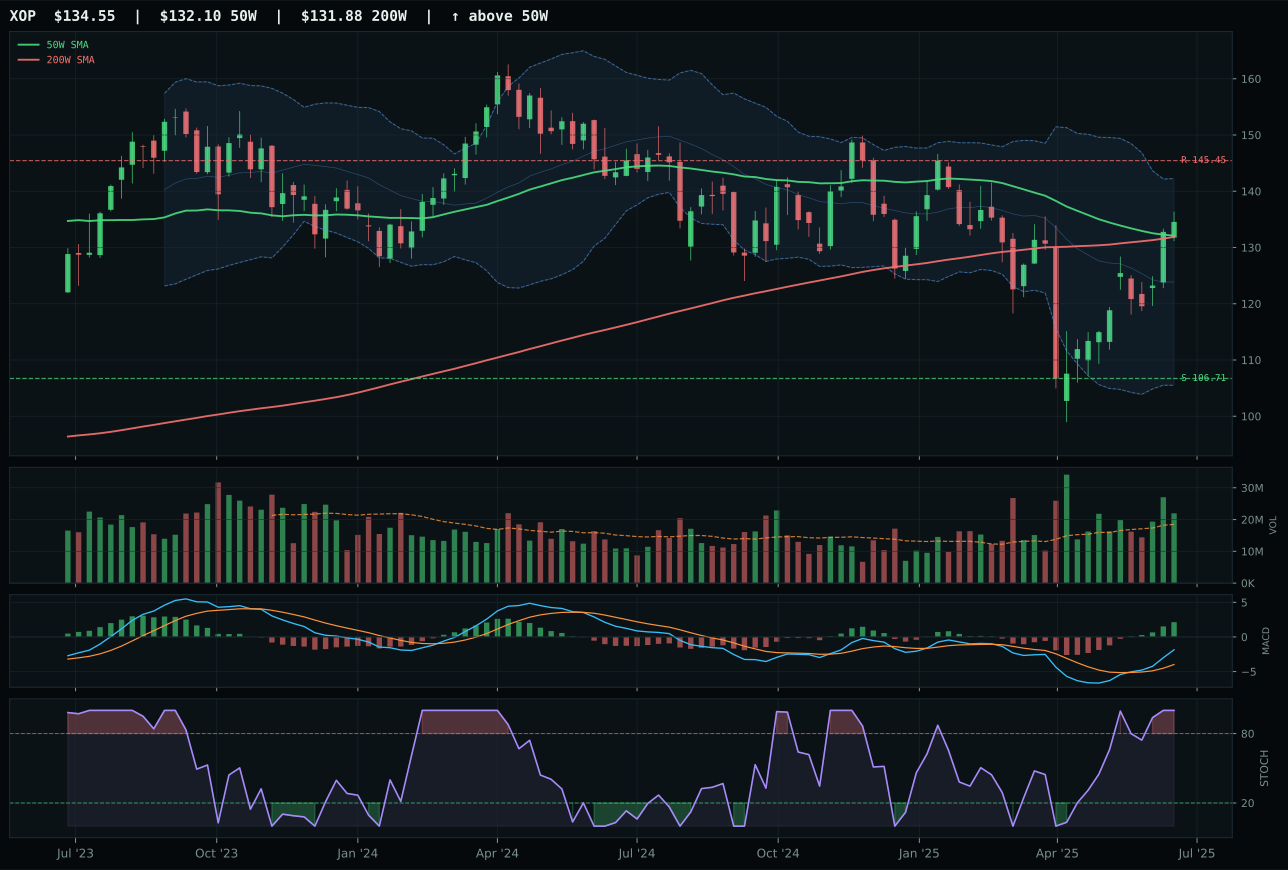
XOP has a compression near 50W profile with -2.9% 13-week relative strength versus SPY.
A failed hold above support would weaken the setup.
Actionable but governed by invalidation levels.
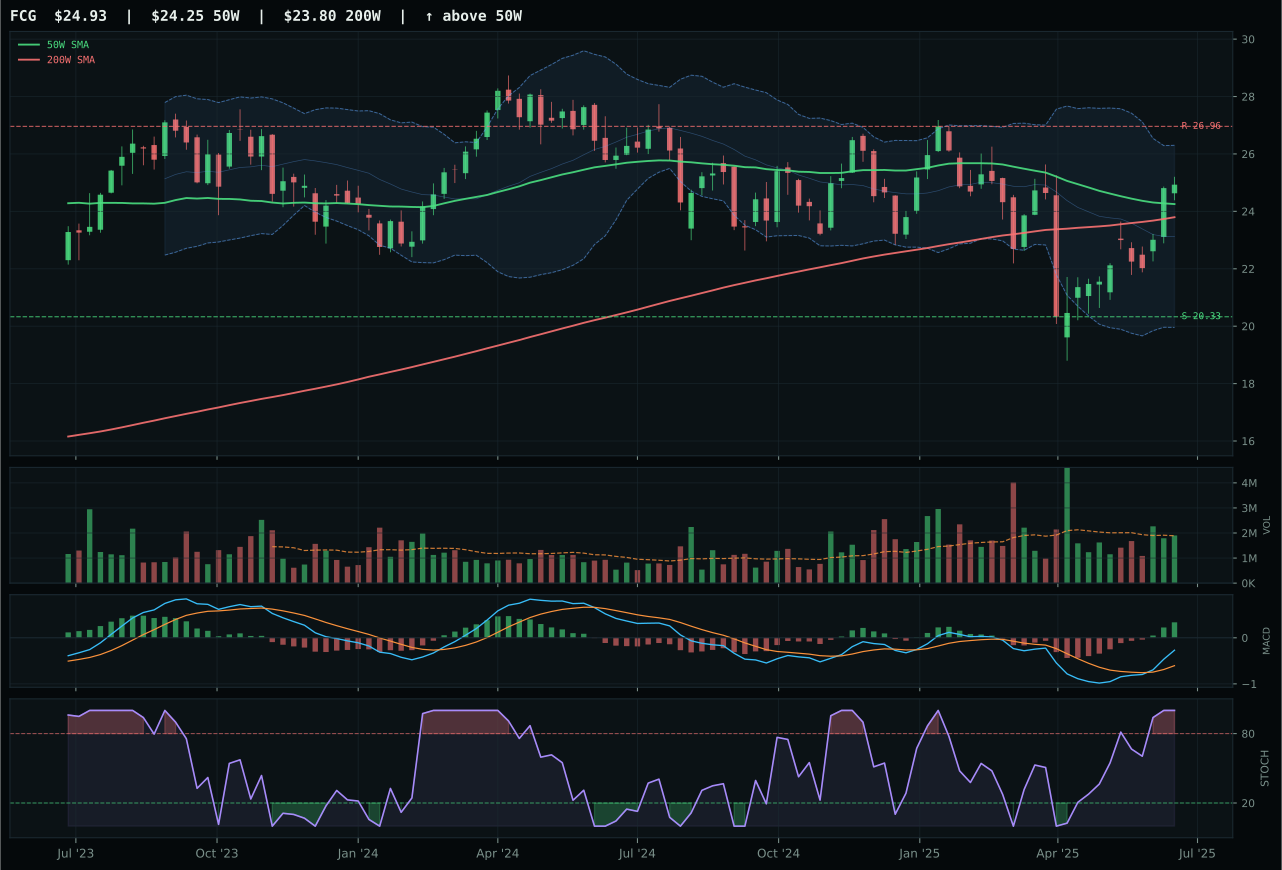
FCG has a compression near 50W profile with -4.6% 13-week relative strength versus SPY.
A failed hold above support would weaken the setup.
Actionable but governed by invalidation levels.
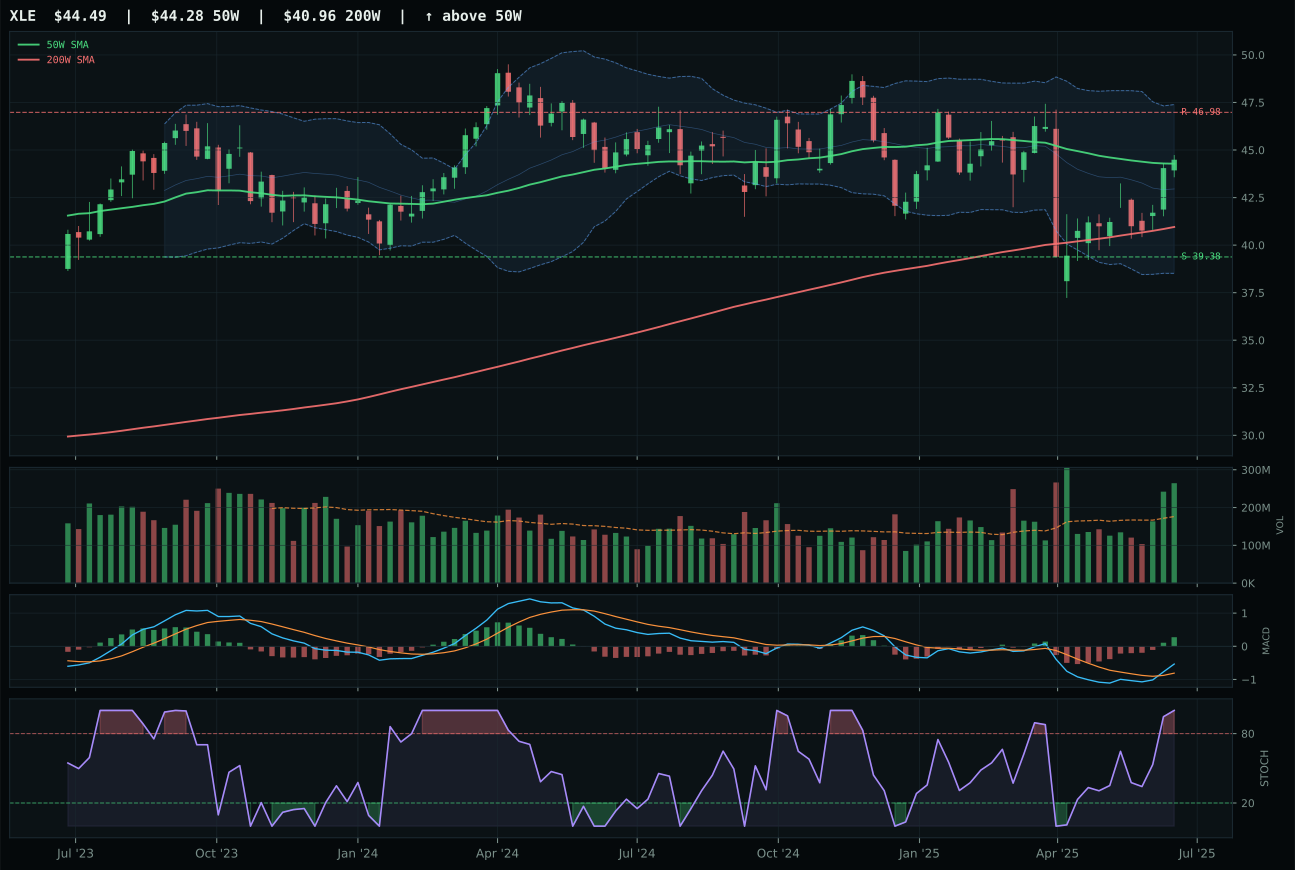
XLE has a compression near 50W profile with -9.2% 13-week relative strength versus SPY.
A failed hold above support would weaken the setup.
Actionable but governed by invalidation levels.
FCG won a weak category by posting a timing score of 100.0/100, a remarkable achievement for a stock group where both 13W and 26W returns lag peers badly. The setup near the 50W at 2.8% distance, combined with MACD bullish and improving and stochastic RSI overbought, created the tightest entry opportunity available. FCG's neutral volume at 1.01x the twenty-day average and compression structure at 76.3/100 positioned it for potential expansion if energy sentiment shifts. XOP technically outperformed in composite (81 vs 78) and its risk/reward was fractionally better (50.2), but the system selected FCG based on entry timing and mean-reversion setup quality. XOP's above-average participation (accumulation/confirmation) at face value looks constructive, but it also suggests that position-building has already occurred, making entry timing worse. XLE was disqualified by negative thirteen-week return of negative 3.8% and negative 9.2% SPY-relative weakness, which no timing score could overcome.
Traditional Energy received 5% allocation in tier-2, weighed down by a category macro fit of just 23.0/100, the lowest in the portfolio. Disinflation pressure subtracts ten basis points, and the energy category lacks any tailwind from active macro descriptors—it is purely a technical hold with no macro sponsorship. Real asset sponsorship adds seven basis points as a counterbalance, but credit stress and liquidity stress each subtract meaningful support. The portfolio is holding this position on the idea that FCG's exceptional timing (100.0/100) creates an entry point where risk/reward becomes asymmetric to the downside, but the category-level macro headwind is severe. FCG's thirteen-week return of only 0.8% and negative 4.6% SPY-relative strength confirm that energy is not leading this cycle. To upgrade Traditional Energy to tier-1, the system would need to see either a material shift in macro descriptors (real asset sponsorship becoming dominant as inflation reaccelerates) or a break of the 50W with sustained accumulation and positive 13W momentum. Until then, five percent represents a contrarian bet on mean-reversion and entry timing, not conviction about energy's direction.
Industrial Metals — COPX
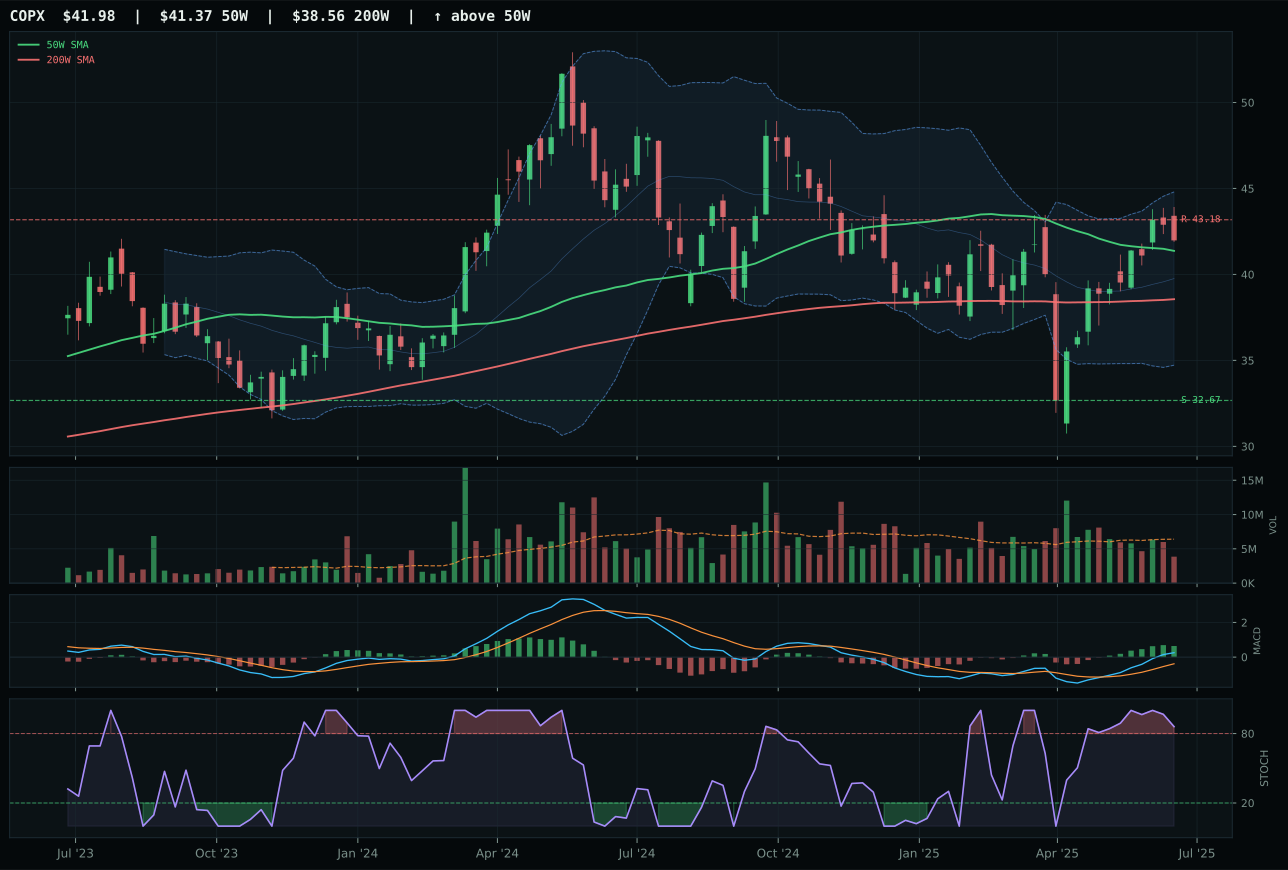
COPX has a compression near 50W profile with -4.8% 13-week relative strength versus SPY.
A failed hold above support would weaken the setup.
Actionable but governed by invalidation levels.
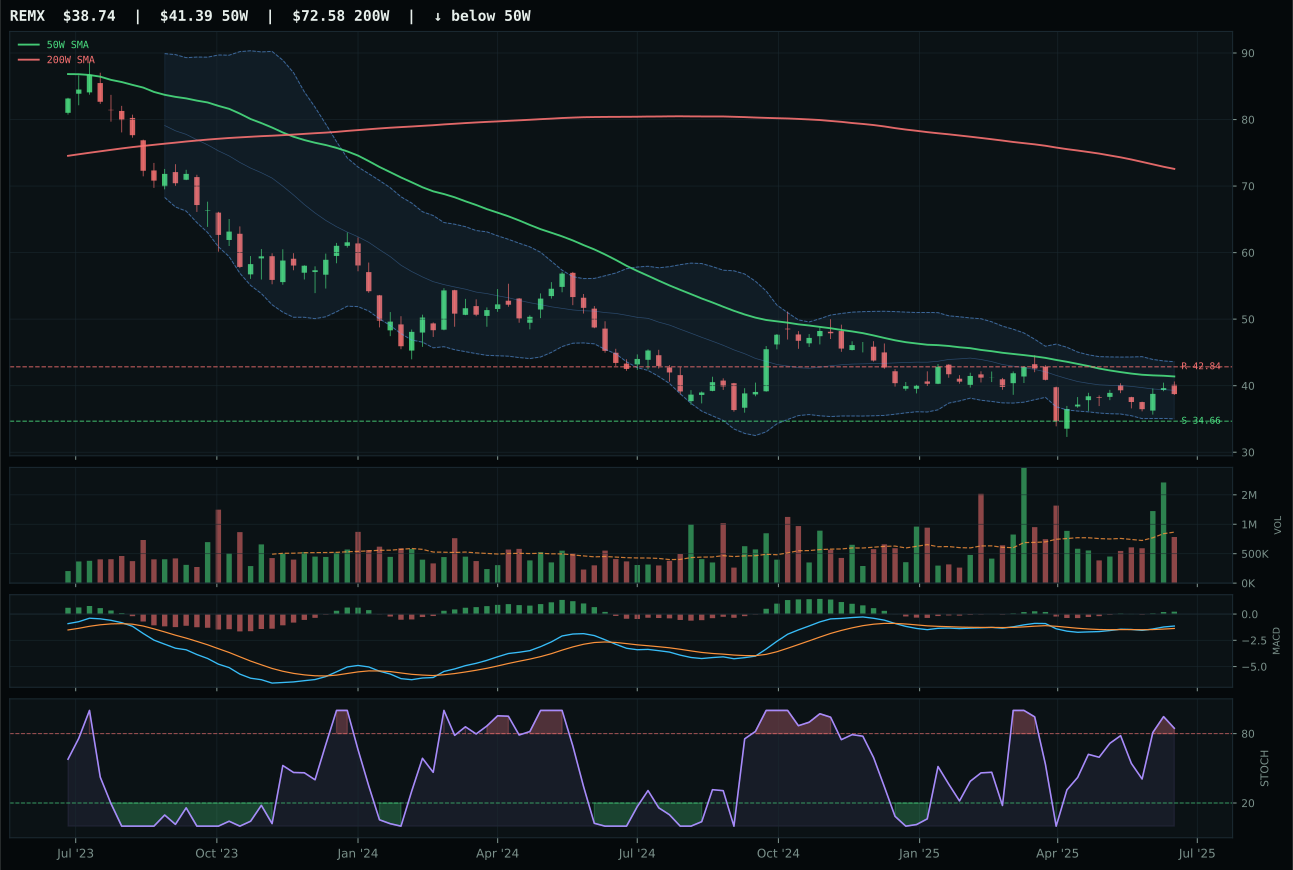
REMX has a neutral structure profile with -14.4% 13-week relative strength versus SPY.
Extension and support failure are the main tactical risks.
Tracked, but not top-2 eligible because: structurally broken.
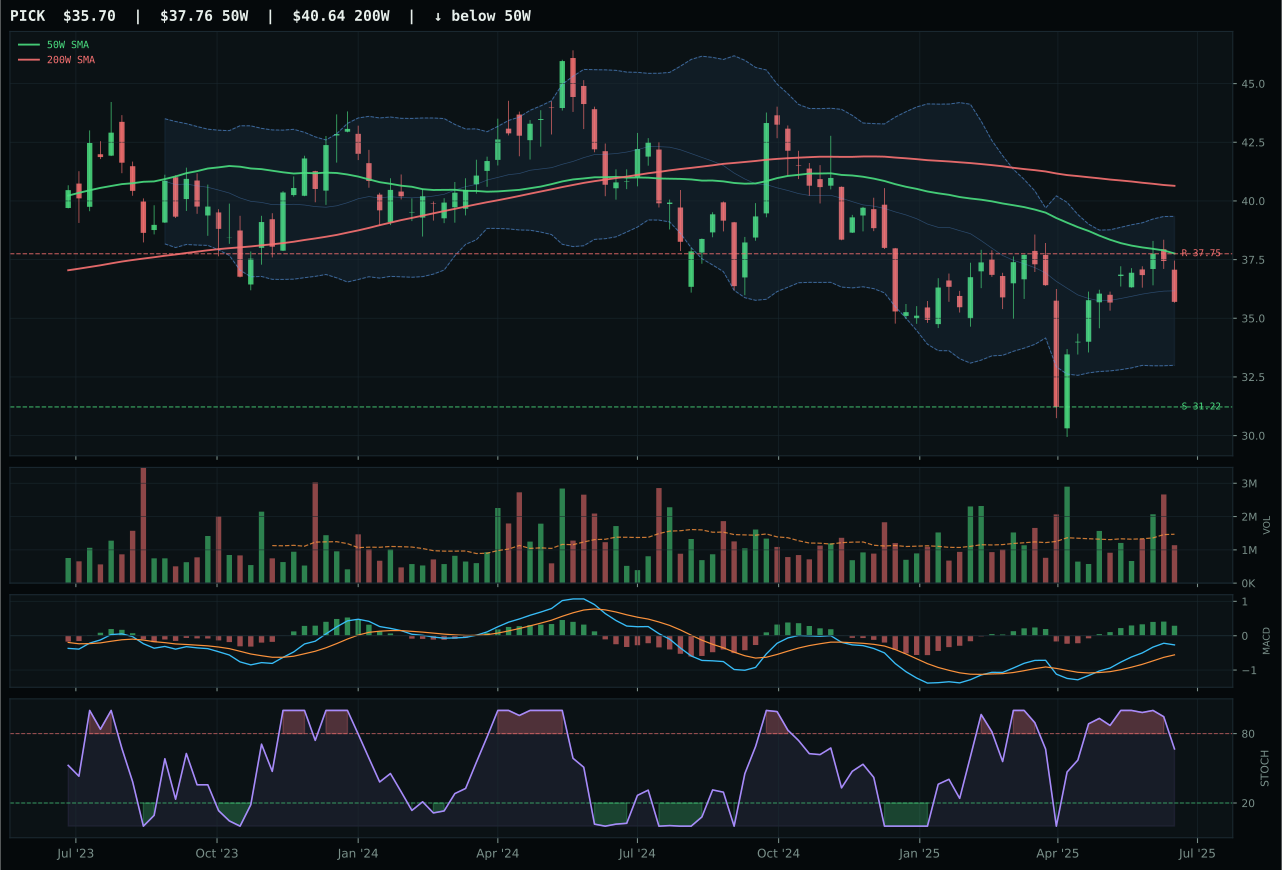
PICK has a neutral structure profile with -9.7% 13-week relative strength versus SPY.
Extension and support failure are the main tactical risks.
Tracked, but not top-2 eligible because: structurally broken.
COPX won a category plagued by poor technical and macro conditions, prevailing primarily on relative merit rather than absolute strength. Price is only 1.5% above the 50W with compression near 50W structure, which should be neutral, but at 0.60x the twenty-day average volume is thin participation—a red flag that suggests weak institutional sponsorship. COPX's thirteen-week return of 0.6% and negative 4.8% SPY-relative strength represent genuine weakness, but the timing score of 89.0/100 reflects its proximity to the 50W and Fibonacci decision zone at 0.382, preserving optionality if buyers step in. REMX and PICK both collapsed entirely: REMX has negative 14.4% SPY-relative strength, negative 9.0% thirteen-week return, and a composite technical score of only 26.4/100, disqualifying it on structural grounds. COPX's momentum confirmation of only 51.2/100 and volume-price confirmation of 49.9/100 reveal a setup held together by category-relative strength of 4.9% and the hope that compression near support will trigger expansion.
Industrial Metals earned 5% allocation in tier-2 standing, with a category score of 36.6 that masks genuinely weak technical conditions being held up by exceptional macro support. The category macro fit is 65.0/100, driven by metals scarcity (+14 basis points), commodity breadth positive (+10), and real asset sponsorship (+6)—offsetting liquidity stress and credit stress. In this disinflation regime, industrial metals are benefiting from supply-chain narratives and AI demand expectations that, for now, override poor relative strength against equities. COPX's allocation is a bet on the macro narrative, not on technical momentum. The thin participation in COPX's setup and its anemic thirteen-week return of 0.6% mean this position has no margin for error: if breadth deteriorates or the commodity-scarcity narrative falters, the category will contract sharply. To upgrade Industrial Metals to tier-1, we would need to see volume participation increase to at least neutral levels (1.0x twenty-day average), SPY-relative strength turn positive, or fresh institutional accumulation into the compression zone. As currently positioned, this is a small, macro-driven wager that does not yet have technical confirmation.
Agriculture & Livestock — MOO
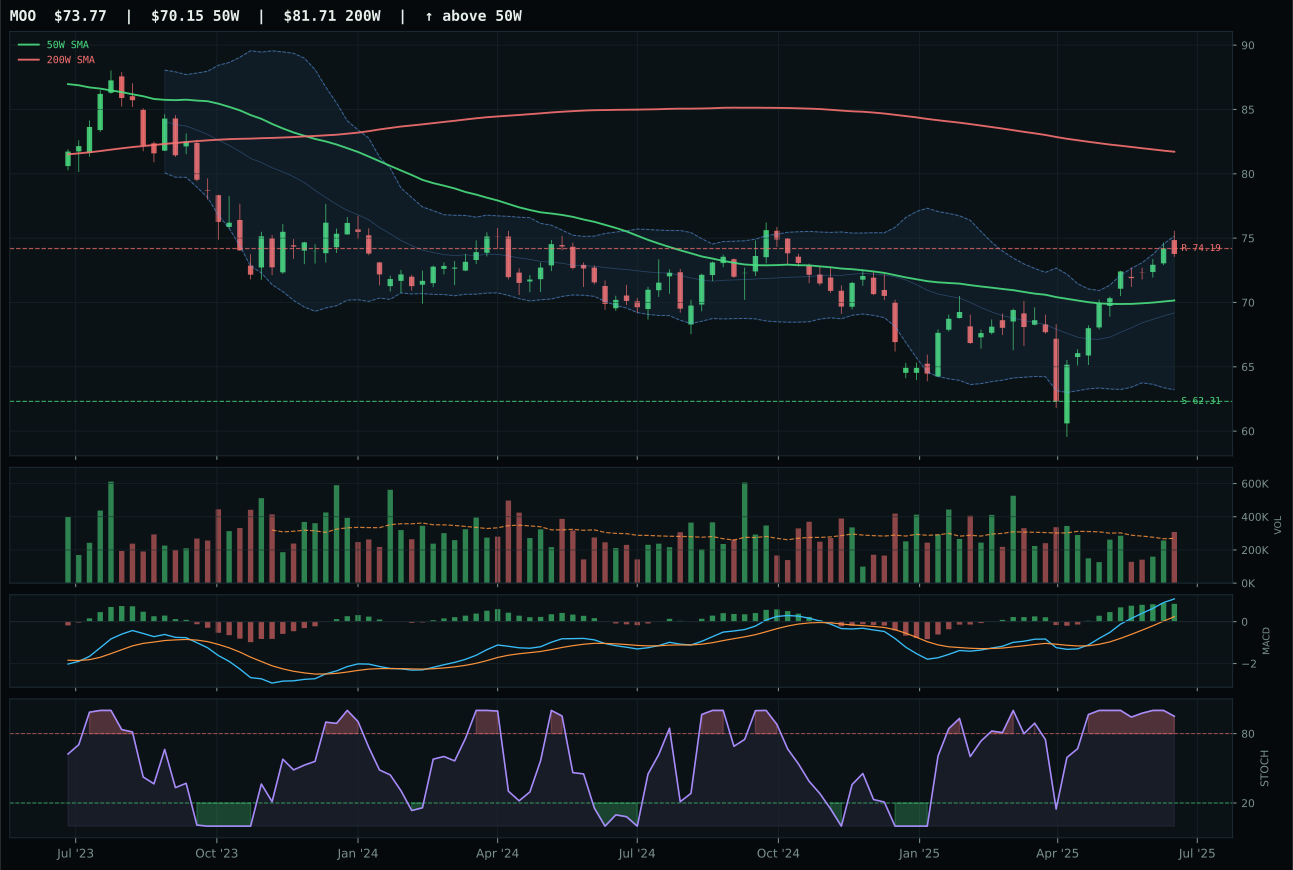
MOO has a neutral structure profile with 2.1% 13-week relative strength versus SPY.
A failed hold above support would weaken the setup.
Actionable but governed by invalidation levels.
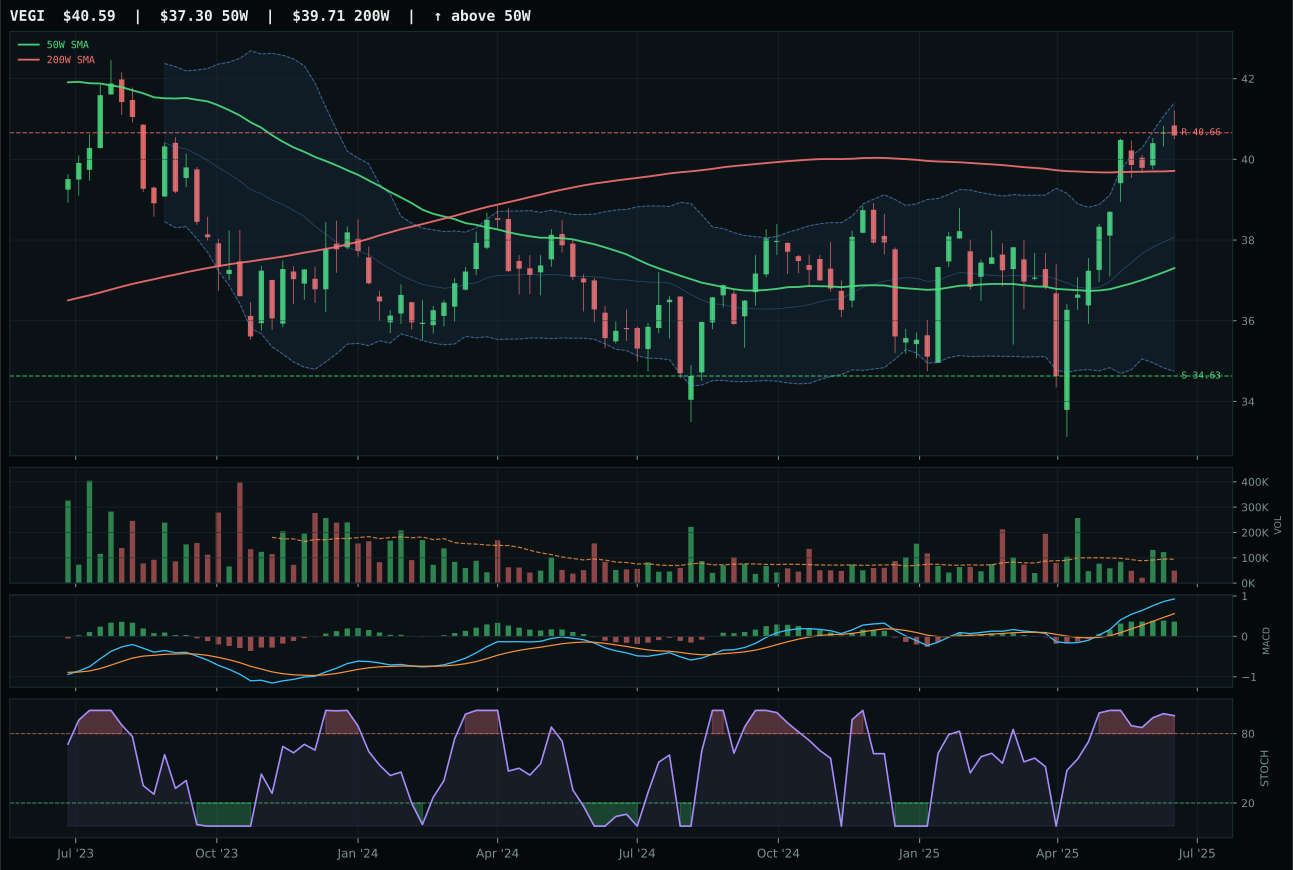
VEGI has a neutral structure profile with 4.1% 13-week relative strength versus SPY.
A failed hold above support would weaken the setup.
Tracked, but not top-2 eligible because: .
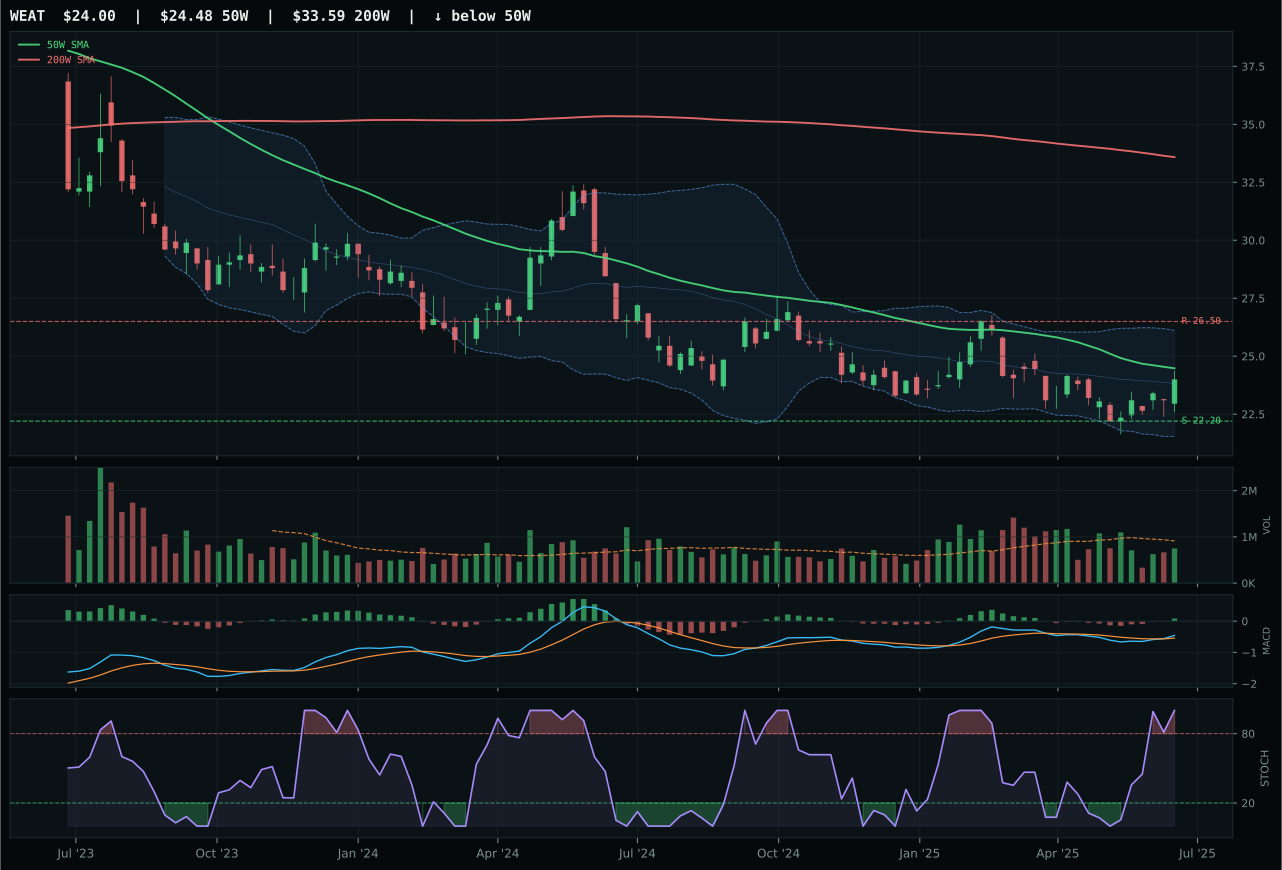
WEAT has a compression near 50W profile with -7.2% 13-week relative strength versus SPY.
Extension and support failure are the main tactical risks.
Tracked, but not top-2 eligible because: structurally broken.
MOO won a category that has earned zero allocation this week, defeating VEGI and WEAT on marginally less deteriorated technicals rather than any genuine strength. MOO's price above the 50W but still below the 200W, combined with neutral structure and above-average participation of 1.14x the twenty-day average, preserved a trend score of 83.2/100 that neither VEGI (fractured by thin participation) nor WEAT (collapsed entirely) could match. The category-relative strength of 0.0% alongside a mere 2.1% SPY-relative edge reveals an asset class offering no real outperformance sponsorship. VEGI lost ground on risk/reward (37.2 vs 45.5) and structure cleanliness (75.6 vs 82.7), while WEAT simply broke—down 1.8% over thirteen weeks with RS of negative 7.2% and MACD bullish only by technical definition, not by flow evidence. MOO's own momentum confirmation of 73.1/100 tells the true story: this is a bounce, not a resumption.
Agriculture & Livestock earned zero allocation this week, ranking ninth or tenth in the category hierarchy. The final score of 31.7 reflects a category-level macro fit of 45.0/100 that is actively hostile: disinflation pressure subtracts eight basis points, commodity breadth positive adds only five, and liquidity stress removes another four, creating a structural headwind that no single ETF can overcome. MOO's technical setup, while the best of three weak options, still only scores 66.7/100 on technical evidence—a threshold that cannot support allocation when macro conditions are this adverse. The macro regime penalizes real assets broadly right now, and Agriculture sits at the intersection of that penalty and weak relative strength versus equities. For this category to re-enter the portfolio, we would need either a persistent rally in commodity prices (currently signaled by breadth deterioration), a meaningful disinflation shock that reverses the current pressure, or MACD confirmation that suggests institutional accumulation rather than range-bound consolidation. None of these conditions are present. Zero percent is not pessimism; it is the rational response to a setup where risk has shifted unfavorably.
Emerging Markets — IEMG
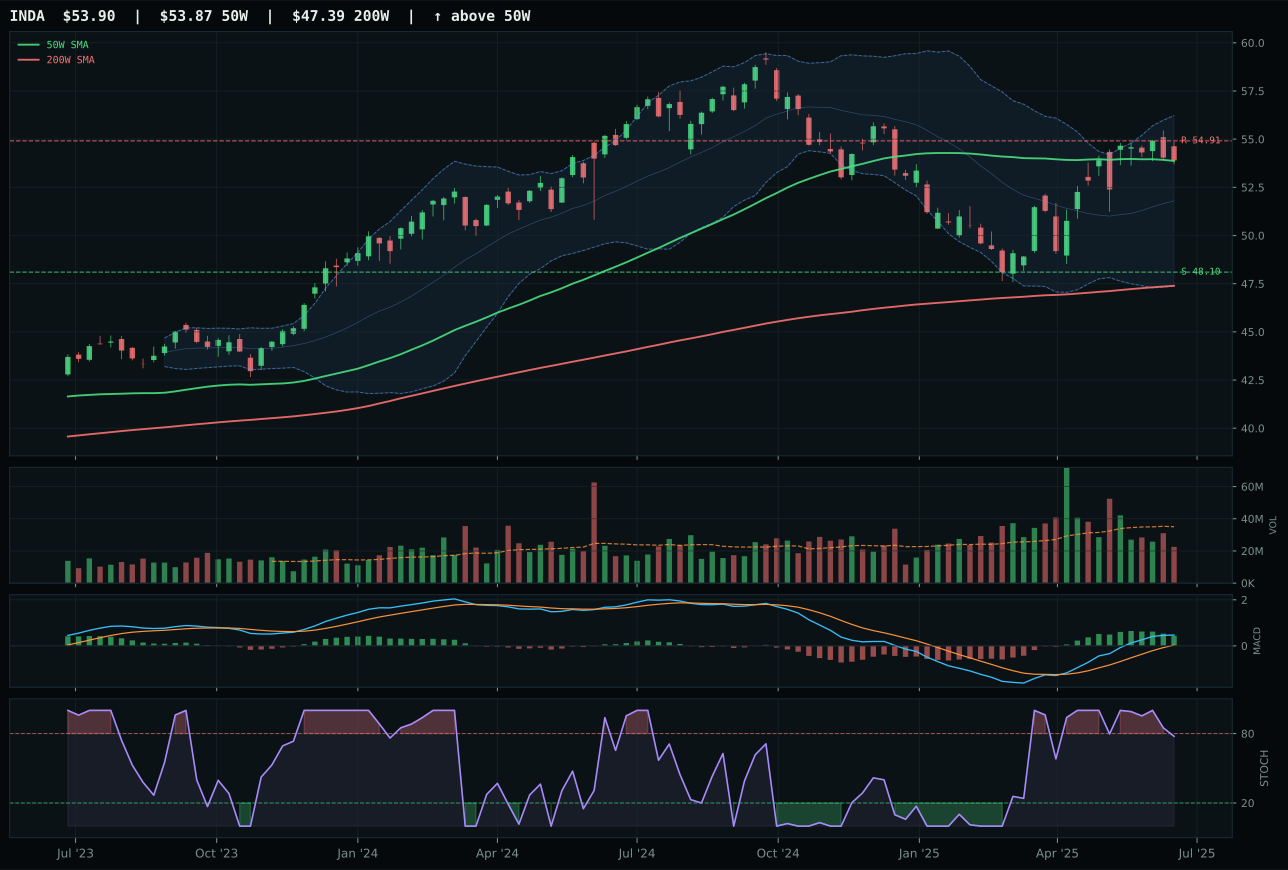
INDA has a compression near 50W profile with -0.7% 13-week relative strength versus SPY.
A failed hold above support would weaken the setup.
Actionable but governed by invalidation levels.
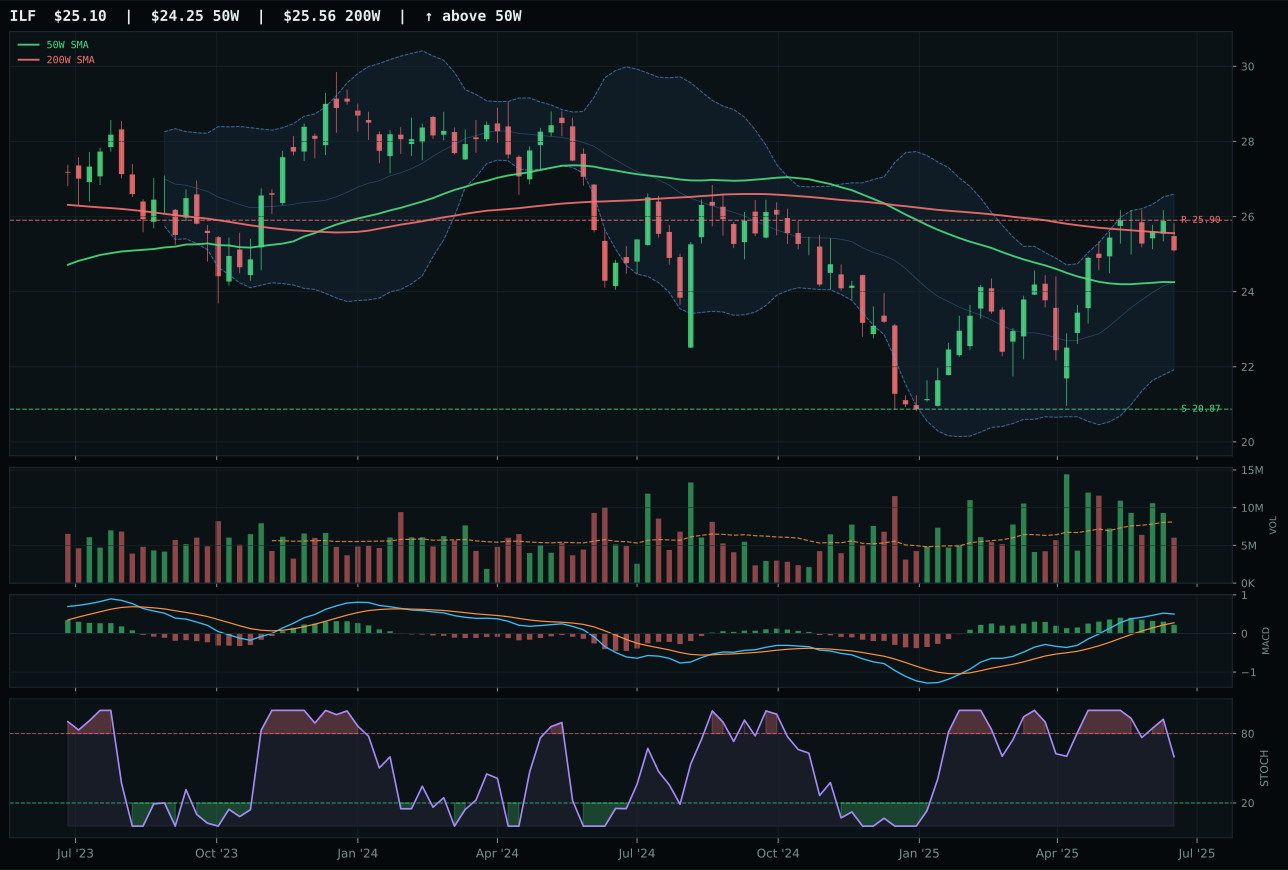
ILF has a neutral structure profile with -1.6% 13-week relative strength versus SPY.
A failed hold above support would weaken the setup.
Actionable but governed by invalidation levels.
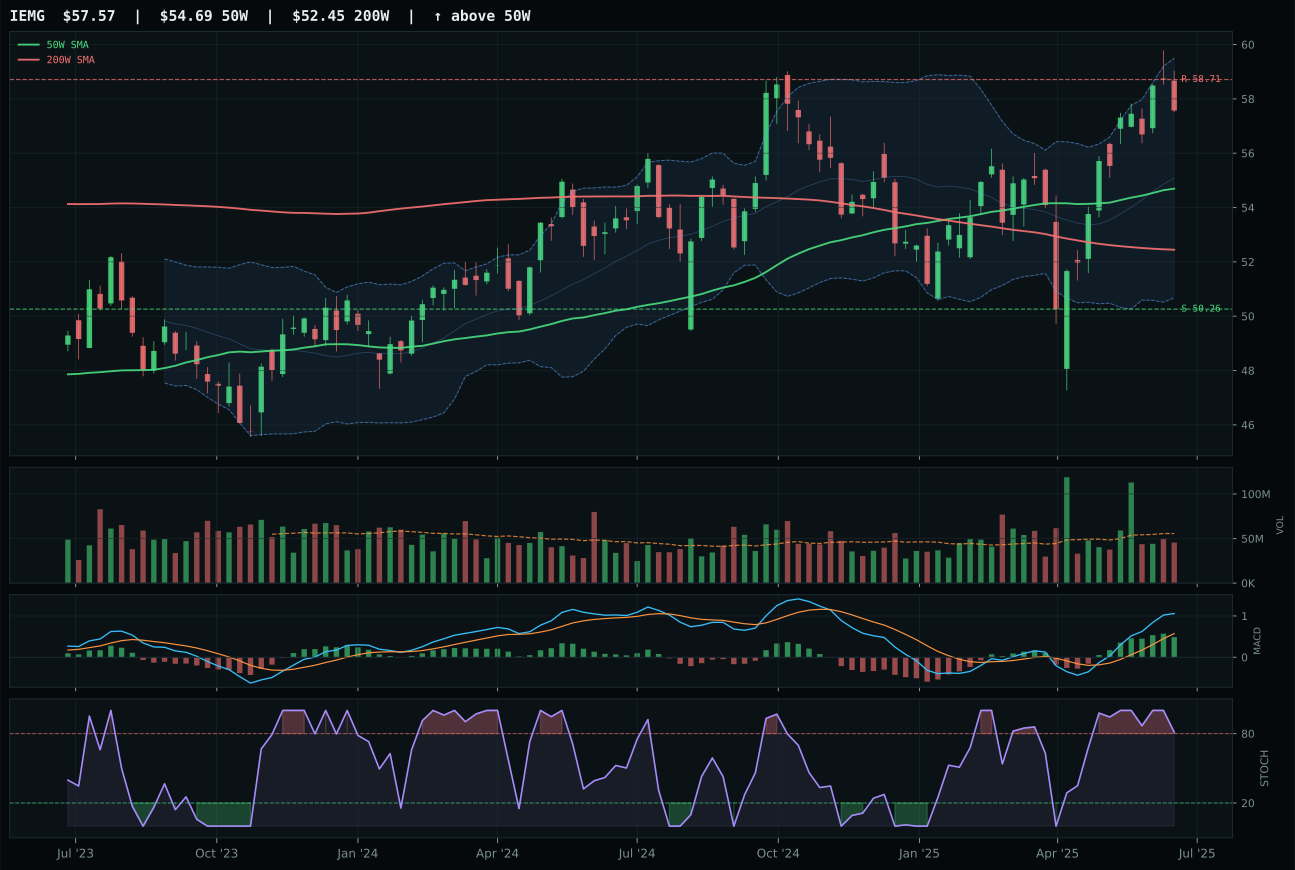
IEMG has a neutral structure profile with -0.9% 13-week relative strength versus SPY.
A failed hold above support would weaken the setup.
Actionable but governed by invalidation levels.
IEMG won a category assigned zero allocation by posting a composite technical score of 69/100 versus INDA's 78/100, a reversal driven by stronger MACD confirmation (bullish and improving vs. bullish but flattening) and neutral volume versus thin participation. IEMG's thirteen-week return of 4.5% and neutral SPY-relative strength of negative 0.9% are pedestrian, but the structure at 77.3/100 is cleanest among the three options, with 83.0% compression and support at 50.26. INDA's compression setup near the 50W and falling stochastic RSI signal a loss of momentum despite stronger recent returns; it looks like a reversion trade rather than a continued trend. ILF was disqualified by trend collapse at 54/100 with negative 1.6% SPY-relative strength and negative 3.8% thirteen-week return. IEMG's victory means little when the category itself scores only 30.1 and earns no allocation.
Emerging Markets earned zero allocation this week, ranking ninth or tenth in the portfolio with a devastating category macro fit of 38.0/100. Credit stress and liquidity stress each subtract ten basis points, creating a combined negative twenty-basis-point drag that no amount of positive risk appetite can overcome. The macro regime is actively hostile to emerging-market exposure; disinflation, risk-off credit conditions, and liquidity concerns have made EM the worst-performing category in this allocation cycle. IEMG's technical evidence of 59.1/100, while the best available in the category, is below the threshold needed to justify allocation when macro conditions are this adverse. The portfolio would need to see a material reversal in credit or liquidity stress—i.e., a Fed pivot or a meaningful improvement in financial conditions—before emerging markets re-enter the allocation. For now, zero percent is the appropriate response: no allocation to a category offering no relative strength, no macro sponsorship, and no technical setup compelling enough to override the structural headwinds. This is not a permanent exclusion, but rather a recognition that capital is better deployed into categories with both technical and macro tailwinds.