
2025-06-13
Informational purposes only. The content in this report, including allocations, analysis, and commentary, is provided solely for informational and educational purposes. It does not constitute financial advice, investment advice, trading advice, or any other type of advice. Past performance does not guarantee future results. Always conduct your own research and consult a qualified financial professional before making investment decisions.
Weekly Allocation
| Ticker | Category | Weight | Role |
|---|---|---|---|
| FBTC | 50% | Overlay | |
| SLV | Precious Metals | 10% | Top-2 (10%) |
| URA | Nuclear Energy | 10% | Top-2 (10%) |
| XLK | Technology | 5% | Tier-2 (5%) |
| SMH | AI | 5% | Tier-2 (5%) |
| IGF | Utilities & Infrastructure | 5% | Tier-2 (5%) |
| ITA | Defense & Aerospace | 5% | Tier-2 (5%) |
| FCG | Traditional Energy | 5% | Tier-2 (5%) |
| COPX | Industrial Metals | 5% | Tier-2 (5%) |
Trade Instructions — Monday Open
Sell the tranche from 2025-05-16 (completing its 4-week hold). Buy the new tranche. Instructions show net portfolio changes — same-asset positions cancel, weight changes show the delta.
| Action | Ticker | Instruction |
|---|---|---|
| SELL | PAVE | Sell 50% of PAVE position (reduce 5.00% → 2.50%) |
| SELL | GLD | Sell 33% of GLD position (reduce 7.50% → 5.00%) |
| SELL | ILF | Sell entire ILF position (1.25% of portfolio) |
| SELL | XAR | Sell 50% of XAR position (reduce 2.50% → 1.25%) |
| BUY | URA | Buy URA — 16.67% of freed cash (adds 1.25% to portfolio) |
| BUY | ITA | Buy ITA — 16.67% of freed cash (adds 1.25% to portfolio) |
| BUY | SLV | Buy SLV — 33.33% of freed cash (adds 2.50% to portfolio) |
| BUY | IGF | Buy IGF — 16.67% of freed cash (adds 1.25% to portfolio) |
| BUY | FCG | Buy FCG — 16.67% of freed cash (adds 1.25% to portfolio) |
Current Portfolio After Trade
Combined holdings across all 4 active tranches. Each tranche is 25% of the portfolio.
| Ticker | % of Portfolio | Weight Bar |
|---|---|---|
| FBTC | 50.00% | |
| XLK | 6.25% | |
| URA | 6.25% | |
| GLD | 5.00% | |
| SMH | 5.00% | |
| COPX | 5.00% | |
| SLV | 5.00% | |
| IEMG | 3.75% | |
| ITA | 3.75% | |
| XLU | 3.75% | |
| PAVE | 2.50% | |
| XAR | 1.25% | |
| IGF | 1.25% | |
| FCG | 1.25% |
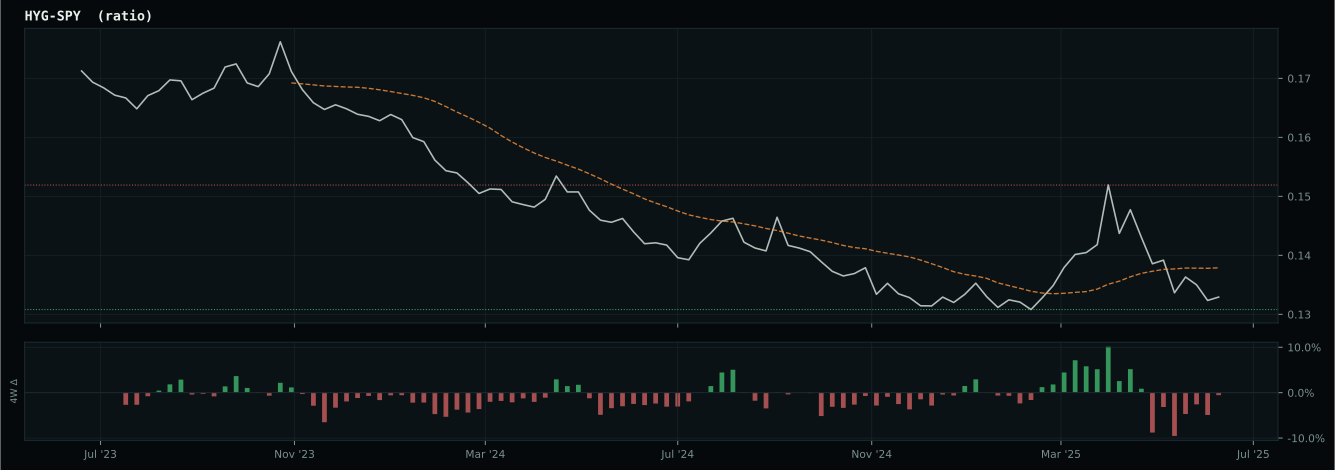
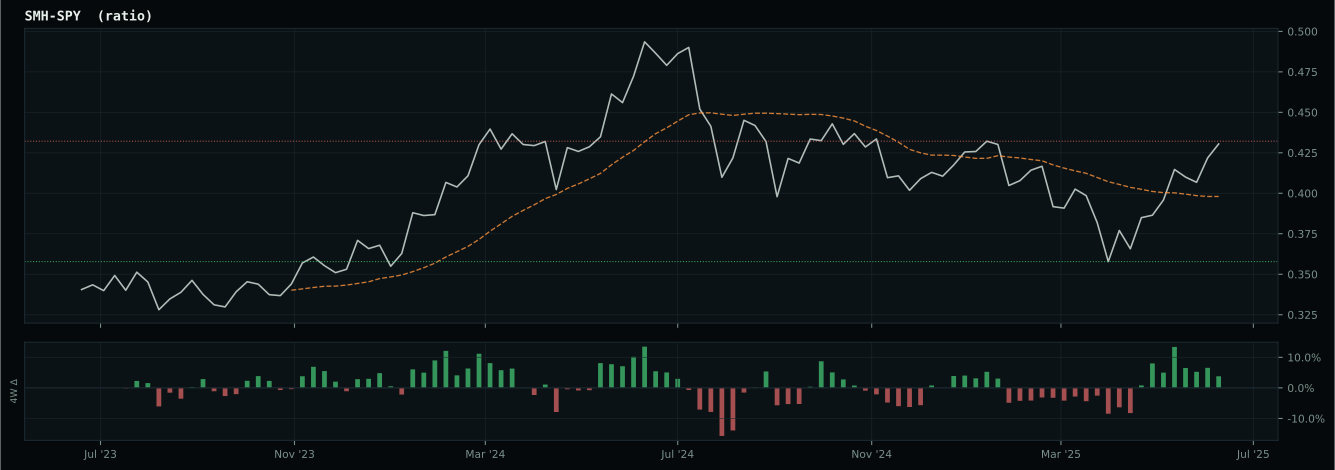
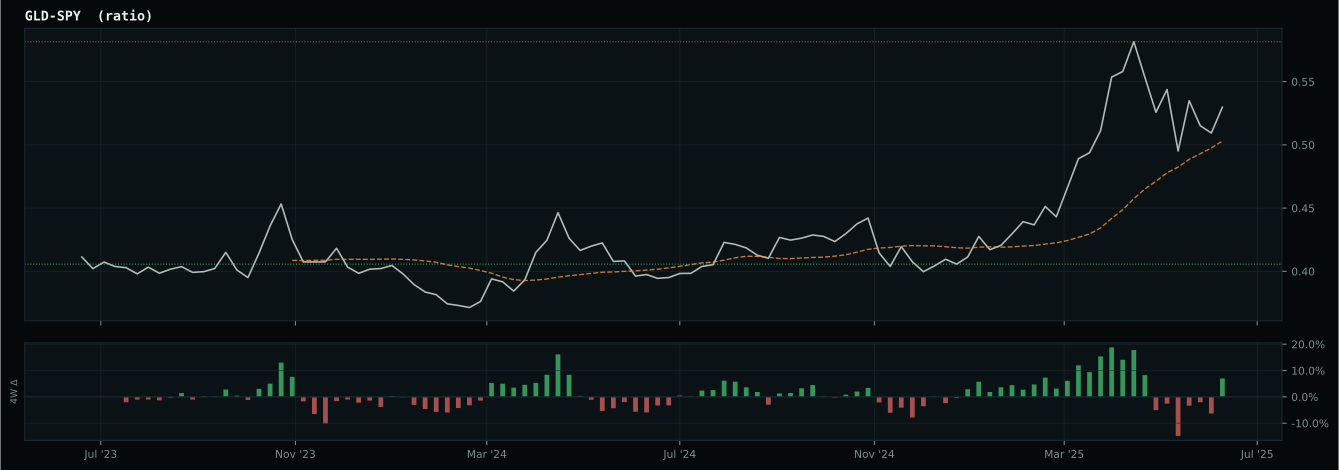
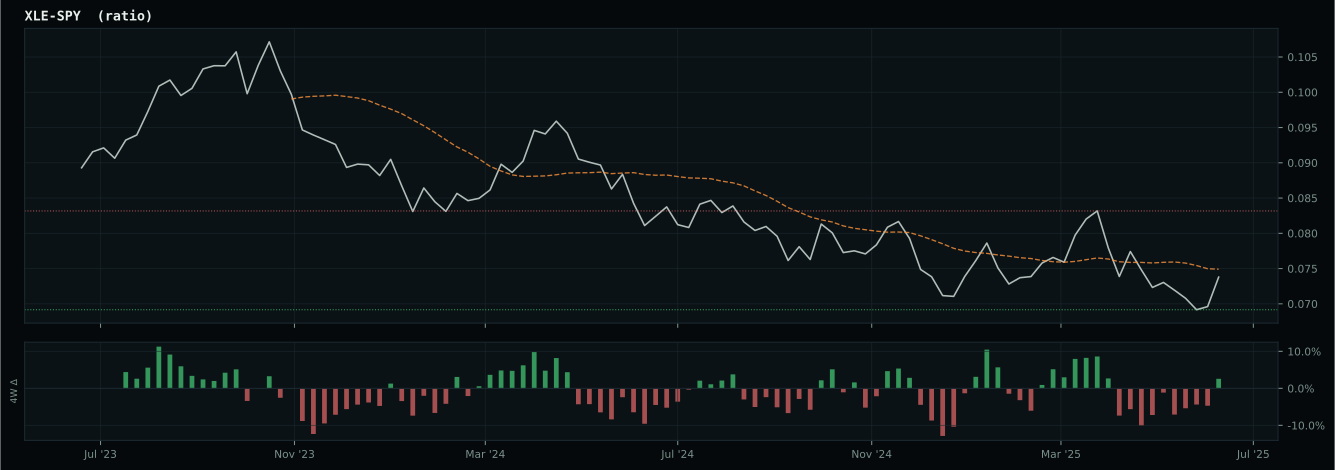
Macro Regime — Disinflation
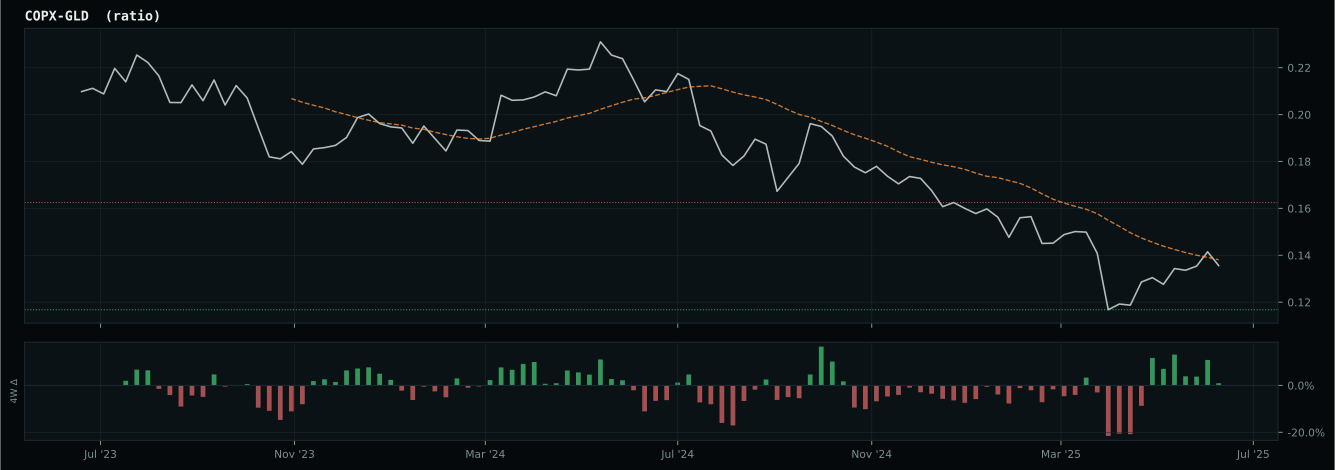
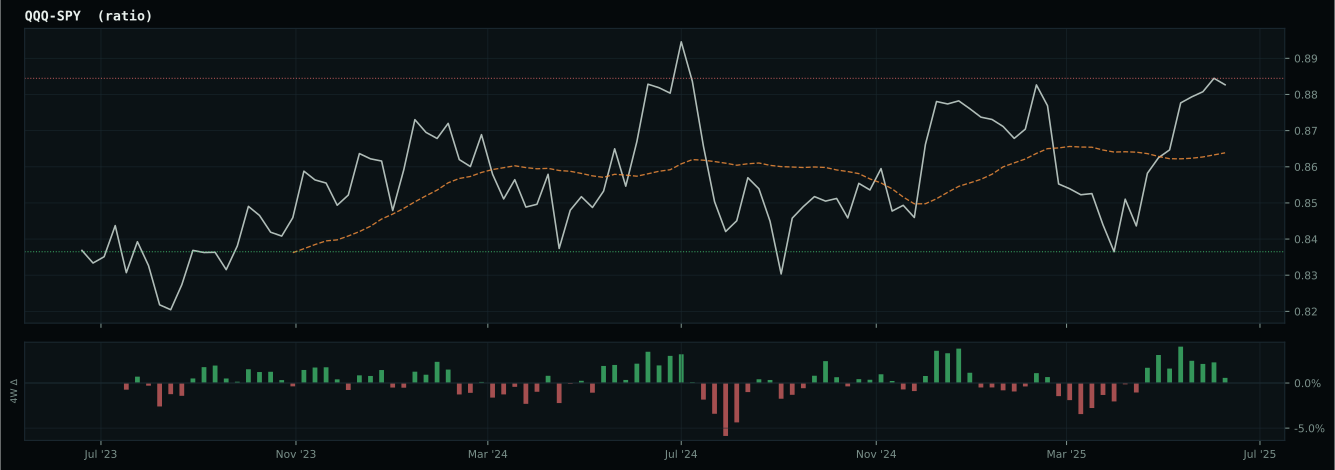
Macro Evidence Charts
Market-implied signals behind the macro regime scores. Each ratio compares two assets; the direction and slope of the ratio is what the macro engine reads.
Crypto Regime — TrendBTC
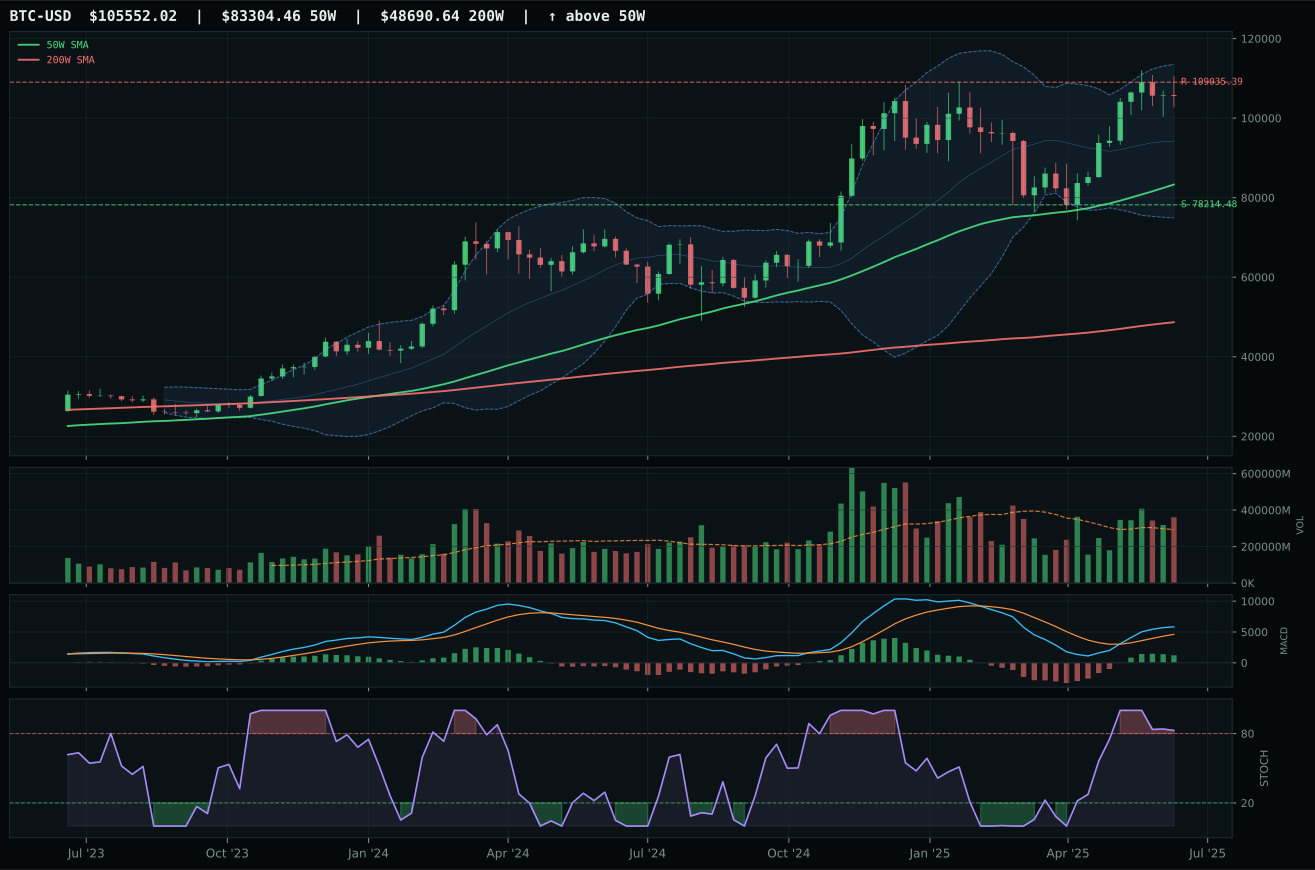
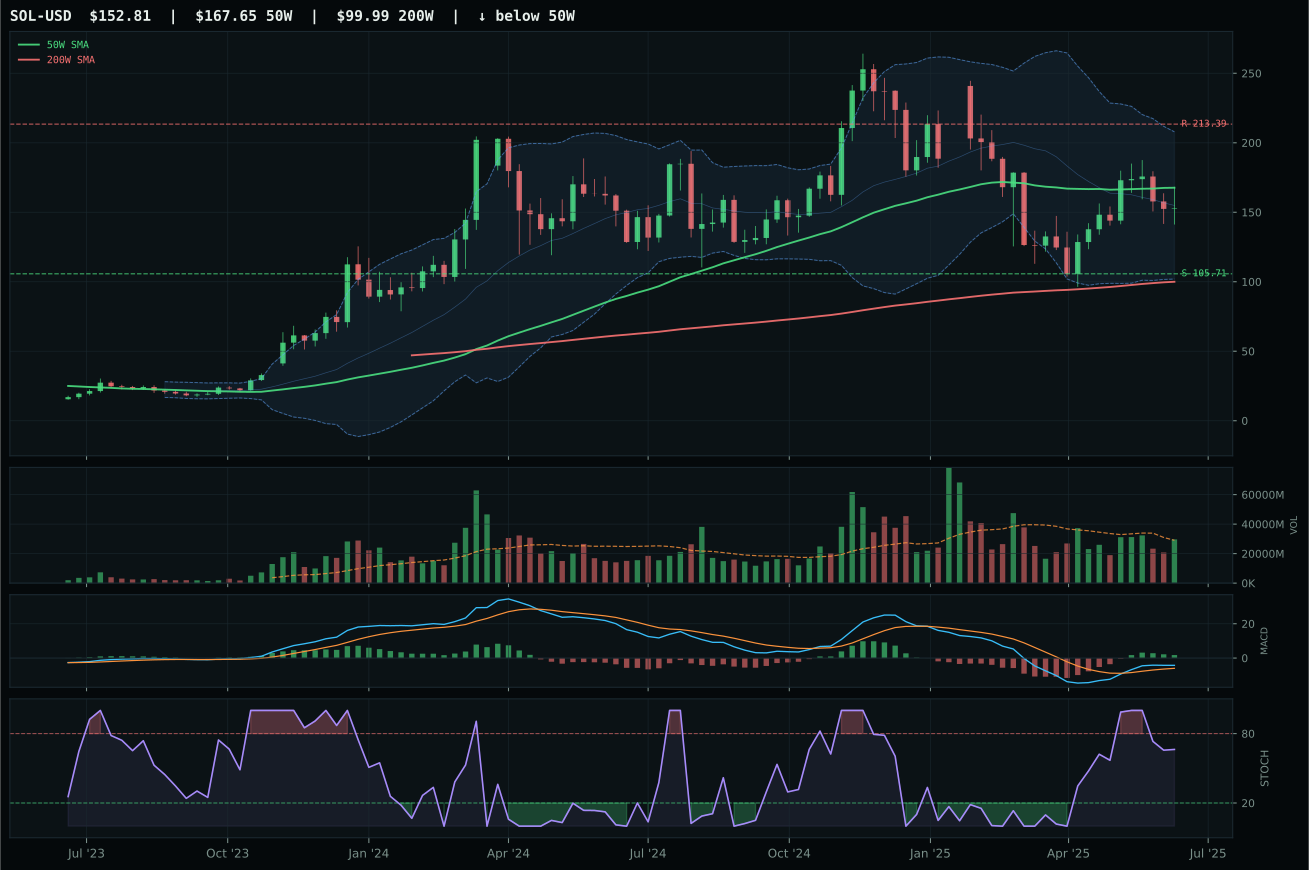
ValueBTC not armed: BTC has not made the first post-breakdown touch of the 200W buy zone after losing the 50W
TrendBTC confirmed: 2 consecutive closes above rising/flat 50W SMA
one or more available conditions failed
Category Rankings
| Rank | Category | Winner | Score | Alloc | 4W Ret | Peers (4W) |
|---|---|---|---|---|---|---|
| 1 | Precious Metals | SLV | 77.0 | 20% | +6.40% | GDX -2.4% · GLD -1.8% |
| 2 | Nuclear Energy | URA | 73.7 | 20% | -1.75% | URNM -0.2% · NLR -1.3% |
| 3 | Technology | XLK | 67.0 | 10% | +6.07% | IGV +0.9% · CIBR -0.8% |
| 4 | AI | SMH | 67.0 | 10% | +10.13% | AIQ +3.0% · BOTZ +2.9% |
| 5 | Utilities & Infrastructure | IGF | 63.8 | 10% | -0.41% | PAVE +5.9% · XLU +0.7% |
| 6 | Defense & Aerospace | ITA | 57.6 | 10% | +5.08% | XAR +6.4% · ROKT +8.3% |
| 7 | Traditional Energy | FCG | 36.4 | 10% | -2.84% | XOP +0.6% · XLE +1.3% |
| 8 | Industrial Metals | COPX | 35.9 | 10% | +3.36% | REMX +16.7% · PICK +6.4% |
| 9 | Emerging Markets | IEMG | 32.4 | 0% | +2.47% | INDA +0.4% · ILF -0.3% |
| 10 | Agriculture & Livestock | MOO | 29.6 | 0% | -0.47% | VEGI -0.5% · WEAT -1.3% |
Precious Metals — SLV
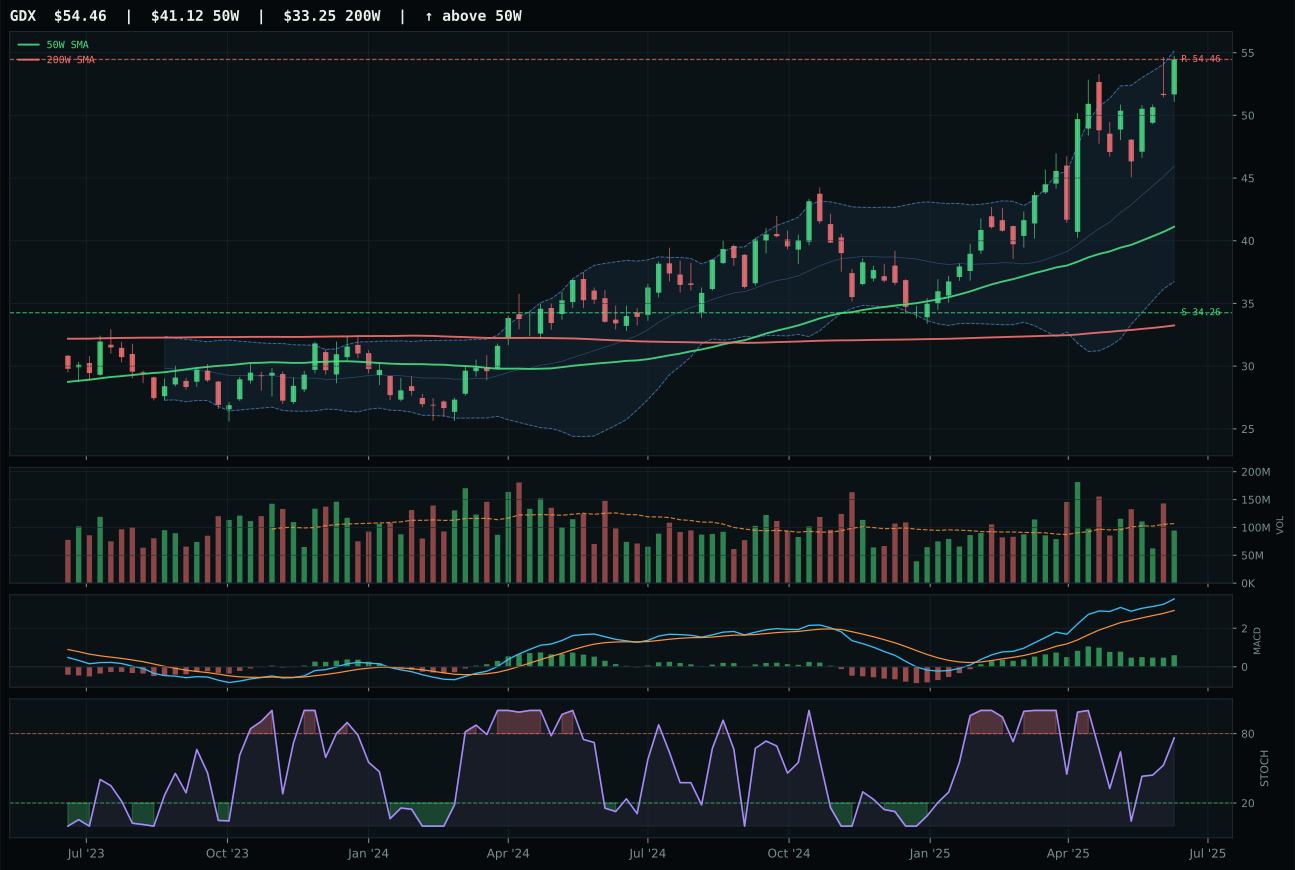
GDX has a vertical extension profile with 18.7% 13-week relative strength versus SPY.
A failed hold above support would weaken the setup.
Actionable but governed by invalidation levels.
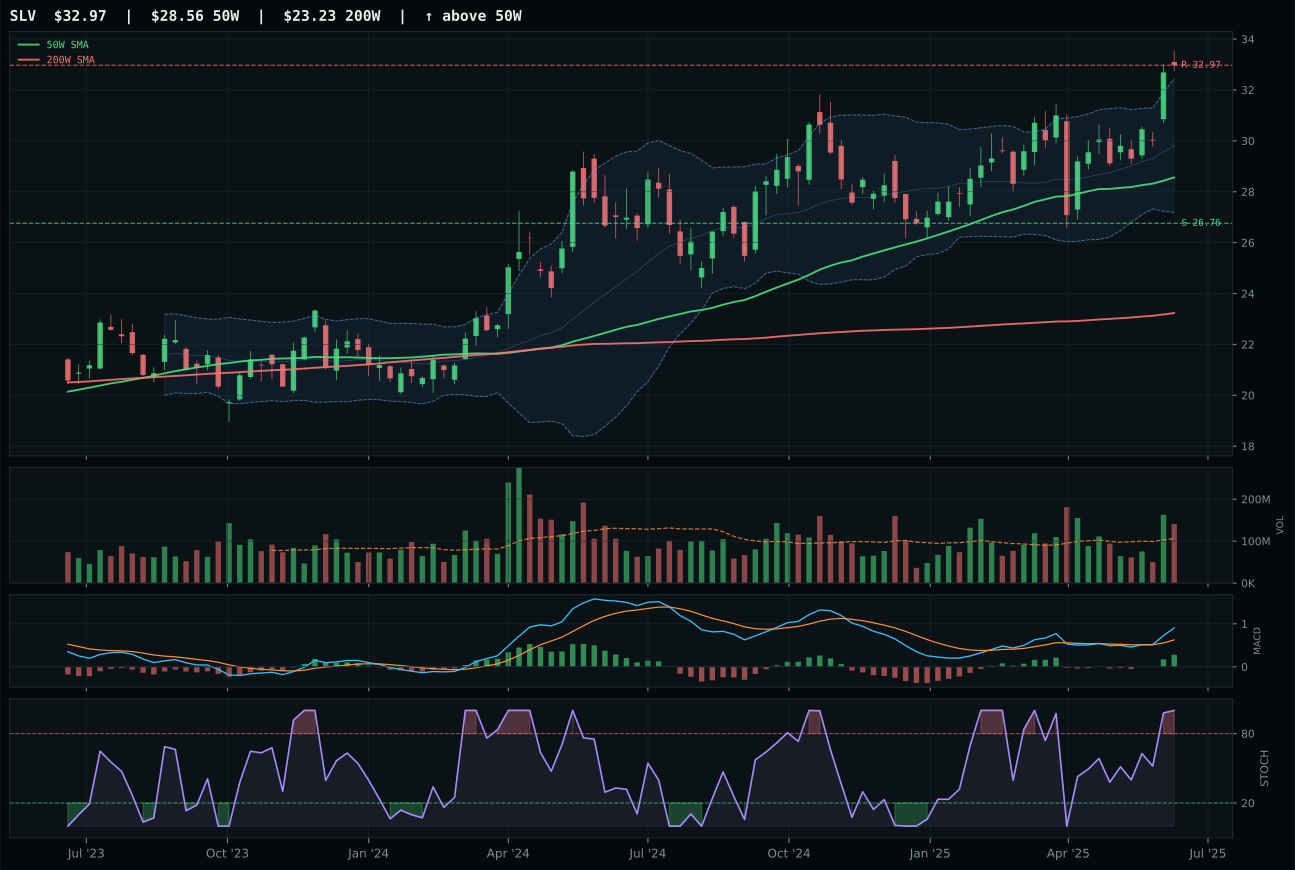
SLV has a vertical extension profile with 1.3% 13-week relative strength versus SPY.
A failed hold above support would weaken the setup.
Actionable but governed by invalidation levels.
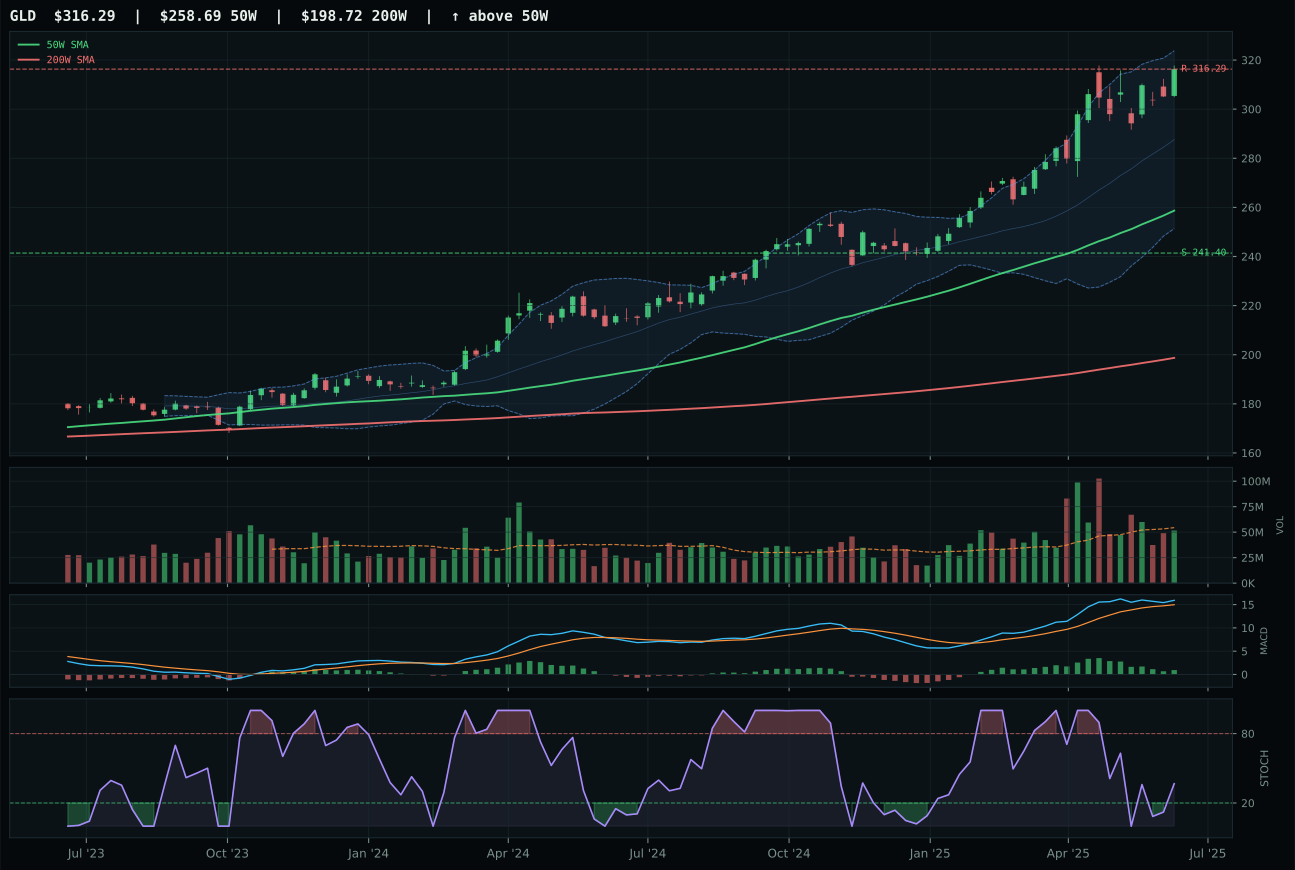
GLD has a vertical extension profile with 8.8% 13-week relative strength versus SPY.
A failed hold above support would weaken the setup.
Actionable but governed by invalidation levels.
Precious Metals earned a top-2 overweight allocation of 10% because its category score of 77.0 ranked among the two highest eligible categories this week, driven by exceptional macro alignment and clean technical confirmation. The monetary hedge bid is active (+14), disinflation helps the category (+8), and metals scarcity is active (+7), creating a 29-point net macro tailwind that directly addresses portfolio hedging needs in a rising real-yield environment. SLV's volume-price confirmation of 64.1 and above-average participation prove the setup is not a false breakout but rather the beginning of institutional positioning into precious metals as a monetary insurance asset. The category's 74.0 macro fit combined with 77.0 technical score reflects a rare alignment: the chart is extended, yet the thesis is sound because the extension is built on volume accumulation. For allocation purposes, the 10% commitment reflects conviction that the monetary regime is shifting and SLV's entry quality—while not pristine—is acceptable given the macro urgency. The allocation assumes no pullback and builds exposure gradually as prices reset to risk-reward equilibrium.
Nuclear Energy — URA
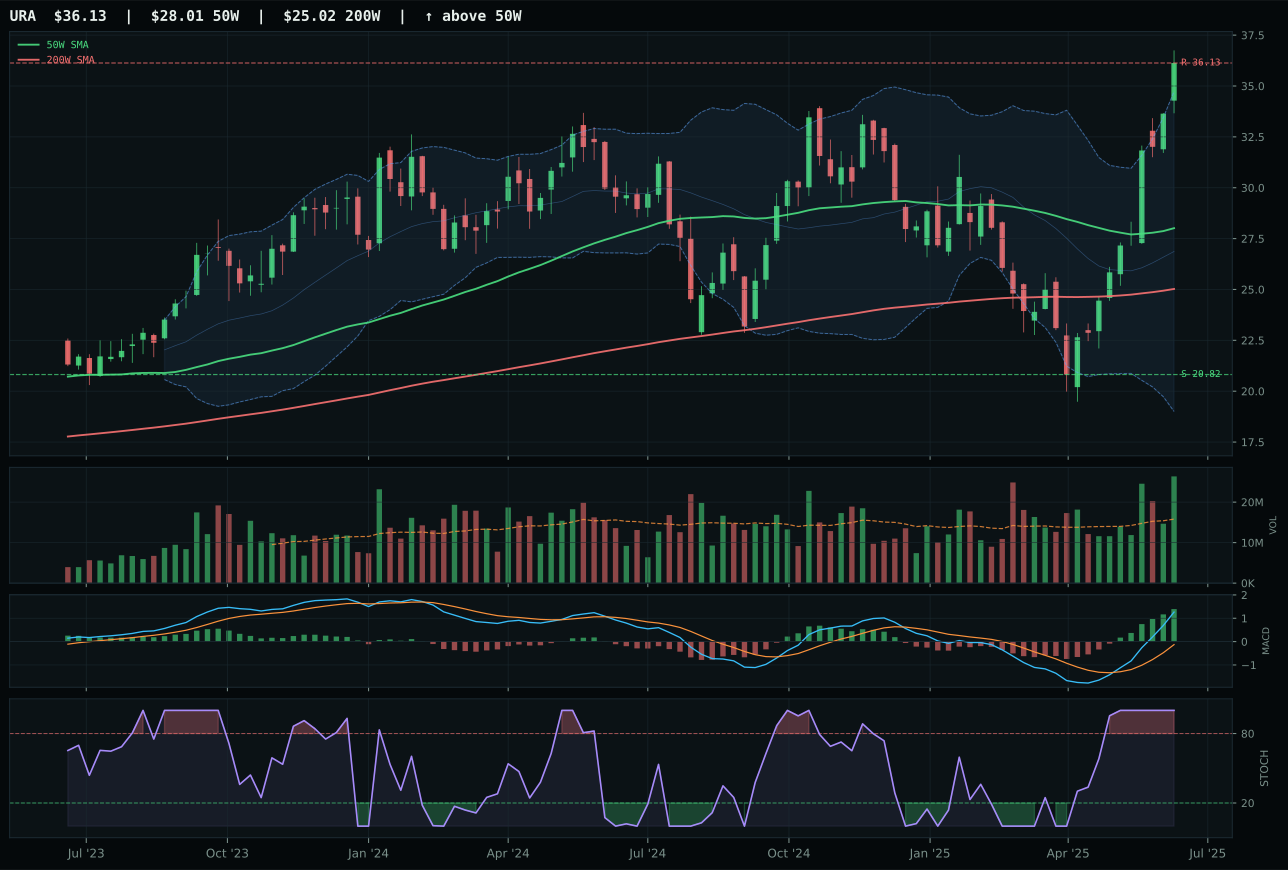
URA has a vertical extension profile with 45.1% 13-week relative strength versus SPY.
A failed hold above support would weaken the setup.
Actionable but governed by invalidation levels.
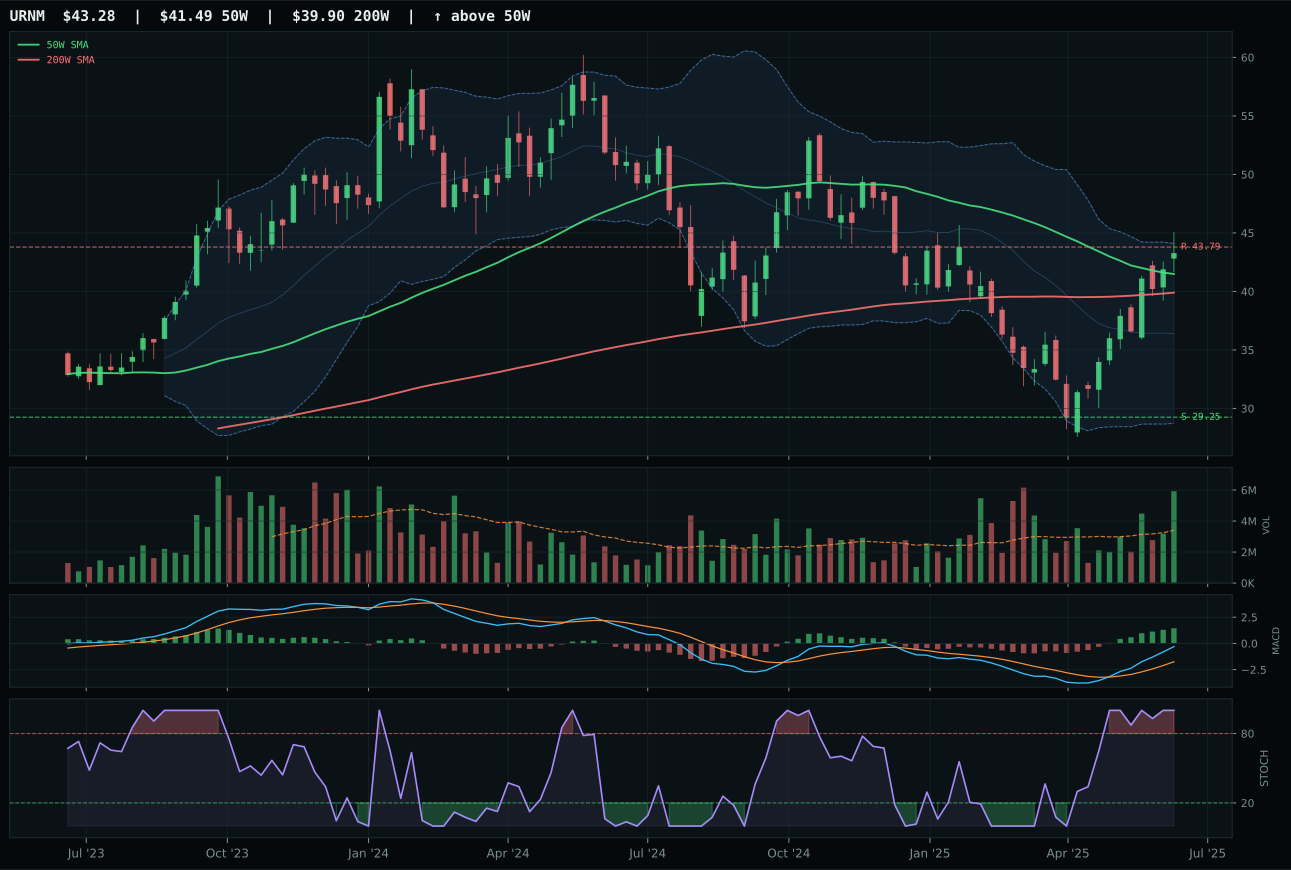
URNM has a neutral structure profile with 23.7% 13-week relative strength versus SPY.
A failed hold above support would weaken the setup.
Actionable but governed by invalidation levels.
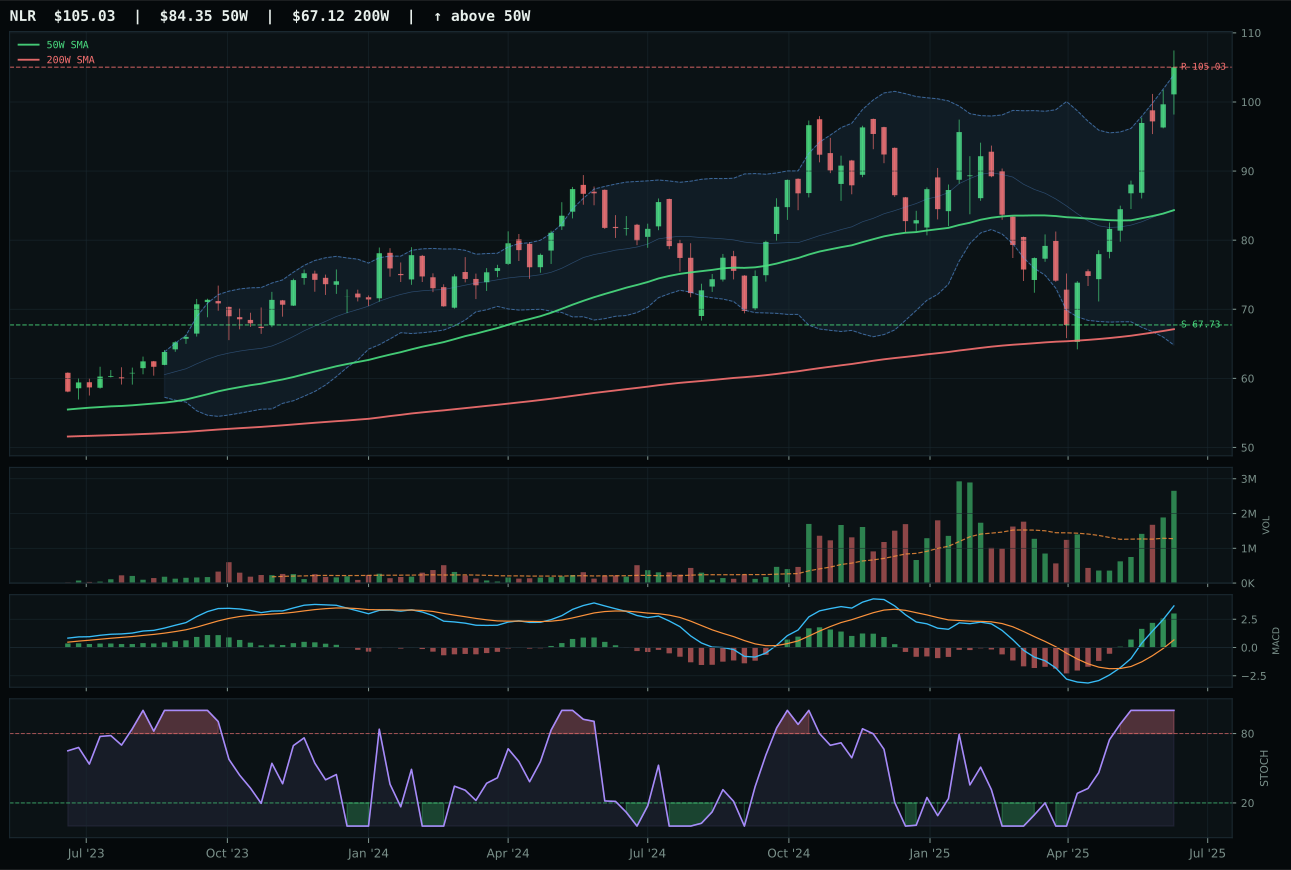
NLR has a vertical extension profile with 29.6% 13-week relative strength versus SPY.
A failed hold above support would weaken the setup.
Actionable but governed by invalidation levels.
Nuclear Energy earned a top-2 overweight allocation of 10% because its category score of 73.7 ranked among the two highest this week, despite macro fit of only 50.0 that offers no structural tailwind. The decision rests entirely on technical evidence: URA's 100.0 technical score is the highest in the entire portfolio, combining perfect trend confirmation (100.0), flawless volume-price sponsorship (99.4), and maximum persistence (100.0) with legitimate entry quality despite the 29.0% extension. Real asset sponsorship is active (+7), providing a thin rationale for the macro case, but the true allocation driver is that URA is the only name in the portfolio demonstrating textbook institutional accumulation at scale. The 1.67x above-average volume and accumulation/confirmation phase signal that the move has money behind it, not just momentum. For a 10% commitment to feel comfortable, the macro regime would need to pivot toward real asset demand, but the portfolio is allocating based on technical proof rather than waiting for narrative confirmation. This reflects conviction that uranium's supply scarcity will dominate risk appetite cycles, making URA the portfolio's purest real asset levered to that thesis.
Technology — XLK
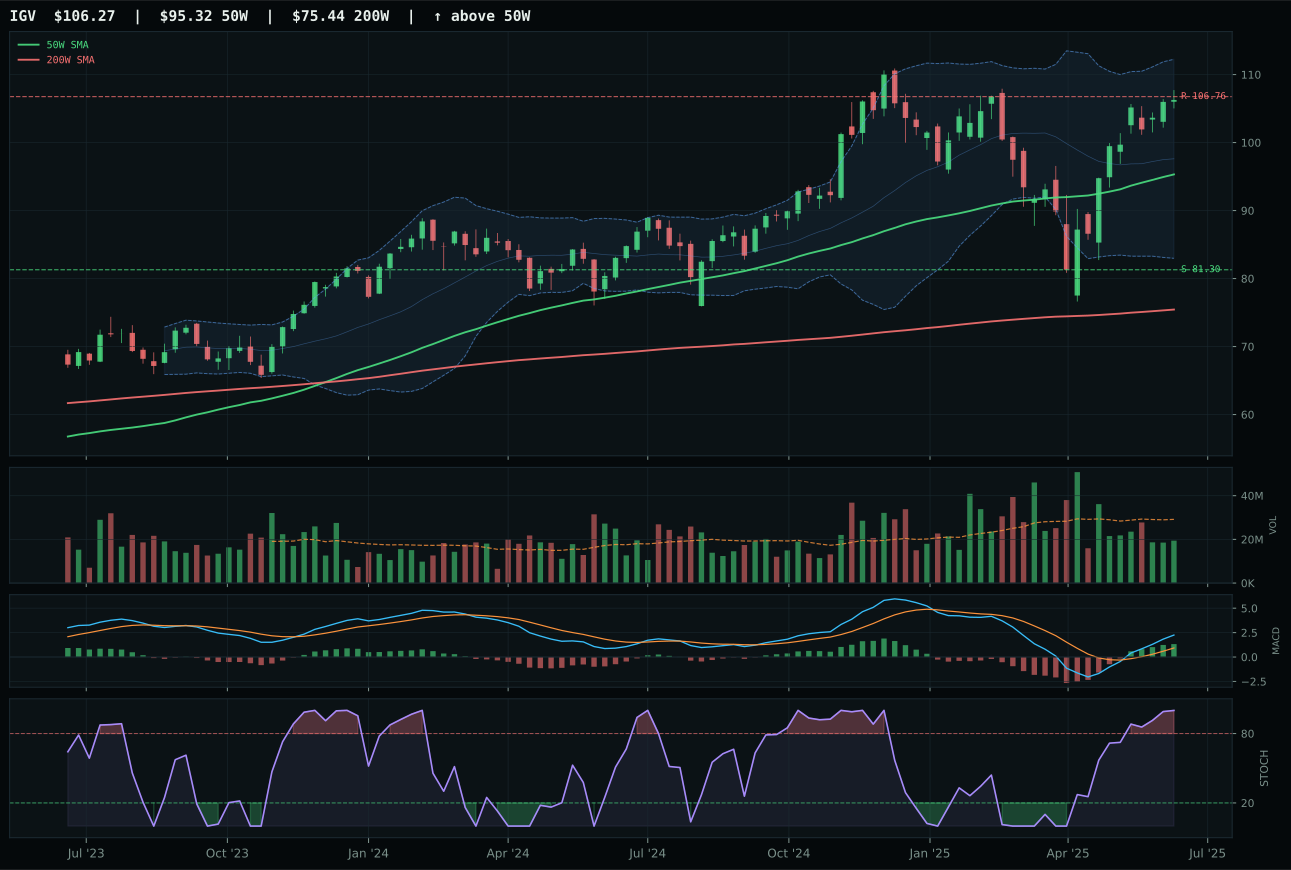
IGV has a neutral structure profile with 9.9% 13-week relative strength versus SPY.
A failed hold above support would weaken the setup.
Actionable but governed by invalidation levels.
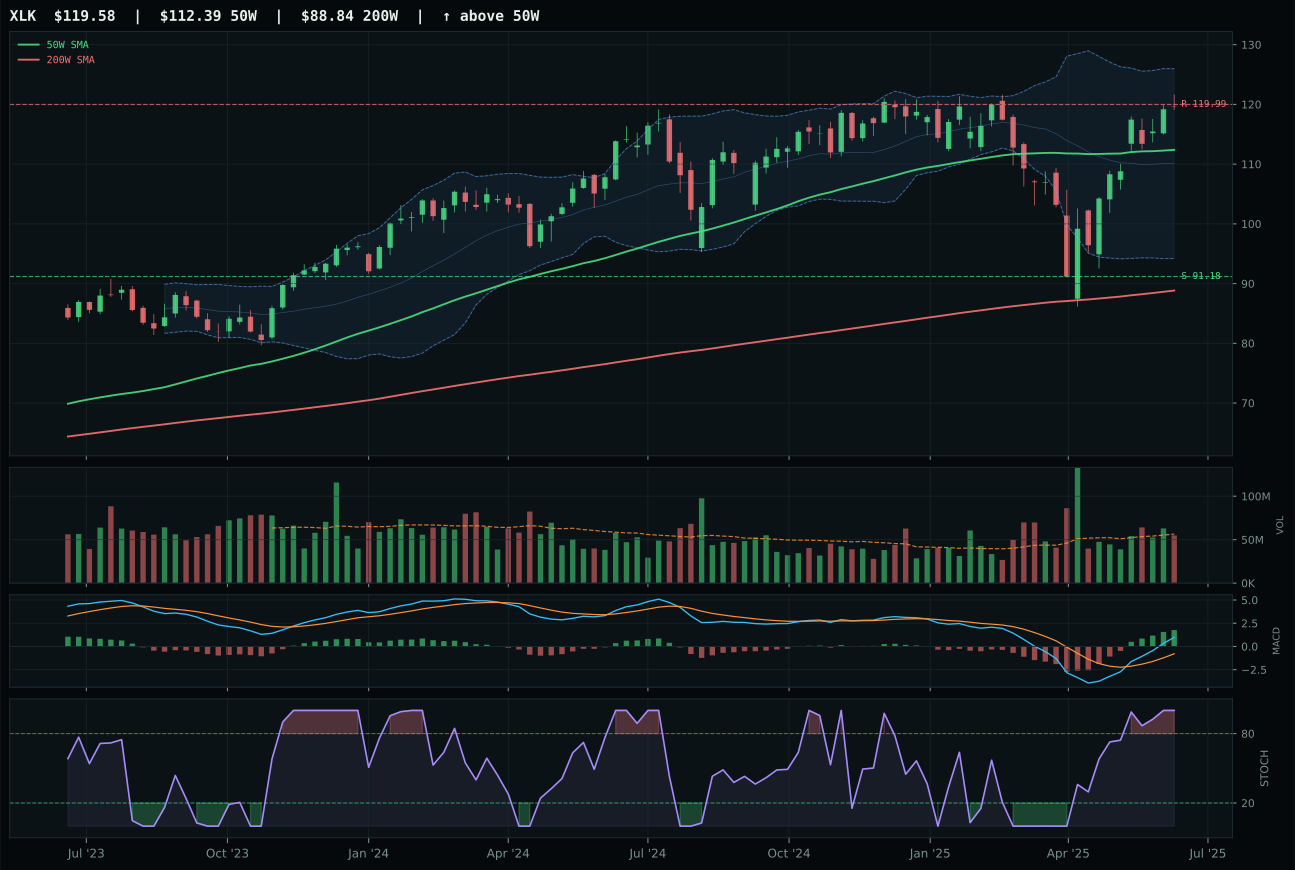
XLK has a neutral structure profile with 5.7% 13-week relative strength versus SPY.
A failed hold above support would weaken the setup.
Actionable but governed by invalidation levels.
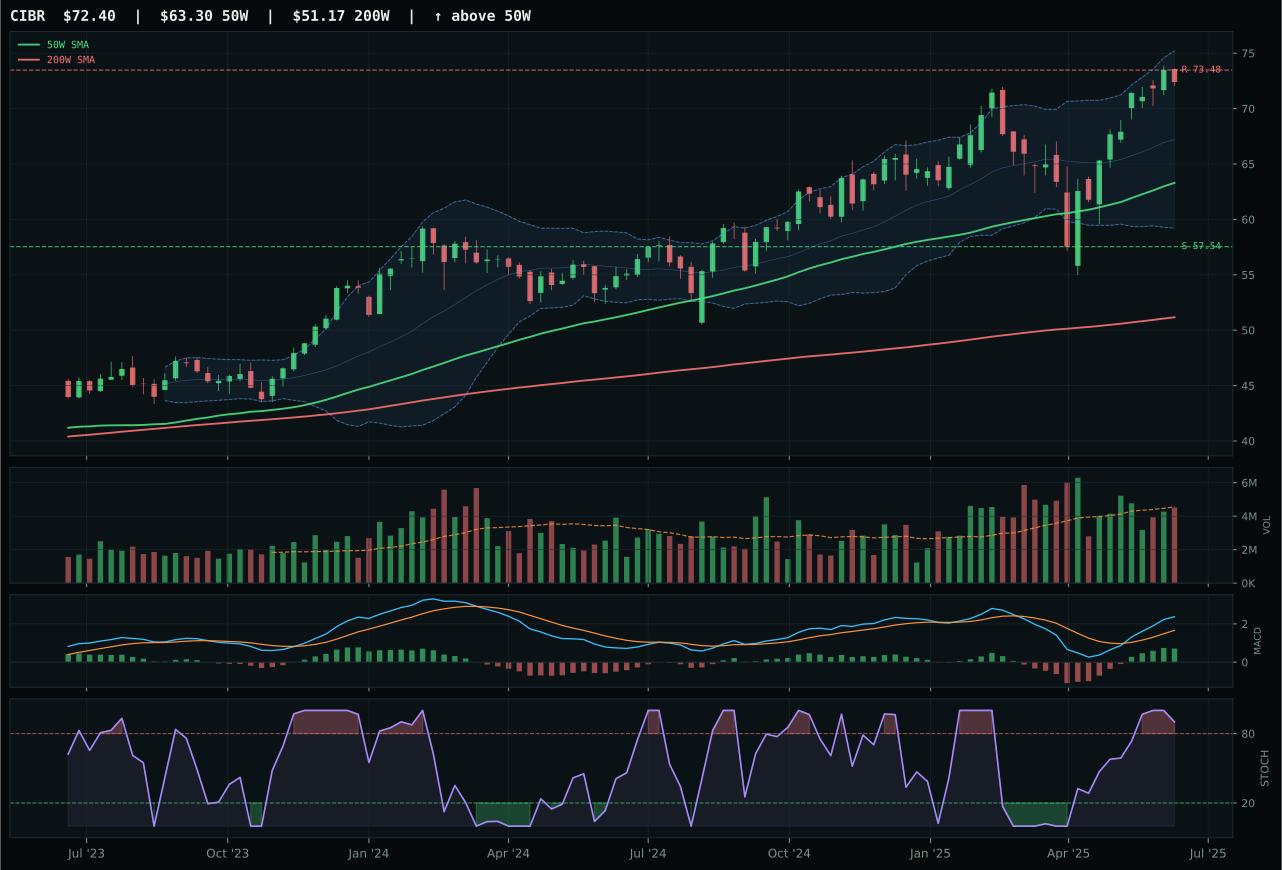
CIBR has a neutral structure profile with 5.6% 13-week relative strength versus SPY.
A failed hold above support would weaken the setup.
Actionable but governed by invalidation levels.
XLK wins the category because its timing score of 82.0 decisively beats IGV's 67.0, reflecting a cleaner setup with neutral structure and better volume confirmation at 0.97x the 20-week average versus IGV's thin participation. The 13-week return of 11.8% sits in the deep retracement zone near Fib 0.786, offering entry quality where new money is not yet stretched—a stark contrast to IGV's 15.9% gain that has pushed it into a higher Fibonacci zone and attracted less conviction volume. XLK's relative strength versus SPY of 5.7% is modest but sufficient, and its MACD is bullish and improving with stochastic RSI holding overbought momentum, signaling that the move is being accumulated rather than distributed. The 6.6% distance from the 50-week moving average positions XLK as a participant in an established trend without the entry penalty that IGV carries.
Technology earned a tier-2 allocation of 5% because it ranked outside the top two categories this week, despite a solid technical score of 67.0 and reasonable macro fit at 60.0 out of 100. The disinflation regime (+7) and active risk appetite (+9) provide structural tailwinds, but liquidity stress (-10) has proven the dominant force in the macro checklist, pulling the category's narrative fit below the threshold for overweight consideration. AI growth sponsorship (+6) supports both XLK and the broader basket, yet the category cannot overcome the relative strength of Precious Metals and Nuclear Energy, which have demonstrated superior technical evidence and cleaner accumulation patterns. For Technology to reclaim a top-2 seat, the setup would need to move closer to the 50-week average to eliminate entry risk, or breadth would need to broaden—currently, category-relative strength between XLK and IGV is flat at 0.0%, suggesting no leader is pulling peers higher.
AI — SMH
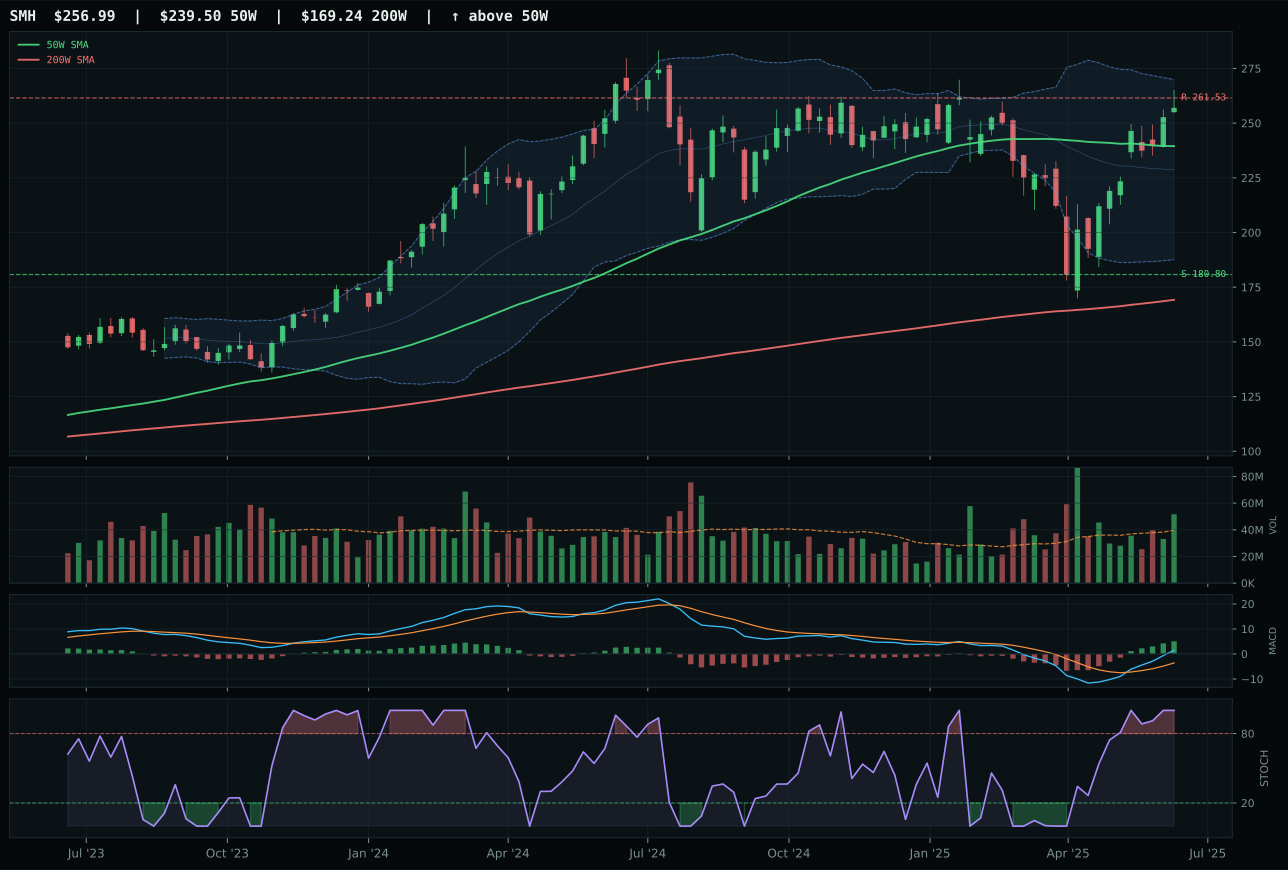
SMH has a neutral structure profile with 7.4% 13-week relative strength versus SPY.
A failed hold above support would weaken the setup.
Actionable but governed by invalidation levels.
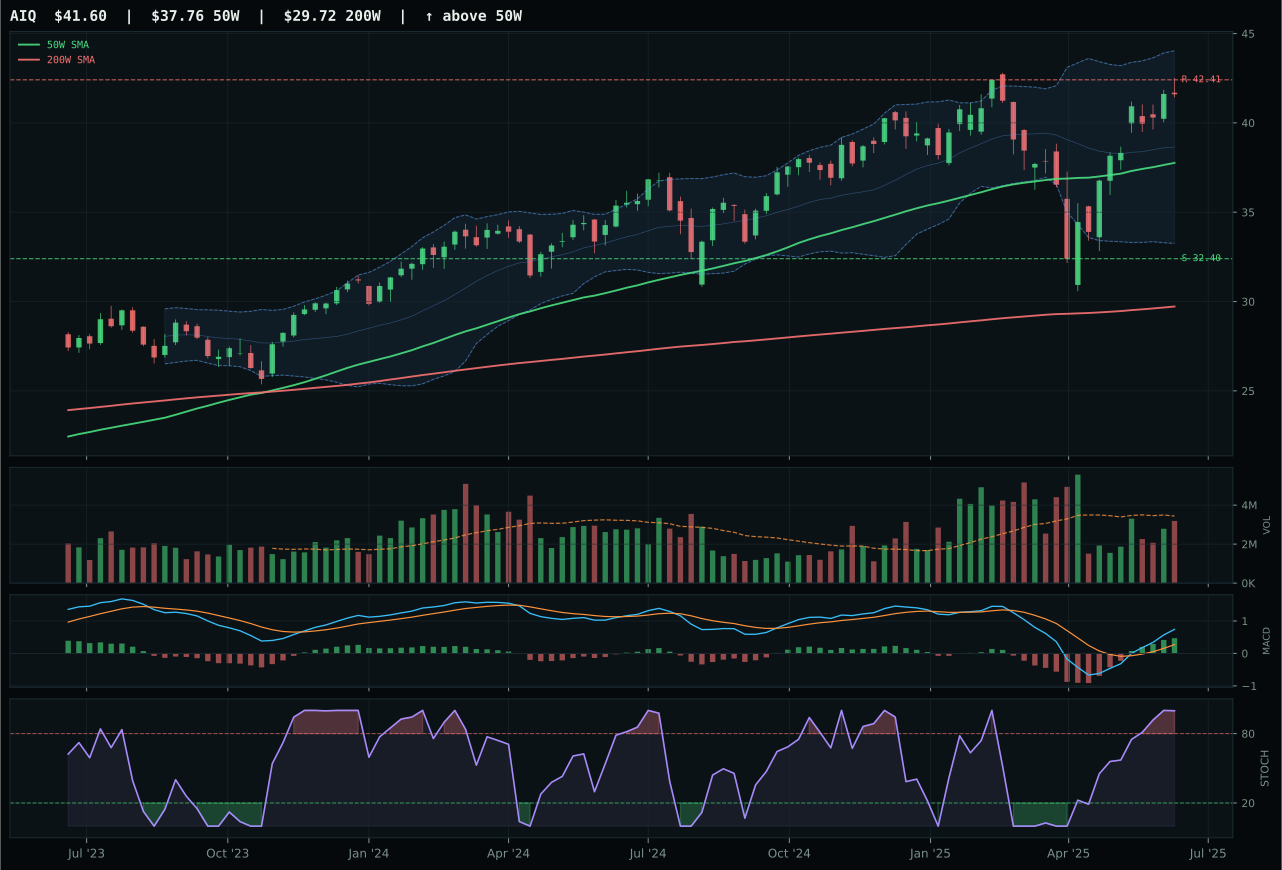
AIQ has a neutral structure profile with 4.3% 13-week relative strength versus SPY.
A failed hold above support would weaken the setup.
Actionable but governed by invalidation levels.
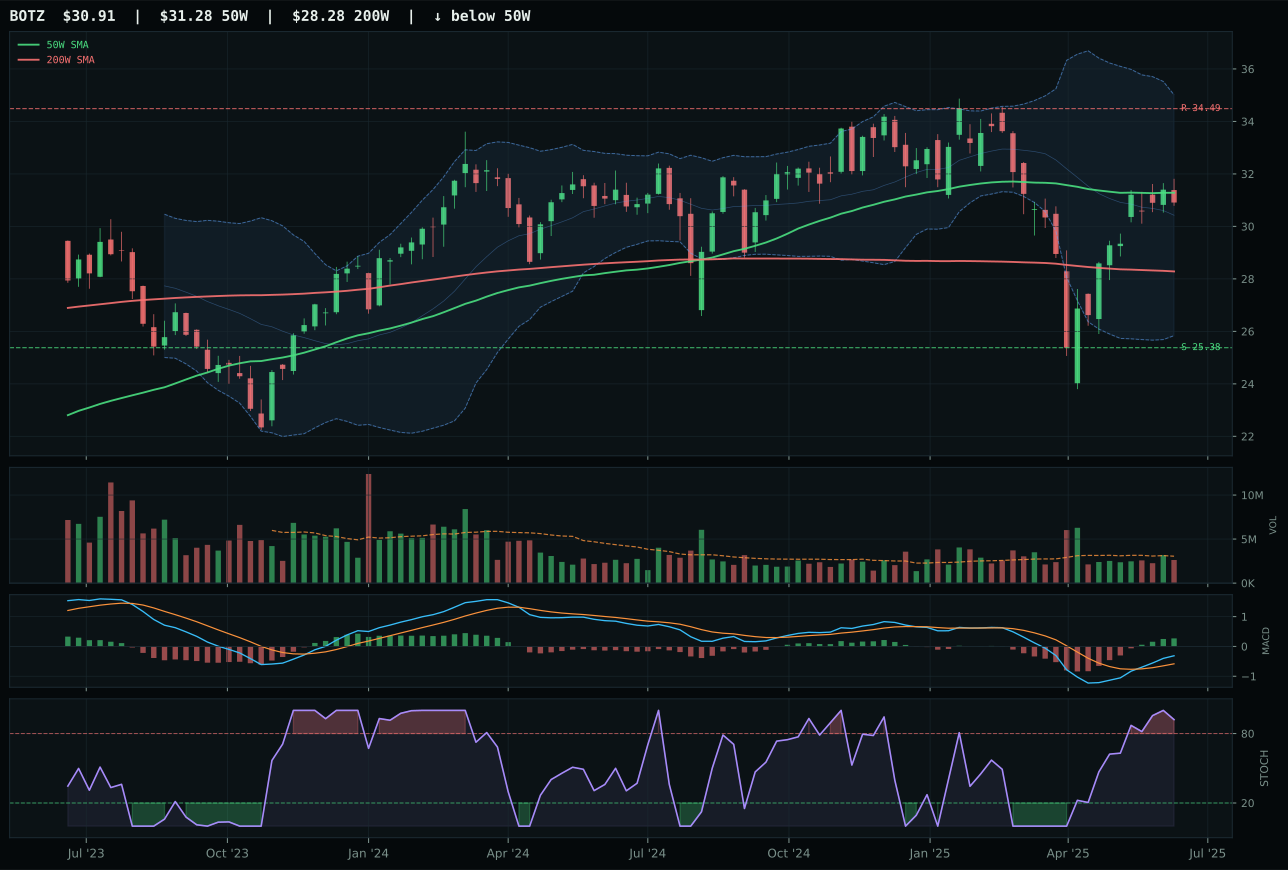
BOTZ has a compression near 50W profile with -5.3% 13-week relative strength versus SPY.
A failed hold above support would weaken the setup.
Actionable but governed by invalidation levels.
AI earned 5% allocation because its category score of 67.0 placed it outside the top two, despite strong macro tailwinds from AI growth sponsorship (+14) and active risk appetite (+10). The technical score of 88.8 for SMH is robust, but disinflation pressure creates a structural headwind (-12) that the allocator cannot ignore—rising real yields in a disinflationary cycle compress AI's growth valuations regardless of earnings momentum. The 59.0 macro fit reflects this tension: real asset sponsorship is absent, and credit stress (-8) restricts the leverage that typically powers AI upside. SMH's extended position 7.3% above the 50-week average and risk-reward ratio of only 30.7 (limited upside, 42.1% downside to support) further constrain the allocation. For AI to earn top-2 status, the macro regime would need to shift toward reflation, or the technical setup would require a deeper pullback to rebuild entry quality without sacrificing the conviction volume that currently supports the move.
Utilities & Infrastructure — IGF
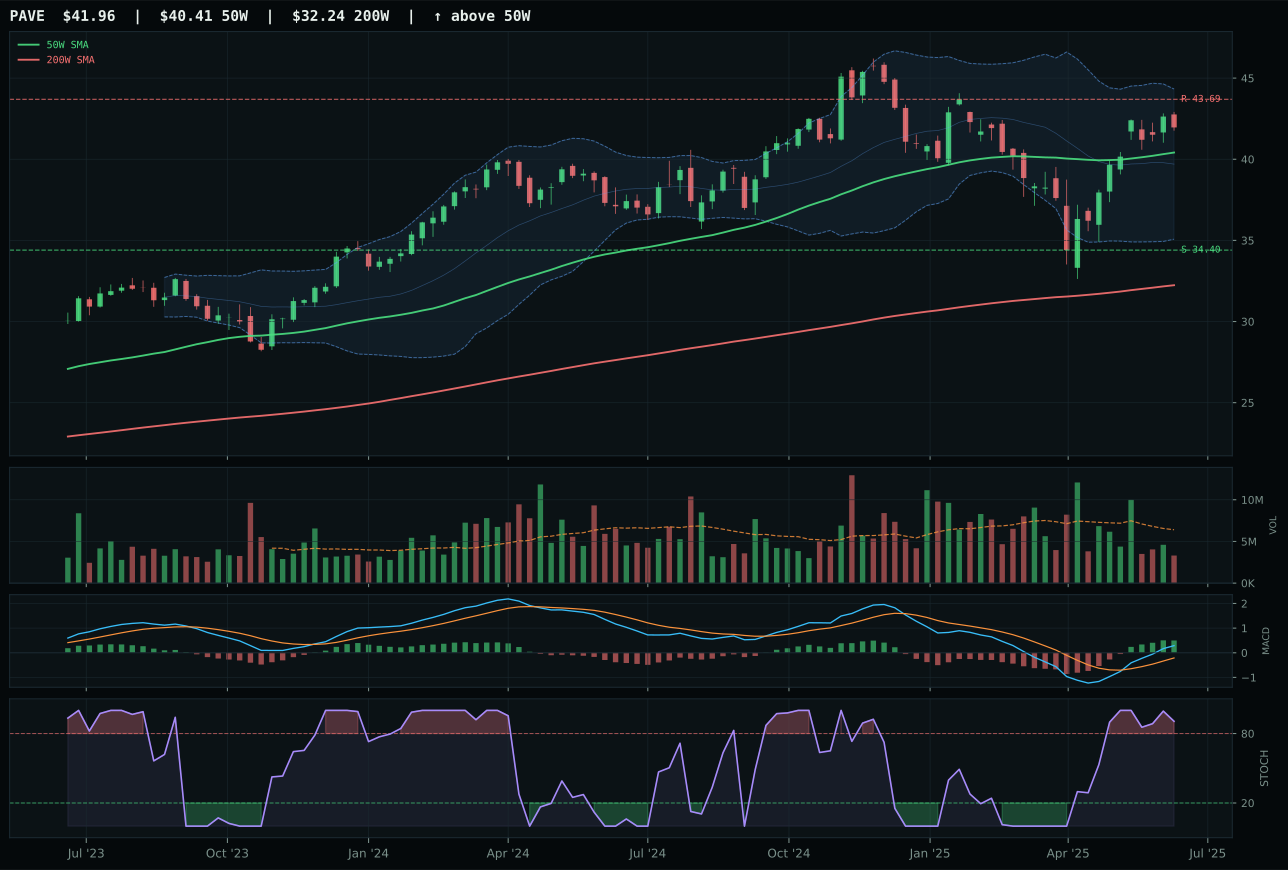
PAVE has a neutral structure profile with 3.4% 13-week relative strength versus SPY.
A failed hold above support would weaken the setup.
Actionable but governed by invalidation levels.
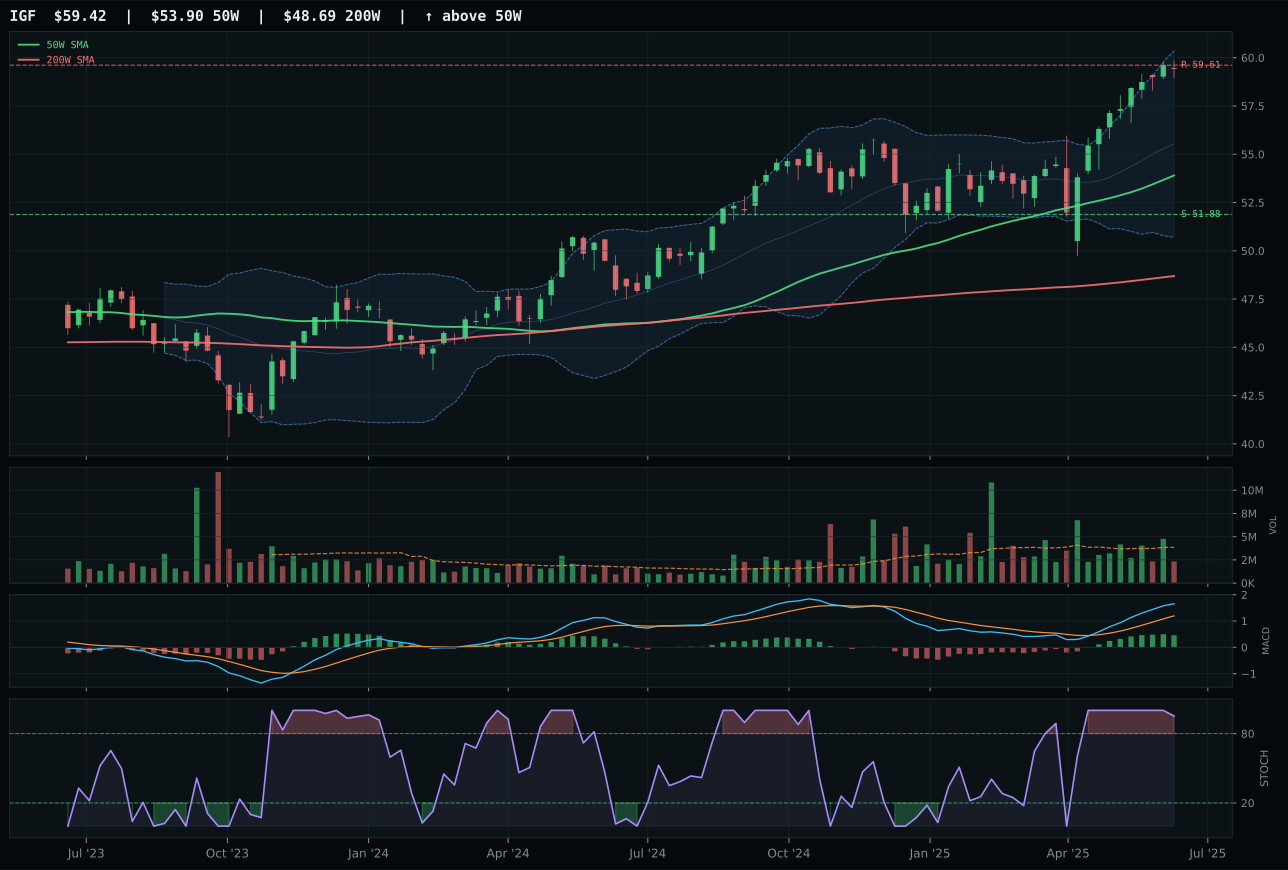
IGF has a neutral structure profile with 4.2% 13-week relative strength versus SPY.
A failed hold above support would weaken the setup.
Actionable but governed by invalidation levels.
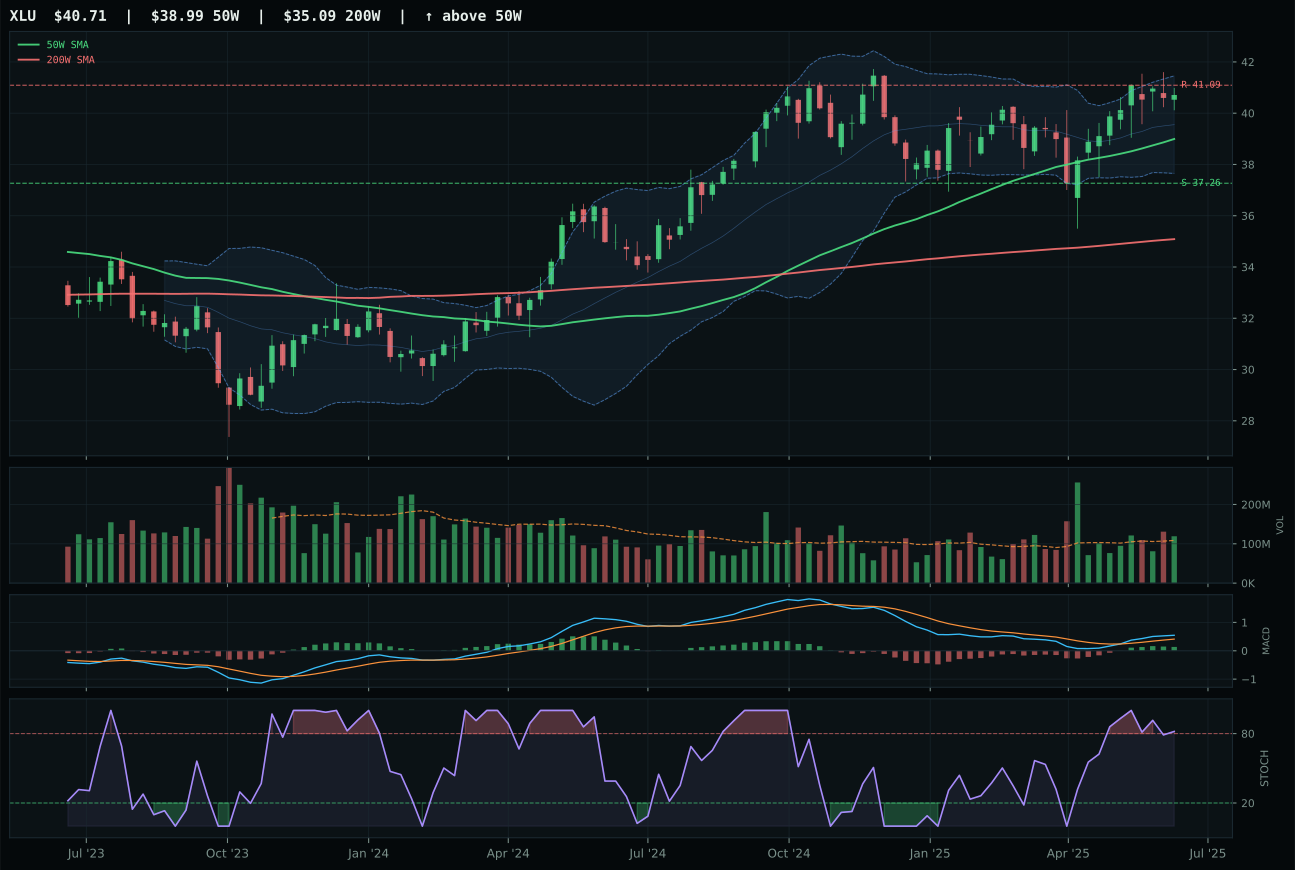
XLU has a neutral structure profile with -2.8% 13-week relative strength versus SPY.
A failed hold above support would weaken the setup.
Actionable but governed by invalidation levels.
Utilities & Infrastructure earned 5% allocation because its category score of 63.8 ranked in the tier-2 range, supported by a favorable macro fit of 62.0 that reflects disinflation helping the category (+7) and active disinflation pressure (+6). Utilities' defensive profile and income focus are natural beneficiaries of falling inflation expectations, creating a 13-point net positive macro environment relative to risk-asset categories. However, IGF's technical setup is uninspiring despite the macro support: thin volume at 0.61x the 20-week average and risk-reward of only 37.4 (37.4% upside cushion, 14.5% downside) signal that smart money is not building new positions here. PAVE's superior timing and momentum suggest the category may have already retraced its disinflation benefit into the chart, making further allocation at current levels questionable. The 5% slot acknowledges the macro case—that disinflation benefits utilities' earnings stability and dividend yields—without overcommitting to prices that have already absorbed most of that benefit. To justify a larger position, either Utilities would need to consolidate closer to the 50-week to reset entry quality, or a sharper pivot to extreme risk aversion would need to activate defensive rotation beyond current positioning.
Defense & Aerospace — ITA
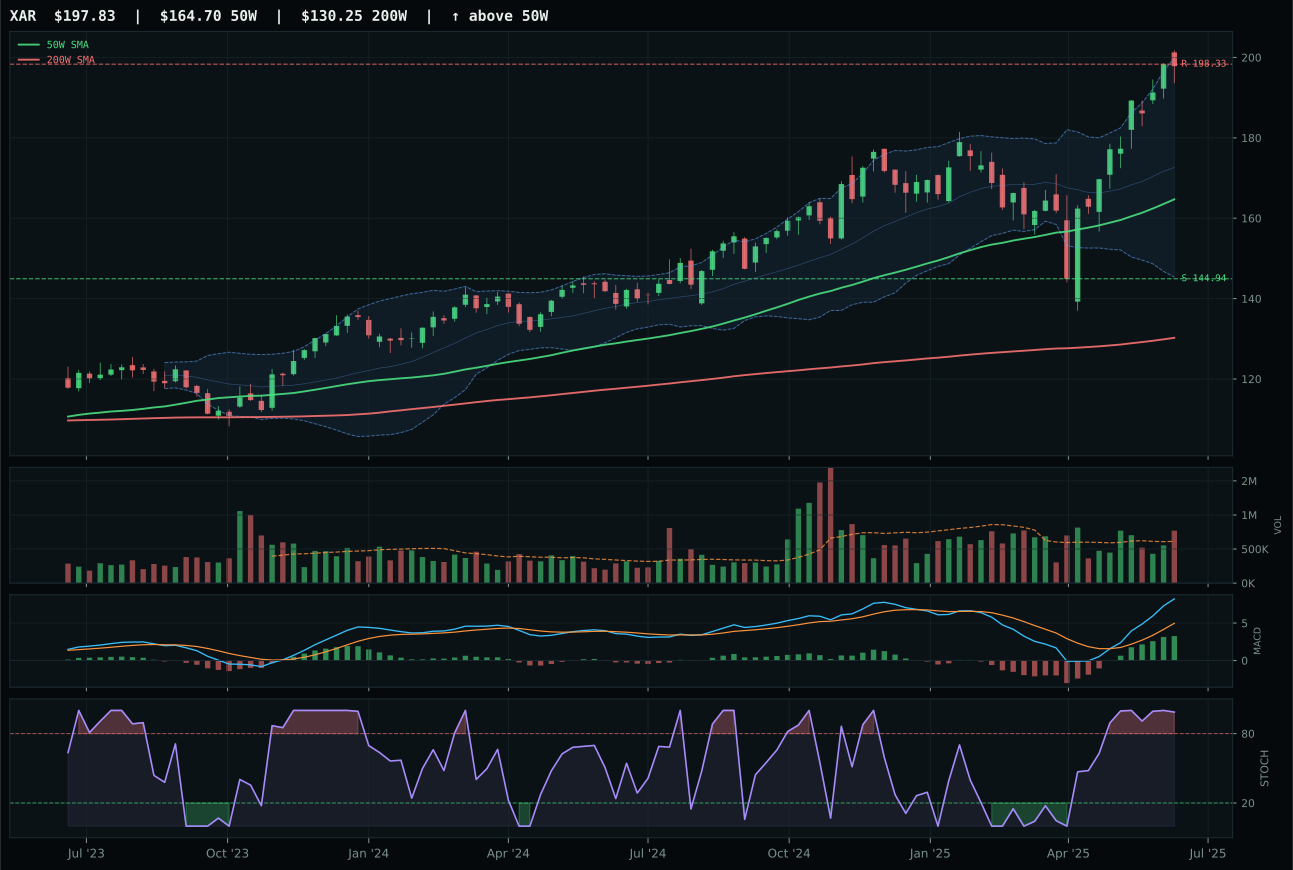
XAR has a vertical extension profile with 16.2% 13-week relative strength versus SPY.
A failed hold above support would weaken the setup.
Actionable but governed by invalidation levels.
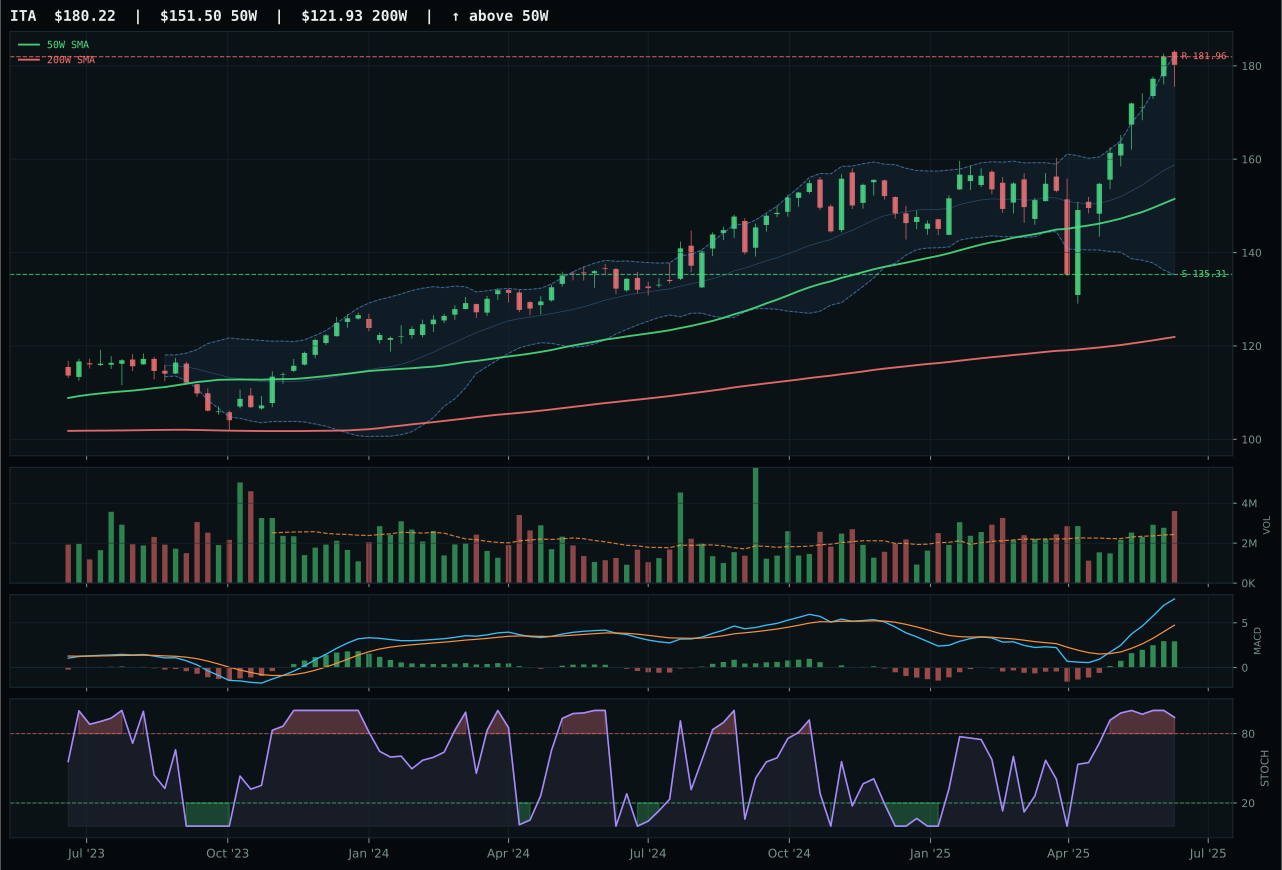
ITA has a vertical extension profile with 13.1% 13-week relative strength versus SPY.
A failed hold above support would weaken the setup.
Actionable but governed by invalidation levels.
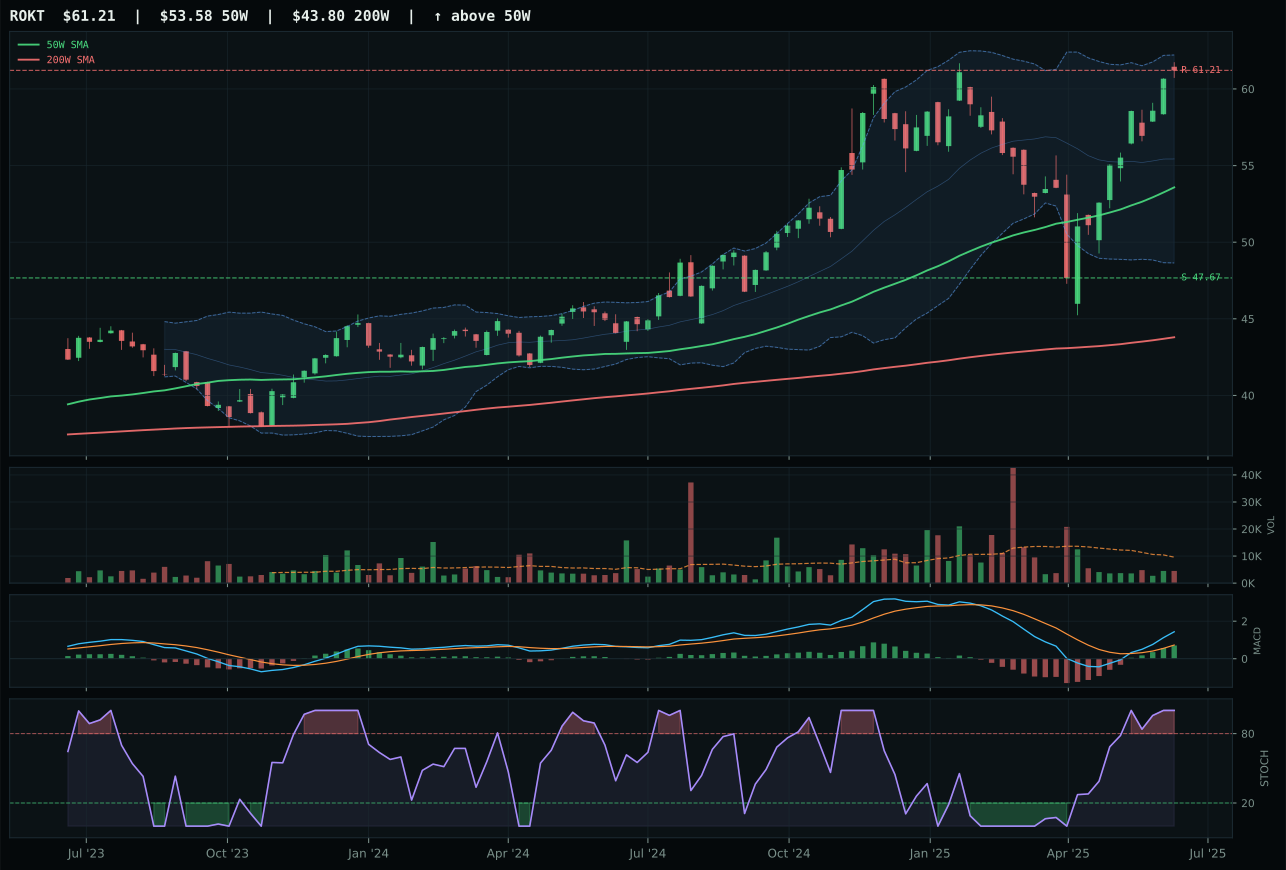
ROKT has a neutral structure profile with 9.5% 13-week relative strength versus SPY.
A failed hold above support would weaken the setup.
Tracked, but not top-2 eligible because: .
Defense & Aerospace earned 5% allocation because its category score of 57.6 ranked it in the middle tier, well behind Precious Metals and Nuclear Energy but ahead of excluded categories. The macro fit of 51.0 is constrained by a neutral disinflation impact and weak category-specific descriptor alignment—liquidity stress (-4) and credit stress (+2) largely offset each other, offering no clear narrative to justify overweight. ITA's technical evidence is solid at 74.4, but the timing score of 27.0 reflects the harsh reality that every new buyer today is entering 19% above the 50-week, making this a late-cycle rally rather than an early accumulation setup. For Defense to earn top-2 consideration, either the technical setup would need to reset closer to the moving averages to rebuild entry quality, or geopolitical risk would need to materialize as an active descriptor to provide macro cover for the extended technicals. At current levels, the category warrants a small slot as a beneficiary of risk appetite, but not the capital concentration that higher-conviction setups command.
Traditional Energy — FCG
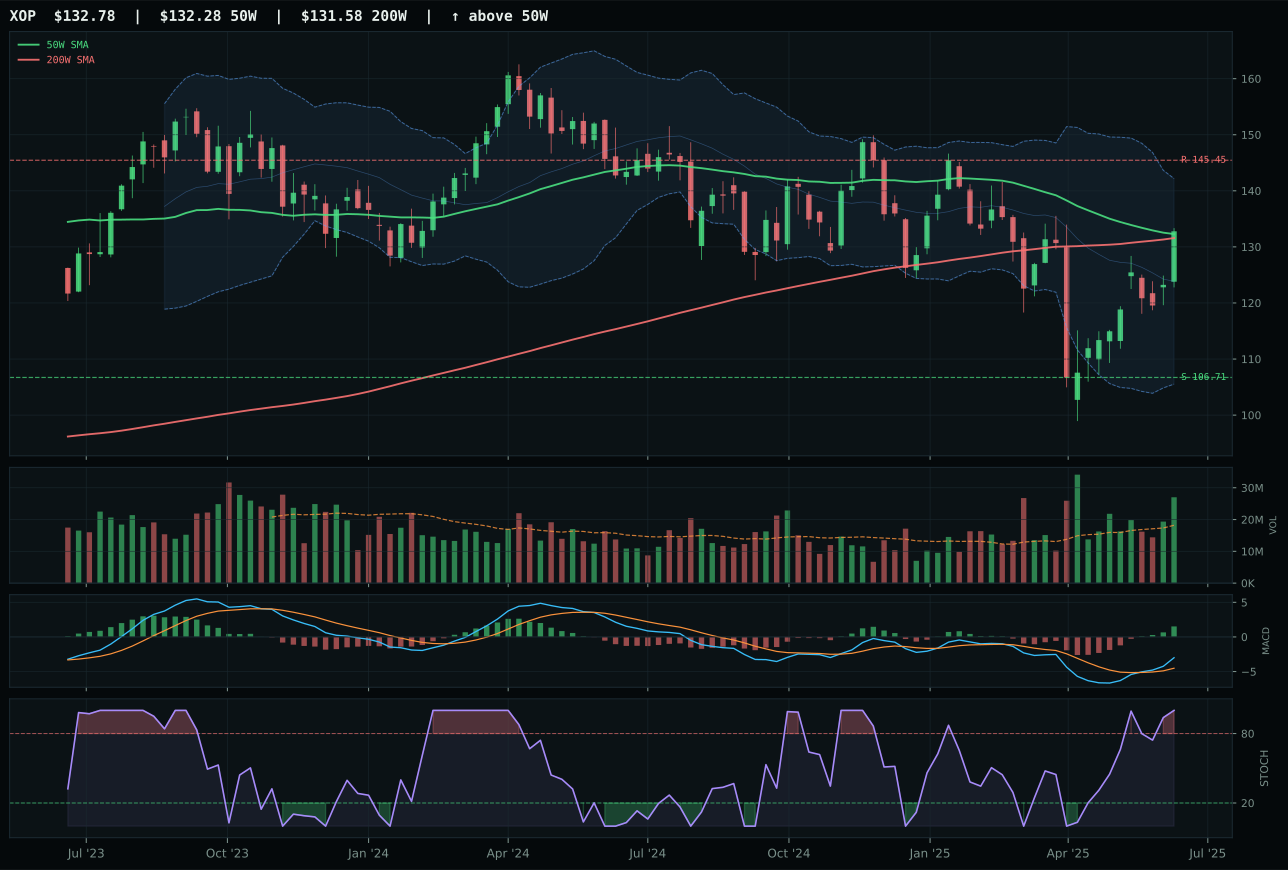
XOP has a compression near 50W profile with -1.5% 13-week relative strength versus SPY.
A failed hold above support would weaken the setup.
Actionable but governed by invalidation levels.
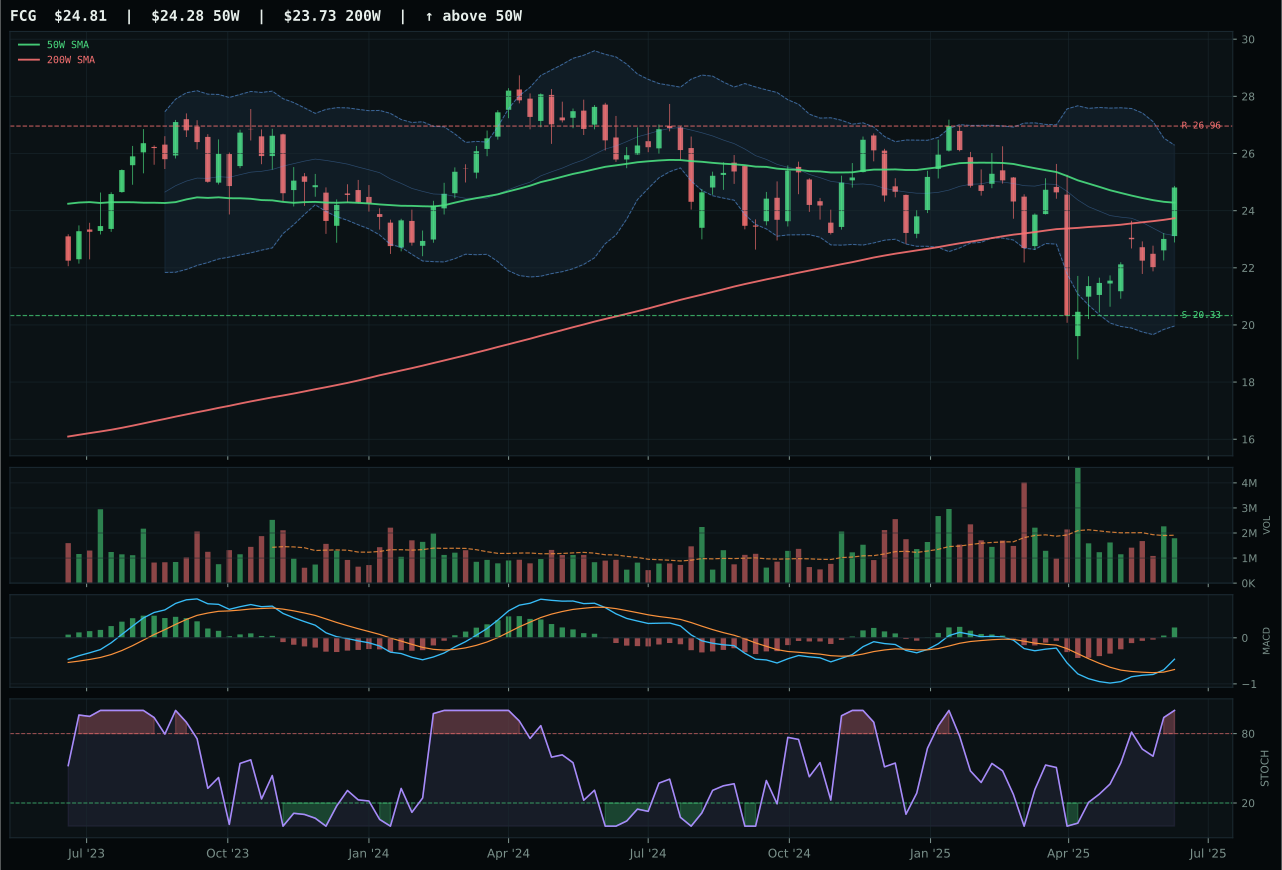
FCG has a compression near 50W profile with -2.1% 13-week relative strength versus SPY.
A failed hold above support would weaken the setup.
Actionable but governed by invalidation levels.
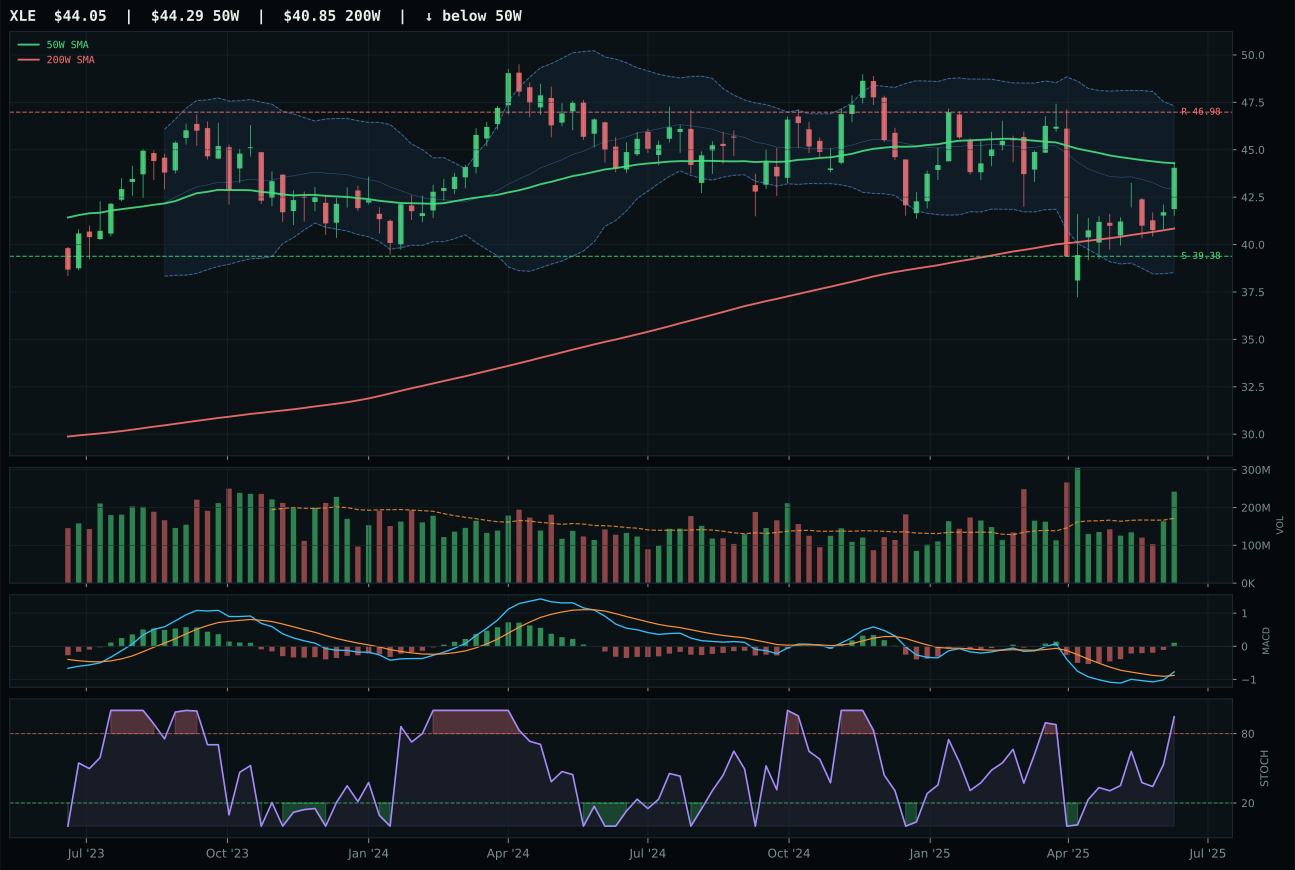
XLE has a compression near 50W profile with -7.9% 13-week relative strength versus SPY.
A failed hold above support would weaken the setup.
Actionable but governed by invalidation levels.
Traditional Energy earned 5% allocation despite a category score of only 36.4, reflecting forced acceptance of a weak position rather than conviction. The macro fit is deeply negative at 23.0: disinflation hurts the category (-10), and disinflation pressure (-10) is the dominant active descriptor, creating a 20-point headwind that no amount of risk appetite (+7) can overcome. XOP's technical evidence of 85.2 is misleading—strong charts in a bearish macro regime are traps, not opportunities. FCG's 74.1 technical score and 100.0 timing are attractive in isolation, yet the portfolio cannot ignore that energy is the only category ranked lower than Industrial Metals and Emerging Markets. The 5% slot is a residual holding, not an active bet; it exists because the allocator must carry some energy exposure given the regime uncertainty, and FCG's tight compression provides the least painful entry if inflation surprises higher. To earn a larger position, energy would require either reflation signals in the macro checklist or a breakdown in credit conditions that forces a defensive rotation into commodities as collateral.
Industrial Metals — COPX
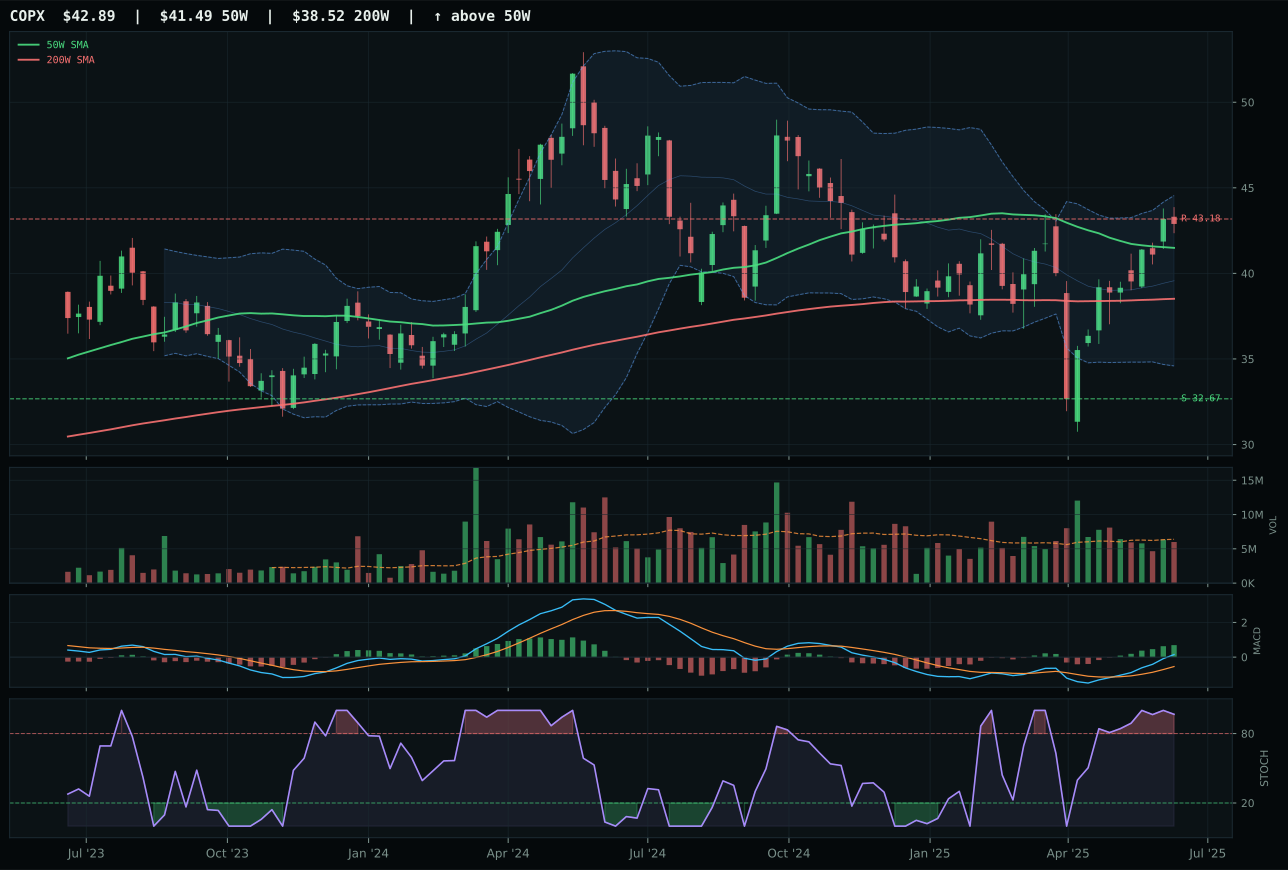
COPX has a neutral structure profile with -2.3% 13-week relative strength versus SPY.
A failed hold above support would weaken the setup.
Actionable but governed by invalidation levels.
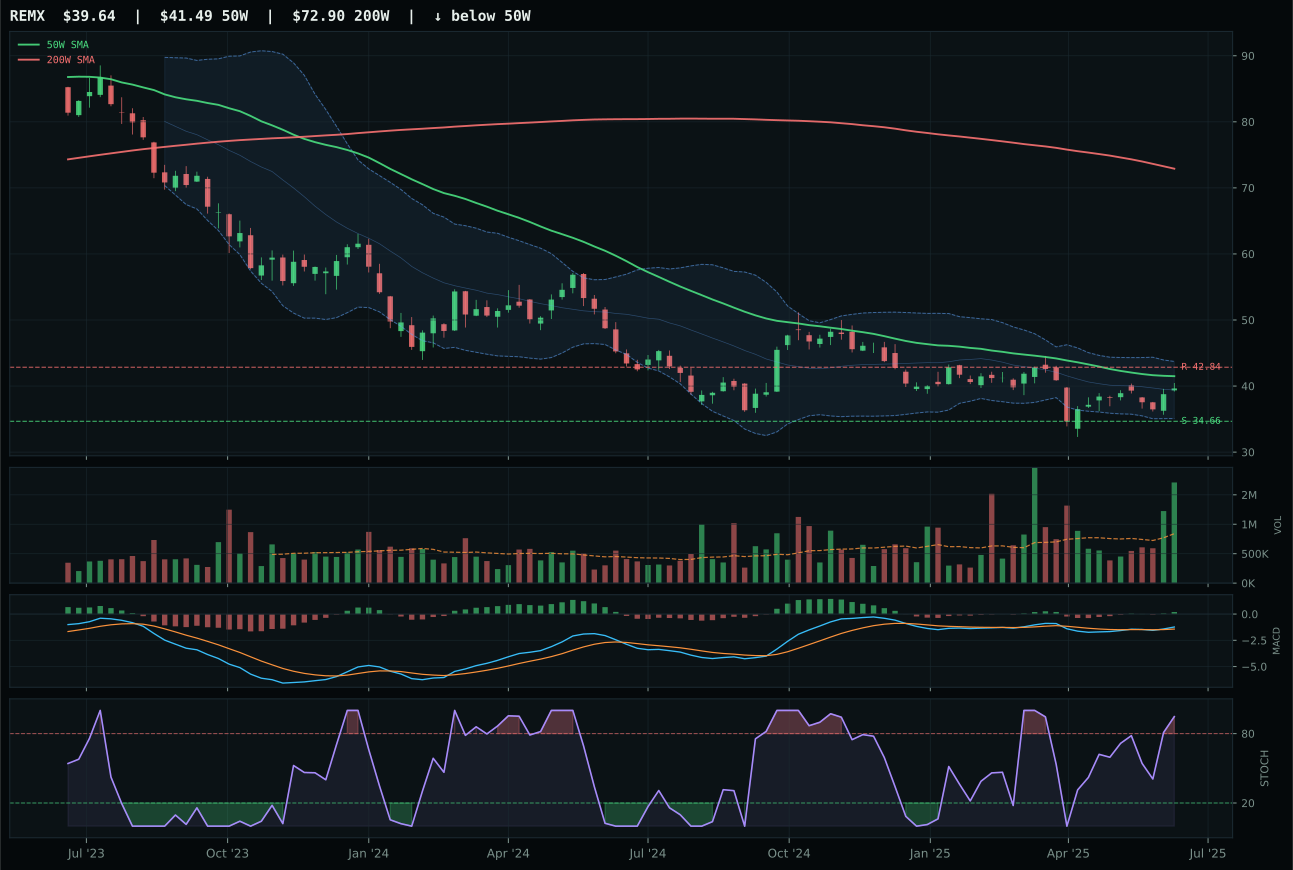
REMX has a neutral structure profile with -13.5% 13-week relative strength versus SPY.
Extension and support failure are the main tactical risks.
Tracked, but not top-2 eligible because: structurally broken.
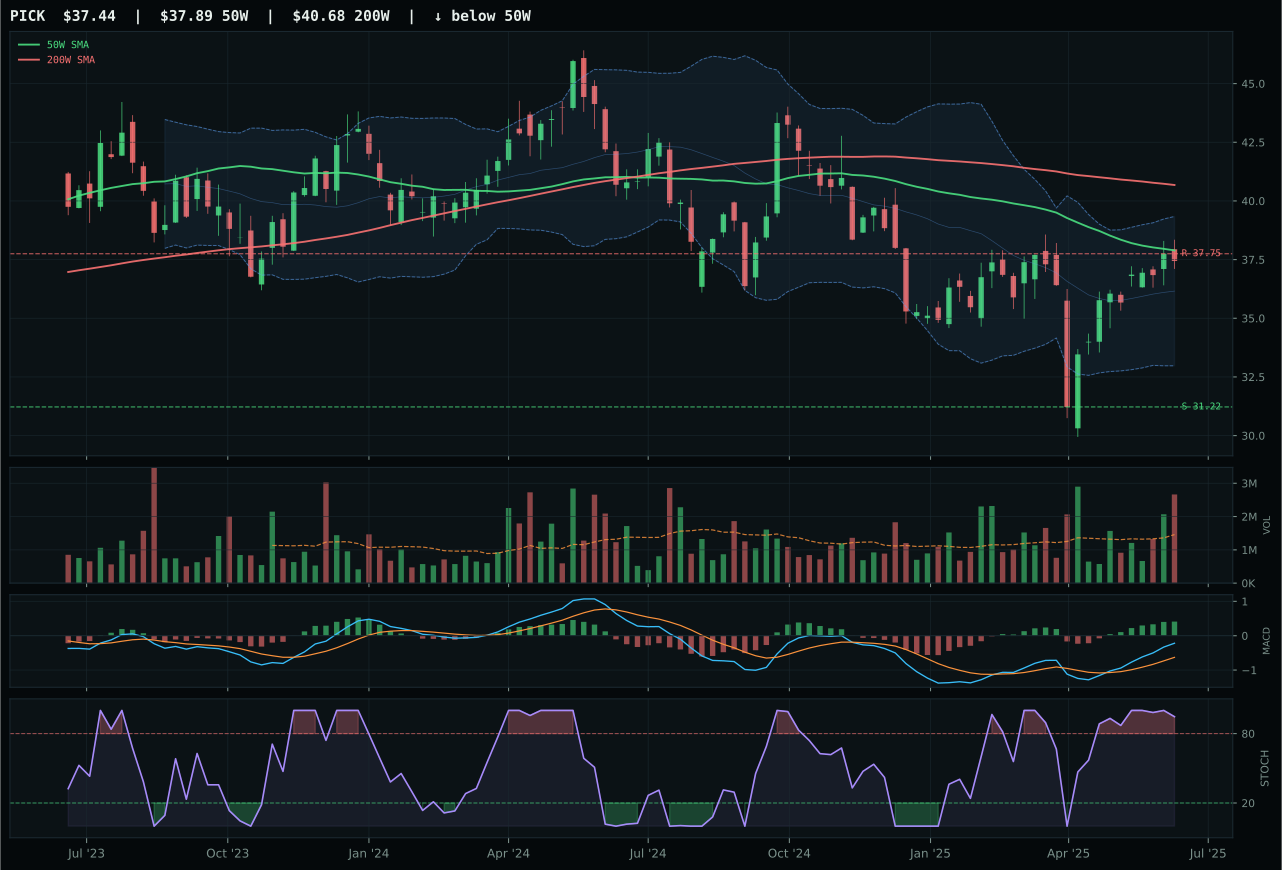
PICK has a compression near 50W profile with -6.8% 13-week relative strength versus SPY.
Extension and support failure are the main tactical risks.
Tracked, but not top-2 eligible because: structurally broken.
Industrial Metals earned 5% allocation because its category score of 35.9 ranked in the tier-2 range despite macro strength, reflecting poor technical quality in the largest component names. The macro fit is robust at 65.0: metals scarcity is active (+14), commodity breadth positive (+10), and real asset sponsorship (+6) create a 30-point net tailwind. Yet COPX's technical evidence of only 63.9 and the category's 49.8 basket score after 3/2/1 weighting reveal a fundamental problem—the industrial metals narrative is correct, but no ETF has the technical setup to justify capital commitment. COPX's neutral structure and flat relative strength offer no conviction, while REMX and PICK are technically broken. The allocation is defensive: holding 5% acknowledges the macro case without overcommitting to subpar entry quality. To earn top-2 status or a larger position, COPX would need to consolidate near the 50-week and rebuild volume-price sponsorship, or risk appetite would need to deteriorate sharply enough to make real assets the only refuge, temporarily overriding technical concerns.
Emerging Markets — IEMG
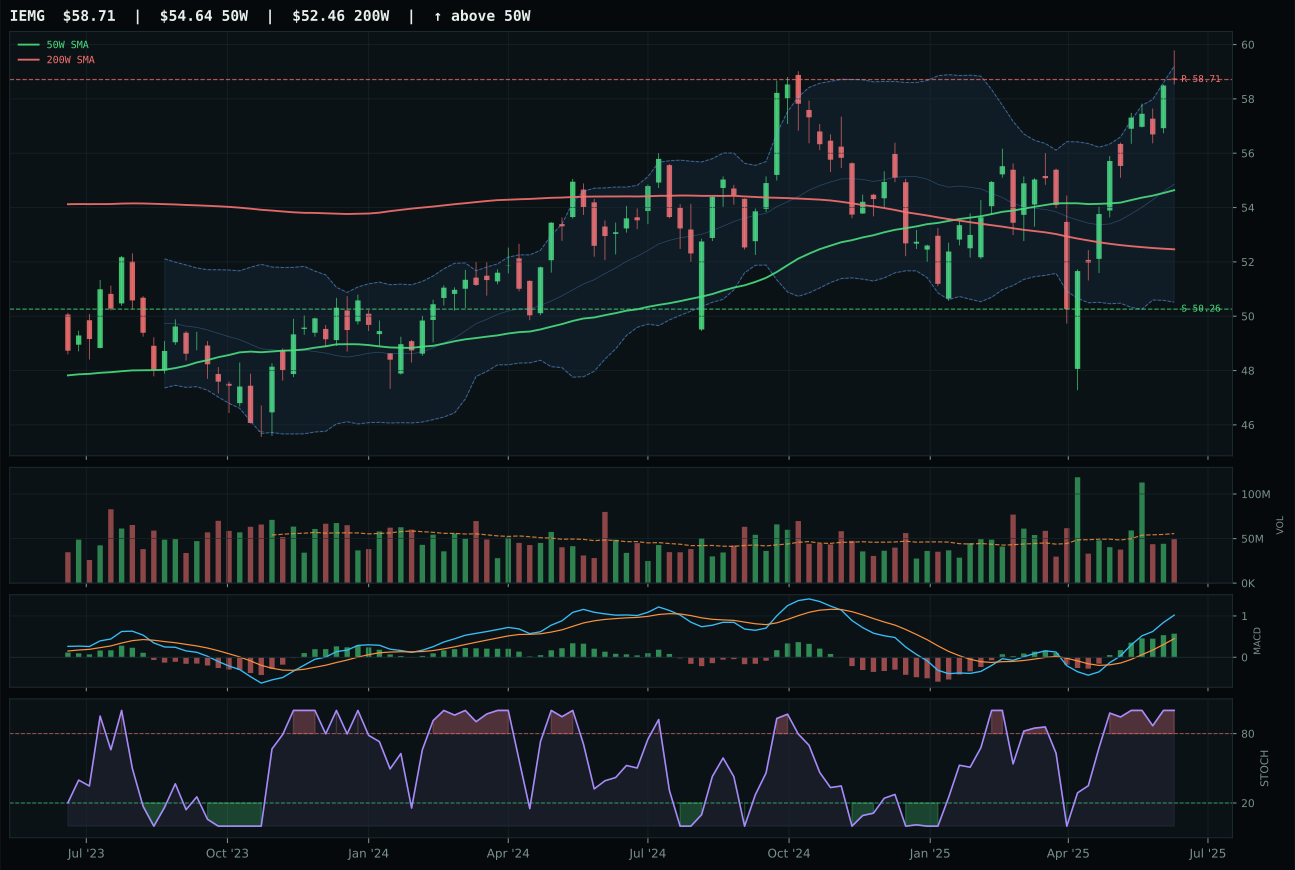
IEMG has a neutral structure profile with 0.6% 13-week relative strength versus SPY.
A failed hold above support would weaken the setup.
Actionable but governed by invalidation levels.
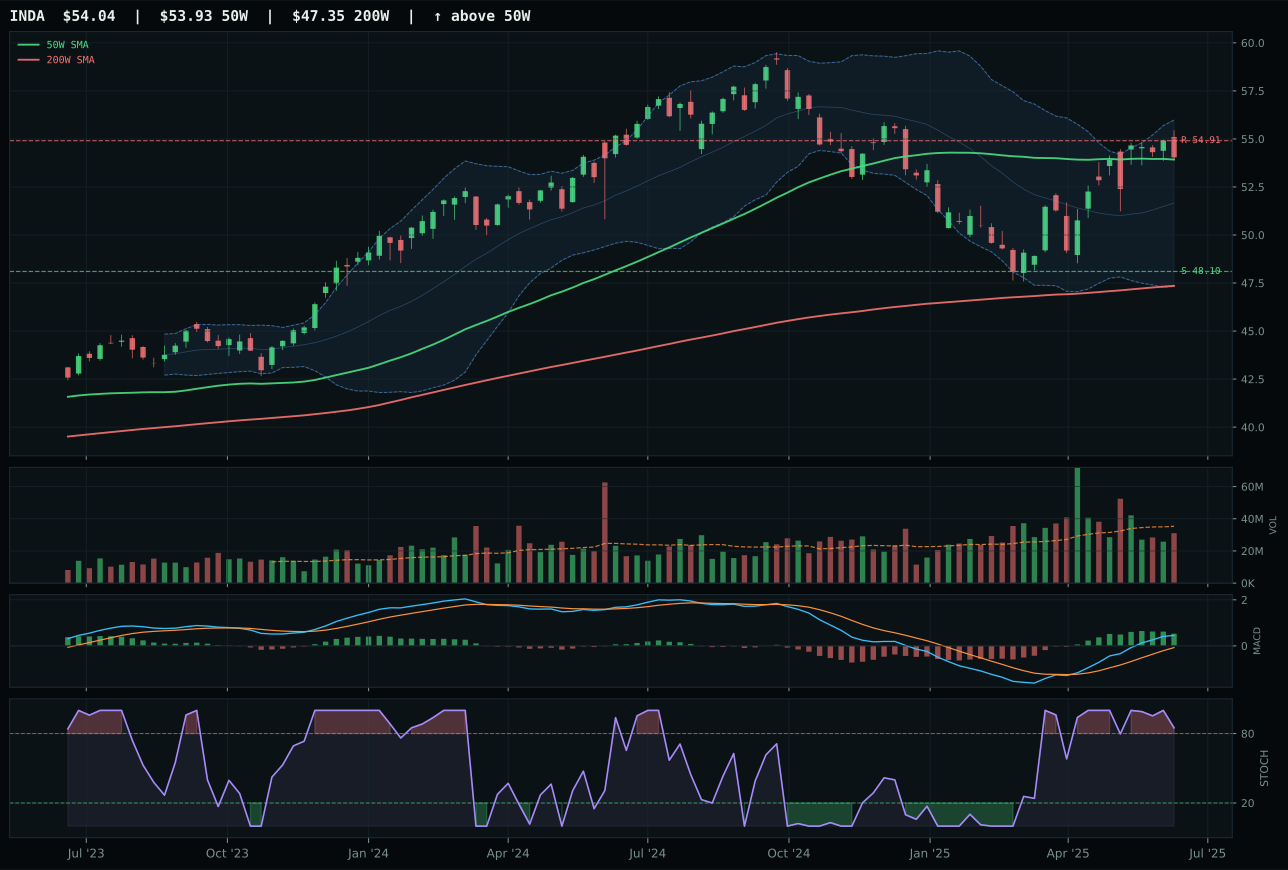
INDA has a compression near 50W profile with 4.4% 13-week relative strength versus SPY.
A failed hold above support would weaken the setup.
Actionable but governed by invalidation levels.
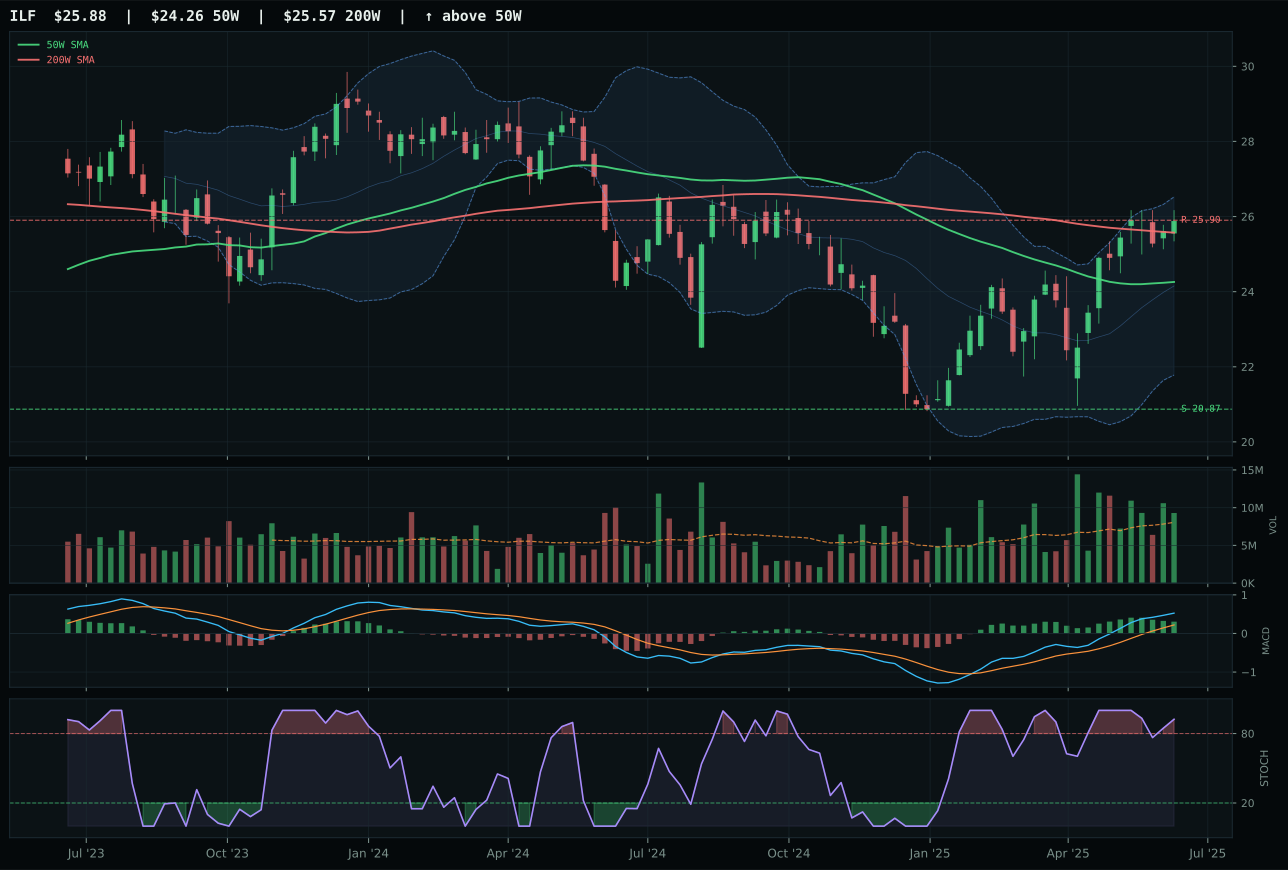
ILF has a neutral structure profile with 2.7% 13-week relative strength versus SPY.
A failed hold above support would weaken the setup.
Actionable but governed by invalidation levels.
Emerging Markets received 0% allocation because its category score of 32.4 ranked outside the qualifying distribution, placing it 9th or 10th despite IEMG's respectable 74.1 technical score. The macro fit of 38.0 is insufficient: credit stress (-10) and liquidity stress (-10) create a 20-point headwind that overwhelms the positive impact of risk appetite (+8). IEMG's price is extended near the 52-week high with timing compressed at 75.0 and risk-reward at 45.6, offering limited upside (0.0%) and moderate downside (16.8% to support). Emerging markets are structurally challenged in a disinflation regime because foreign capital flows reverse when real yields rise globally, and the portfolio has no active macro descriptor strong enough to justify allocating into that headwind. INDA's flattening MACD further signals momentum is exhausted. To earn a position, Emerging Markets would require either a significant macro pivot toward reflation and lower real yields, or a technical reset where prices consolidate closer to the 50-week average to rebuild entry quality. Until then, capital is better deployed into assets like Nuclear and Precious Metals that benefit from the current macro regime rather than suffer from it.
Agriculture & Livestock — MOO
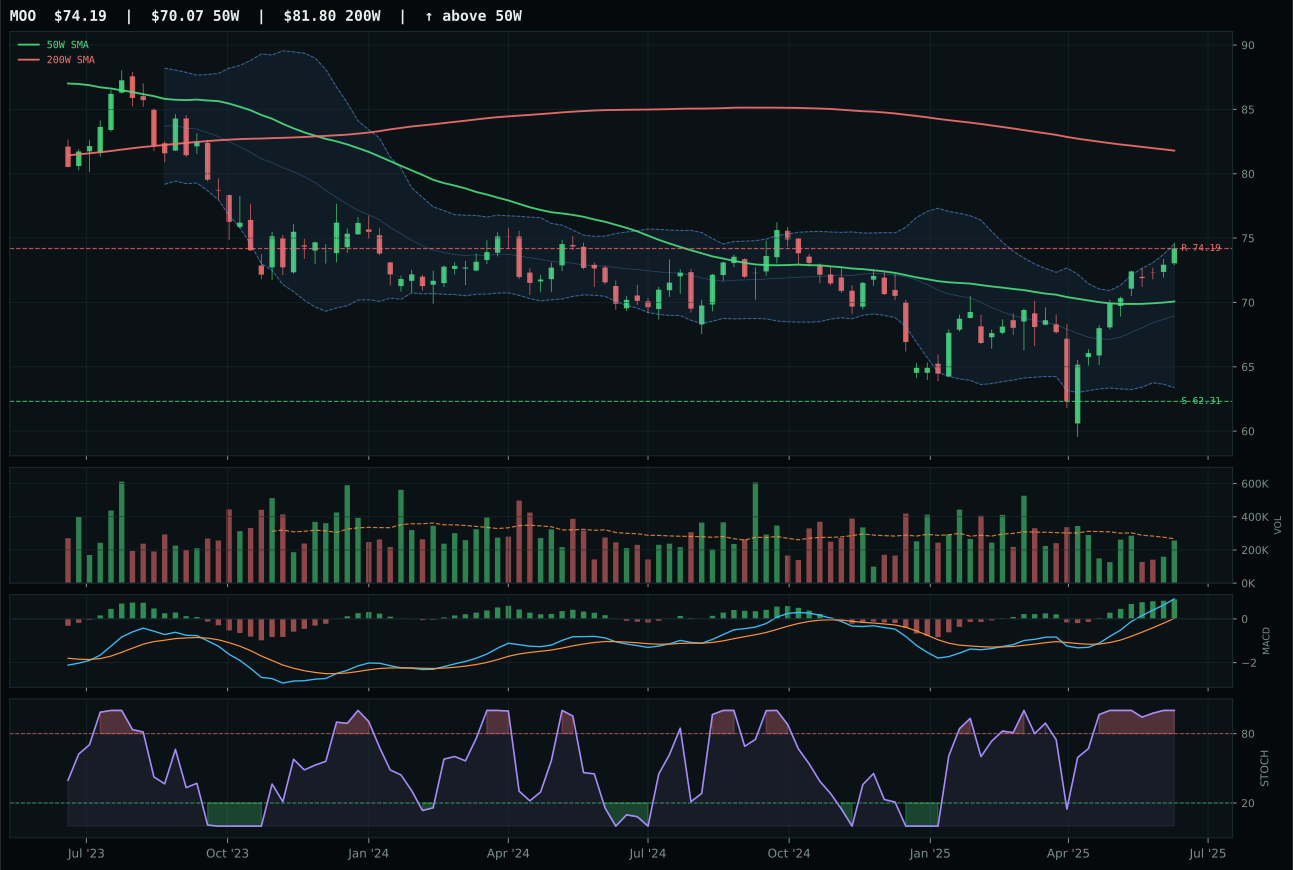
MOO has a neutral structure profile with 2.9% 13-week relative strength versus SPY.
A failed hold above support would weaken the setup.
Actionable but governed by invalidation levels.
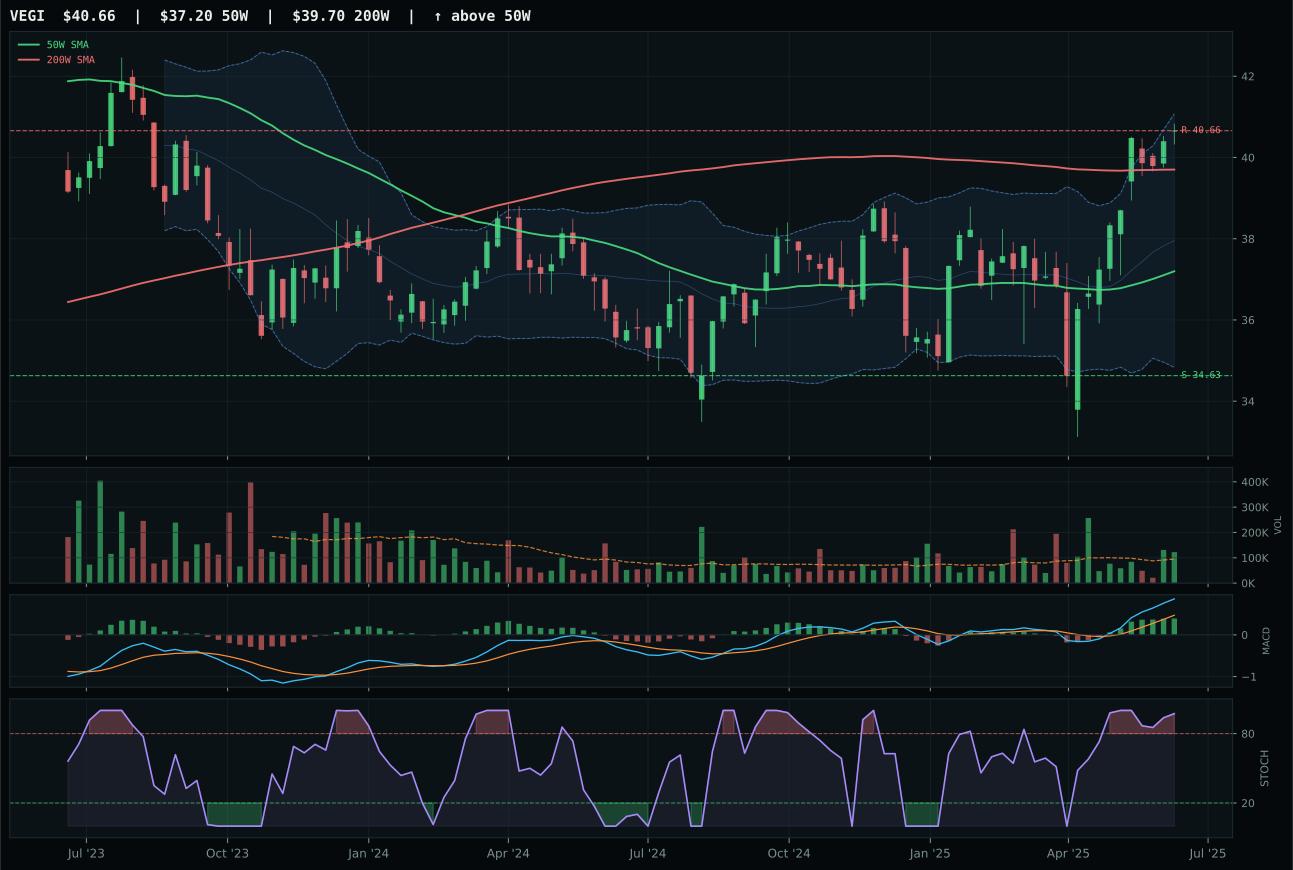
VEGI has a neutral structure profile with 3.9% 13-week relative strength versus SPY.
A failed hold above support would weaken the setup.
Tracked, but not top-2 eligible because: .
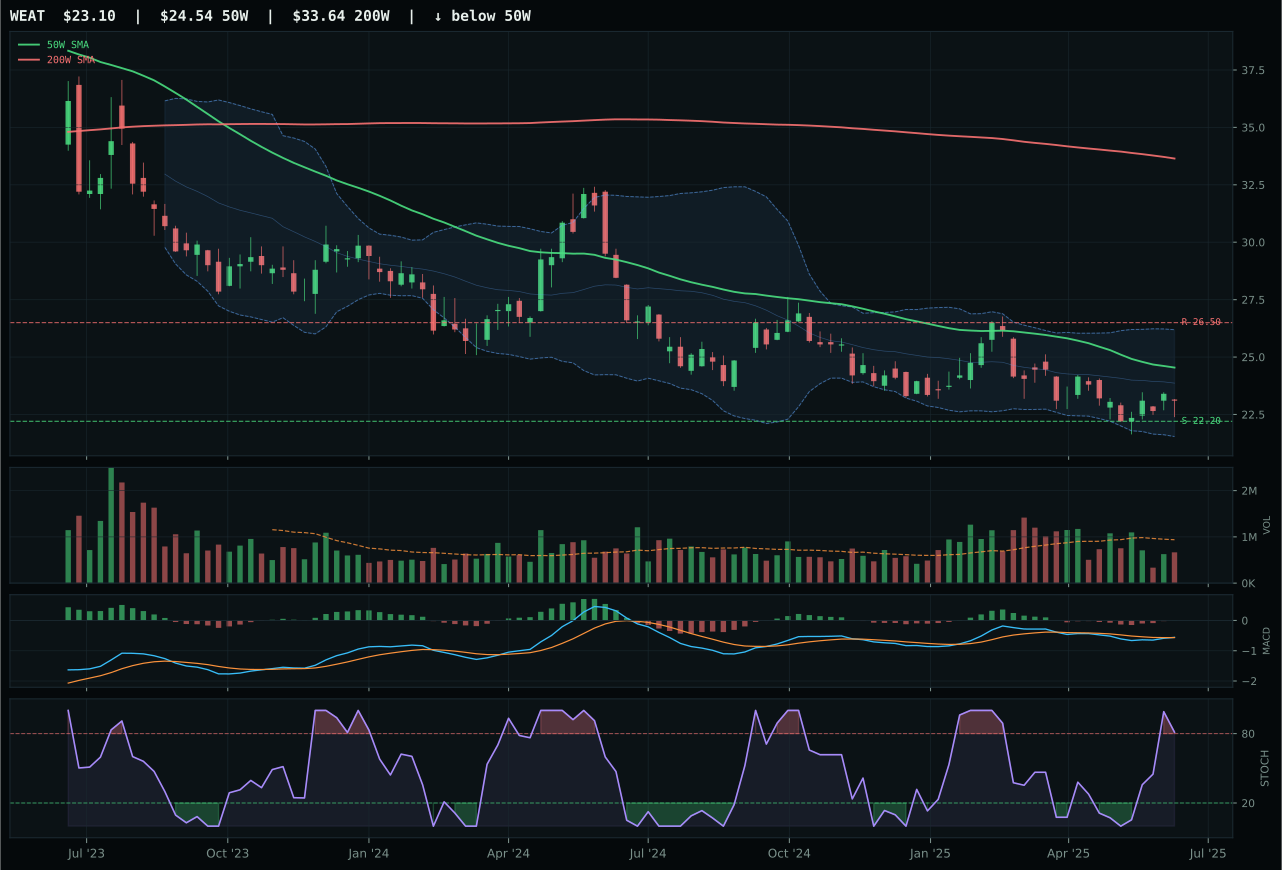
WEAT has a pullback into support profile with -11.6% 13-week relative strength versus SPY.
Extension and support failure are the main tactical risks.
Tracked, but not top-2 eligible because: structurally broken.
Agriculture & Livestock received 0% allocation this week because its category score of 29.6 ranked it 9th or 10th, outside the qualifying range for any capital commitment. The macro fit of 45.0 is deeply underwater: disinflation pressure (-8) actively punishes real assets, and the macro regime itself penalizes any commodity beta play with rising real yields and weakening inflation expectations. Real asset sponsorship (+8) and commodity breadth positive (+5) offer some support, but the 11-point net headwind from disinflation descriptors is insurmountable. MOO's technical evidence of 76.5 is respectable, yet the category-level macro fit drags the entire basket into exclusion territory. To earn a position, the macro regime would need to pivot toward reflation, or an unexpected supply shock would need to activate commodity breadth as the dominant descriptor. Until then, Agriculture remains a zero-weight category, with capital directed toward assets that benefit from disinflation rather than suffering from it.