
2025-06-06
Informational purposes only. The content in this report, including allocations, analysis, and commentary, is provided solely for informational and educational purposes. It does not constitute financial advice, investment advice, trading advice, or any other type of advice. Past performance does not guarantee future results. Always conduct your own research and consult a qualified financial professional before making investment decisions.
Weekly Allocation
| Ticker | Category | Weight | Role |
|---|---|---|---|
| FBTC | 50% | Overlay | |
| SLV | Precious Metals | 10% | Top-2 (10%) |
| XLK | Technology | 10% | Top-2 (10%) |
| XLU | Utilities & Infrastructure | 5% | Tier-2 (5%) |
| URA | Nuclear Energy | 5% | Tier-2 (5%) |
| SMH | AI | 5% | Tier-2 (5%) |
| XAR | Defense & Aerospace | 5% | Tier-2 (5%) |
| IEMG | Emerging Markets | 5% | Tier-2 (5%) |
| COPX | Industrial Metals | 5% | Tier-2 (5%) |
Trade Instructions — Monday Open
Sell the tranche from 2025-05-09 (completing its 4-week hold). Buy the new tranche. Instructions show net portfolio changes — same-asset positions cancel, weight changes show the delta.
| Action | Ticker | Instruction |
|---|---|---|
| SELL | GLD | Sell 25% of GLD position (reduce 10.00% → 7.50%) |
| SELL | XLU | Sell 25% of XLU position (reduce 5.00% → 3.75%) |
| SELL | ITA | Sell 33% of ITA position (reduce 3.75% → 2.50%) |
| SELL | IGV | Sell entire IGV position (1.25% of portfolio) |
| SELL | ILF | Sell 50% of ILF position (reduce 2.50% → 1.25%) |
| SELL | URNM | Sell entire URNM position (1.25% of portfolio) |
| SELL | AIQ | Sell entire AIQ position (1.25% of portfolio) |
| BUY | XLK | Buy XLK — 25.00% of freed cash (adds 2.50% to portfolio) |
| BUY | XAR | Buy XAR — 12.50% of freed cash (adds 1.25% to portfolio) |
| BUY | SMH | Buy SMH — 12.50% of freed cash (adds 1.25% to portfolio) |
| BUY | URA | Buy URA — 12.50% of freed cash (adds 1.25% to portfolio) |
| BUY | IEMG | Buy IEMG — 12.50% of freed cash (adds 1.25% to portfolio) |
| BUY | SLV | Buy SLV — 25.00% of freed cash (adds 2.50% to portfolio) |
Current Portfolio After Trade
Combined holdings across all 4 active tranches. Each tranche is 25% of the portfolio.
| Ticker | % of Portfolio | Weight Bar |
|---|---|---|
| FBTC | 50.00% | |
| GLD | 7.50% | |
| XLK | 6.25% | |
| COPX | 5.00% | |
| PAVE | 5.00% | |
| SMH | 5.00% | |
| URA | 5.00% | |
| XLU | 3.75% | |
| IEMG | 3.75% | |
| ITA | 2.50% | |
| XAR | 2.50% | |
| SLV | 2.50% | |
| ILF | 1.25% |
Macro Regime — Disinflation
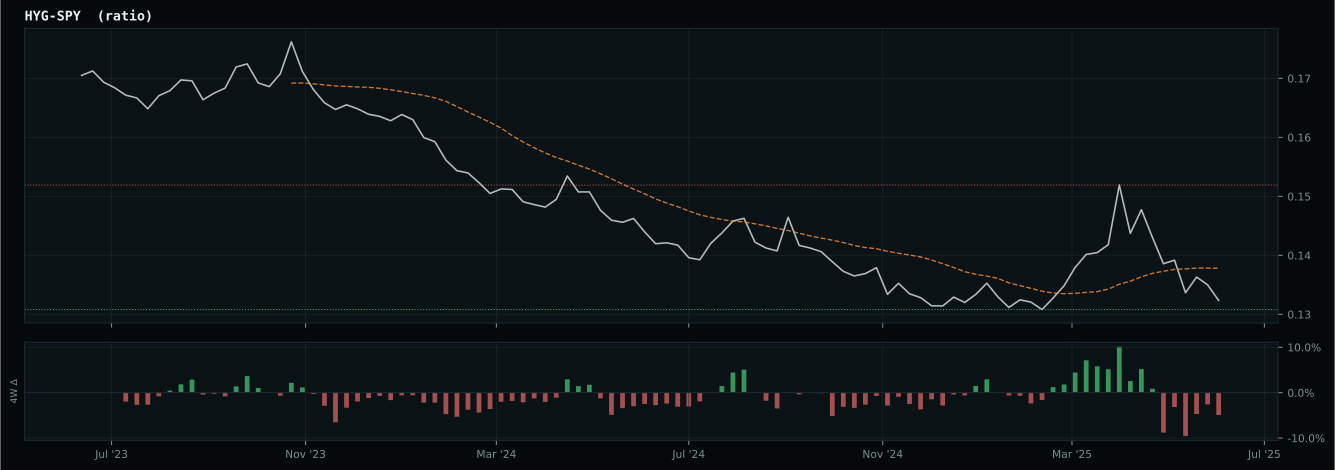
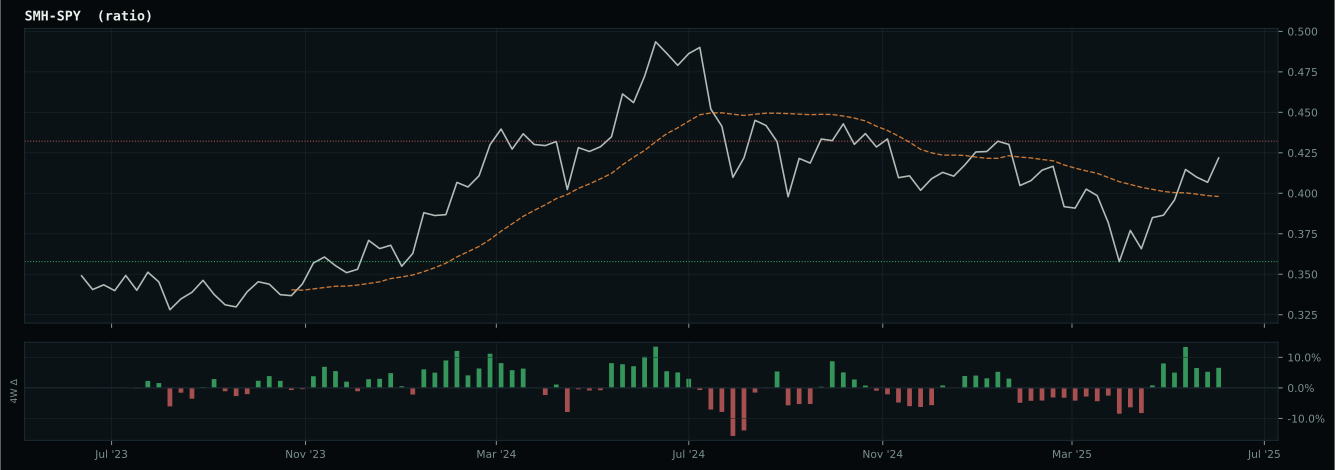
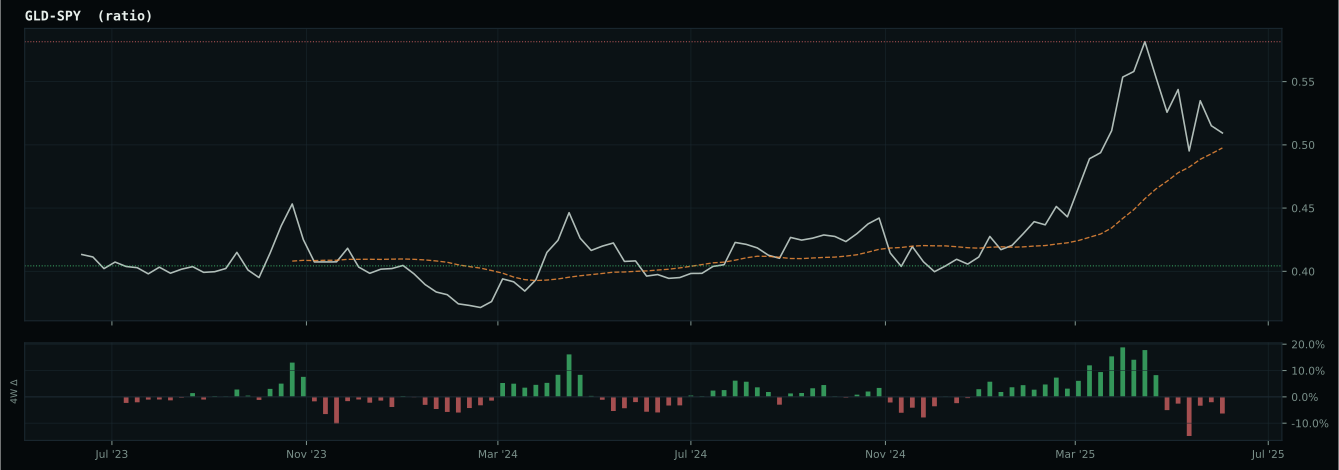
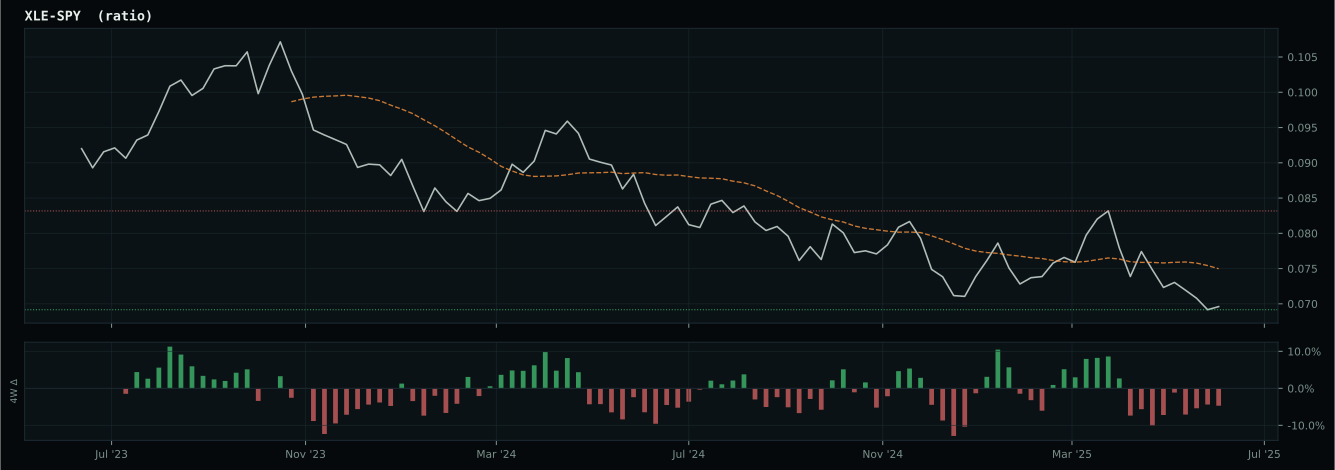
Macro Evidence Charts
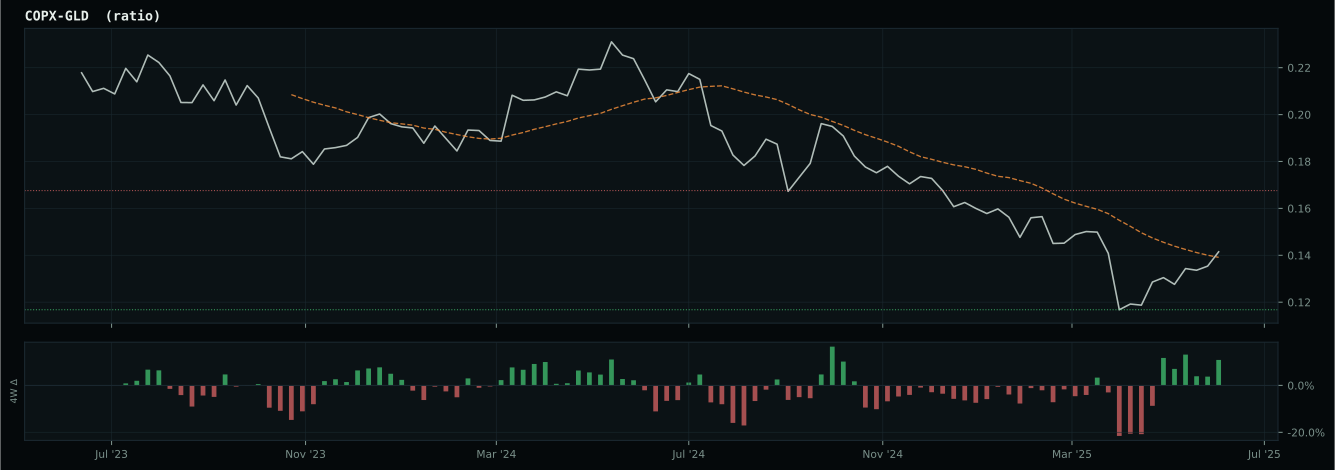
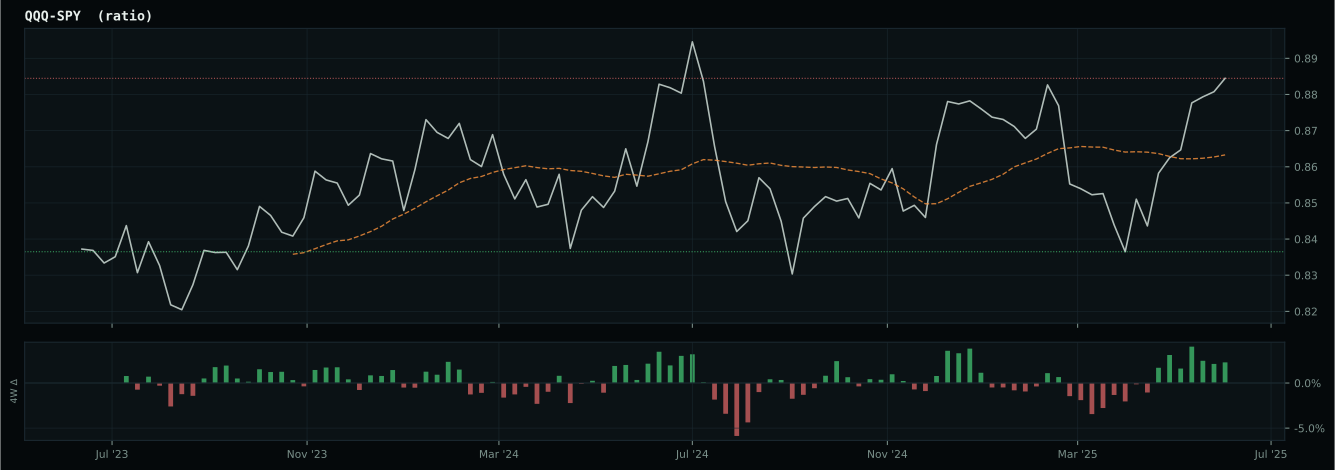
Market-implied signals behind the macro regime scores. Each ratio compares two assets; the direction and slope of the ratio is what the macro engine reads.
Crypto Regime — TrendBTC
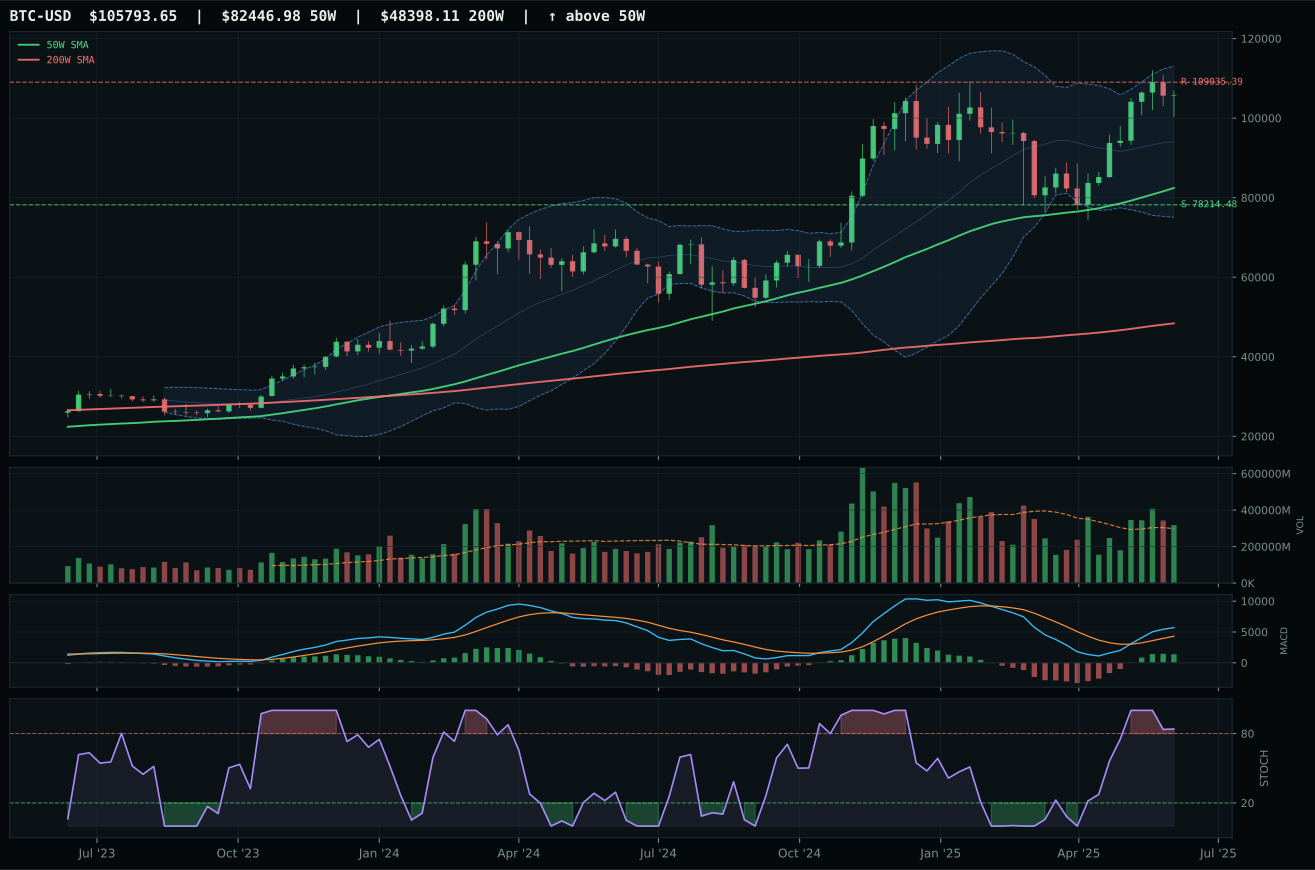
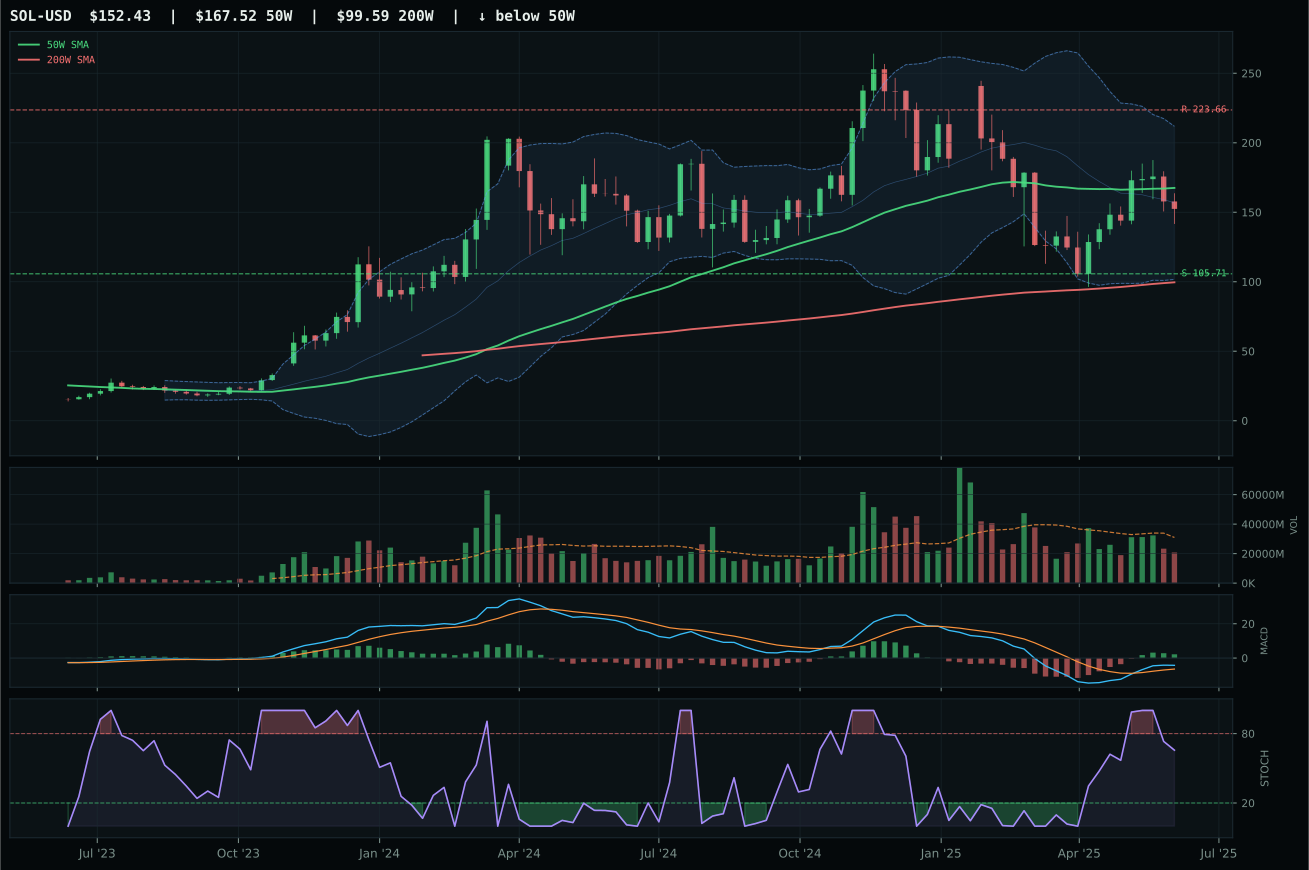
ValueBTC not armed: BTC has not made the first post-breakdown touch of the 200W buy zone after losing the 50W
TrendBTC confirmed: 2 consecutive closes above rising/flat 50W SMA
one or more available conditions failed
Category Rankings
| Rank | Category | Winner | Score | Alloc | 4W Ret | Peers (4W) |
|---|---|---|---|---|---|---|
| 1 | Precious Metals | SLV | 79.3 | 20% | -0.12% | GDX +0.5% · GLD -0.1% |
| 2 | Technology | XLK | 70.3 | 20% | +6.97% | CIBR +2.9% · IGV +4.6% |
| 3 | Utilities & Infrastructure | XLU | 69.4 | 10% | +0.75% | IGF -1.3% · PAVE +4.4% |
| 4 | Nuclear Energy | URA | 67.6 | 10% | +9.39% | NLR +6.8% · URNM +9.7% |
| 5 | AI | SMH | 65.8 | 10% | +10.49% | AIQ +4.7% · BOTZ +2.8% |
| 6 | Defense & Aerospace | XAR | 57.7 | 10% | +3.98% | ITA +2.6% · ROKT +7.1% |
| 7 | Emerging Markets | IEMG | 55.4 | 10% | +2.11% | INDA +0.8% · ILF +3.6% |
| 8 | Industrial Metals | COPX | 37.3 | 10% | +5.06% | PICK +2.3% · REMX +4.1% |
| 9 | Agriculture & Livestock | MOO | 29.2 | 0% | +2.46% | VEGI +1.0% · WEAT -2.6% |
| 10 | Traditional Energy | FCG | 12.6 | 0% | +0.74% | XOP +3.7% · XLE +3.3% |
Precious Metals — SLV
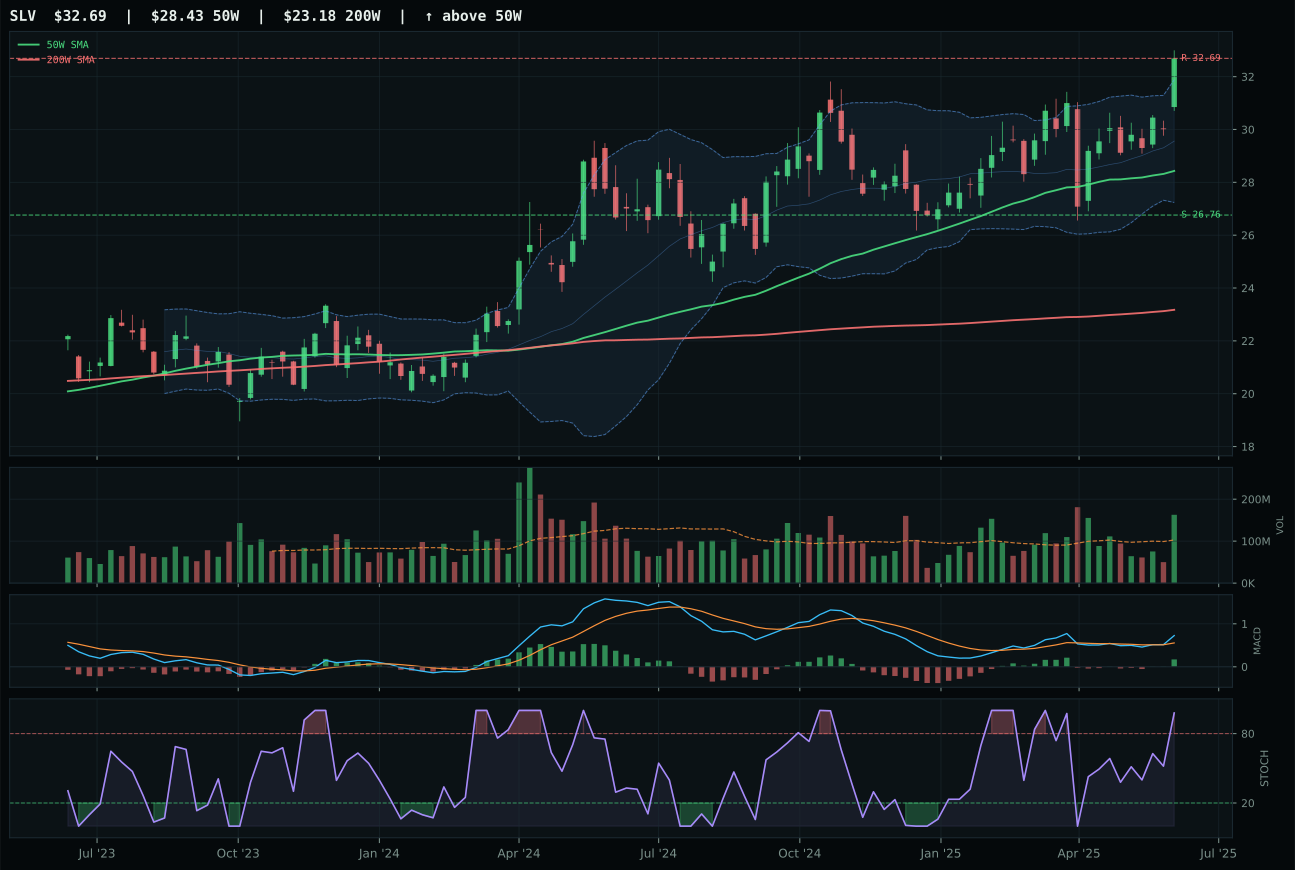
SLV has a neutral structure profile with 6.4% 13-week relative strength versus SPY.
A failed hold above support would weaken the setup.
Actionable but governed by invalidation levels.
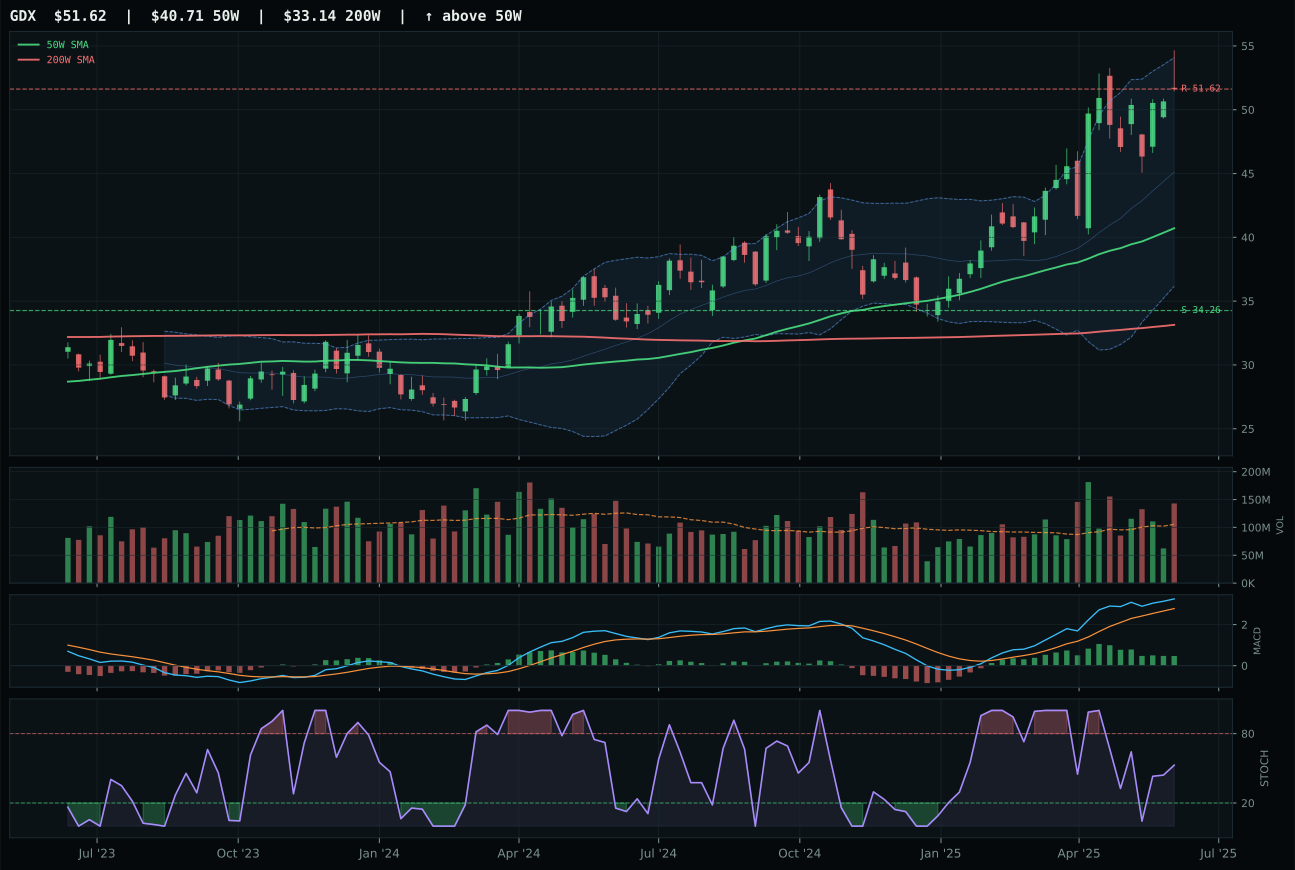
GDX has a vertical extension profile with 19.9% 13-week relative strength versus SPY.
A failed hold above support would weaken the setup.
Actionable but governed by invalidation levels.
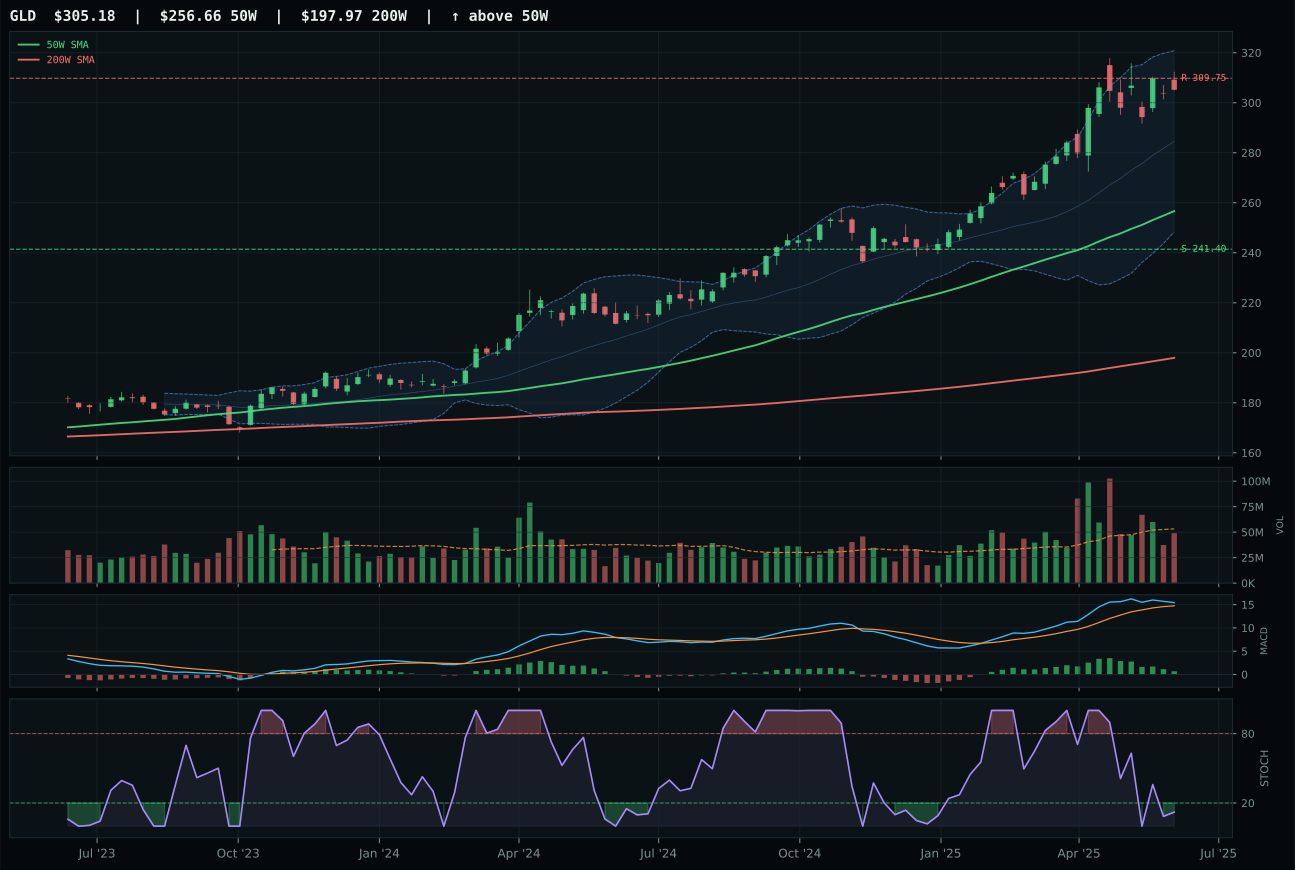
GLD has a vertical extension profile with 9.7% 13-week relative strength versus SPY.
A failed hold above support would weaken the setup.
Actionable but governed by invalidation levels.
SLV dominated the precious metals category with an 87.1 reasoned score and clinched top-2 by posting a 79.3 final composite—the highest in the portfolio alongside Technology. The setup combines perfect trend confirmation (100.0 from price above both moving averages and +6.4% RS versus SPY) with accumulation-strength volume at 1.58x the 20W average, a tell that large hands are moving into silver despite it being 15.0% extended from the 50W. GDX's 74.6 reasoned score couldn't match because at 26.8% above the 50W, it has morphed into a leveraged bet that depends on sustained monetary premium—riskier entry without better conviction metrics. SLV's volume-price confirmation scores 92.2 and persistence 81.2, the highest in the portfolio, indicating that momentum is being sustained by accumulated positions rather than speculative rebalancing. The 59.0 timing score reflects measured distance from the 50W; GDX's flattening MACD and slowing stochastic confirm deterioration in the driver trend.
Precious Metals at 10% allocation (matching Technology at 20%) reflects the second-highest category score (79.3) and the strongest macro fit score across all ten categories (74.0 out of 100), a combination that is almost impossible to dismiss. Monetary hedge bid active (+7 macro points), metals scarcity active (+7), and disinflation helping this exposure (+8) create a rare environment where technical evidence (95.6 out of 100 for SLV) aligns perfectly with regime mechanics. Liquidity stress (minus-5) and risk appetite positive (minus-4 at category level) create modest headwinds, yet the net macro picture is decisively favorable. SLV's 15.0% extension from the 50W is material and introduces entry risk, but the volume-price confirmation at 92.2 is the highest signal in the portfolio this week—institutions are accumulating, not distributing. This is precisely the category-regime convergence that justifies top-2 status: not just strong technicals, but strong technicals in a macro environment explicitly designed to support precious metals. A breakdown of accumulation-level volume or a shift in the monetary hedge bid descriptor would immediately threaten this allocation.
Technology — XLK
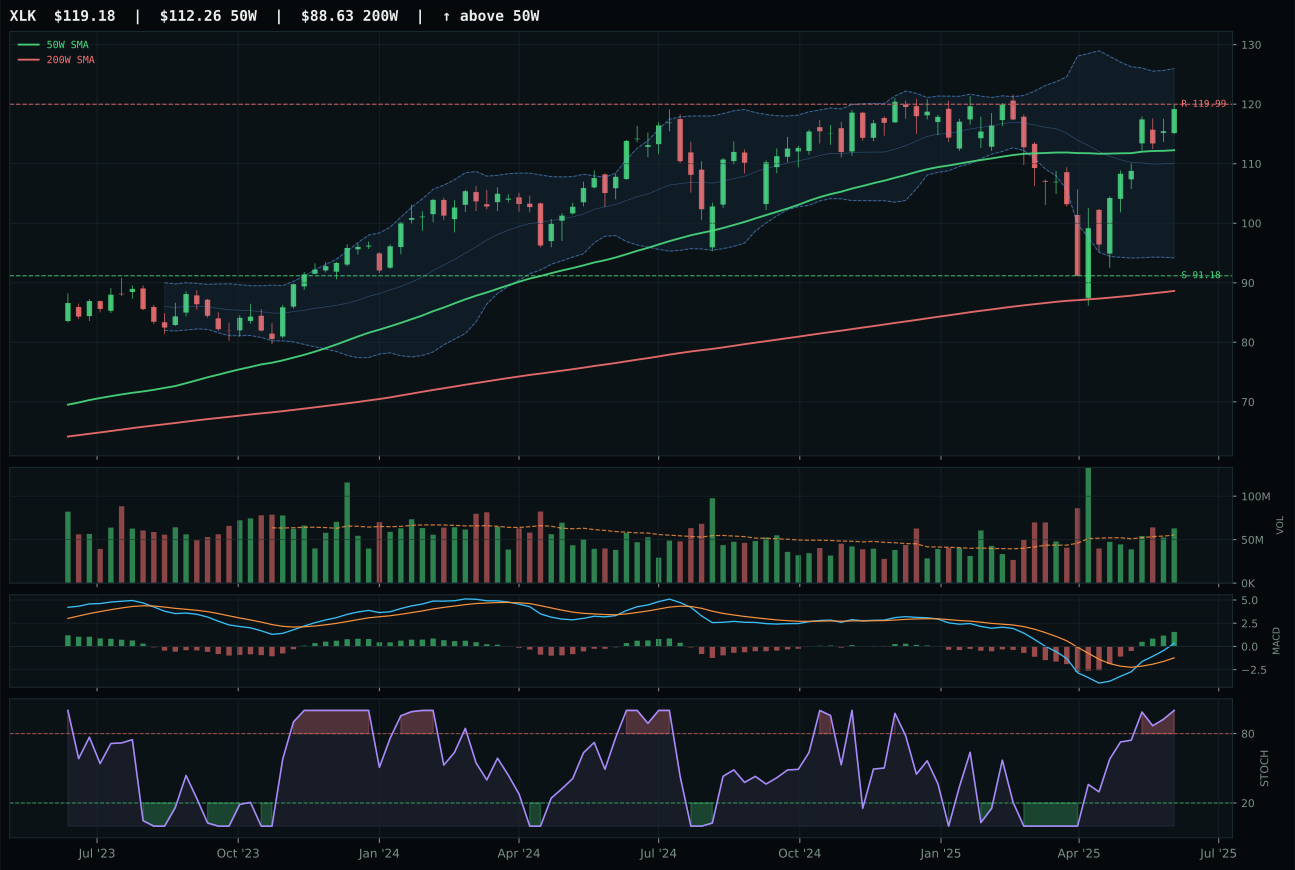
XLK has a neutral structure profile with 5.0% 13-week relative strength versus SPY.
A failed hold above support would weaken the setup.
Actionable but governed by invalidation levels.
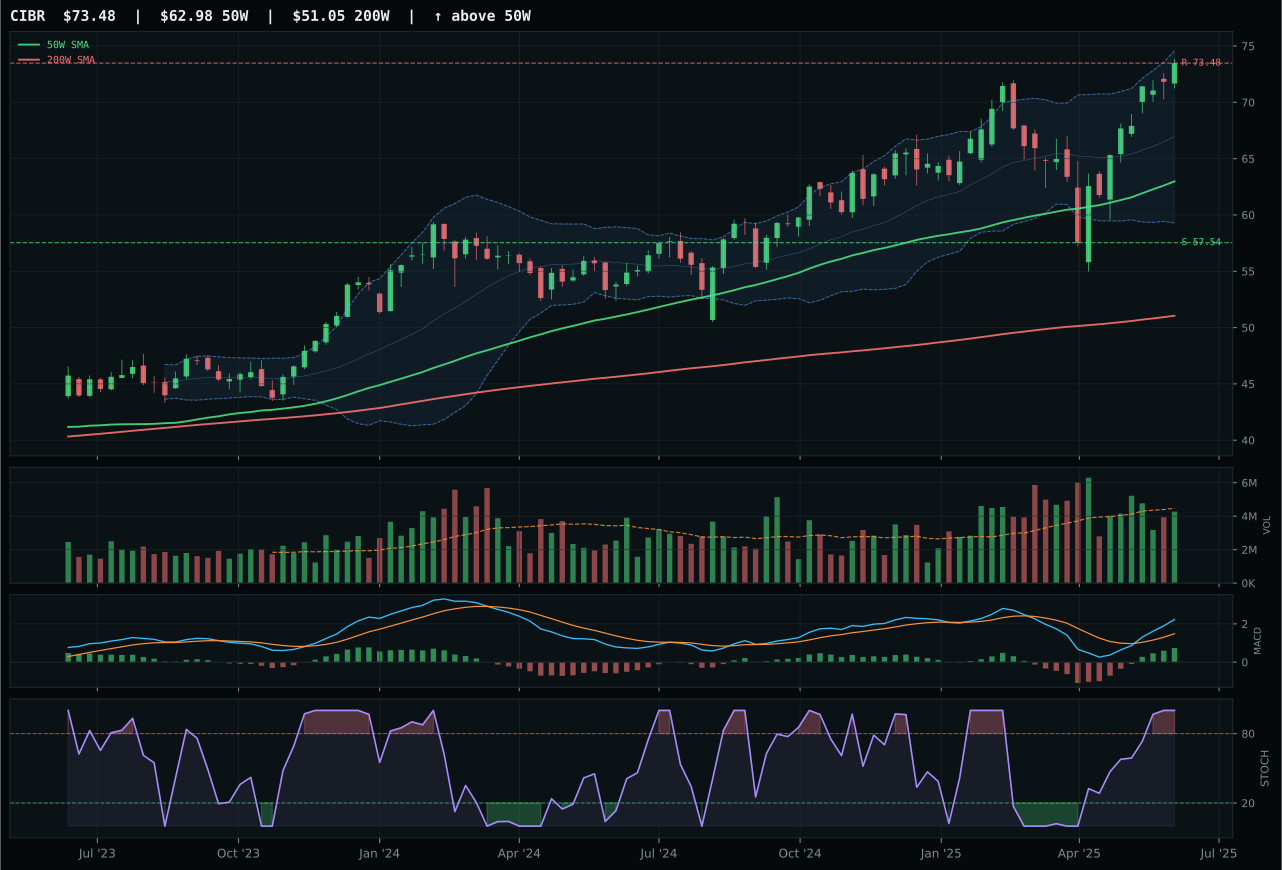
CIBR has a vertical extension profile with 7.4% 13-week relative strength versus SPY.
A failed hold above support would weaken the setup.
Actionable but governed by invalidation levels.
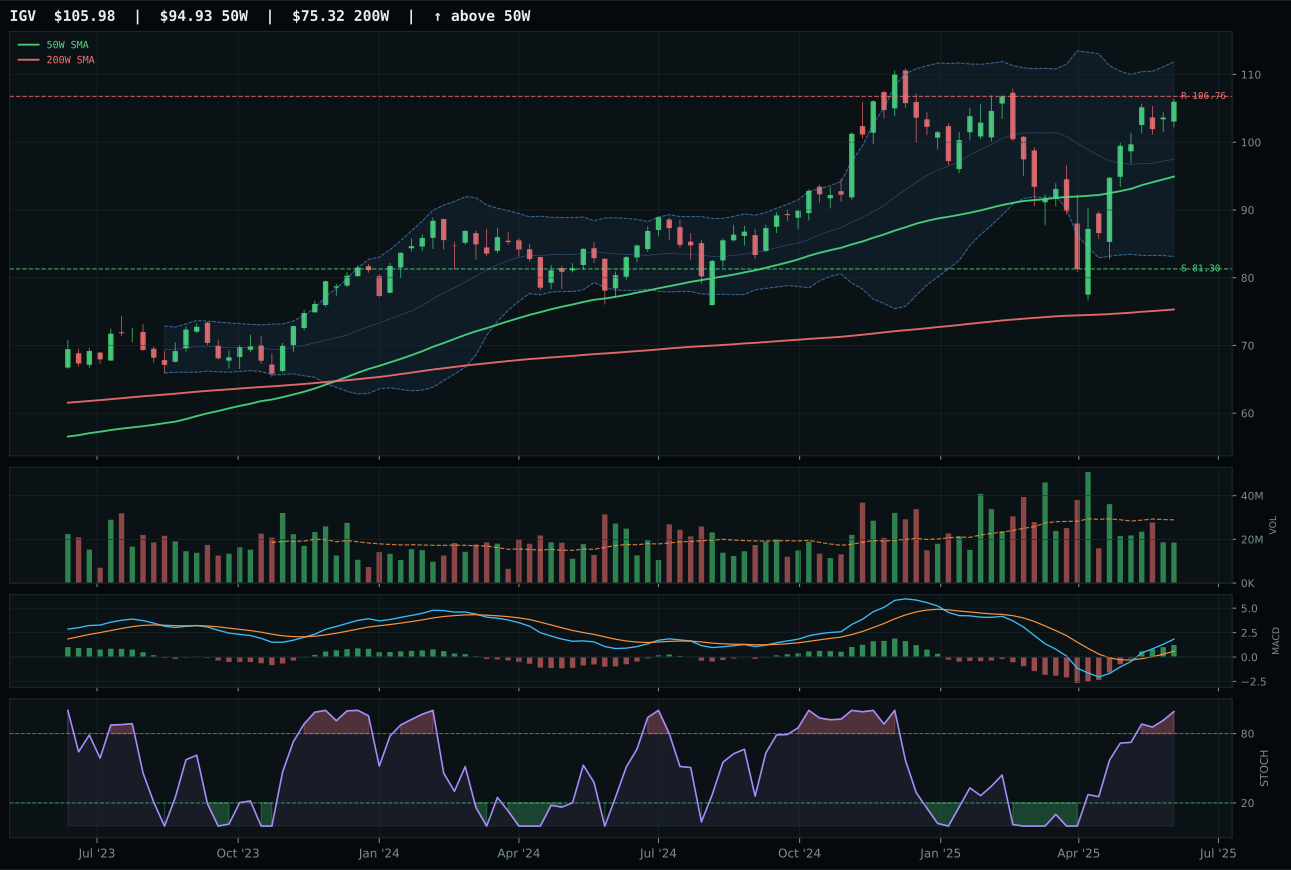
IGV has a neutral structure profile with 9.4% 13-week relative strength versus SPY.
A failed hold above support would weaken the setup.
Actionable but governed by invalidation levels.
XLK captured the category by maintaining price above both the 50W and 200W with a measured 0.1% slope—clean enough to trust without feeling stretched. The 5.0% outperformance versus SPY paired with above-average volume participation at 1.14x confirms that accumulation is driving the move rather than late chasing. CIBR's 16.7% distance from the 50W exposed it as the extended play; at that depth, timing became the weak link with a 37.0 score versus XLK's 82.0, and MACD confirmation couldn't overcome the structural risk. XLK sits near the Fib 0.786 retracement at 114.31—a value-zone anchor where 30.7% downside to support offsets the lack of upside room, but the setup remains neutral and sponsorship clear.
Technology earned its 10% slot as the third-ranked category overall, behind Precious Metals (79.3) and Precious Metals (79.3), by delivering credible technical evidence (85.8 out of 100) that survives disinflation headwinds when macro fit is weighted at only 38% of the final score. The active macro descriptors cut both ways: risk appetite positive and AI growth sponsorship inject plus-13 points of macro support, but liquidity stress drains minus-9 and credit stress subtracts another minus-6, leaving category-level macro fit at a neutral 60.0. This is precisely the environment where Technology belongs in the core allocation rather than the top two—strong technicals, no macro tailwind, and enough relative strength within the basket to justify holding without being forced to choose between it and categories with cleaner macro alignment. A meaningful dip below the 50W or deterioration in above-average volume participation would immediately threaten the 10% position; conversely, if risk appetite remains active and liquidity stress reverses, Technology could graduate to top-2 status within weeks.
Utilities & Infrastructure — XLU
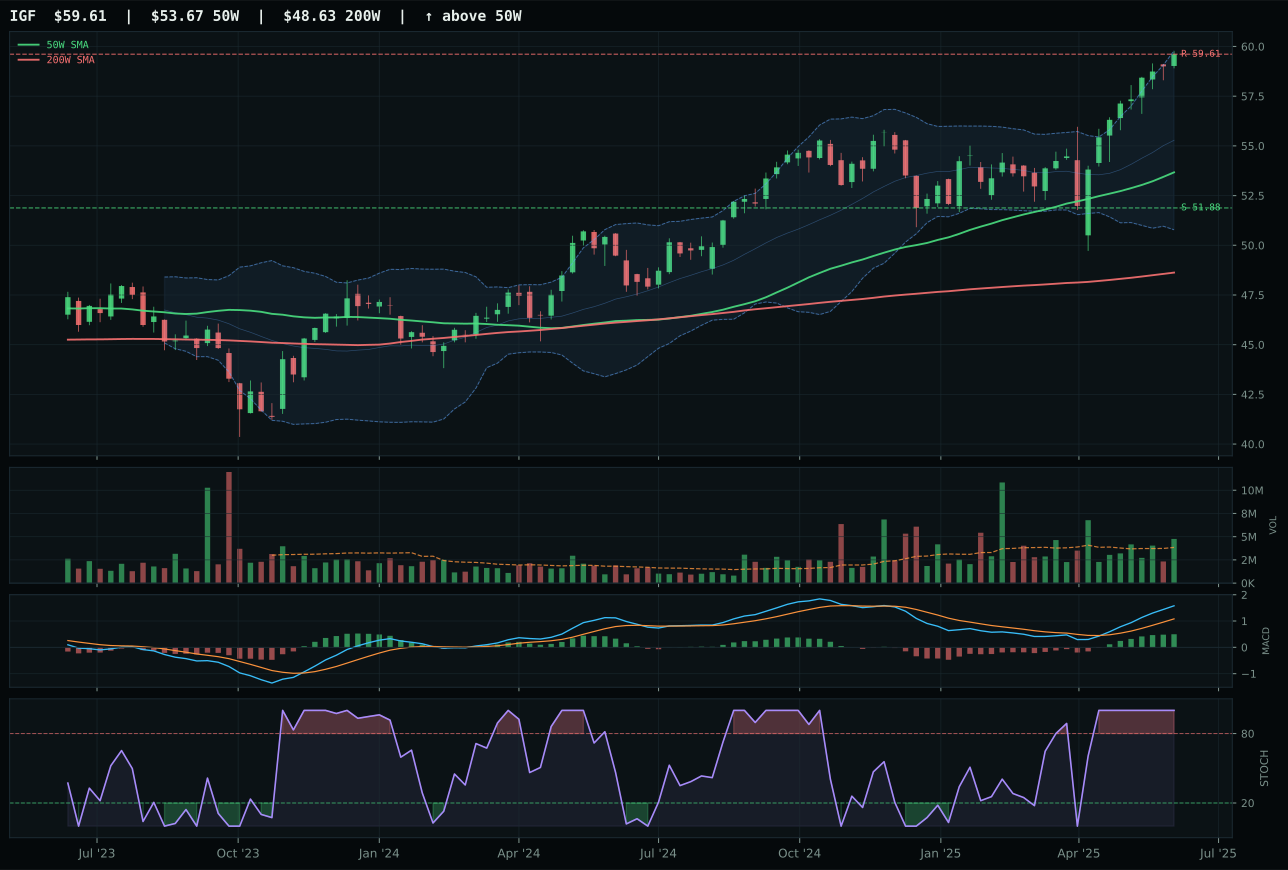
IGF has a neutral structure profile with 8.5% 13-week relative strength versus SPY.
A failed hold above support would weaken the setup.
Actionable but governed by invalidation levels.
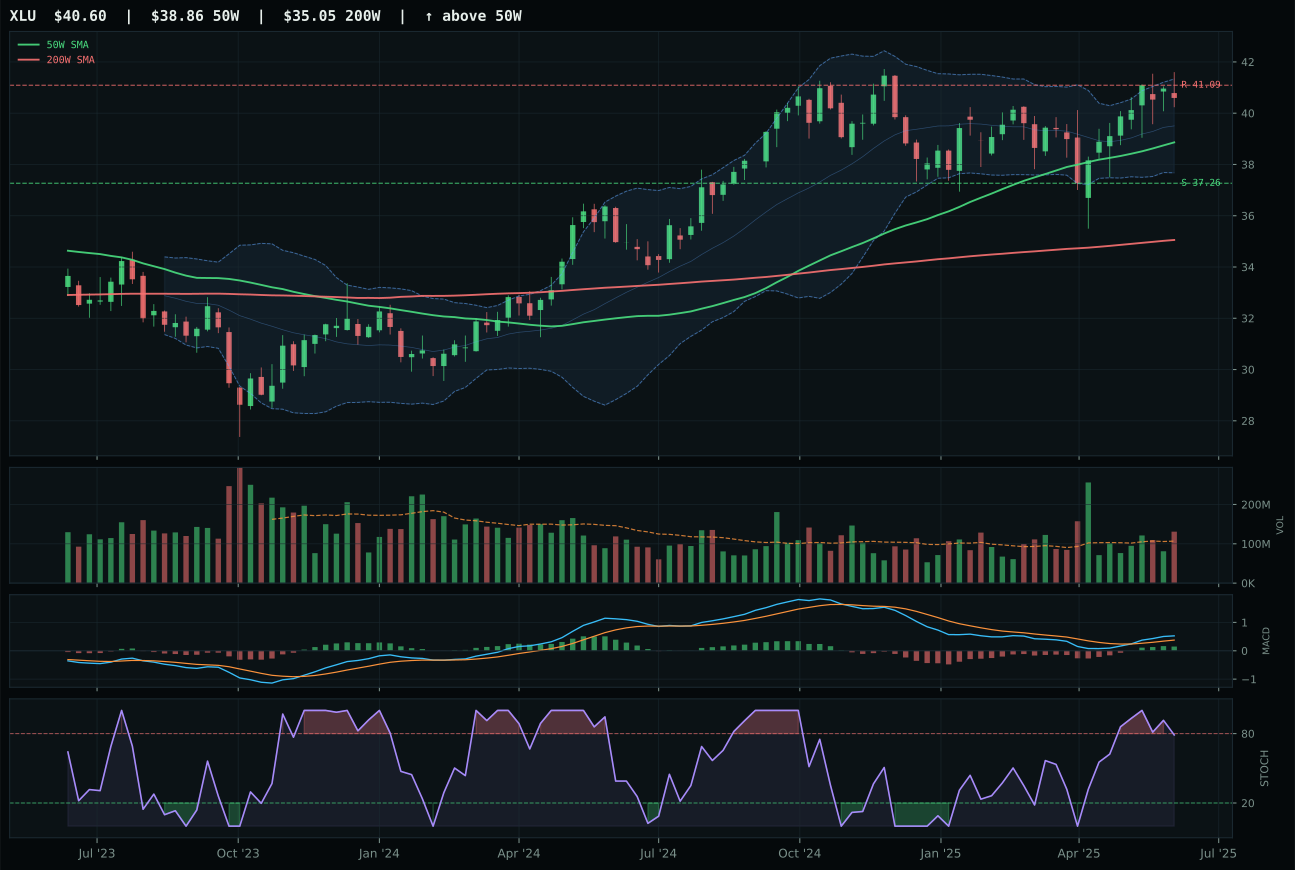
XLU has a neutral structure profile with 1.0% 13-week relative strength versus SPY.
A failed hold above support would weaken the setup.
Actionable but governed by invalidation levels.
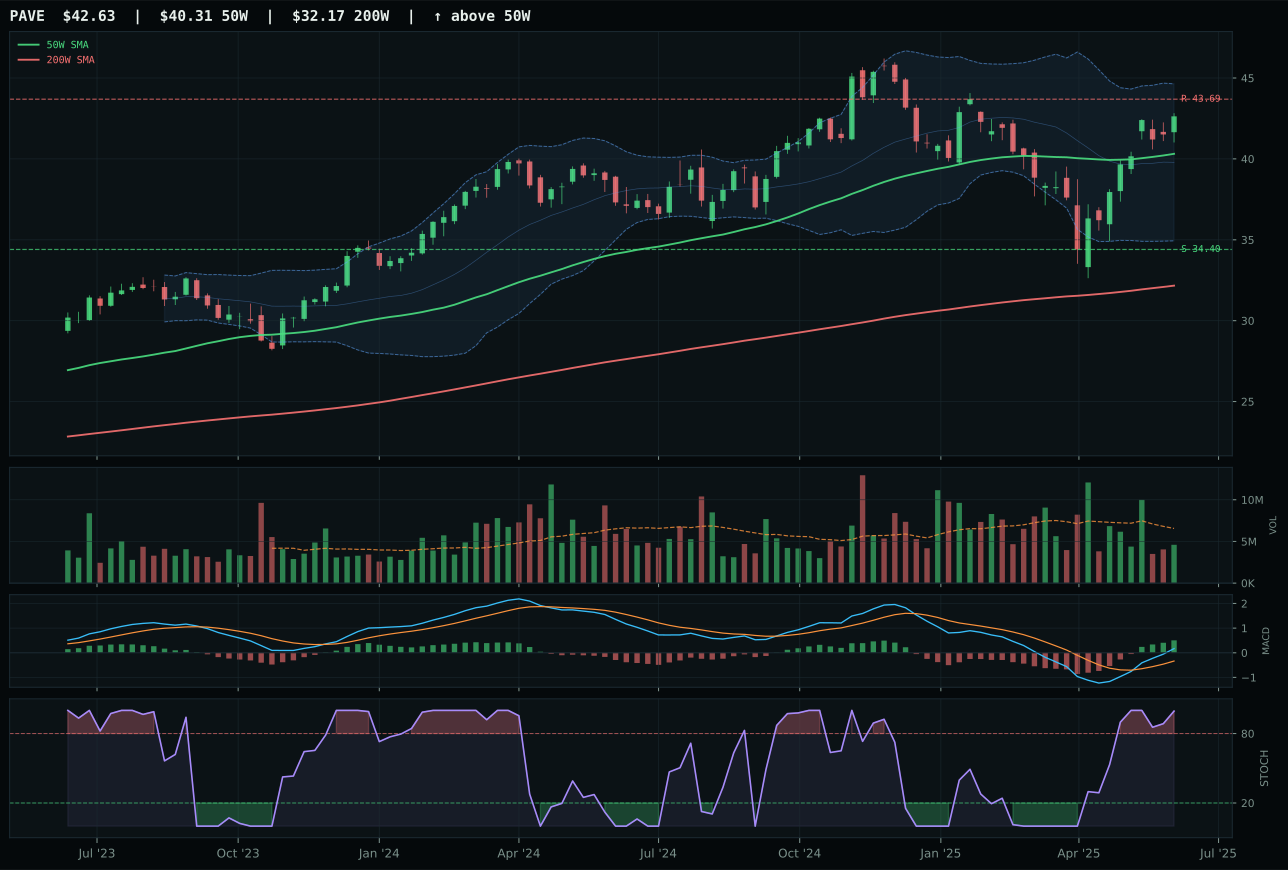
PAVE has a neutral structure profile with 5.7% 13-week relative strength versus SPY.
A failed hold above support would weaken the setup.
Actionable but governed by invalidation levels.
XLU edged IGF to claim the category representative slot despite IGF posting a superior 90.7 technical evidence score, because XLU's 90.0 timing score and 4.5% distance from the 50W demonstrated safer entry than IGF's 11.1% extension near the 52W high. Both trade above both moving averages with bullish-improving MACD, but XLU's falling/neutral stochastic at 0.79 signals momentum is maturing and consolidating—precisely the pattern that justifies entry into regulated utility defense. IGF's overbought momentum and extended setup mean the low-correlation benefits that utilities provide are already priced in; XLU captures the same defensive exposure with more prudent timing. Category-relative strength favors XLU by -4.7% versus IGF's 2.8%, meaning defensive capital is rotating toward the more measured setup. At 47.4 risk-reward score, both compress upside to -1.2% against modest 8.9% downside—a defensive structure where duration sensitivity, not growth, drives returns. XLU's 1.0% RS versus SPY and 5.0% 13W return confirm this is a zero-beta, negative-convexity play.
Utilities & Infrastructure at 5% allocation (ranked fifth with 69.4 category score) reflects solid technical evidence (76.3 for XLU) paired with favorable macro fit (62.0 out of 100), where disinflation helping this exposure (+7) and disinflation pressure active (+6) create a structural tailwind that justifies holding despite sixth-tier category ranking. XLU's trend score of 100.0 combined with 90.0 timing creates a portfolio-valuable setup: downside protection through 8.9% support cushion paired with bullish technical confirmation. Risk appetite positive (minus-2 at category level) and liquidity stress (minus-3) create modest headwinds that prevent top-2 consideration, yet the macro regime clearly favors defensive yield-oriented assets in disinflation. The 5% allocation is justified as a macro satellite that hedges portfolio duration and inflation expectations; if rates continue falling or if risk appetite deteriorates, XLU's defensive positioning becomes more valuable. However, if risk appetite reverses sharply or if rate expectations stabilize, the allocation pressure increases immediately—XLU would drop to 0% if it loses trend confirmation (closing below the 50W) or if category-relative strength turns decisively negative, signaling IGF's momentum lead.
Nuclear Energy — URA
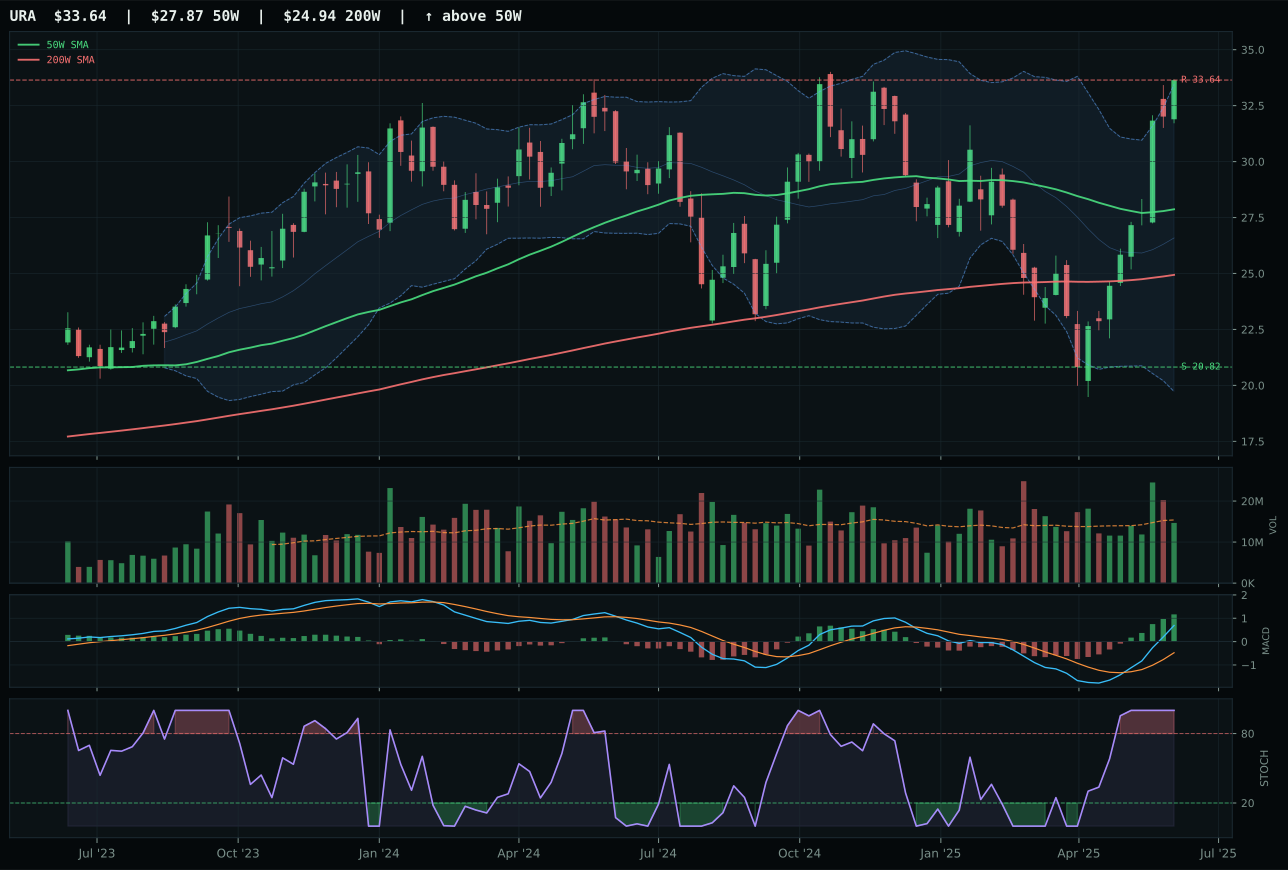
URA has a vertical extension profile with 36.5% 13-week relative strength versus SPY.
A failed hold above support would weaken the setup.
Actionable but governed by invalidation levels.
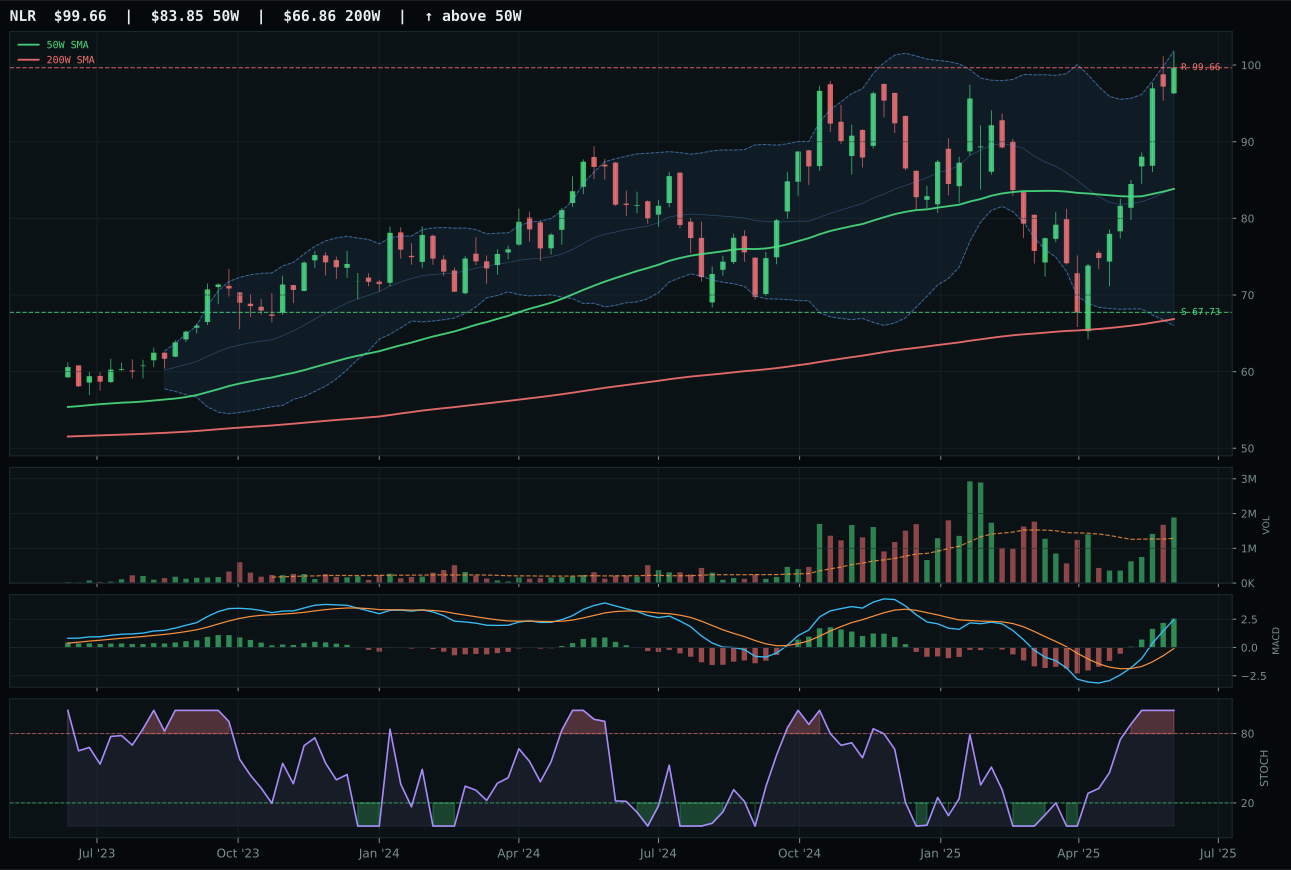
NLR has a vertical extension profile with 27.5% 13-week relative strength versus SPY.
A failed hold above support would weaken the setup.
Actionable but governed by invalidation levels.
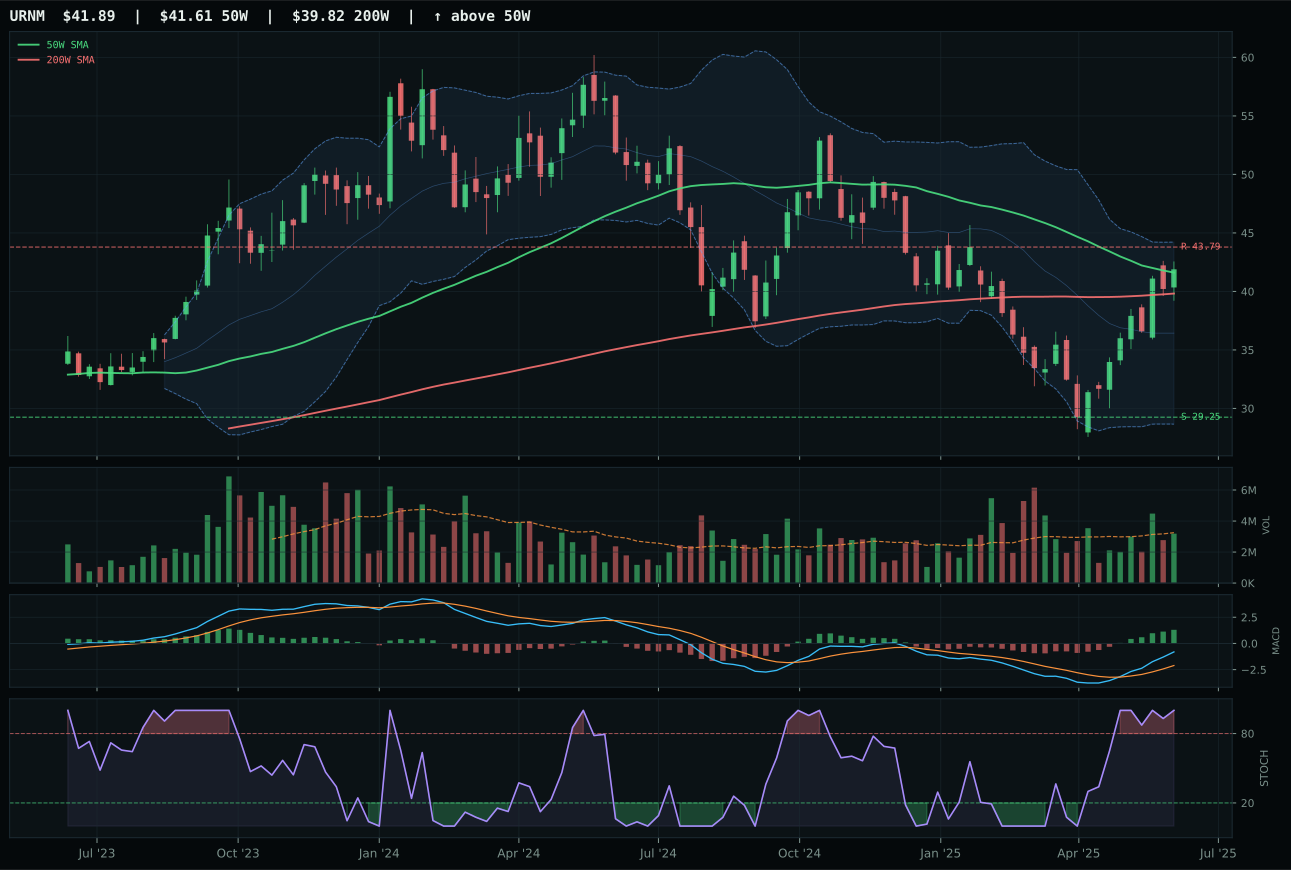
URNM has a compression near 50W profile with 21.2% 13-week relative strength versus SPY.
A failed hold above support would weaken the setup.
Actionable but governed by invalidation levels.
URA and NLR posted nearly identical composite scores of 72, with URA's 9.0% category-relative strength overcoming NLR's superior technical evidence (90.9 versus 83.3) to claim the representative slot. Both are extended 20%+ above the 50W near the 52W high, both show bullish-improving MACD and overbought momentum; the divergence lies in breadth and accumulation pattern. URA's 36.5% RS versus SPY and 40.5% 13W return demonstrate that uranium as a dedicated theme is winning hearts faster than NLR's balanced nuclear utility approach—higher conviction, more momentum, less diversification. URA's neutral volume at 0.95x and vertical extension structure mean the move is momentum-driven, not foundational accumulation; NLR's above-average volume suggests institutional accumulation into a steadier trade. The 37.0 timing score reflects the extension penalty both carry; at the 52W high with 0.0% upside to resistance, risk-reward has inverted to 61.6% downside versus 0.0% upside—a setup that works only if momentum persistence (100.0 score) remains unbroken.
Nuclear Energy at 5% allocation (ranked sixth overall with 67.6 score) holds because technical evidence (83.3 for URA) survives a neutral macro fit (50.0 out of 100) where category-specific descriptors are unavailable, forcing reliance on broader regime signals. Real asset sponsorship (+7 macro points) and AI growth sponsorship (+5) provide light support, yet liquidity stress (minus-7) and credit stress (minus-5) create offsetting pressure that leaves macro fit genuinely neutral. The 5% position is justified purely on URA's technical momentum and 90.0 persistence score, which together suggest the move has institutional sponsorship beyond speculative overbought conditions. However, the 20.7% extension from the 50W combined with 37.0 timing score creates meaningful entry risk; this is a satellite hold justified by momentum breadth (SMH, IEMG, and URA all showing strong 13-week returns) rather than macro conviction. URA would drop to 0% immediately if it closes below the 50W on volume expansion or if AI growth sponsorship descriptor reverses; conversely, a fresh high on above-average volume would suggest resetting the technical setup and justify increasing to 10%.
AI — SMH
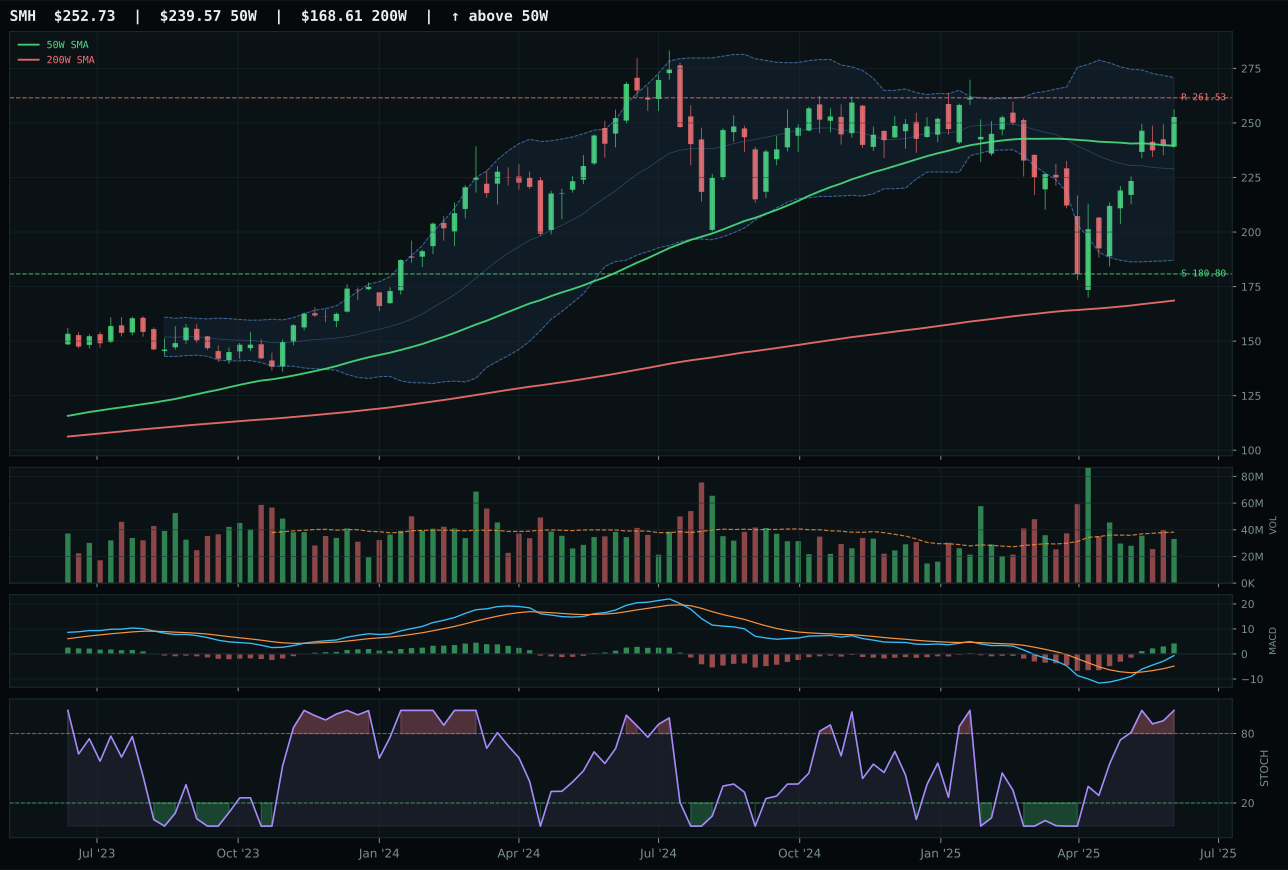
SMH has a neutral structure profile with 8.2% 13-week relative strength versus SPY.
A failed hold above support would weaken the setup.
Actionable but governed by invalidation levels.
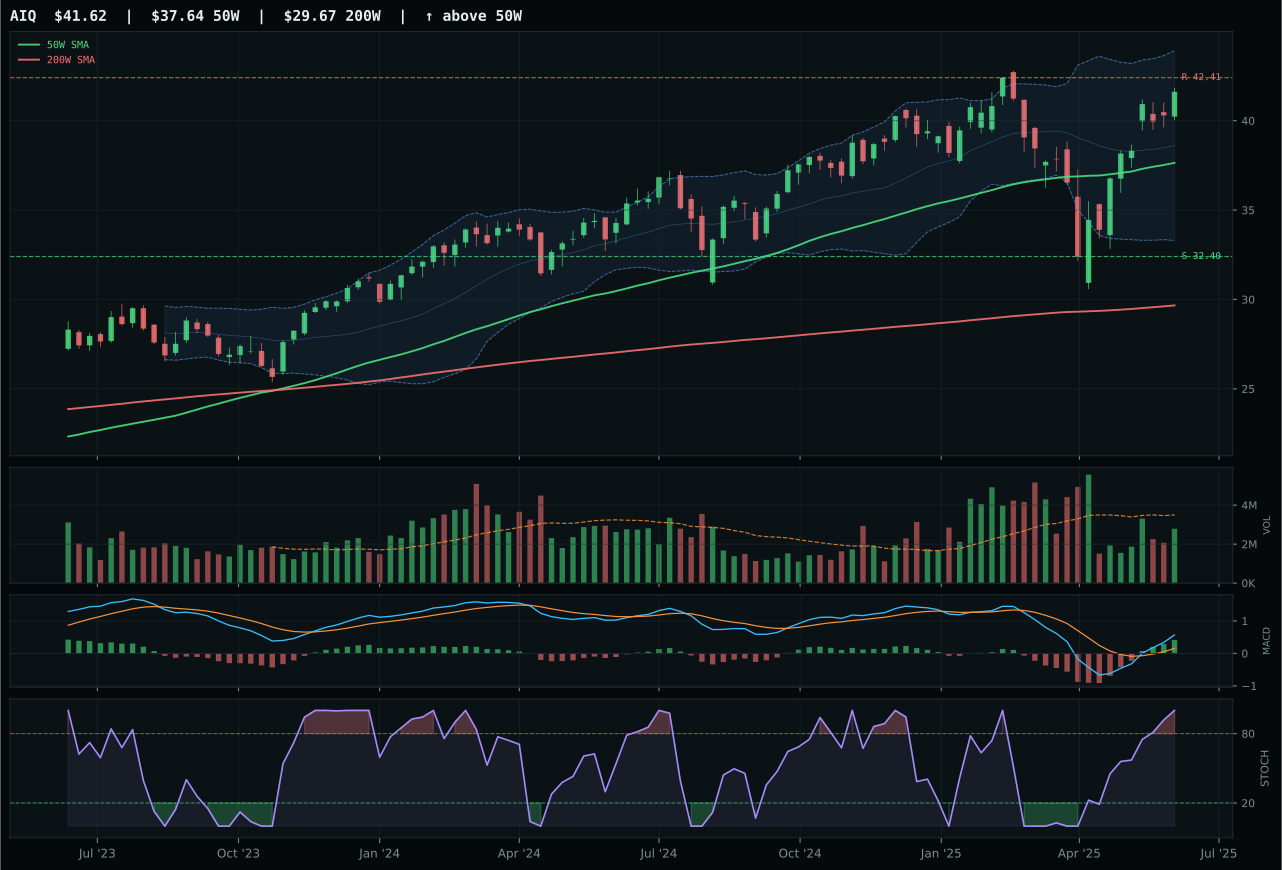
AIQ has a neutral structure profile with 4.2% 13-week relative strength versus SPY.
A failed hold above support would weaken the setup.
Actionable but governed by invalidation levels.
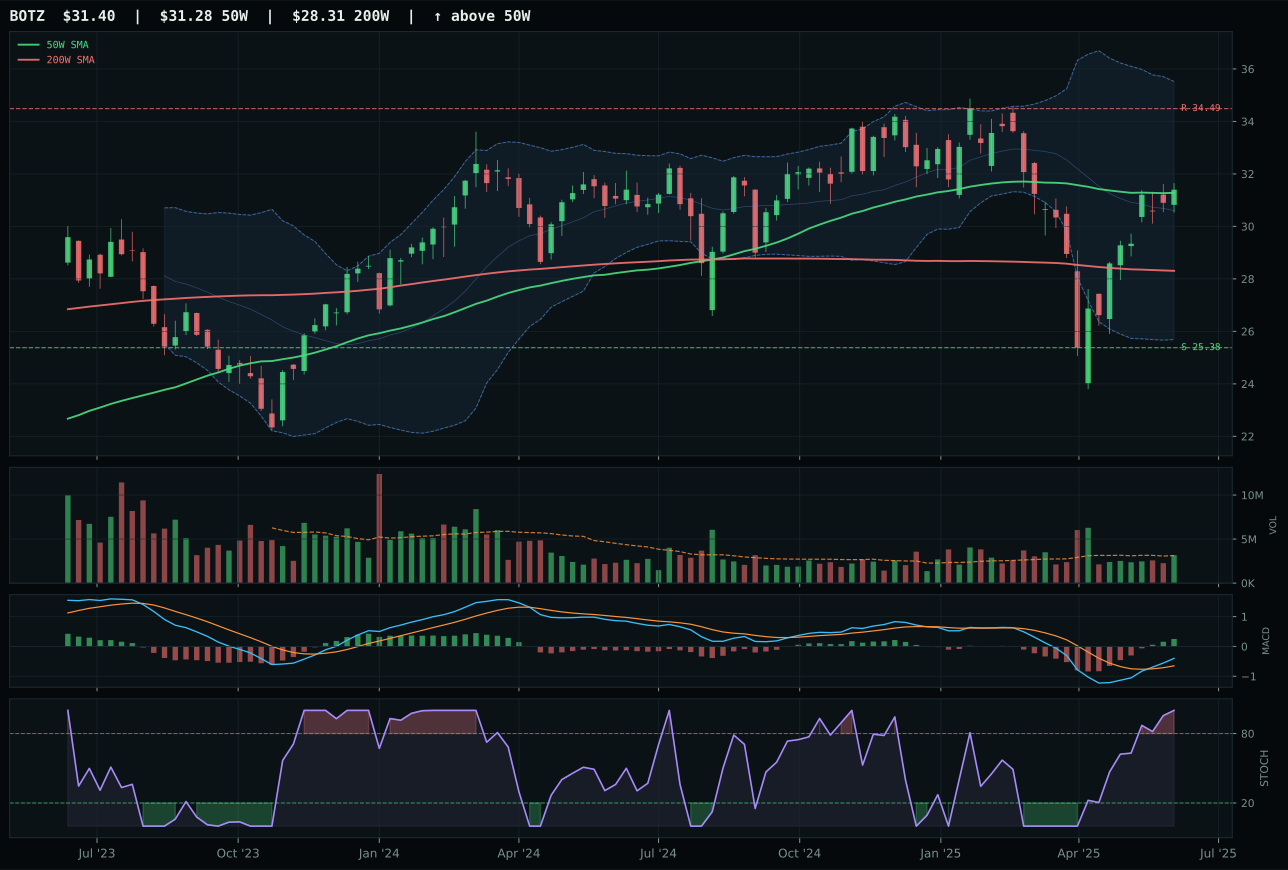
BOTZ has a compression near 50W profile with -3.5% 13-week relative strength versus SPY.
A failed hold above support would weaken the setup.
Actionable but governed by invalidation levels.
SMH edged AIQ by a razor-thin 0.3-point margin—close enough that category-relative strength became decisive. Both showed 8.2% and 4.2% RS versus SPY respectively, but SMH's 75.0 timing score beat AIQ's 59.0 because its 5.5% distance from the 50W left room for conviction without overextension. The 12.3% 13W return and perfect 100.0 momentum confirmation demonstrate sustained buying in the semiconductor space, while neutral volume at 0.87x means the move isn't yet exhausted by retail. AIQ stretched 10.6% from the 50W and failed to generate category leadership—a structural penalty in a regime where breadth matters. Both trade overbought momentum, but SMH's setup—neutral rather than extended—tips the representative decision in favor of compute infrastructure over broader application software.
AI at 5% allocation ranks below top-2 territory despite a respectable 65.8 category score because the macro fit (59.0 out of 100) is sandwiched between two structurally stronger categories and the representative's vertical extension leaves limited runway without another accumulation signal. AI growth sponsorship (+14 macro points) and risk appetite positive (+10) provide genuine support, yet liquidity stress (minus-12) and credit stress (minus-8) create drag that no amount of tech momentum can overcome when competing for scarce allocation capital. The case for holding 5% is straightforward: SMH's overbought stochastic and improving MACD confirm momentum remains intact, and the category's technical evidence (84.1 out of 100) justifies a satellite position even if macro is neutral. To breach the top-2, AI would need either a fresh compression near the 50W to reset timing and entry risk, or a meaningful macro shift that elevates AI growth sponsorship from active-descriptor status to category-specific tailwind; neither condition exists this week.
Defense & Aerospace — XAR
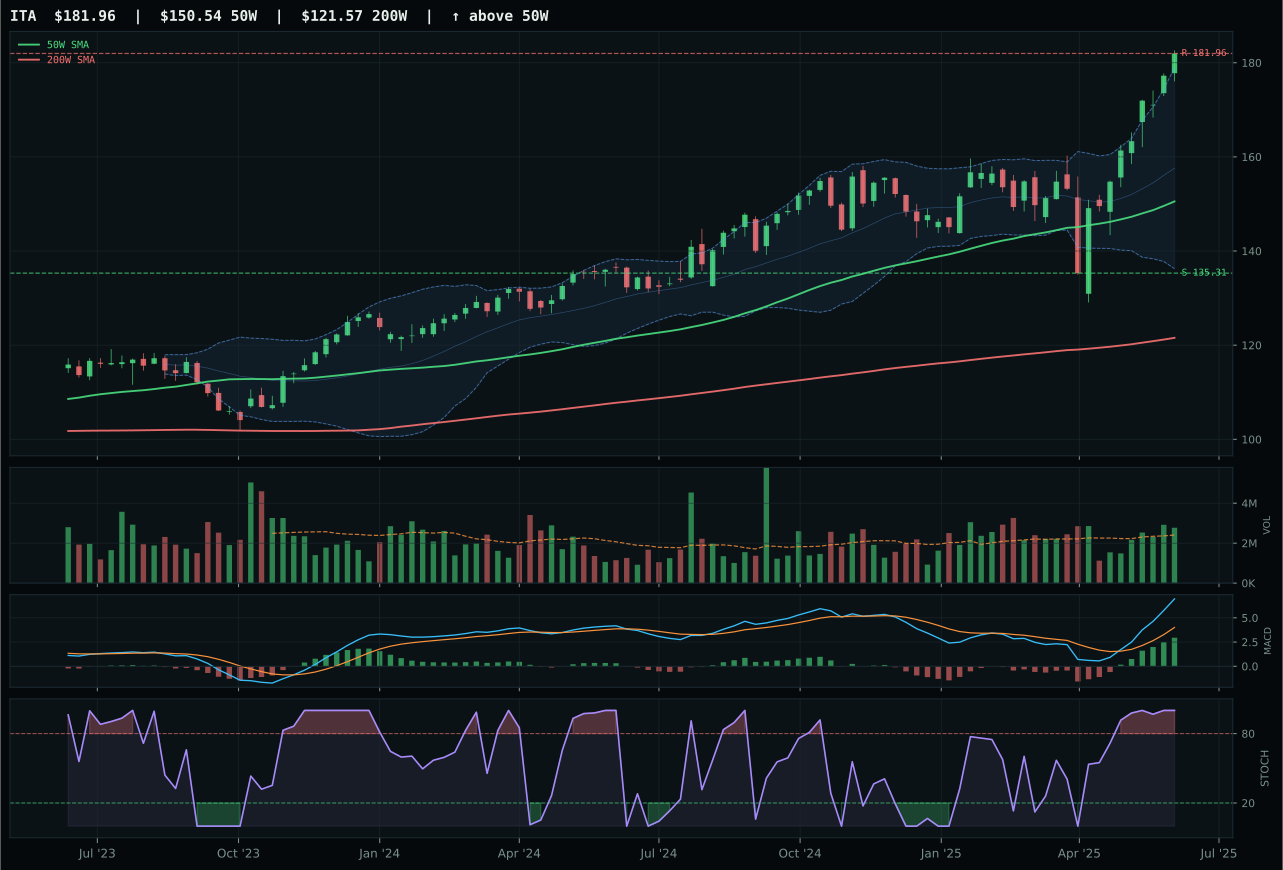
ITA has a vertical extension profile with 17.5% 13-week relative strength versus SPY.
A failed hold above support would weaken the setup.
Actionable but governed by invalidation levels.
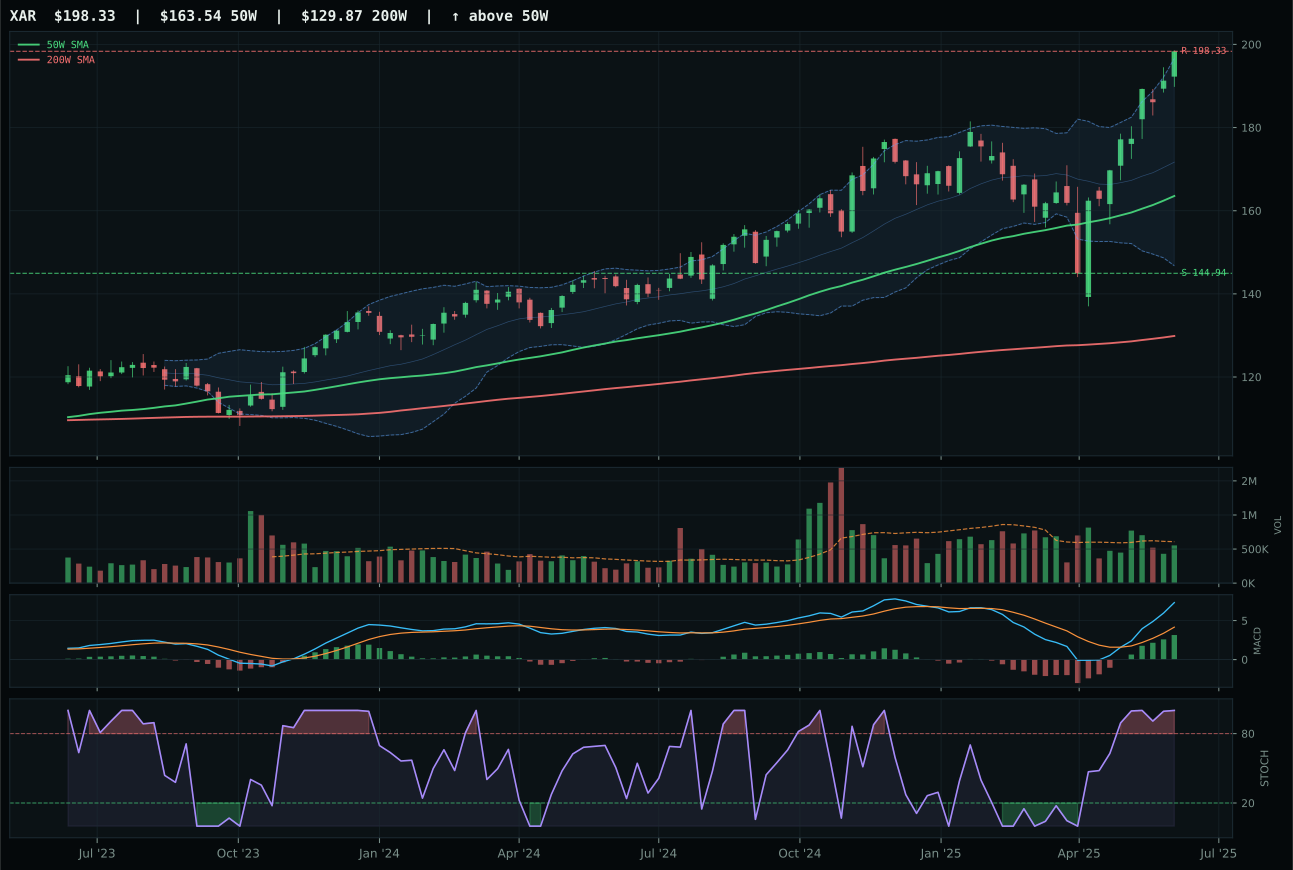
XAR has a vertical extension profile with 19.2% 13-week relative strength versus SPY.
A failed hold above support would weaken the setup.
Actionable but governed by invalidation levels.
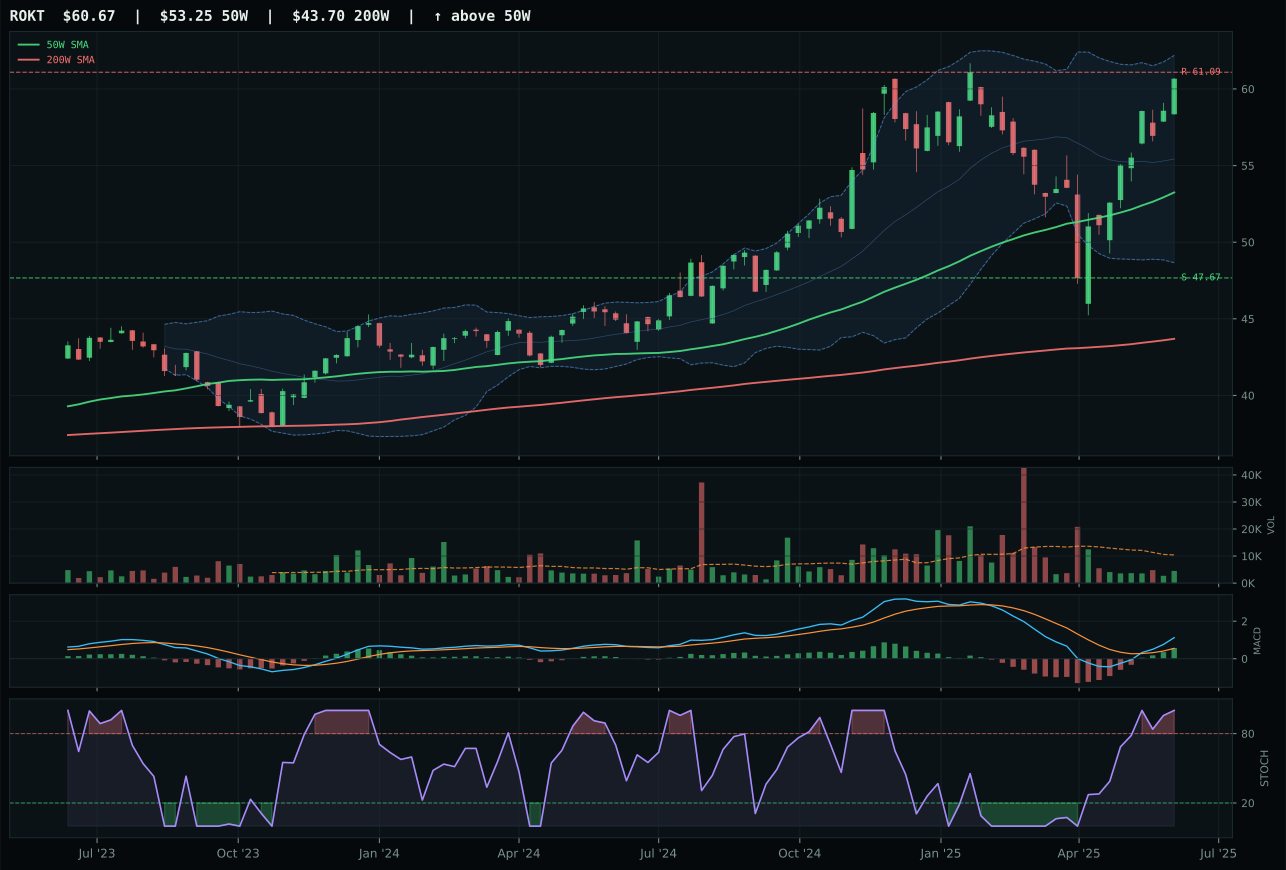
ROKT has a neutral structure profile with 8.8% 13-week relative strength versus SPY.
A failed hold above support would weaken the setup.
Tracked, but not top-2 eligible because: .
XAR claimed the category representative slot despite both it and runner-up ITA posting nearly identical composite scores of 72, with category-relative strength of 1.7% versus 0.0% serving as the tiebreaker. Both sit at the 52W high with vertical extension, both show bullish-improving MACD and overbought momentum, yet XAR's 23.2% 13W return and 19.2% SPY relative strength command greater respect than ITA's 21.5% and 17.5%. The critical gap emerges in volume: ITA attracts above-average participation while XAR trades on neutral volume, suggesting the move has narrowed to a dedicated core rather than broad institutional chase. At 21.3% above the 50W, XAR's timing score of 37.0 reflects the cost of entry here—the chart is exhausted on the upside, leaving only 0.0% to resistance. Risk asymmetry has inverted, but momentum persistence at 100.0 confirms that the move is real, not speculative.
Defense & Aerospace at 5% allocation ranks seventh among the ten categories and barely clears the minimum threshold for holding because its 57.7 final score reflects significant timing headwinds (37.0 composite timing vs higher in peers) and neutral macro fit (51.0 out of 100 category-level macro fit). The category boasts legitimate defensive sponsorship (risk appetite positive active, credit stress active) and real-world demand catalysts, yet disinflation regime mechanics penalize extended positions without fresh accumulation, and XAR's 21.3% distance from the 50W compounds the stretch risk. The 5% allocation is justified only because XAR's momentum confirmation scores perfectly at 100.0 and its 74.3% persistence suggests the move has structural legs, not just speculative momentum. A compression back toward the 50W or loss of category-relative strength would justify cutting this to zero within days; conversely, if XAR breaks to new highs on above-average participation, the setup resets and 5% becomes more defensible as a tactical satellite.
Emerging Markets — IEMG
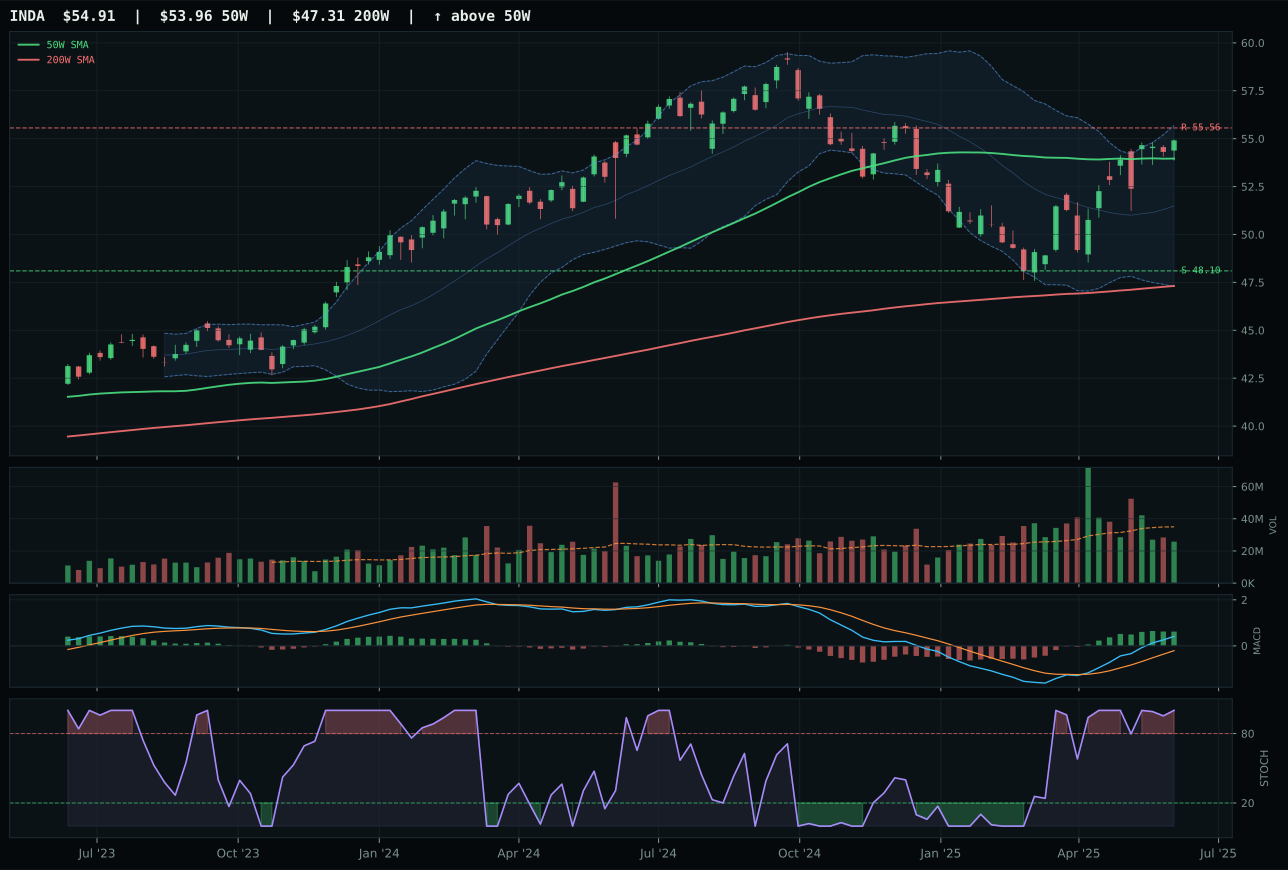
INDA has a compression near 50W profile with 7.8% 13-week relative strength versus SPY.
A failed hold above support would weaken the setup.
Actionable but governed by invalidation levels.
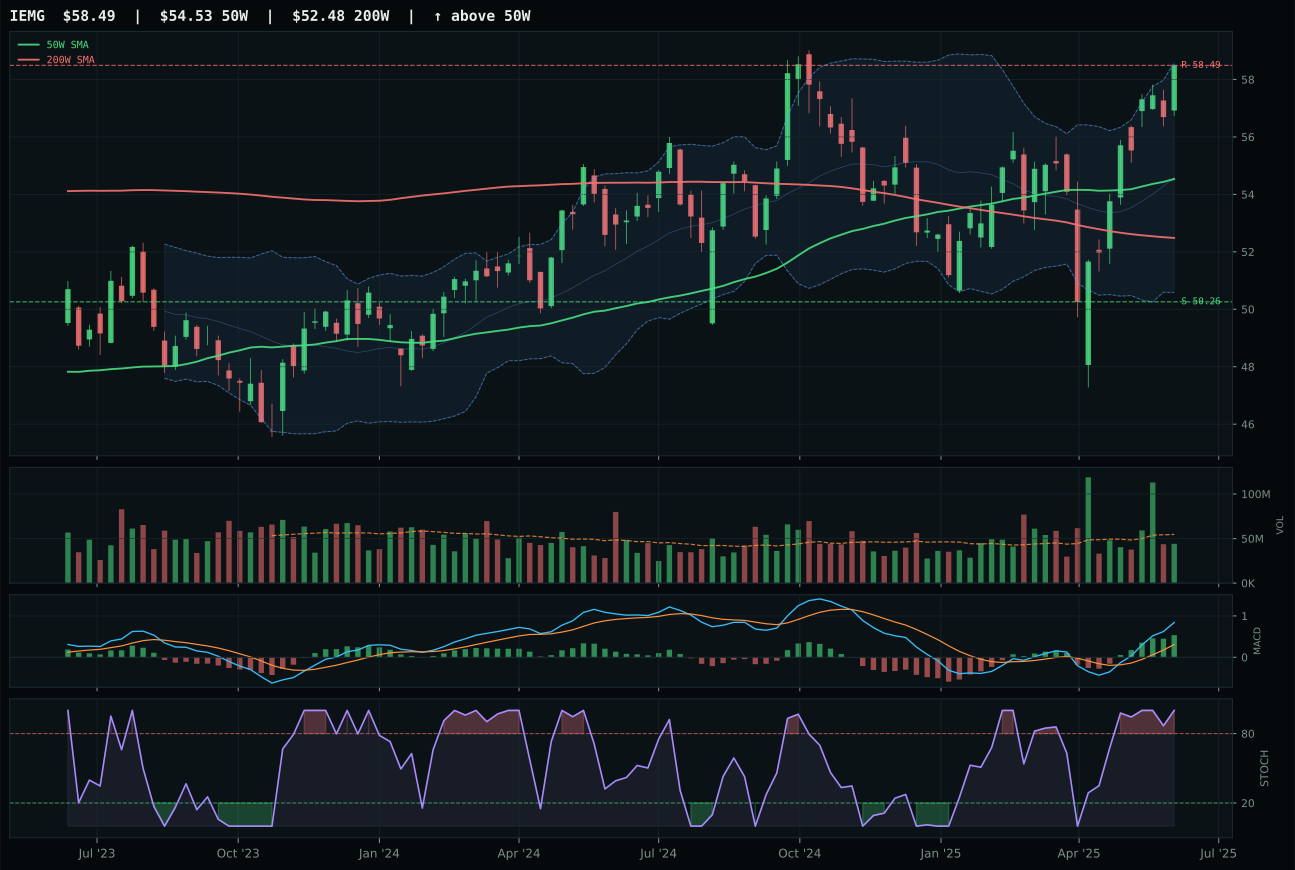
IEMG has a neutral structure profile with 2.5% 13-week relative strength versus SPY.
A failed hold above support would weaken the setup.
Actionable but governed by invalidation levels.
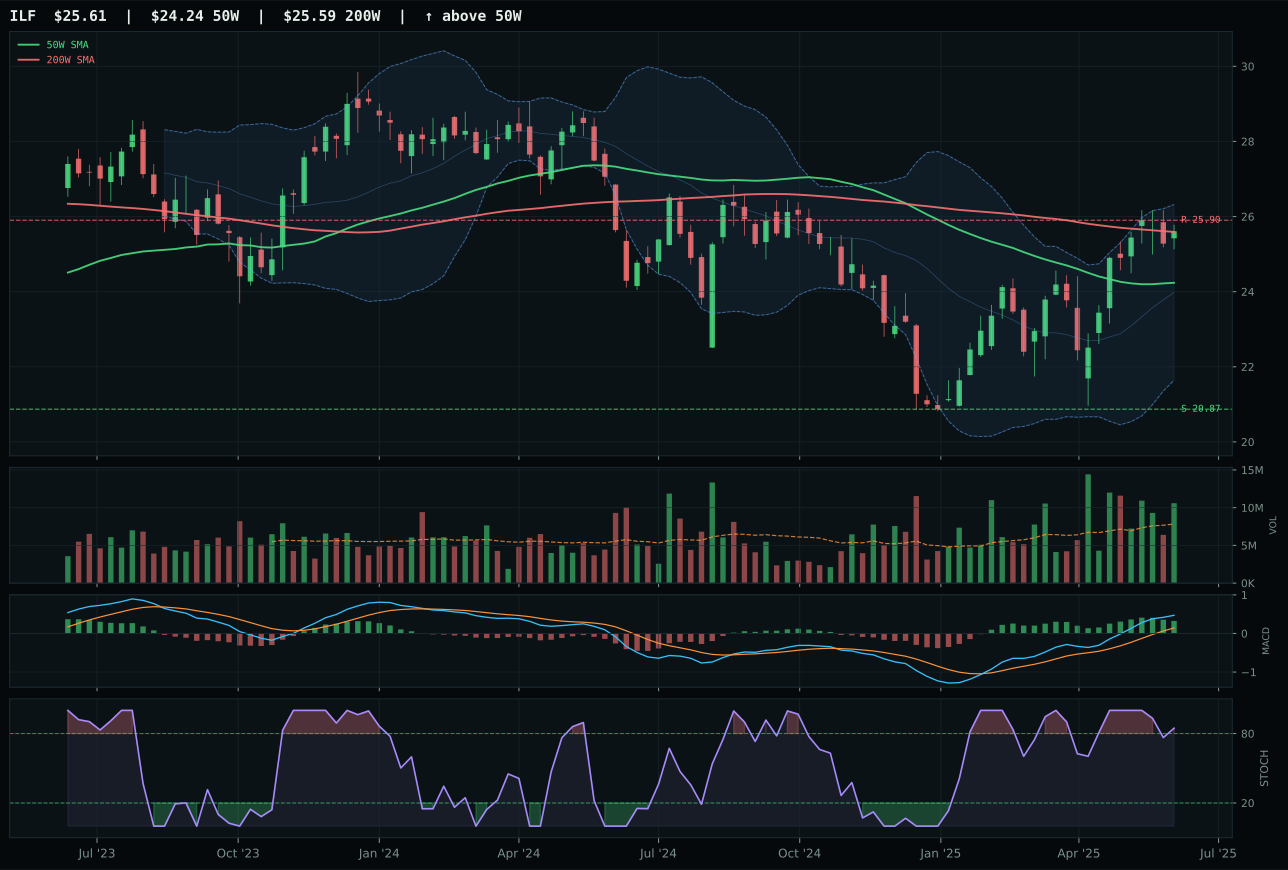
ILF has a neutral structure profile with 7.6% 13-week relative strength versus SPY.
A failed hold above support would weaken the setup.
Actionable but governed by invalidation levels.
IEMG claimed the category despite INDA posting a superior 81.7 technical evidence score because IEMG's cleaner structure (77.2 versus 73.2) and neutral volume participation (0.81x) outweighed INDA's compression-based timing setup. At 7.3% above the 50W near the 52W high, IEMG sits in a setup that feels safe but offers no safety margin—0.0% upside to resistance and 16.4% downside to support creates asymmetric risk. INDA's 11.9% 13W return and 7.8% RS versus SPY appear stronger, yet thin volume participation (hard filter: thin) combined with compression near 50W and MACD still improving suggest INDA hasn't yet broken out with conviction. IEMG's -5.0% category-relative strength is a drag, but it beats INDA's 0.3%—barely. Both face the same macro headwinds, but IEMG's broader emerging-market beta is less volatile than INDA's India concentration risk. The category-relative spread of 17.0 points between IEMG (55.4) and third-place ILF (54.0) signals that this entire category lacks leadership conviction.
Emerging Markets at 5% allocation (ranked eighth with 55.4 category score) reflects a technical setup that survives despite poor macro fit (38.0 out of 100 category-level), where credit stress (minus-10) and liquidity stress (minus-10) create explicit headwinds only partially offset by risk appetite positive (+8). IEMG's trend score of 93.8 and timing of 75.0 are respectable, yet the category-level macro deterioration (credit and liquidity stress both active) prevents top-2 consideration and limits allocation to a tactical satellite. The case for holding 5% is straightforward: IEMG is not extended, maintains neutral participation, and offers 16.4% downside cushion to support; if emerging markets find fresh sponsorship through a reversal in credit stress or liquidity stress indicators, the setup immediately becomes actionable for increased allocation. However, this is a conditional hold without conviction—risk appetite positive is the only macro descriptor providing real support, and its minus-2 contribution at category level reveals it is actually a constraint on upside rather than a bullish signal. IEMG drops to 0% if INDA takes the basket lead on volume strength, or if emerging markets break below the 50W on distribution; the allocation exists purely because top-tier macro categories cannot absorb all available capital.
Industrial Metals — COPX
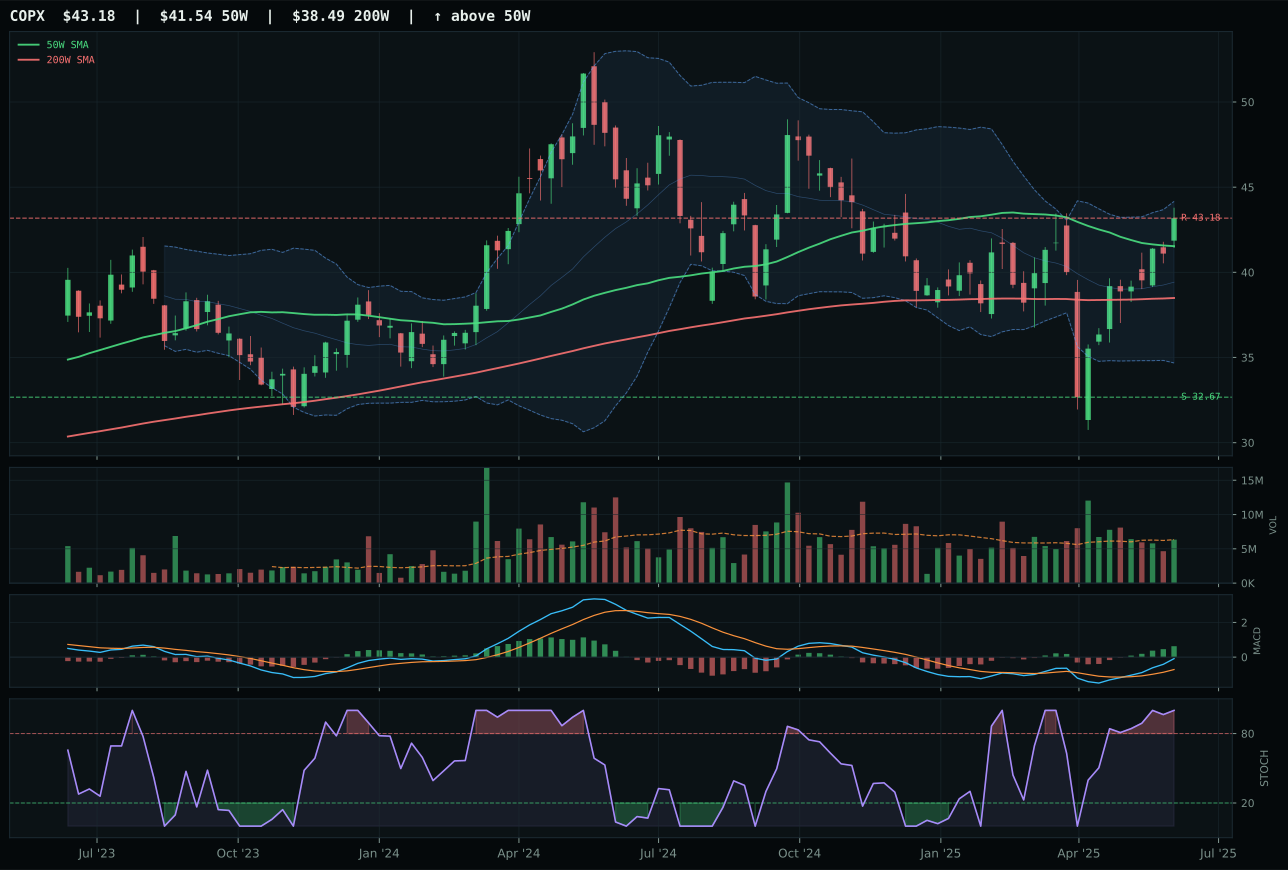
COPX has a neutral structure profile with 4.1% 13-week relative strength versus SPY.
A failed hold above support would weaken the setup.
Actionable but governed by invalidation levels.
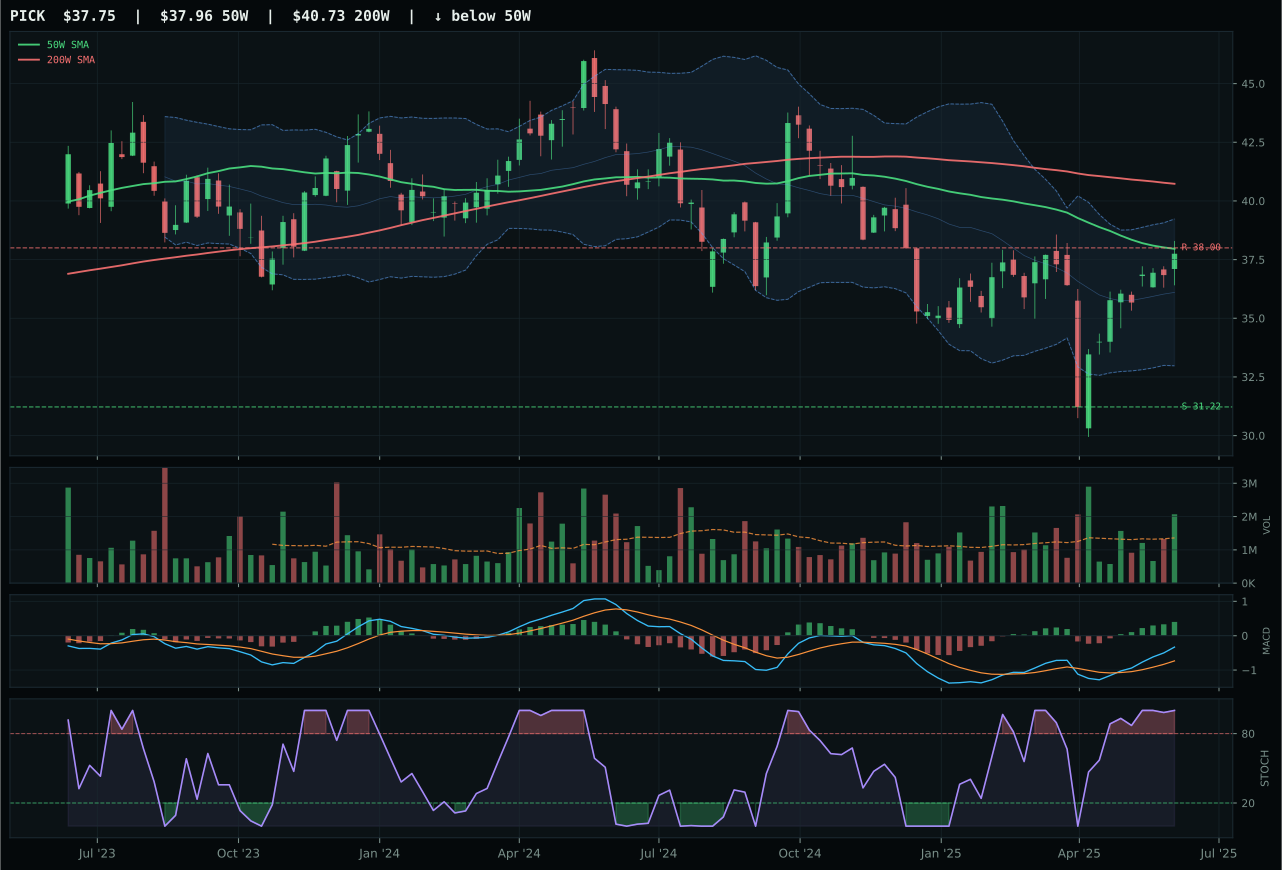
PICK has a compression near 50W profile with -3.1% 13-week relative strength versus SPY.
Extension and support failure are the main tactical risks.
Tracked, but not top-2 eligible because: structurally broken.
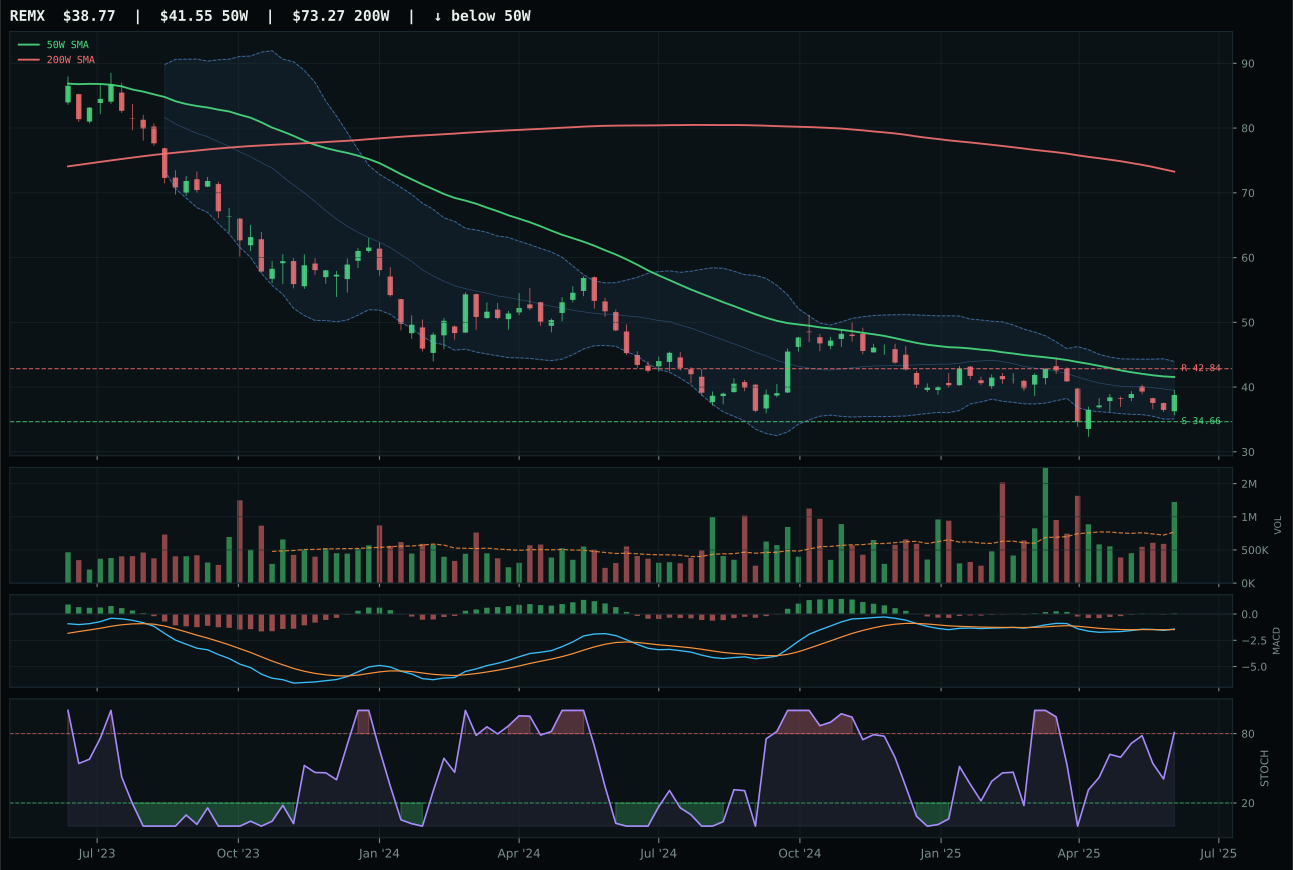
REMX has a neutral structure profile with -11.4% 13-week relative strength versus SPY.
Extension and support failure are the main tactical risks.
Tracked, but not top-2 eligible because: structurally broken.
COPX won Industrial Metals with an 86.4 technical evidence score and 79.6 reasoned composite, dominating PICK (42.0) and REMX (38.7) through superior structure (73.2 versus 49.0) and category-relative strength (7.1% versus 0.0%). At 4.0% above the 50W in the Fib 0.382 retracement zone, COPX sits between compression (64.4) and opportunity—close enough to the moving average to trust the trend without the exhaustion penalty that extended setups carry. Volume remains neutral at 1.00x, preventing the bullish-improving MACD from being dismissed as thin-participation noise. PICK's compression near the 50W and deteriorated structure (hard filter: structurally broken) ruled it out despite accumulation-strength volume; the composition suggests diversified mining is treading water while copper-specific scarcity (the COPX thesis) attracts tactical interest. Category-relative strength of 7.1% proves that institutional buyers favor COPX's focused commodity positioning over generalist mining exposure.
Industrial Metals at 5% allocation ranks seventh overall with a 37.3 category score that benefits from strong macro fit (65.0 out of 100) despite weak technicals, making this a pure macro satellite rather than a technical conviction position. Metals scarcity active (+14 macro points), commodity breadth positive (+10), and real asset sponsorship (+6) create genuine regime support, yet liquidity stress (minus-8) and credit stress (minus-7) prevent top-2 consideration. COPX's technical evidence (86.4 out of 100) is solid and represents the category's only clean setup, yet the category-level reasoning-layer process deliberately tests that score against macro state and structure quality, resulting in the lower 37.3 final score. The 5% allocation is defensible as a macro hedge: if commodity breadth remains positive and metals scarcity descriptors persist, COPX's neutral structure and superior timing (90.0) offer asymmetric upside without extended entry risk. However, this is a conditional hold that would shrink to 0% immediately if disinflation pressure strengthens or if COPX slips below its 50W—it lacks the volume-price conviction of SLV or the momentum persistence of URA.
Agriculture & Livestock — MOO
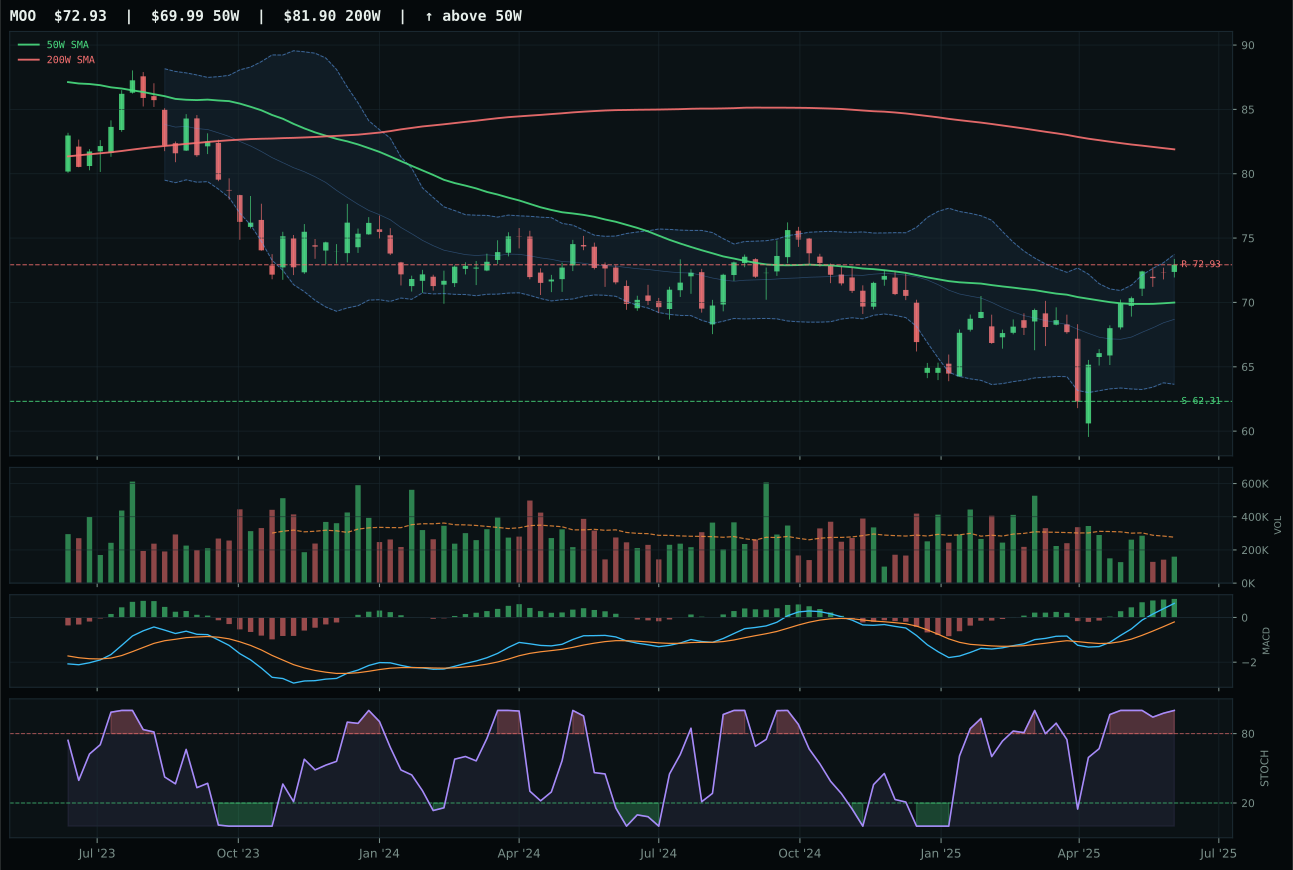
MOO has a neutral structure profile with 1.0% 13-week relative strength versus SPY.
A failed hold above support would weaken the setup.
Actionable but governed by invalidation levels.
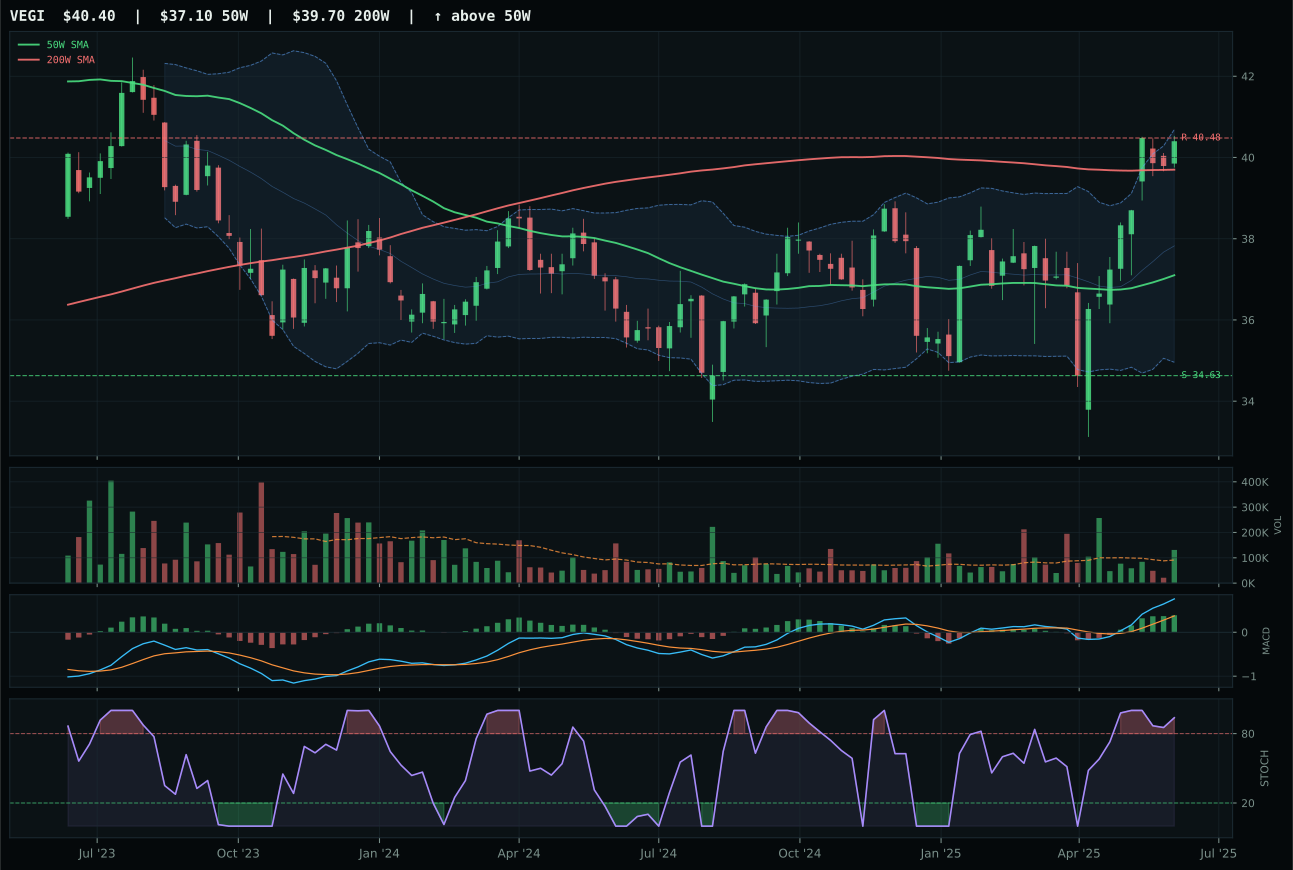
VEGI has a neutral structure profile with 2.8% 13-week relative strength versus SPY.
A failed hold above support would weaken the setup.
Tracked, but not top-2 eligible because: .
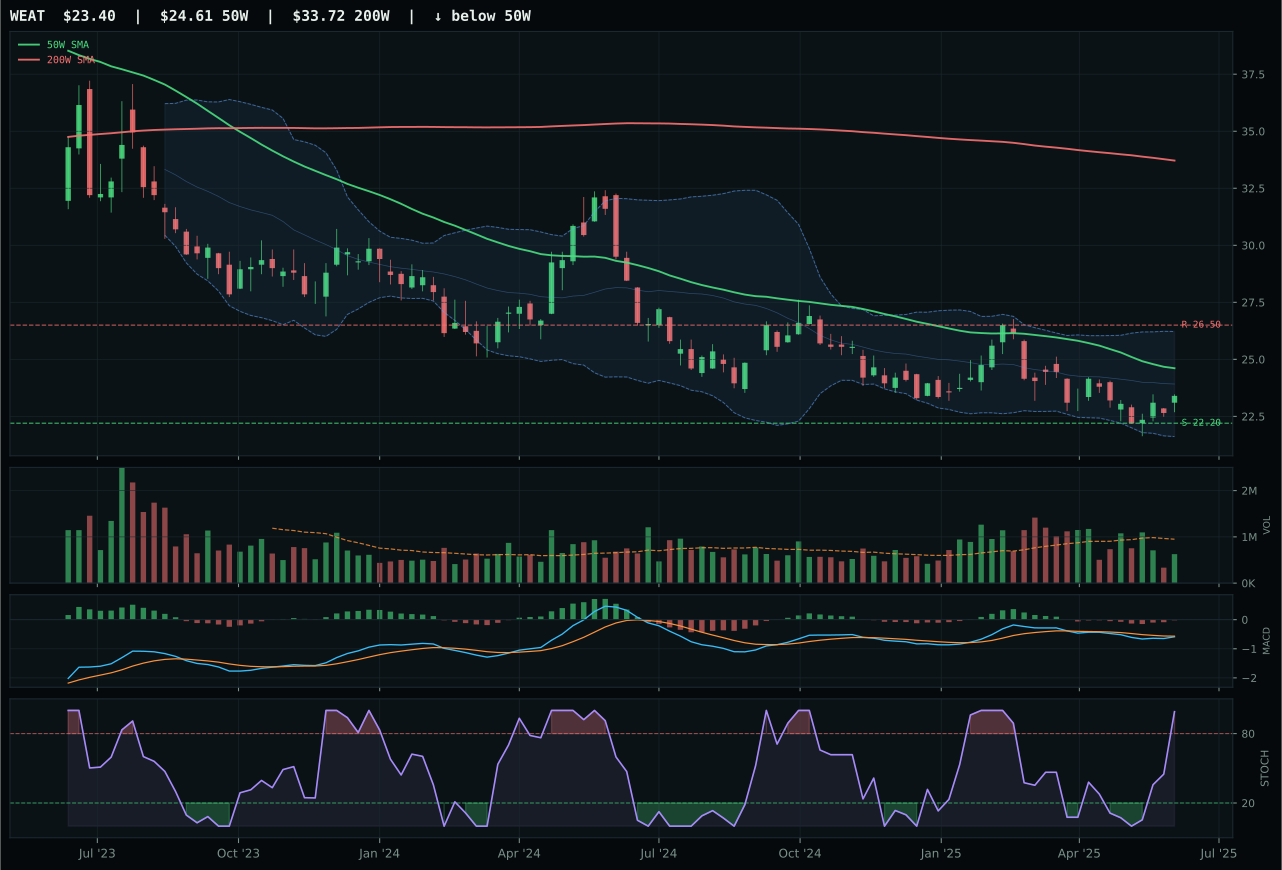
WEAT has a neutral structure profile with -6.7% 13-week relative strength versus SPY.
Extension and support failure are the main tactical risks.
Tracked, but not top-2 eligible because: structurally broken.
MOO won a weak category with a 66.0 reasoned score and 29.2 final composite, dominating VEGI (45.0) and WEAT (23.5) primarily through superior timing: 90.0 versus VEGI's 57.0. Positioned 4.2% above the 50W near the Fib 0.236 retracement, MOO benefits from compressed risk and Fibonacci support at 62.31 just 17.0% below current price, creating favorable risk-reward at 53.5. The category-relative strength of 0.0% indicates that none of these three command institutional buying interest; VEGI's above-average volume and overbought momentum are noise on a weak trend, while WEAT has collapsed 2.7% over 13 weeks. MACD is bullish across all three, but thin volume participation at 0.58x suggests conviction is absent. This is a default long in a portfolio constrained to equal-weight categories—the least-bad setup in a structurally challenged space.
Agriculture & Livestock earning 0% allocation this week is unambiguous: the category scores 29.2, placing it ninth or tenth overall, and fails the macro fit test decisively (45.0 out of 100) as disinflation mechanics actively hurt real-asset exposure (minus-6 to minus-8 points). Real asset sponsorship (+8 macro points) and commodity breadth positive (+5) provide minor offsets, yet disinflation pressure (minus-8) and liquidity stress (minus-4) create structural headwinds that no amount of short-term technicals overcomes. MOO's above-average timing (90.0) combined with thin participation creates a setup that appears attractive on the five-to-ten week horizon but lacks the institutional sponsorship and macro backdrop required to justify portfolio capital. For this category to earn even a 5% satellite position, either disinflation must reverse course with fresh inflation data, or MOO must demonstrate accumulation at higher prices through above-average volume—neither condition is met, and neither is imminent based on current regime descriptors.
Traditional Energy — FCG
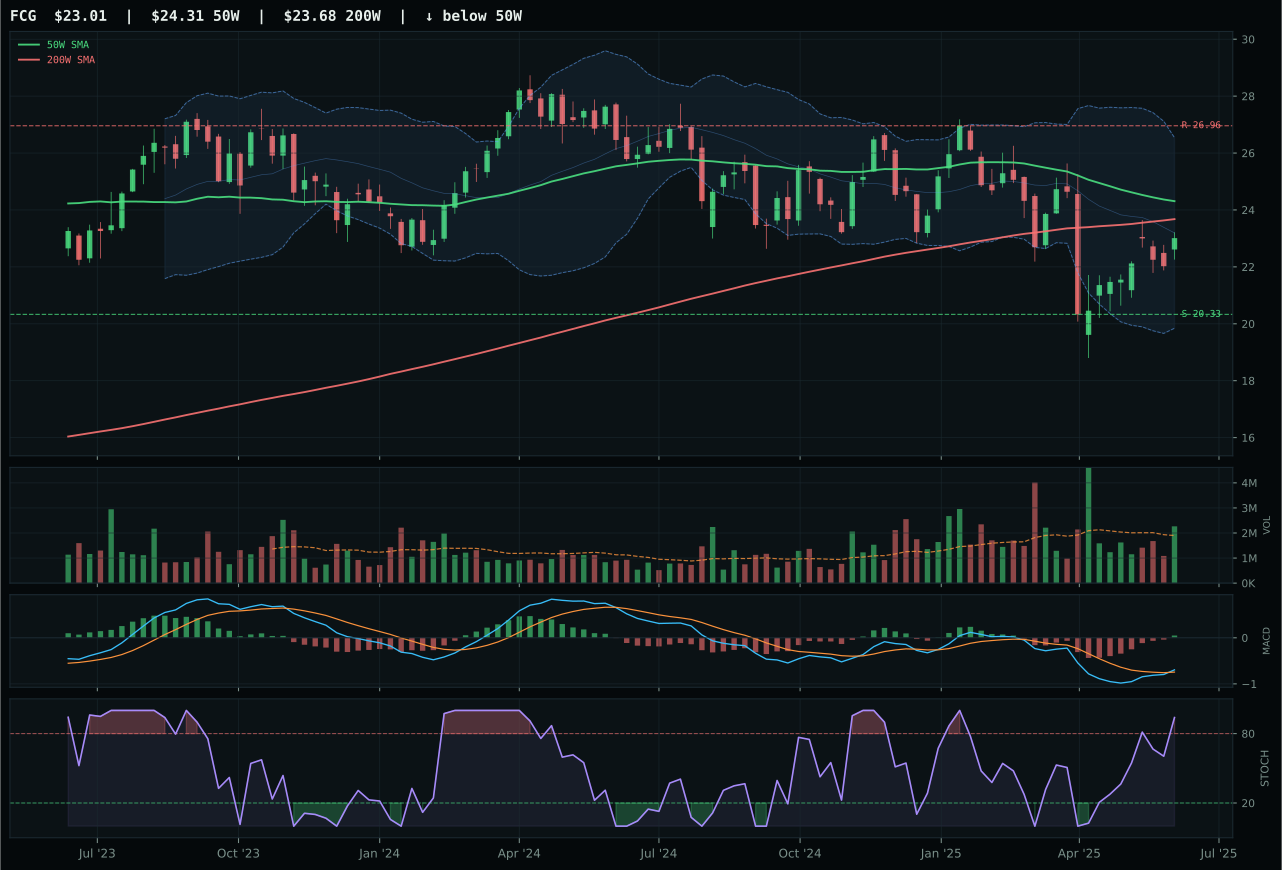
FCG has a neutral structure profile with -2.6% 13-week relative strength versus SPY.
A failed hold above support would weaken the setup.
Actionable but governed by invalidation levels.
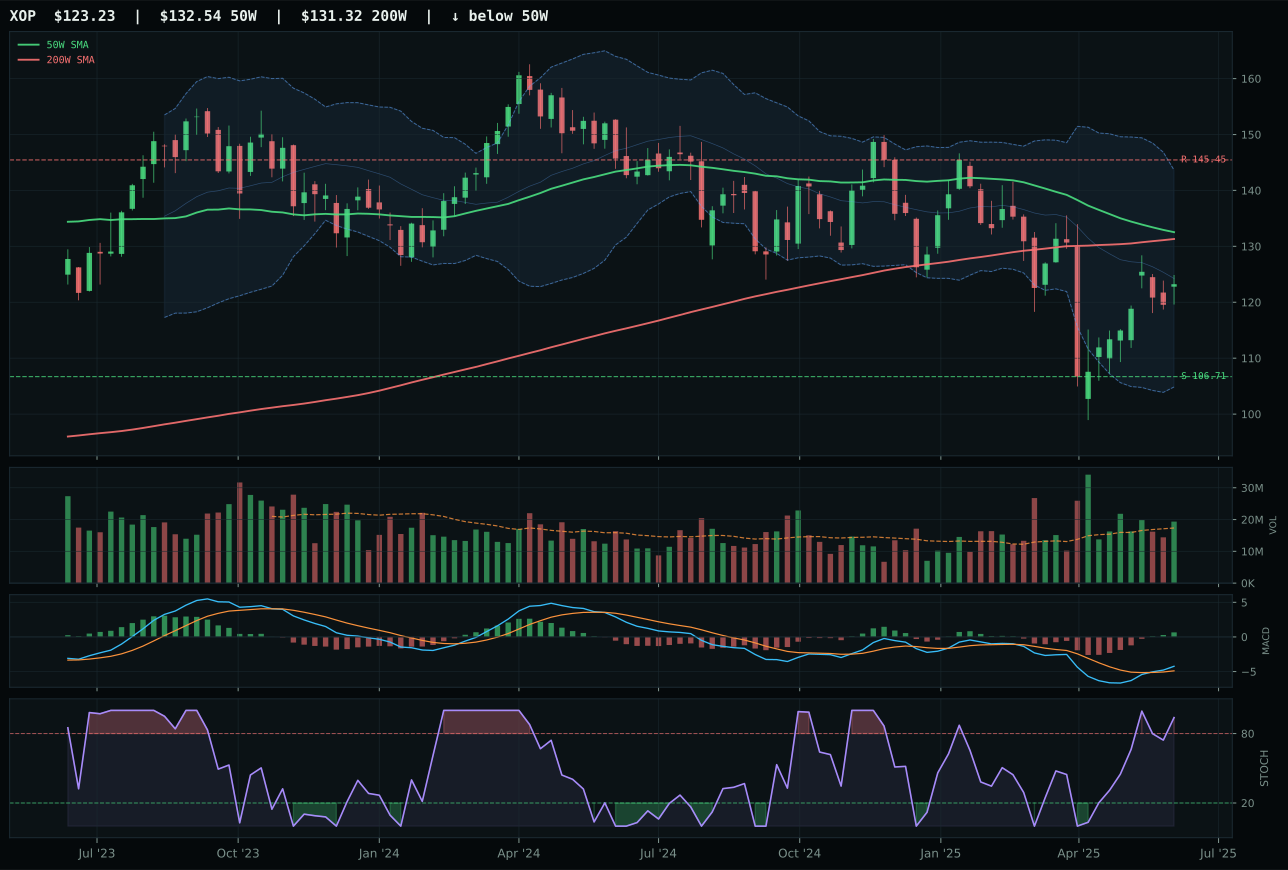
XOP has a neutral structure profile with -3.5% 13-week relative strength versus SPY.
A failed hold above support would weaken the setup.
Actionable but governed by invalidation levels.
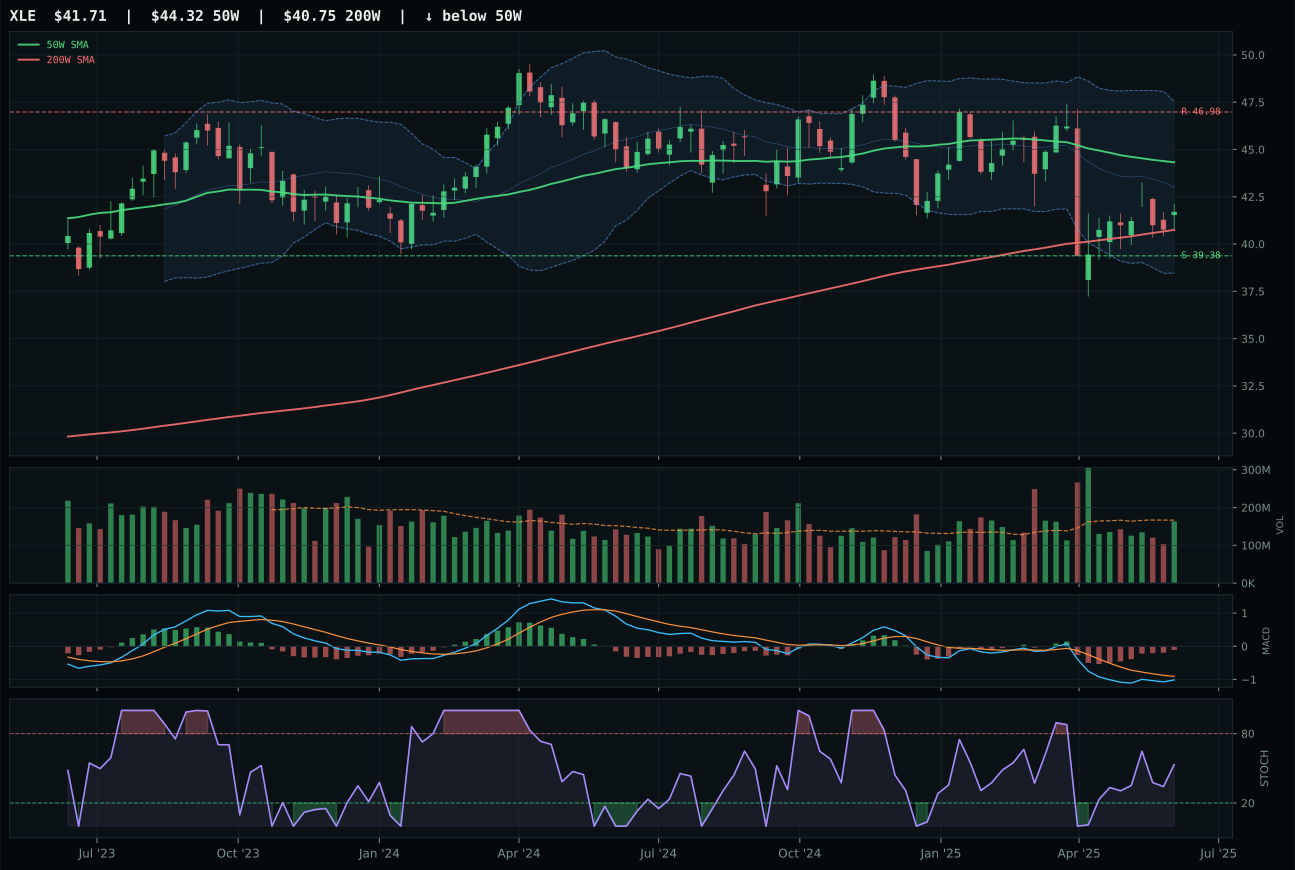
XLE has a neutral structure profile with -8.6% 13-week relative strength versus SPY.
A failed hold above support would weaken the setup.
Actionable but governed by invalidation levels.
FCG won Traditional Energy with a 61.0 reasoned score despite the category's structural weakness, beating XOP (48.4) and XLE (28.7) primarily through superior category-relative strength (0.9% versus 0.0% and -8.6% respectively). The setup is defensive: price sits 5.3% below the 50W in the Fib 0.500 decision zone, with 73.0 risk-reward benefit accruing to the downside (13.2% to support) rather than upside (-14.7% to resistance). FCG's above-average volume participation at 1.19x and neutral structure indicate accumulated positions from distressed sellers or hedgers rather than fresh conviction buying. The 1.4% 13W return confirms minimal leadership; MACD is bullish-improving and stochastic overbought, but these are technical bounces from deeply oversold conditions, not evidence of structural sponsorship. This is a category that the portfolio carries only because equal weighting requires it—XOP's weak timing (57.0) and XLE's bearish MACD disqualify both as alternatives.
Traditional Energy at 0% allocation (ranked ninth or tenth) is justified by the 12.7 category score and catastrophic 23.0 macro fit, where disinflation hurts this exposure (minus-10 points) and disinflation pressure active (minus-10 more) create an explicit regime headwind. Real asset sponsorship (+7) and risk appetite positive components cannot overcome the structural mismatch between falling inflation expectations and energy assets, which historically require either growth acceleration or inflation surprise to outperform. Neither FCG nor XOP demonstrates the trend score, volume signature, or relative strength needed to argue for contrarian positioning; FCG's 51.1 trend score (below 50W, below 200W) is borderline bearish masked by overbought technicals, not a legitimate setup. The category would need either a sharp reversal in disinflation narrative, demonstrated by a hard reversal in the commodity breadth positive descriptor, or a complete breakdown of energy weakness (such as FCG showing accumulation-level volume below the 50W before bouncing higher) to earn even a 5% satellite allocation. As it stands, every basis point of allocation capital is better deployed to Precious Metals, Utilities, or SMH growth.