
2025-05-30
Informational purposes only. The content in this report, including allocations, analysis, and commentary, is provided solely for informational and educational purposes. It does not constitute financial advice, investment advice, trading advice, or any other type of advice. Past performance does not guarantee future results. Always conduct your own research and consult a qualified financial professional before making investment decisions.
Weekly Allocation
| Ticker | Category | Weight | Role |
|---|---|---|---|
| FBTC | 50% | Overlay | |
| GLD | Precious Metals | 10% | Top-2 (10%) |
| XLU | Utilities & Infrastructure | 10% | Top-2 (10%) |
| XLK | Technology | 5% | Tier-2 (5%) |
| URA | Nuclear Energy | 5% | Tier-2 (5%) |
| IEMG | Emerging Markets | 5% | Tier-2 (5%) |
| SMH | AI | 5% | Tier-2 (5%) |
| ITA | Defense & Aerospace | 5% | Tier-2 (5%) |
| COPX | Industrial Metals | 5% | Tier-2 (5%) |
Trade Instructions — Monday Open
Sell the tranche from 2025-05-02 (completing its 4-week hold). Buy the new tranche. Instructions show net portfolio changes — same-asset positions cancel, weight changes show the delta.
| Action | Ticker | Instruction |
|---|---|---|
| SELL | PAVE | Sell 33% of PAVE position (reduce 7.50% → 5.00%) |
| SELL | ILF | Sell 33% of ILF position (reduce 3.75% → 2.50%) |
| SELL | XAR | Sell 50% of XAR position (reduce 2.50% → 1.25%) |
| SELL | IGV | Sell 50% of IGV position (reduce 2.50% → 1.25%) |
| BUY | XLU | Buy XLU — 40.00% of freed cash (adds 2.50% to portfolio) |
| BUY | ITA | Buy ITA — 20.00% of freed cash (adds 1.25% to portfolio) |
| BUY | XLK | Buy XLK — 20.00% of freed cash (adds 1.25% to portfolio) |
| BUY | IEMG | Buy IEMG — 20.00% of freed cash (adds 1.25% to portfolio) |
Current Portfolio After Trade
Combined holdings across all 4 active tranches. Each tranche is 25% of the portfolio.
| Ticker | % of Portfolio | Weight Bar |
|---|---|---|
| FBTC | 50.00% | |
| GLD | 10.00% | |
| PAVE | 5.00% | |
| COPX | 5.00% | |
| XLU | 5.00% | |
| SMH | 3.75% | |
| URA | 3.75% | |
| ITA | 3.75% | |
| XLK | 3.75% | |
| ILF | 2.50% | |
| IEMG | 2.50% | |
| XAR | 1.25% | |
| IGV | 1.25% | |
| URNM | 1.25% | |
| AIQ | 1.25% |
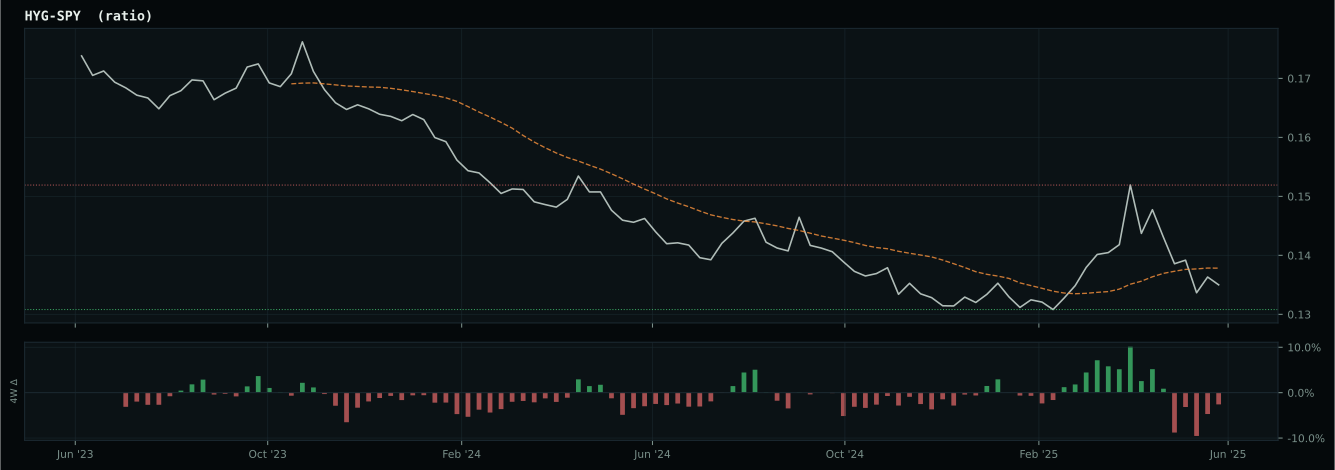
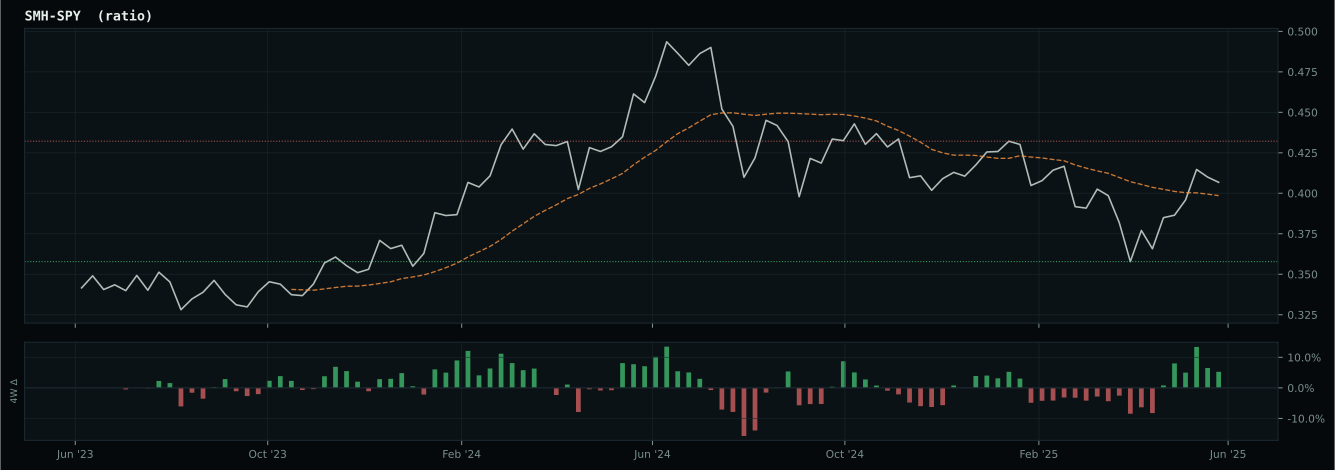
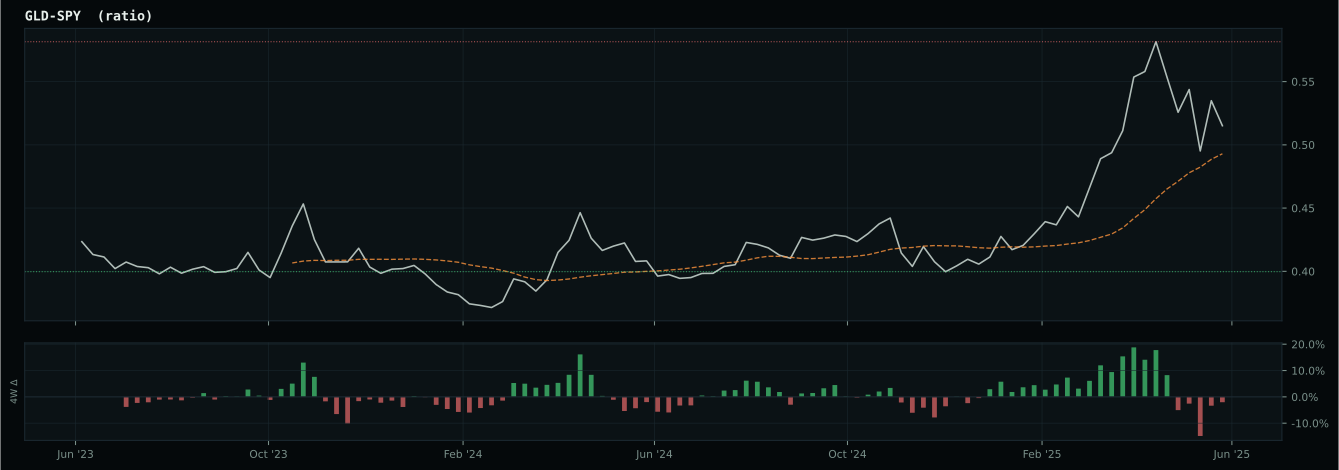
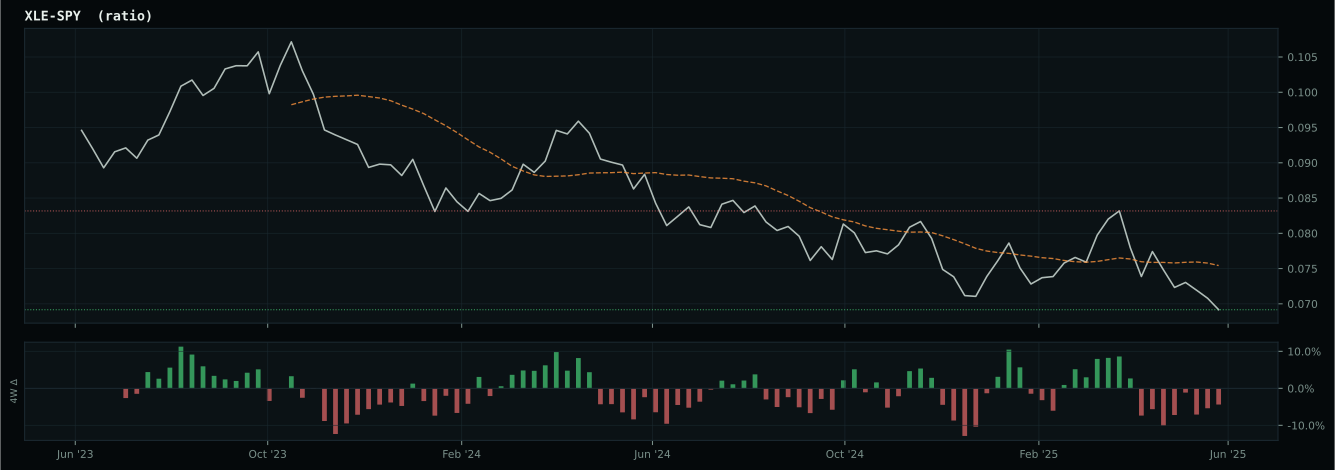
Macro Regime — Disinflation
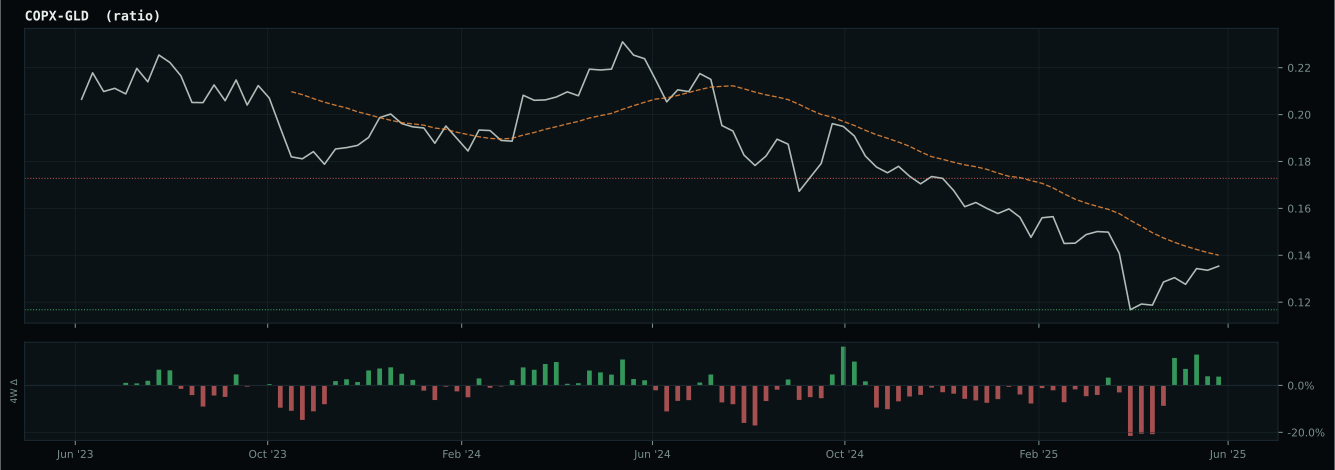
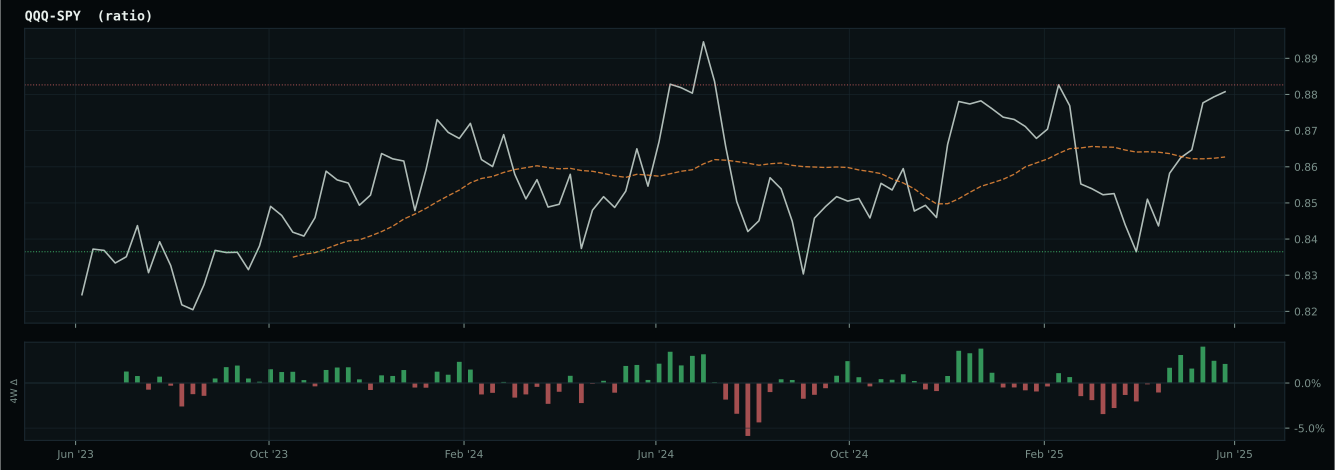
Macro Evidence Charts
Market-implied signals behind the macro regime scores. Each ratio compares two assets; the direction and slope of the ratio is what the macro engine reads.
Crypto Regime — TrendBTC
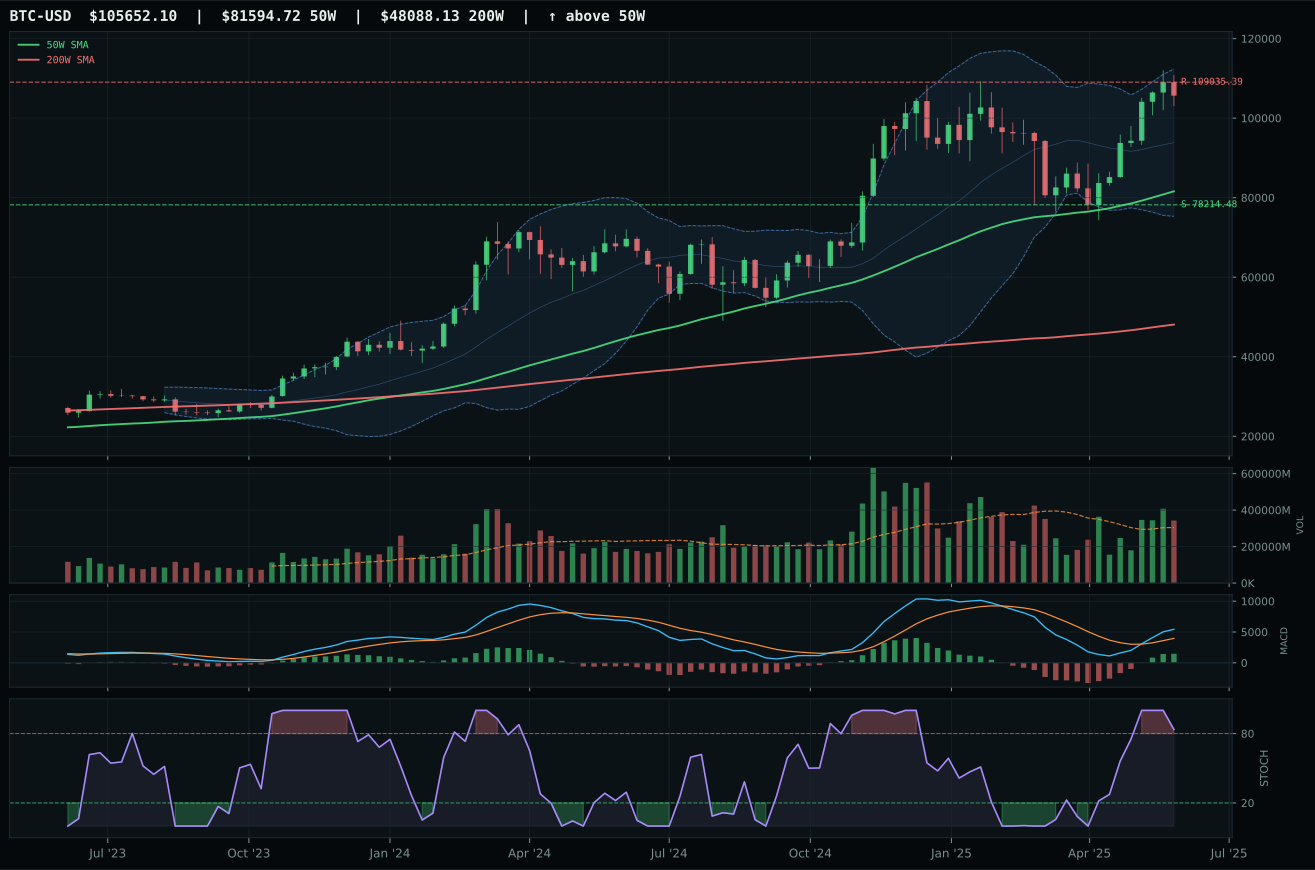
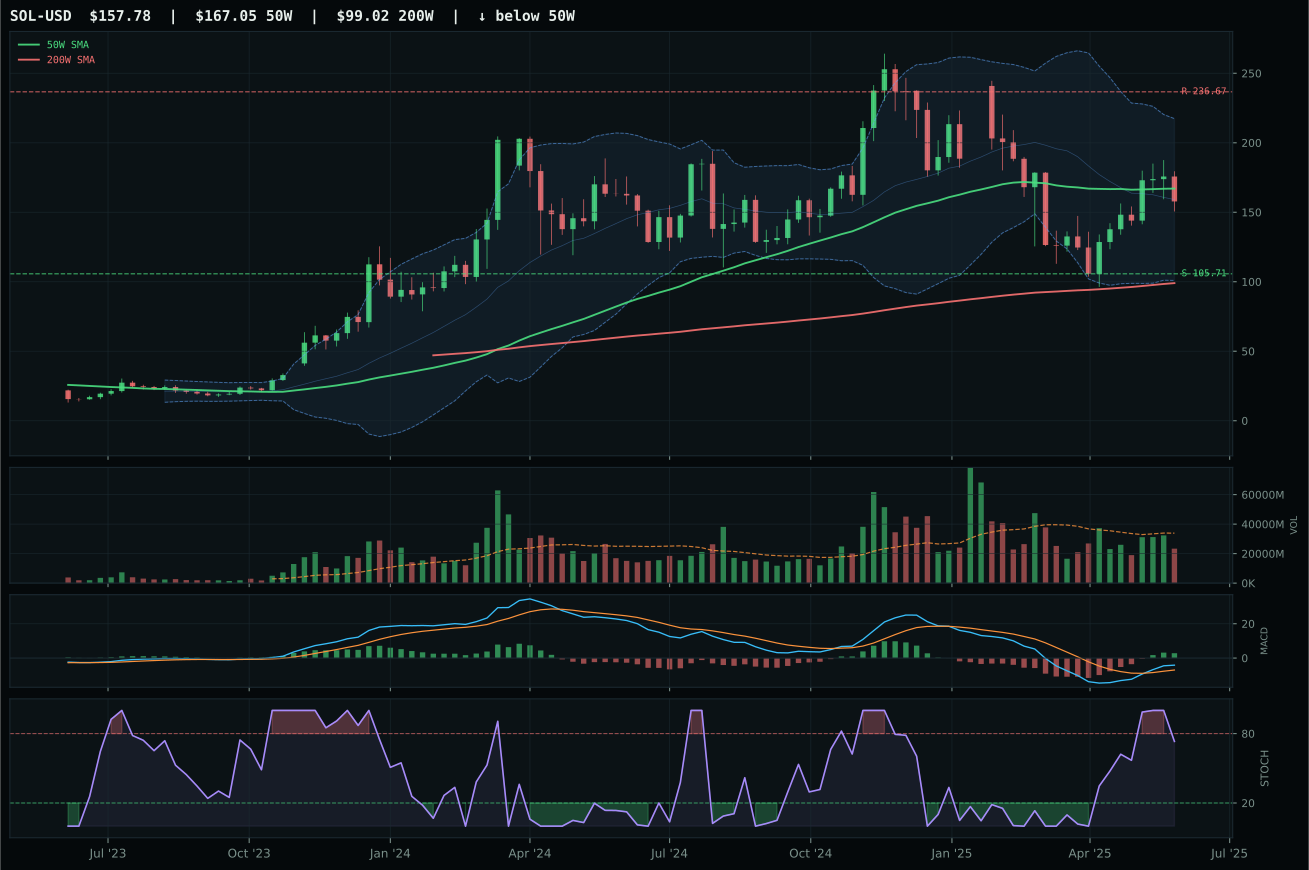
ValueBTC not armed: BTC has not made the first post-breakdown touch of the 200W buy zone after losing the 50W
TrendBTC confirmed: 2 consecutive closes above rising/flat 50W SMA
one or more available conditions failed
Category Rankings
| Rank | Category | Winner | Score | Alloc | 4W Ret | Peers (4W) |
|---|---|---|---|---|---|---|
| 1 | Precious Metals | GLD | 77.0 | 20% | -2.21% | GDX -1.5% · SLV +6.1% |
| 2 | Utilities & Infrastructure | XLU | 70.6 | 20% | -0.77% | IGF -0.7% · PAVE +5.2% |
| 3 | Technology | XLK | 65.9 | 10% | +9.84% | CIBR +4.7% · IGV +6.1% |
| 4 | Nuclear Energy | URA | 65.2 | 10% | +21.51% | NLR +14.6% · URNM +18.7% |
| 5 | Emerging Markets | IEMG | 59.1 | 10% | +4.92% | INDA +2.2% · ILF +1.5% |
| 6 | AI | SMH | 58.2 | 10% | +16.94% | AIQ +8.6% · BOTZ +5.8% |
| 7 | Defense & Aerospace | ITA | 53.4 | 10% | +6.00% | XAR +9.9% · ROKT +10.6% |
| 8 | Industrial Metals | COPX | 15.2 | 10% | +6.93% | PICK +1.6% · REMX +13.1% |
| 9 | Agriculture & Livestock | MOO | 11.4 | 0% | +1.58% | VEGI +1.3% · WEAT -3.5% |
| 10 | Traditional Energy | XOP | 8.8 | 0% | +2.91% | FCG +3.1% · XLE +2.3% |
Precious Metals — GLD
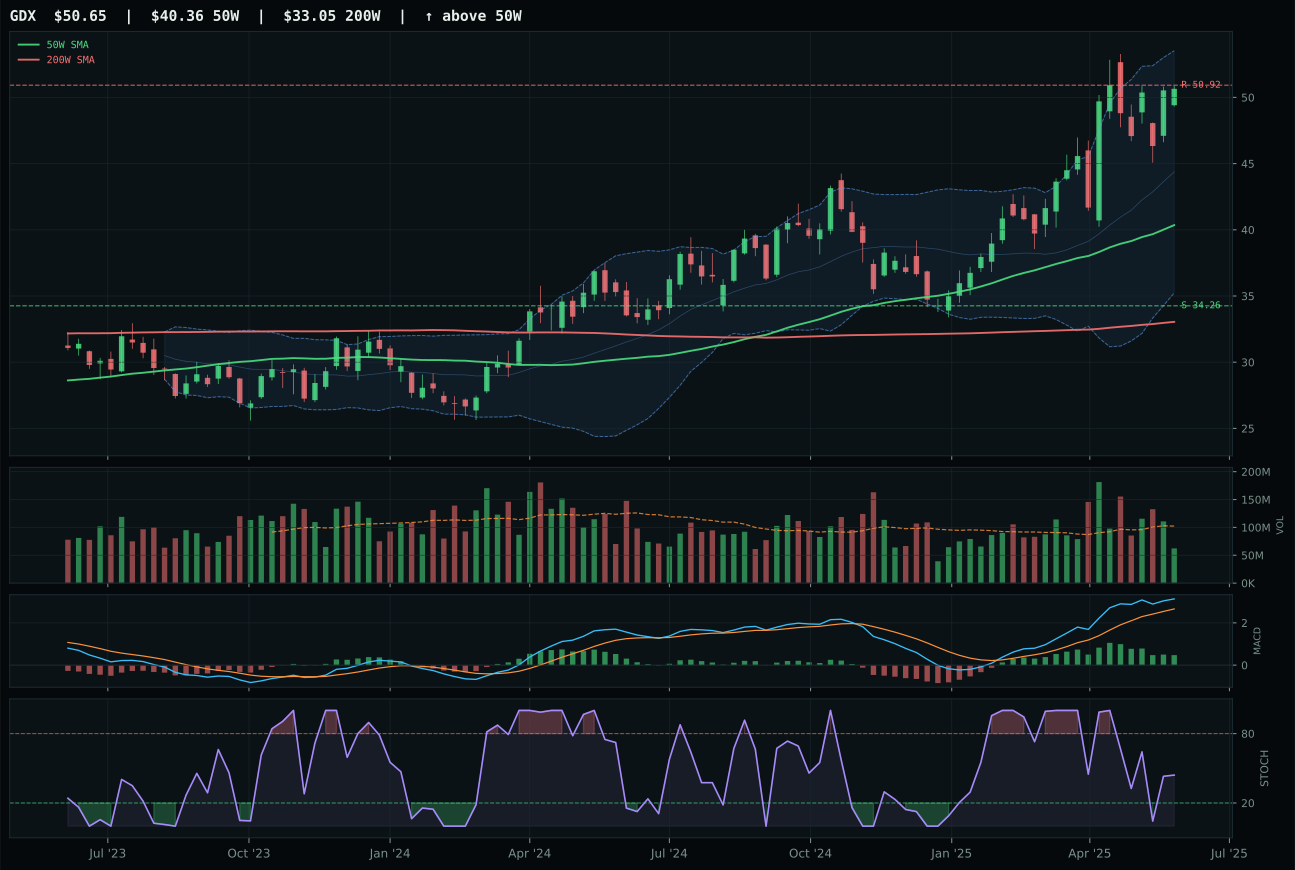
GDX has a vertical extension profile with 28.3% 13-week relative strength versus SPY.
A failed hold above support would weaken the setup.
Actionable but governed by invalidation levels.
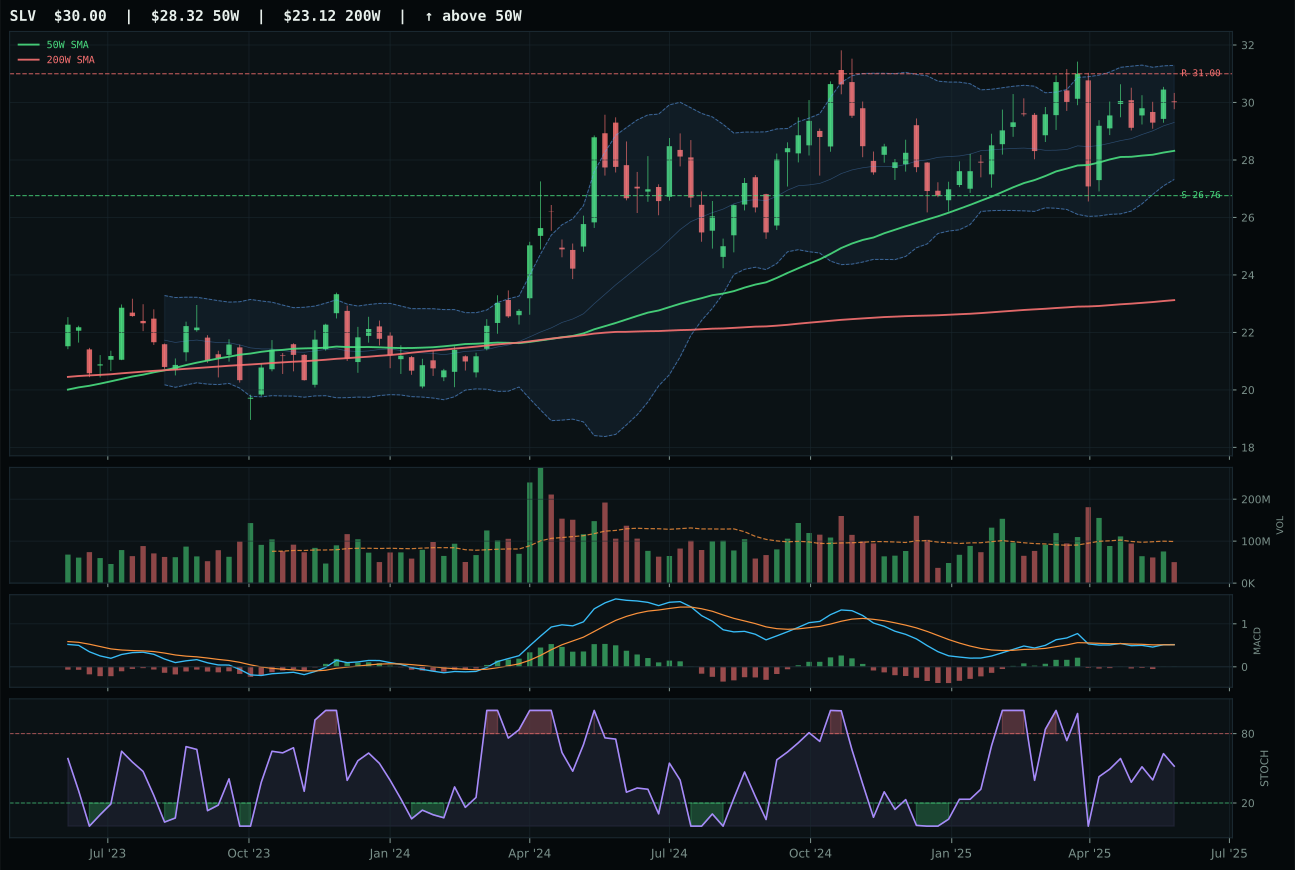
SLV has a neutral structure profile with 6.8% 13-week relative strength versus SPY.
A failed hold above support would weaken the setup.
Actionable but governed by invalidation levels.
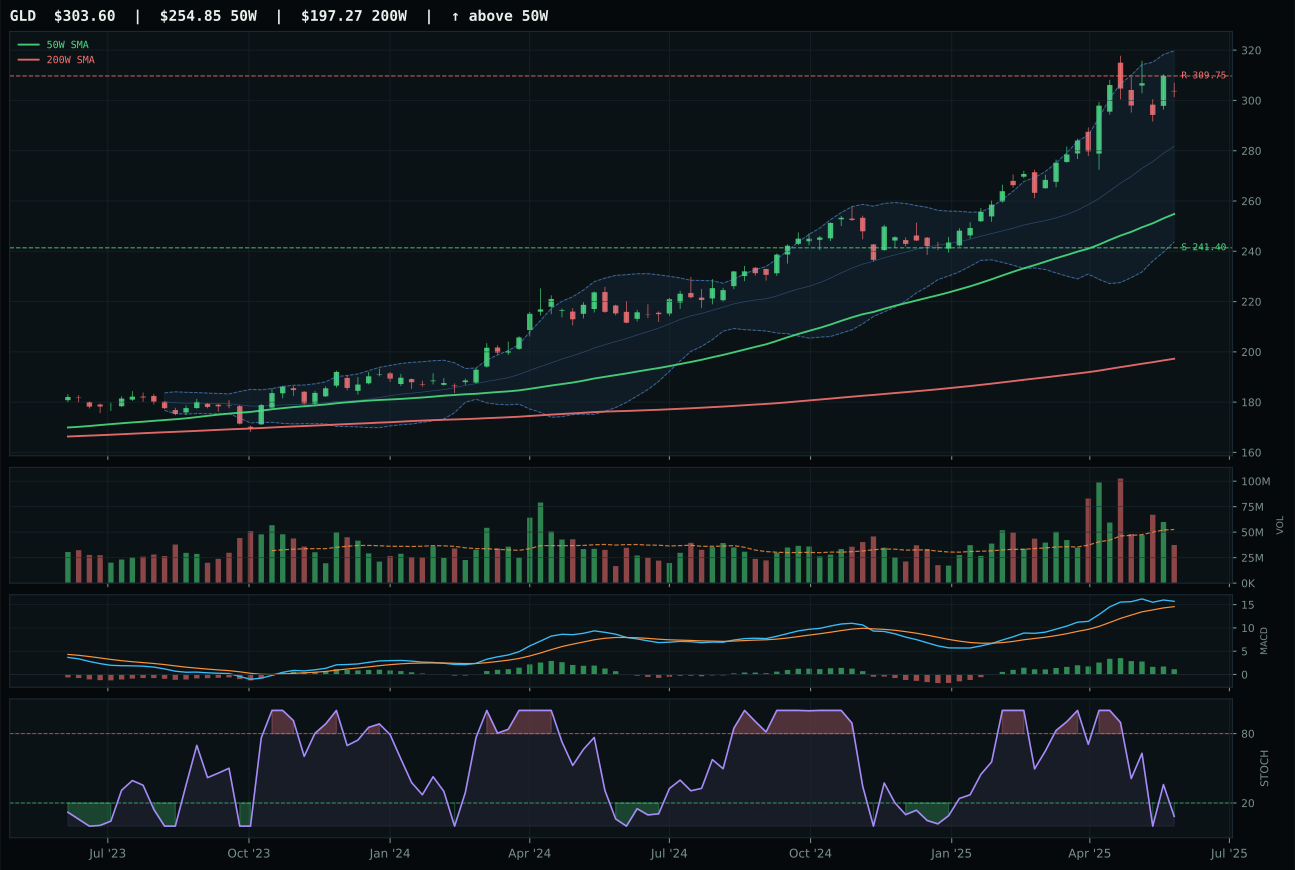
GLD has a vertical extension profile with 16.1% 13-week relative strength versus SPY.
A failed hold above support would weaken the setup.
Actionable but governed by invalidation levels.
GLD edges SLV and dominates GDX for the top-2 slot by maintaining perfect trend confirmation (100.0) despite being extended 19.1% above the 50W, a rare combination that signals institutional conviction rather than retail chase. Both GLD and GDX are extended, but GLD's structure remains slightly cleaner (72.0 vs 70.4) and its stochastic RSI is oversold at 0.08—meaning the acceleration is exhausted but conviction persists—while GDX's is falling/neutral and already showing weakness. GLD's category-relative strength is 0.0% (neutral parity) while GDX's positive 12.2% signals internal divergence; GLD's positioning as the clean monetary hedge without leverage provides a stabler technical picture than the miner beta. Volume participation is thin at both, but GLD's 67.8 volume-price confirmation edges GDX's weaker reading, and persistence at 77.0 matches the category's strength. Macro fit overwhelmingly favors this entire category: monetary hedge bid (+14), disinflation pressure (+8), and defensive rotation (+6) create a 78.0/100 macro score that compensates for any timing stretch.
Precious Metals ranks top-2 with a 77.0 category score and receives 10% allocation, making it one of only two overweight positions in the portfolio. This allocation reflects a regime shift: disinflation creates demand for monetary hedges without inflation expectations, defensive rotation (+12 in utilities, +6 here) is the dominant macro theme, and GLD's 16.1% relative strength versus SPY confirms institutional reallocation into gold. The macro fit of 85.0/100 is the highest in the portfolio, driven by three active descriptors all favoring safety and hedging. GLD's 19.1% extension above the 50W is a timing concern, but not a disqualifier—the category's macro sponsorship is strong enough to justify holding through a potentially choppy entry. This is conviction-based allocation: the portfolio is explicitly betting that disinflation fear and portfolio de-risking will continue to fund gold. The setup is extended but the sponsorship is institutional.
Utilities & Infrastructure — XLU
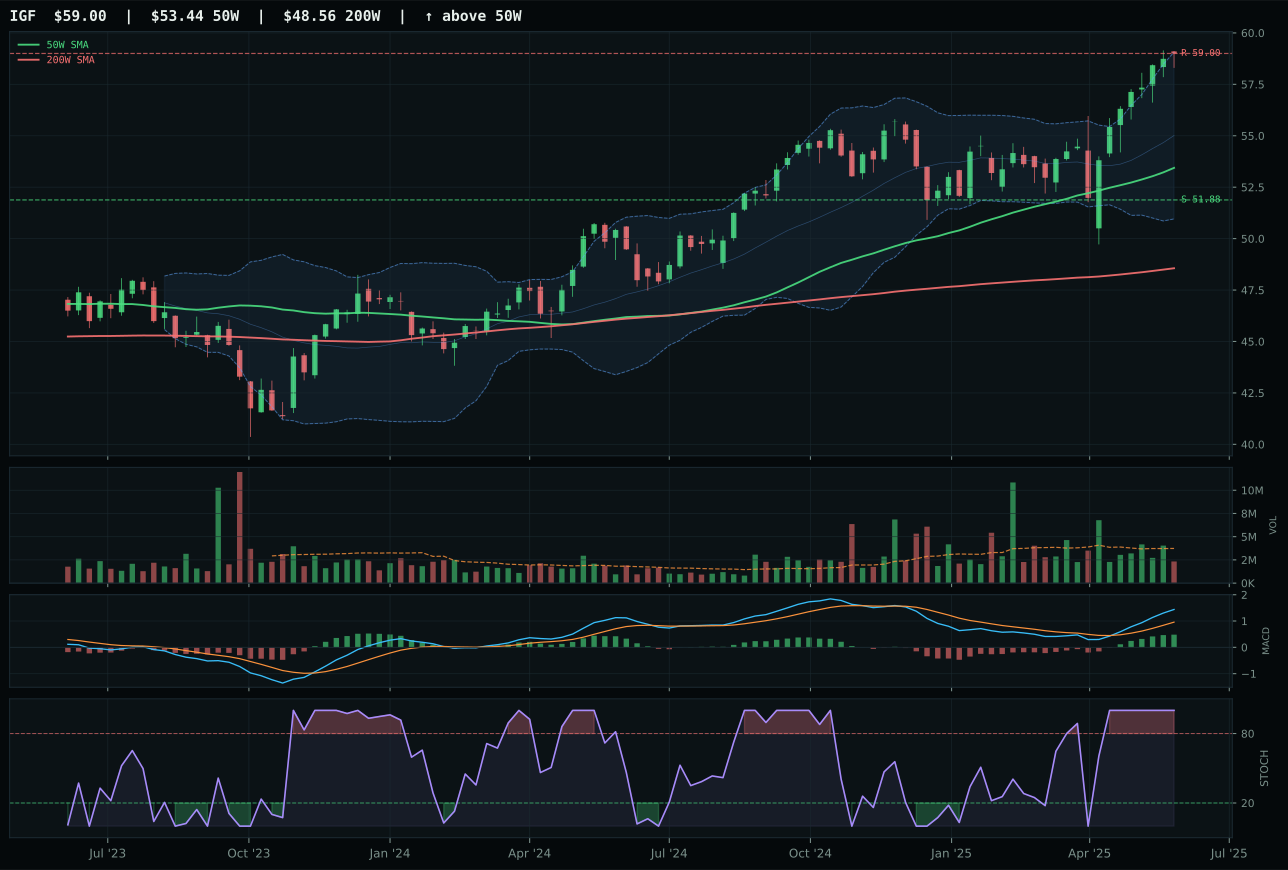
IGF has a neutral structure profile with 11.1% 13-week relative strength versus SPY.
A failed hold above support would weaken the setup.
Actionable but governed by invalidation levels.
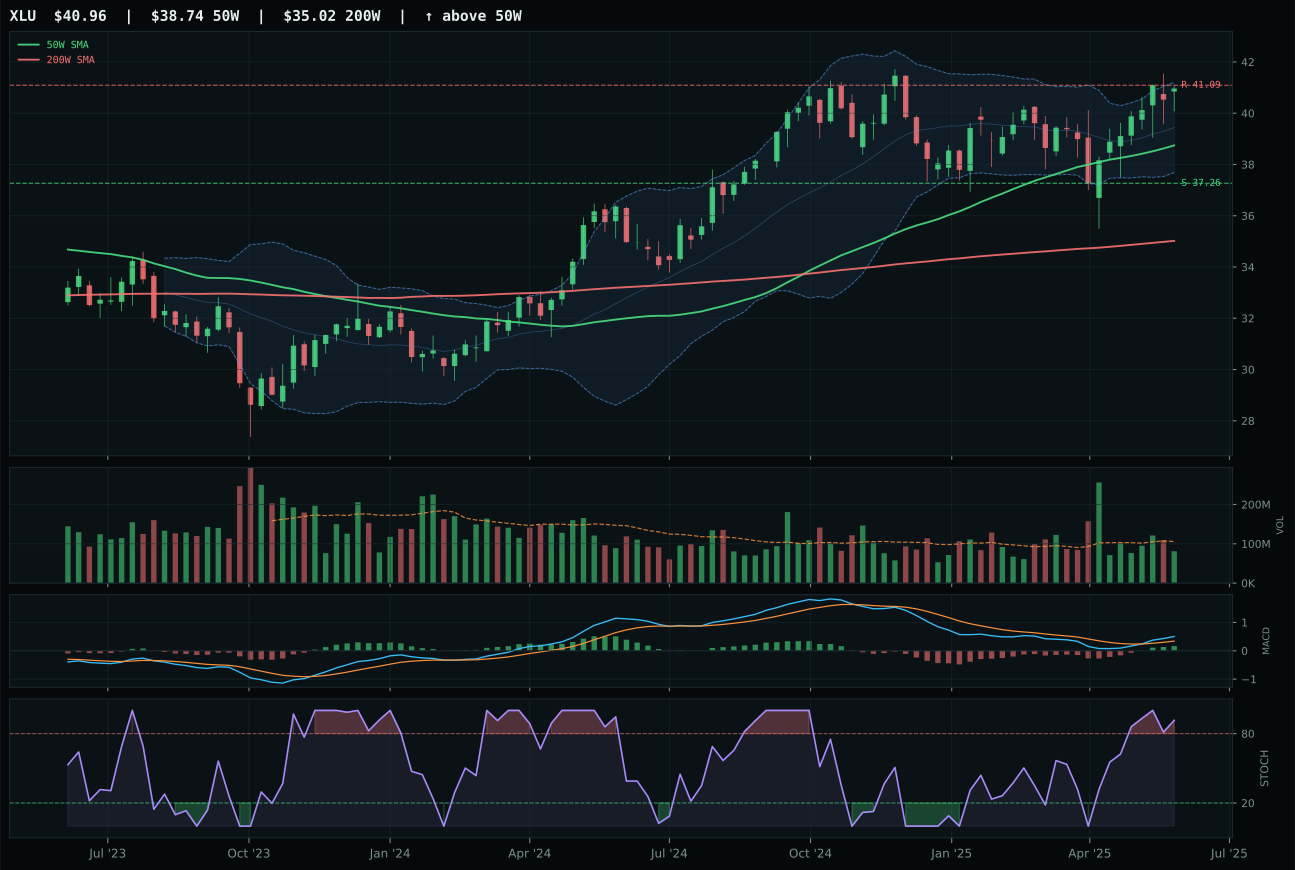
XLU has a neutral structure profile with 4.2% 13-week relative strength versus SPY.
A failed hold above support would weaken the setup.
Actionable but governed by invalidation levels.
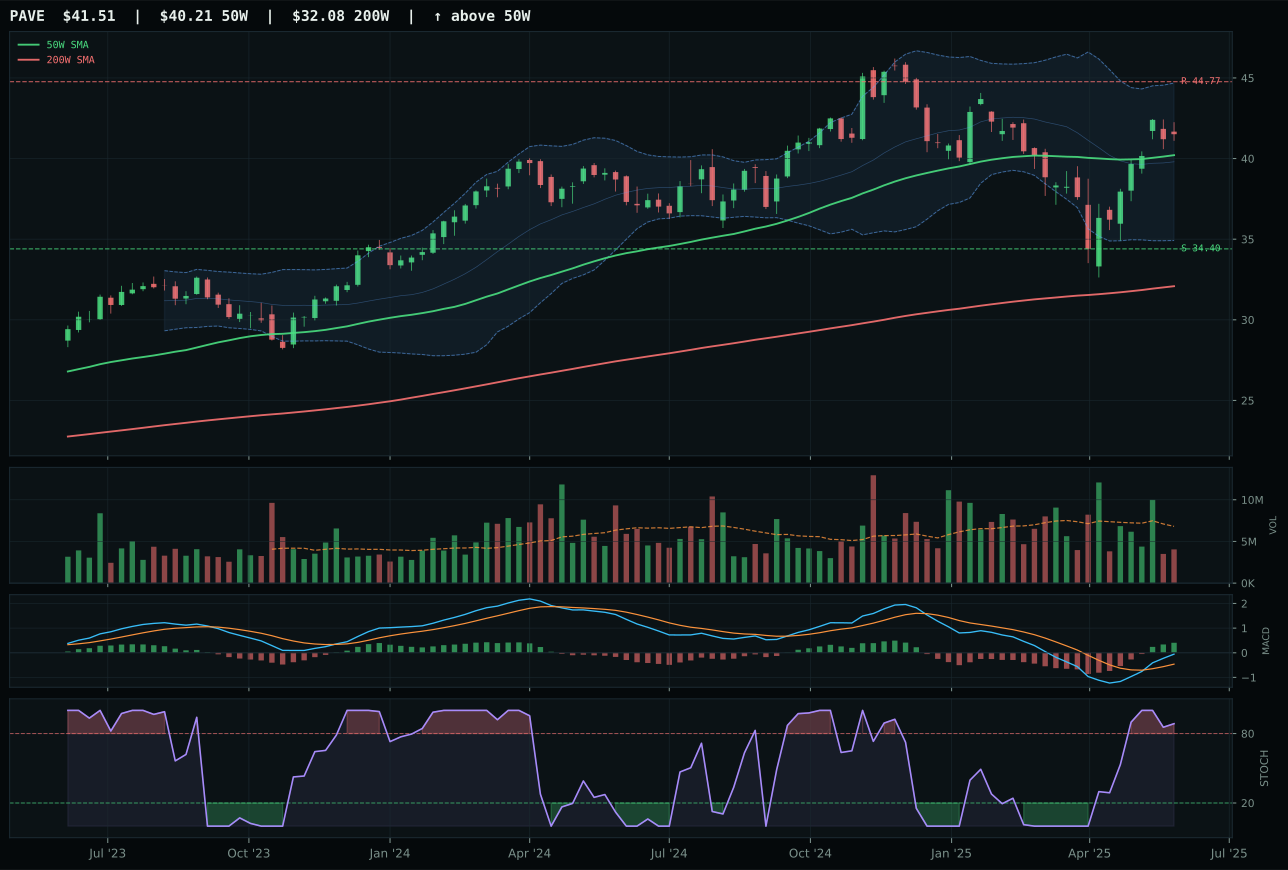
PAVE has a neutral structure profile with 4.0% 13-week relative strength versus SPY.
A failed hold above support would weaken the setup.
Actionable but governed by invalidation levels.
XLU captures the second top-2 slot by combining perfect trend (100.0) with the strongest macro narrative in the portfolio, despite finishing second to IGF on technical evidence alone. IGF scores 87.2 on technical execution and carries 11.1% relative strength, but XLU's category-relative strength of 0.0% masks the fact that defensive rotation (+12) is an active macro descriptor that favors regulated utilities over global infrastructure. XLU sits 5.8% above the 50W in neutral structure with bullish MACD and overbought stochastic RSI rolling over, a defensive setup that lacks the extension excitement of IGF but provides structural stability. Volume is neutral at 0.77x, appropriate for a compression pattern. XLU's 3.4% 13-week return underperforms IGF's 10.3%, but in a disinflation regime seeking portfolio de-risking, the anchor blue-chip utility expression outranks the more volatile international infrastructure play.
Utilities & Infrastructure ranks top-2 with a 70.6 category score and receives 10% allocation, making it the largest non-crypto position and the second major conviction bet alongside precious metals. Macro fit is 76.0/100—among the highest in the portfolio—driven by active defensive rotation (+12), disinflation pressure (+6), and explicit transition/mixed regime support (+4). XLU's 4.2% relative strength versus SPY is modest compared to GLD or ITA, but the category's macro sponsorship is unambiguous: this is where capital migrates when portfolio managers reduce duration risk and equity beta. The 57.0/100 timing score reflects compression, not extended strength; XLU is gathering rather than running. This allocation is the primary expression of the disinflation + defensive rotation thesis; both top-2 positions (GLD and XLU) embody the same macro narrative from different asset classes. The portfolio is explicitly underweighting equity risk and pivoting toward real assets and defensive utility yields. This is a conviction allocation, not a technical trade.
Technology — XLK
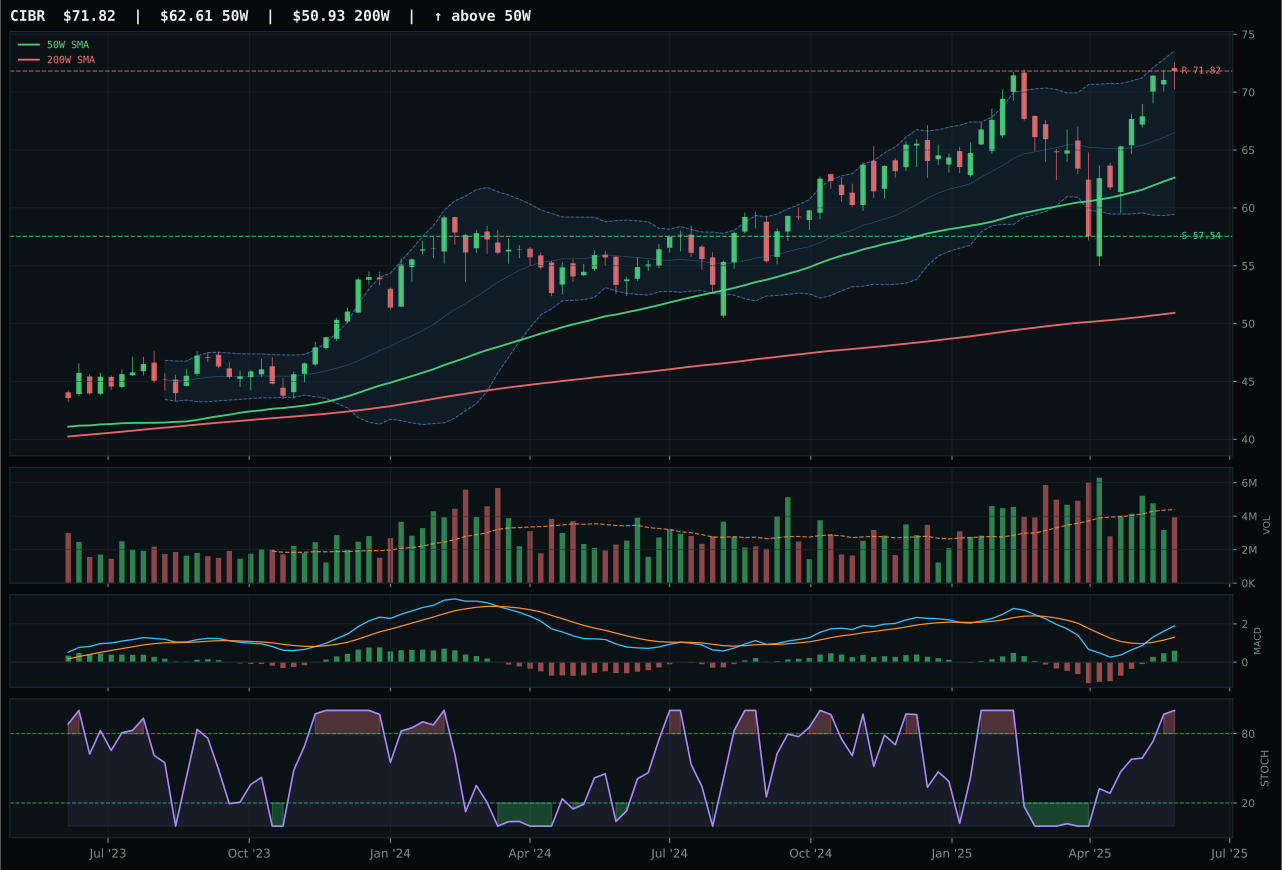
CIBR has a neutral structure profile with 9.4% 13-week relative strength versus SPY.
A failed hold above support would weaken the setup.
Actionable but governed by invalidation levels.
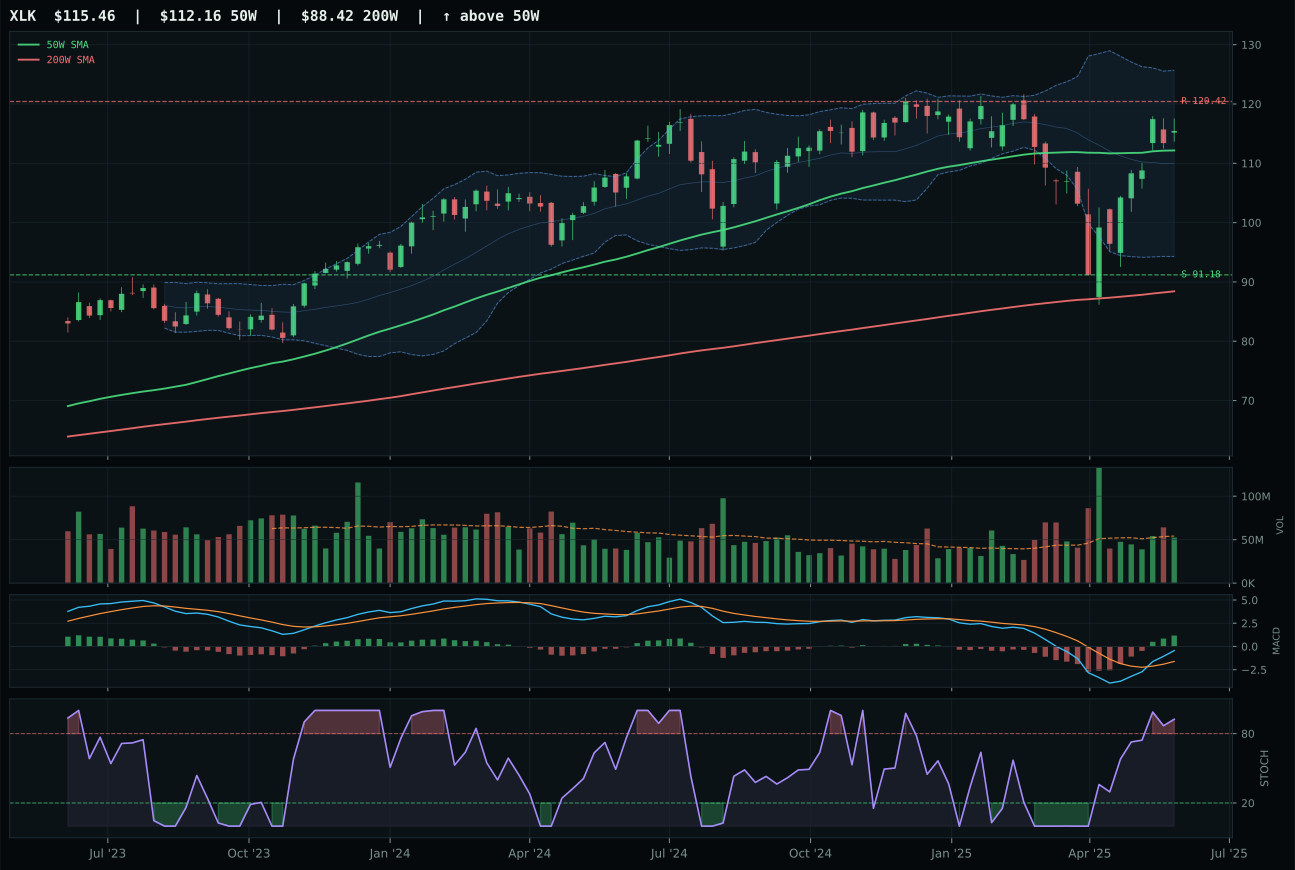
XLK has a neutral structure profile with 3.2% 13-week relative strength versus SPY.
A failed hold above support would weaken the setup.
Actionable but governed by invalidation levels.
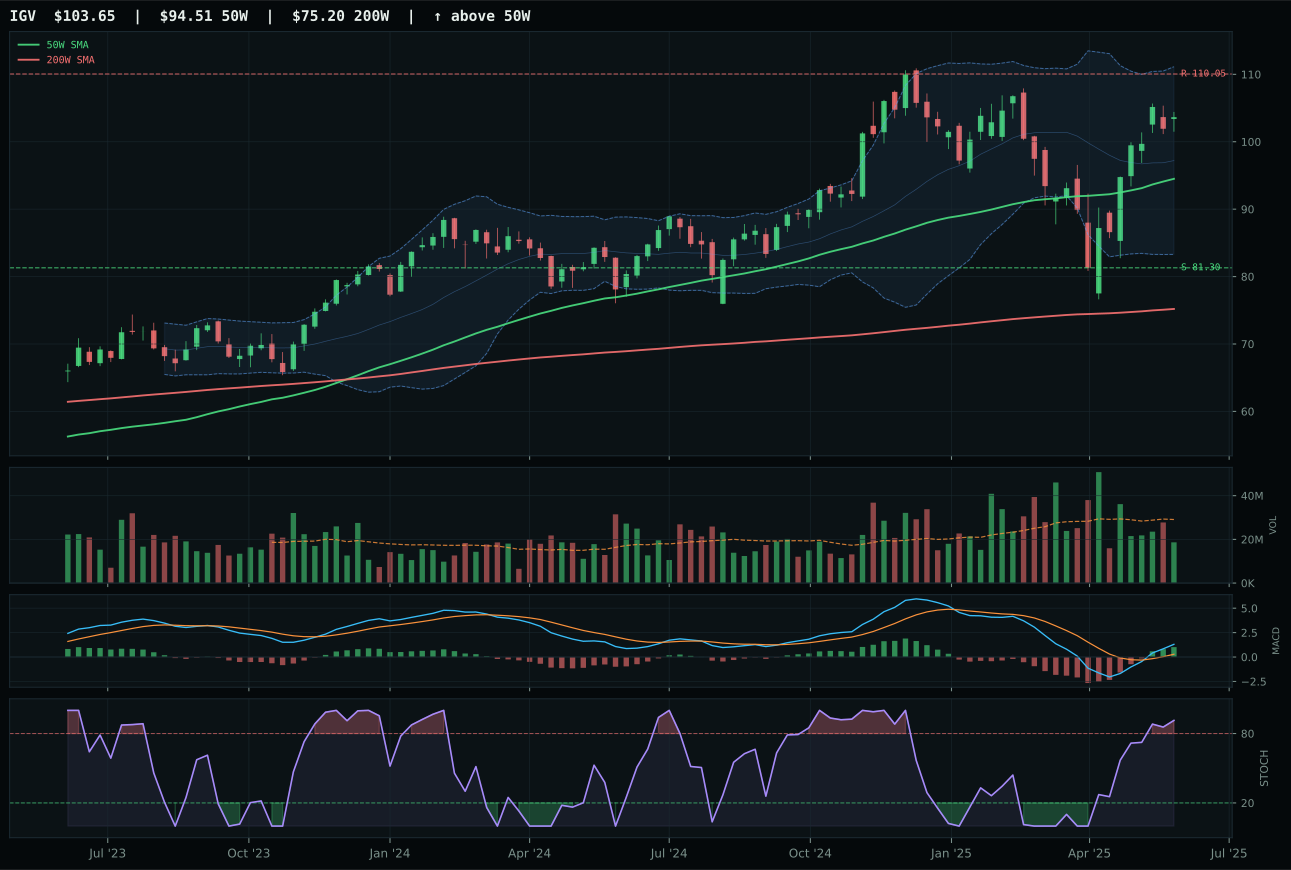
IGV has a neutral structure profile with 7.1% 13-week relative strength versus SPY.
A failed hold above support would weaken the setup.
Actionable but governed by invalidation levels.
XLK wins the category despite a marginal 0.2-point advantage over CIBR because timing discipline and proximity to the 50W moving average separated the two. XLK sits just 3.1% above its 50W while CIBR is stretched 14.7%, a critical difference when both carry neutral structure and overbought stochastic RSI readings. The timing score gap—90.0 versus 59.0—reflects XLK's superior risk-adjusted entry: CIBR has already given buyers multiple weeks to accumulate, while XLK is still near the point where defensive accumulation turns into momentum chase. Volume is neutral at both ETFs, MACD is bullish and improving for each, but XLK's category-relative strength of -4.0% versus CIBR's positive 2.3% RS suggests broad technology is the safer expression of the bullish setup rather than the narrower cybersecurity thesis that has already run.
Technology earns 5% allocation as a tier-2 category, ranking below two higher-scoring opportunities in a disinflation regime where growth stories struggle against macro headwinds. The category's 65.9 score reflects solid technical evidence (77.1/100) undermined by weak macro fit (45.0/100)—AI growth sponsorship adds value, but liquidity stress and the absence of inflation hedging keep it from breaking into the top tier. XLK's defensive positioning and modest 2.4% 13-week return offer stability rather than alpha; the case for holding this allocation is structural: technology cannot be ignored in a diversified portfolio, and a disinflation environment still rewards profitable scale. For this category to justify a top-2 slot, XLK would need to demonstrate sustained above-market relative strength and a cleaner setup—today it's a holding, not a conviction.
Nuclear Energy — URA
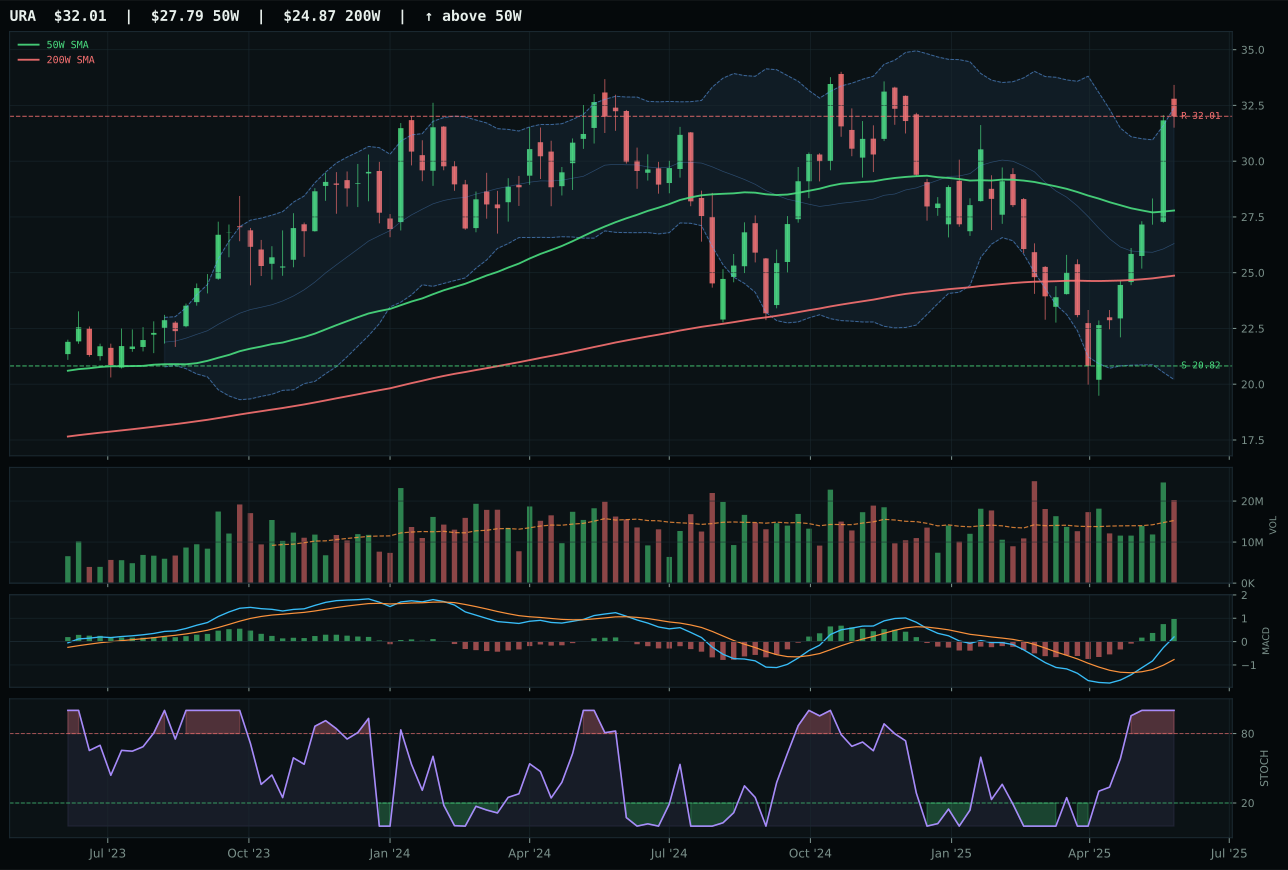
URA has a vertical extension profile with 29.9% 13-week relative strength versus SPY.
A failed hold above support would weaken the setup.
Actionable but governed by invalidation levels.
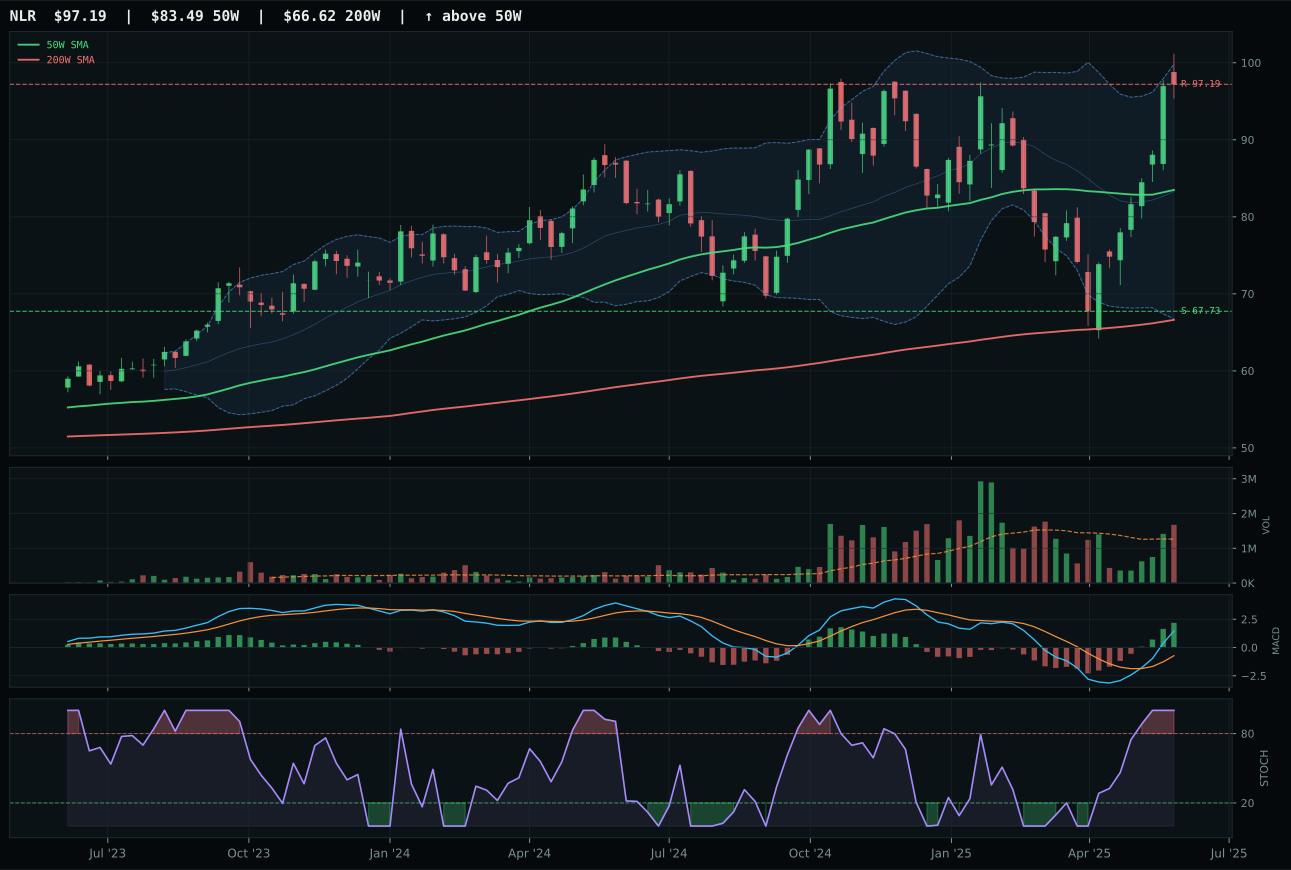
NLR has a vertical extension profile with 23.4% 13-week relative strength versus SPY.
A failed hold above support would weaken the setup.
Actionable but governed by invalidation levels.
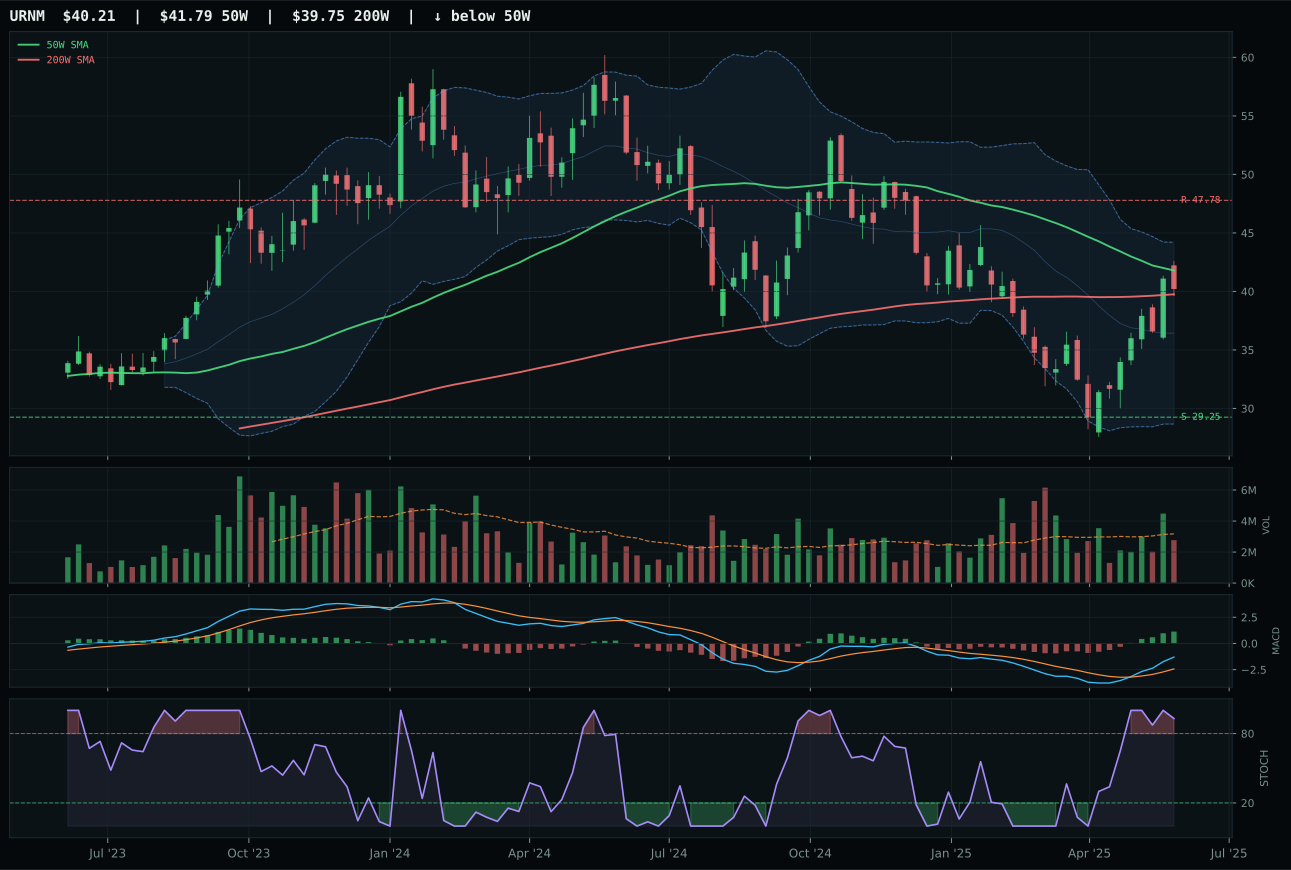
URNM has a neutral structure profile with 16.5% 13-week relative strength versus SPY.
A failed hold above support would weaken the setup.
Actionable but governed by invalidation levels.
URA edges NLR by 0.7 points for the tier-2 slot entirely on category-relative strength at 6.5% versus NLR's 0.0%, a narrow but decisive advantage when both ETFs carry identical trend (100.0), timing (45.0), and momentum (100.0) scores. Both sit vertically extended—URA at 15.2%, NLR at a similar level—with above-average volume participation and overbought stochastic RSI, but URA's 29.1% 13-week return versus NLR's 22.5% reflects genuine outperformance within the category. URA's persistence at 89.6/100 versus NLR's lower reading indicates that URA's momentum has translated into sustained holding, not just a spike. Macro narratives diverge slightly: NLR benefits from defensive rotation (+6) while URA's macro fit is neutral, but technical execution in this extended setup requires the stronger relative strength leader, which is URA.
Nuclear Energy ranks tier-2 at 5% allocation with a 65.2 category score, a respectable position held by exceptional technical evidence (94.8/100) despite neutral macro fit (50.0/100). URA's 29.9% relative strength versus SPY is the third-best in the portfolio after GLD and ITA, signaling genuine institutional demand for nuclear exposure. The category lacks specific macro descriptors; AI growth sponsorship (+5) provides some support, while liquidity stress (-7) is a mild headwind. This allocation is purely technical: URA's chart is extended but executing perfectly, and the persistence at 89.6/100 confirms the move is not rolling over. The case for holding is the strength of the setup itself, not macro narrative alignment. For the category to reach top-2 status, macro sponsorship would need to activate—either defensive rotation would need to explicitly embrace nuclear as energy infrastructure, or AI growth sponsorship would need to intensify around data-center power demand. Current allocation reflects technical merit in a macro vacuum.
Emerging Markets — IEMG
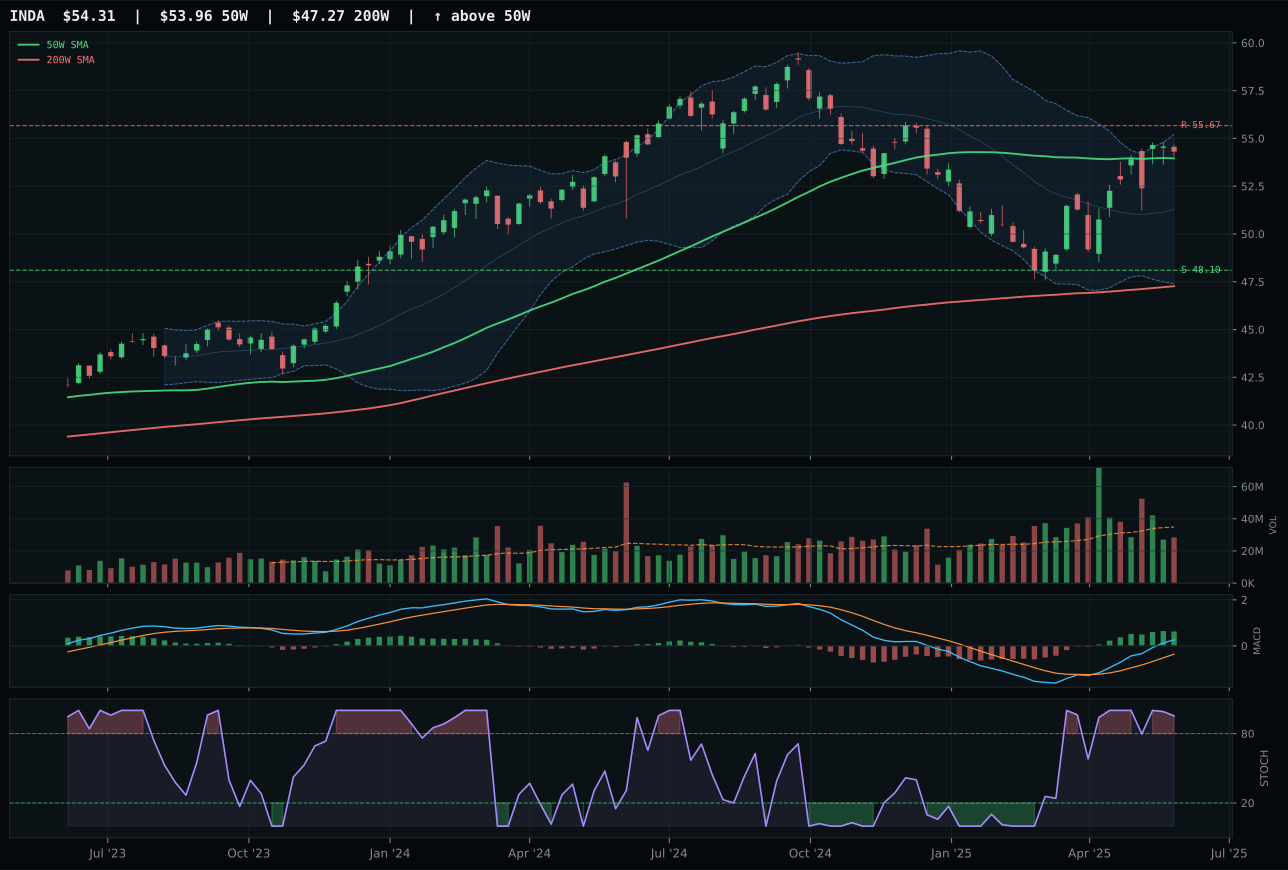
INDA has a compression near 50W profile with 13.7% 13-week relative strength versus SPY.
A failed hold above support would weaken the setup.
Actionable but governed by invalidation levels.
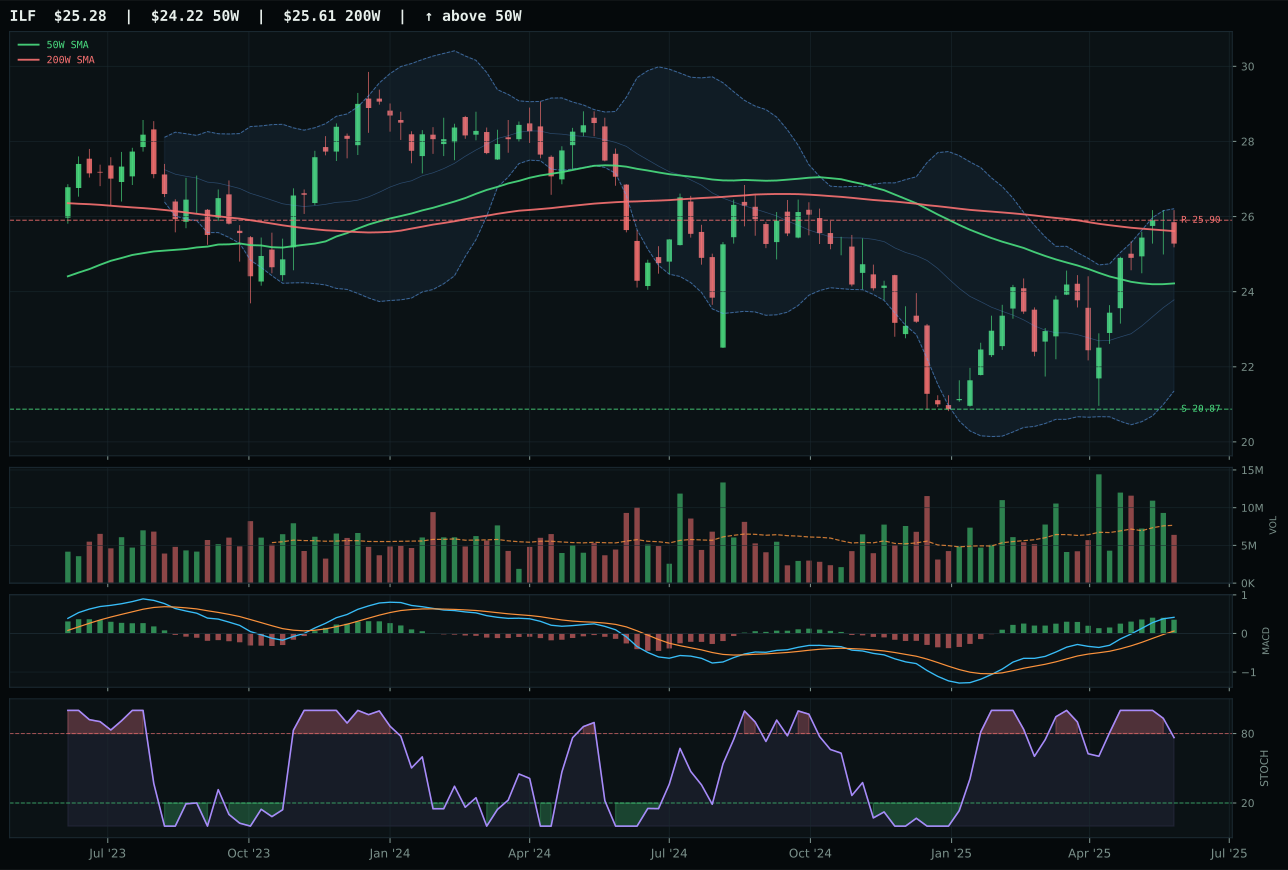
ILF has a neutral structure profile with 13.7% 13-week relative strength versus SPY.
A failed hold above support would weaken the setup.
Actionable but governed by invalidation levels.
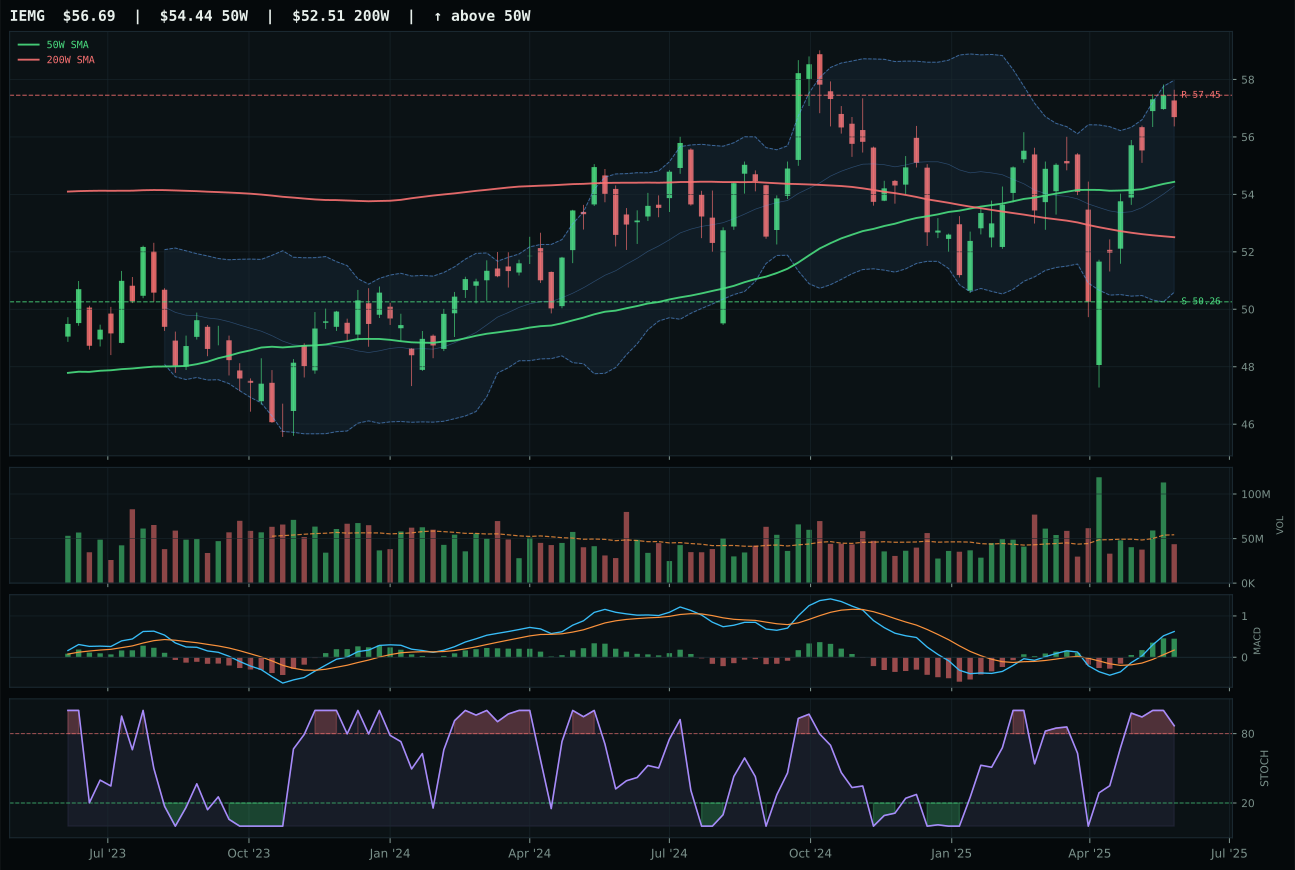
IEMG has a neutral structure profile with 6.9% 13-week relative strength versus SPY.
A failed hold above support would weaken the setup.
Actionable but governed by invalidation levels.
IEMG wins despite technical evidence of only 62.4/100 because INDA's structure collapsed to 72.4 and ILF's setup, while technically sound, lacks the breadth of IEMG's broad emerging-market expression. INDA is overextended at compression near the 50W with 13.7% relative strength, creating a narrower thesis; ILF sits in neutral structure with solid 11.1% RS but thinner participation. IEMG's neutrality—6.9% RS versus SPY, 6.1% 13-week return—actually becomes an advantage when both competitors show category-relative weakness; IEMG's -6.8% category-relative strength is less damaging than INDA's 0.1% because the category itself is weak. Volume participation is consistently thin across all three, but IEMG's neutral volume is preferable to ILF's explicit thin participation. The winner represents broad beta, not alpha.
Emerging Markets ranks tier-2 at 5% allocation with a 59.1 category score, held down by poor macro fit (40.0/100) driven entirely by liquidity stress (-10). IEMG's representative technical evidence (62.4/100) is the third-lowest in the portfolio, suggesting this is a defensive allocation rather than a conviction play. The category's momentum confirmation is middling at 64.2/100, and risk-reward is tight at 46.9/100—margin of safety is thin. Holding 5% here is structural diversification in a global portfolio during a disinflation regime; emerging markets typically benefit from currency devaluation, not disinflation. The macro case for this allocation is negative; liquidity stress and the absence of growth sponsorship mean this is a hold position pending better setup or macro shift. IEMG would need to break convincingly above the 57.45 resistance and see category-relative strength improve materially to justify increasing allocation. Current position is a placeholder.
AI — SMH
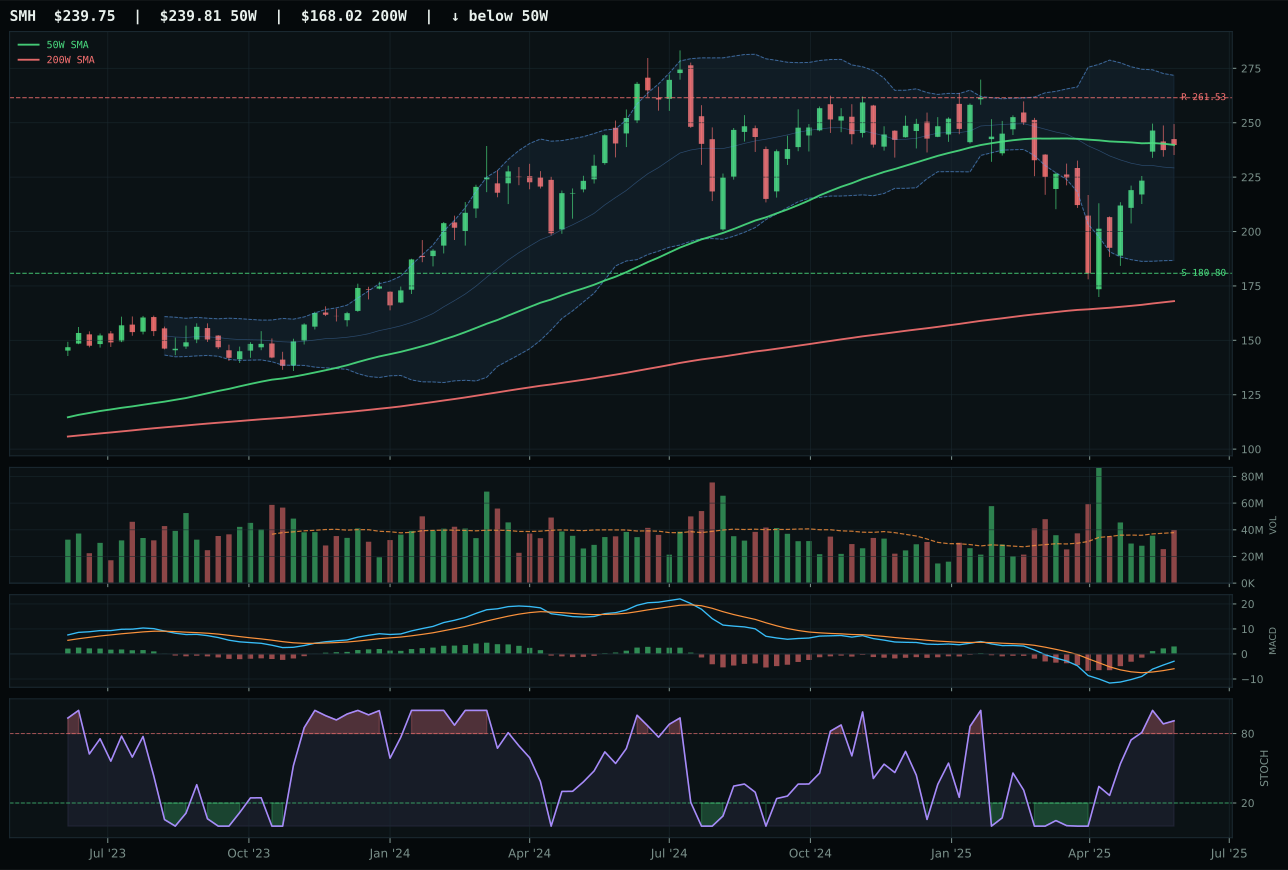
SMH has a compression near 50W profile with 3.8% 13-week relative strength versus SPY.
A failed hold above support would weaken the setup.
Actionable but governed by invalidation levels.
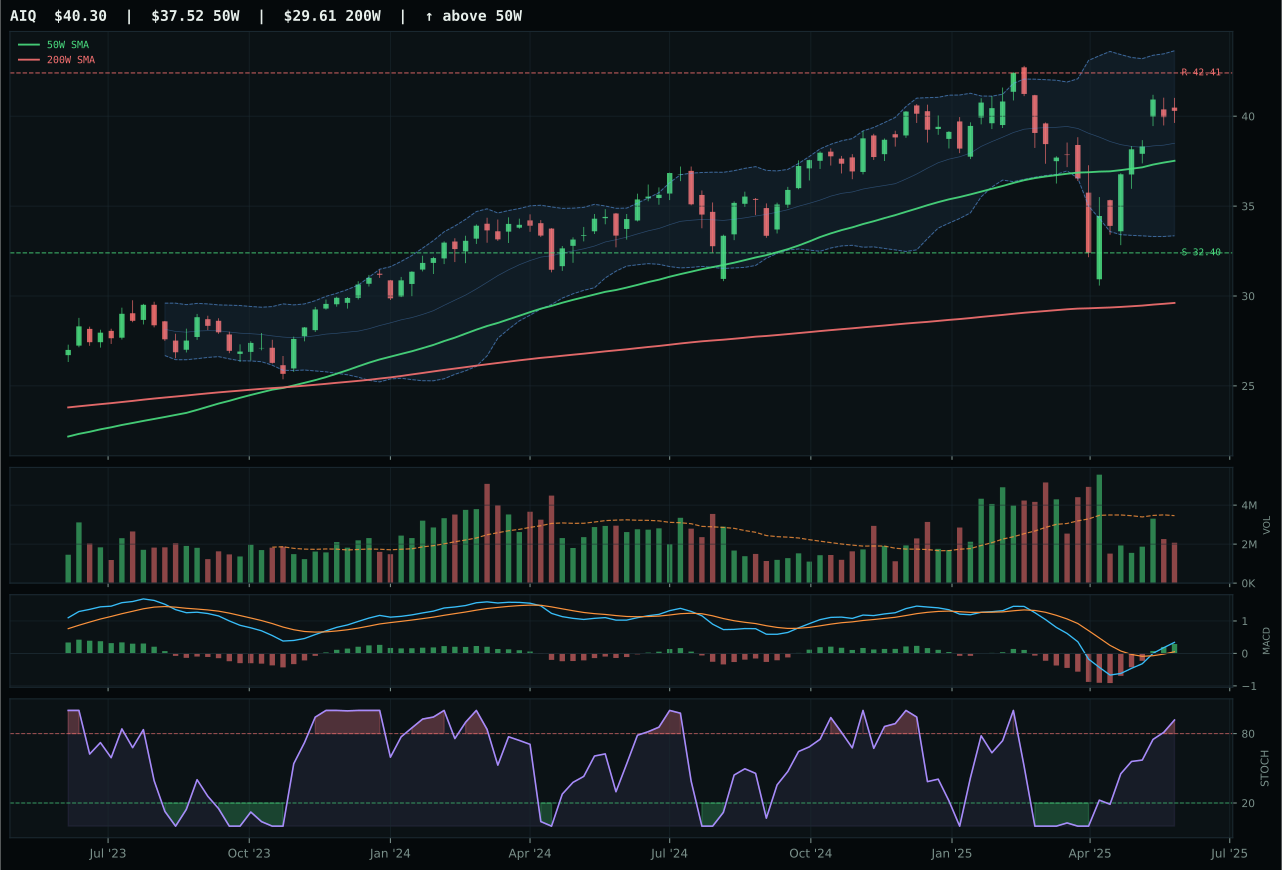
AIQ has a neutral structure profile with 4.0% 13-week relative strength versus SPY.
A failed hold above support would weaken the setup.
Actionable but governed by invalidation levels.
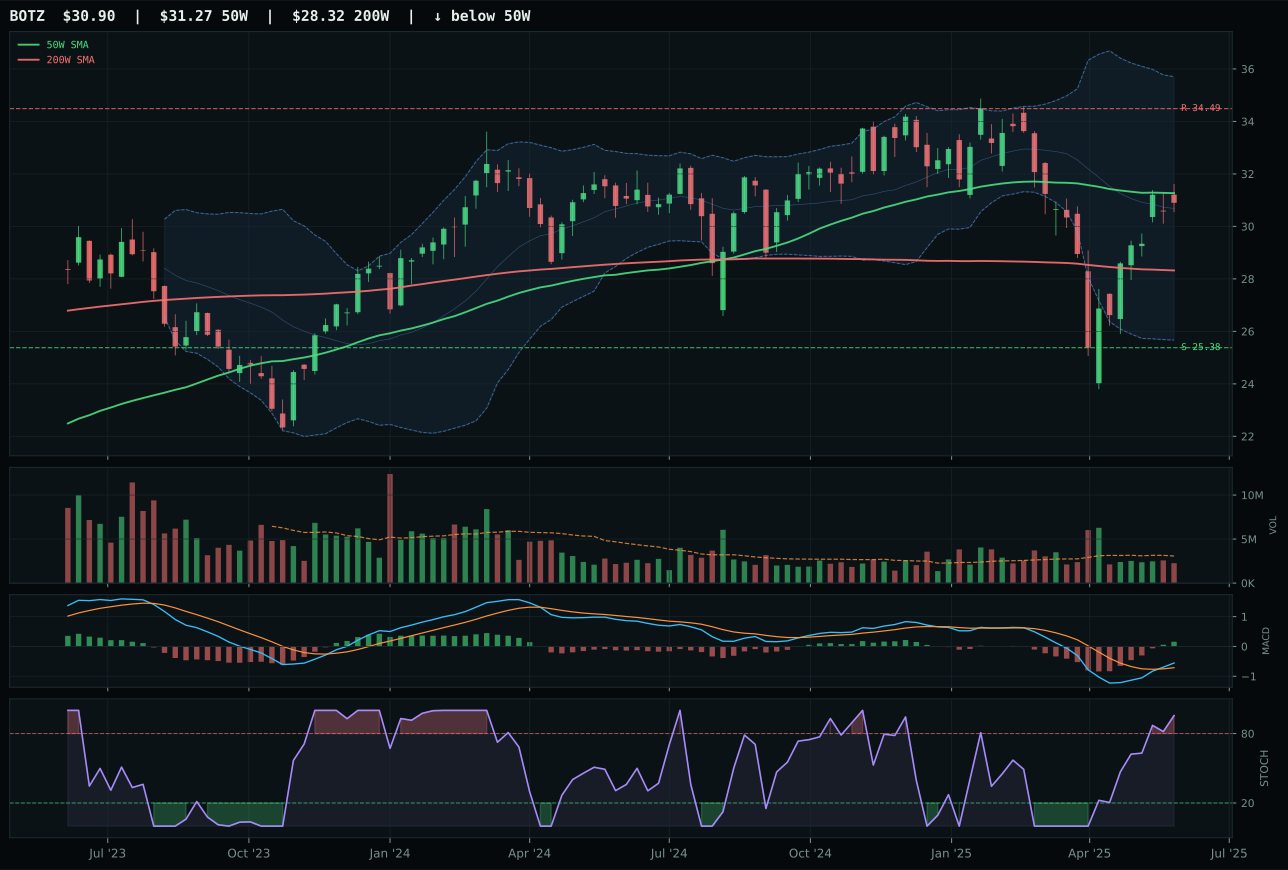
BOTZ has a compression near 50W profile with -2.8% 13-week relative strength versus SPY.
A failed hold above support would weaken the setup.
Actionable but governed by invalidation levels.
SMH beats AIQ by precisely one point—timing—because it sits at the 50W moving average while AIQ is already 7.4% extended, fundamentally shifting the risk-reward in SMH's favor. Both carry overbought momentum, bullish MACD, and similar 13-week returns near 3%, but SMH's compression setup near the 50W provides natural support and expansion potential if buyers defend. AIQ's thinner volume participation and stretched position penalize it during a period when entry discipline matters more than trend continuation. The score gap of 1.3 points understates how tightly these two compete; the winner was determined by proximity to a key moving average and the structural setup, not by fundamentals or macro narrative divergence.
AI receives 5% allocation as a tier-2 category despite a category score of 58.2, trailing two higher-ranked exposures in the current disinflation regime. Macro fit is only 57.0/100—AI growth sponsorship is active at +14, but liquidity stress at -12 and weak disinflation tailwinds leave this category vulnerable to near-term volatility. SMH's 3.0% 13-week return and neutral relative strength tell the story: momentum is present but participation is uneven, and the setup resembles a pause rather than a breakout. The allocation case rests on conviction that AI infrastructure demand will survive disinflation; holding this 5% position is appropriate insurance, but the timing is defensive—SMH's perfect 100.0 timing score masks the fact that the category is compressed and waiting for either a break above resistance or a capitulation below support. Growth in this category remains sponsored, but not yet celebrated.
Defense & Aerospace — ITA
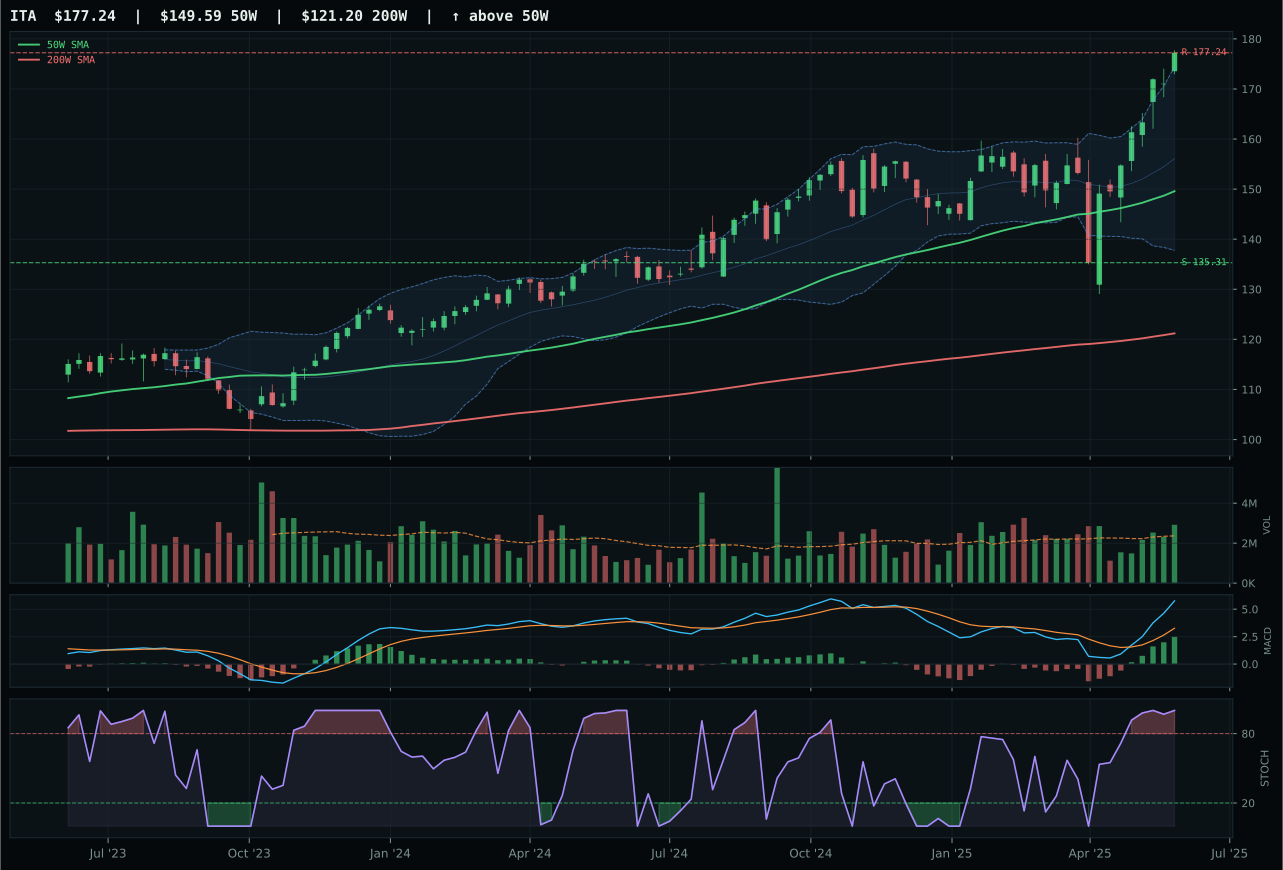
ITA has a vertical extension profile with 15.3% 13-week relative strength versus SPY.
A failed hold above support would weaken the setup.
Actionable but governed by invalidation levels.
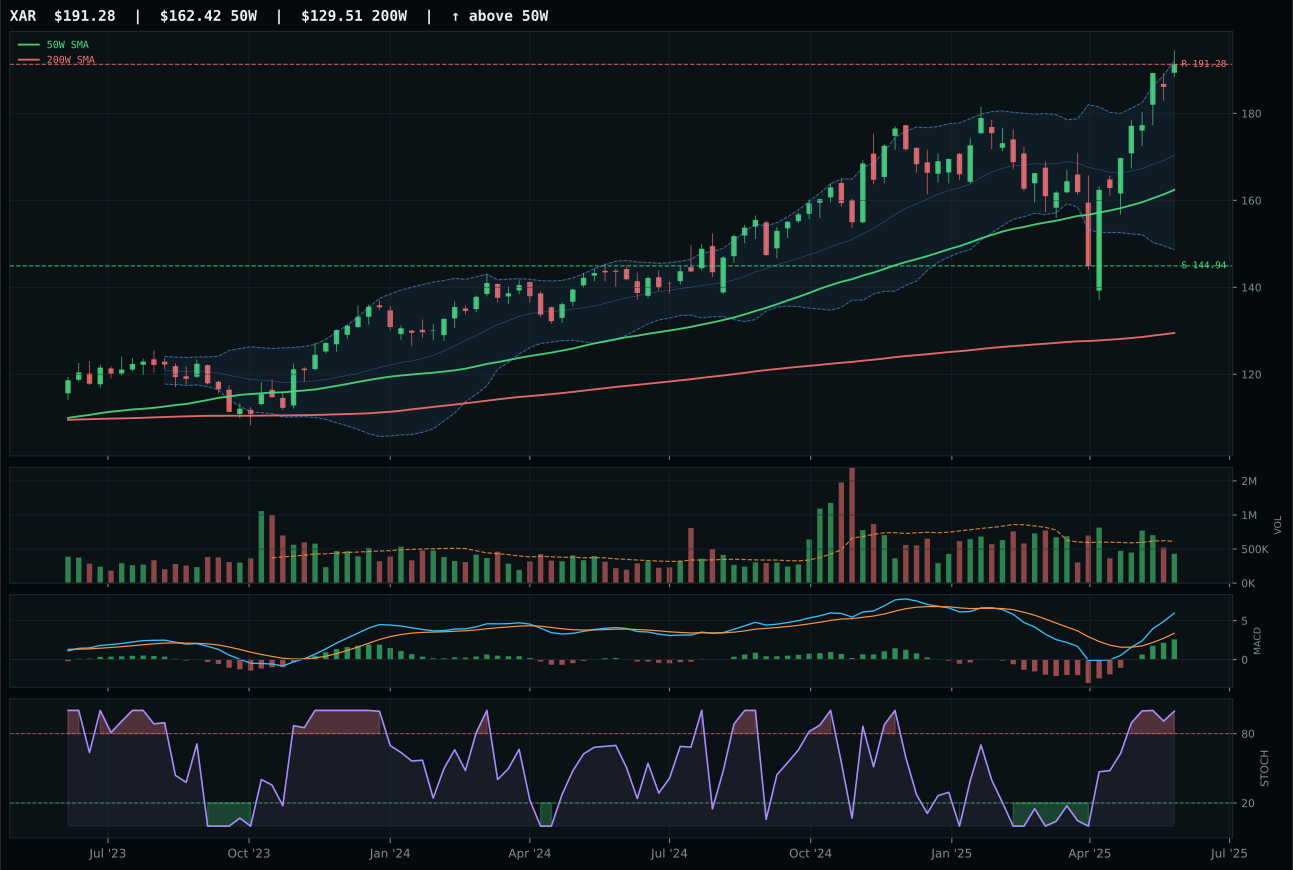
XAR has a vertical extension profile with 15.9% 13-week relative strength versus SPY.
A failed hold above support would weaken the setup.
Actionable but governed by invalidation levels.
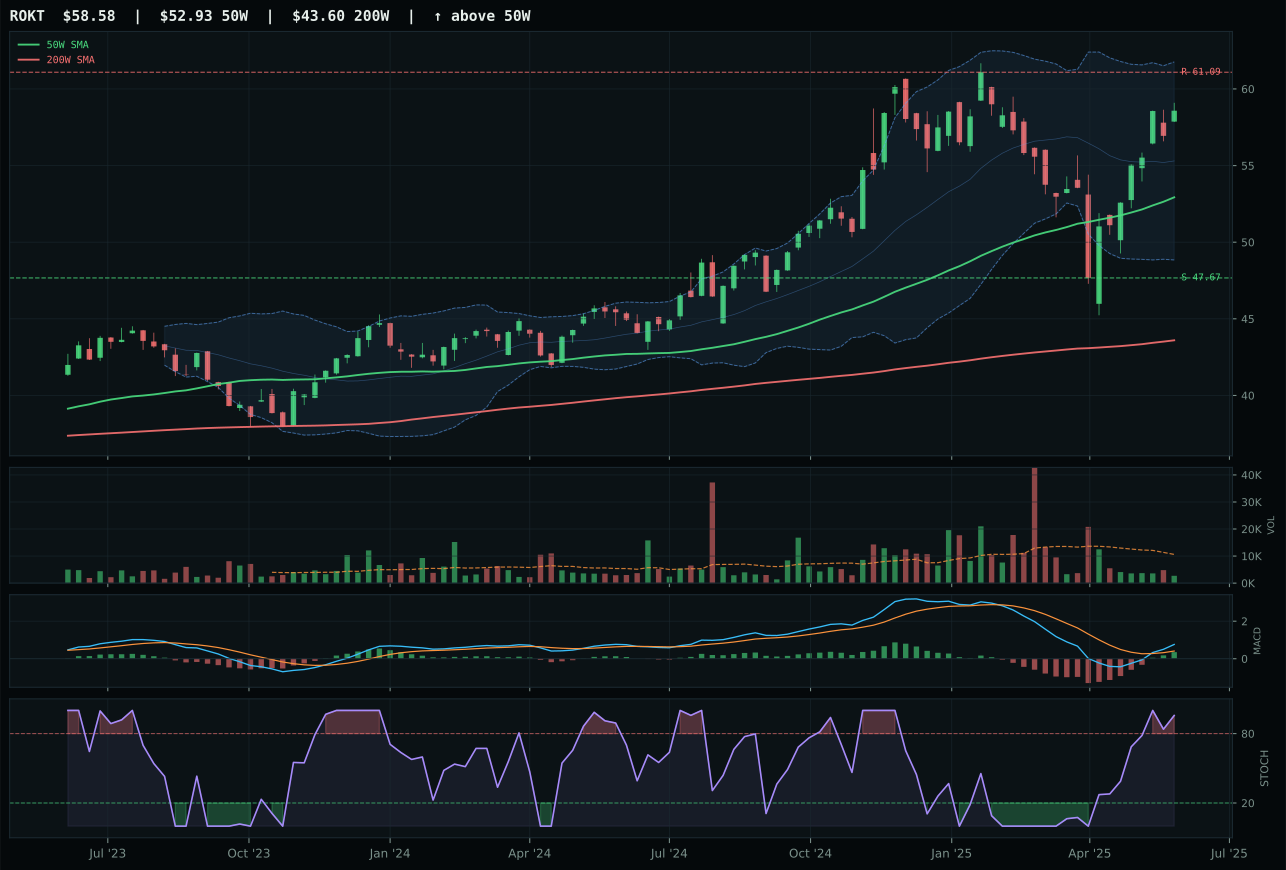
ROKT has a neutral structure profile with 6.2% 13-week relative strength versus SPY.
A failed hold above support would weaken the setup.
Tracked, but not top-2 eligible because: .
ITA dominates its category with a 2.4-point margin over XAR, driven by superior volume confirmation and timing execution despite both being vertically extended. ITA is 18.5% above its 50W with above-average participation at 1.23x the 20W average, providing institutional sponsorship that XAR—stretched even further at 25.5% with thin volume—cannot match. Both have overbought momentum and bullish MACD, but ITA's stronger cleanliness score (75.0 vs 75.6) and perfect momentum confirmation (100.0) signal accumulation rather than late-stage momentum rolling over. XAR's stochastic RSI is already beginning to roll over while ITA's sits flat at maximum, a subtle but important technical confirmation that ITA's extended move retains genuine buying interest. The 14.5% 13-week return with above-average volume is the classic signature of institutional portfolio rotation into defensive beta.
Defense & Aerospace ranks tier-2 at 5% allocation with a 53.4 category score, benefiting from defensive rotation sponsorship (+7) even as extended valuations and poor risk-reward (41.6/100) prevent it from reaching top-2 status. ITA's vertical extension and 15.3% relative strength versus SPY are genuine outperformance, but they come at the cost of timing—the 37.0/100 timing score reflects the reality that new buyers are late to this leadership move. The category macro fit is exactly neutral because AI growth, liquidity stress, and defensive rotation all have claims on the narrative, but none dominate. ITA's strong technical evidence (86.9/100) carries this category to tier-2, but the macro environment has already priced in rotation to safety; the allocation here is structural diversification, not momentum capture. Entry quality has deteriorated week-over-week, and the category would need a sharp pullback to refresh its setup.
Industrial Metals — COPX
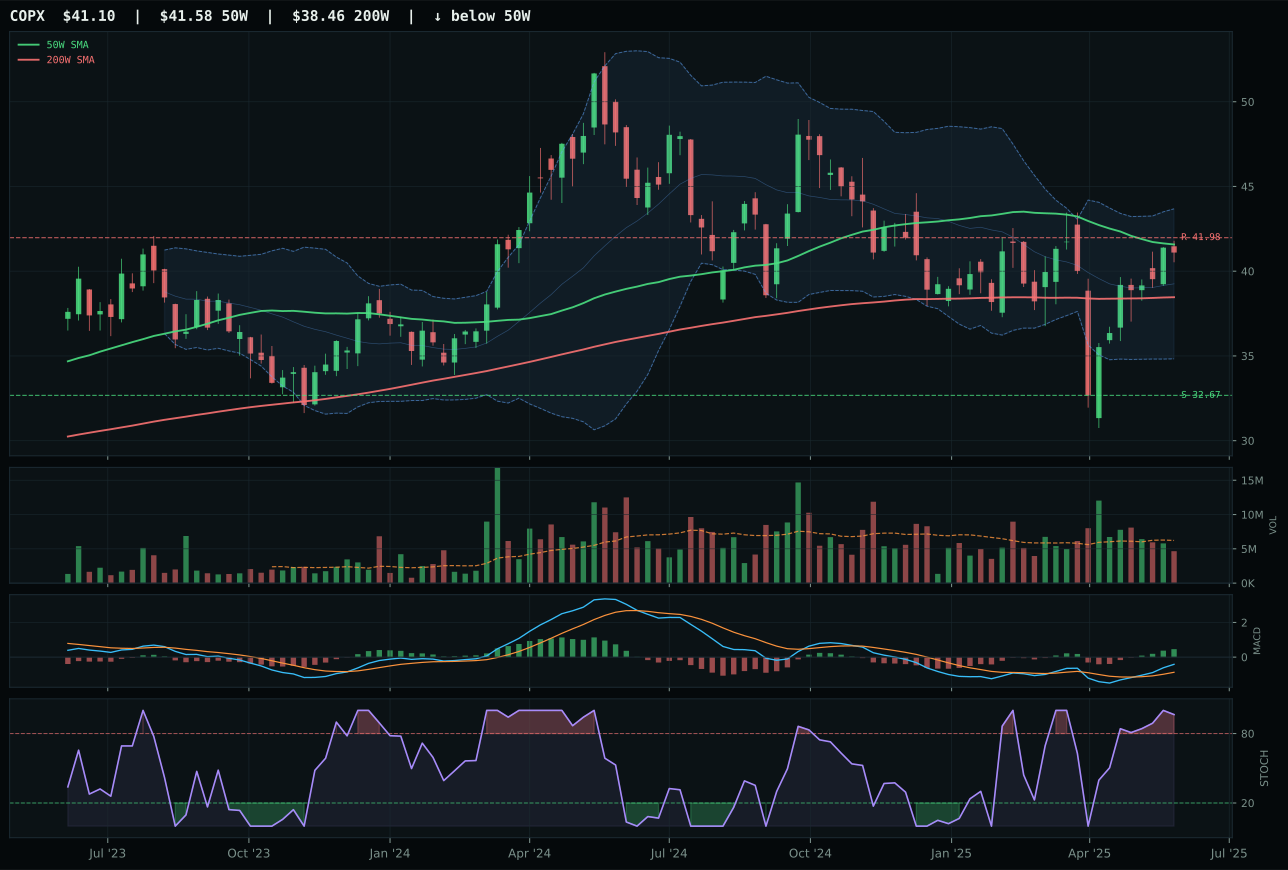
COPX has a compression near 50W profile with 8.3% 13-week relative strength versus SPY.
A failed hold above support would weaken the setup.
Actionable but governed by invalidation levels.
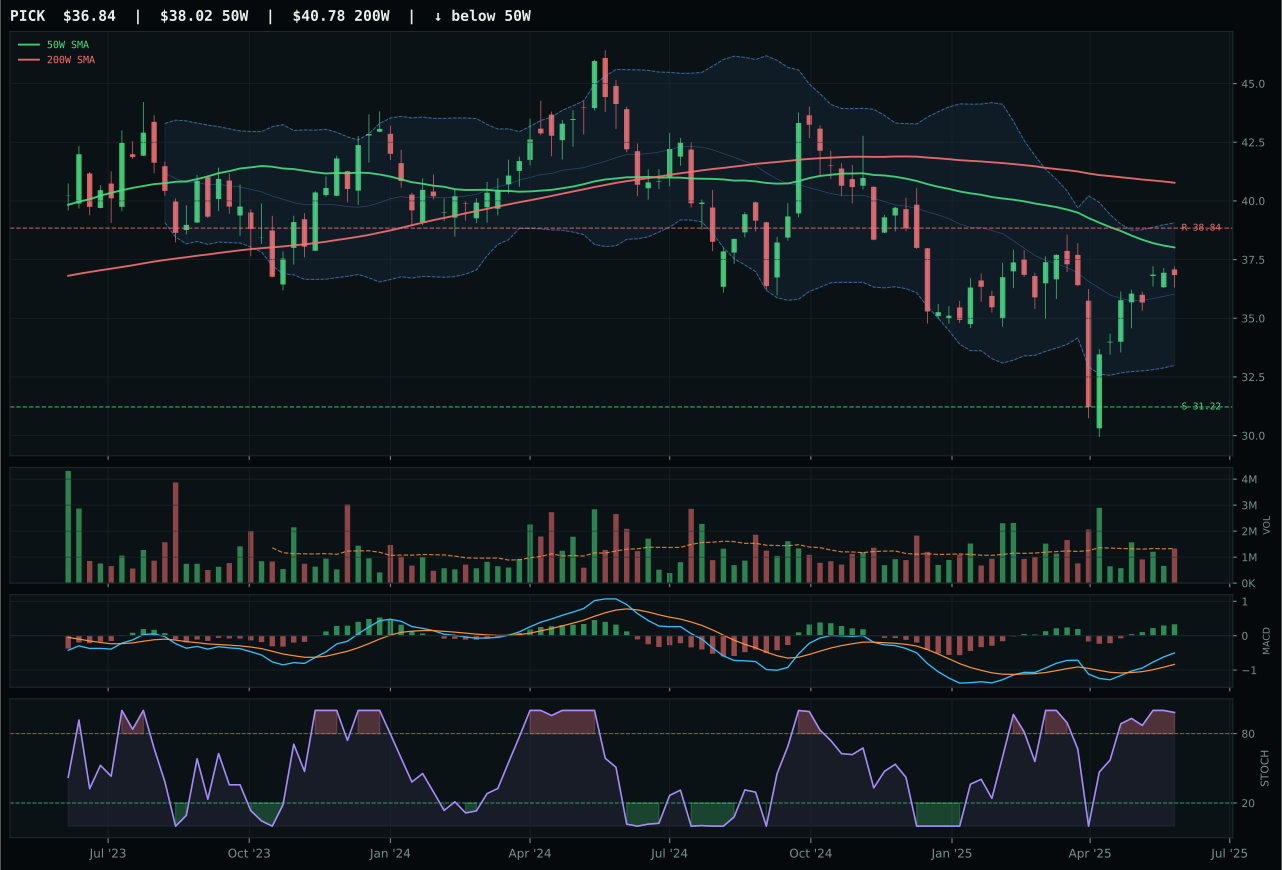
PICK has a neutral structure profile with 3.5% 13-week relative strength versus SPY.
Extension and support failure are the main tactical risks.
Tracked, but not top-2 eligible because: structurally broken.
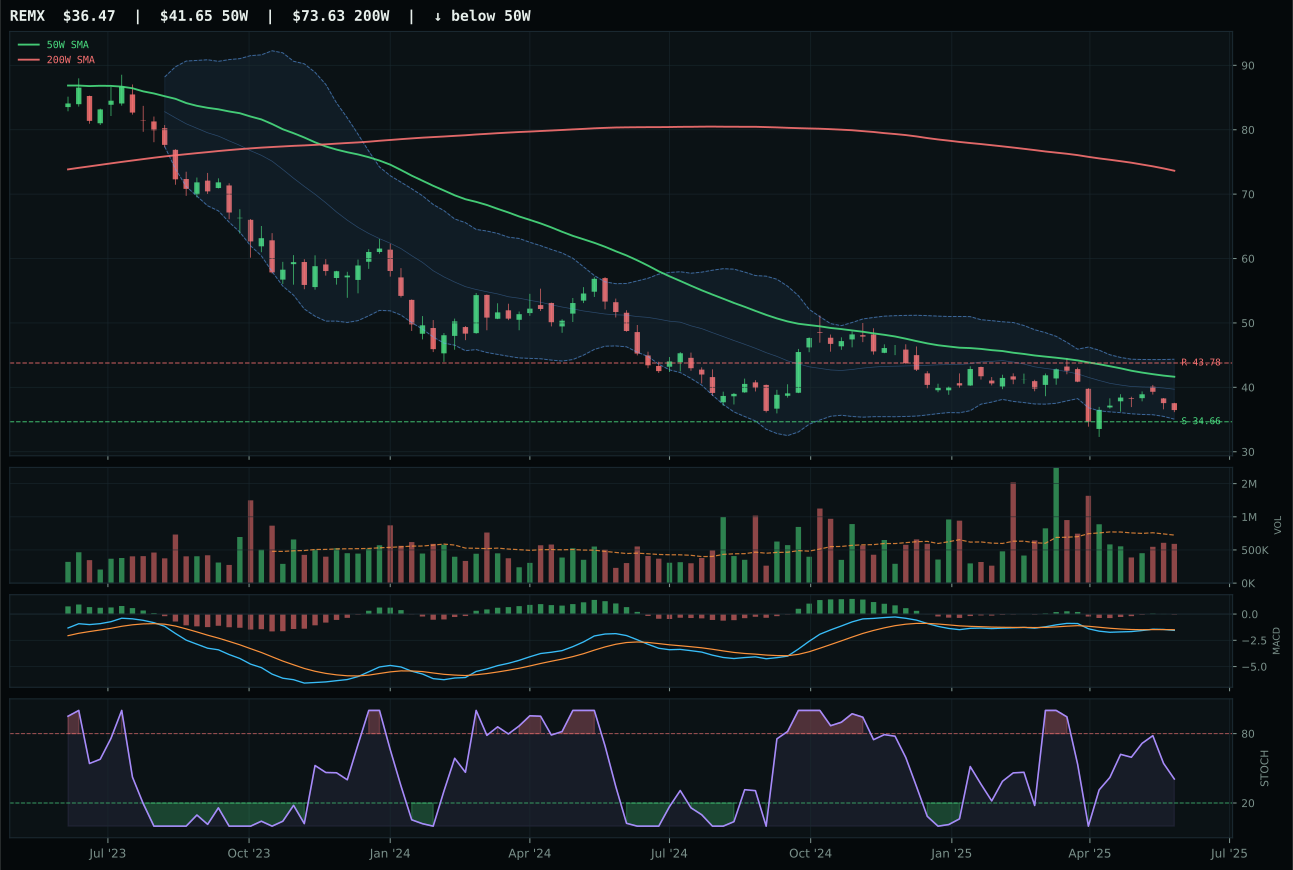
REMX has a neutral structure profile with -7.6% 13-week relative strength versus SPY.
Extension and support failure are the main tactical risks.
Tracked, but not top-2 eligible because: structurally broken.
COPX captures tier-2 allocation by executing a textbook mean-reversion setup: price at the 50W with -1.1% distance, bullish MACD, overbought momentum, and compression structure all aligned for potential expansion. PICK's structural cleanliness of only 42.6 versus COPX's 71.0 disqualifies it despite similar trend components; PICK's chart is broken, failing key technical filters. COPX's 7.5% 13-week return and 8.3% relative strength versus SPY confirm that accumulated demand is real, not just MACD reading. Momentum confirmation hits 95.6/100 because the 4W return of 5.7% supports the 13W move, and category-relative strength is positive at 4.9%—COPX is the only expression of industrial metals demand in the current setup. The 1.05x volume at the 20W average is neutral-to-light, typical of compression, and above-average participation would be a false signal here.
Industrial Metals lands at tier-2 with 5% allocation despite a dismal 15.2 category score, held down by liquidity stress (-8) and macro fit of only 42.0/100. The category is fundamentally hamstrung by disinflation pressure and weak industrial demand signals; COPX's compression near the 50W is defensive positioning, not cyclical opportunity. Holding 5% here is a hedge against mean reversion, not a growth conviction. The gap between COPX's 69.0 technical evidence and its 43.0 macro fit tells the story: the setup is technically sound, but the macro regime offers no tailwind. This allocation would immediately reset to 0% if COPX breaks below support at 32.67, confirming that compression was absorption rather than accumulation. The case for holding this 5% is structural diversification in a balanced sleeve; the category would need to break clearly above 41.98 resistance and see volume expand meaningfully to justify increasing.
Agriculture & Livestock — MOO
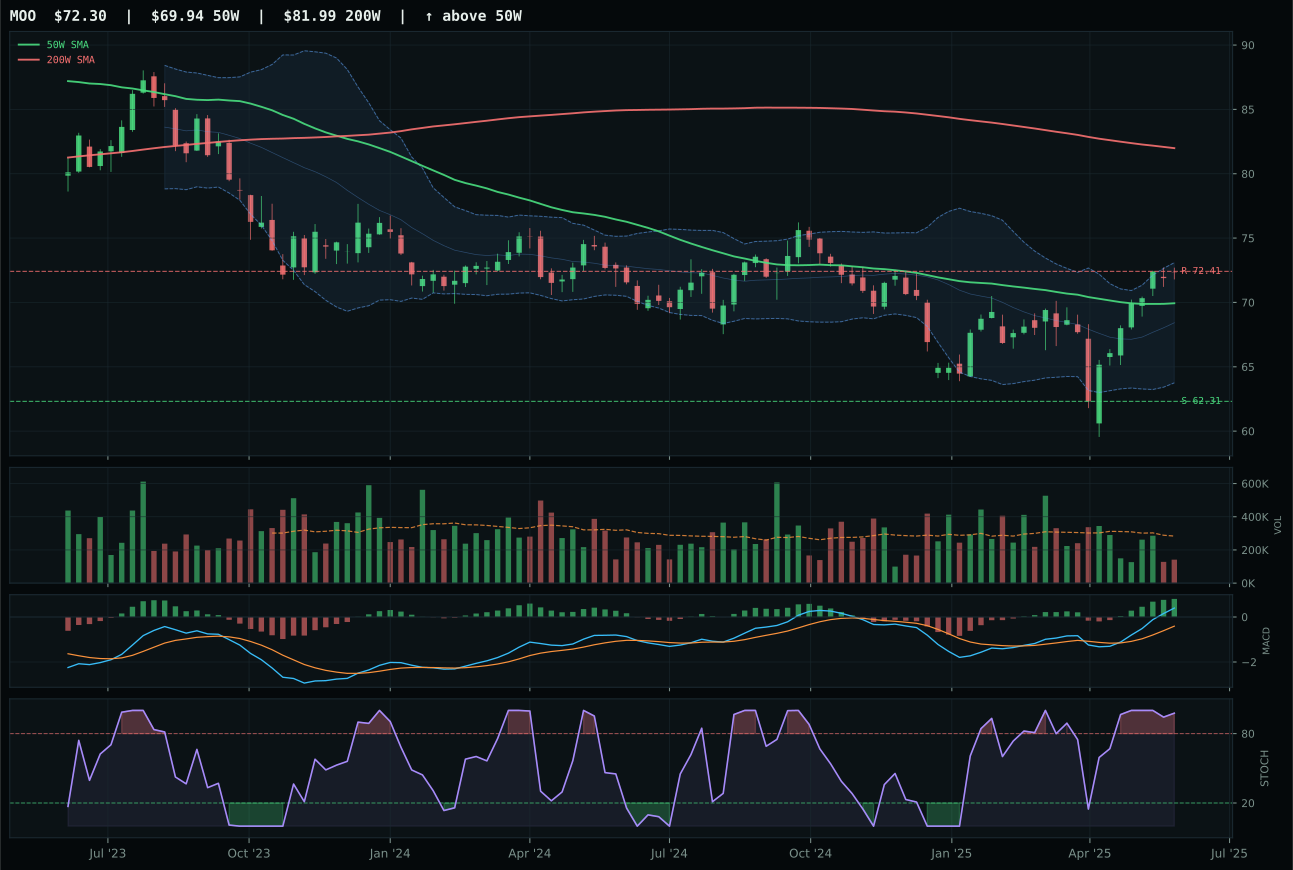
MOO has a neutral structure profile with 7.1% 13-week relative strength versus SPY.
A failed hold above support would weaken the setup.
Actionable but governed by invalidation levels.
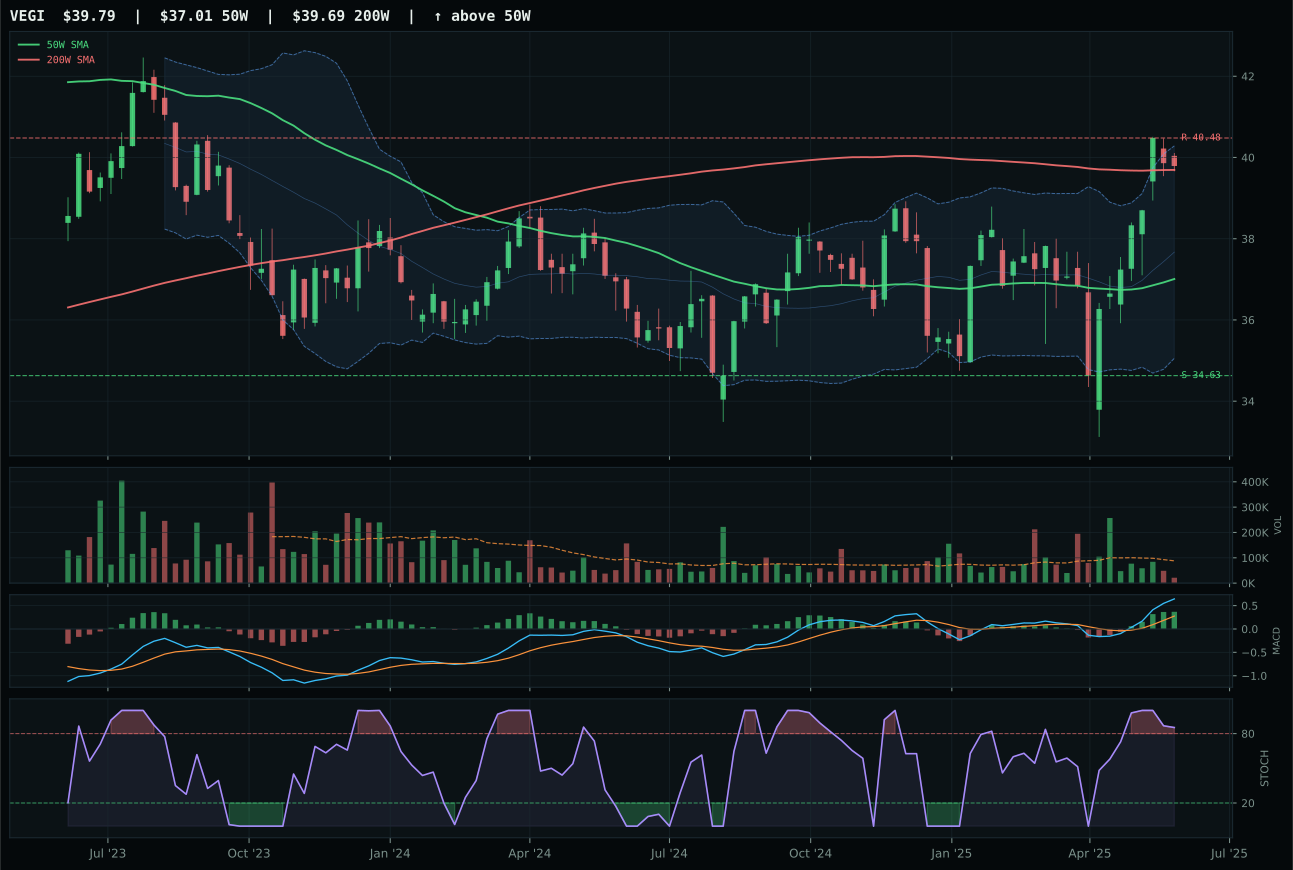
VEGI has a neutral structure profile with 7.6% 13-week relative strength versus SPY.
A failed hold above support would weaken the setup.
Tracked, but not top-2 eligible because: .
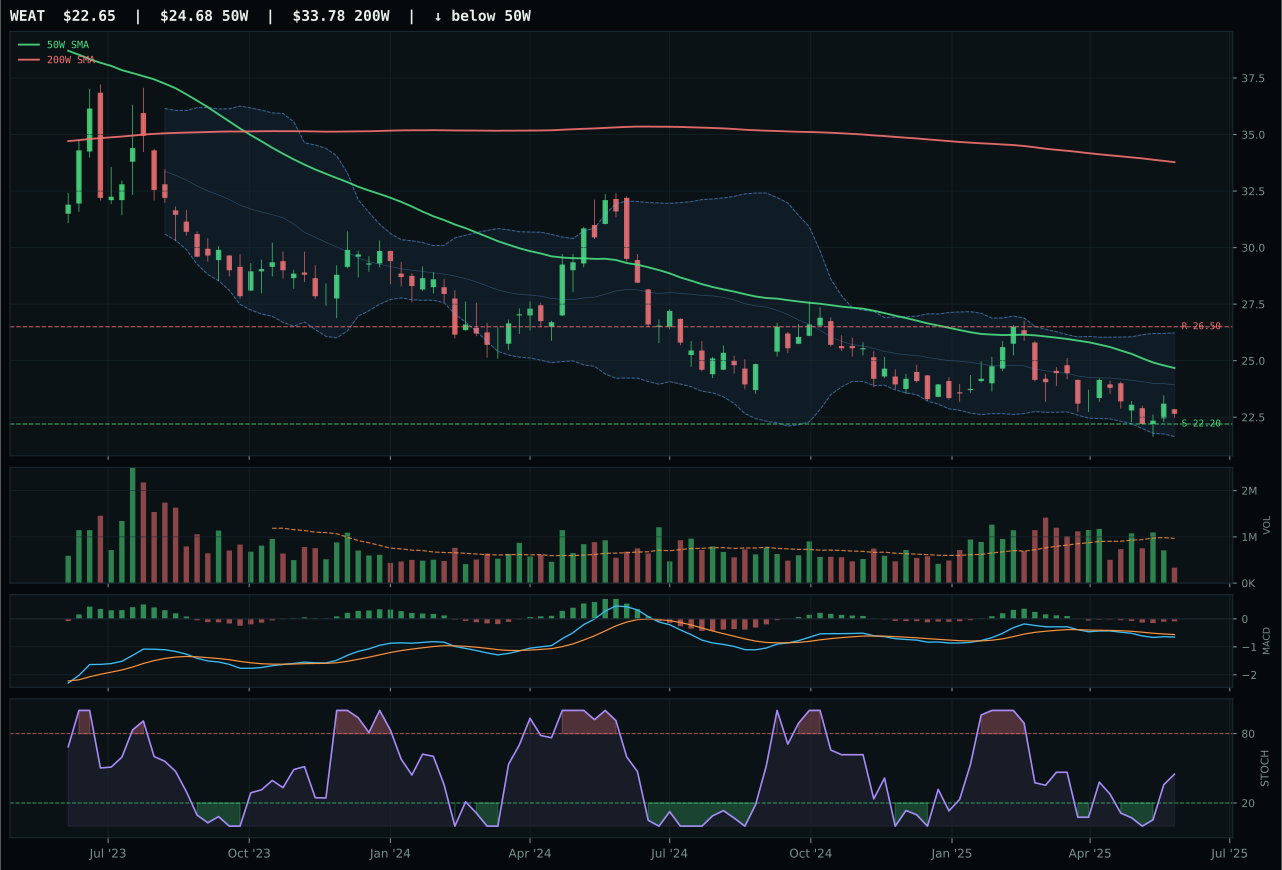
WEAT has a pullback into support profile with -5.4% 13-week relative strength versus SPY.
Extension and support failure are the main tactical risks.
Tracked, but not top-2 eligible because: structurally broken.
MOO wins a weak category by executing better than VEGI despite both sitting in thin-participation, overbought territory. MOO's timing score of 72.0 beats VEGI's 57.0 because it sits closer to the 50W at 3.4% versus VEGI's extended position, and its structure cleanliness of 75.3 exceeds VEGI's 72.4. Both carry the same neutral structure and overbought stochastic RSI rolling over, but MOO's 7.1% relative strength versus SPY and improved support/resistance topology (62.31/72.41) provide marginally better setup quality. The score gap of 13.6 points is deceivingly large given that both ETFs are being penalized heavily by category-level macro headwinds; this is a race between two weak candidates rather than a strong candidate outperforming.
Agriculture & Livestock receives 0% allocation this week, ranked 9th or 10th among categories, because disinflation pressure (-8) and macro fit (32.0/100) are actively hostile to commodity exposure. The category score collapsed to 11.4 precisely because the macro regime punishes anything that depends on inflation or real asset scarcity; even MOO's positive 7.1% relative strength cannot overcome the structural headwind. MOO's technical evidence (61.8/100) is respectable but insufficient to overcome 45.0/100 macro fit. This is direct exclusion, not a near-miss: for agriculture to earn allocation, either disinflation must reverse course, or a sharp deflationary break must create demand for hard assets as monetary hedges. Neither condition is active. The portfolio is correct to ignore this category entirely.
Traditional Energy — XOP
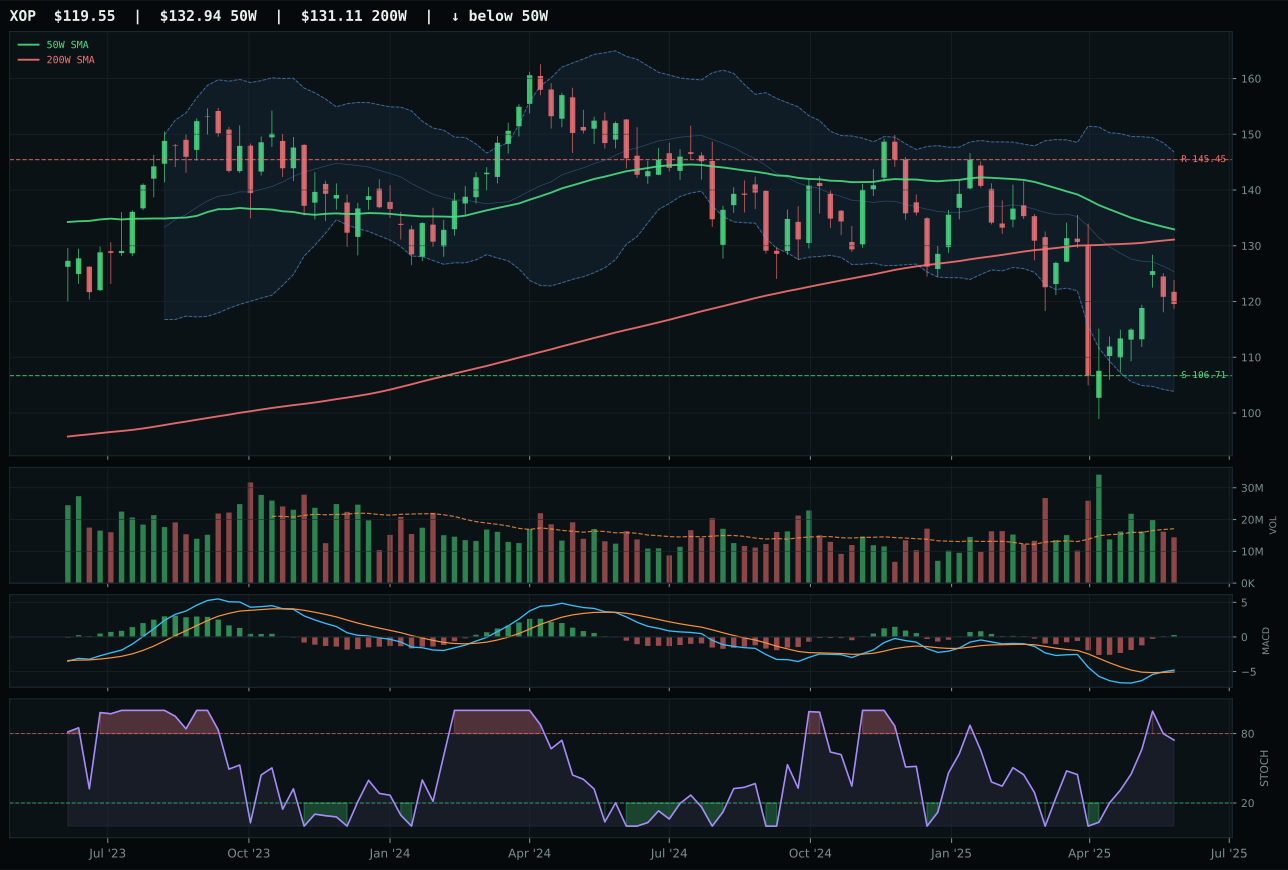
XOP has a neutral structure profile with -7.9% 13-week relative strength versus SPY.
A failed hold above support would weaken the setup.
Actionable but governed by invalidation levels.
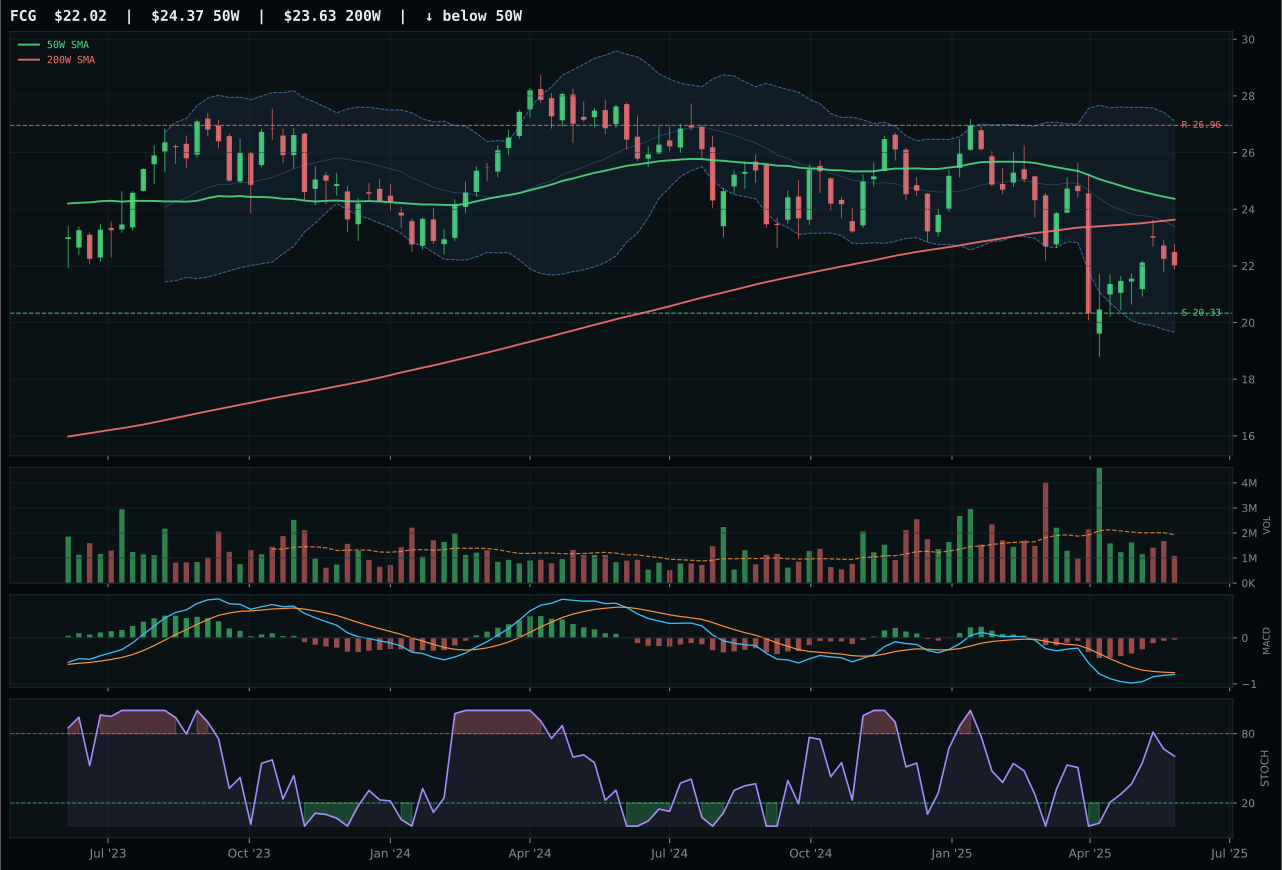
FCG has a neutral structure profile with -8.7% 13-week relative strength versus SPY.
A failed hold above support would weaken the setup.
Actionable but governed by invalidation levels.
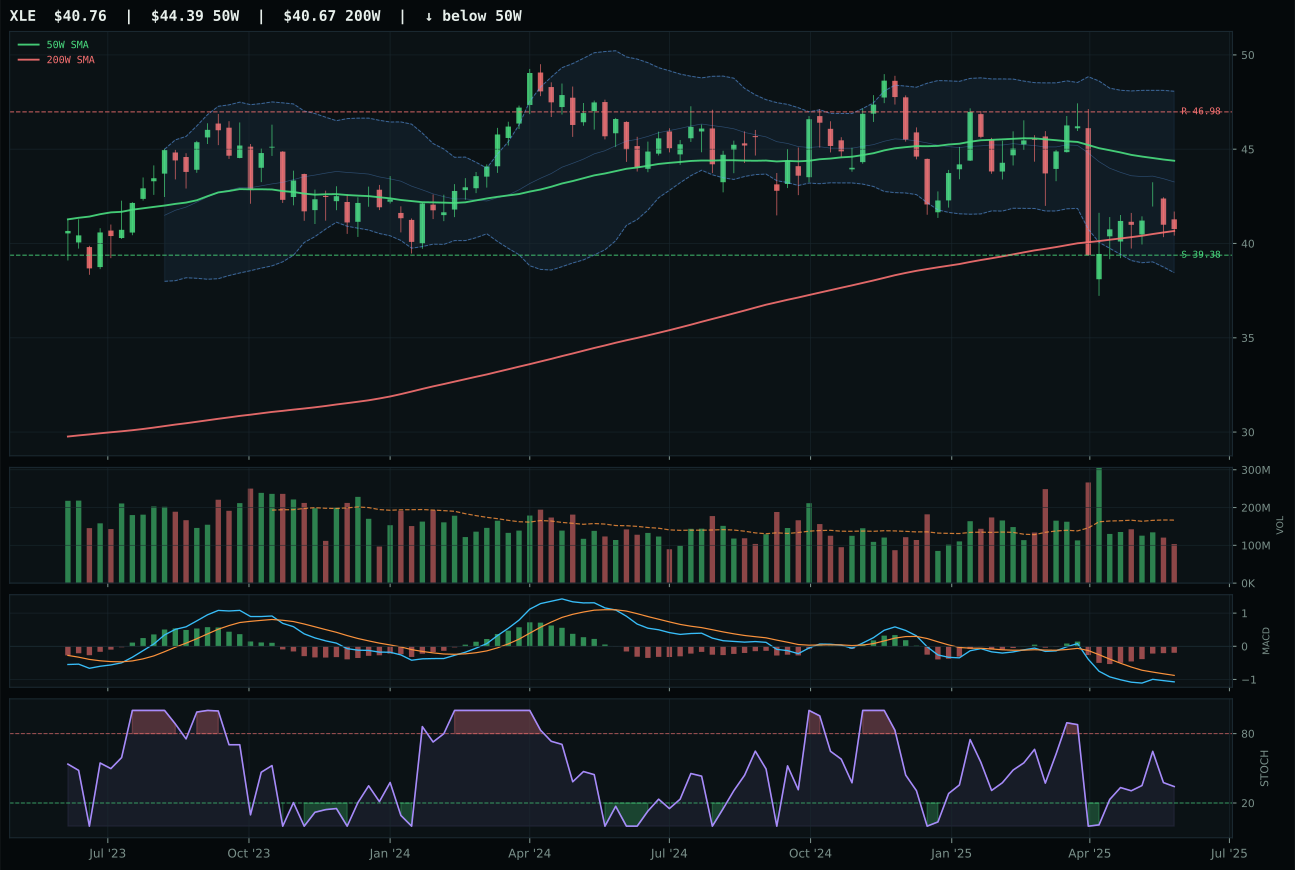
XLE has a pullback into support profile with -9.6% 13-week relative strength versus SPY.
A failed hold above support would weaken the setup.
Actionable but governed by invalidation levels.
XOP wins a deeply distressed category by posting 52.4 technical evidence despite negative 13-week returns of -8.7% and -7.9% relative strength versus SPY. The winner's distinction comes from MACD bullish and improving—even though stochastic RSI is mid-zone, not overbought—and slightly superior structure (72.0 vs 70.6) compared to FCG. Both sit in deep recovery setups below the 50W and 200W, but XOP's category-relative strength of +0.8% versus FCG's 0.0% provides minimal differentiation; this is a category where no ETF is truly leading. FCG's bearish-but-improving MACD and thin participation volumes are technical red flags that rank it below XOP's bullish setup, but the gap is narrow. Neither XOP nor FCG nor XLE demonstrates the combination of structural strength and volume confirmation needed to validate entry—all three are deeply oversold and waiting for fundamental catalysts.
Traditional Energy receives 0% allocation, ranked 9th or 10th, because disinflation at -10 and disinflation pressure at -10 create an actively hostile macro regime. The category macro fit of 23.0/100 is the poorest in the portfolio; XOP's modest 52.4 technical evidence cannot overcome a structural macro headwind this severe. This is not a near-miss or a watch position; energy is explicitly excluded because the current regime penalizes commodity scarcity narratives and high cost-of-capital infrastructure. For traditional energy to earn even a 5% tier-2 allocation, disinflation must reverse, oil demand must show structural strength beyond tactical bounces, and the macro descriptor set must shift away from defensive rotation and toward growth sponsorship. None of these conditions are present. The portfolio's exclusion here is a conviction bet that energy will remain unloved until macro regime confirmation forces a reallocation.