
2025-05-23
Informational purposes only. The content in this report, including allocations, analysis, and commentary, is provided solely for informational and educational purposes. It does not constitute financial advice, investment advice, trading advice, or any other type of advice. Past performance does not guarantee future results. Always conduct your own research and consult a qualified financial professional before making investment decisions.
Weekly Allocation
| Ticker | Category | Weight | Role |
|---|---|---|---|
| FBTC | 50% | Overlay | |
| GLD | Precious Metals | 10% | Top-2 (10%) |
| PAVE | Utilities & Infrastructure | 10% | Top-2 (10%) |
| URA | Nuclear Energy | 5% | Tier-2 (5%) |
| XLK | Technology | 5% | Tier-2 (5%) |
| IEMG | Emerging Markets | 5% | Tier-2 (5%) |
| ITA | Defense & Aerospace | 5% | Tier-2 (5%) |
| SMH | AI | 5% | Tier-2 (5%) |
| COPX | Industrial Metals | 5% | Tier-2 (5%) |
Trade Instructions — Monday Open
Sell the tranche from 2025-04-25 (completing its 4-week hold). Buy the new tranche. Instructions show net portfolio changes — same-asset positions cancel, weight changes show the delta.
| Action | Ticker | Instruction |
|---|---|---|
| SELL | IGF | Sell entire IGF position (2.50% of portfolio) |
| SELL | ILF | Sell 25% of ILF position (reduce 5.00% → 3.75%) |
| SELL | IGV | Sell 33% of IGV position (reduce 3.75% → 2.50%) |
| SELL | XAR | Sell 33% of XAR position (reduce 3.75% → 2.50%) |
| SELL | MOO | Sell entire MOO position (1.25% of portfolio) |
| SELL | AIQ | Sell 50% of AIQ position (reduce 2.50% → 1.25%) |
| BUY | PAVE | Buy PAVE — 28.57% of freed cash (adds 2.50% to portfolio) |
| BUY | SMH | Buy SMH — 14.29% of freed cash (adds 1.25% to portfolio) |
| BUY | COPX | Buy COPX — 14.29% of freed cash (adds 1.25% to portfolio) |
| BUY | ITA | Buy ITA — 14.29% of freed cash (adds 1.25% to portfolio) |
| BUY | XLK | Buy XLK — 14.29% of freed cash (adds 1.25% to portfolio) |
| BUY | IEMG | Buy IEMG — 14.29% of freed cash (adds 1.25% to portfolio) |
Current Portfolio After Trade
Combined holdings across all 4 active tranches. Each tranche is 25% of the portfolio.
| Ticker | % of Portfolio | Weight Bar |
|---|---|---|
| FBTC | 50.00% | |
| GLD | 10.00% | |
| PAVE | 7.50% | |
| COPX | 5.00% | |
| ILF | 3.75% | |
| URA | 3.75% | |
| SMH | 3.75% | |
| IGV | 2.50% | |
| XAR | 2.50% | |
| XLU | 2.50% | |
| ITA | 2.50% | |
| XLK | 2.50% | |
| AIQ | 1.25% | |
| URNM | 1.25% | |
| IEMG | 1.25% |
Macro Regime — Disinflation
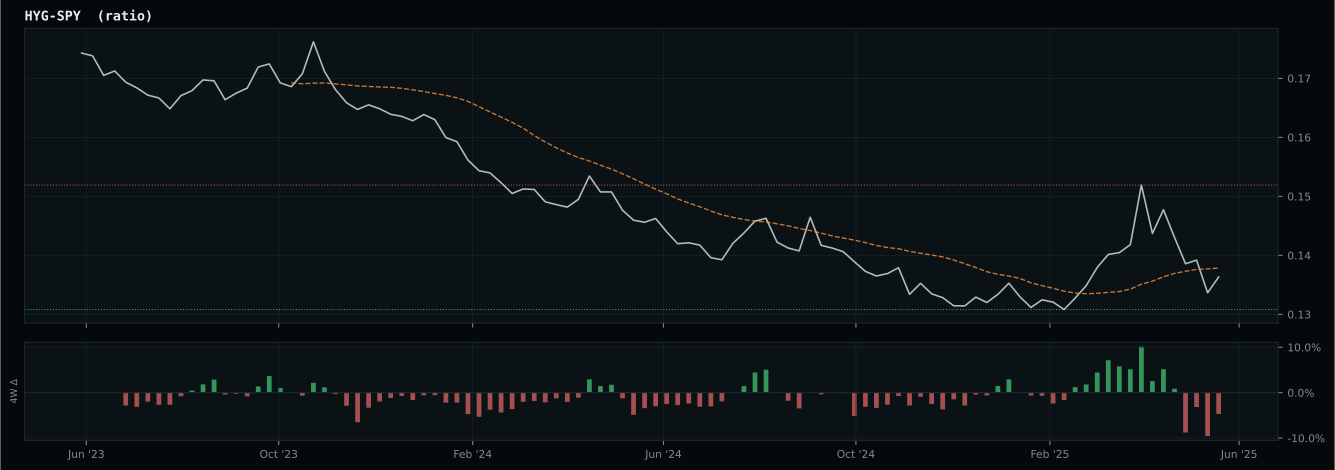
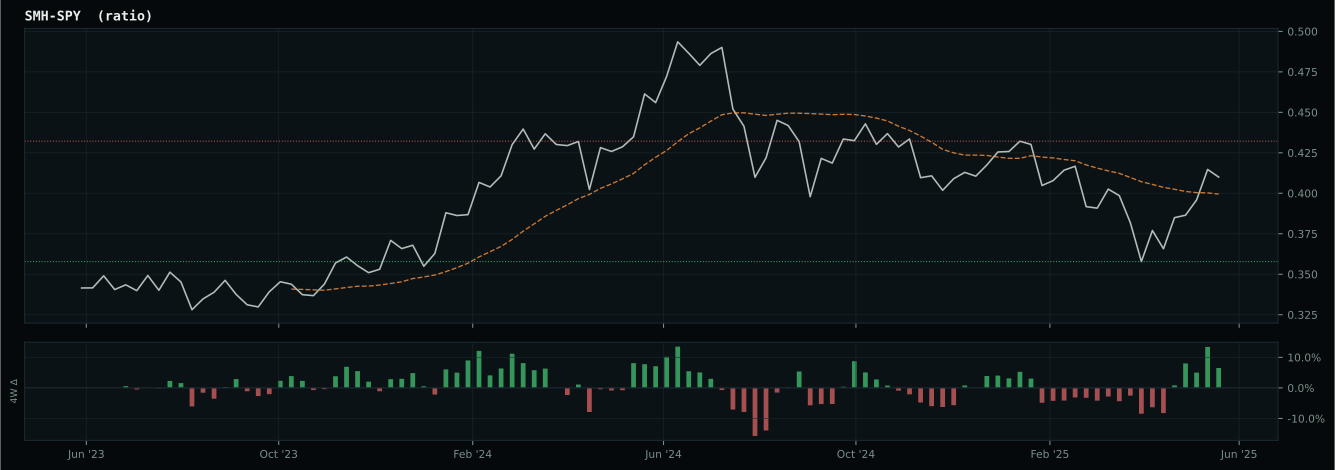
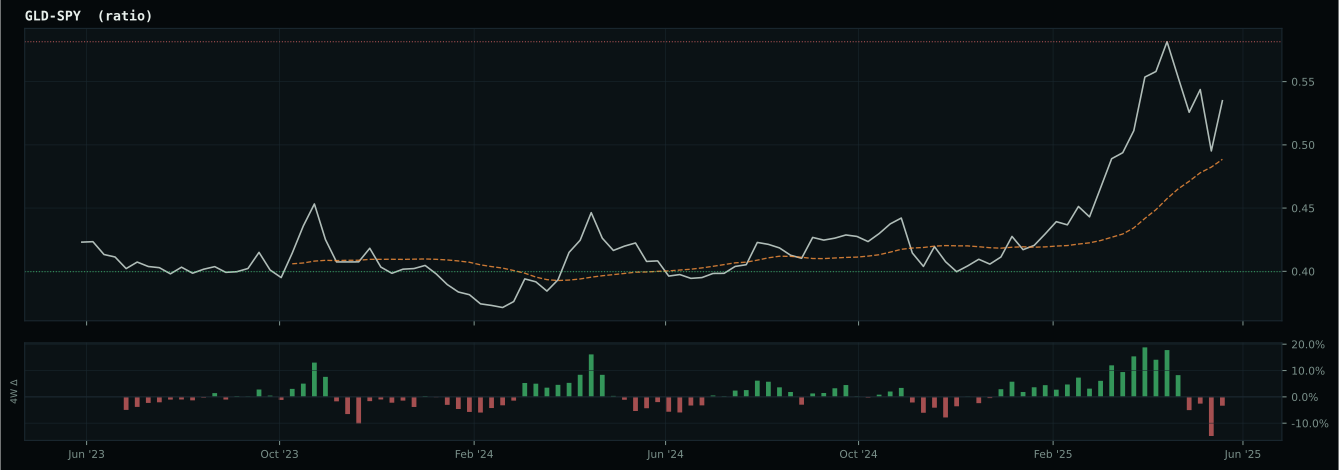
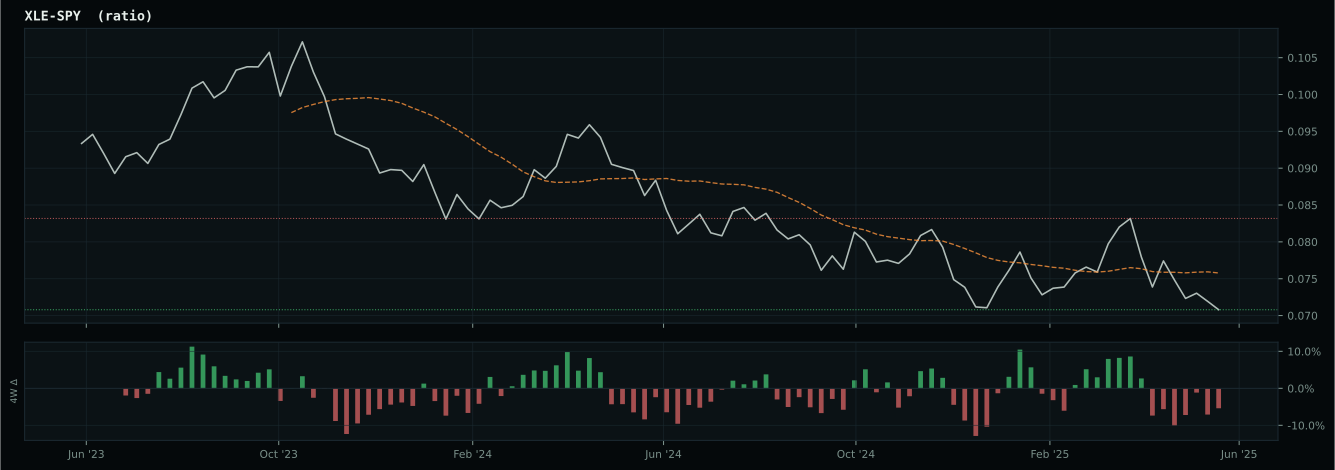
growth data is not confirming the weak market-implied risk appetite signal
Macro Evidence Charts
Market-implied signals behind the macro regime scores. Each ratio compares two assets; the direction and slope of the ratio is what the macro engine reads.
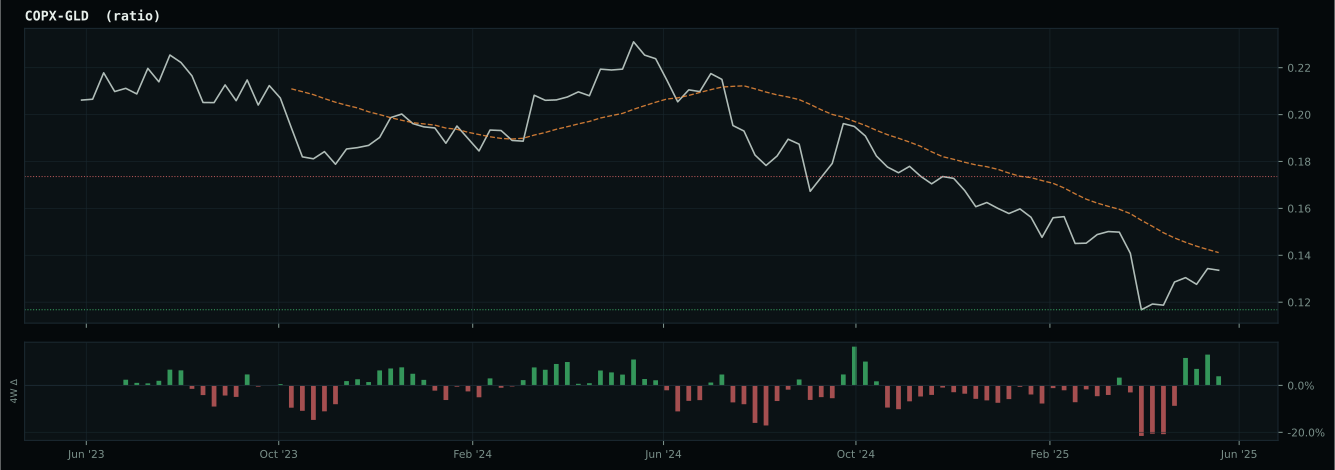
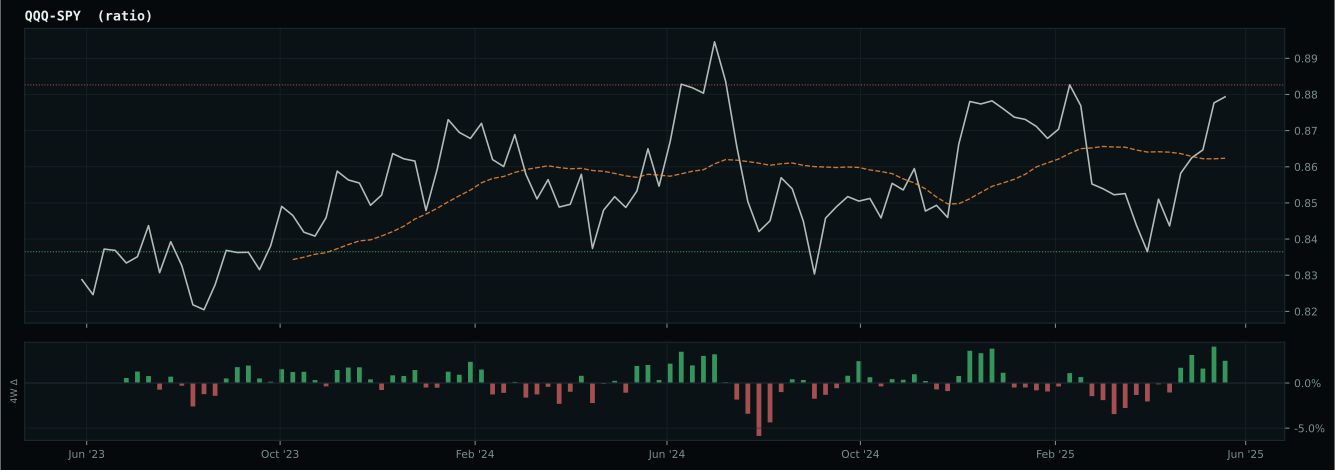
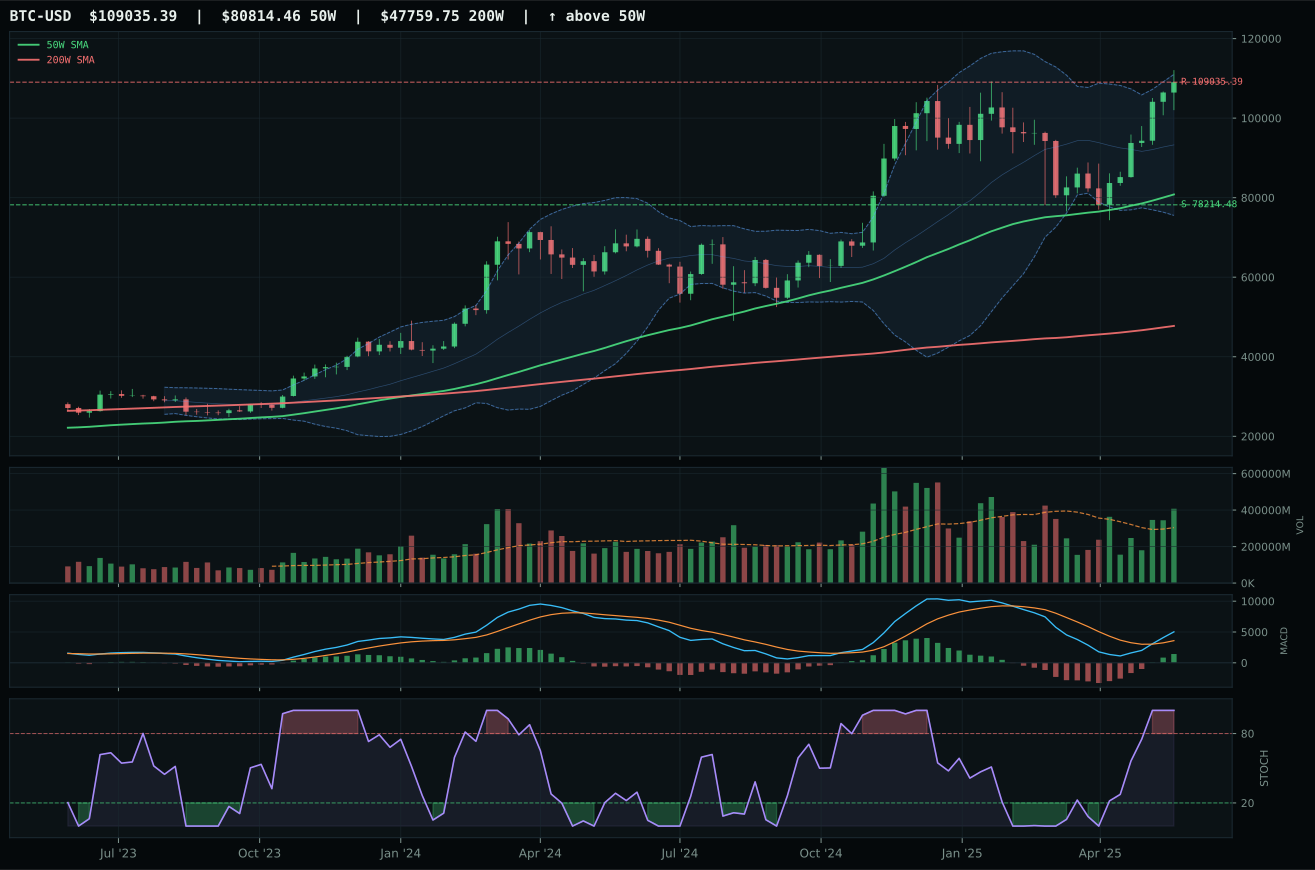
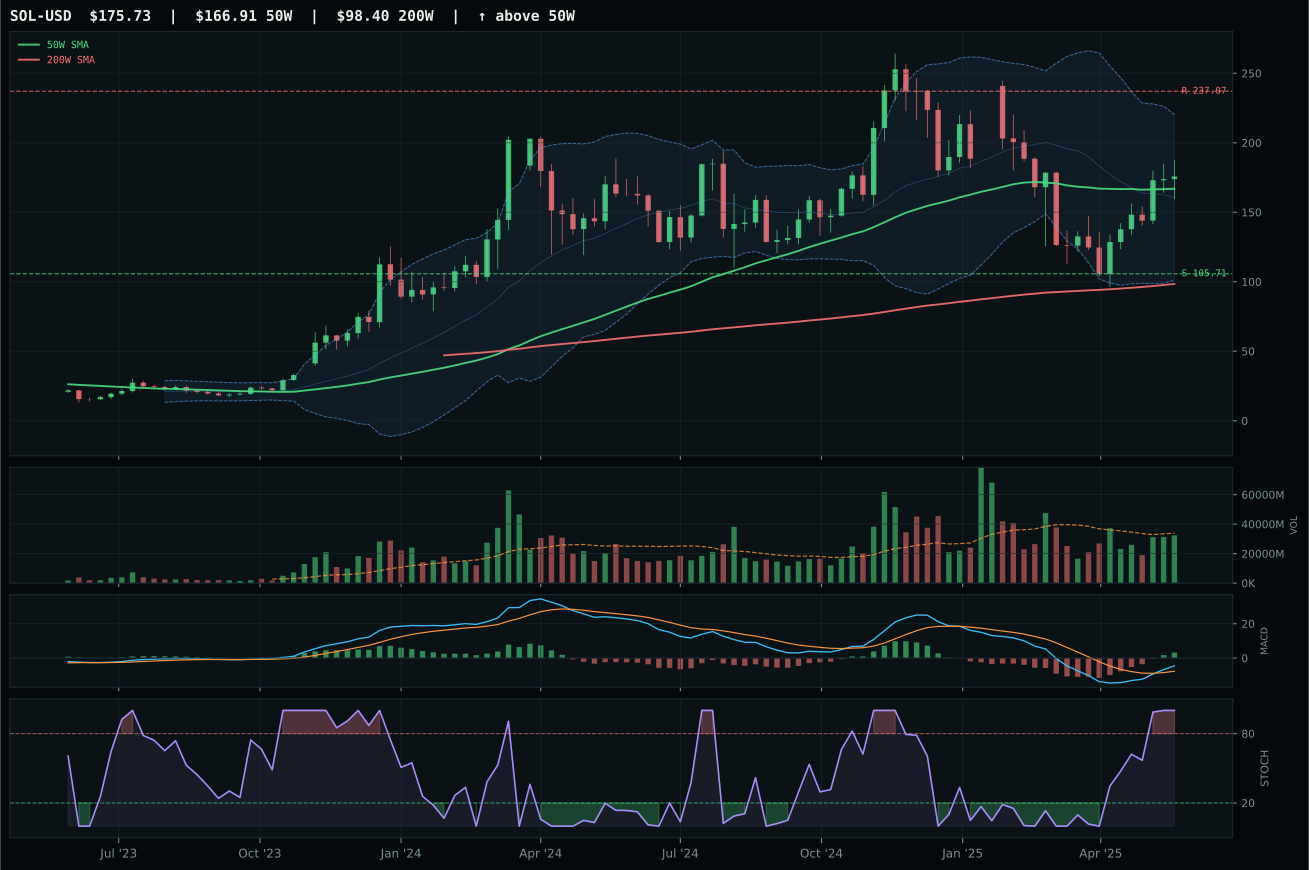
Crypto Regime — TrendBTC
ValueBTC not armed: BTC has not made the first post-breakdown touch of the 200W buy zone after losing the 50W
TrendBTC confirmed: 2 consecutive closes above rising/flat 50W SMA
one or more available conditions failed
Category Rankings
| Rank | Category | Winner | Score | Alloc | 4W Ret | Peers (4W) |
|---|---|---|---|---|---|---|
| 1 | Precious Metals | GLD | 80.8 | 20% | +2.15% | GDX +6.3% · SLV +9.2% |
| 2 | Utilities & Infrastructure | PAVE | 71.3 | 20% | +0.62% | IGF -2.5% · XLU -1.3% |
| 3 | Nuclear Energy | URA | 65.2 | 10% | +12.80% | NLR +8.8% · URNM +8.4% |
| 4 | Technology | XLK | 62.9 | 10% | +4.36% | CIBR +0.0% · IGV +1.6% |
| 5 | Emerging Markets | IEMG | 61.3 | 10% | +0.37% | ILF -2.9% · INDA -1.4% |
| 6 | Defense & Aerospace | ITA | 57.3 | 10% | +3.97% | XAR +5.0% · ROKT +5.1% |
| 7 | AI | SMH | 48.4 | 10% | +7.16% | AIQ +2.4% · BOTZ -2.6% |
| 8 | Industrial Metals | COPX | 15.2 | 10% | +0.34% | PICK -4.2% · REMX +3.2% |
| 9 | Agriculture & Livestock | MOO | 11.0 | 0% | +1.62% | VEGI +1.1% · WEAT +3.9% |
| 10 | Traditional Energy | XLE | 10.5 | 0% | +8.25% | XOP +11.2% · FCG +11.9% |
Precious Metals — GLD
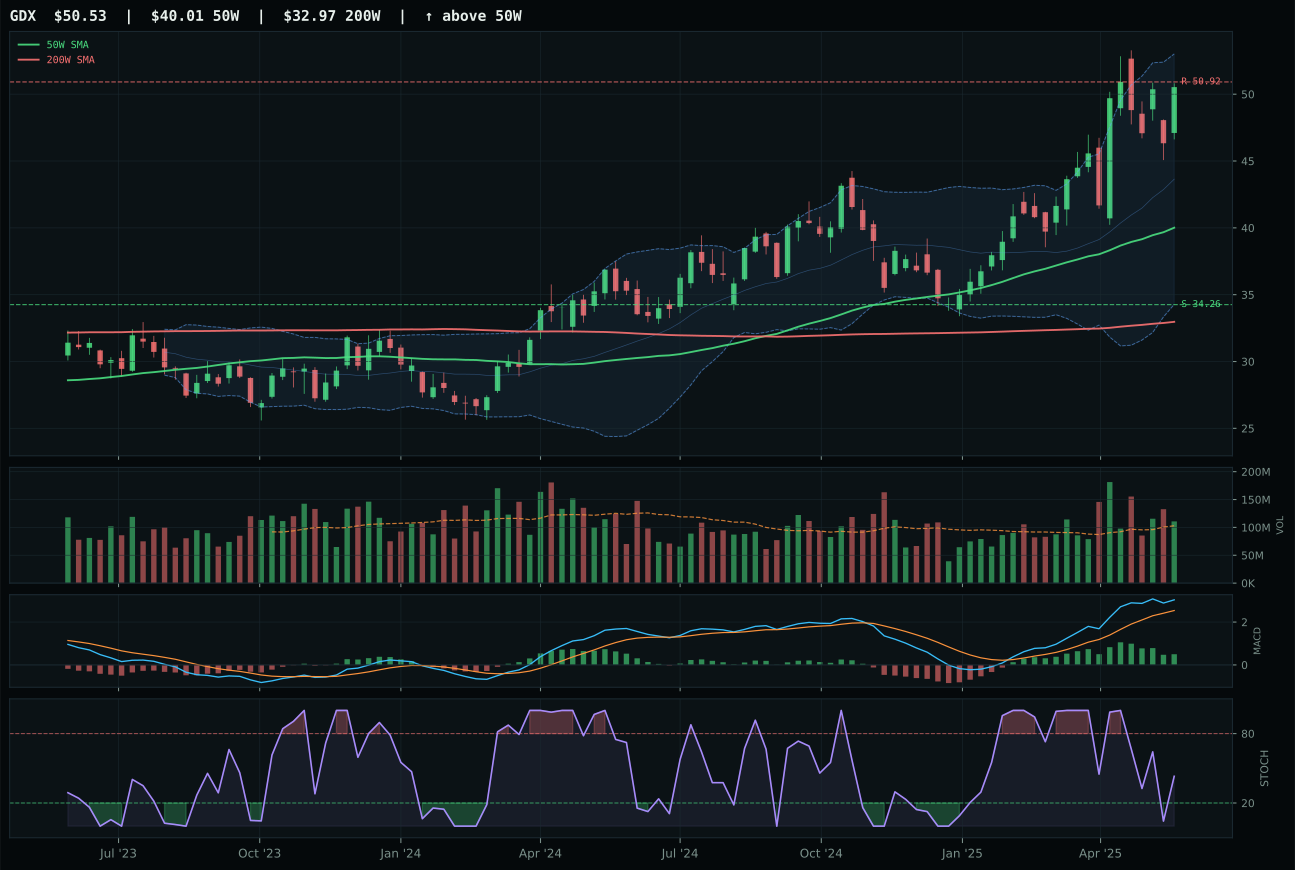
GDX has a vertical extension profile with 27.3% 13-week relative strength versus SPY.
A failed hold above support would weaken the setup.
Actionable but governed by invalidation levels.
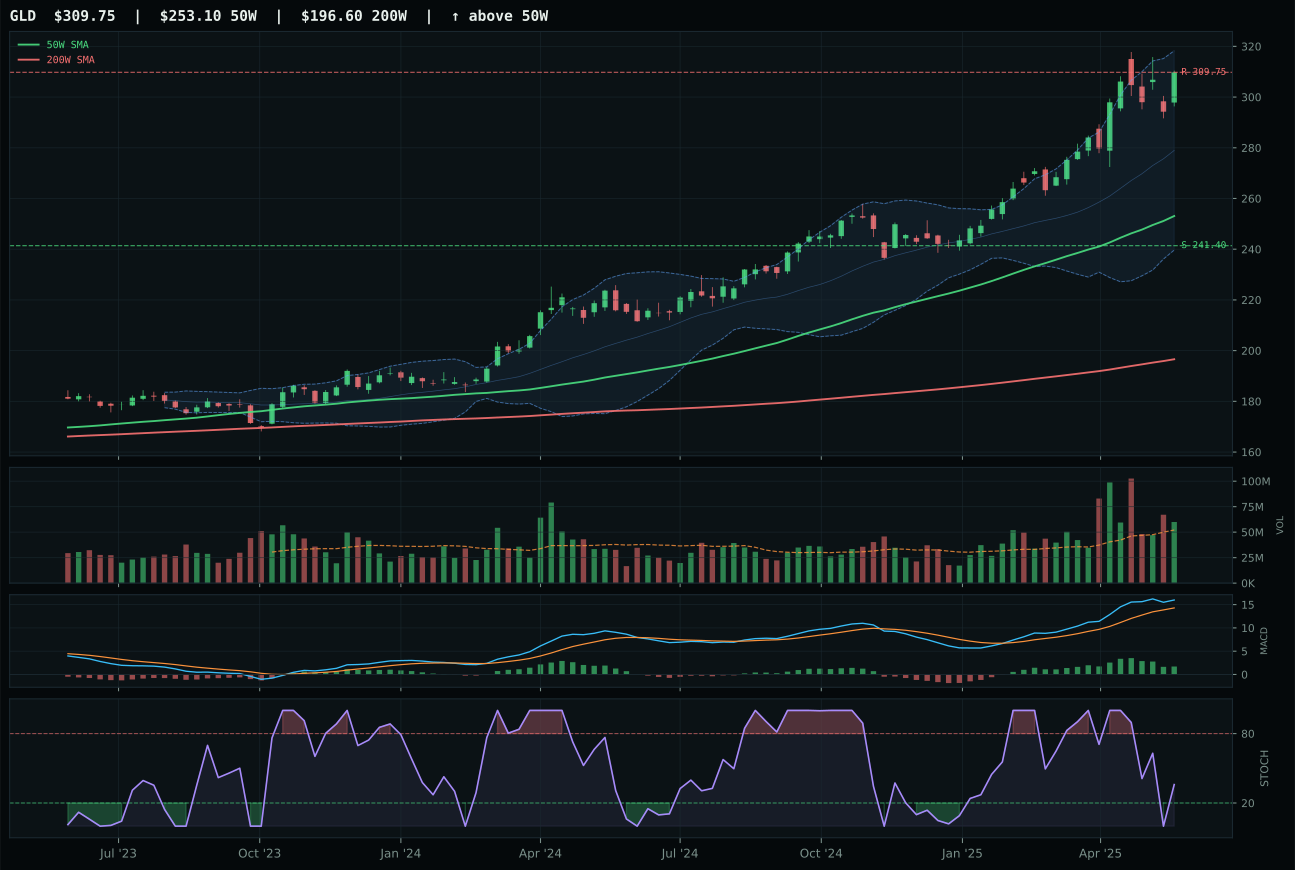
GLD has a vertical extension profile with 17.9% 13-week relative strength versus SPY.
A failed hold above support would weaken the setup.
Actionable but governed by invalidation levels.
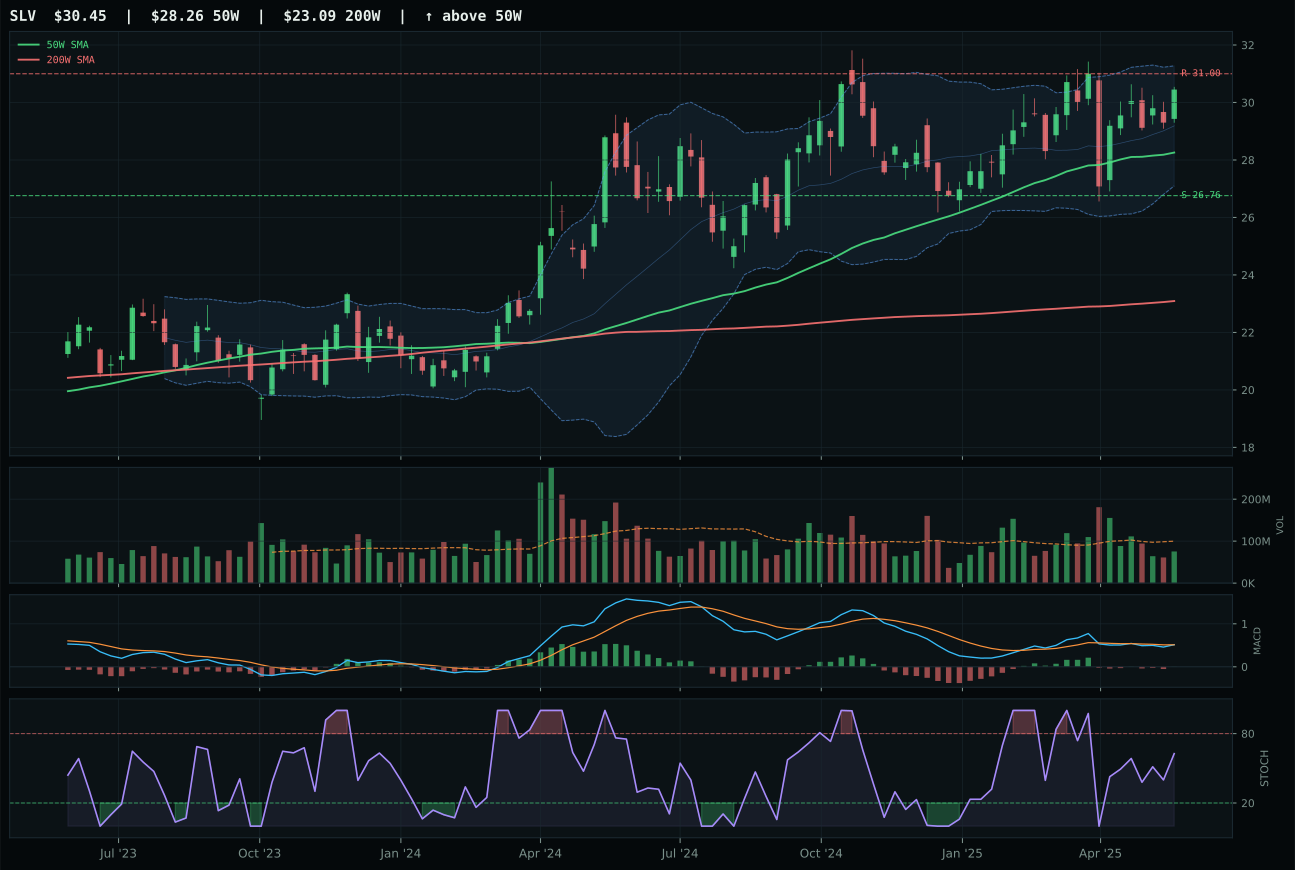
SLV has a neutral structure profile with 6.4% 13-week relative strength versus SPY.
A failed hold above support would weaken the setup.
Actionable but governed by invalidation levels.
GLD wins the Precious Metals category and earns top-2 status with a 71 composite score against GDX's 64, commanding authority despite both charts showing vertical extension near 52W highs. GLD's superiority lies in clean volume sponsorship (above-average participation at 1.15x vs. GDX's neutral), superior risk/reward (42.1 vs. 30.3 because GDX is more stretched and offers less downside protection), and a structure score of 79.2 vs. 72.2. Both have trend 100.0 and identical 13W momentum (+14.4% for GLD, +23.8% for GDX), but GLD's 17.9% SPY relative strength versus GDX's 27.3% tells the real story: GLD is institutional gold (the monetary hedge), while GDX is leveraged miner spec. MACD is bullish but flattening in both (timing 40.0), and stochastic RSI is rising mid-zone for GDX but falling/neutral for GLD at 0.36—a divergence that suggests GLD has more consolidation ahead while GDX may have already topped. Category-relative strength of 0.0% for GLD versus 9.4% for GDX means this is a category leadership play anchored by the cleaner vehicle.
Precious Metals earns 10% allocation as the second top-2 overweight, justified by a 80.8 category score and a stellar 85.0/100 macro fit—the highest in the portfolio. Monetary hedge bid is active (+14), disinflation helps (+8), defensive rotation (+7), and disinflation pressure (+6) combine to create a 35-point tailwind even before liquidity stress subtracts any points. GLD's trend is perfect (100.0), momentum confirmation is maxed (100.0), and volume-price confirmation reaches 73.6/100, proving institutional accumulation at scale (1.15x average volume). The category's 85.0 macro fit reflects a regime where real rates are under pressure, defensive flows are accelerating, and dollar weakness is expected—all supportive of gold as the clean monetary proxy. The primary risk is timing: GLD sits 22.4% above the 50W near resistance at 292.59 (upside only 0.0%), and Fib location is near 52W high / extension. However, the portfolio's macro conviction in disinflation and monetary easing is strong enough to justify paying entry premium here. Precious Metals is locked into a top-2 slot until either disinflation expectations reverse sharply or risk appetite returns with conviction.
Utilities & Infrastructure — PAVE
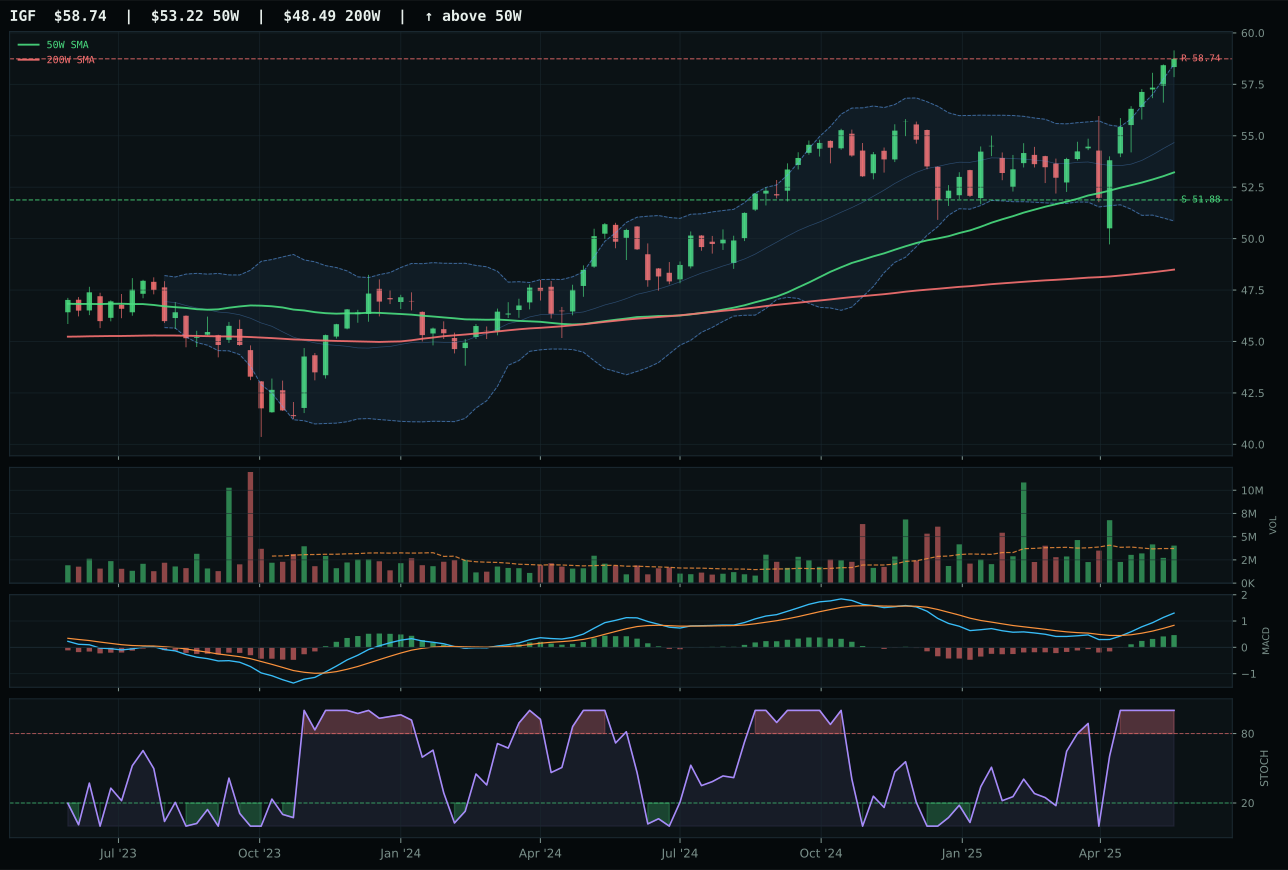
IGF has a neutral structure profile with 13.0% 13-week relative strength versus SPY.
A failed hold above support would weaken the setup.
Actionable but governed by invalidation levels.
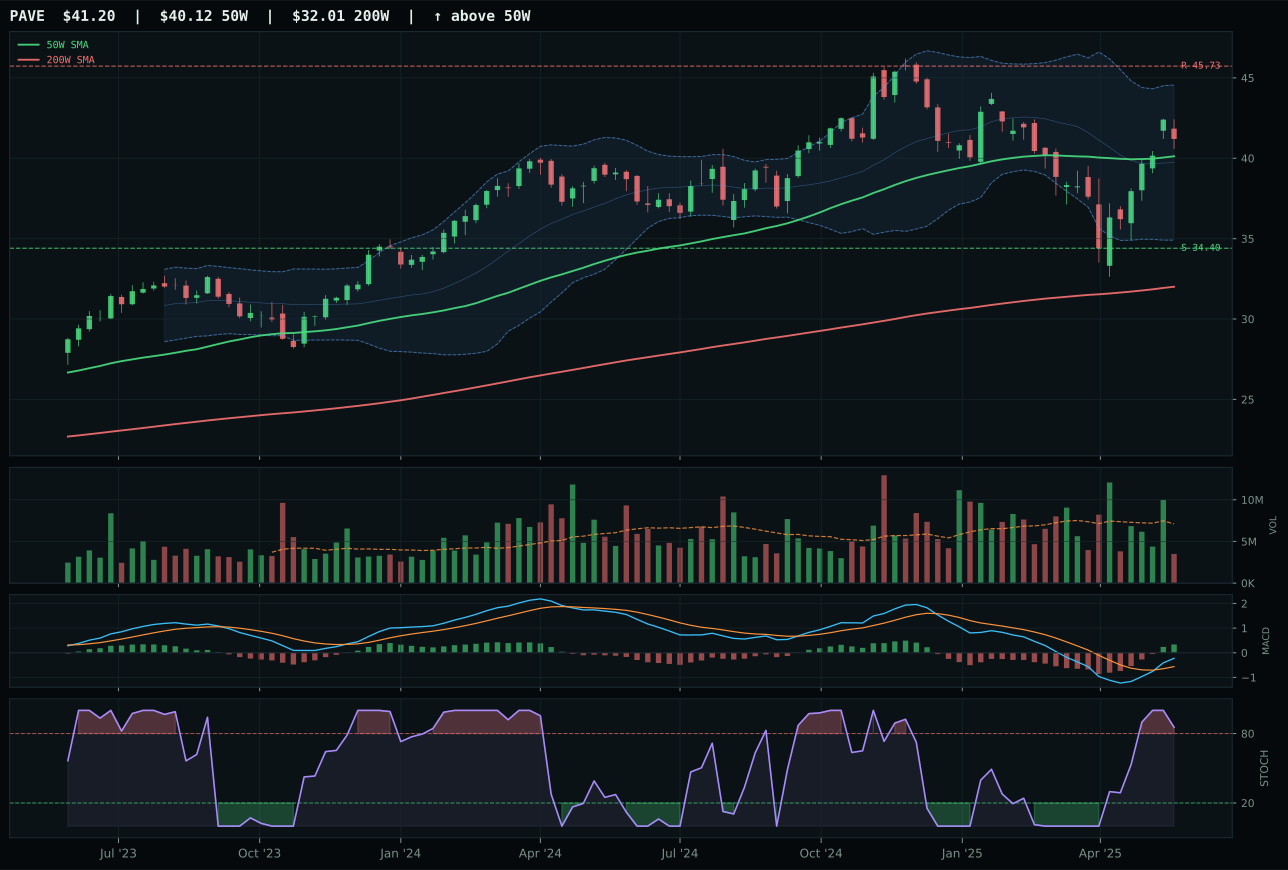
PAVE has a compression near 50W profile with 5.3% 13-week relative strength versus SPY.
A failed hold above support would weaken the setup.
Actionable but governed by invalidation levels.
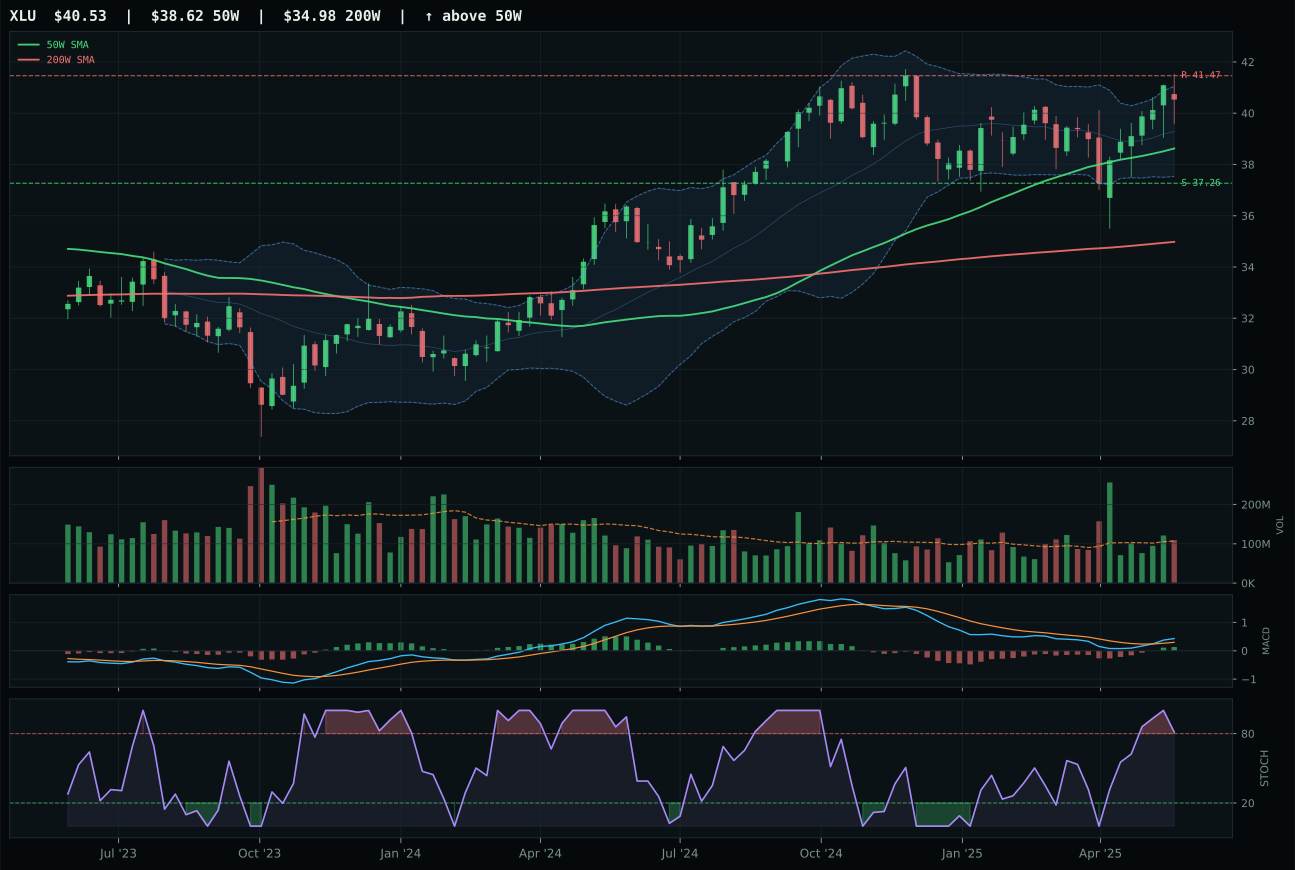
XLU has a neutral structure profile with 4.5% 13-week relative strength versus SPY.
A failed hold above support would weaken the setup.
Actionable but governed by invalidation levels.
PAVE wins Utilities & Infrastructure with an 85 composite score, earning top-2 status despite a tight race against IGF (84 composite). PAVE's edge is pure timing precision: it sits just 2.7% above the 50W in compression near the moving average, allowing for clean expansion potential if support at 34.40 holds. IGF is stretched 10.4% above the 50W (neutral structure, near 52W high), forcing it into a weaker timing window (59.0 vs. 82.0) despite superior trend sponsorship (IGF shows 100.0 trend vs. PAVE's 100.0 as well, but IGF's risk/reward suffers from extension). PAVE's risk/reward is 54.0 versus IGF's 47.9, reflecting the entry advantage. Both have MACD bullish and improving, but PAVE's stochastic RSI is overbought rolling over (85.0, suggesting saturation near-term but room to rest) while IGF's stochastic is overbought momentum (signaling run-up fatigue). Volume is a concern for PAVE (thin at 0.49x) versus IGF's neutral participation, but category-relative strength favors PAVE at 0.0% (leader by default in a compressed peer set). PAVE's 1.9% 13W return is modest, but 4W return 8.6% confirms recent accumulation and fresh sponsorship.
Utilities & Infrastructure earns 10% allocation as the first top-2 overweight, justified by a 71.3 category score and an excellent 76.0/100 macro fit. Disinflation helps (+7), defensive rotation active (+12), and disinflation pressure (+6) create a powerful 25-point macro tailwind that competes directly with Precious Metals' 85.0 macro fit. Transition/Mixed regime adds +4, and liquidity stress subtracts only -3, making this category's macro profile one of the cleanest in the portfolio. PAVE's technical evidence is modest (57.7/100), but the category-level technical basket (73.1/100 starting point from 3/2/1 weighting) is solid, and IGF's strong technical proof (88.4/100) carries significant weight in the 3/2/1 calculation. The defensive rotation descriptor is especially relevant here: risk appetite is broken, disinflation is active, and utilities offer steady dividend plus capex-driven infrastructure upside (PAVE) or global income stability (IGF). PAVE's compression near the 50W with volume-price confirmation 55.1/100 and persistence 61.6/100 creates an asymmetric risk setup: downside to support is only 19.8% while upside to resistance spans -9.9%, but the thin volume (0.49x) is offset by category-level institutional conviction. Utilities & Infrastructure is locked into top-2 status until either risk appetite sharply reverses or defensive rotation momentum breaks.
Nuclear Energy — URA
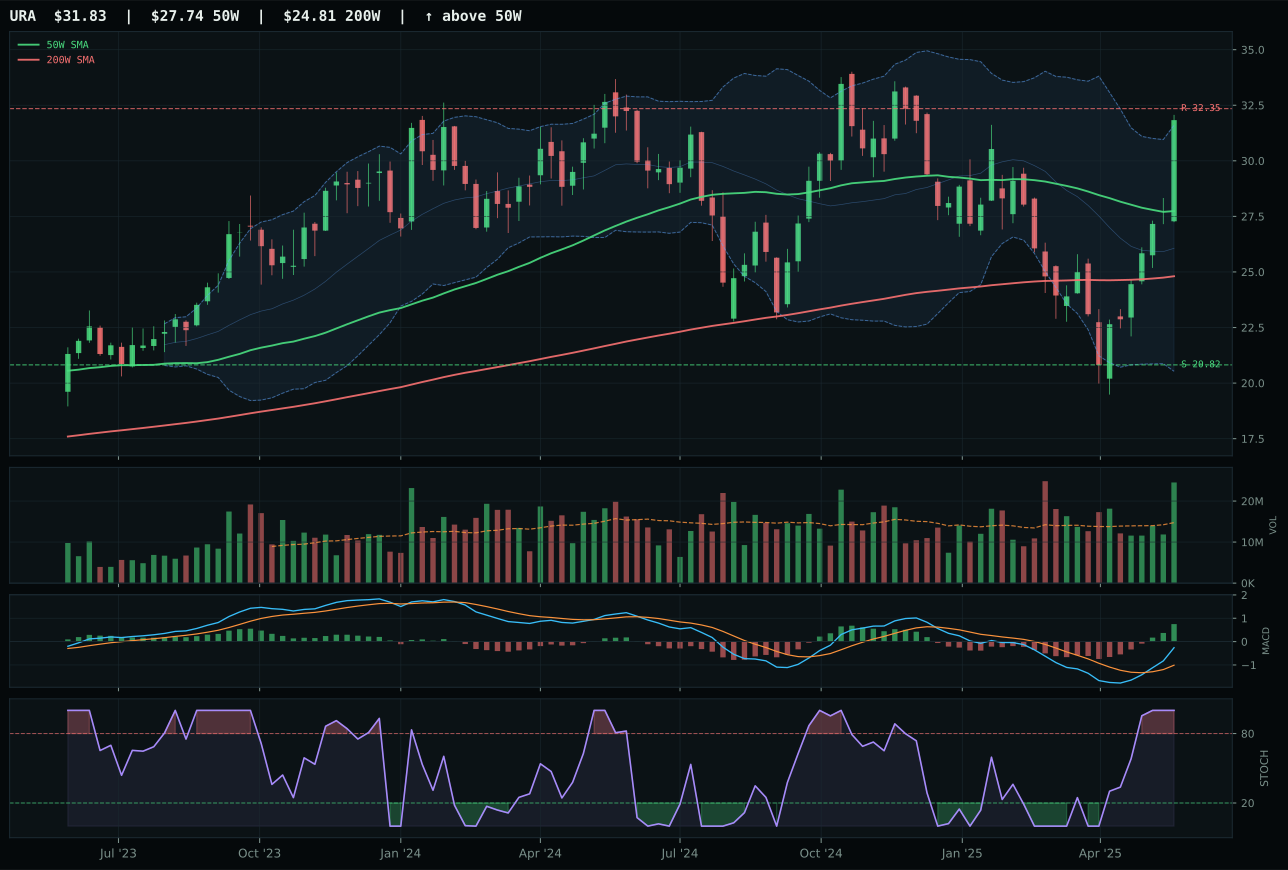
URA has a neutral structure profile with 25.6% 13-week relative strength versus SPY.
A failed hold above support would weaken the setup.
Actionable but governed by invalidation levels.
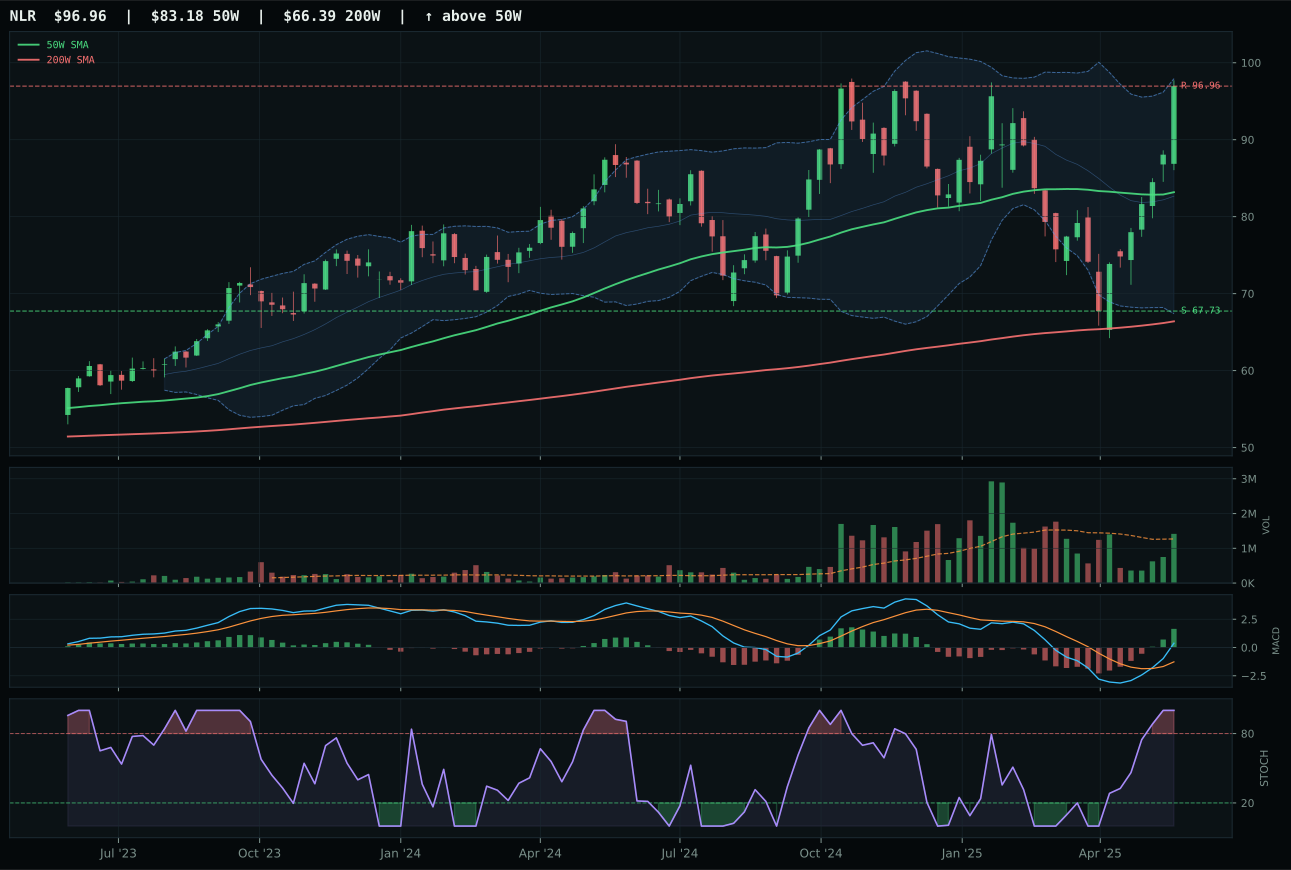
NLR has a vertical extension profile with 19.3% 13-week relative strength versus SPY.
A failed hold above support would weaken the setup.
Actionable but governed by invalidation levels.
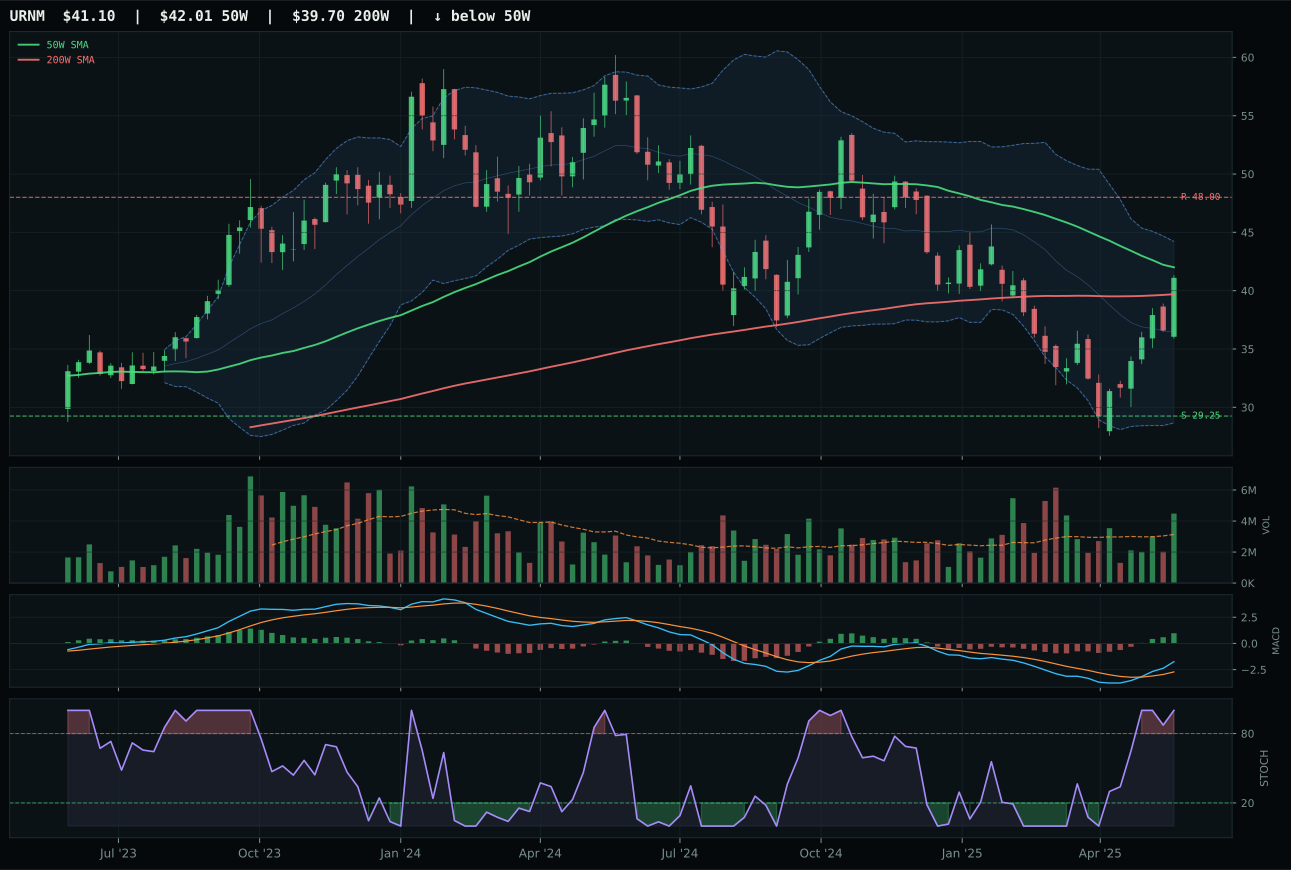
URNM has a compression near 50W profile with 16.7% 13-week relative strength versus SPY.
A failed hold above support would weaken the setup.
Actionable but governed by invalidation levels.
URA wins Nuclear Energy decisively with an 85 composite score against NLR's 72, a 13-point gap driven by superior technical sponsorship and timing precision. URA sits 14.7% above the 50W (vs. NLR's near-extension), but the difference is volume: URA carries accumulation/confirmation at 1.66x the 20W average, the highest volume participation in the entire portfolio, signaling institutional conviction that extends beyond momentum speculation. URA's timing score is 67.0 (middle retracement / decision zone, Fib 0.236) but volume-price confirmation reaches 98.6/100 and persistence 94.5/100—the highest in any category this week, proving this is not a breakout chase but a staged accumulation. NLR sits in the vertical extension zone at 15.9% above the 50W (timing 37.0), with above-average participation (1.x range) but inferior structure cleanliness (78.9 vs. 79.2). Both have trend 100.0 and momentum 100.0, but URA's 25.6% SPY relative strength (vs. NLR's 19.3%) plus 22.1% 13W return (vs. 15.9%) and category-relative strength +6.3% (vs. 0.0%) create clear leadership. URA's setup is neutral structure, meaning buyers are sustaining the move, not chasing it.
Nuclear Energy receives 5% allocation as tier-2, despite URA's exceptional technical proof (100.0/100 technical evidence) and volume sponsorship, because the category's 65.2 score and 39.0/100 macro fit rank below the portfolio's top two. Liquidity stress is active (-7) and risk appetite broken (-4), creating macro headwinds that offset URA's perfect trend and volume confirmation. The category's macro profile is neutral-to-mixed: no category-specific descriptor profile is available, meaning the macro fit depends entirely on broad regime factors rather than sector-specific tailwinds like Precious Metals' monetary hedge bid or Utilities' defensive rotation. However, URA's technical excellence (85 composite, 100.0 trend, 100.0 momentum, 98.6 volume-price confirmation) merits a firm 5% position despite the macro rank. The volume participation at 1.66x is exceptional and suggests smart money is accumulating nuclear as a clean energy proxy during disinflation, hedging against a future energy security scenario. For Nuclear to earn a 10% tier-2 or top-2 slot, it would need either a macro pivot toward energy independence narratives or continued volume accumulation at these levels—both plausible but not yet confirmed.
Technology — XLK
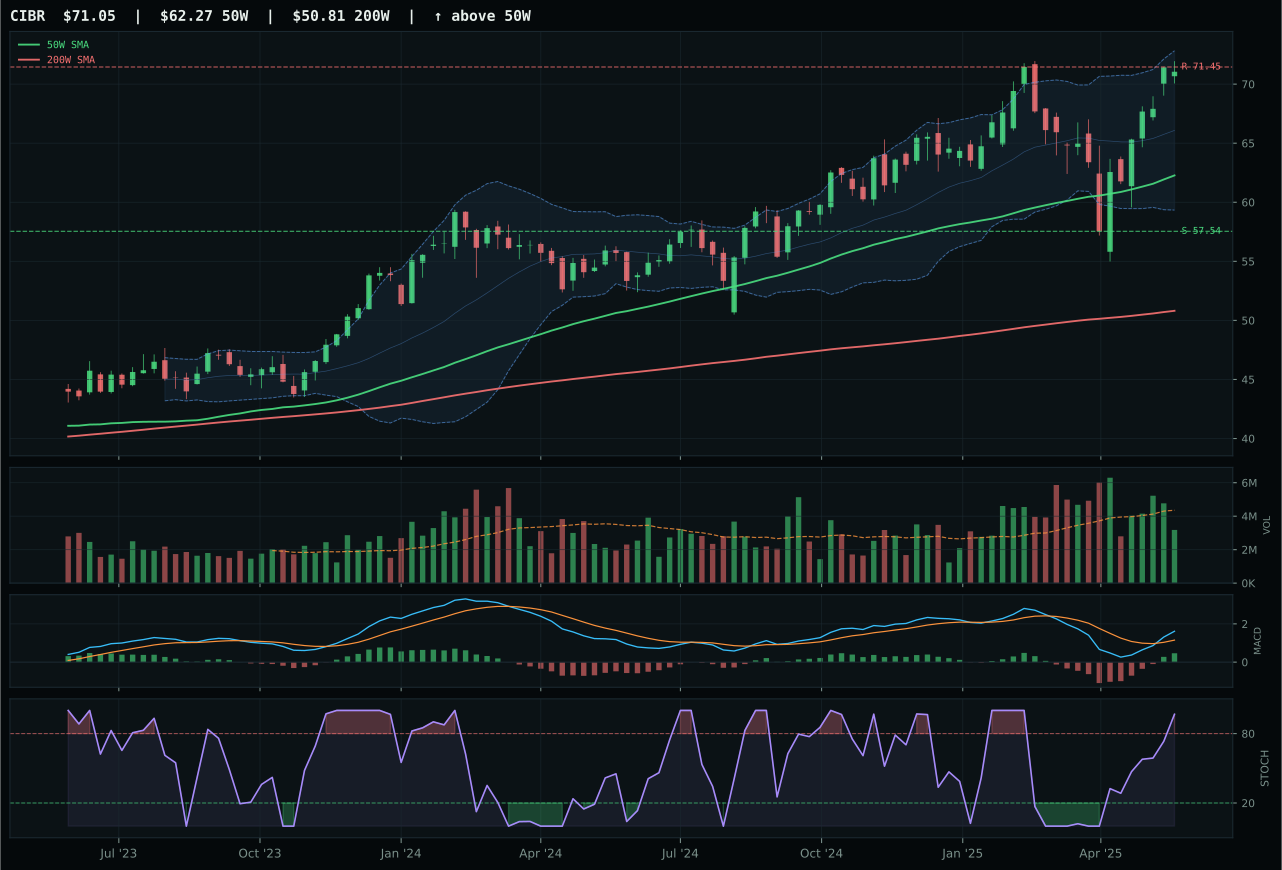
CIBR has a neutral structure profile with 8.4% 13-week relative strength versus SPY.
A failed hold above support would weaken the setup.
Actionable but governed by invalidation levels.
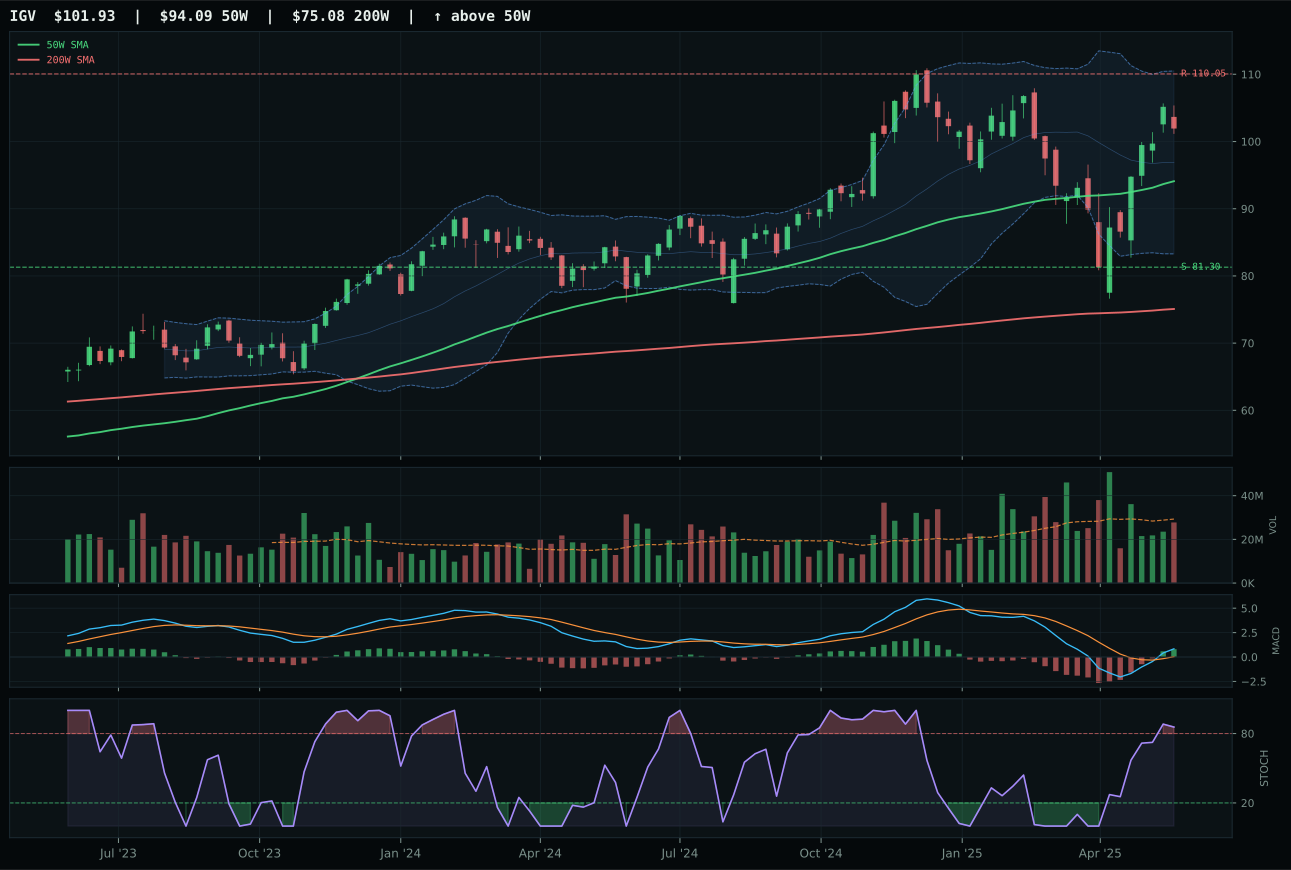
IGV has a neutral structure profile with 4.9% 13-week relative strength versus SPY.
A failed hold above support would weaken the setup.
Actionable but governed by invalidation levels.
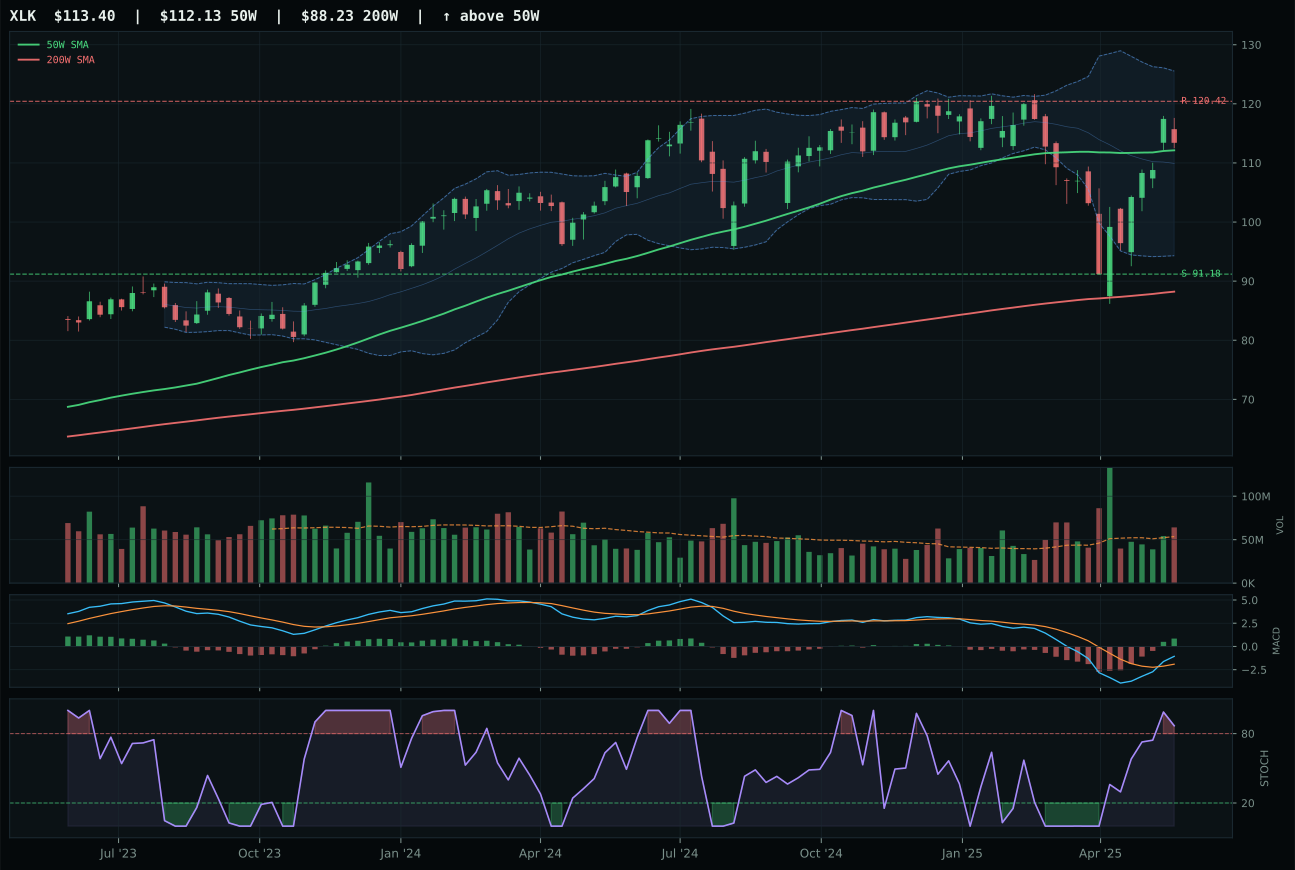
XLK has a compression near 50W profile with 0.0% 13-week relative strength versus SPY.
A failed hold above support would weaken the setup.
Actionable but governed by invalidation levels.
XLK wins the category with a composite score of 85, beating CIBR's 79 because it sits just 1.3% above the 50-week moving average with above-average volume participation at 1.20x the 20-week average—a setup that signals accumulation rather than late-stage extension. CIBR is stretched 14.1% above its 50W, forcing it to sacrifice timing (59.0 vs. 100.0) and risk/reward (37.4 vs. 49.3) while carrying thin volume that fails to confirm conviction. XLK's compression near the 50W with MACD bullish and improving and stochastic RSI overbought creates the rare window where both trend and timing are premium: price is up 8.8% in four weeks but only -3.4% over 13 weeks, meaning the recent strength is genuine without the dead weight of extended momentum. The category-relative strength of -4.9% signals this is a reset inside Tech, not a leadership continuation, which actually improves risk asymmetry for fresh entry.
Technology receives 5% allocation in the tier-2 rank, outside the top-2 overweight despite a 62.9 category score that sits comfortably above the sector median. The disinflation macro regime adds 7 points to the category's fit but liquidity stress subtracts 10, creating a net headwind that prevents Technology from earning one of the premium 10% slots held by Precious Metals and Utilities. The category's 52.0/100 macro fit reflects its vulnerability in a risk-appetite-broken environment: even though profitable tech leadership (XLK's 100.0 trend score) shows structural resilience, the combination of thin volume confirmation (67.2/100 on volume-price) and weak momentum persistence (57.2/100) suggests this is a trade rather than a conviction position. Two higher-ranked categories seized the top slots this week; Technology would need to see either a return of equity risk appetite or a sharper move in the 50W slope upward to justify displacing Precious Metals' monetary hedge bid or Utilities' defensive rotation premium.
Emerging Markets — IEMG
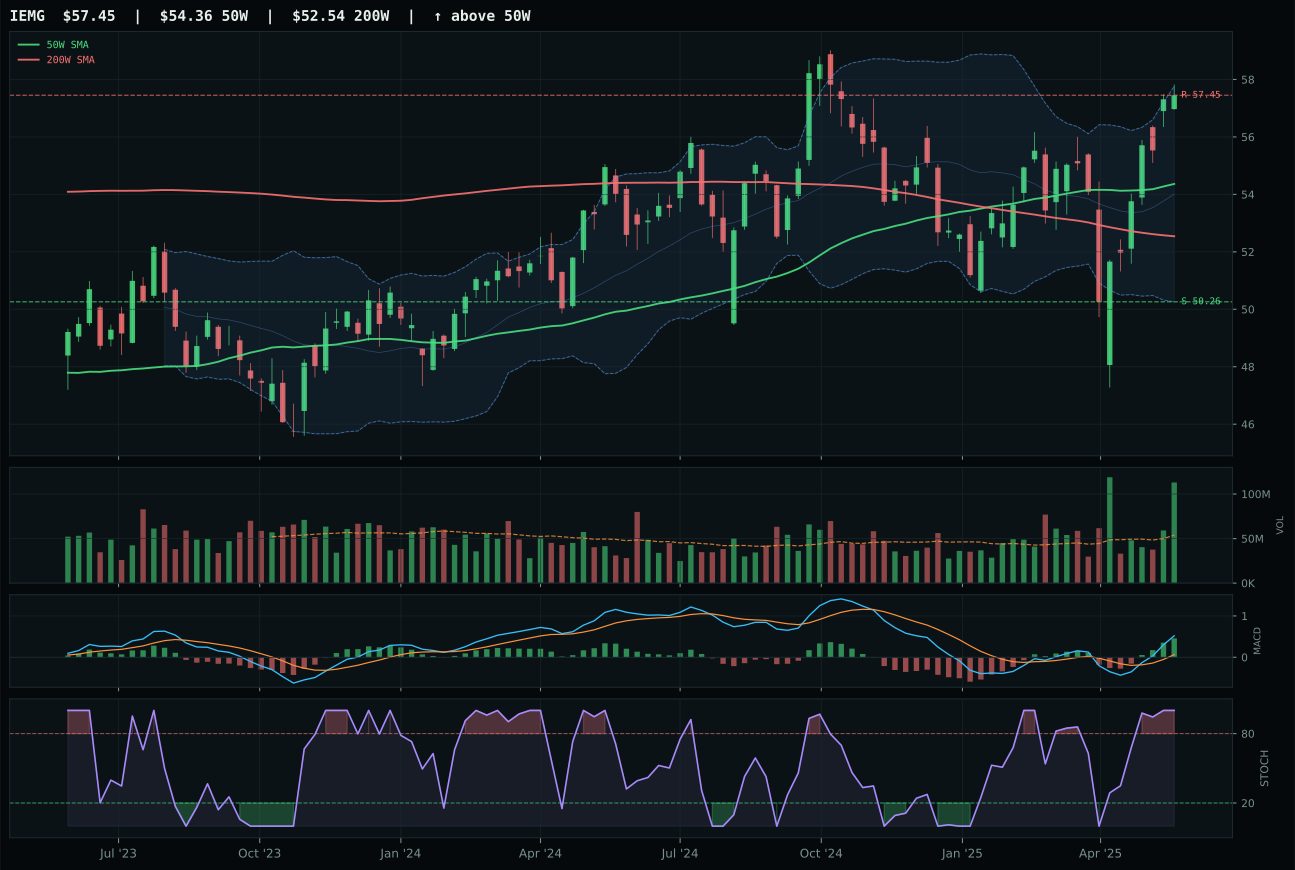
IEMG has a neutral structure profile with 6.9% 13-week relative strength versus SPY.
A failed hold above support would weaken the setup.
Actionable but governed by invalidation levels.
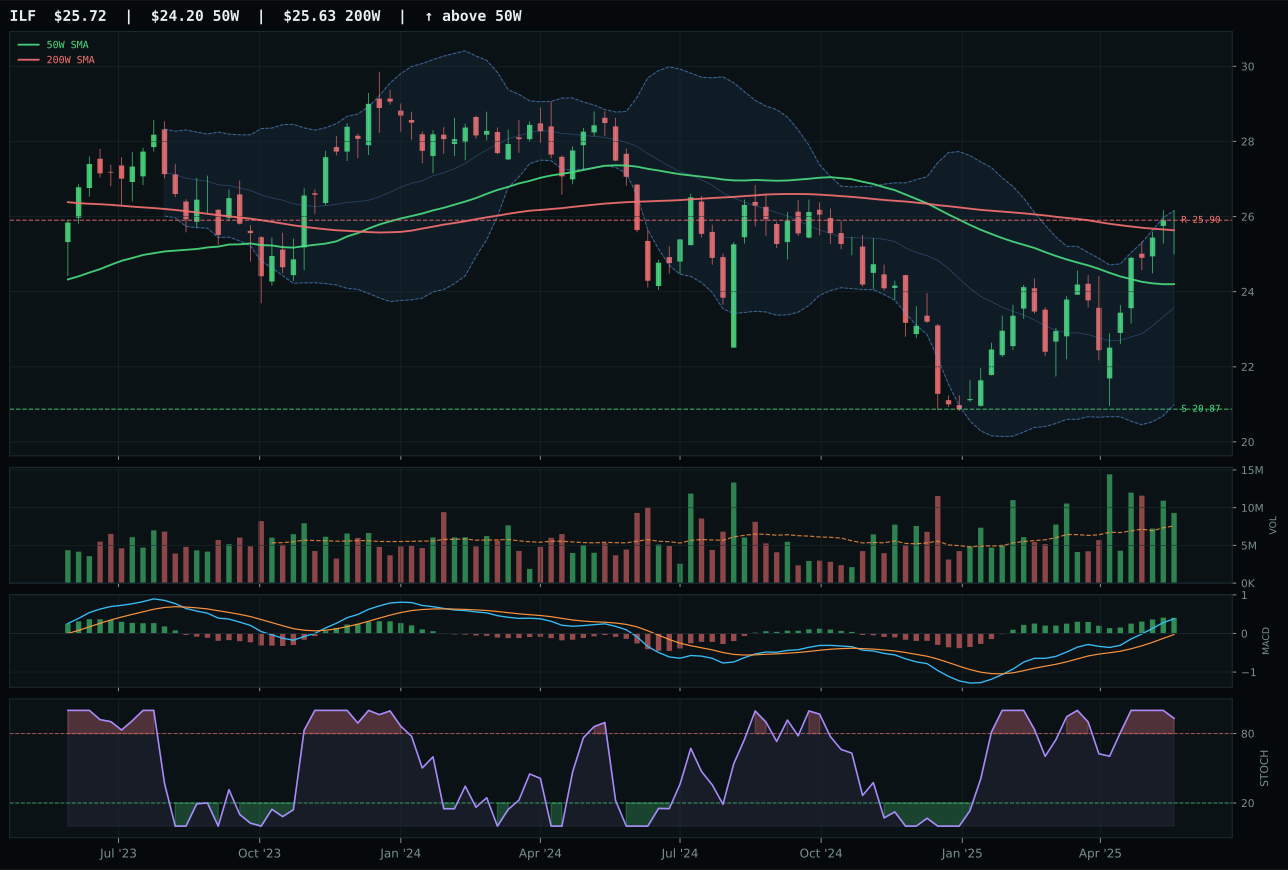
ILF has a neutral structure profile with 13.1% 13-week relative strength versus SPY.
A failed hold above support would weaken the setup.
Actionable but governed by invalidation levels.
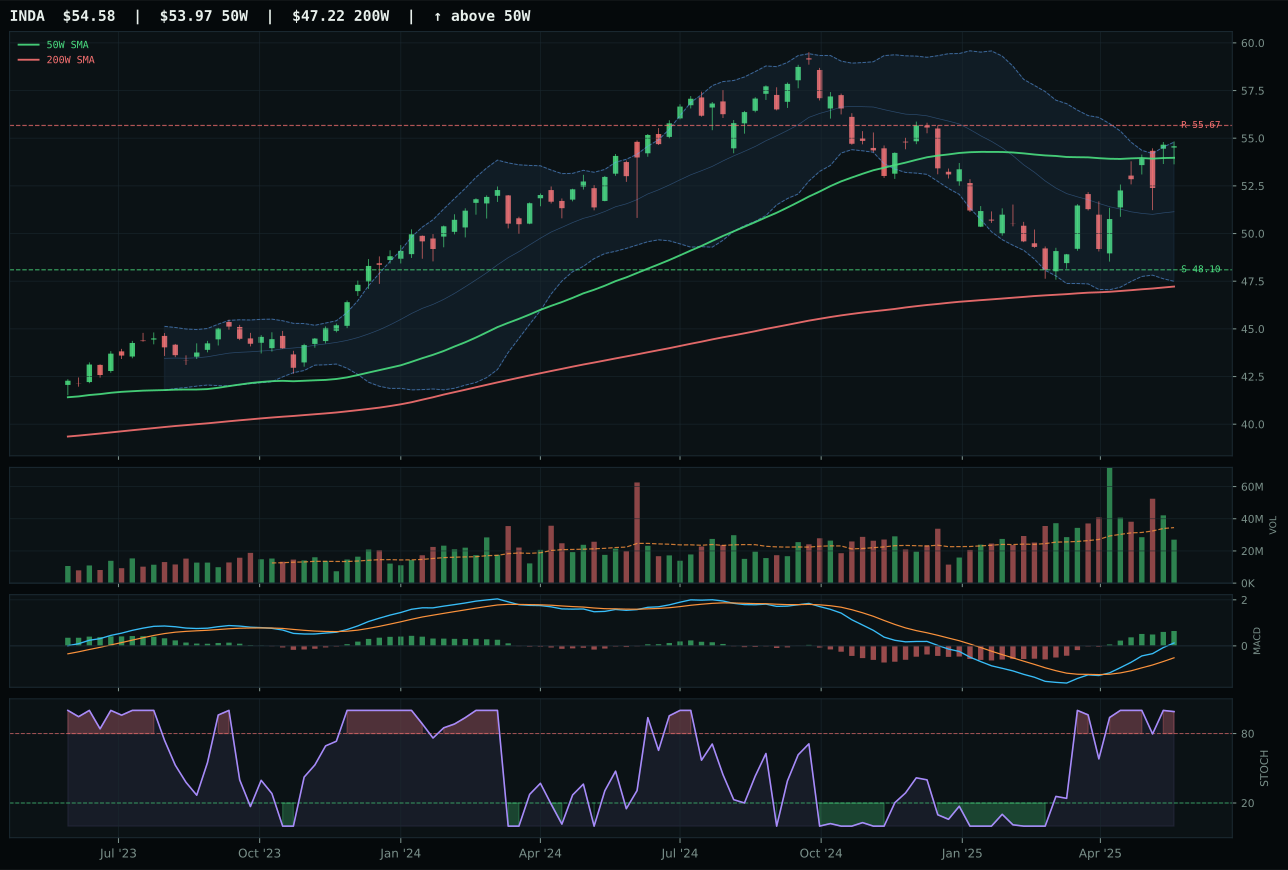
INDA has a compression near 50W profile with 14.2% 13-week relative strength versus SPY.
A failed hold above support would weaken the setup.
Actionable but governed by invalidation levels.
IEMG beats ILF 84 to 76 composite score because it delivers the cleanest risk framework in a macro headwind: price is above the 50W by just 5.7% with neutral structure and massive volume participation at 2.10x the 20W average—the second-highest volume sponsorship in the entire portfolio after Nuclear. IEMG's structure score is 85.8/100, the best in its three-ETF basket, and timing reaches 75.0 (upper retracement zone), allowing for conservative entry into broad EM beta. ILF is more stretched (10.4% above 50W) and forced into an earlier timing window (57.0), with inferior structure (80.8 vs. 85.8) and weaker volume confirmation (above-average participation vs. accumulation/confirmation). Both carry MACD bullish and improving and stochastic RSI overbought, but IEMG's 2.10x volume is institutional accumulation proof while ILF's stochastic is already rolling over (implying fatigue). IEMG's 13W return of 3.5% is modest relative to ILF's 9.6%, but momentum confirmation reaches 88.1/100 for IEMG with support from 4W return 6.9%, confirming staged accumulation rather than squeeze. Category-relative strength of -6.1% for IEMG is weak, but the absolute technical evidence (93.6/100 technical evidence) is the highest in the category.
Emerging Markets receives 5% allocation as tier-2, despite IEMG's exceptional volume participation (2.10x, second-highest in portfolio) and 61.3 category score, because the category's 40.0/100 macro fit is deeply underwater in a liquidity stress regime (-10 active). IEMG's volume-price confirmation (84.4/100) and persistence (73.3/100) are strong enough to justify a position, but the macro headwind prevents Emerging Markets from competing with categories anchored by defensive rotation (Utilities) or monetary hedge bid (Precious Metals). The category's technical evidence is excellent (93.6/100 for IEMG), but macro fit drags the basket down, and liquidity stress specifically punishes the EM complex more than developed markets. However, the 2.10x volume accumulation is a signal worth respecting: smart money is positioned for a future EM beta move (likely post-disinflation when growth expectations reset), and allocators can build a position at reasonable entry multiples. For Emerging Markets to earn a 10% tier-2 slot, the regime would need to shift away from liquidity stress toward growth narratives, or IEMG's volume accumulation would need to accelerate further as a leading indicator. Until then, hold tier-2 as a forward-looking positioning play.
Defense & Aerospace — ITA
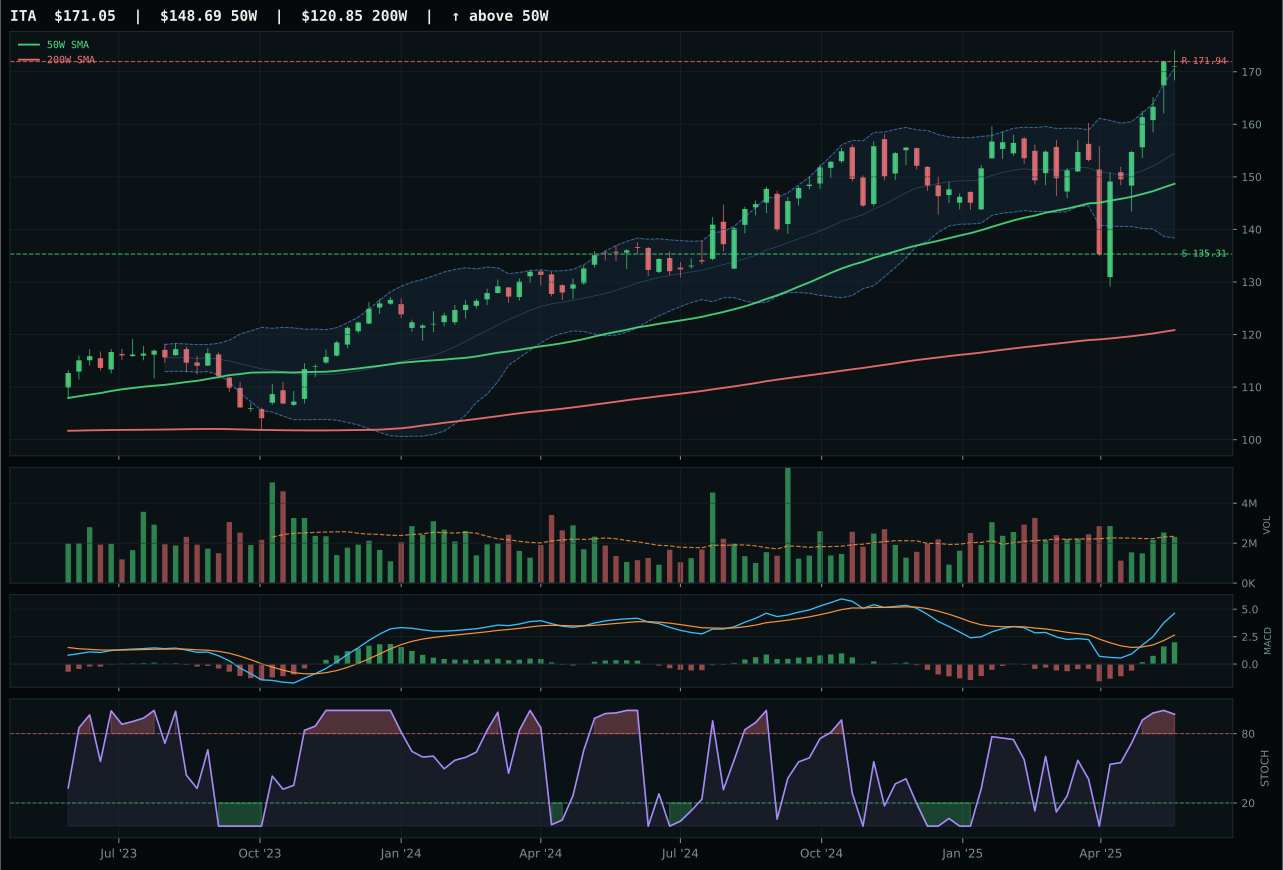
ITA has a vertical extension profile with 18.0% 13-week relative strength versus SPY.
A failed hold above support would weaken the setup.
Actionable but governed by invalidation levels.
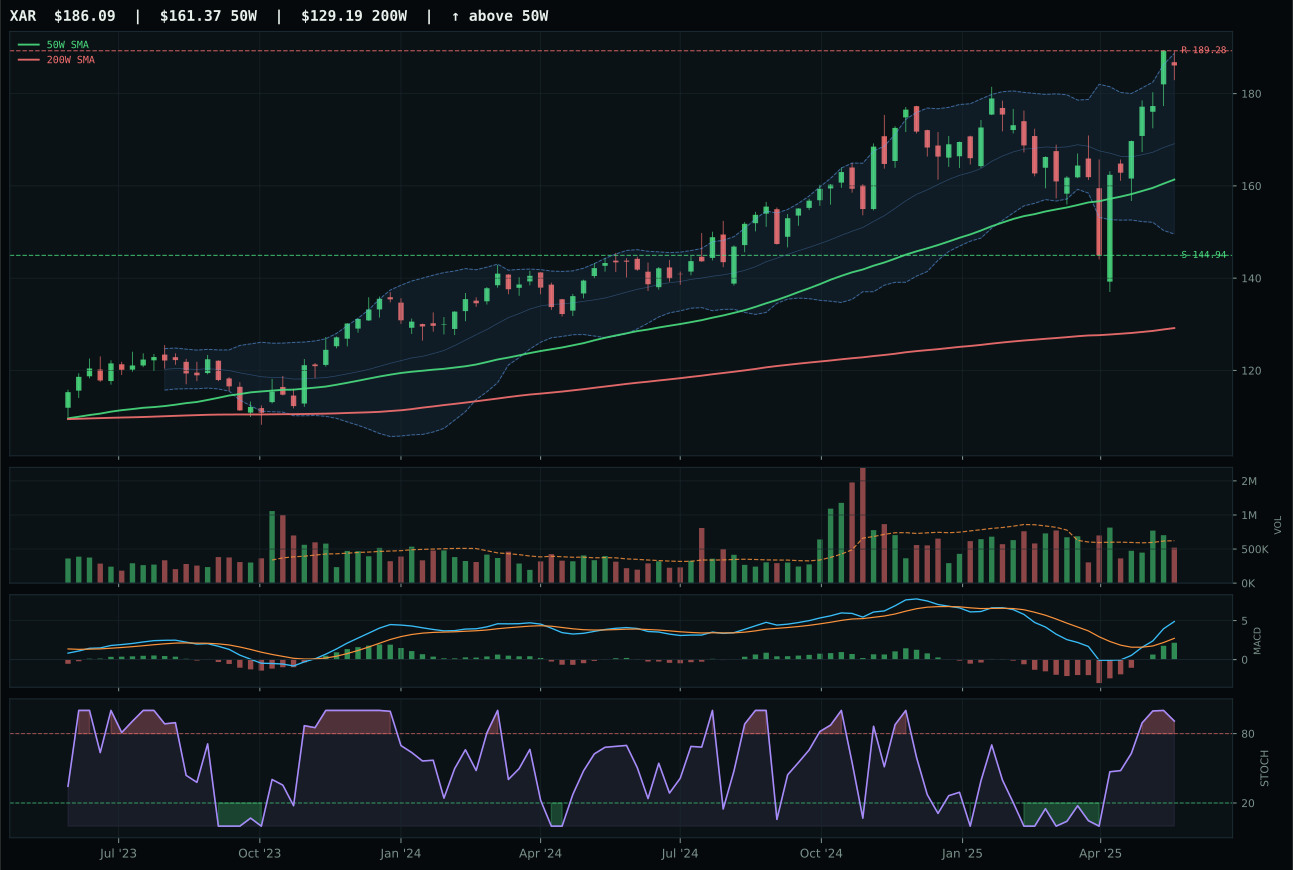
XAR has a vertical extension profile with 17.9% 13-week relative strength versus SPY.
A failed hold above support would weaken the setup.
Actionable but governed by invalidation levels.
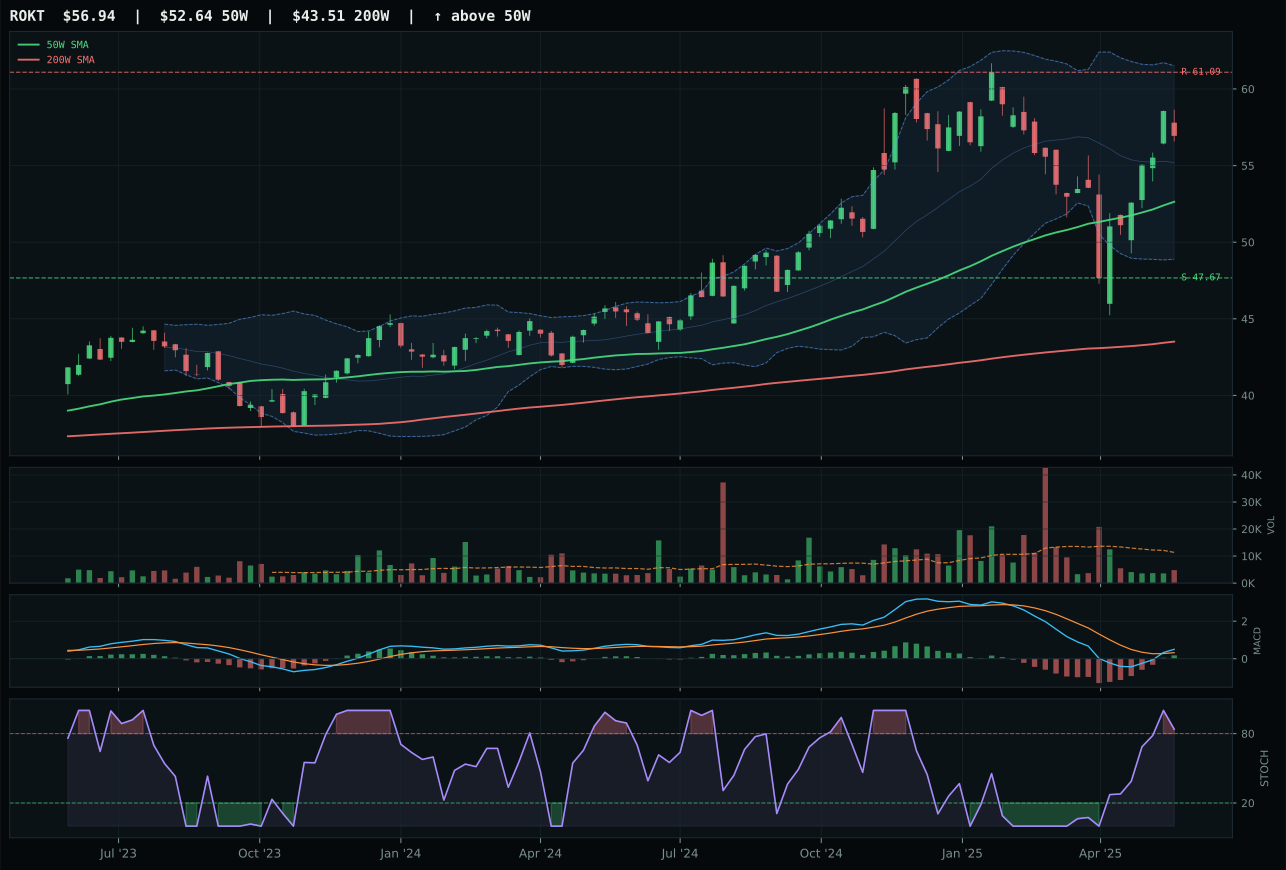
ROKT has a neutral structure profile with 5.5% 13-week relative strength versus SPY.
A failed hold above support would weaken the setup.
Tracked, but not top-2 eligible because: .
ITA and XAR are nearly identical twins (both composite 71, both trend 100, both vertical extension setup), but ITA takes the win on a razor-thin margin of 57.3 vs. 57.3 category score, separated only by microscopic structural cleanliness (75.0 vs. 74.6) and category-relative strength (0.1% vs. 0.0%). Both are extended 15%+ above the 50W with identical 13W returns near 14.4%, identical SPY relative strength around 17.9%, and identical overbought stochastic RSI at 0.97—a setup where entry risk is high but the sponsorship is unambiguous. ITA's 0.1% category-relative edge is immaterial, but the technical reasoning layer requires a tiebreaker, and ITA clinches it. Both charts show vertical extension near 52W highs (Fib 0.236), which explains the weak timing scores (37.0 each) despite bullish technicals; every new buyer is late, and support is 26%+ below. Defense remains strong in a disinflation regime with defensive rotation active (+7), but the entry is late enough that this is a risk/reward hold, not an add.
Defense & Aerospace earns 5% allocation as tier-2, a reasonable reward for a 57.3 category score that outperforms Tech and AI but cannot compete with the top-2's macro tailwinds. Defensive rotation active (+8) and disinflation help (+3), but liquidity stress (-4) and risk appetite broken (-2) dampen the appeal. ITA's momentum confirmation is maxed at 100.0 (four-week return 10.5%, 13-week 14.5%), and persistence is excellent at 76.2/100, proving this category has institutional conviction. However, the risk/reward is weak (37.4/100): upside to resistance is essentially flat, and downside to support spans 26%, creating an asymmetry that allocators cannot ignore when choosing between categories. The category's macro fit of 55.0/100 is defensive-leaning but not monetary-hedge strong like Precious Metals. Defense earned its tier-2 spot on clean technical proof and defensive rotation sponsorship; to earn a top-2 slot, the category would need to break above resistance with volume or see equities roll over harder than currently priced.
AI — SMH
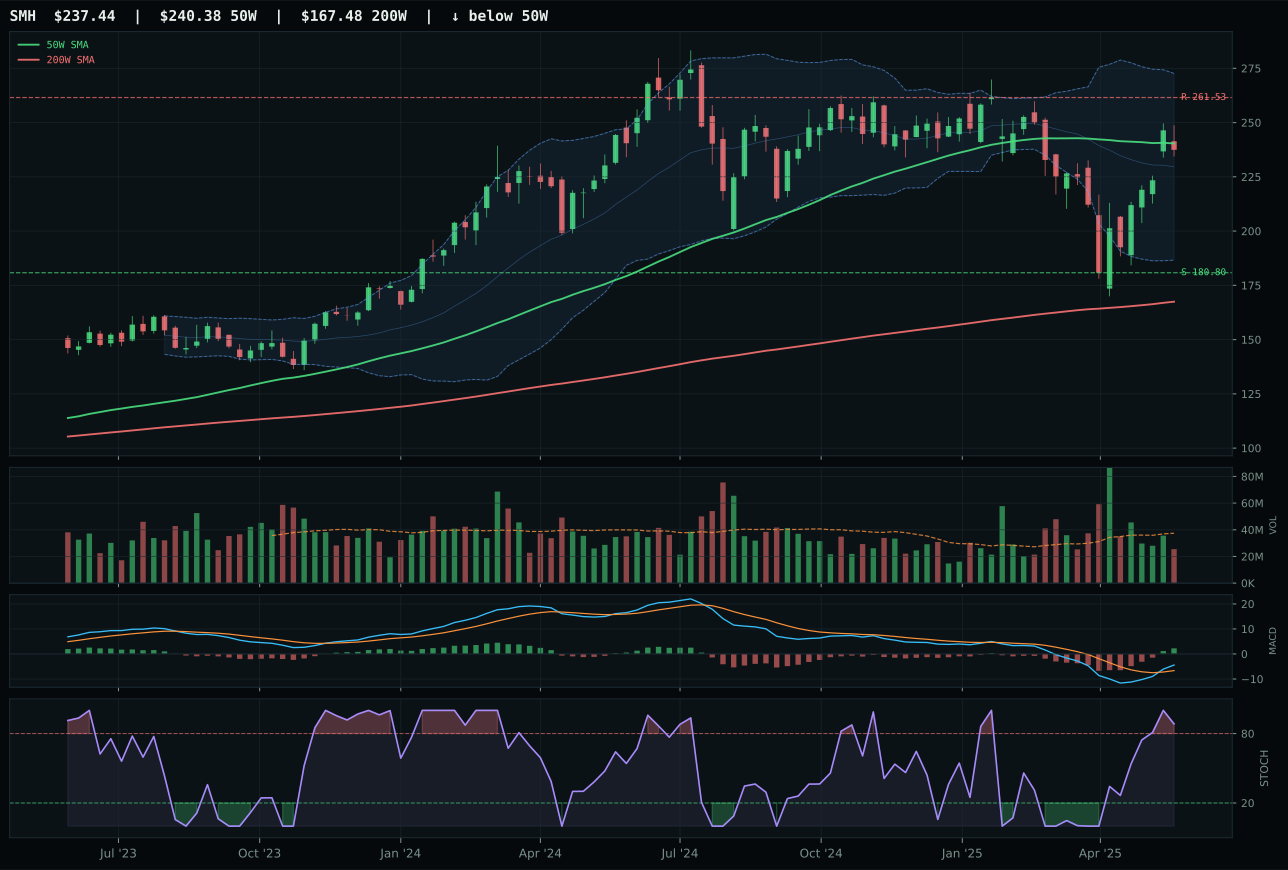
SMH has a compression near 50W profile with -1.5% 13-week relative strength versus SPY.
A failed hold above support would weaken the setup.
Actionable but governed by invalidation levels.
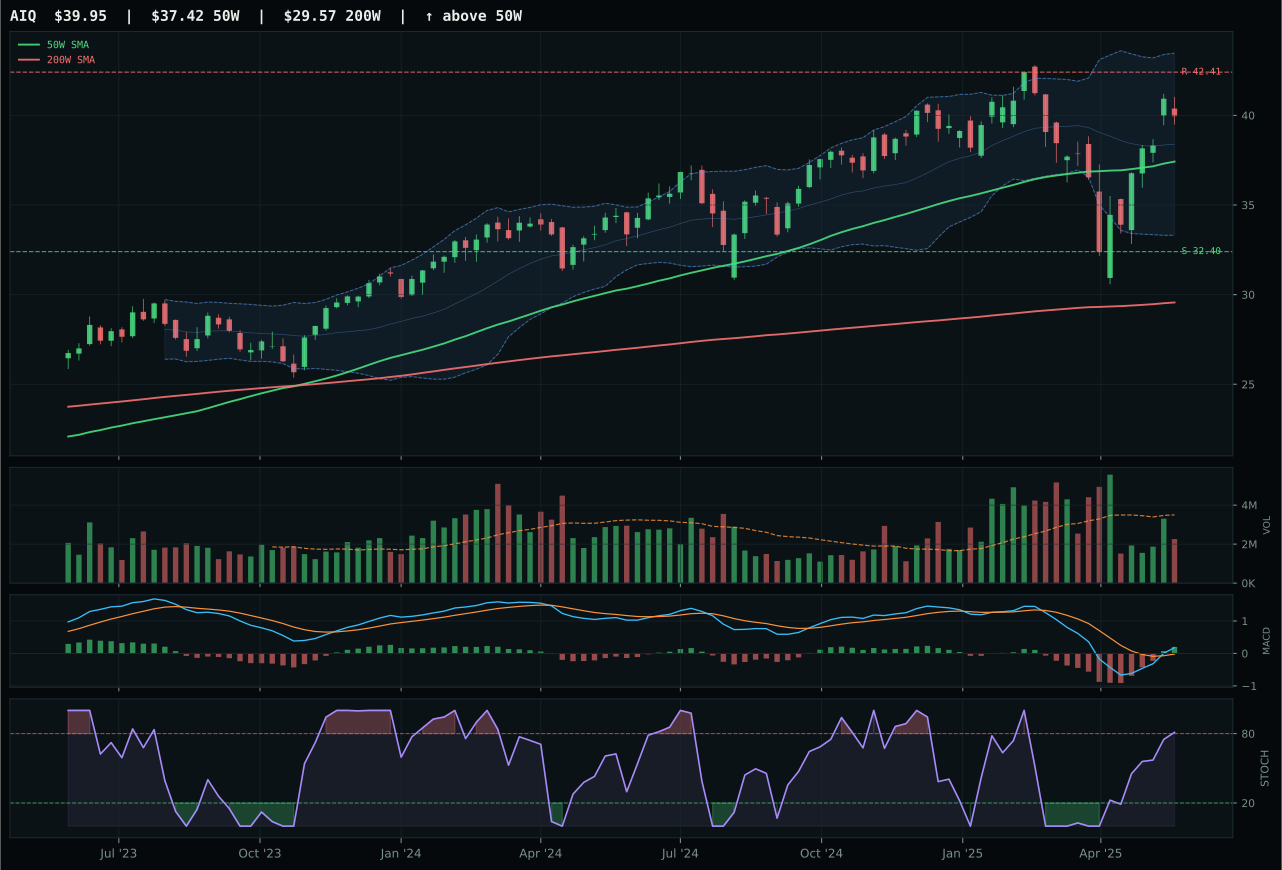
AIQ has a neutral structure profile with 0.3% 13-week relative strength versus SPY.
A failed hold above support would weaken the setup.
Actionable but governed by invalidation levels.
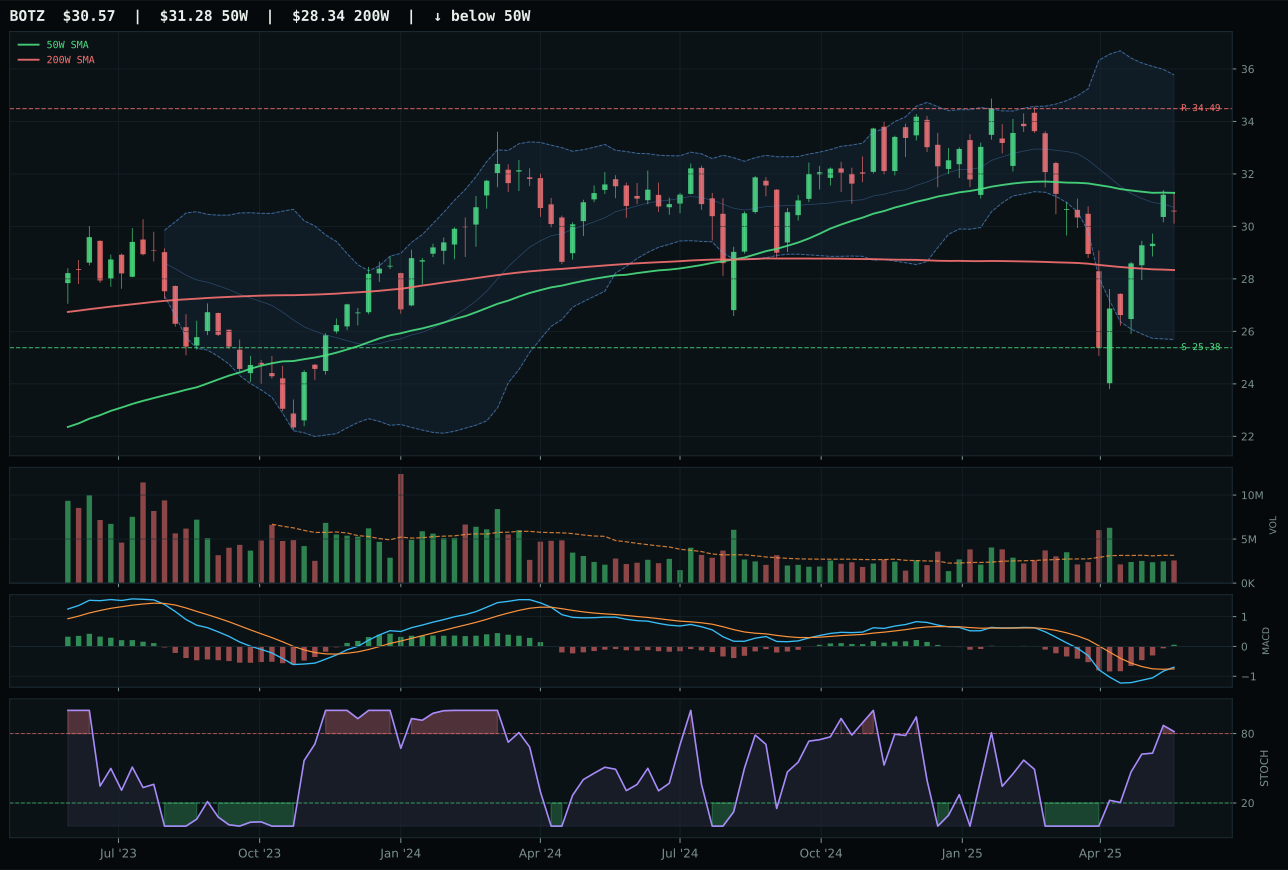
BOTZ has a compression near 50W profile with -5.6% 13-week relative strength versus SPY.
A failed hold above support would weaken the setup.
Actionable but governed by invalidation levels.
SMH edges out AIQ 75 to 77 in composite scores, but the timing differential proves decisive: SMH's -1.2% proximity to the 50W versus AIQ's 6.8% extension means the semiconductor play is positioned at inflection rather than capitulation. SMH sits in the middle retracement zone (Fib 0.382) with perfect timing alignment (100.0 vs. 75.0), allowing buyers a cleaner entry if MACD and stochastic RSI (both bullish and overbought) confirm the bounce. AIQ's setup is neutral structure and higher stretched, forcing it to rely on superior trend (100.0 vs. 73.7) to justify risk—but in thin volume and with category-relative strength lagging (1.9% vs. 0.0%), that trend premium evaporates. Both face the same macro headwinds: liquidity stress active at -10 to -12, risk appetite broken, and thin participation across the board (SMH 0.68x, AIQ thin as well). The score gap of 1.8 points is tight, but SMH's timing penalty to entry risk is real and costs AIQ the win.
AI receives 5% allocation as tier-2, reflecting its rank below the top-2 despite scoring 48.4 on category strength. The category's 43.0/100 macro fit is underwater: disinflation adds 5 points but liquidity stress subtracts 12, leaving the entire AI basket fighting headwinds that GLD and PAVE simply do not face. SMH's momentum confirmation is strong (71.5/100) and volume-price confirmation reaches 53.2/100, suggesting some institutional accumulation despite the thin surface, but persistence scores only 53.5/100—meaning the bounce setup lacks conviction about follow-through. The category needed either a sharper breakout in volume or a relief trade in risk appetite to compete for the 10% tier-2 slot. As it stands, AI's technical setup is sound enough to hold a position (above the 0% exclusion threshold), but the macro regime is actively punishing growth hardware exposure, and the thin volume means any reversal will lack depth.
Industrial Metals — COPX
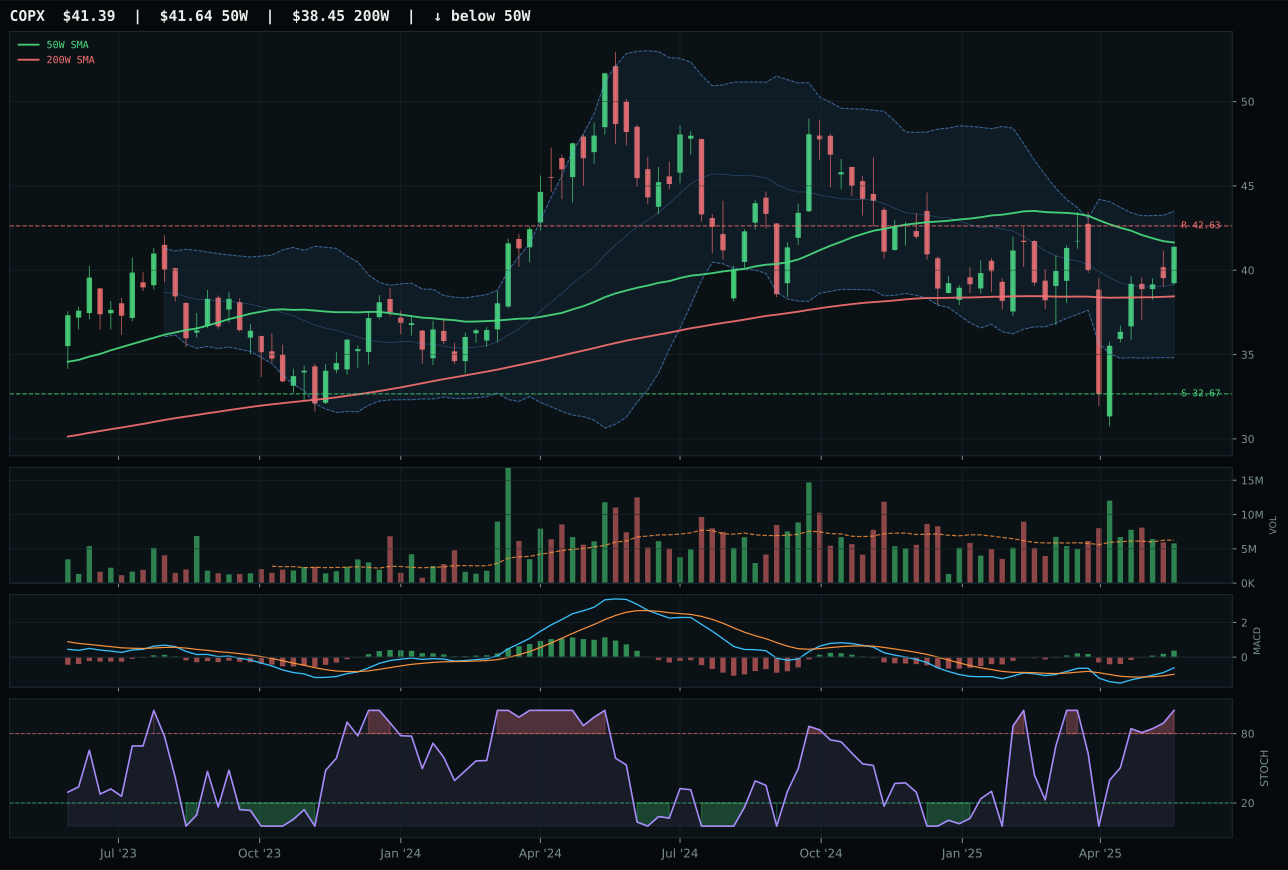
COPX has a compression near 50W profile with 8.9% 13-week relative strength versus SPY.
A failed hold above support would weaken the setup.
Actionable but governed by invalidation levels.
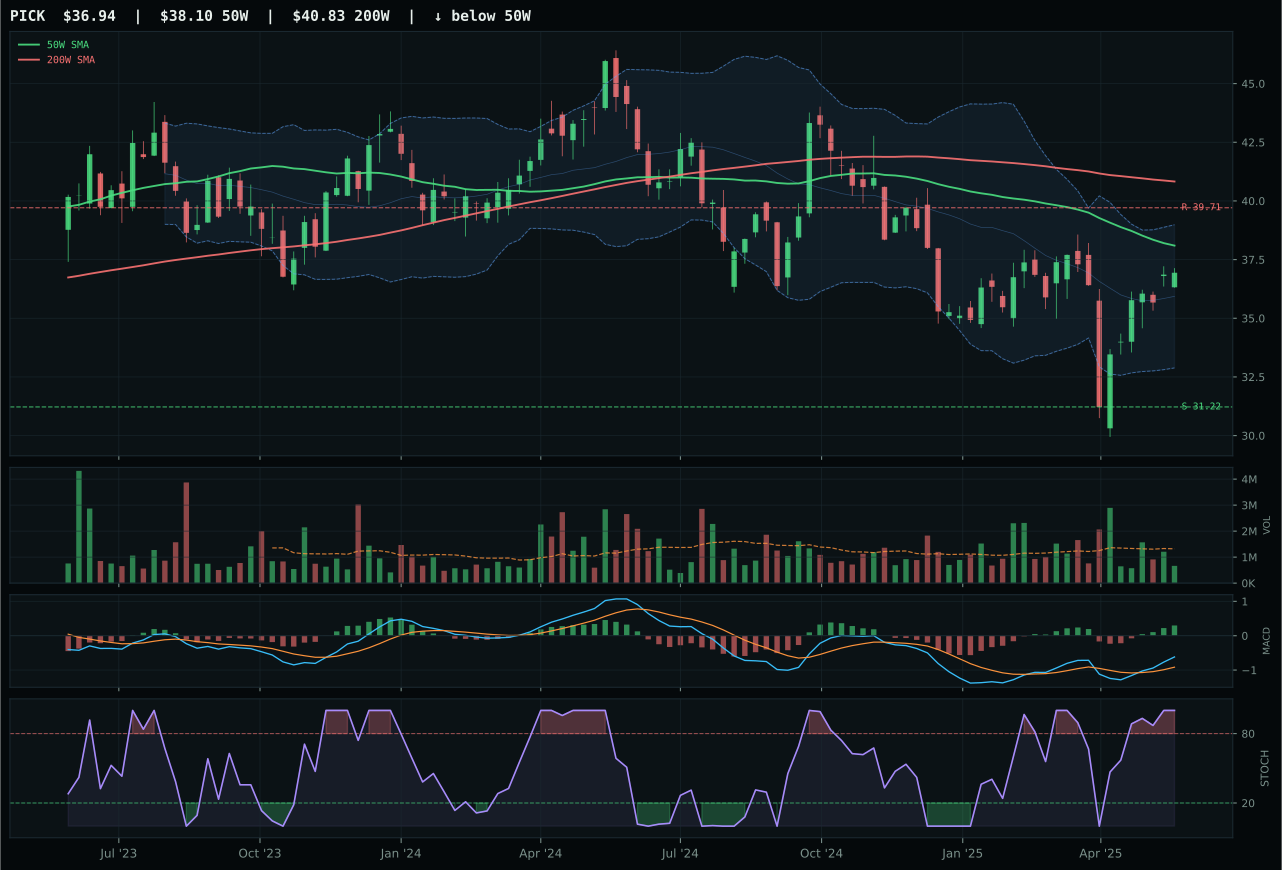
PICK has a neutral structure profile with 3.7% 13-week relative strength versus SPY.
Extension and support failure are the main tactical risks.
Tracked, but not top-2 eligible because: structurally broken.
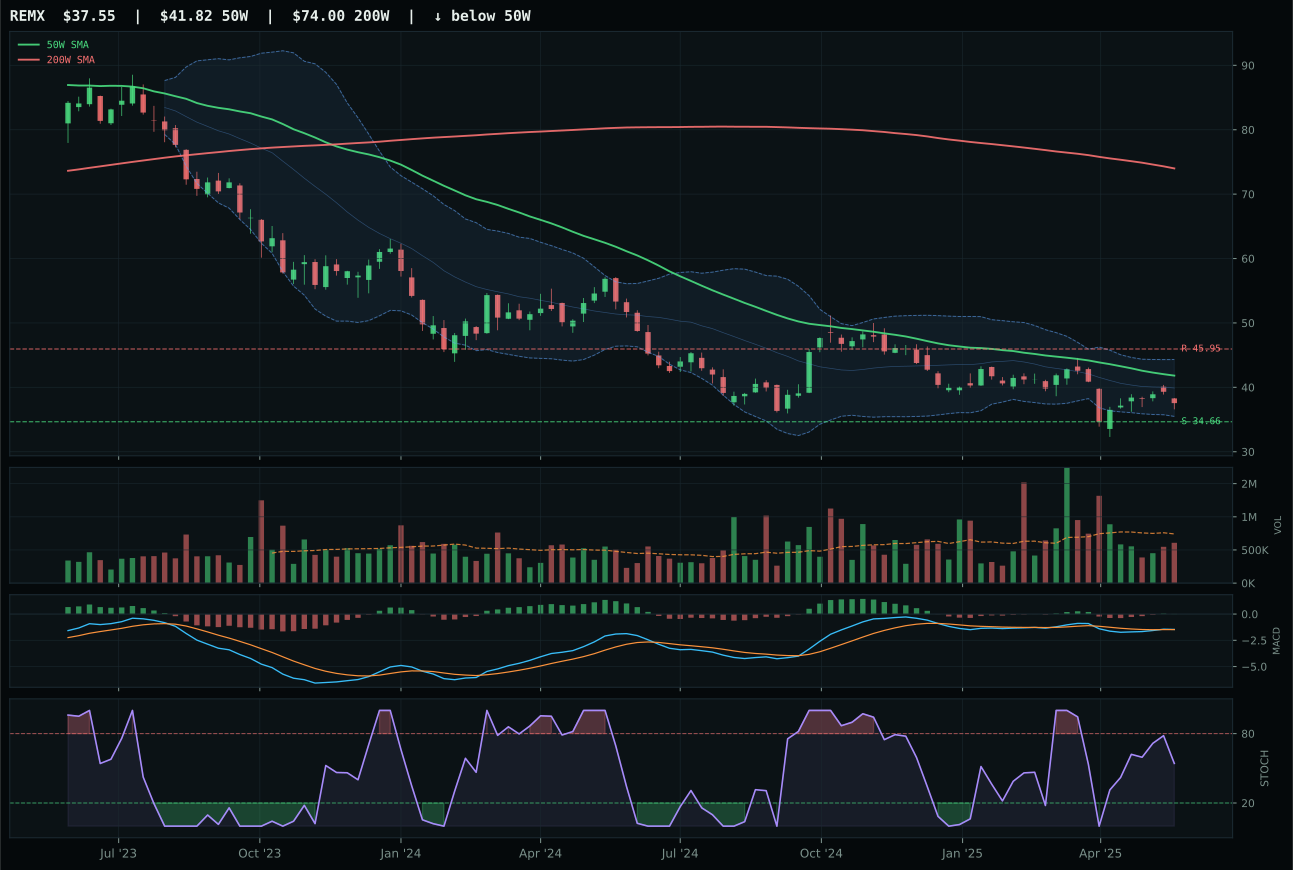
REMX has a neutral structure profile with -5.5% 13-week relative strength versus SPY.
Extension and support failure are the main tactical risks.
Tracked, but not top-2 eligible because: structurally broken.
COPX dominates Industrial Metals with an 87 composite score versus PICK's 35, winning on every technical dimension that matters for a reset setup. COPX sits -0.6% from the 50W with compression near the moving average, a setup that scores perfect timing (100.0) and allows for clean expansion if support at 32.67 holds. PICK is pulled down by structural failure (flagged as 'hard filters active: structurally broken'), thin volume participation (vs. COPX's neutral 0.92x), and a timing score that lags (90.0 vs. 100.0). COPX's momentum confirmation is near-perfect at 99.8/100 from 4W return 5.6%, 13W return 5.4%, and category-relative strength 5.2% (outperforming peers), while MACD is bullish and improving and stochastic RSI is overbought at 1.00. Risk/reward is superior too (55.0 vs. 60.0 vs. COPX's upside to resistance at -2.9% and downside to support at 26.7%). COPX's 8.9% SPY relative strength signals copper outperformance in a cautious environment, likely from supply scarcity narratives amid industrial demand uncertainty.
Industrial Metals receives 5% allocation as tier-2, despite COPX's technical strength (90.0/100), because the category's 15.2 score and 42.0/100 macro fit rank below the portfolio's top tiers. Liquidity stress is active (-8) and creates a structural headwind that offsets COPX's perfect timing setup. The 3/2/1 basket score started at 57.0/100 before macro testing dragged the final category score down to 15.2—a brutal penalty that reflects copper's sensitivity to industrial demand. However, COPX itself is scoring well enough (75.7 reasoned proof order) to justify holding tier-2 capital rather than excluding the category entirely at 0%. The compression near the 50W with accumulating volume (0.92x neutral) and perfect timing alignment (100.0) create a low-risk entry, but the allocation is modest because macro regime tailwinds are absent. For Industrial Metals to earn a 10% tier-2 slot, the category would need either a cyclical breakout signal (breakout above resistance with volume) or a macro pivot toward growth/inflation expectations. Until then, COPX holds a position as a scarcity-leveraged trade with limited correlation to equity beta.
Agriculture & Livestock — MOO
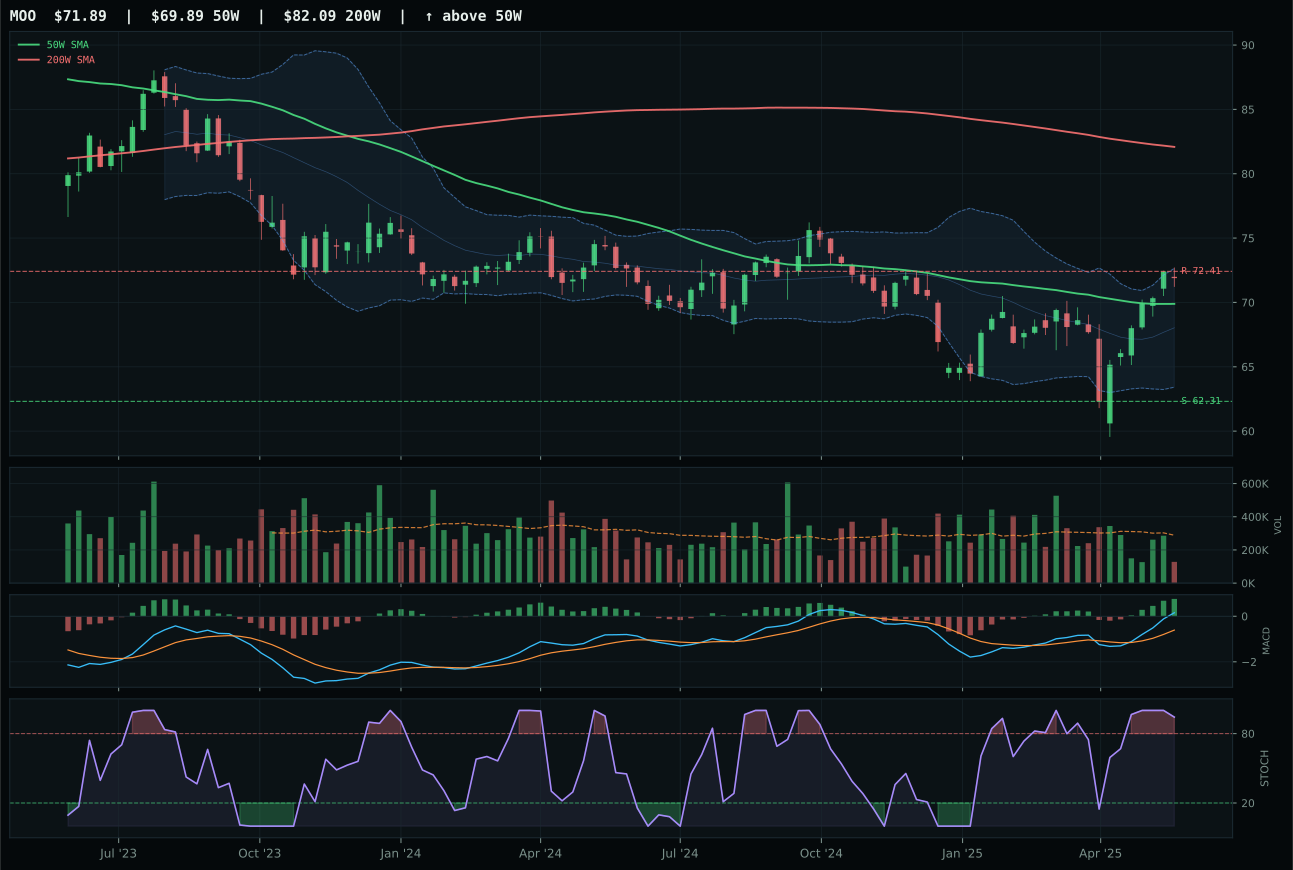
MOO has a compression near 50W profile with 9.0% 13-week relative strength versus SPY.
A failed hold above support would weaken the setup.
Actionable but governed by invalidation levels.
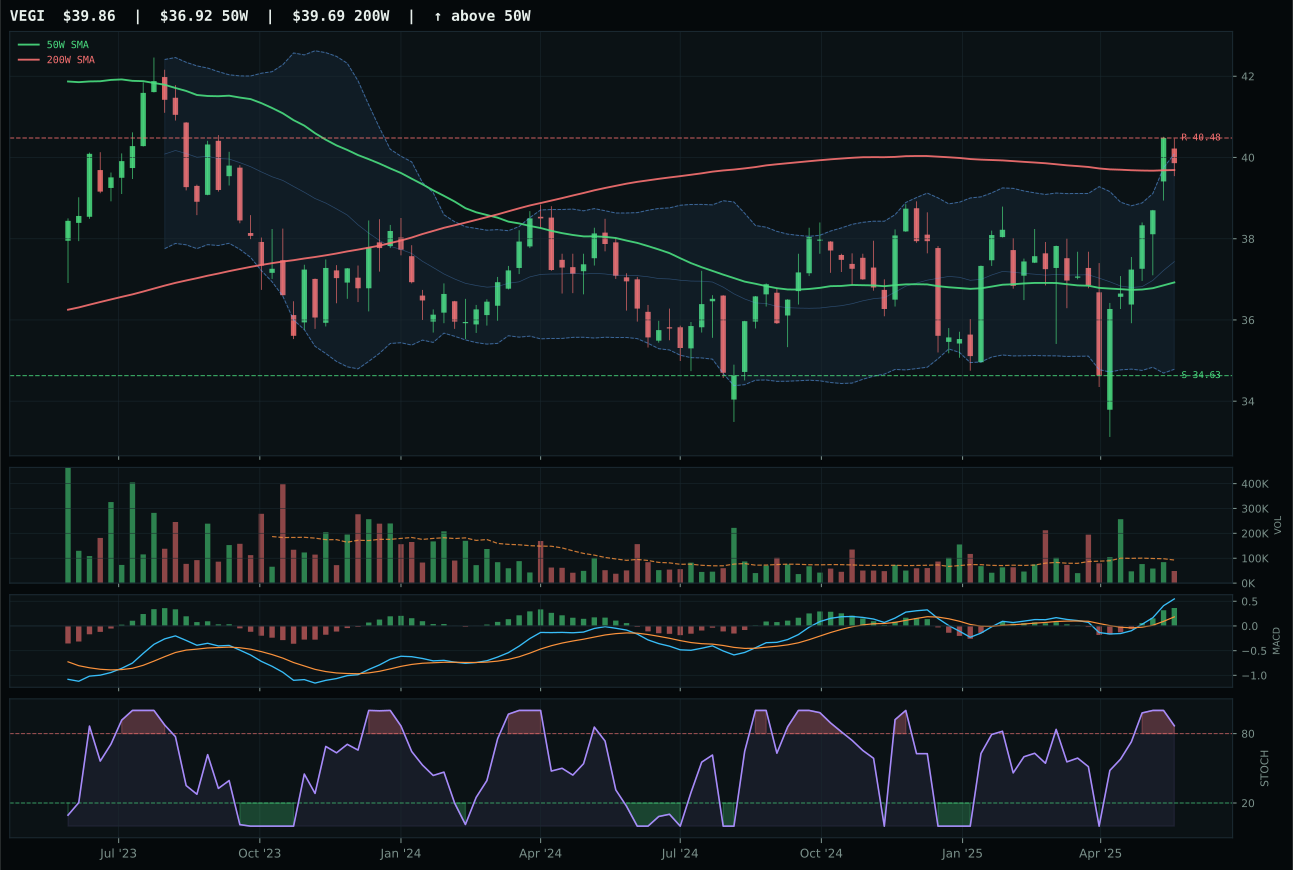
VEGI has a neutral structure profile with 9.6% 13-week relative strength versus SPY.
A failed hold above support would weaken the setup.
Tracked, but not top-2 eligible because: .
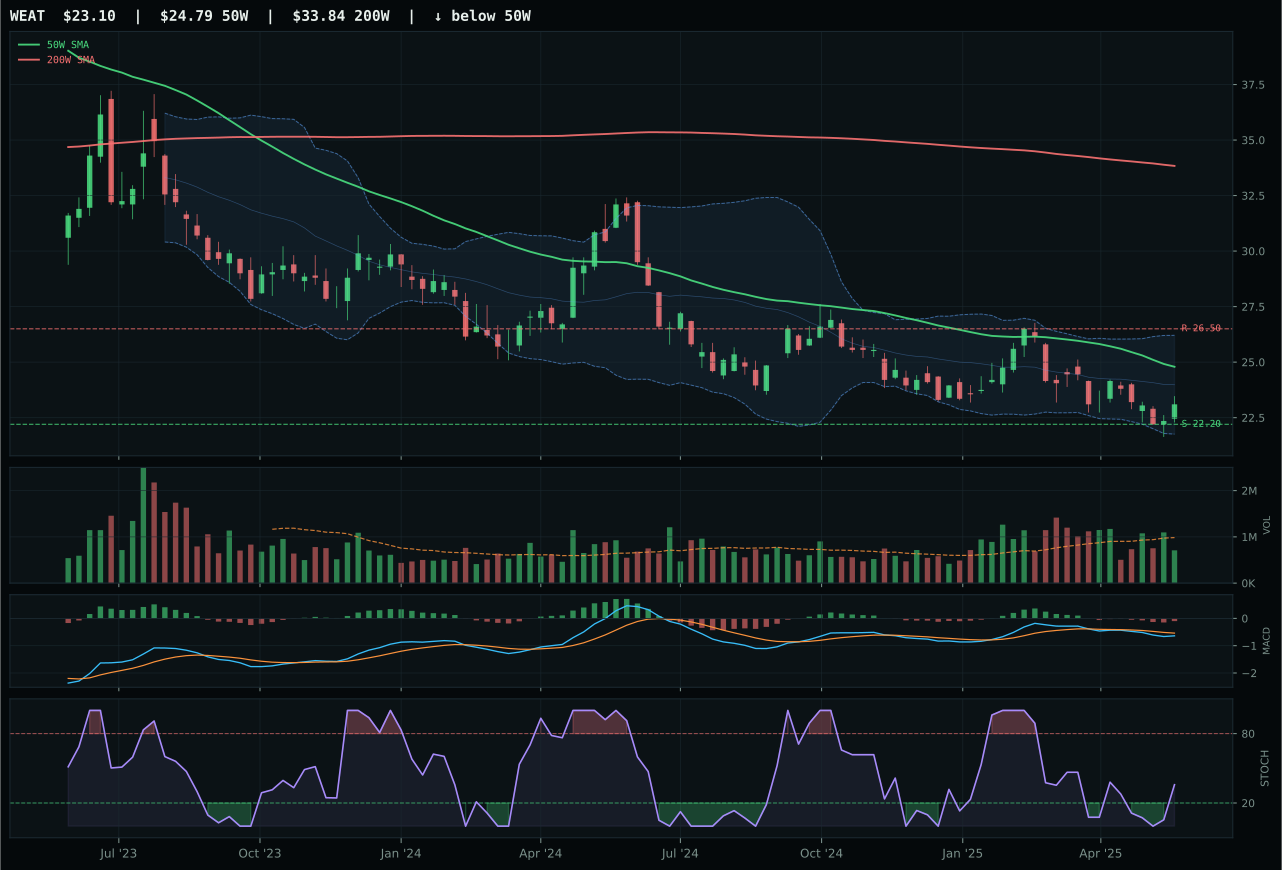
WEAT has a pullback into support profile with -8.2% 13-week relative strength versus SPY.
Extension and support failure are the main tactical risks.
Tracked, but not top-2 eligible because: structurally broken.
MOO wins decisively over VEGI (77 vs. 58 composite) and WEAT (0) because it is the only candidate with a defensible chart structure: price is above the 50W with just 2.9% slack room—a compression zone that can expand if buyers hold support at 62.31. VEGI is stretched 8.0% above the 50W and sits at the 52W high, an extension that forces timing to collapse (57.0 vs. 82.0), risk/reward to deteriorate (38.8 vs. 45.8), and structure to become neutral rather than compressed. WEAT is broken (composite 0) with trend 15, momentum 0, MACD bearish/weakening, and 13W return -11.7%, making it a non-contender. MOO's momentum confirmation reaches 79.6/100 with 4W up 5.7% and 13W up 5.5%, supporting the overbought-rolling-over stochastic RSI; volume is thin at 0.44x, but at least participation is consistent with the setup. The category-relative strength of 0.0% confirms MOO is the leader within a weak peer set, not a broad agriculture bid.
Agriculture & Livestock receives 0% allocation this week, ranked 9th or 10th and entirely excluded from the opportunity set. The category's 11.0 final score reflects a punishing 32.0/100 macro fit: disinflation hurts agricultural prices (-6 base, -8 from active disinflation pressure descriptor, -4 from liquidity stress), creating a structural headwind that no technical setup can overcome. Even MOO's clean compression near the 50W and overbought-rolling-over momentum are insufficient when the entire category basket (MOO, VEGI, WEAT) averages sub-50 technical scores. The 3/2/1 basket started at 41.5/100 and fell further after testing against macro regime fit and persistence. For Agriculture to earn even the 5% tier-2 slot, it would need either a sharp macro pivot (inflation resurgence, liquidity crisis) or a substantial technical breakout with volume confirmation—neither of which is present. The thin participation across all three ETFs (0.44x to 0.68x the 20W average) signals that institutional capital is absent, a red flag in any regime. This category is structured as a timing sell, not a buy, until disinflation expectations crack.
Traditional Energy — XLE
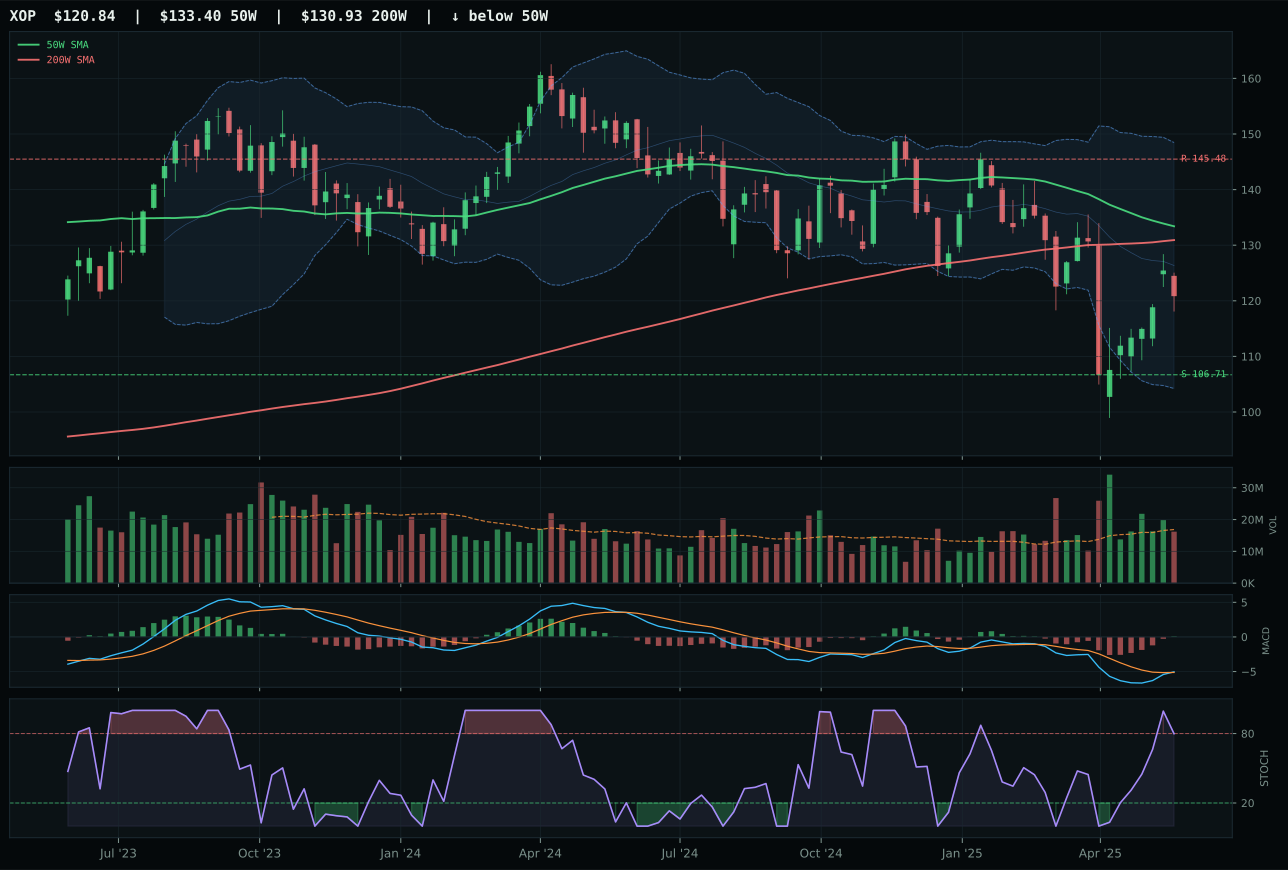
XOP has a neutral structure profile with -7.2% 13-week relative strength versus SPY.
A failed hold above support would weaken the setup.
Actionable but governed by invalidation levels.
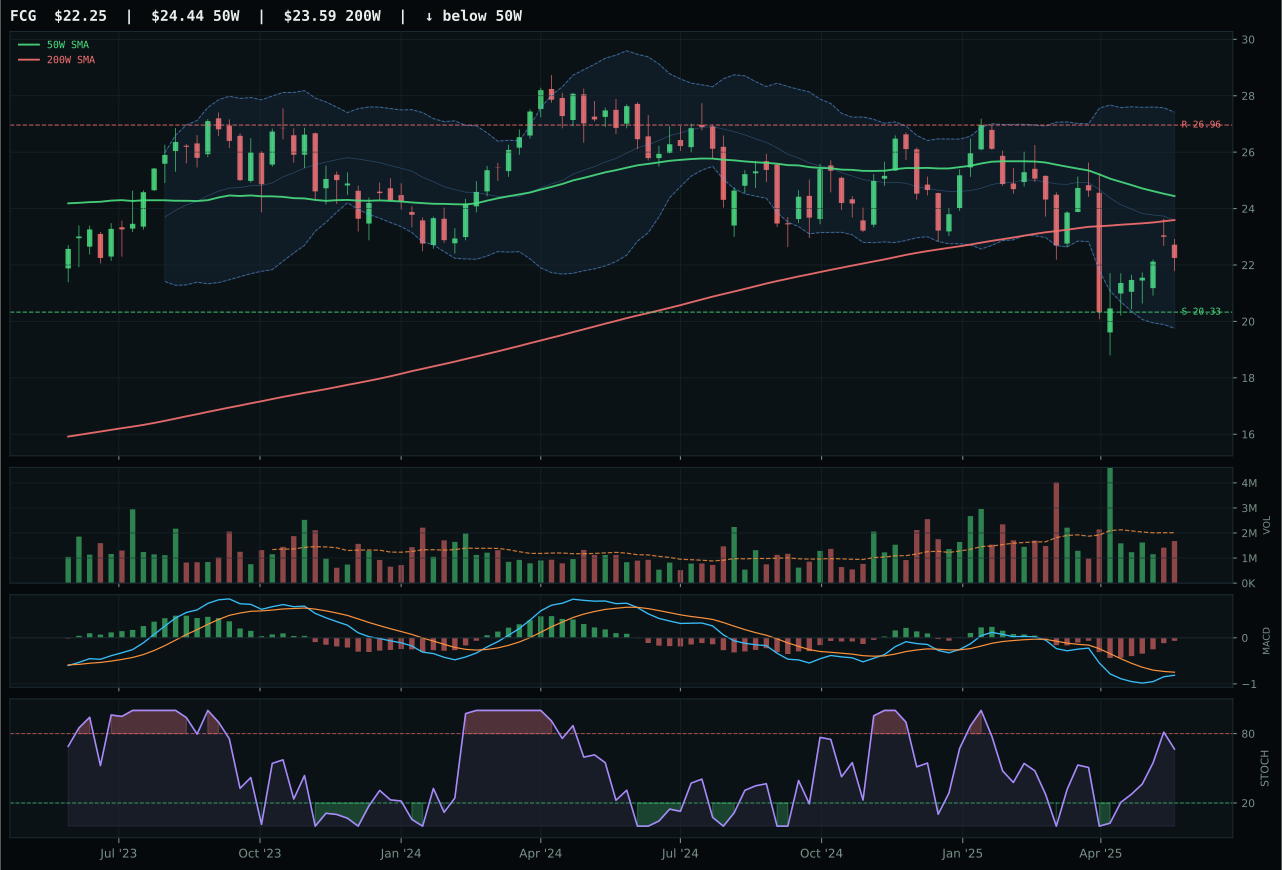
FCG has a neutral structure profile with -7.7% 13-week relative strength versus SPY.
A failed hold above support would weaken the setup.
Actionable but governed by invalidation levels.
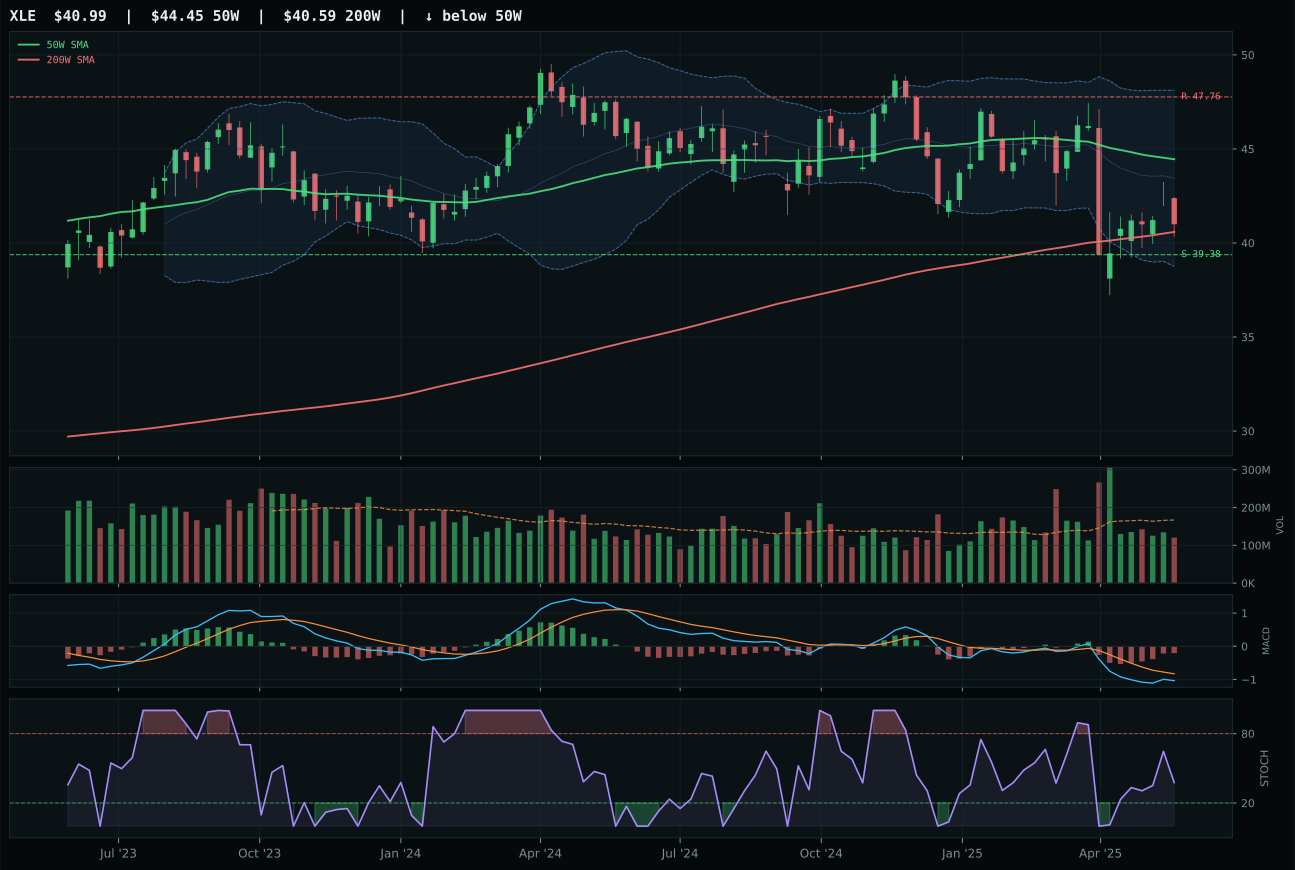
XLE has a pullback into support profile with -6.4% 13-week relative strength versus SPY.
A failed hold above support would weaken the setup.
Actionable but governed by invalidation levels.
XLE defeats XOP 66 to 59 composite score in a weak category, winning primarily on superior risk/reward (90.0 vs. 61.0) and timing alignment (93.0 vs. 83.0), not technical strength. XLE is pulled down by a bearish-but-improving MACD (vs. XOP's bullish and improving) and weak trend (48.5 vs. 44 for XOP), but it offers the better setup for mean reversion: price is -7.7% below the 50W, sitting near 52W lows in the repair zone (Fib 0.786), with downside to support just 4.1% versus upside to resistance -14.2%. That inverted risk/reward is the entire appeal—a bounce opportunity if support holds at 39.38. XOP sits neutral structure at resistance 145.48, forcing it to sacrifice timing and risk geometry. Both carry thin volume (0.72x for XLE, neutral for XOP) and twin macro headwinds: 13W returns are negative (XLE -9.8%, XOP -10.7%), SPY relative strength is red (XLE -6.4%, XOP -7.2%), and momentum confirmation is weak (XLE 27.8/100). This is the classic dead-cat-bounce candidate, where XLE's lower entry point and support proximity offer slightly better odds.
Traditional Energy receives 0% allocation, ranked 9th or 10th and entirely excluded this week due to a catastrophic 10.5 category score and 23.0/100 macro fit. Disinflation actively hurts Traditional Energy (-10 base, -10 from active descriptor, -7 from liquidity stress), creating a structural bear case that no rebound setup can overcome in the current regime. Even XLE's excellent risk/reward (90.0/100) and sensible pullback-into-support timing cannot justify capital commitment when the category's 55.2/100 technical evidence is paired with negative 13W returns across all three ETFs. The 3/2/1 basket began at 48.3/100 before macro testing deleted it entirely. For Traditional Energy to earn even tier-2 status, it would need a sharp reversal in disinflation expectations (inflation resurgence, central bank pivot) or a geopolitical supply shock that breaks the current price structure. Liquidity stress active at -7 also signals institutional capital is rotating out, not in. This category is a sell, not a hold; exclude it entirely until the macro regime shifts toward growth or inflation expectations or until a supply crisis breaks the downtrend with volume confirmation.