
2025-05-16
Informational purposes only. The content in this report, including allocations, analysis, and commentary, is provided solely for informational and educational purposes. It does not constitute financial advice, investment advice, trading advice, or any other type of advice. Past performance does not guarantee future results. Always conduct your own research and consult a qualified financial professional before making investment decisions.
Weekly Allocation
| Ticker | Category | Weight | Role |
|---|---|---|---|
| FBTC | 50% | Overlay | |
| PAVE | Utilities & Infrastructure | 10% | Top-2 (10%) |
| GLD | Precious Metals | 10% | Top-2 (10%) |
| XLK | Technology | 5% | Tier-2 (5%) |
| ILF | Emerging Markets | 5% | Tier-2 (5%) |
| XAR | Defense & Aerospace | 5% | Tier-2 (5%) |
| SMH | AI | 5% | Tier-2 (5%) |
| URA | Nuclear Energy | 5% | Tier-2 (5%) |
| COPX | Industrial Metals | 5% | Tier-2 (5%) |
Trade Instructions — Monday Open
Sell the tranche from 2025-04-18 (completing its 4-week hold). Buy the new tranche. Instructions show net portfolio changes — same-asset positions cancel, weight changes show the delta.
| Action | Ticker | Instruction |
|---|---|---|
| SELL | IGF | Sell 50% of IGF position (reduce 5.00% → 2.50%) |
| SELL | CIBR | Sell entire CIBR position (1.25% of portfolio) |
| SELL | MOO | Sell 50% of MOO position (reduce 2.50% → 1.25%) |
| SELL | XLE | Sell entire XLE position (1.25% of portfolio) |
| SELL | NLR | Sell entire NLR position (1.25% of portfolio) |
| SELL | AIQ | Sell 33% of AIQ position (reduce 3.75% → 2.50%) |
| BUY | ILF | Buy ILF — 14.29% of freed cash (adds 1.25% to portfolio) |
| BUY | URA | Buy URA — 14.29% of freed cash (adds 1.25% to portfolio) |
| BUY | PAVE | Buy PAVE — 28.57% of freed cash (adds 2.50% to portfolio) |
| BUY | SMH | Buy SMH — 14.29% of freed cash (adds 1.25% to portfolio) |
| BUY | COPX | Buy COPX — 14.29% of freed cash (adds 1.25% to portfolio) |
| BUY | XLK | Buy XLK — 14.29% of freed cash (adds 1.25% to portfolio) |
Current Portfolio After Trade
Combined holdings across all 4 active tranches. Each tranche is 25% of the portfolio.
| Ticker | % of Portfolio | Weight Bar |
|---|---|---|
| FBTC | 50.00% | |
| GLD | 10.00% | |
| ILF | 5.00% | |
| PAVE | 5.00% | |
| XAR | 3.75% | |
| IGV | 3.75% | |
| URA | 3.75% | |
| COPX | 3.75% | |
| AIQ | 2.50% | |
| IGF | 2.50% | |
| SMH | 2.50% | |
| XLU | 2.50% | |
| MOO | 1.25% | |
| ITA | 1.25% | |
| URNM | 1.25% | |
| XLK | 1.25% |
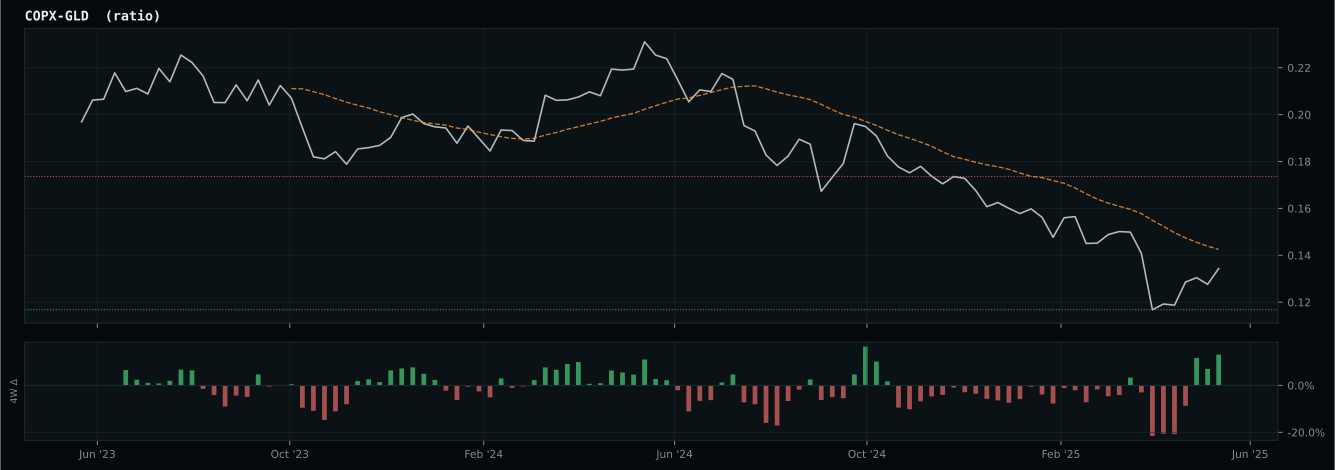
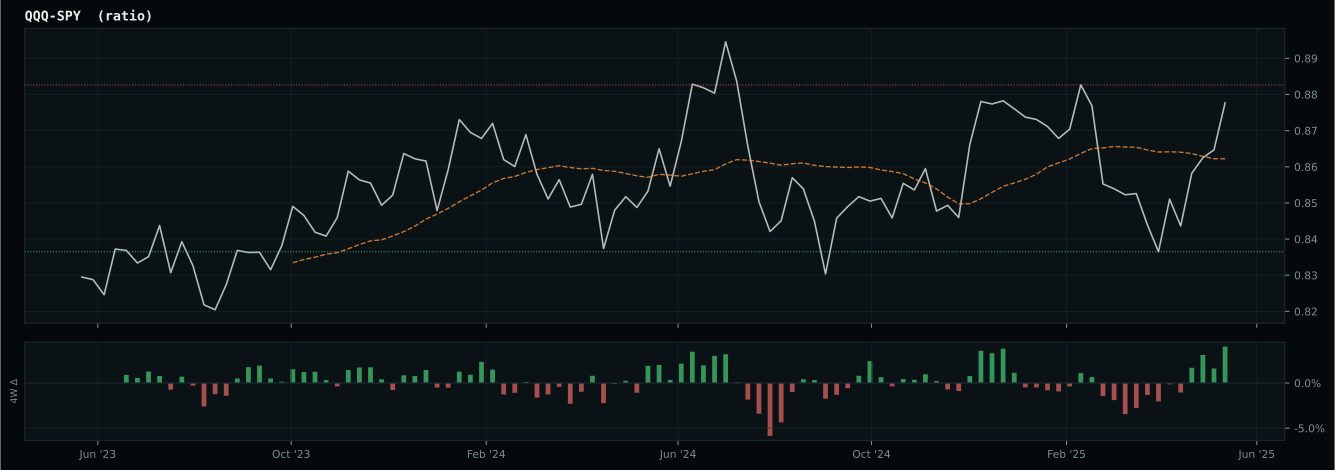
Macro Regime — Disinflation
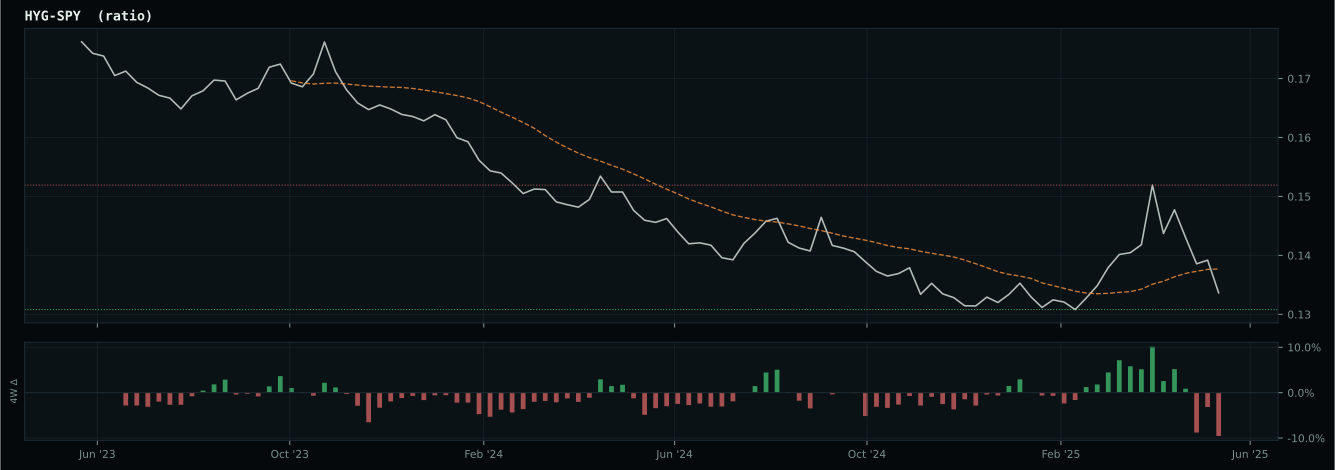
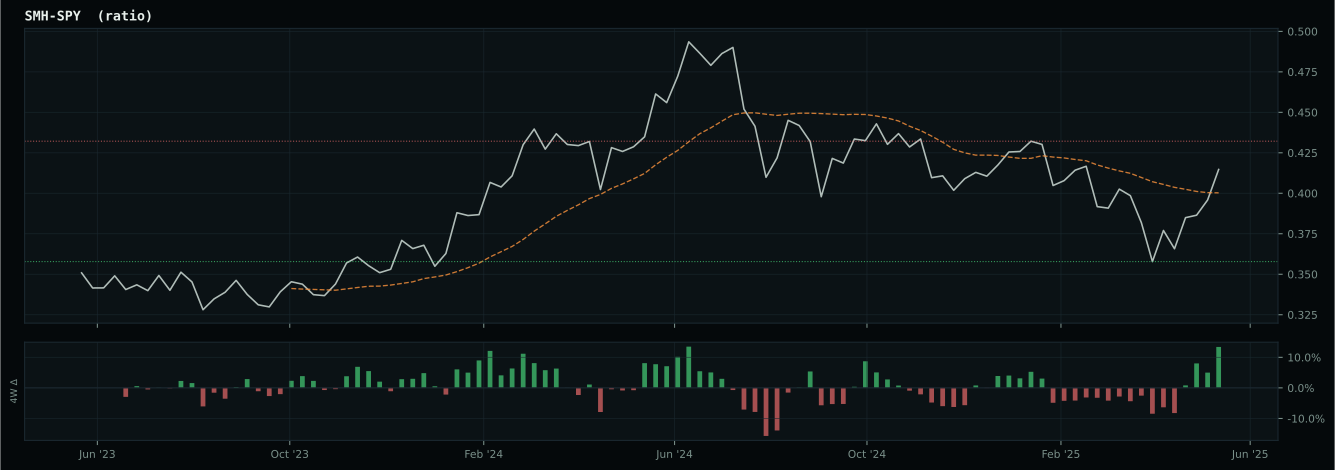
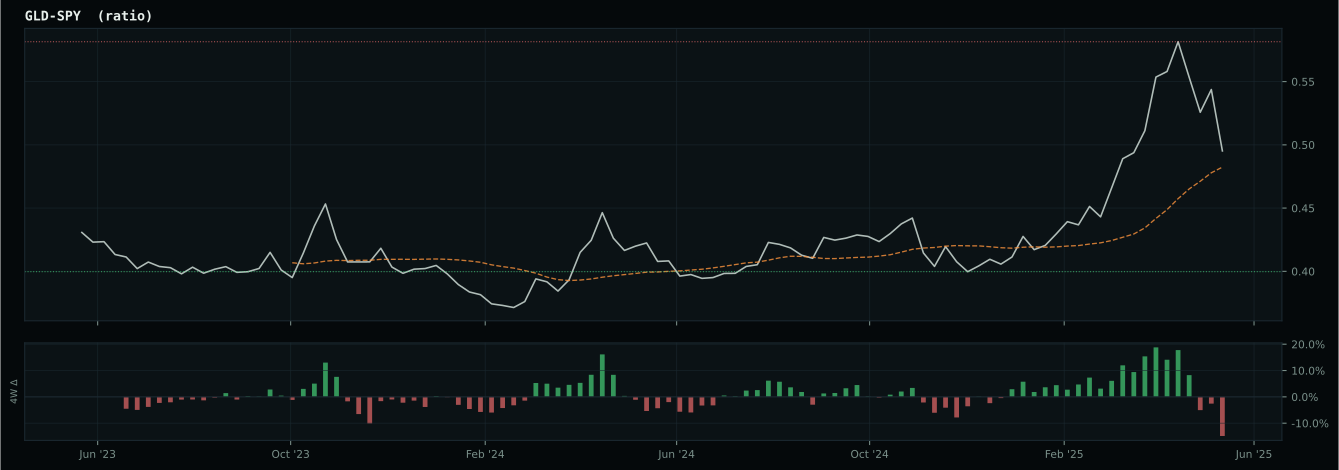
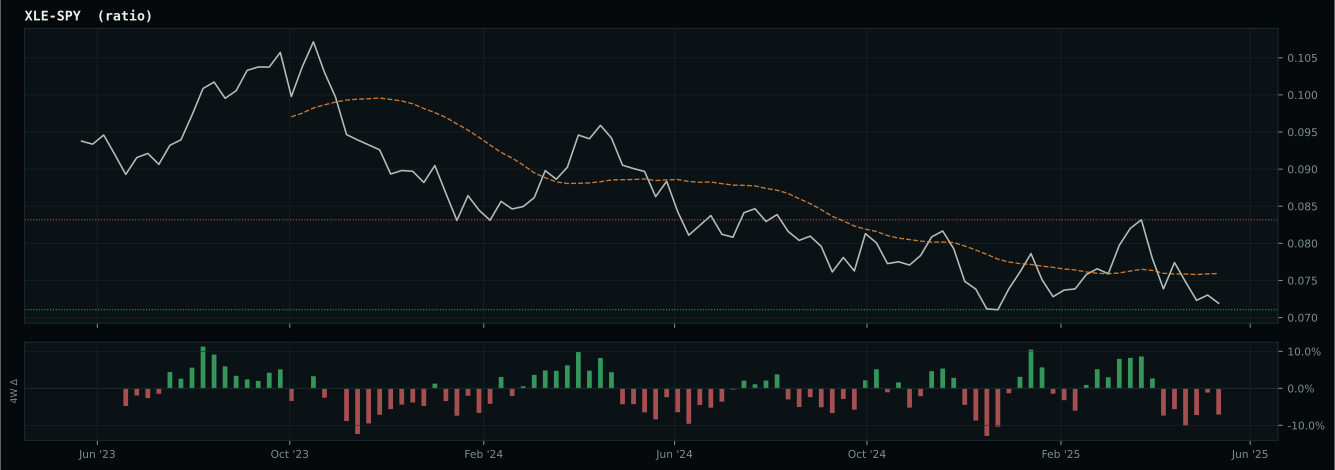
growth data is not confirming the weak market-implied risk appetite signal
Macro Evidence Charts
Market-implied signals behind the macro regime scores. Each ratio compares two assets; the direction and slope of the ratio is what the macro engine reads.
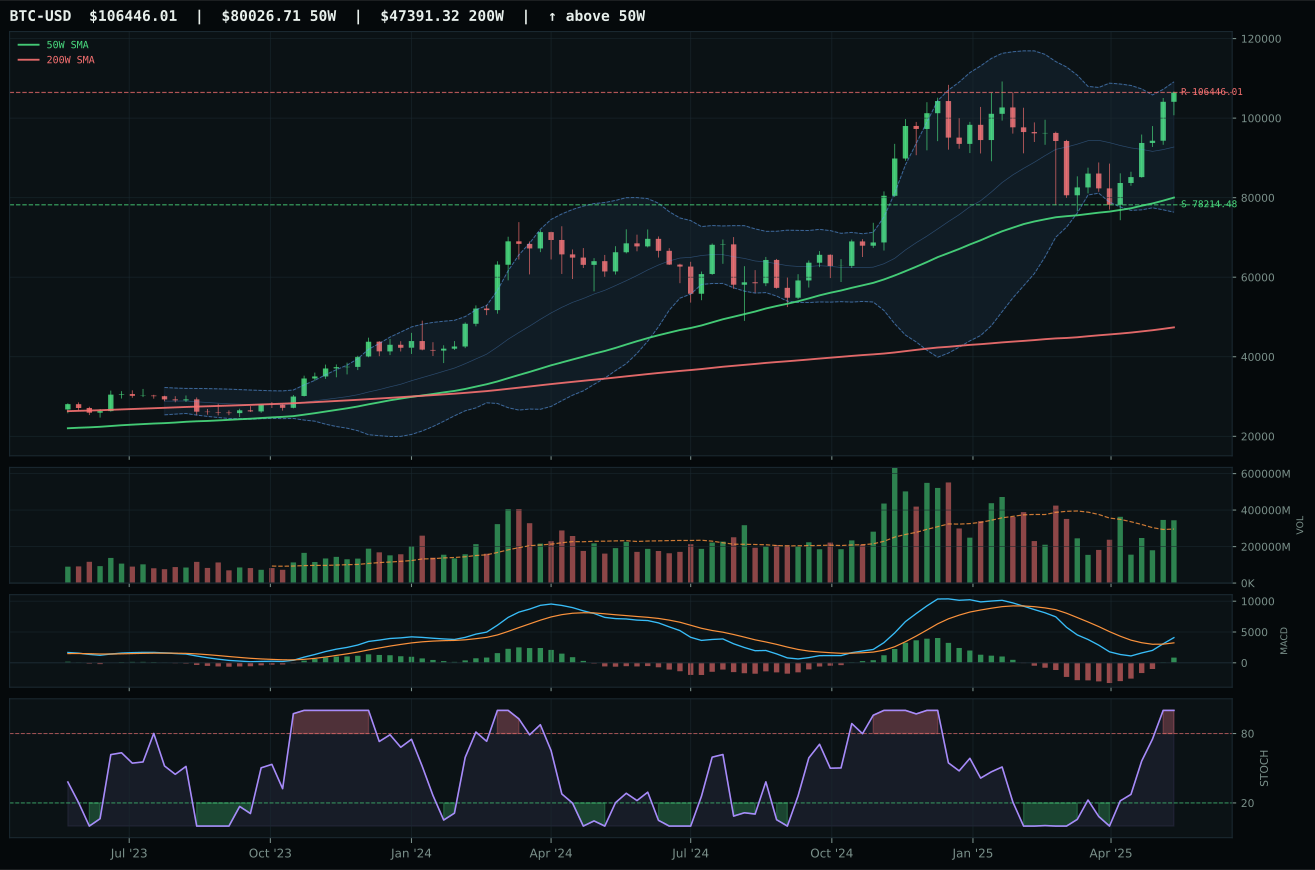
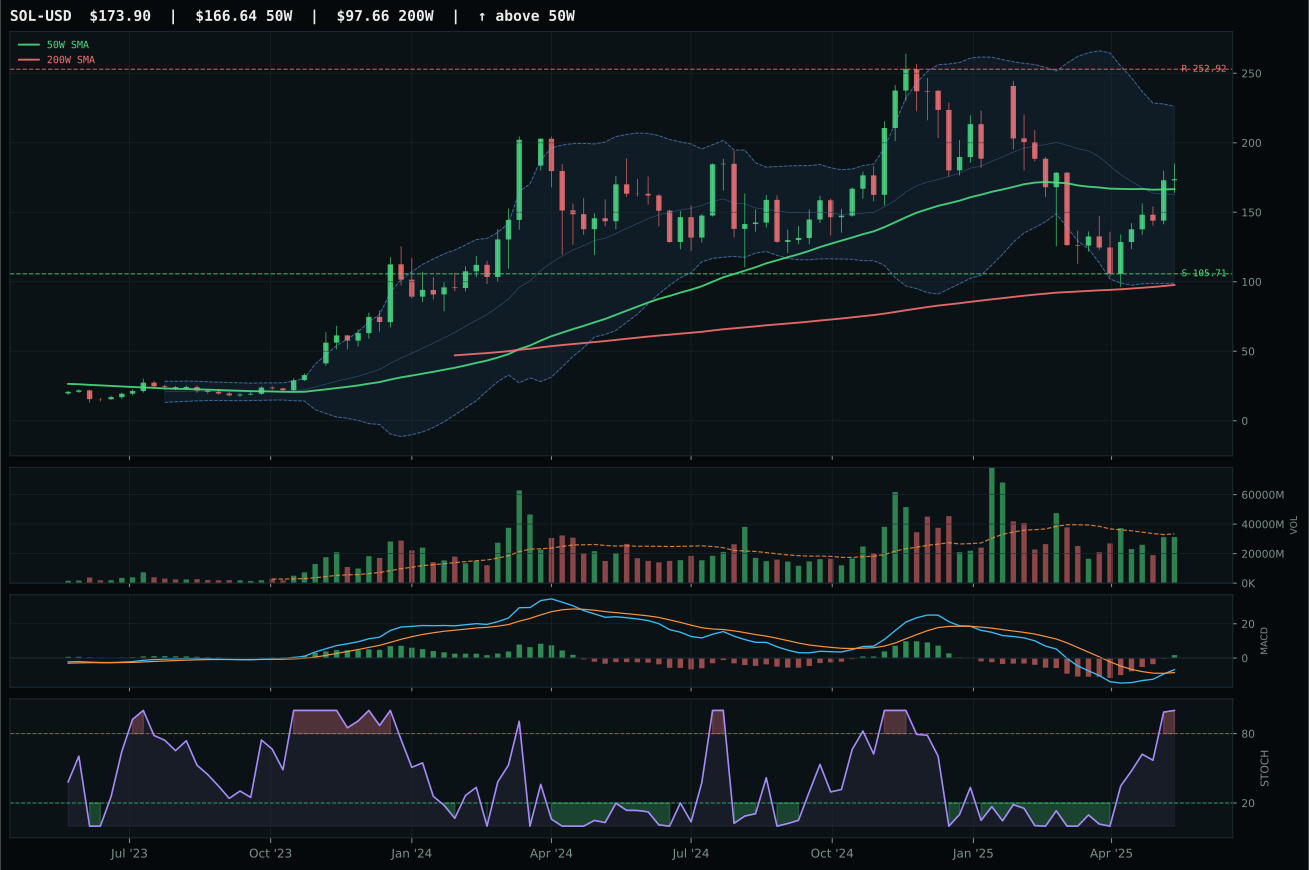
Crypto Regime — TrendBTC
ValueBTC not armed: BTC has not made the first post-breakdown touch of the 200W buy zone after losing the 50W
TrendBTC confirmed: 2 consecutive closes above rising/flat 50W SMA
one or more available conditions failed
Category Rankings
| Rank | Category | Winner | Score | Alloc | 4W Ret | Peers (4W) |
|---|---|---|---|---|---|---|
| 1 | Utilities & Infrastructure | PAVE | 79.9 | 20% | +1.20% | XLU +0.4% · IGF +1.0% |
| 2 | Precious Metals | GLD | 71.9 | 20% | +5.69% | GDX +14.0% · SLV +12.5% |
| 3 | Technology | XLK | 64.3 | 10% | +3.97% | CIBR +3.3% · IGV +2.9% |
| 4 | Emerging Markets | ILF | 64.1 | 10% | -0.93% | INDA +0.2% · IEMG +3.0% |
| 5 | Defense & Aerospace | XAR | 58.5 | 10% | +6.77% | ITA +5.9% · ROKT +6.1% |
| 6 | AI | SMH | 54.2 | 10% | +7.69% | AIQ +4.0% · BOTZ +1.8% |
| 7 | Nuclear Energy | URA | 51.0 | 10% | +40.29% | NLR +26.4% · URNM +27.0% |
| 8 | Industrial Metals | COPX | 18.1 | 10% | +10.66% | PICK +2.1% · REMX +4.9% |
| 9 | Agriculture & Livestock | MOO | 11.6 | 0% | +3.97% | VEGI +1.5% · WEAT +2.2% |
| 10 | Traditional Energy | XLE | 10.9 | 0% | +3.65% | XOP +5.8% · FCG +8.4% |
Utilities & Infrastructure — PAVE
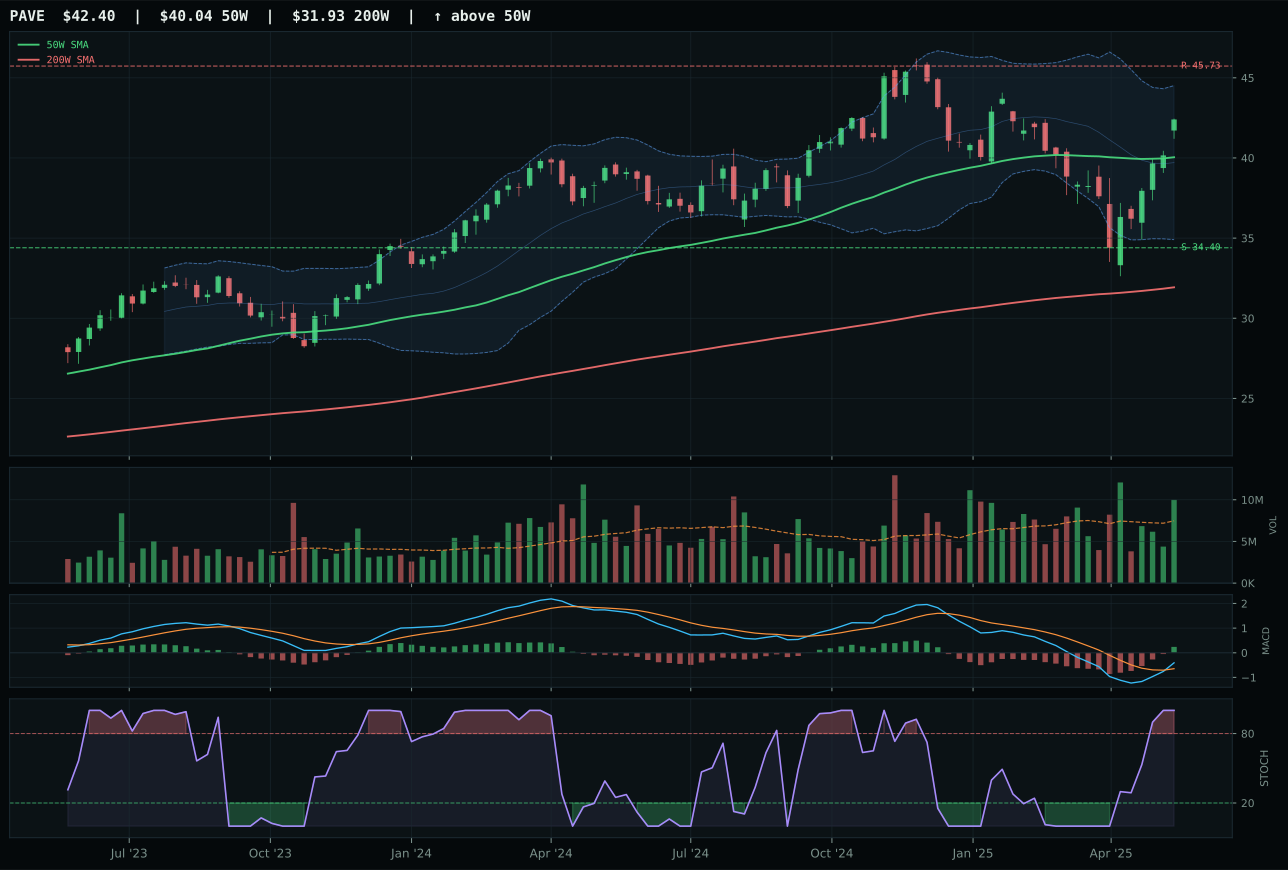
PAVE has a neutral structure profile with 3.7% 13-week relative strength versus SPY.
A failed hold above support would weaken the setup.
Actionable but governed by invalidation levels.
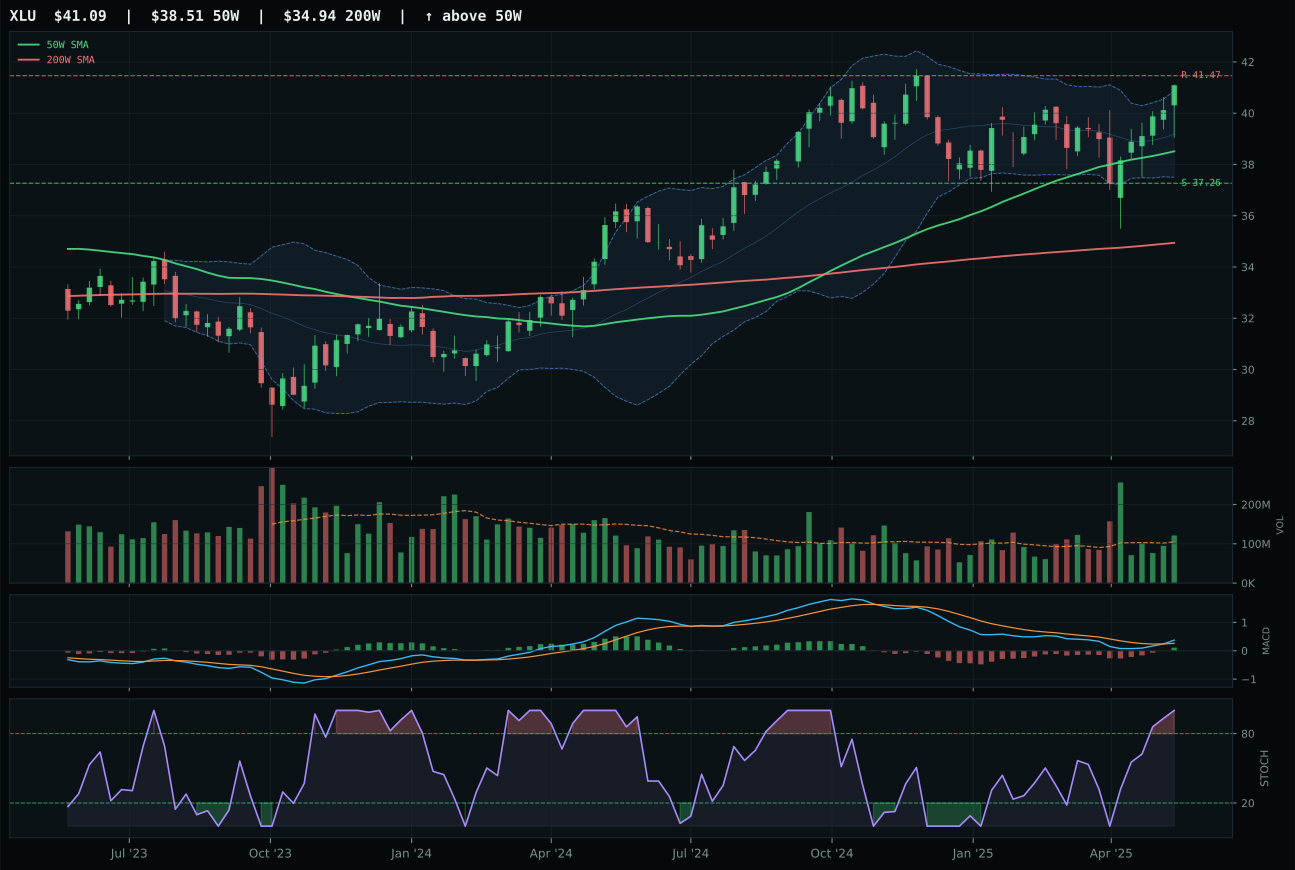
XLU has a neutral structure profile with 6.4% 13-week relative strength versus SPY.
A failed hold above support would weaken the setup.
Actionable but governed by invalidation levels.
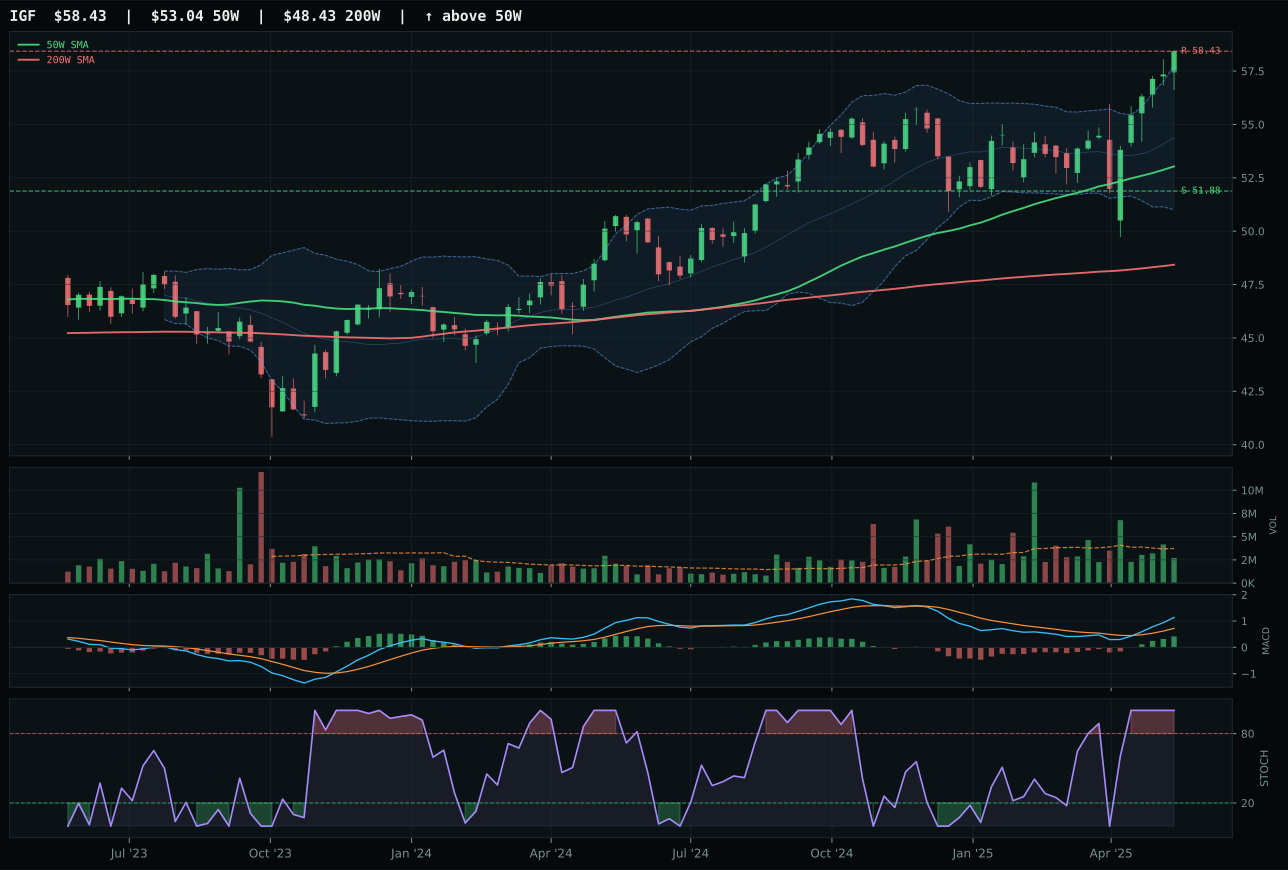
IGF has a neutral structure profile with 10.4% 13-week relative strength versus SPY.
A failed hold above support would weaken the setup.
Actionable but governed by invalidation levels.
PAVE captures top-two allocation with a narrow margin over XLU, winning on momentum confirmation and volume sponsorship in a photo-finish where risk/reward is the deciding factor. PAVE and XLU both trend at 100.0 with price above both moving averages, both show 75.0 timing despite PAVE at 5.9% from the 50W and XLU closer at 4.0%, and both carry overbought stochastic RSI. The seventeen-point separation in four-week returns (PAVE 17.1% vs XLU 3.9%) reveals the timing of institutional rotation: PAVE has captured the recent infrastructure capex bid faster. Risk/reward at 50.6 for PAVE versus 46.6 for XLU, combined with PAVE's above-average volume at 1.34x versus XLU's similar volume, tilts the balance toward PAVE. Both show MACD bullish and improving, but PAVE's recent four-week acceleration suggests buyers are committing to domestic infrastructure exposure more aggressively than regulated utility defense. XLU's superior macro fit (68.0 versus PAVE's 44.0) reflects defensive rotation (+12) and disinflation pressure (+6) favoring stable cash flows, yet PAVE's technical momentum is current while XLU's macro alignment is backward-looking.
Utilities & Infrastructure earns top-2 overweight at 10% allocation because the category score of 79.9 ranks among the highest across all 10 categories and macro fit is exceptionally strong at 76.0. PAVE's technical evidence of 85.5 combines with a macro narrative that is actively bullish: defensive rotation contributes +12, disinflation pressure adds +6, and the broader disinflation regime provides +7 additional support. This is the second-strongest macro case in the portfolio after Precious Metals, and the technical setup is equally clean. PAVE's 1.1% 13W return and modest 3.7% SPY relative strength might appear pedestrian next to more volatile categories, but that flatness reflects core infrastructure positioning: utilities and capex-driven assets are not momentum plays, they are portfolio anchors that hold value during demand destruction. The 10% allocation reflects confidence that this category will provide downside cushion alongside positive carry if disinflation accelerates. XLU's 68.0 macro fit is superior on defensive rotation benefits, yet PAVE's structural edge on risk/reward tipped the category representative decision. Both ETFs are suitable for long-term core positioning; PAVE captures slightly tighter entry risk with identical macro conviction.
Precious Metals — GLD
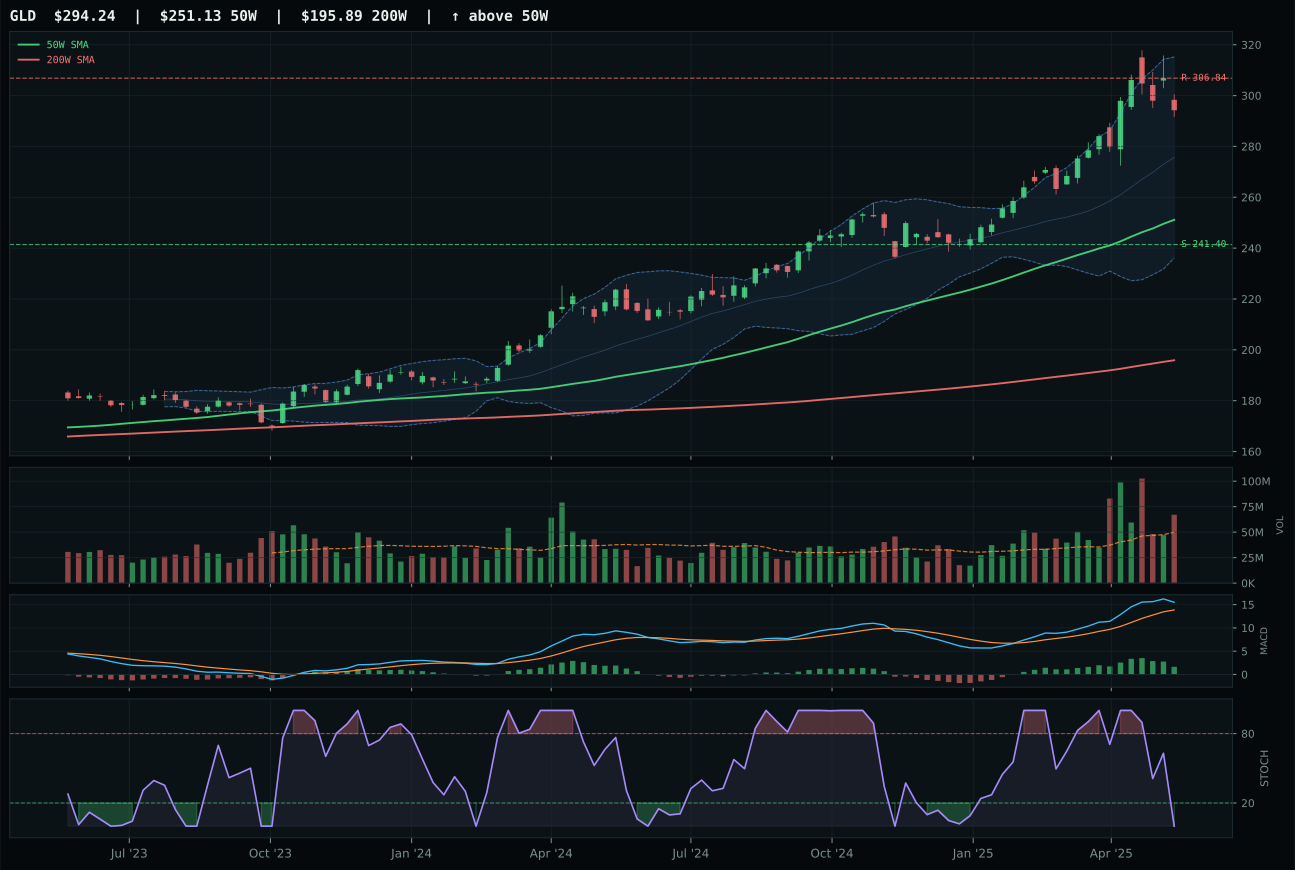
GLD has a vertical extension profile with 13.0% 13-week relative strength versus SPY.
A failed hold above support would weaken the setup.
Actionable but governed by invalidation levels.
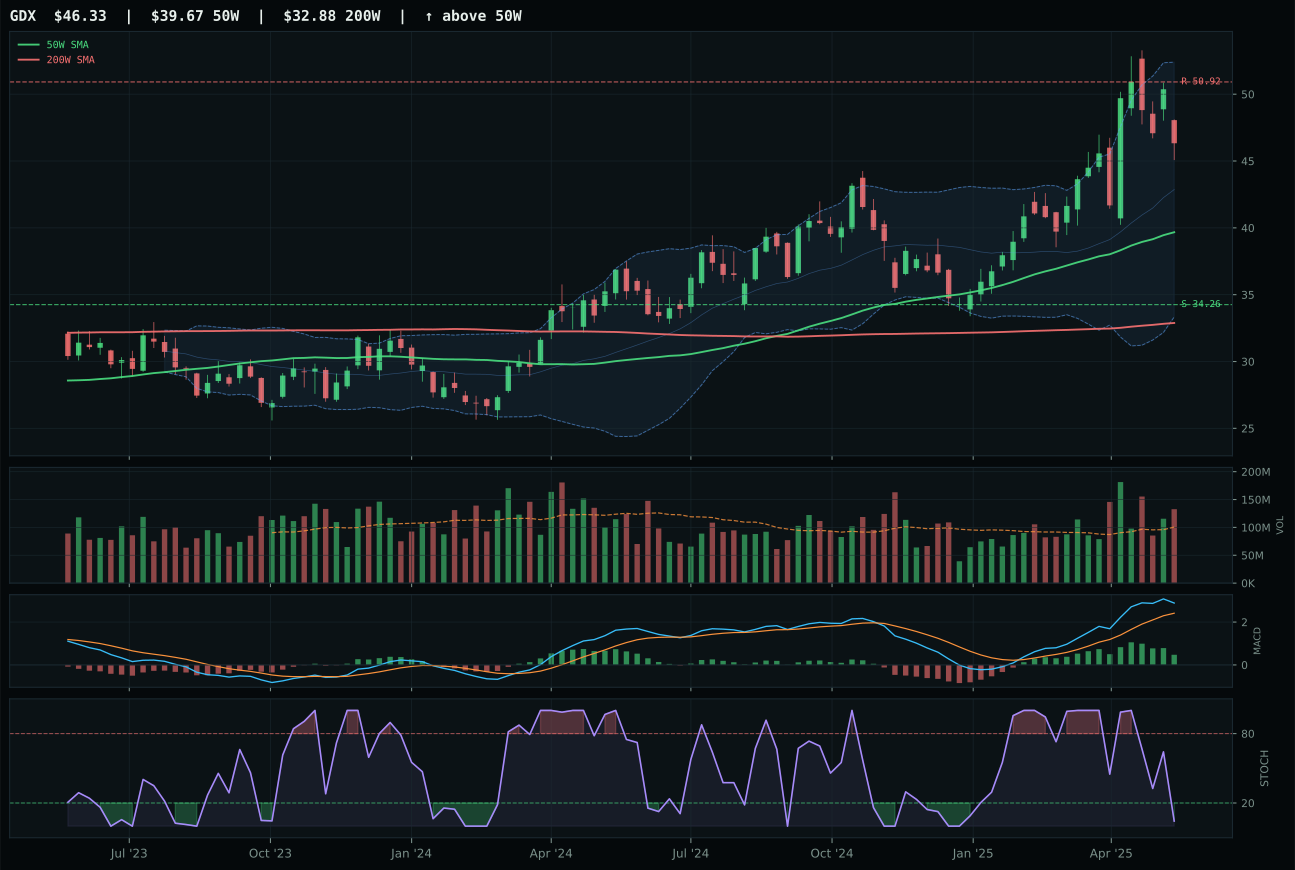
GDX has a vertical extension profile with 15.3% 13-week relative strength versus SPY.
A failed hold above support would weaken the setup.
Actionable but governed by invalidation levels.
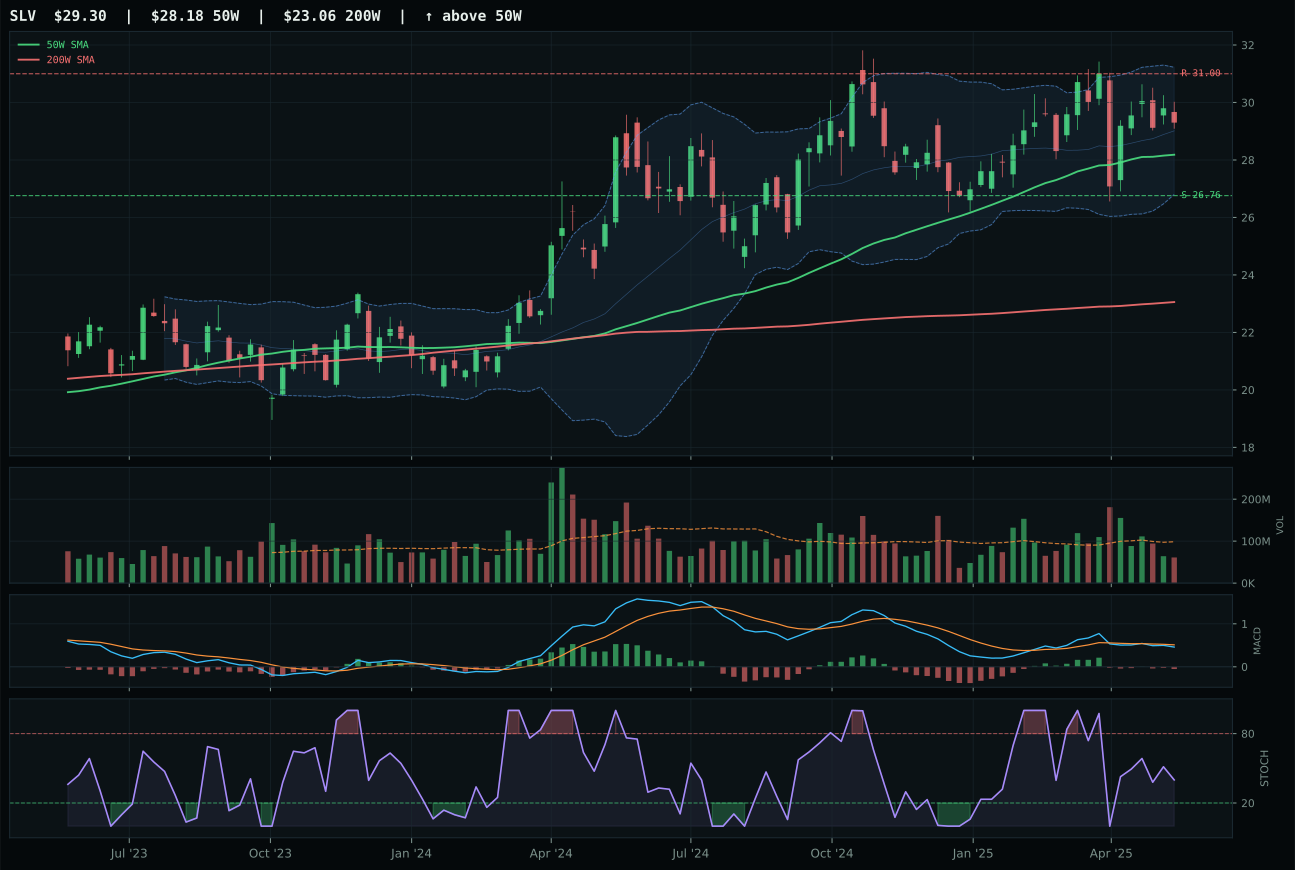
SLV has a neutral structure profile with 2.5% 13-week relative strength versus SPY.
A failed hold above support would weaken the setup.
Actionable but governed by invalidation levels.
GLD captures the top-two allocation with a 2.9-point victory over GDX, powered by macro tailwinds and cleaner structure despite comparable extended positioning. Both trade at vertical extension—GLD at 17.2% above the 50W, GDX similarly elevated—and both show identical 100.0 trend scores reflecting price above both moving averages. GLD's edge emerges from structure clarity (76.7 versus 72.0) and risk/reward (48.4 versus 34.6), factors that matter less than macro fit in this regime. The category-level macro fit of 85.0 is the highest among all ten categories, driven by monetary hedge bid at +14 points, disinflation pressure at +8, and defensive rotation at +6. GLD's macro fit of 78.0 reflects this positive alignment; GDX at 44.0 suffers from liquidity stress (-9) and risk appetite broken (-5), offsetting its superior thirteen-week return of 12.8%. The gold price itself is showing momentum confirmation at 85.6 despite flattening MACD and oversold stochastic RSI, signals that matter in a fed-cut environment.
Precious Metals earns top-2 overweight at 10% allocation because its macro timing is exceptional and technical setup is clean. The category score of 71.9 ranks in the top tier across all categories, driven by a macro fit of 85.0 that reflects the disinflation regime directly: monetary hedge bid is running +14, disinflation pressure is +6, and defensive rotation is active at +7. This is not speculative positioning; it is portfolio insurance becoming systematically attractive. GLD's 13W return of 10.5% and 13.0% SPY relative strength validate that the macro thesis is already moving price, yet the technical structure—while extended at 17.2% above the 50W—is supported by above-average volume and a timing score of 48.0 that acknowledges entry risk without dismissing the move. In a disinflation regime with liquidity stress active, gold becomes a core position, not a tactical hedge. The 10% allocation reflects confidence that this category will anchor portfolio stability if risk appetite deteriorates further. Upside risk is capped by extension and the 4.1% negative upside to resistance, making this a position-sizing exercise in capital preservation, not growth capture.
Technology — XLK
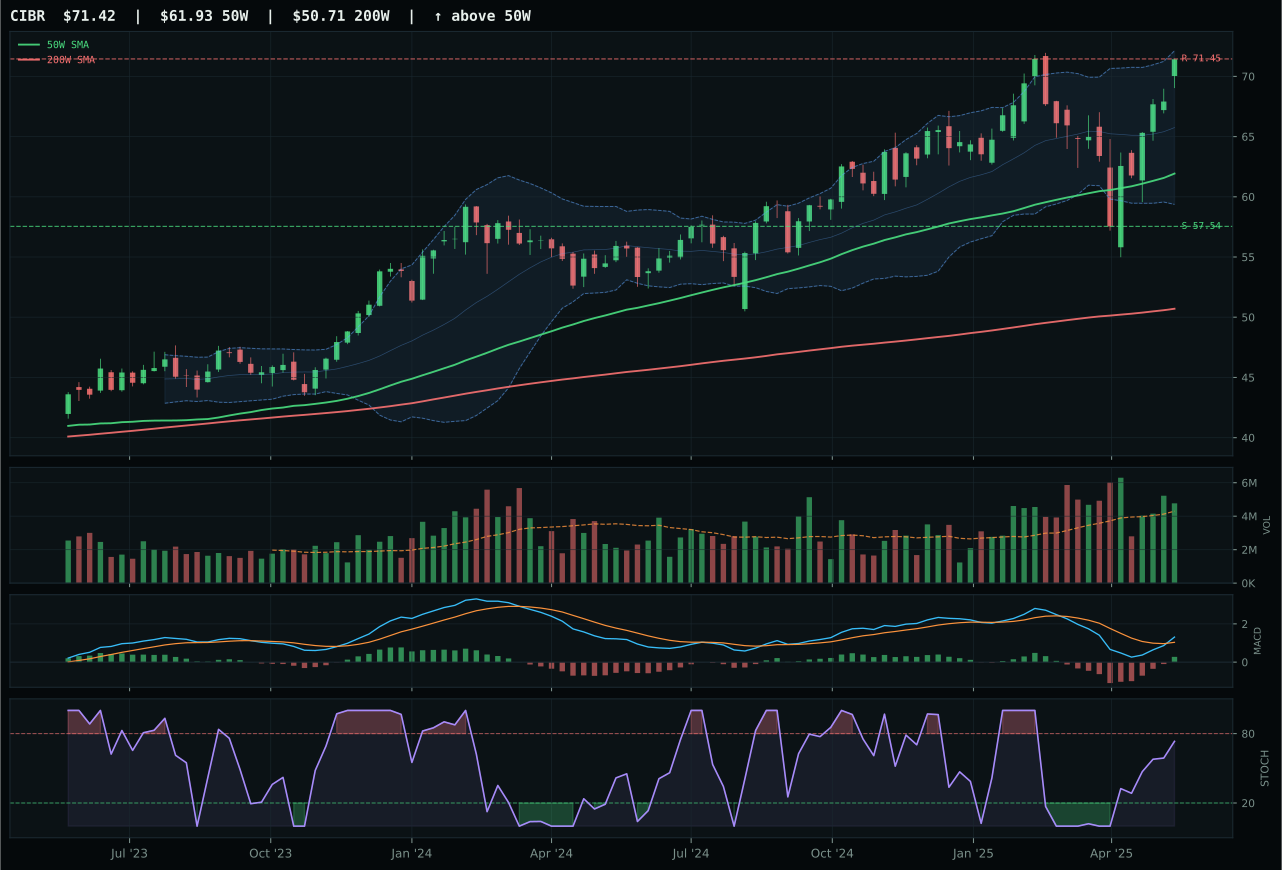
CIBR has a vertical extension profile with 2.5% 13-week relative strength versus SPY.
A failed hold above support would weaken the setup.
Actionable but governed by invalidation levels.
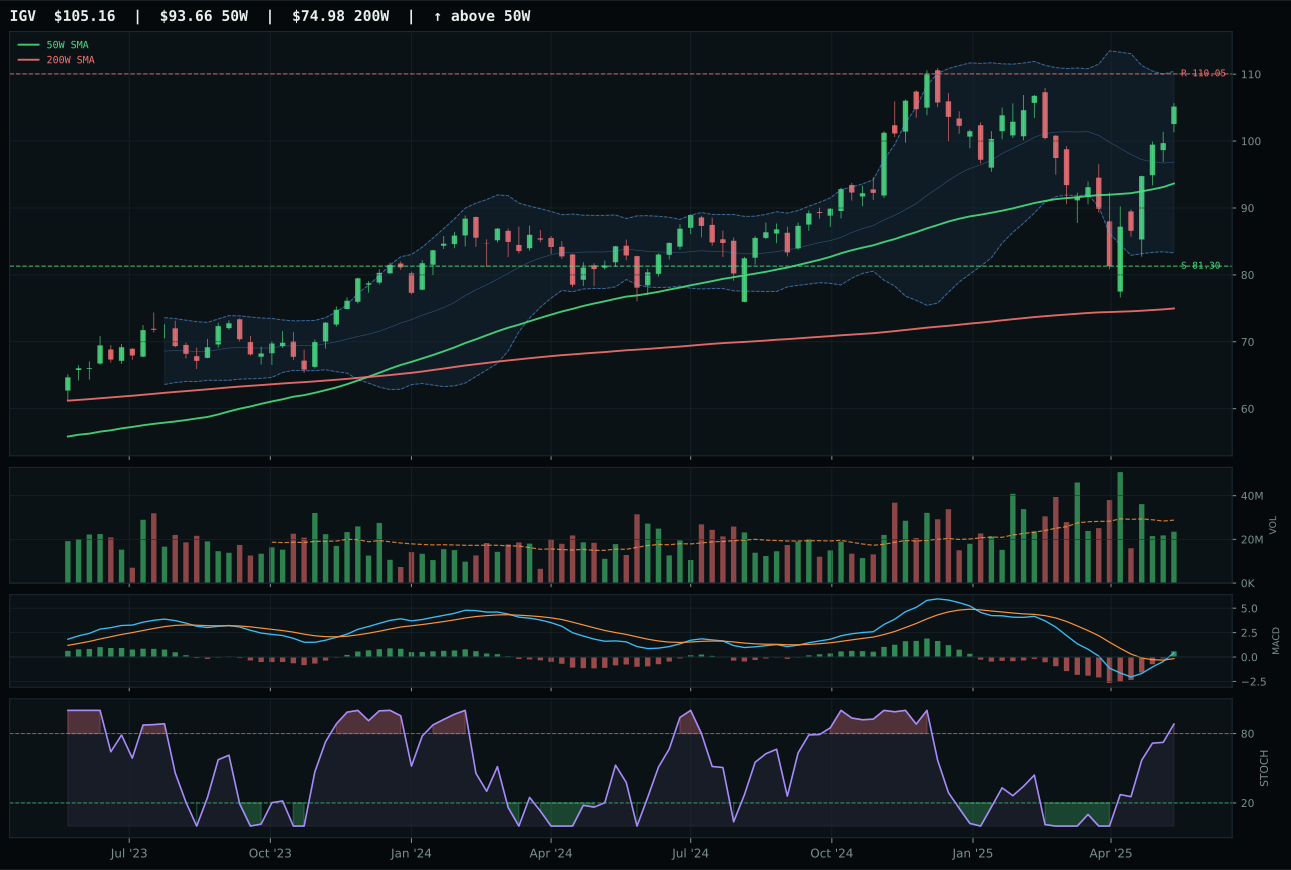
IGV has a neutral structure profile with 1.0% 13-week relative strength versus SPY.
A failed hold above support would weaken the setup.
Actionable but governed by invalidation levels.
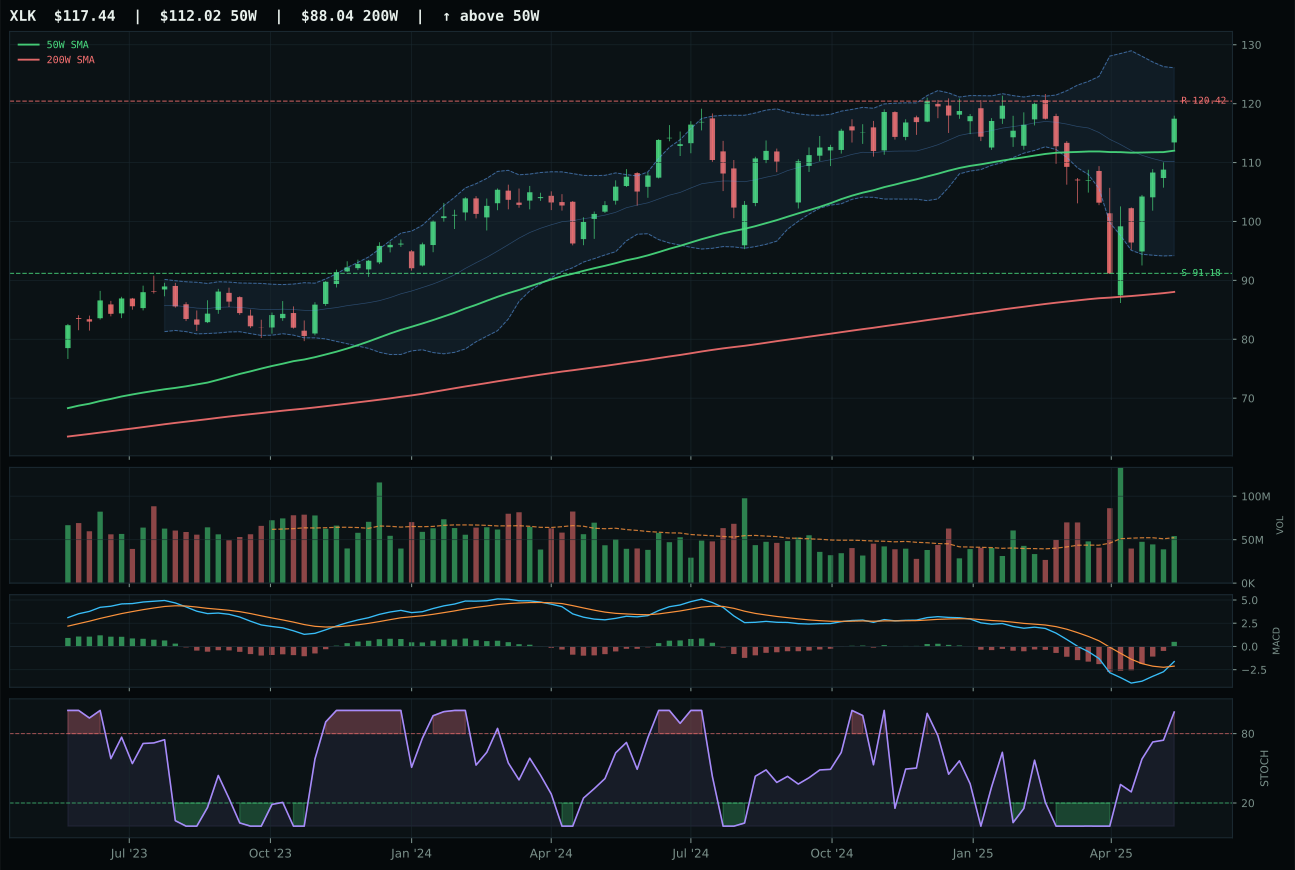
XLK has a neutral structure profile with 0.4% 13-week relative strength versus SPY.
A failed hold above support would weaken the setup.
Actionable but governed by invalidation levels.
XLK won the category because its timing setup is materially cleaner than CIBR's vertical extension. Price sits 5.0% from the 50W—close enough to offer entry without chasing extension—while CIBR trades 15.3% above its 50W, pushing risk asymmetry into the seller's favor. The timing score differential (82.0 vs 53.0) reflects this: XLK's neutral structure at the 0.786 Fib retracement zone offers a coiled entry where stochastic RSI overbought momentum can drive fresh accumulation, whereas CIBR's stretched setup means new buyers are already late. CIBR owns superior SPY relative strength at 2.5% versus XLK's 0.4%, but that strength came from the move already, not from current sponsorship. Volume confirmation is neutral for both, but structure quality and entry risk decisively favor XLK's tight proximity to the 50W.
Technology receives 5% allocation as a tier-2 category, holding a meaningful position despite ranking outside the top-2 overweights. The category score of 64.3 reflects a macro headwind that undermines the technical opportunity: disinflation is a modest +7 contributor, but active liquidity stress exerts a -10 penalty that prevents this category from reaching the highest allocation tier. XLK's technical evidence of 81.2 and bullish MACD/stochastic RSI structure cannot overcome a macro fit of just 41.0—defensive rotation and monetary hedge dynamics currently favor other categories more strongly. This is not a failing setup; it is a timing issue. Should liquidity stress ease or risk appetite rebound, Technology would likely graduate to tier-1 allocation. For now, the 5% slot provides exposure to profitable tech leadership while capital reserves remain available for categories with clearer macro tailwinds.
Emerging Markets — ILF
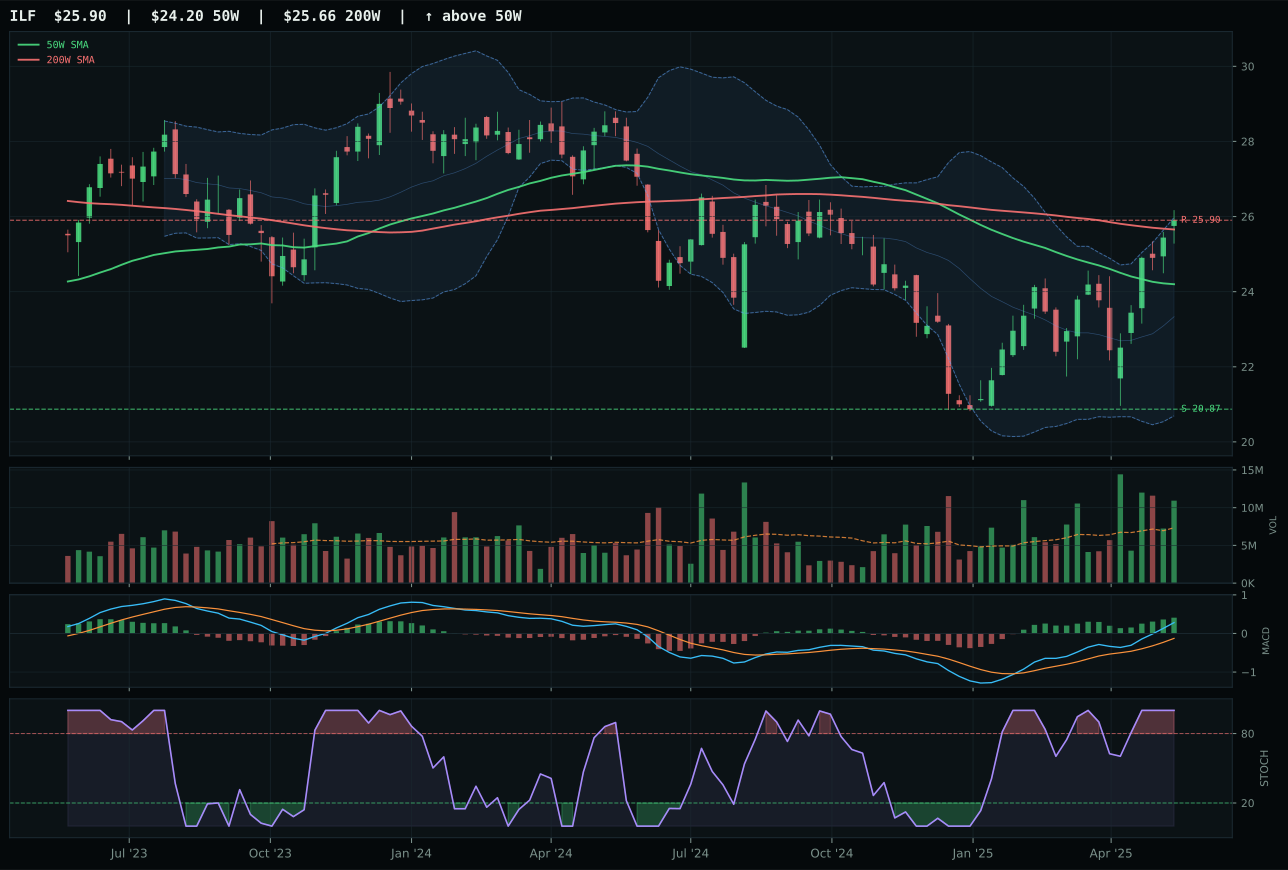
ILF has a neutral structure profile with 9.9% 13-week relative strength versus SPY.
A failed hold above support would weaken the setup.
Actionable but governed by invalidation levels.
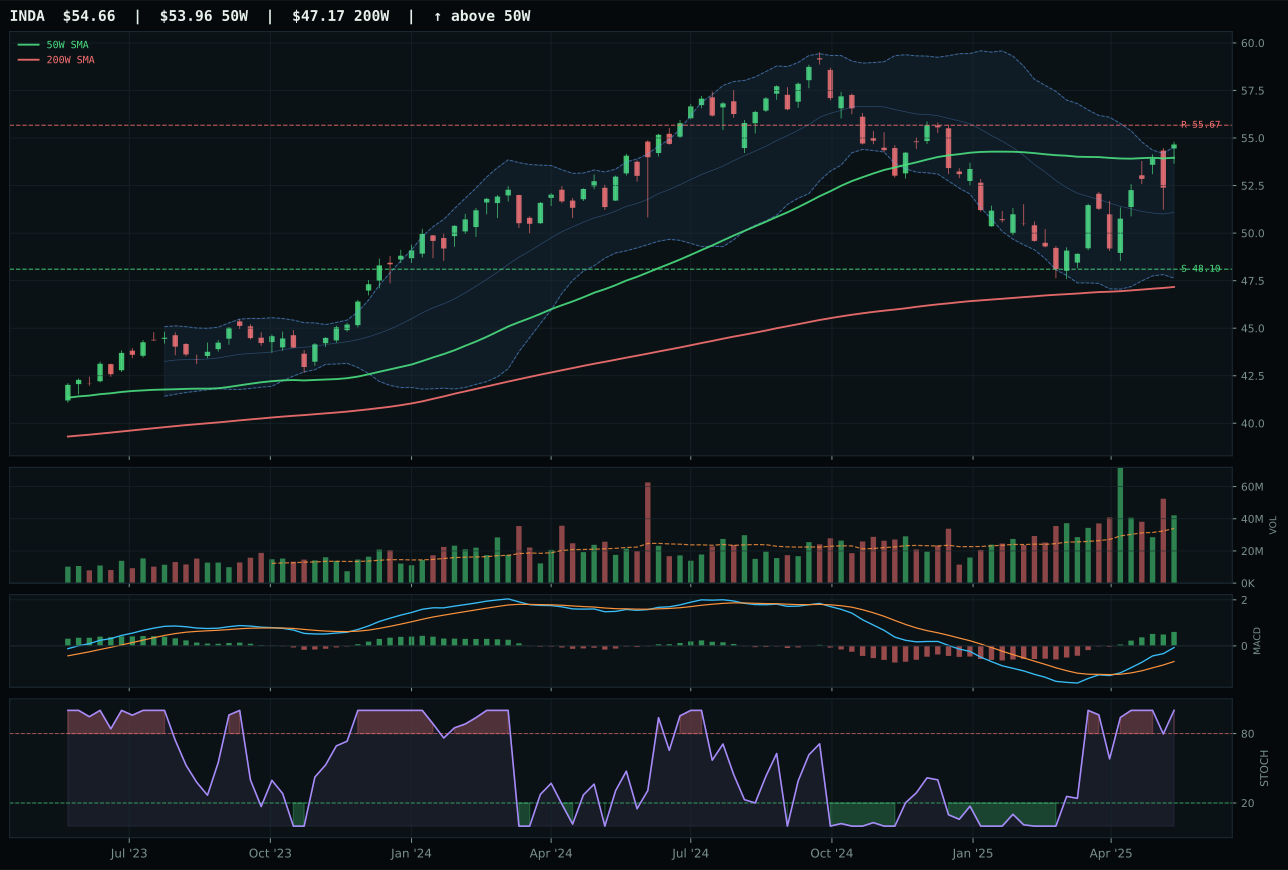
INDA has a compression near 50W profile with 12.8% 13-week relative strength versus SPY.
A failed hold above support would weaken the setup.
Actionable but governed by invalidation levels.
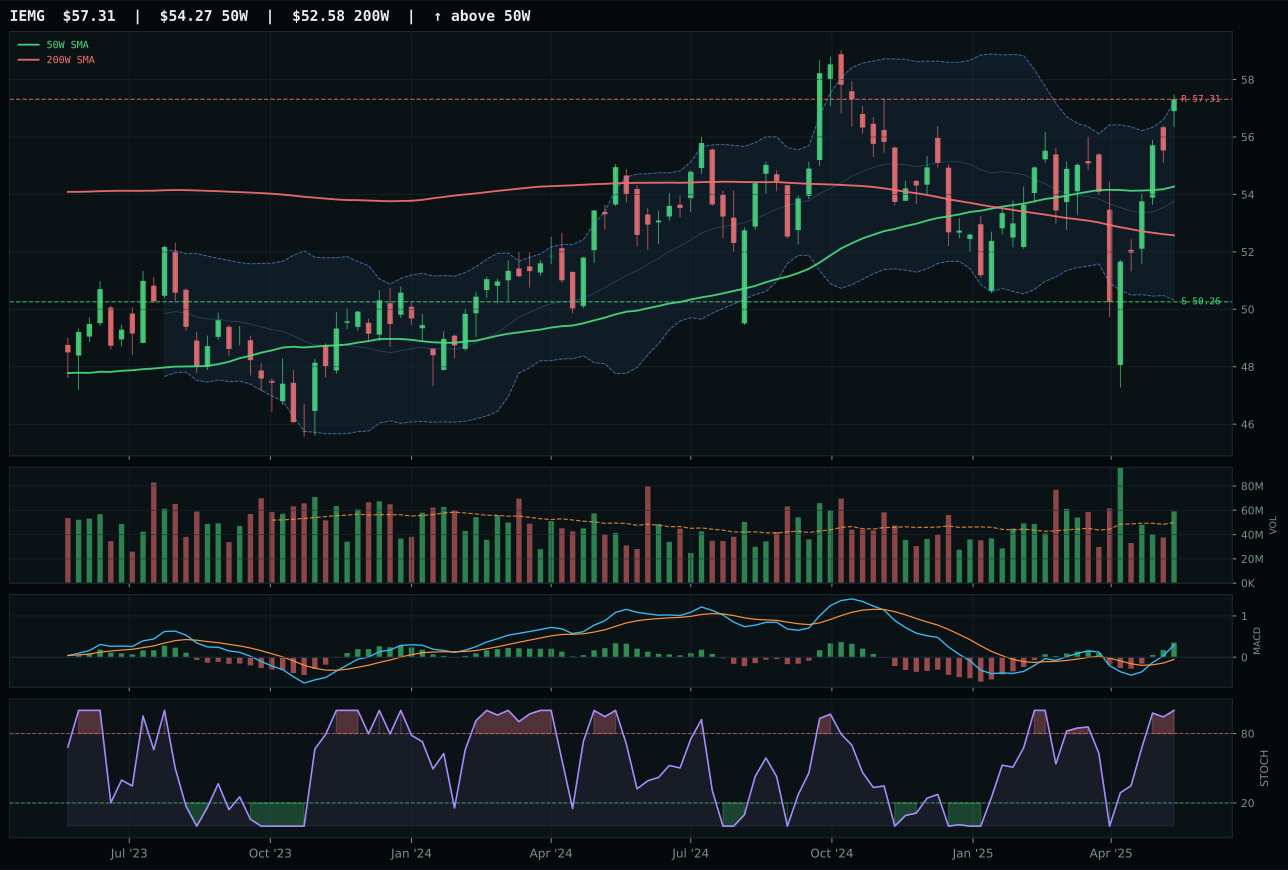
IEMG has a neutral structure profile with 6.9% 13-week relative strength versus SPY.
A failed hold above support would weaken the setup.
Actionable but governed by invalidation levels.
ILF prevails over INDA despite the latter's superior technical evidence of 99.3 versus 87.4, winning on structure clarity rather than momentum metrics. INDA scores 100.0 timing versus ILF's 75.0, but the category weighting at 62% technical proof versus 38% macro fit creates a threshold where INDA's perfect scores cannot overcome ILF's structural edge of 80.9 versus 77.6. ILF trades 7.0% above the 50W with neutral structure and above-average volume participation at 1.49x, while INDA compresses at the 50W with similar volume enthusiasm but less clean price action (compression versus neutral structure suggests INDA is choppy). Category-relative strength at 0.0% for ILF versus 2.8% for INDA seems to favor INDA, but relative strength metrics can penalize outperformance as late-trade exhaustion. Thirteen-week returns show ILF at 7.4% versus INDA at 10.2%, with INDA's superior return already captured. Four-week returns flip the script: ILF 10.5% versus INDA climbing from its compression setup. The representative reasoning layer selected ILF despite 15.2-point composite gap because structural quality trumps momentum continuation at this stage.
Emerging Markets receives 5% tier-2 allocation on technical qualification despite ranking outside the top-2 due to active liquidity stress that penalizes the entire category at -10 macro contribution. The category score of 64.1 represents clean technical setups across the board—all three ETFs (INDA, ILF, IEMG) own bullish MACD, overbought stochastic, and above-average volume participation—yet macro fit of only 40.0 reflects the current regime's headwind. ILF's 87.4 technical evidence and strong 4W return of 10.5% warrant the allocation as tactical exposure to Latin America's commodity and value beta, which typically outperforms during disinflation when growth expectations reset. The 5% position is defensive in structure: ILF's price 7.0% from the 50W with neutral upside to resistance (0.0%) suggests limited extension room, making this a positioning trade rather than a growth momentum chase. This category would graduate to top-2 if liquidity stress reversed—a -10 to +5 swing in that descriptor would immediately improve category macro fit from 40.0 toward the 60+ range needed for tier-1. Hold the emerging markets exposure as a tactical rebalance of growth beta into a regime where commodity cycles may stabilize.
Defense & Aerospace — XAR
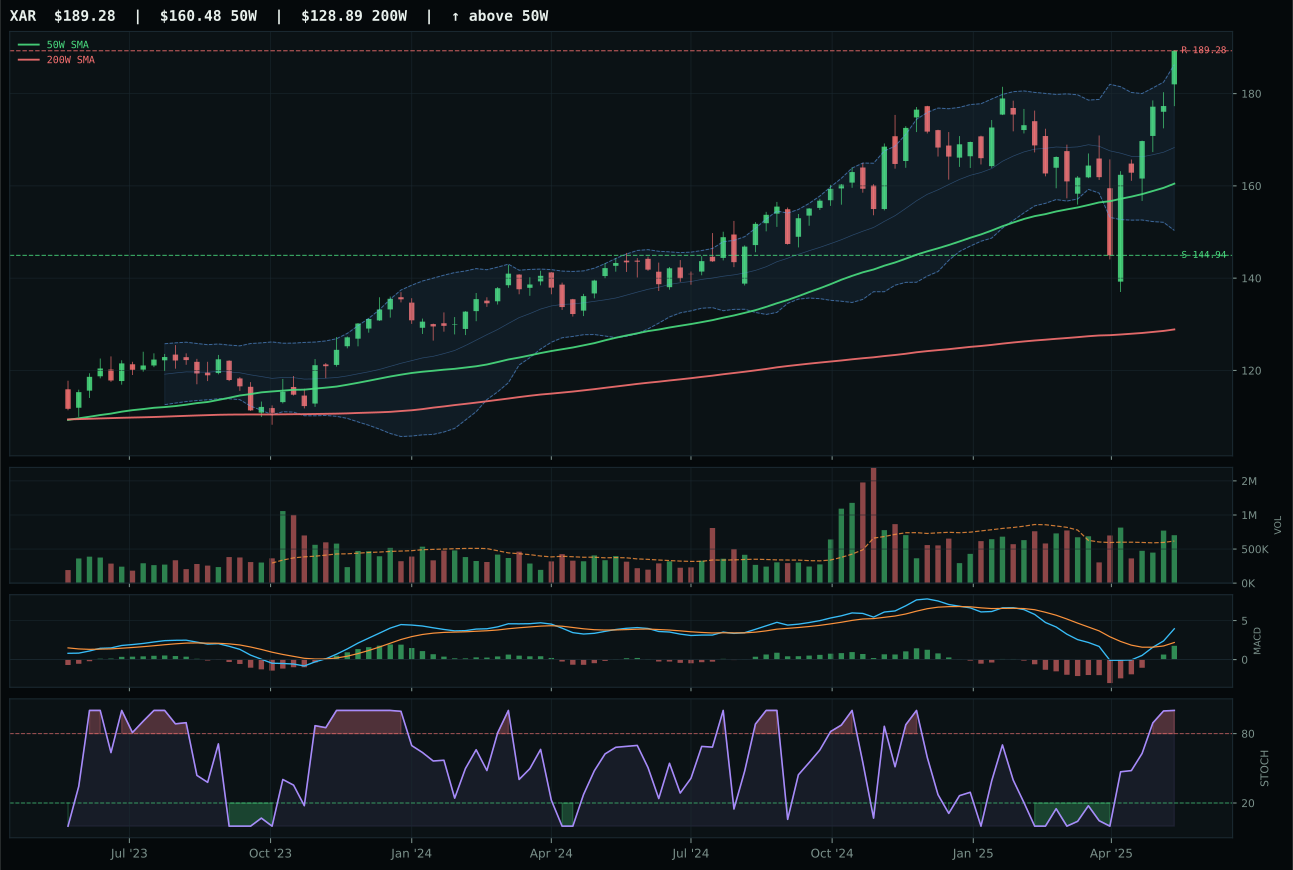
XAR has a vertical extension profile with 14.7% 13-week relative strength versus SPY.
A failed hold above support would weaken the setup.
Actionable but governed by invalidation levels.
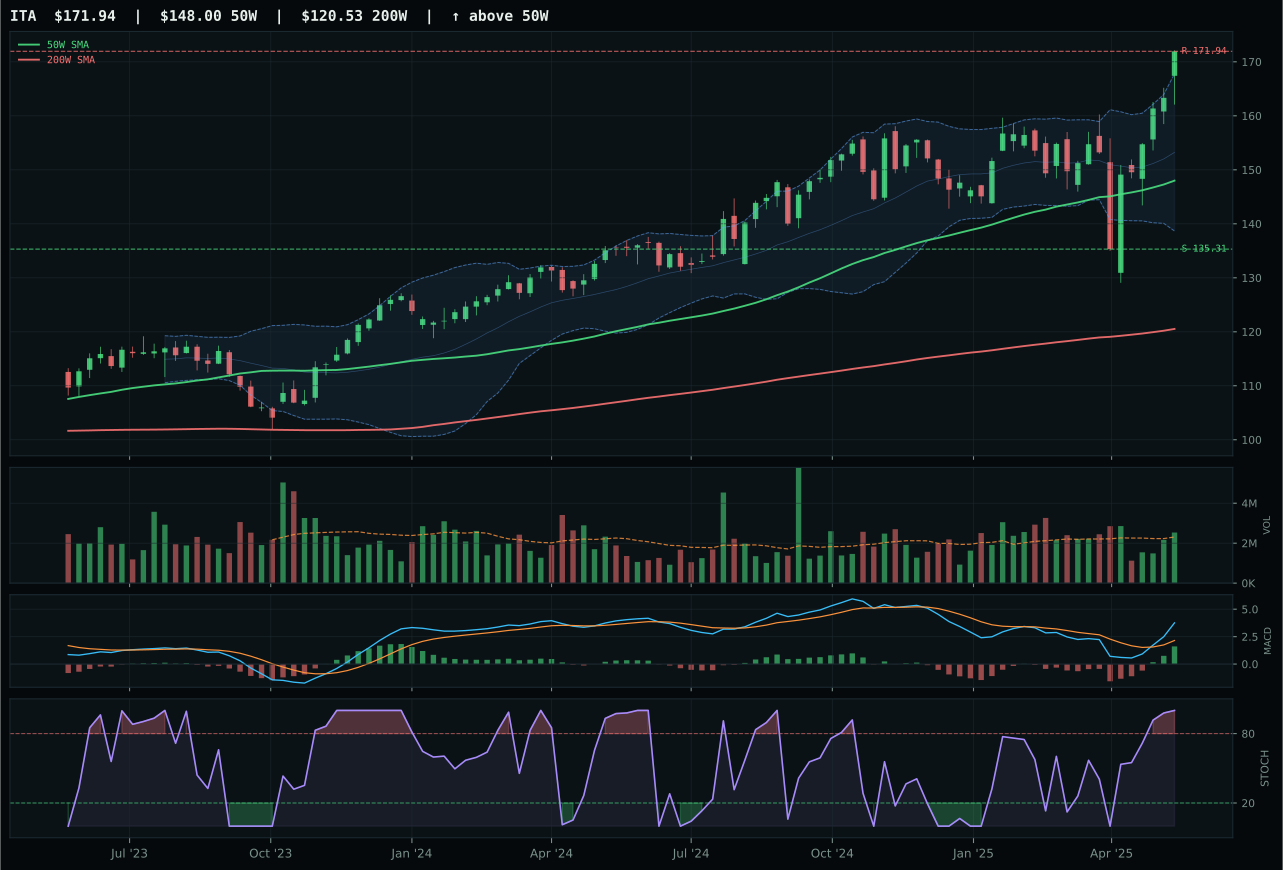
ITA has a vertical extension profile with 14.5% 13-week relative strength versus SPY.
A failed hold above support would weaken the setup.
Actionable but governed by invalidation levels.
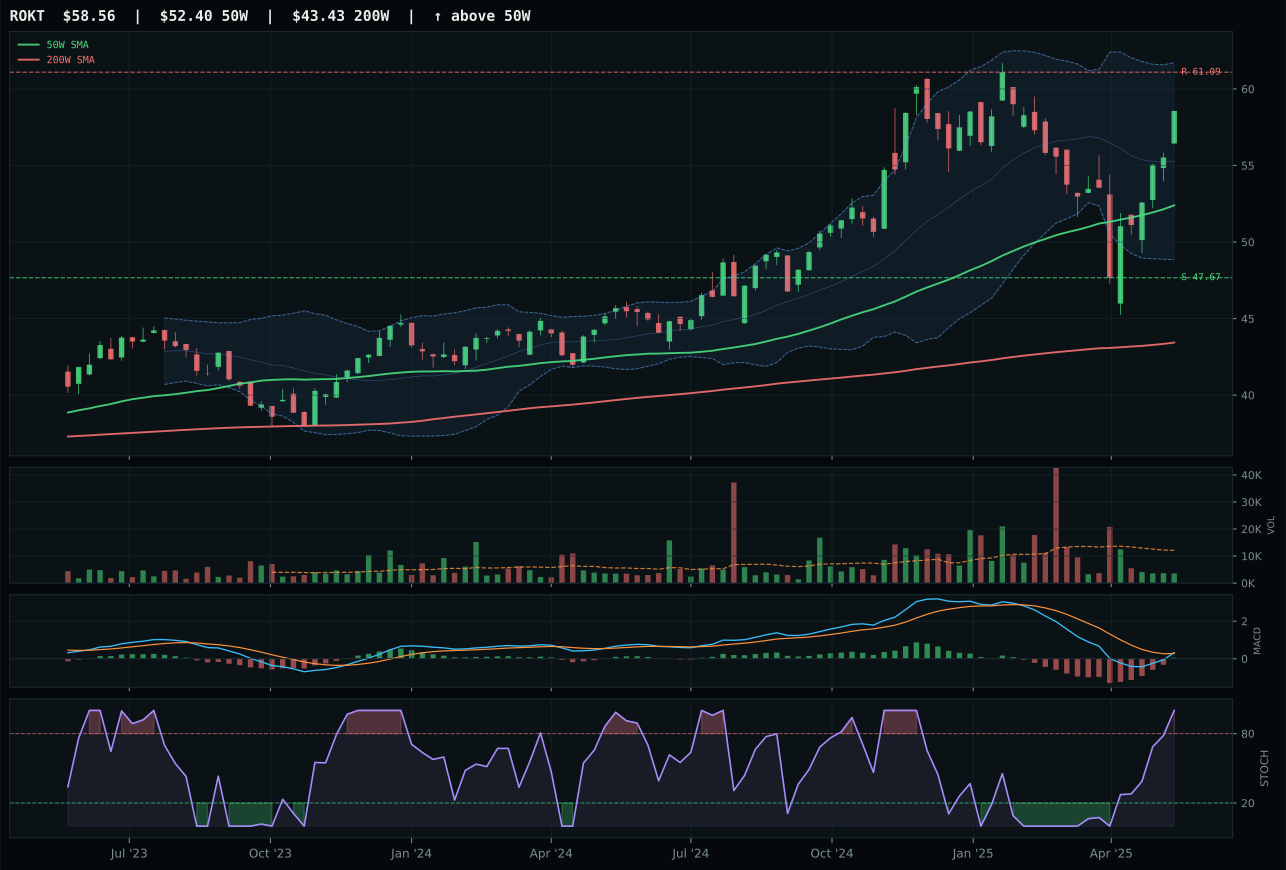
ROKT has a neutral structure profile with 4.7% 13-week relative strength versus SPY.
A failed hold above support would weaken the setup.
Tracked, but not top-2 eligible because: .
XAR edged ITA by the narrowest margin (0.3 points) because volume participation tipped the balance in an otherwise mechanical tie. Both sit at identical 37.0 timing scores—both extended 17-18% above the 50W, both trading near the 52W high with overbought stochastic RSI—and both carry identical 100.0 momentum confirmation scores. The differentiator: XAR's 1.14x volume above-average participation versus ITA's neutral volume. In a vertical extension setup with price at resistance, volume sponsorship becomes the deciding proof that accumulation is active rather than passive extension. XAR's 0.2% category-relative strength barely nudges ahead of ITA's 0.0%, and structure cleanliness is nearly identical (79.8 vs. 77.5), but when two setups are mechanically equivalent and both overbought, the one with stronger sponsorship from volume wins the tiebreak. This is a category where early buyers are comfortably long; new entry risk is high for both, but XAR's volume confirmation suggests institutional participation remains.
Defense & Aerospace scored 58.5 and ranks sixth, earning 5% allocation because the macro regime actively favors defensive positioning and XAR's volume confirmation validates the setup despite extended price. The category macro fit of 55.0 reflects genuine tailwind—defensive rotation is +8 and disinflation is +3—while both upside and downside risks are contained by structure (support 30.6% below, resistance at current levels). The tension is real: timing scores only 37 because price is 17.9% extended, yet volume-price confirmation at 74.2 and persistence at 76.5 prove the move isn't rolling over. This allocation is not a momentum chase; it's a recognition that disinflation plus defensive rotation can sustain extended moves in this category longer than normal mean reversion would allow. If volume participation rolls back below 1.0x and stochastic RSI fails to maintain overbought into next week, this slot should contract to 0% immediately.
AI — SMH
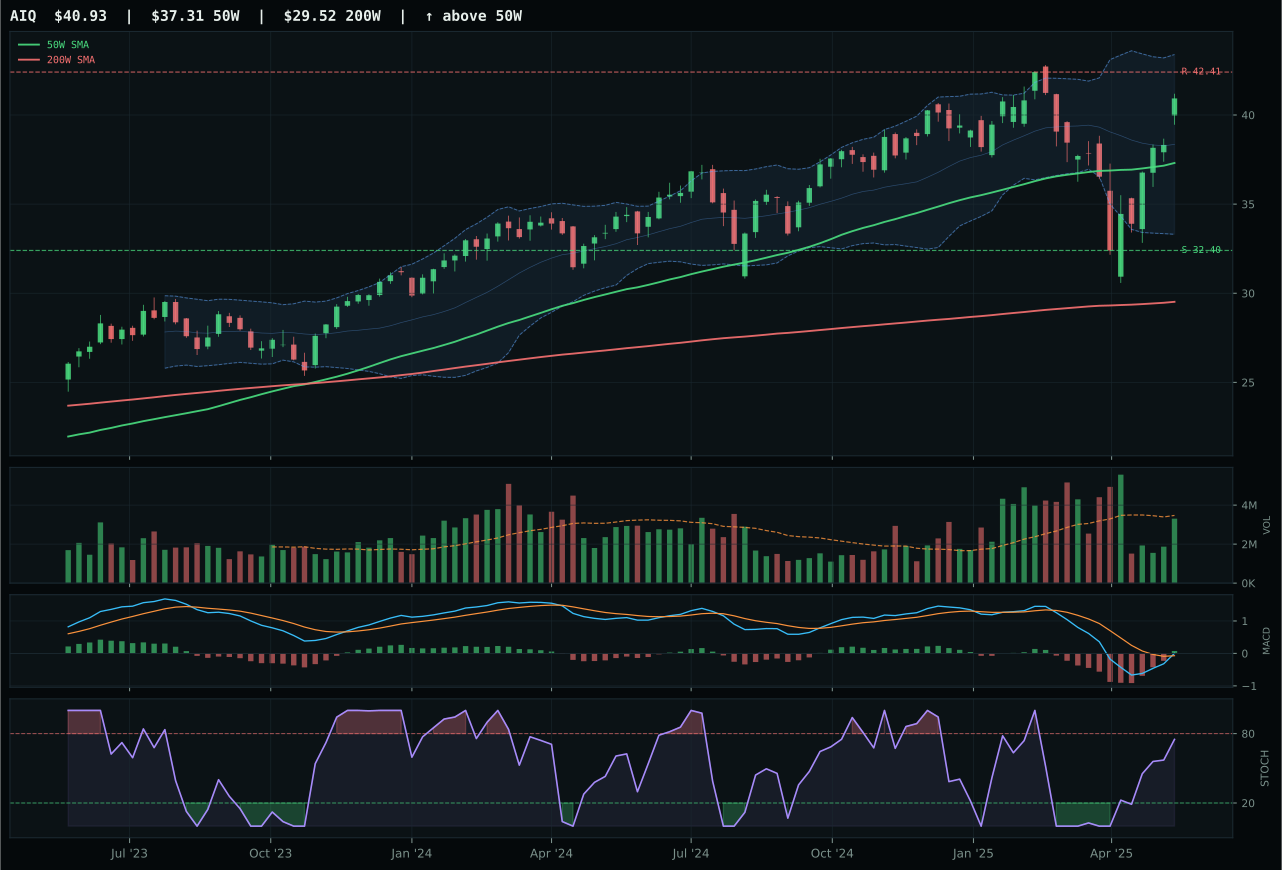
AIQ has a neutral structure profile with -0.9% 13-week relative strength versus SPY.
A failed hold above support would weaken the setup.
Actionable but governed by invalidation levels.
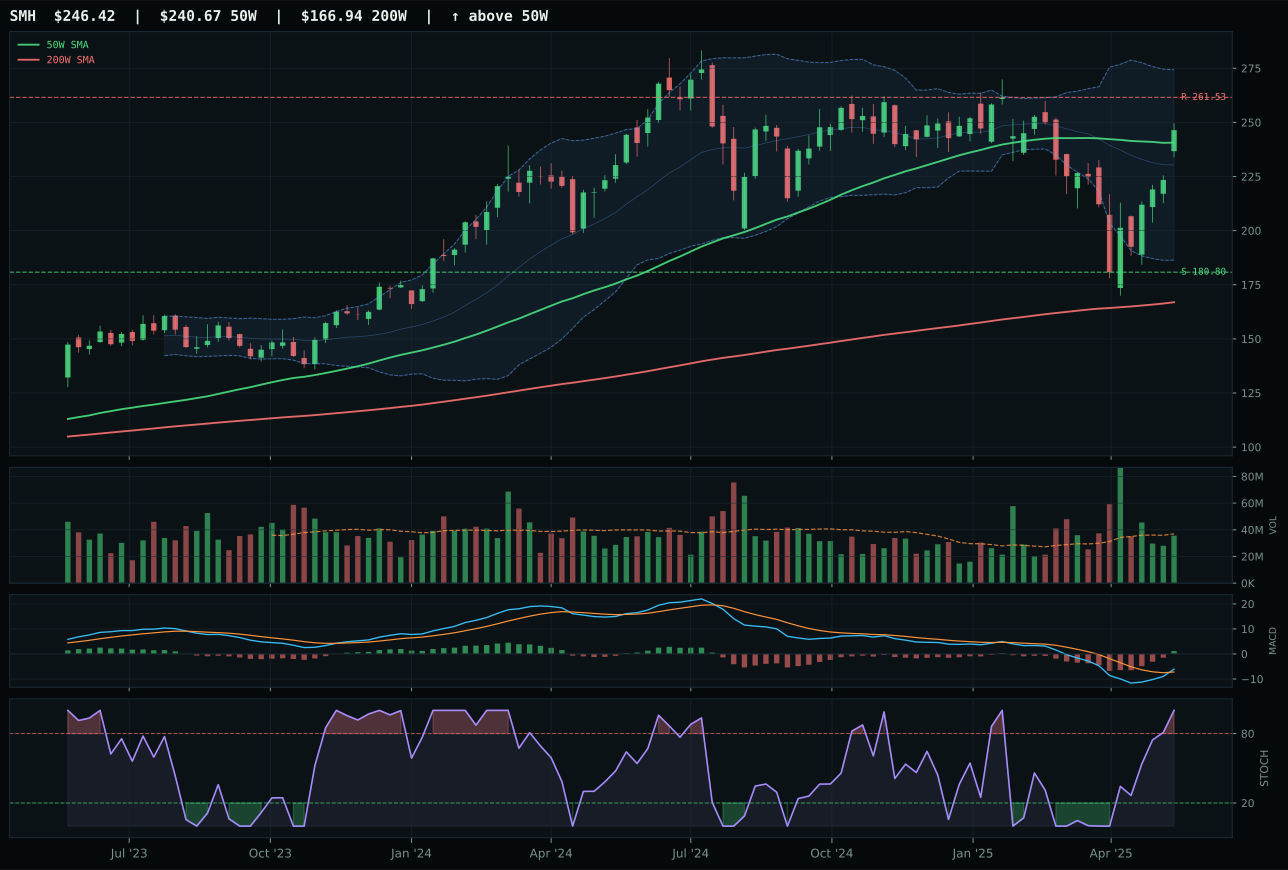
SMH has a compression near 50W profile with 0.1% 13-week relative strength versus SPY.
A failed hold above support would weaken the setup.
Actionable but governed by invalidation levels.
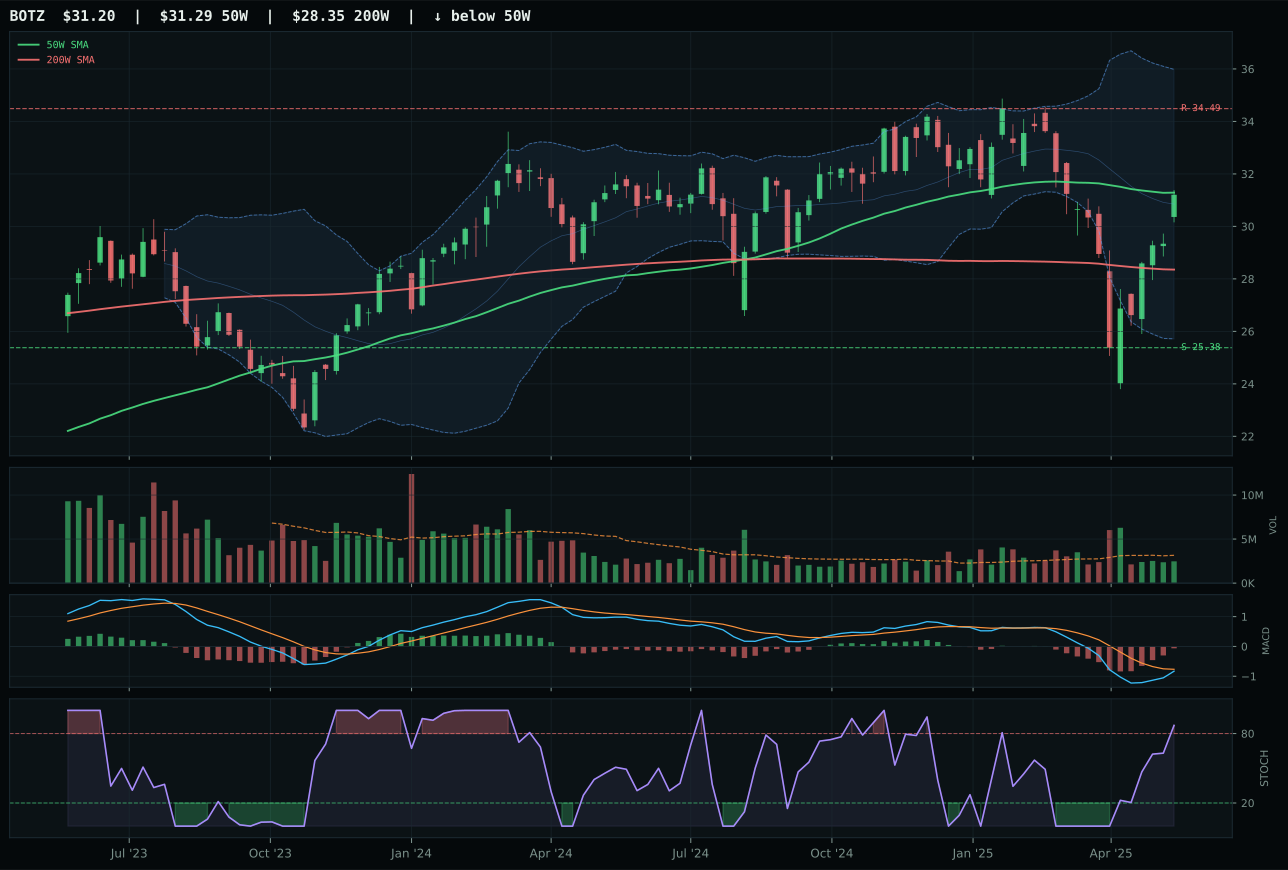
BOTZ has a compression near 50W profile with -5.2% 13-week relative strength versus SPY.
A failed hold above support would weaken the setup.
Actionable but governed by invalidation levels.
SMH claimed the category on timing and structural proximity alone. At 2.4% from the 50W with compression near the moving average, SMH offers a coiled entry where buyers can defend without chasing vertical extension; AIQ sits 9.7% above its 50W, forcing late entries into overbought technical terrain. Timing scores diverge sharply: SMH's perfect 100.0 reflects minimal distance to the 50W plus bullish/improving MACD and overbought stochastic, whereas AIQ's 83.0 penalizes the additional stretch. Category-relative strength swings 1.1% in SMH's favor—a small but meaningful edge in a compressed category field. Both carry neutral volume participation and identical MACD posture, yet SMH's margin-of-safety trade structure (upper retracement zone vs. upper momentum zone) allows accumulation to occur without requiring price confirmation from new highs. Risk/reward heavily favors the coiled setup: SMH offers 36.3% downside to support against -5.8% upside resistance asymmetry, whereas AIQ's extended setup compresses that margin.
AI scored 54.2, ranking below technology and precious metals, but earned 5% because its winner exhibits the exact compression-near-moving-average setup that precedes expansion in early bull moves. The macro picture is poor—liquidity stress at -12 points and risk appetite broken at -7—yet technical evidence is strong at 86.6, driven by SMH's perfect timing and momentum confirmation. This allocation is a tactical bet that buyers will defend the 180.80 support level in the coming week rather than a conviction play. The category macro fit of 43.0 is the weakest among allocated slots, so this position should be the first to trim if stochastic RSI oversold reverses into overbought without fresh volume, or if the 50W slope begins to flatten below zero. The real risk is that SMH's neutral volume at 0.96x the 20W average fails to confirm the setup—watch for above-average participation to validate this trade.
Nuclear Energy — URA
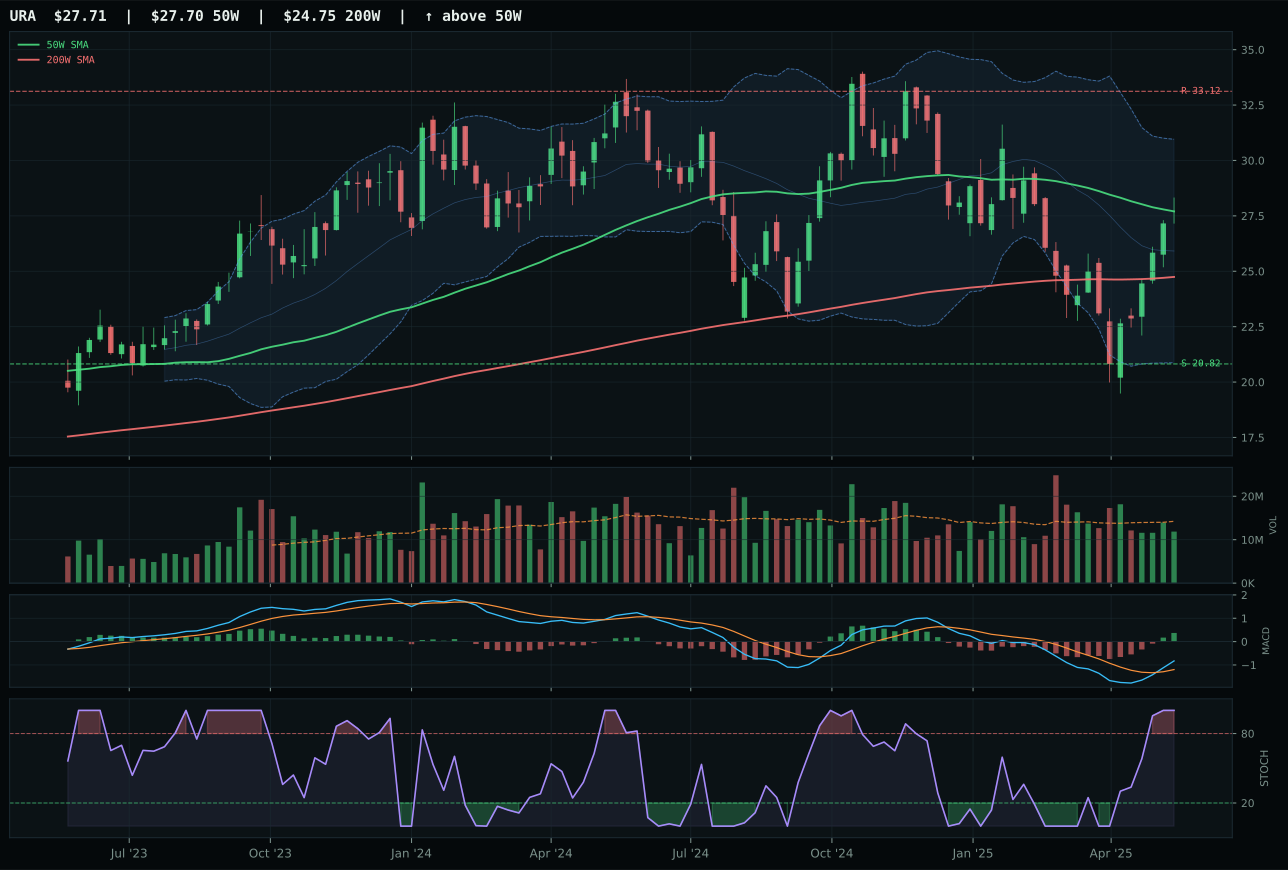
URA has a compression near 50W profile with 1.4% 13-week relative strength versus SPY.
A failed hold above support would weaken the setup.
Actionable but governed by invalidation levels.
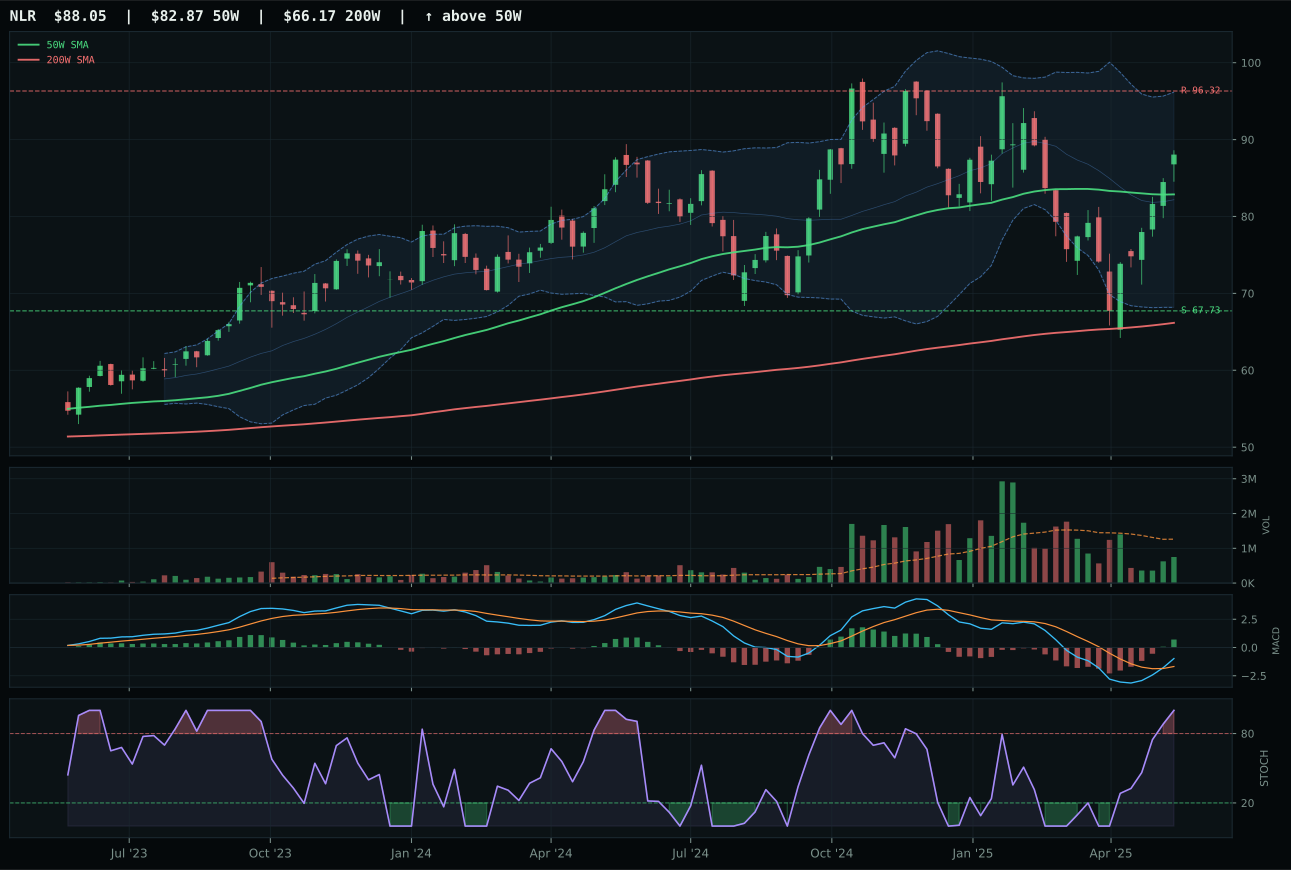
NLR has a neutral structure profile with 1.2% 13-week relative strength versus SPY.
A failed hold above support would weaken the setup.
Actionable but governed by invalidation levels.
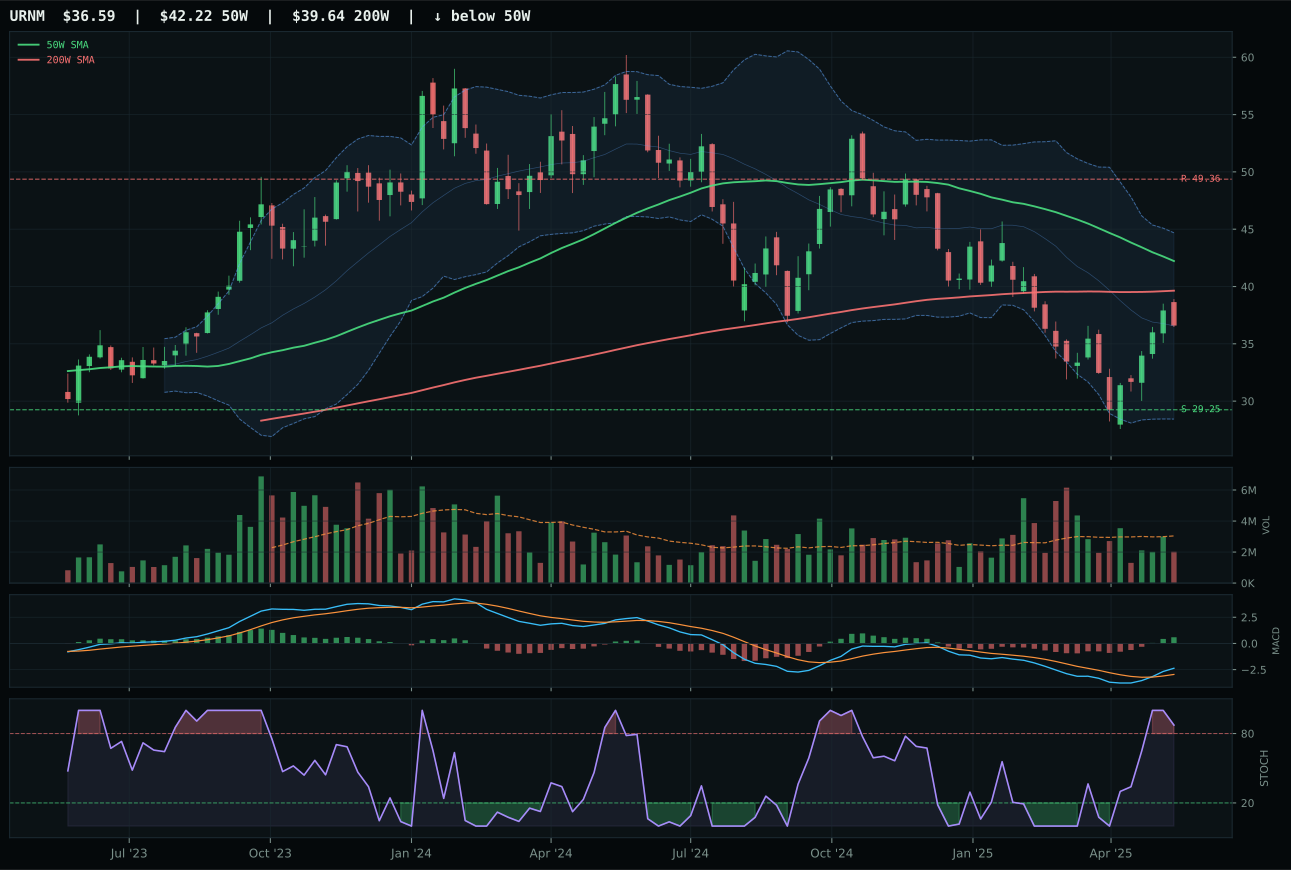
URNM has a neutral structure profile with -1.5% 13-week relative strength versus SPY.
A failed hold above support would weaken the setup.
Actionable but governed by invalidation levels.
URA wins with an 8.7-point margin over NLR by offering the rare setup of zero distance to the 50W combined with compression structure and perfect timing execution. Price at exactly the 50W (0.0% distance) with timing score of 100.0 versus NLR's 6.2% extension and 75.0 timing is the primary edge. Both show identical bullish and improving MACD and overbought stochastic RSI at 100.0 momentum confirmation, but URA's compression near the 50W creates expansion potential if buyers defend the level, while NLR at 6.2% extended leaves less room before exhaustion. Thirteen-week returns are nearly matched at -1.1% for URA versus -1.3% for NLR, but URA's 21.2% four-week return shows sharper recent acceleration. Risk/reward at 61.9 for URA versus 50.1 for NLR reflects URA's tighter structure: support at 20.82 is 33.1% below current, resistance at 33.12 is 16.3% above. NLR's wider range and thin volume participation (versus URA's neutral) signal lower institutional conviction. Category-relative strength is negligible for both (0.2% vs 0.0%), but the chart mechanics favor URA's coil setup over NLR's extension.
Nuclear Energy holds 5% tier-2 allocation despite a category score of 51.0 and neutral macro fit, qualified on pure technical merit in a regime where disinflation creates modest headwinds. URA's 87.1 technical evidence and 100.0 timing score represent clean chart structure that warrants capital, yet category-level macro fit of only 39.0 prevents top-2 advancement. Liquidity stress and broken risk appetite each subtract from the nuclear thesis, but no category-specific macro descriptor actively penalizes nuclear energy in a disinflation environment—utilities and defensive infrastructure are neutral, not wounded. The 5% allocation represents a core holding decision: URA is positioned correctly at the 50W with zero entry overhead, stochastic RSI overbought provides expansion potential, and 4W momentum of 21.2% confirms institutional participation is active. This category would graduate to top-2 if macro fit improved—a 50+ shift in the descriptor checklist would be driven by defensive rotation acceleration or monetization bids that benefit stable cash-flow assets. Hold this allocation because the setup is clean, not because macro certainty exists. Monitor for deterioration in volume confirmation or breakdown below the 20.82 support level.
Industrial Metals — COPX
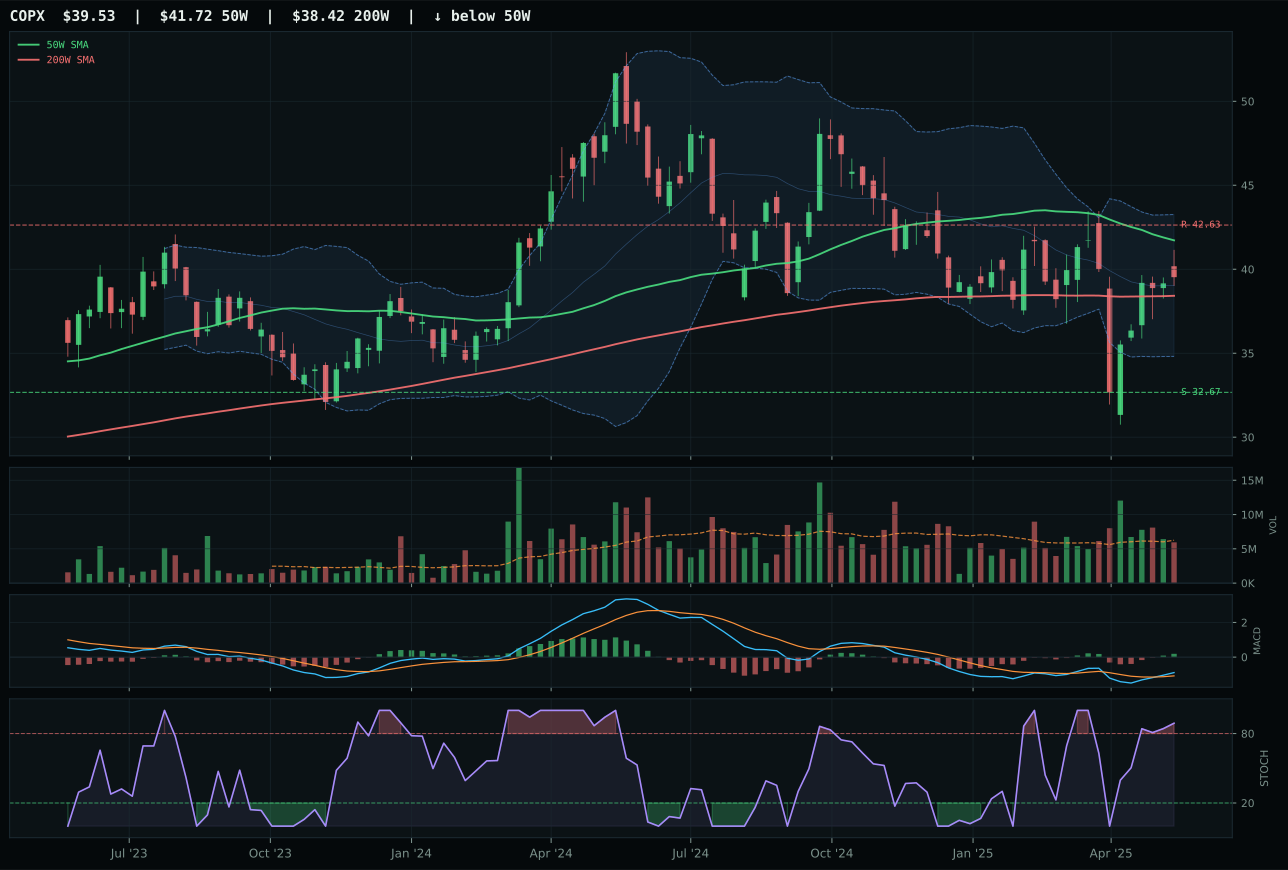
COPX has a neutral structure profile with -2.6% 13-week relative strength versus SPY.
A failed hold above support would weaken the setup.
Actionable but governed by invalidation levels.
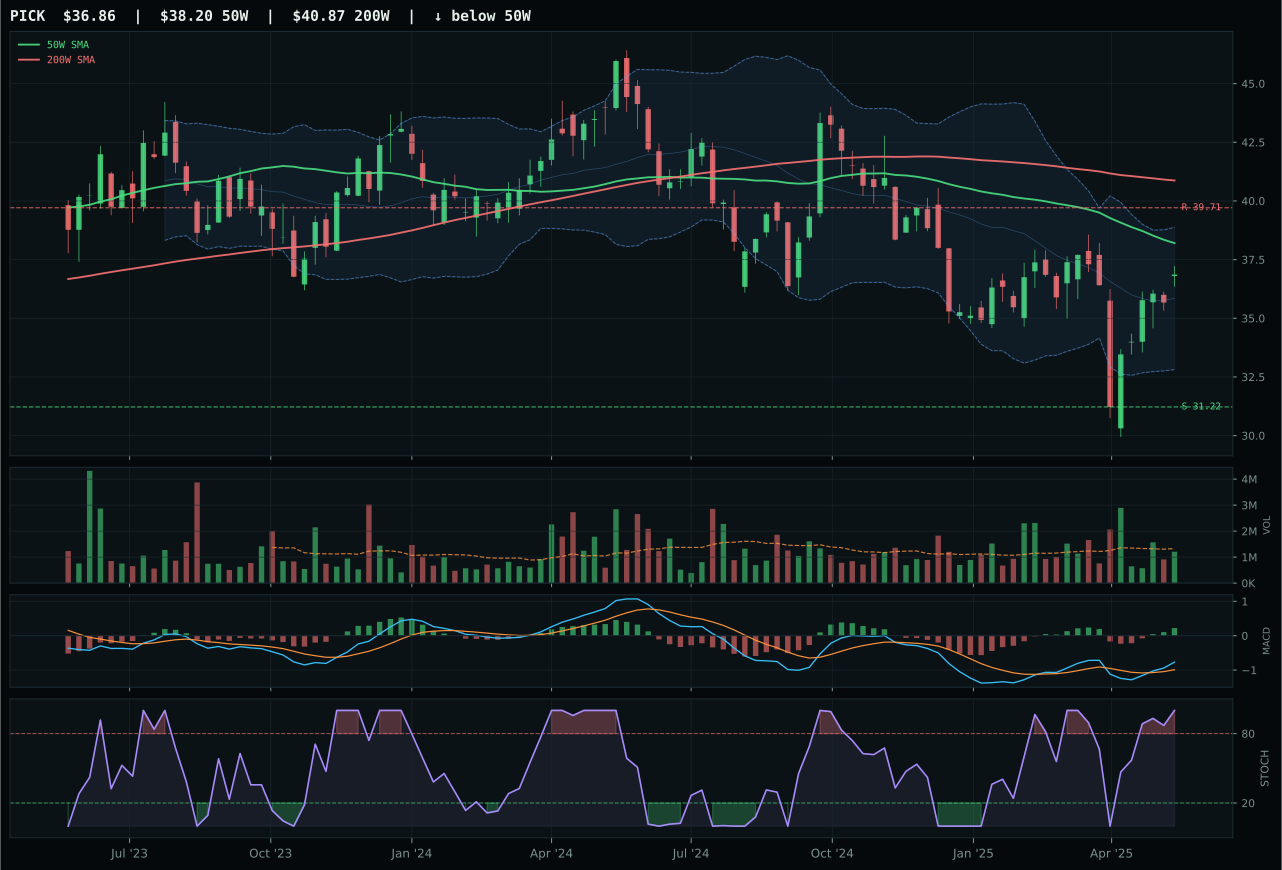
PICK has a neutral structure profile with 1.2% 13-week relative strength versus SPY.
Extension and support failure are the main tactical risks.
Tracked, but not top-2 eligible because: structurally broken.
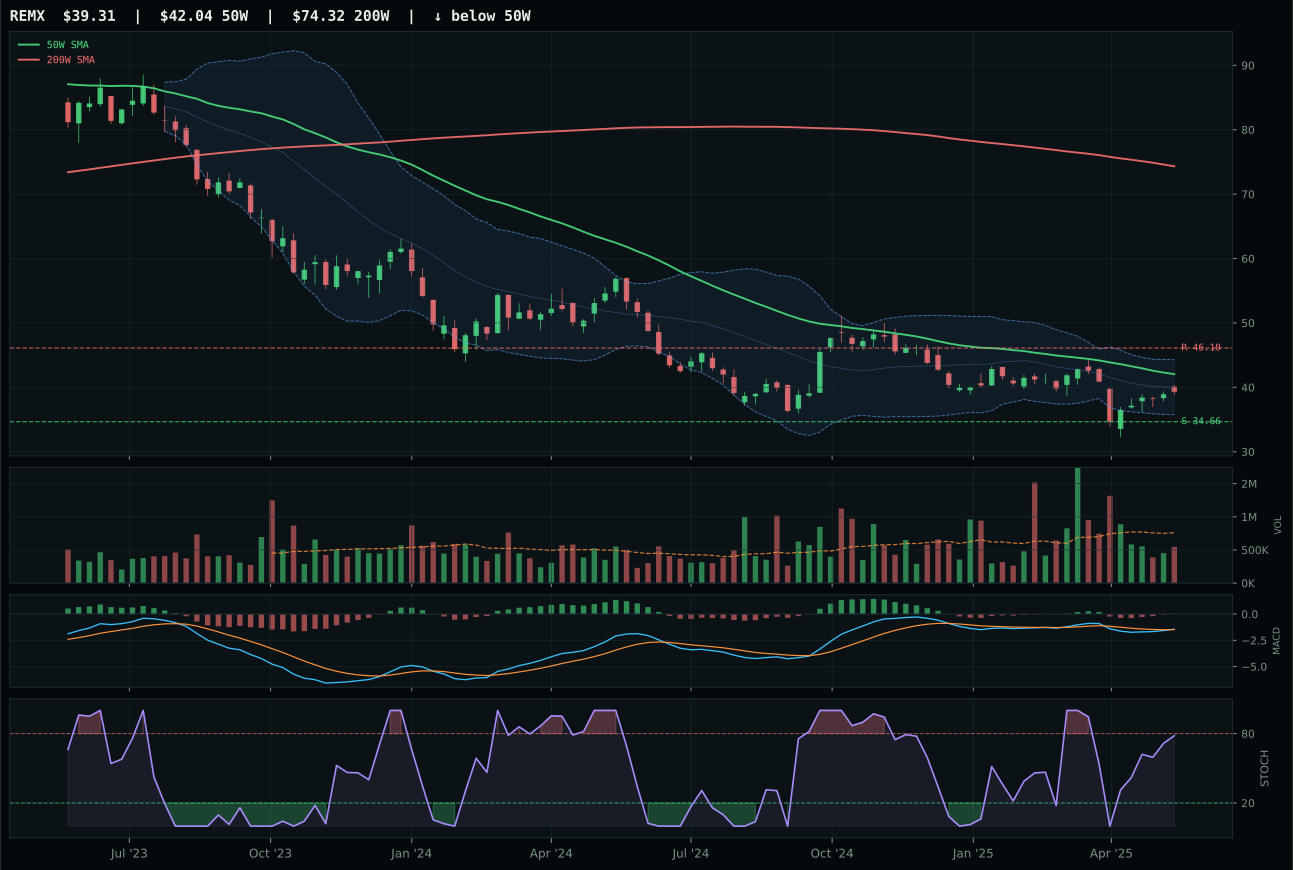
REMX has a neutral structure profile with -2.1% 13-week relative strength versus SPY.
Extension and support failure are the main tactical risks.
Tracked, but not top-2 eligible because: structurally broken.
COPX edges PICK by 21.4 points despite both showing pullback-into-support setups, winning on structure clarity and technical cleanliness rather than momentum. COPX trades 5.3% below the 50W with 61.1 trend and neutral structure scoring 72.2; PICK also sits below the 50W but suffers hard-filter structural damage that collapses its setup quality. Both MACD show bullish and improving, both stochastic RSI show overbought momentum, but COPX's neutral structure allows timing to score 82.0 while PICK is essentially disqualified. The category-relative strength at -0.5% for COPX versus +3.2% for PICK masks the timing story: PICK has already begun its bounce (thirteen-week return of -1.4% versus COPX at -5.1%), meaning COPX offers more upside to the moving average and less exhaustion. Risk/reward at 59.2 for COPX versus 60.0 for PICK is nearly identical, but the Fibonacci retracement placement differs—COPX sits at 0.618 midpoint, PICK is extended past it. This distinction determines the quality of the trade setup.
Industrial Metals receives 5% allocation despite a category score of just 18.1, holding its tier-2 slot through technical qualification rather than conviction. The macro environment is actively hostile: disinflation pressure exerts a -8 penalty, and liquidity stress contributes -7, summing to a category-level macro fit of only 42.0. COPX's technical evidence of 47.2 is modest—trend 61.1 reflects price below the 50W, momentum confirmation is middling at 67.9, and risk/reward is barely positive at 59.2—yet the category remains eligible because COPX exhibits bullish MACD with improving trajectory and maintains price above the 200W. This is not a category earning allocation on strength; it is a category holding allocation because it is not yet broken. The 5% position serves as a tactical entry point if macro conditions shift: if disinflation pauses or liquidity stress eases, copper scarcity and industrial demand could re-accelerate. For now, this is a waiting position. Should category score drop below 10.0 in future weeks, allocation would compress to 0%.
Agriculture & Livestock — MOO
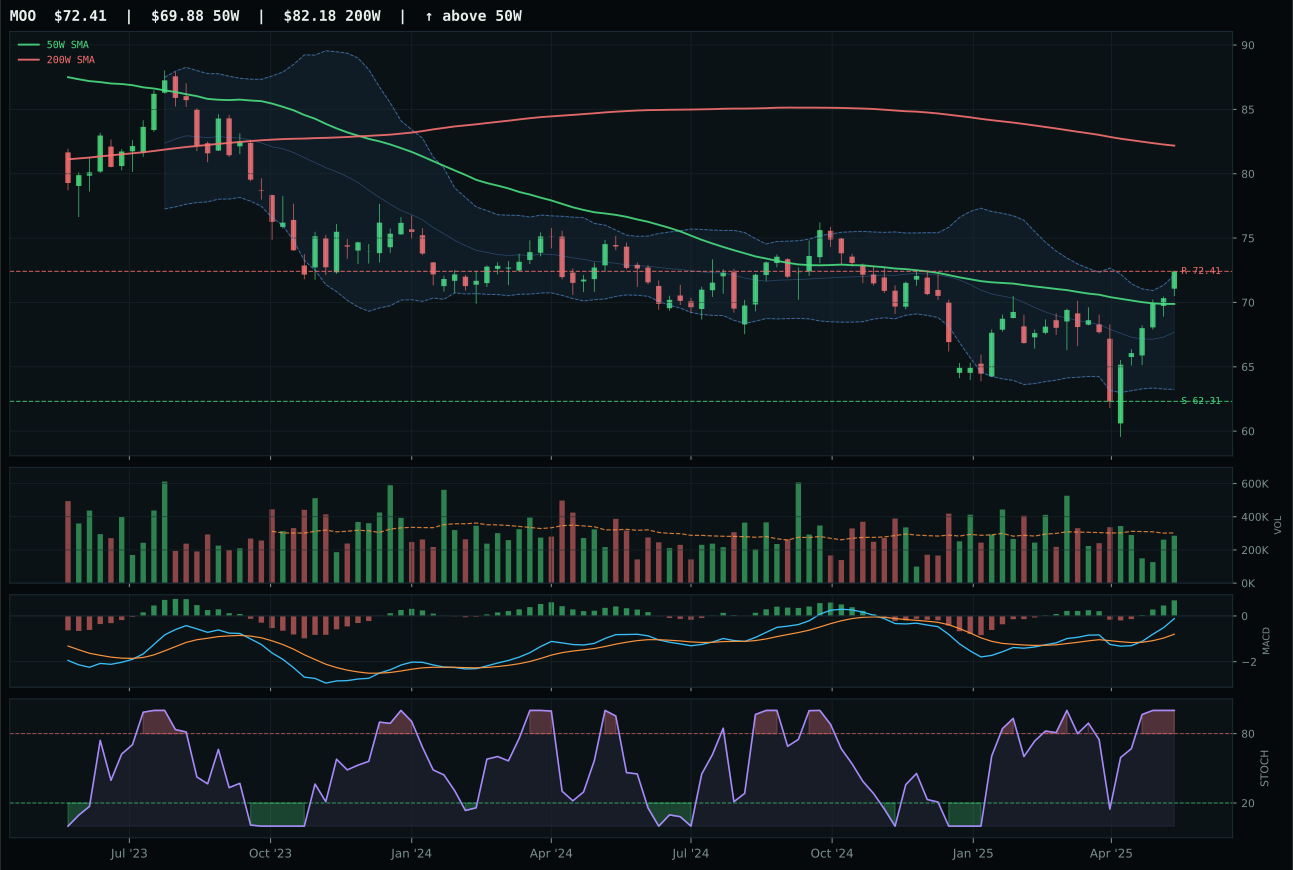
MOO has a neutral structure profile with 9.6% 13-week relative strength versus SPY.
A failed hold above support would weaken the setup.
Actionable but governed by invalidation levels.
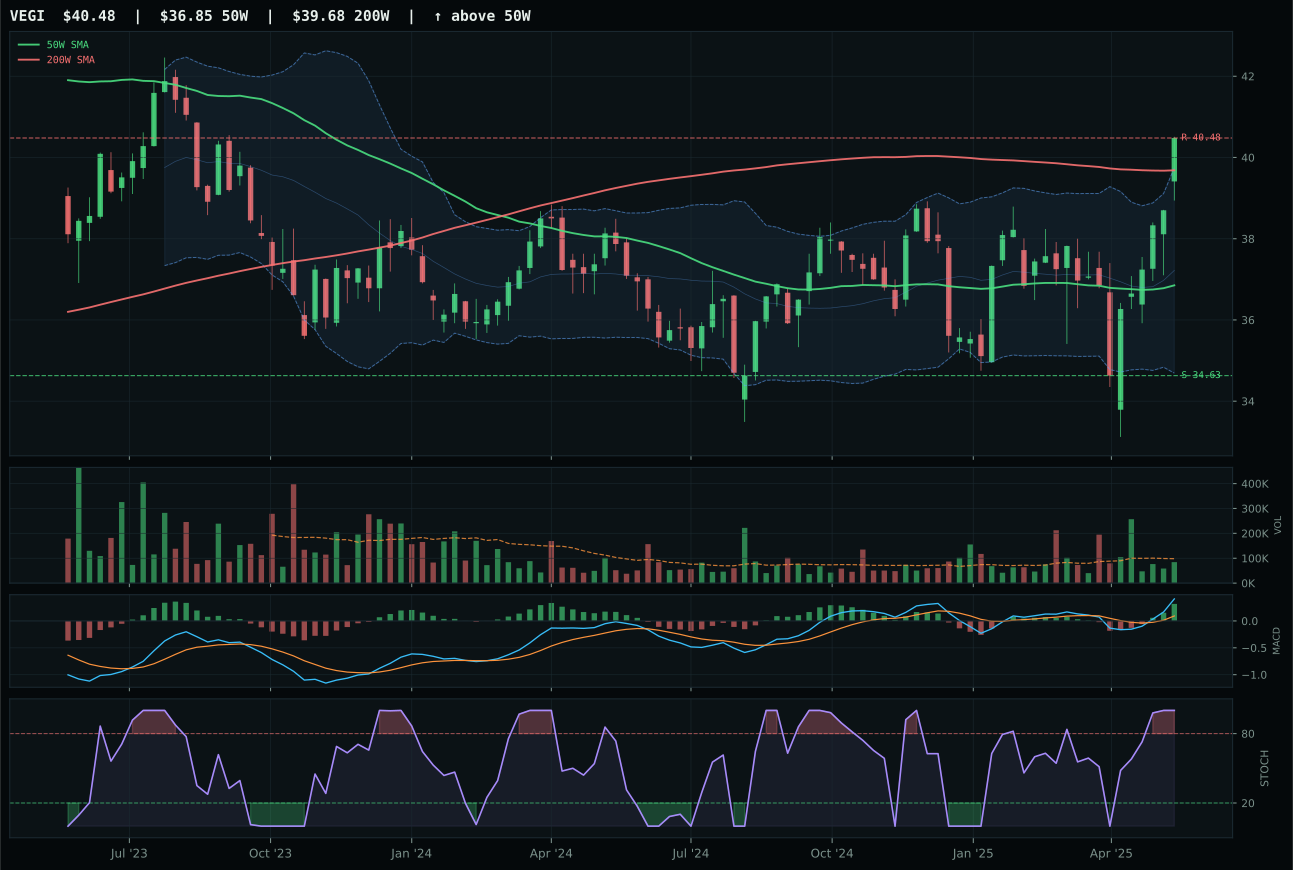
VEGI has a neutral structure profile with 10.7% 13-week relative strength versus SPY.
A failed hold above support would weaken the setup.
Tracked, but not top-2 eligible because: .
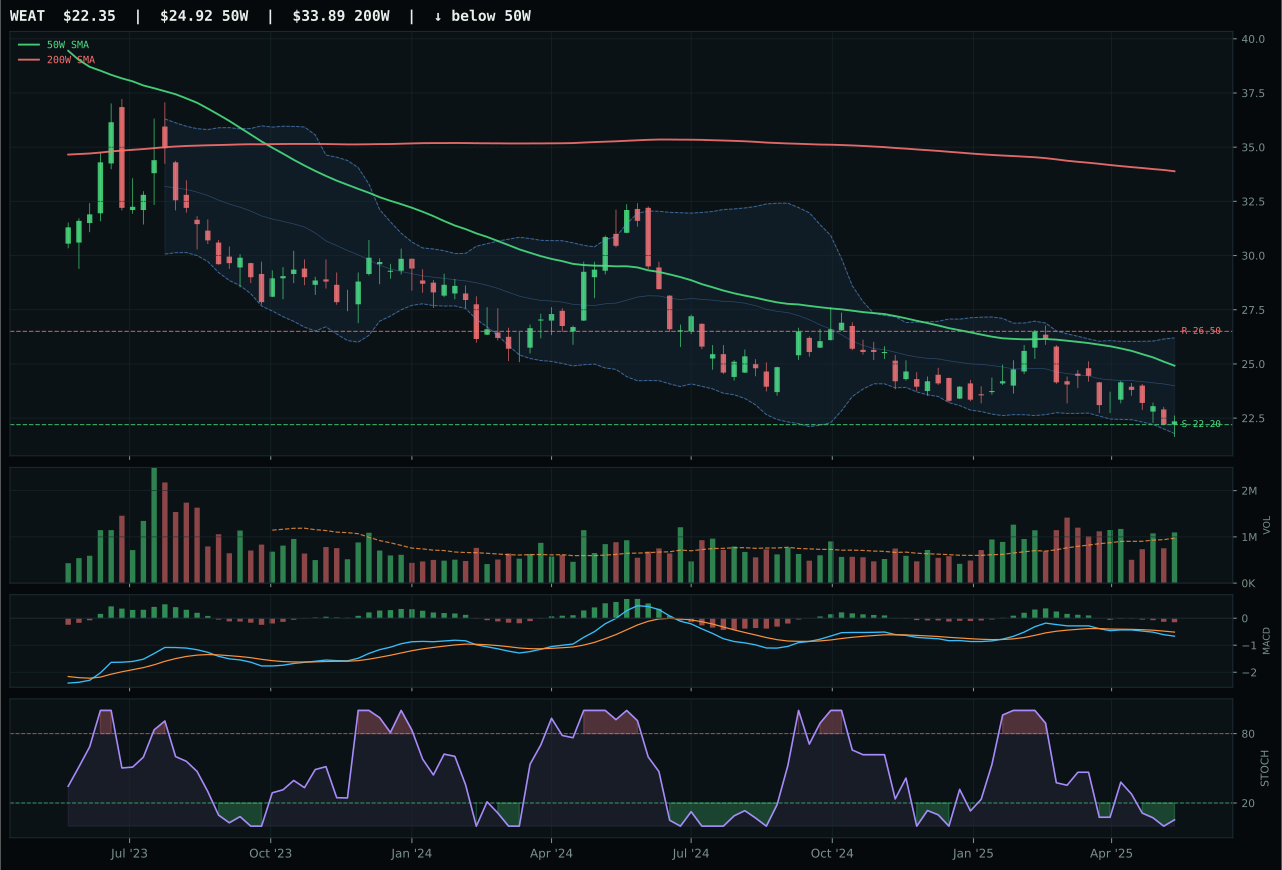
WEAT has a pullback into support profile with -13.1% 13-week relative strength versus SPY.
Extension and support failure are the main tactical risks.
Tracked, but not top-2 eligible because: structurally broken.
MOO won by default structure quality in a category that lacks conviction across the board. MOO's 70.0 trend score reflects price above the 50W but below the 200W—a reset that sits cleaner than VEGI's full uptrend structure—while MOO's timing advantage (90.0 vs. 75.0) comes from a 3.6% proximity to the 50W against VEGI's 9.8% stretch. MOO's risk/reward of 53.9% downside versus 0.0% upside resistance is tighter and more honest than VEGI's extended setup. Both carry identical bullish/improving MACD and overbought stochastic signals, yet MOO's neutral structure provides more entry safety in a macro environment actively hostile to agricultural exposure. The 10.8-point gap versus VEGI is substantial, signaling that the category winner itself lacks compelling technical sponsorship. MOO's 7.1% 13W return and 9.6% SPY relative strength are respectable, but they are not enough to overcome the category-level macro collapse.
Agriculture & Livestock is excluded entirely this week, ranked ninth or tenth among categories at a score of just 11.6, because macro headwinds have turned lethal. Disinflation hurts this exposure by -6 points, and the active disinflation pressure descriptor piles on another -8, leaving macro fit at only 32.0—the weakest in the portfolio. The technical picture doesn't salvage it either: even MOO's best-in-class 79.2 technical evidence can't overcome a category where price structures are below the 200W and relative strength versus SPY is only 9.6% at best. This is not a timing miss; this is structural exclusion. The only path back to the portfolio is a clear macro pivot away from disinflation or a fresh commodity spike that breaks MOO above the 200W with sustained volume—neither is evident in the current regime. Any allocation here would be fighting the macro thesis, and the system correctly punishes that conviction mismatch.
Traditional Energy — XLE
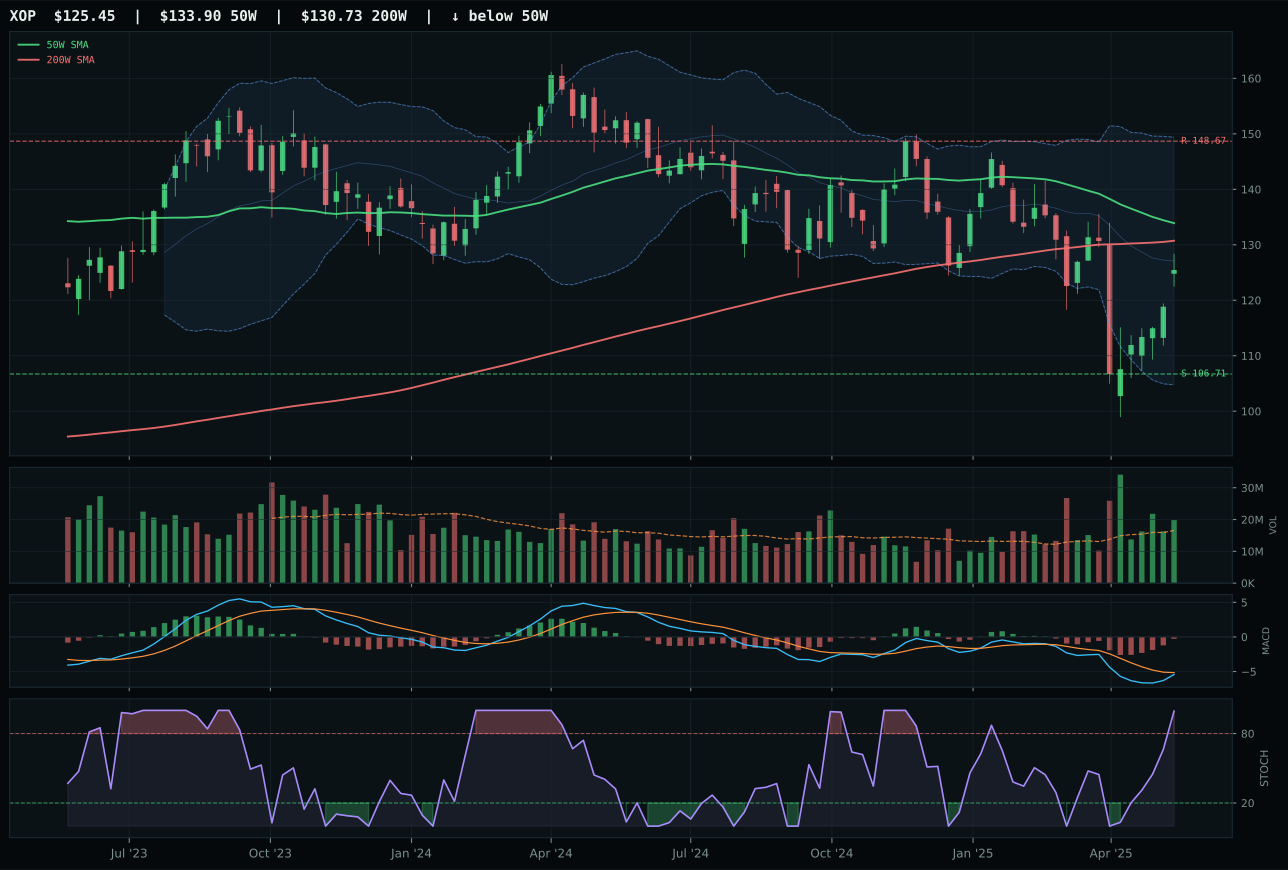
XOP has a neutral structure profile with -5.7% 13-week relative strength versus SPY.
A failed hold above support would weaken the setup.
Actionable but governed by invalidation levels.
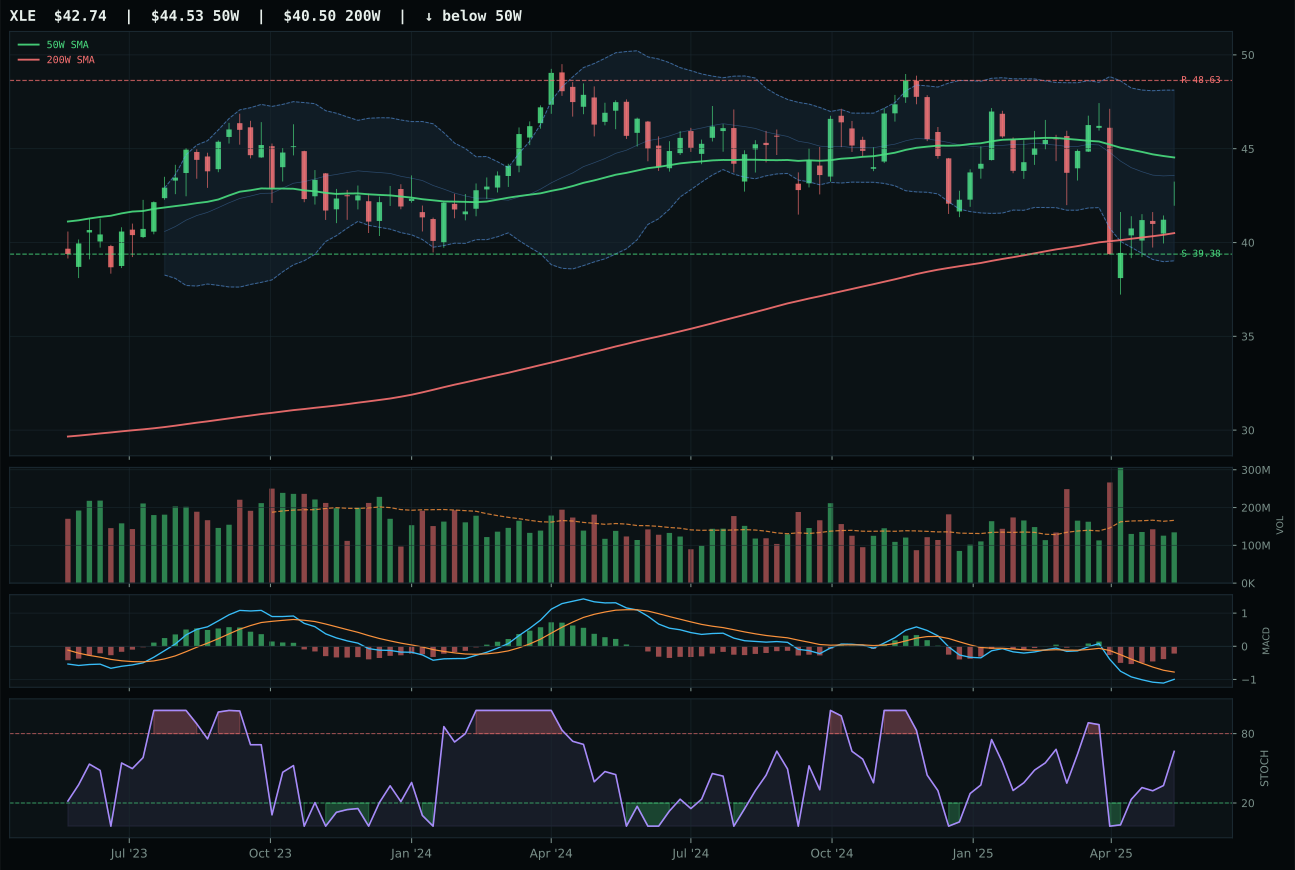
XLE has a neutral structure profile with -2.6% 13-week relative strength versus SPY.
A failed hold above support would weaken the setup.
Actionable but governed by invalidation levels.
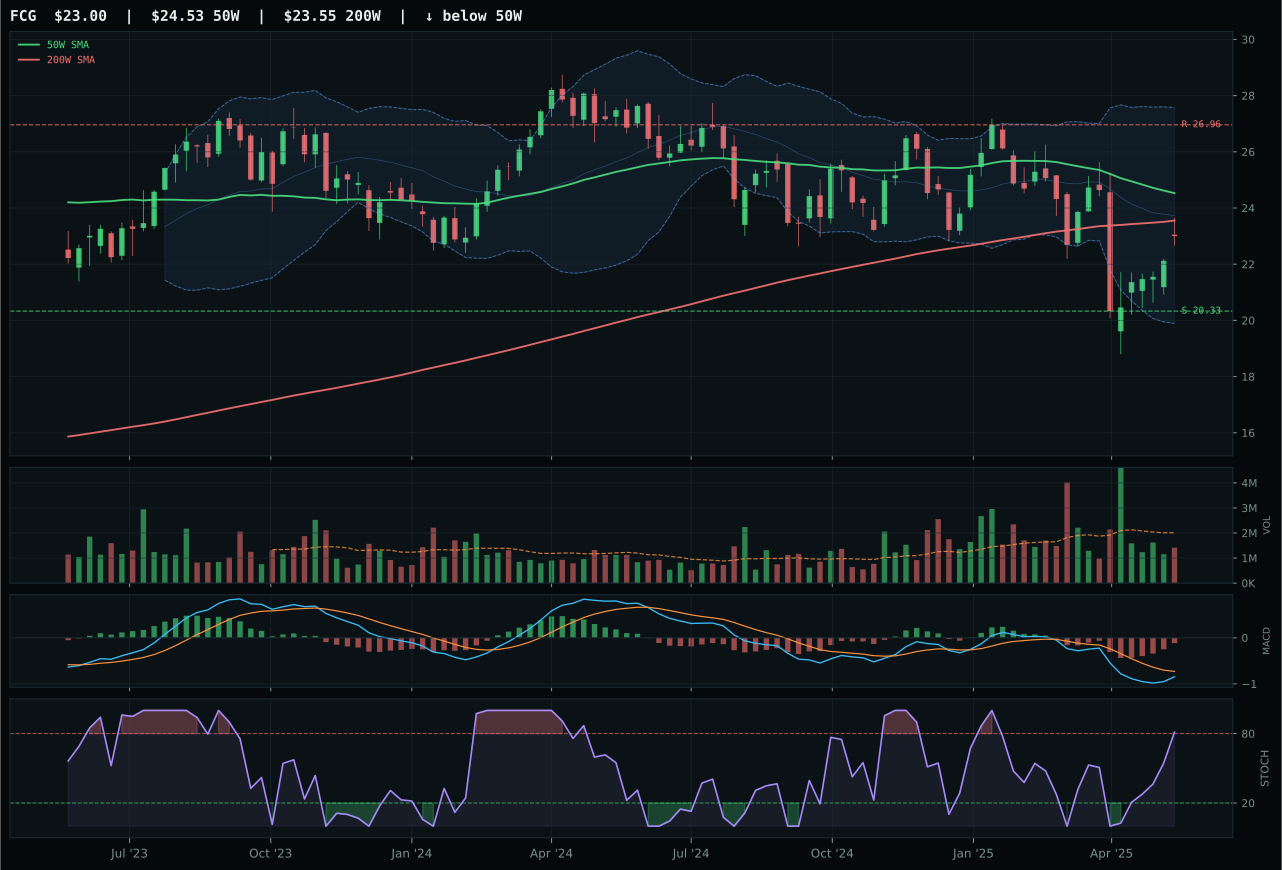
FCG has a neutral structure profile with -6.5% 13-week relative strength versus SPY.
A failed hold above support would weaken the setup.
Actionable but governed by invalidation levels.
XLE outpaces XOP by 7.7 points despite both showing pullback-into-repair setups, with the win driven entirely by superior timing and stochastic RSI positioning rather than momentum divergence. Both trade below the 50W—XLE at 3.9%, XOP at a deeper 5.7%—positioning XLE closer to the moving average defense. Timing scores reveal the story: XLE 98.0 versus XOP 75.0, a massive gap explained by stochastic RSI at rising mid-zone (0.65) for XLE versus overbought momentum (1.00) for XOP. XOP's thirteen-week return of -8.2% versus XLE's -5.1% shows XOP fell harder, making its rebound less credible with exhausted momentum. MACD is bearish but improving for both, but XLE's category-relative strength of 3.1% versus XOP's 0.0% signals buyers are defending integrated energy cash flows more aggressively than exploration beta. Risk/reward is nearly identical (70.6 vs 69.0), and support levels (39.38 for XLE vs 106.71 for XOP) are both defining the risk floor. Volume at 0.81x for XLE versus above-average for XOP actually favors XLE because it shows support without capitulation, signaling controlled unwinding.
Traditional Energy earns 0% allocation this week, ranked outside the top-8 categories due to irreconcilable macro headwinds. The category score of 10.9 reflects a macro fit of only 23.0, where disinflation pressure contributes a devastating -10 penalty and liquidity stress adds -7. Even XLE's technical evidence of 63.6—a respectable score in absolute terms—cannot overcome a macro regime that is actively hostile to energy consumption and commodity exposure. Disinflation mechanics penalize both economic demand and inflation-sensitive assets simultaneously; in an environment where central banks are fighting price decreases, energy demand typically tracks the weakest line of consumption. The category failed eligibility not because charts are broken—XLE, XOP, and FCG all show bullish MACD and improving stochastic signals—but because the macro probability has shifted against the thesis. For Traditional Energy to earn reallocation, one of three events must occur: disinflation pressure must reverse (+10 swing), liquidity stress must ease significantly, or risk appetite must rebound sharply enough to drive growth demand. None of these changes are currently in motion, making this a prudent exclusion.