
2025-05-09
Informational purposes only. The content in this report, including allocations, analysis, and commentary, is provided solely for informational and educational purposes. It does not constitute financial advice, investment advice, trading advice, or any other type of advice. Past performance does not guarantee future results. Always conduct your own research and consult a qualified financial professional before making investment decisions.
Weekly Allocation
| Ticker | Category | Weight | Role |
|---|---|---|---|
| FBTC | 50% | Overlay | |
| GLD | Precious Metals | 10% | Top-2 (10%) |
| XLU | Utilities & Infrastructure | 10% | Top-2 (10%) |
| ITA | Defense & Aerospace | 5% | Tier-2 (5%) |
| IGV | Technology | 5% | Tier-2 (5%) |
| ILF | Emerging Markets | 5% | Tier-2 (5%) |
| URNM | Nuclear Energy | 5% | Tier-2 (5%) |
| AIQ | AI | 5% | Tier-2 (5%) |
| COPX | Industrial Metals | 5% | Tier-2 (5%) |
Trade Instructions — Monday Open
Sell the tranche from 2025-04-11 (completing its 4-week hold). Buy the new tranche. Instructions show net portfolio changes — same-asset positions cancel, weight changes show the delta.
| Action | Ticker | Instruction |
|---|---|---|
| SELL | IGF | Sell 33% of IGF position (reduce 7.50% → 5.00%) |
| SELL | CIBR | Sell 50% of CIBR position (reduce 2.50% → 1.25%) |
| SELL | XAR | Sell 25% of XAR position (reduce 5.00% → 3.75%) |
| SELL | WEAT | Sell entire WEAT position (1.25% of portfolio) |
| SELL | NLR | Sell 50% of NLR position (reduce 2.50% → 1.25%) |
| SELL | INDA | Sell entire INDA position (1.25% of portfolio) |
| BUY | ILF | Buy ILF — 14.29% of freed cash (adds 1.25% to portfolio) |
| BUY | IGV | Buy IGV — 14.29% of freed cash (adds 1.25% to portfolio) |
| BUY | COPX | Buy COPX — 14.29% of freed cash (adds 1.25% to portfolio) |
| BUY | XLU | Buy XLU — 28.57% of freed cash (adds 2.50% to portfolio) |
| BUY | ITA | Buy ITA — 14.29% of freed cash (adds 1.25% to portfolio) |
| BUY | URNM | Buy URNM — 14.29% of freed cash (adds 1.25% to portfolio) |
Current Portfolio After Trade
Combined holdings across all 4 active tranches. Each tranche is 25% of the portfolio.
| Ticker | % of Portfolio | Weight Bar |
|---|---|---|
| FBTC | 50.00% | |
| GLD | 10.00% | |
| IGF | 5.00% | |
| XAR | 3.75% | |
| AIQ | 3.75% | |
| ILF | 3.75% | |
| IGV | 3.75% | |
| MOO | 2.50% | |
| URA | 2.50% | |
| PAVE | 2.50% | |
| COPX | 2.50% | |
| XLU | 2.50% | |
| CIBR | 1.25% | |
| NLR | 1.25% | |
| XLE | 1.25% | |
| SMH | 1.25% | |
| ITA | 1.25% | |
| URNM | 1.25% |
Macro Regime — Disinflation
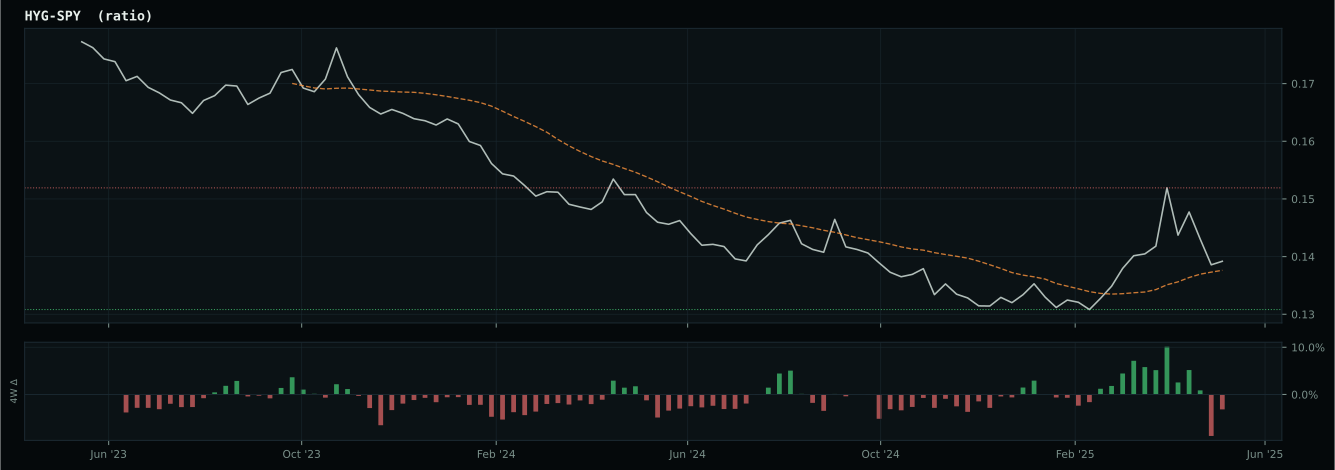
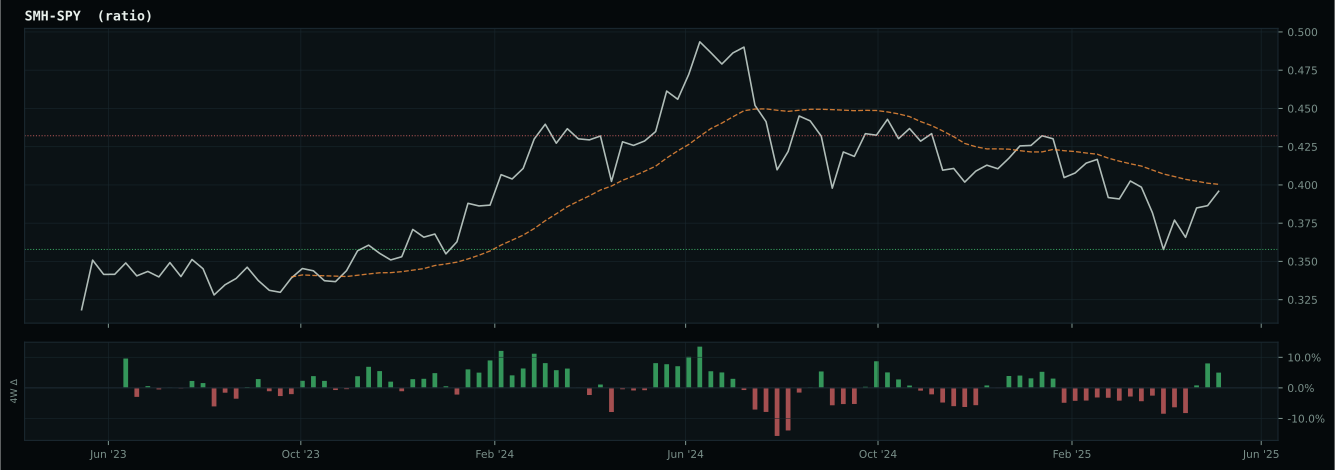
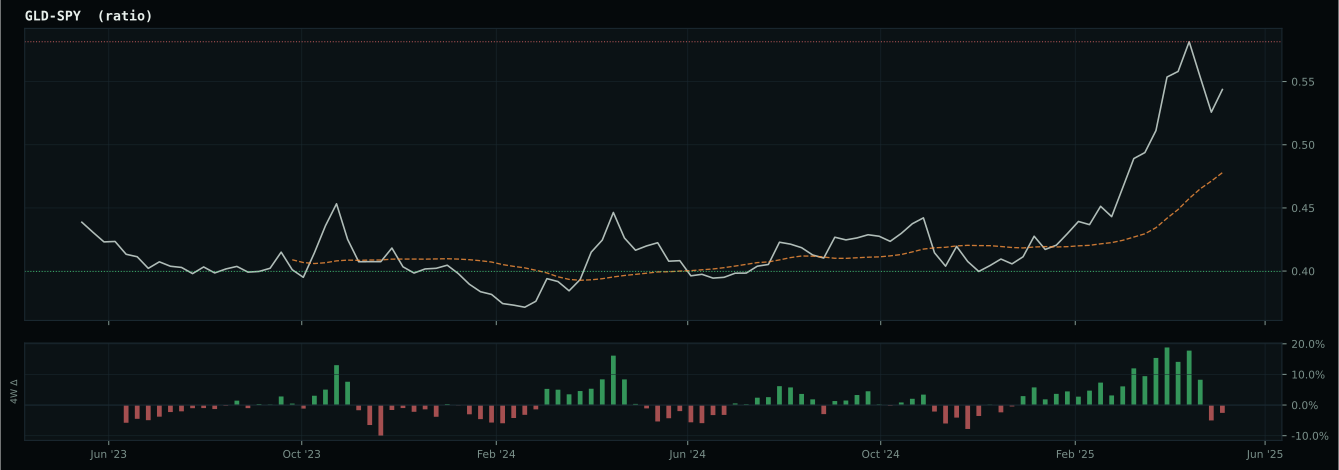
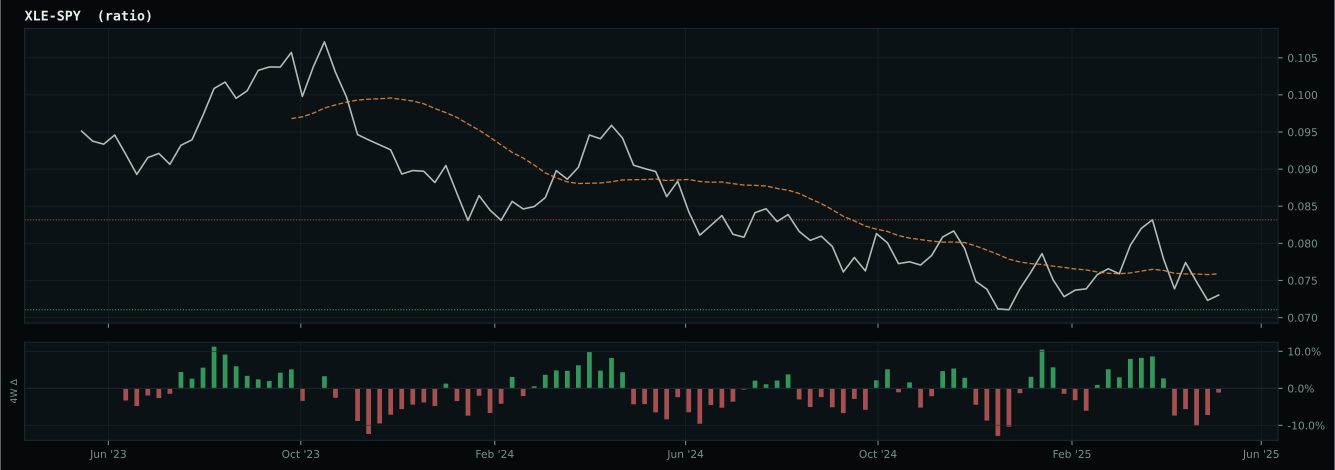
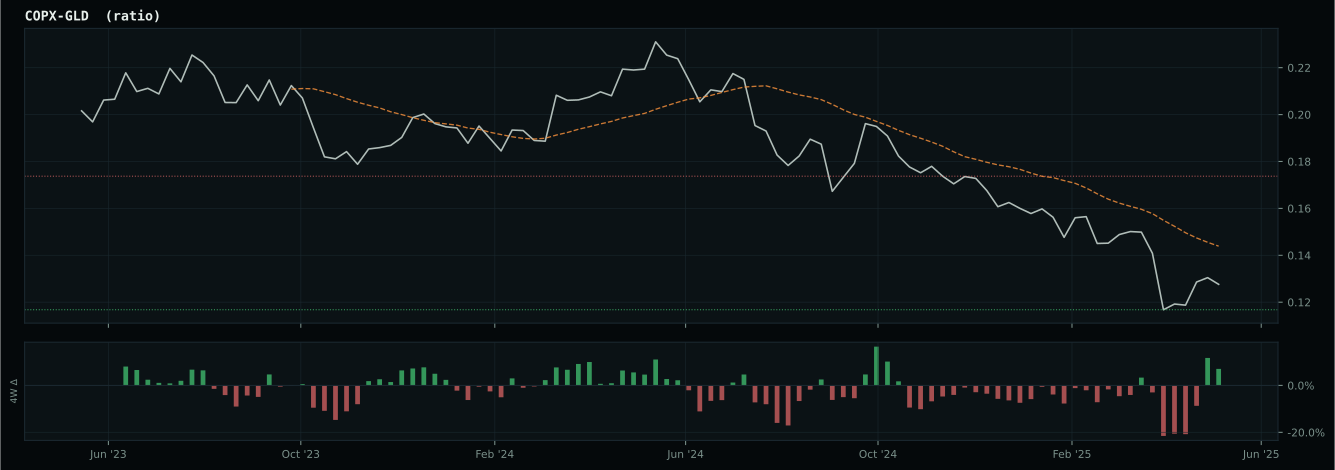
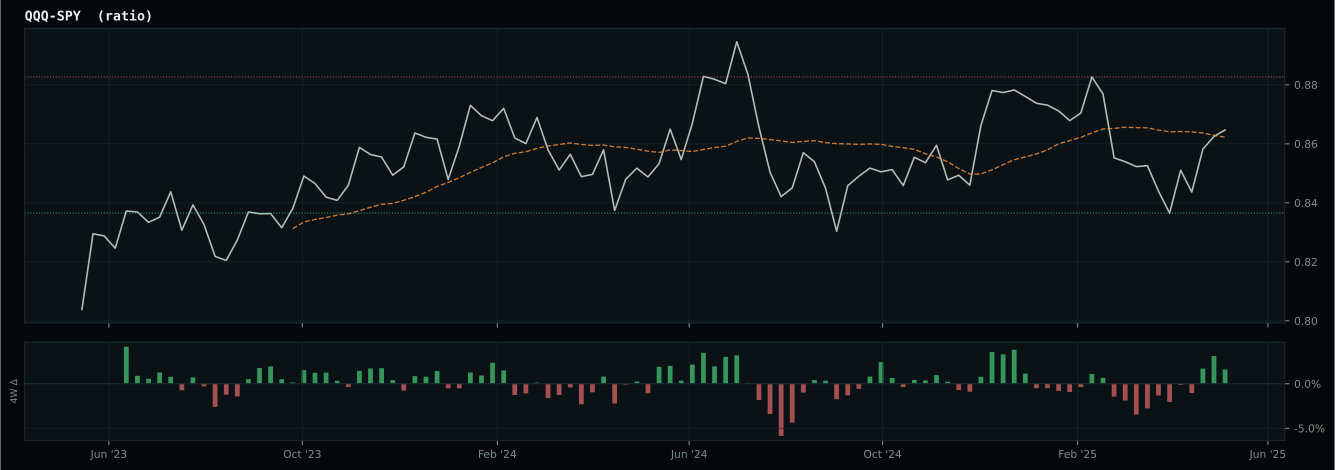
growth data is not confirming the weak market-implied risk appetite signal
Macro Evidence Charts
Market-implied signals behind the macro regime scores. Each ratio compares two assets; the direction and slope of the ratio is what the macro engine reads.
Crypto Regime — TrendBTC
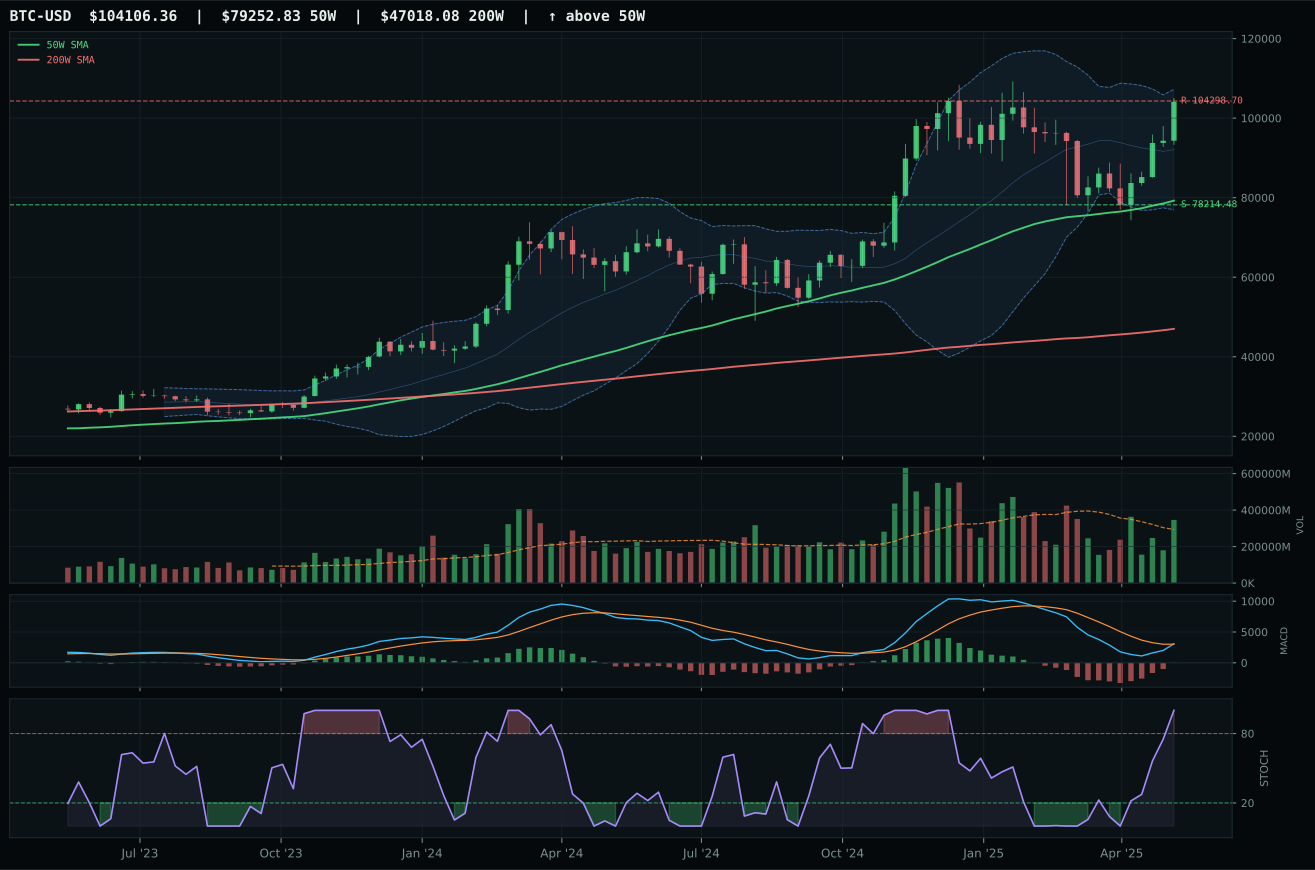
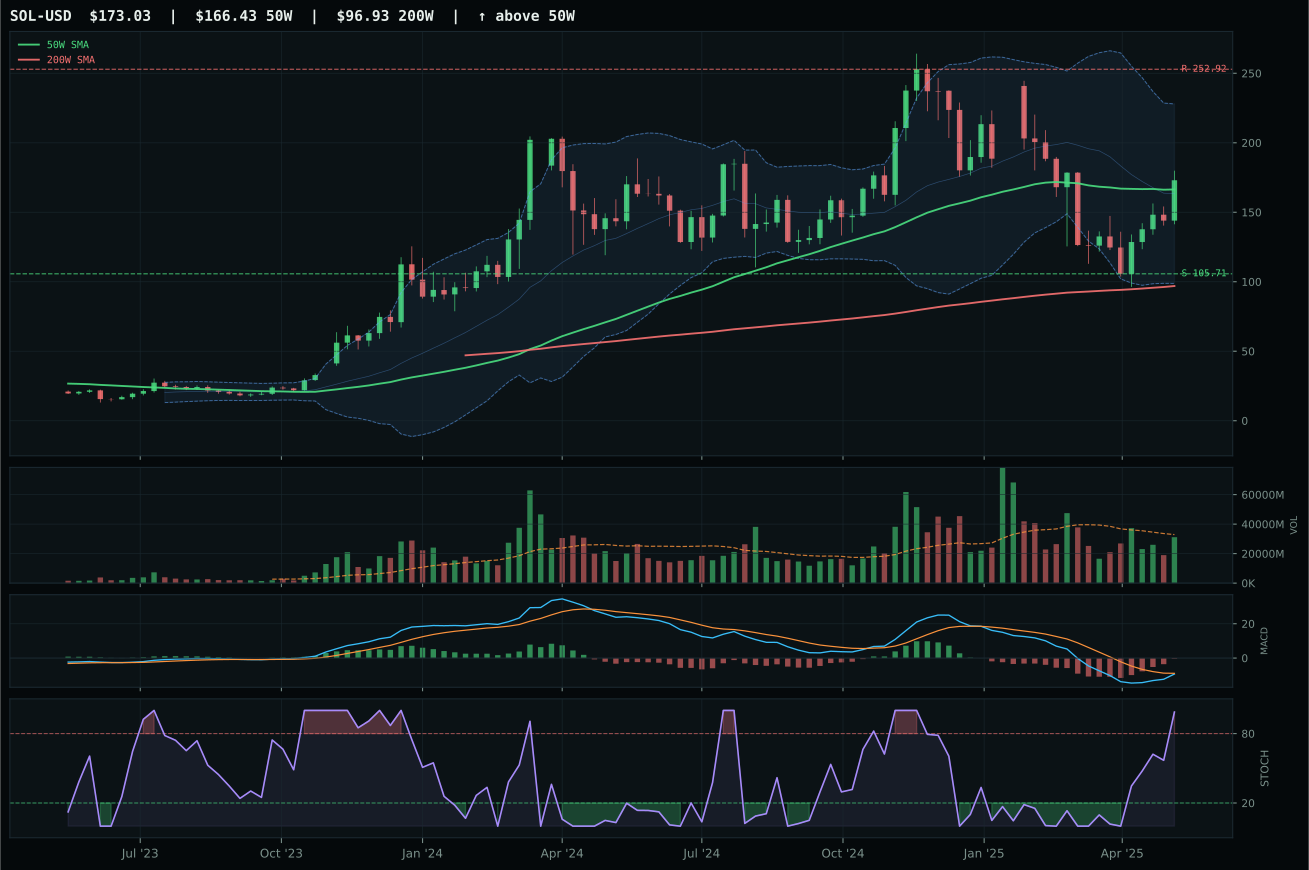
ValueBTC not armed: BTC has not made the first post-breakdown touch of the 200W buy zone after losing the 50W
TrendBTC confirmed: 2 consecutive closes above rising/flat 50W SMA
one or more available conditions failed
Category Rankings
| Rank | Category | Winner | Score | Alloc | 4W Ret | Peers (4W) |
|---|---|---|---|---|---|---|
| 1 | Precious Metals | GLD | 80.3 | 20% | +2.37% | GDX +7.5% · SLV +11.6% |
| 2 | Utilities & Infrastructure | XLU | 79.2 | 20% | +0.55% | IGF +3.5% · PAVE +2.5% |
| 3 | Defense & Aerospace | ITA | 64.5 | 10% | +9.31% | XAR +10.6% · ROKT +8.9% |
| 4 | Technology | IGV | 58.0 | 10% | +3.36% | CIBR +5.1% · XLK +5.5% |
| 5 | Emerging Markets | ILF | 53.5 | 10% | -0.78% | IEMG +3.3% · INDA +1.2% |
| 6 | Nuclear Energy | URNM | 52.1 | 10% | +10.79% | URA +23.7% · NLR +16.5% |
| 7 | AI | AIQ | 32.0 | 10% | +4.30% | SMH +7.7% · BOTZ +3.4% |
| 8 | Industrial Metals | COPX | 18.1 | 10% | +7.79% | REMX -1.9% · PICK +3.1% |
| 9 | Traditional Energy | XLE | 10.7 | 0% | -2.04% | XOP -0.8% · FCG +0.3% |
| 10 | Agriculture & Livestock | MOO | 10.6 | 0% | +2.77% | VEGI +3.1% · WEAT +4.3% |
Precious Metals — GLD
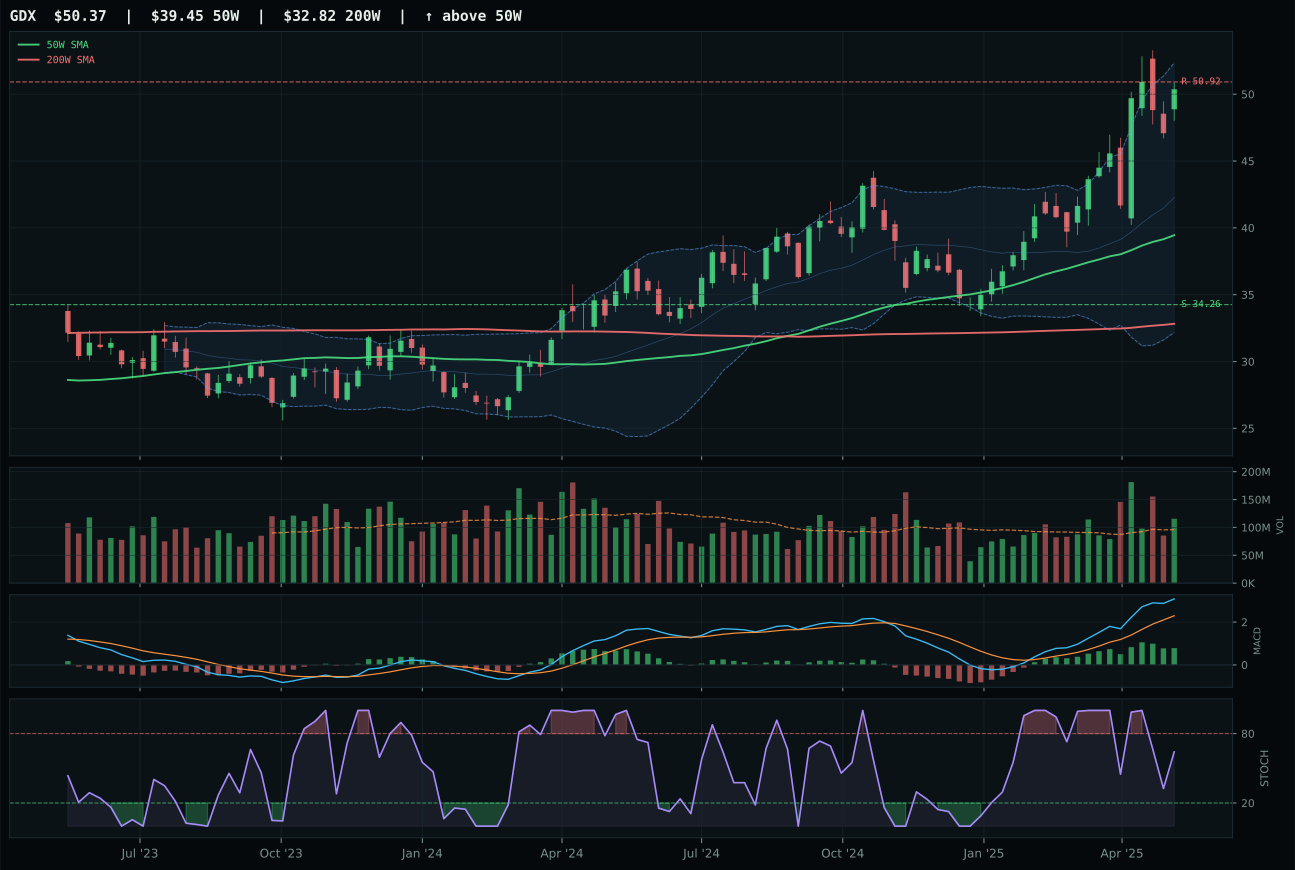
GDX has a vertical extension profile with 29.3% 13-week relative strength versus SPY.
A failed hold above support would weaken the setup.
Actionable but governed by invalidation levels.
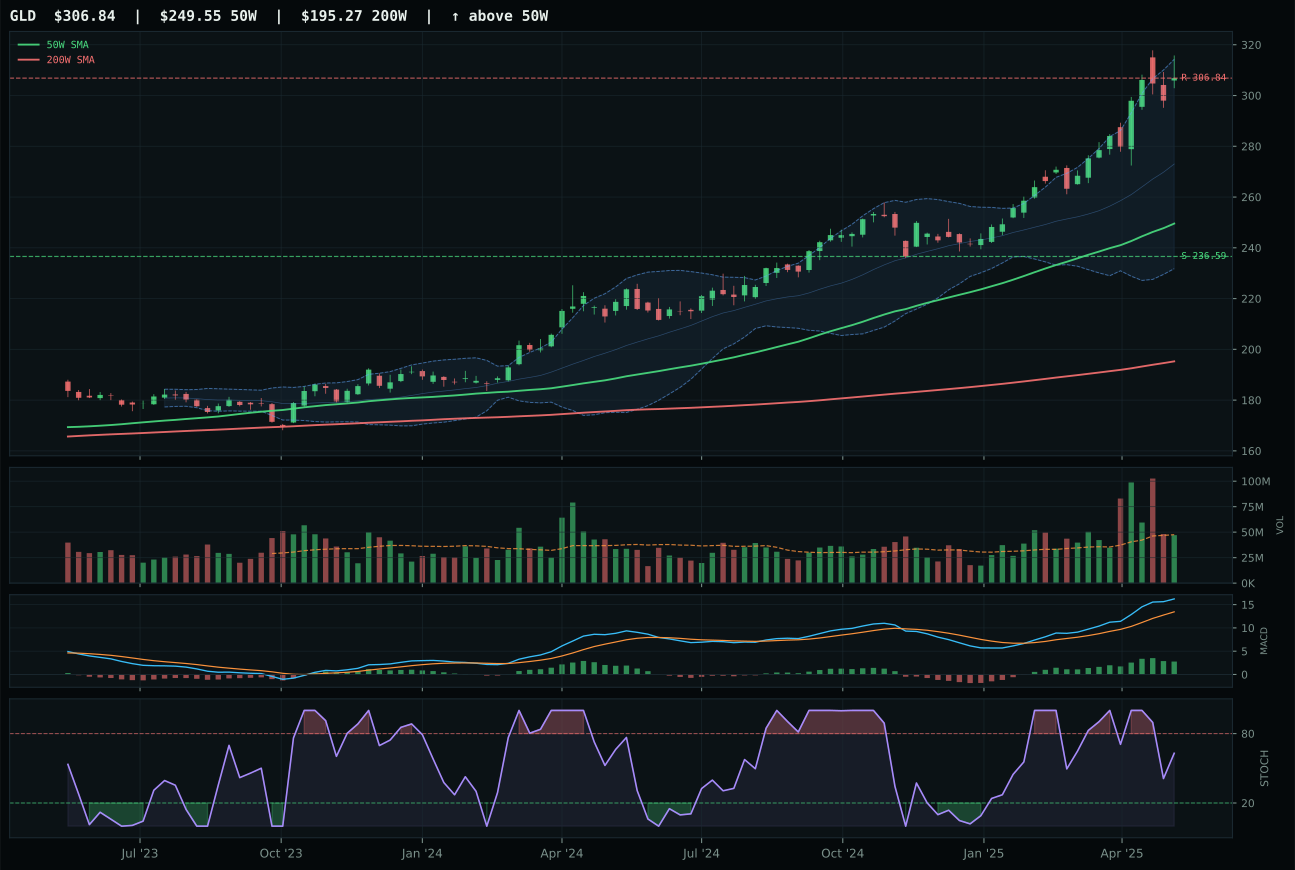
GLD has a vertical extension profile with 22.3% 13-week relative strength versus SPY.
A failed hold above support would weaken the setup.
Actionable but governed by invalidation levels.
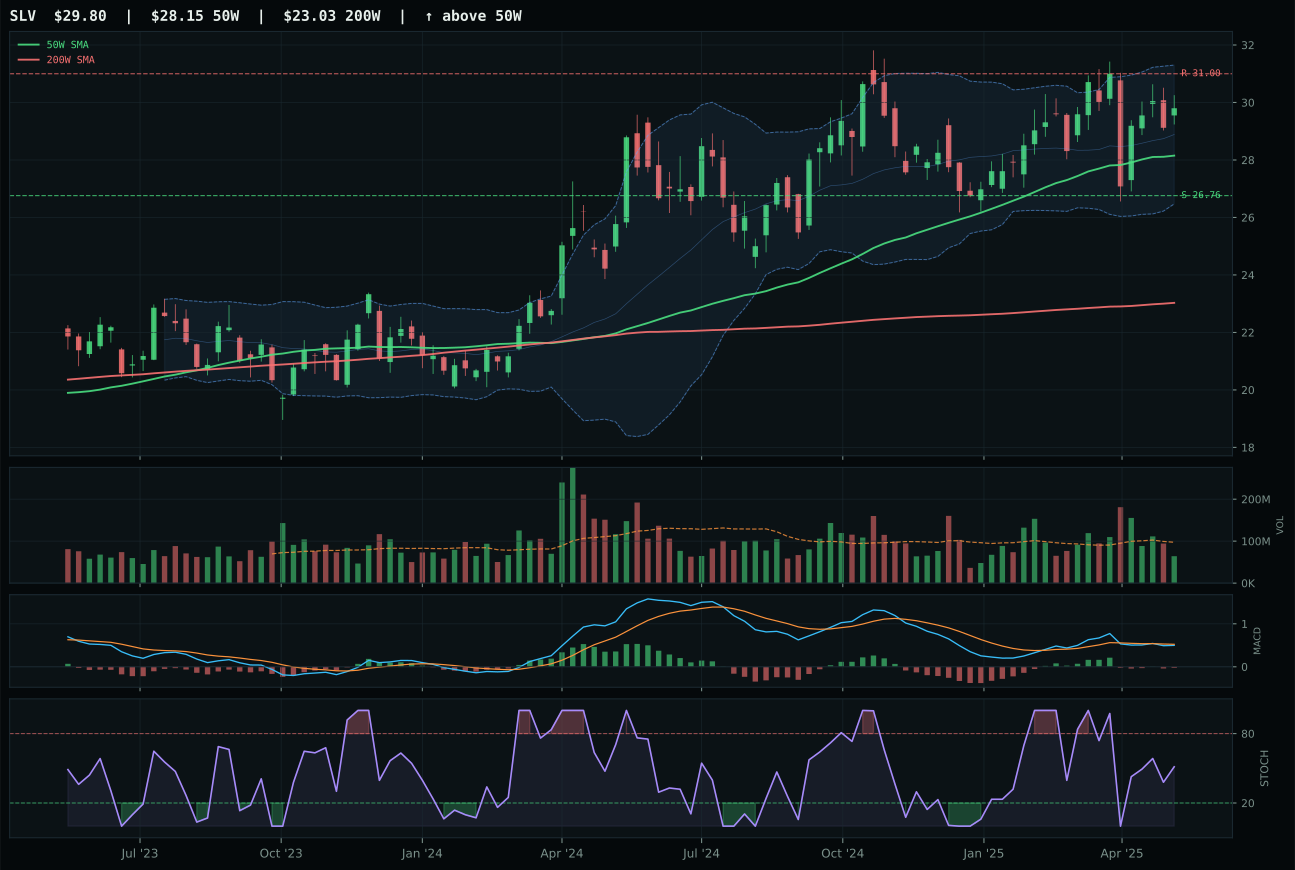
SLV has a neutral structure profile with 8.7% 13-week relative strength versus SPY.
A failed hold above support would weaken the setup.
Actionable but governed by invalidation levels.
GLD wins precious metals and secures a top-2 overweight slot because it delivers the only clean monetary hedge setup in a fragmenting growth narrative. Price at 23.0% above the 50-week is stretched, yes—but the 100/100 trend score, 100/100 momentum confirmation, and bullish-improving MACD demonstrate accumulation into strength, not retail panic buying. GDX's superior 29.3% SPY-relative outperformance tempts, but that leverage cuts both ways: its bullish-but-flattening MACD (versus GLD's bullish-improving) and 48.0 timing score (versus GLD's 53.0) signal momentum is rolling over in the miners. GLD's 71.7 volume-price confirmation and 72.8 persistence both exceed GDX's 68 and 59, proving that the gold narrative is sponsored by institutional capital flow, not speculative excess. The 49.9 risk-reward is tight given the extension, but that tightness reflects a market validating gold as the no-default-risk portfolio ballast—the opportunity set here is capital preservation, not expansion.
Precious Metals earns 10% allocation as a top-2 overweight alongside Utilities & Infrastructure, justified by the highest macro fit score (85.0/100) among all categories. Monetary hedge bid active at +14, disinflation pressure at +6, and defensive rotation at +7 create a 35-point macro tailwind that no other category matches this week. The 80.3 final composite and 78.0 technical evidence from GLD confirm that this is not a mean-reversion play—it is an active position in a regime where nominal rates are expected to compress further and real yields offer no buffer. The 13-week return of 16.3% and 22.3% SPY-relative strength reflect the early innings of the monetary hedge rotation; within a 50% overlay that halves tier sizes, 10% commits meaningful capital to the asset that benefits most directly from the liquidity shock that triggered the entire allocation framework. This is not tactical or hedging—this is strategic conviction that disinflation favors zero-coupon monetary assets above all others.
Utilities & Infrastructure — XLU
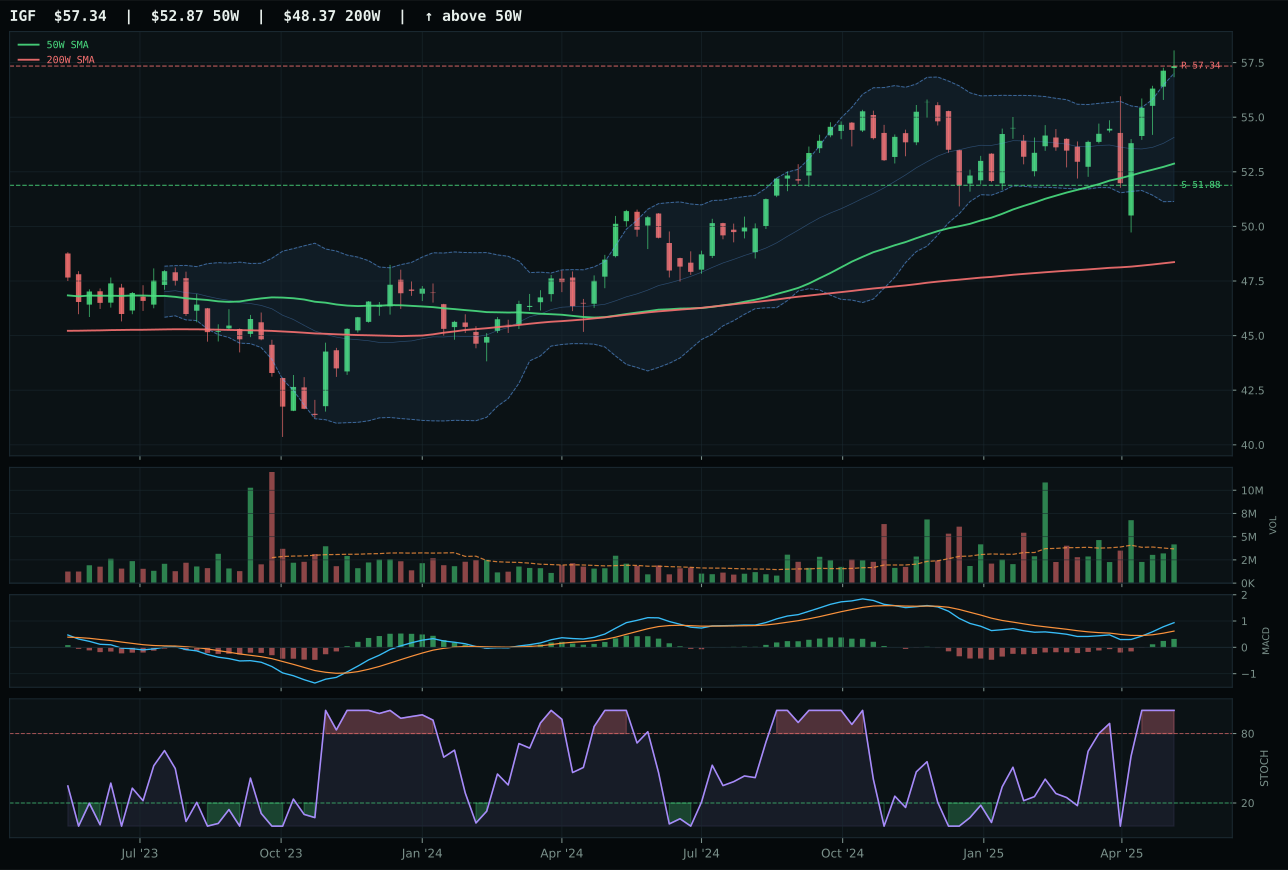
IGF has a neutral structure profile with 13.5% 13-week relative strength versus SPY.
A failed hold above support would weaken the setup.
Actionable but governed by invalidation levels.
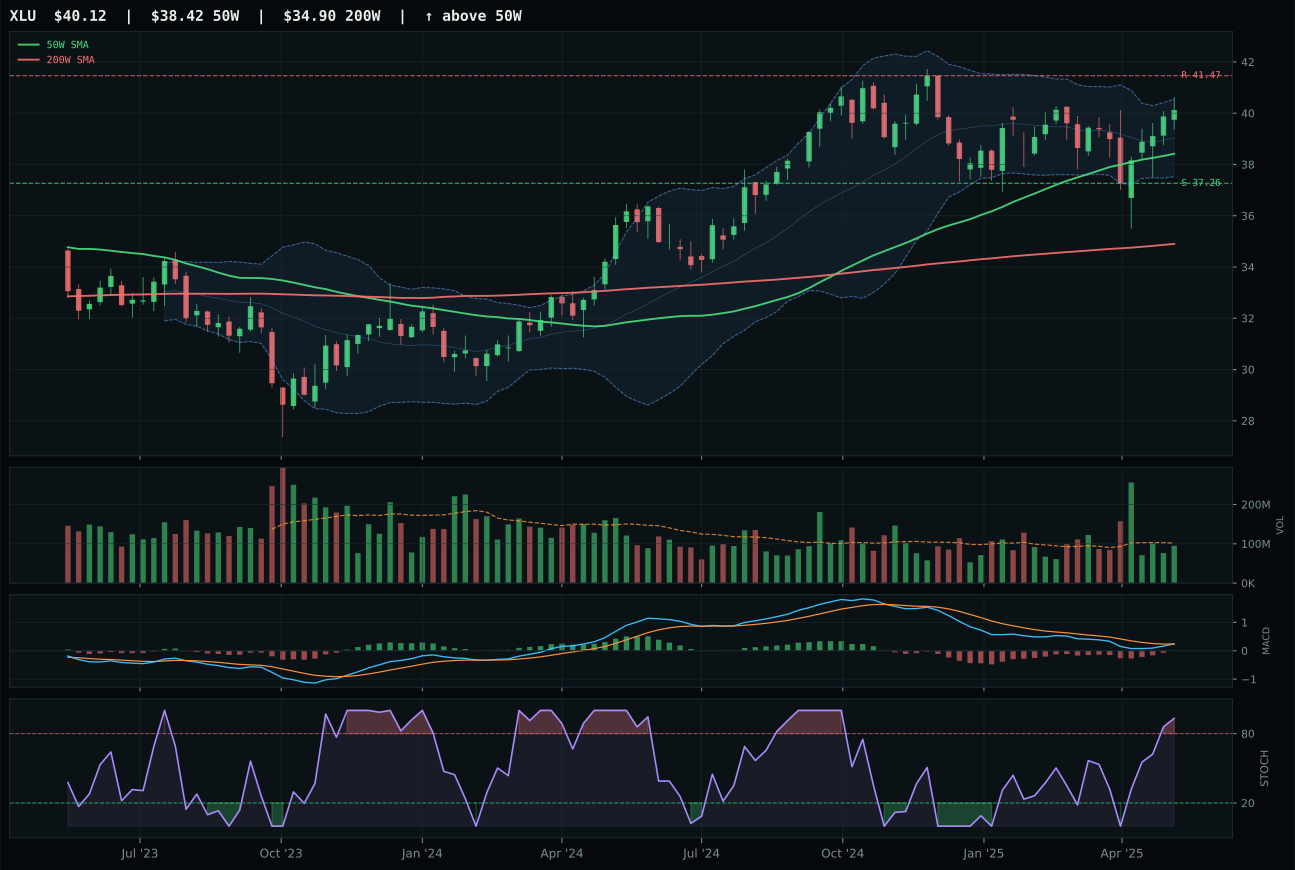
XLU has a neutral structure profile with 8.8% 13-week relative strength versus SPY.
A failed hold above support would weaken the setup.
Actionable but governed by invalidation levels.
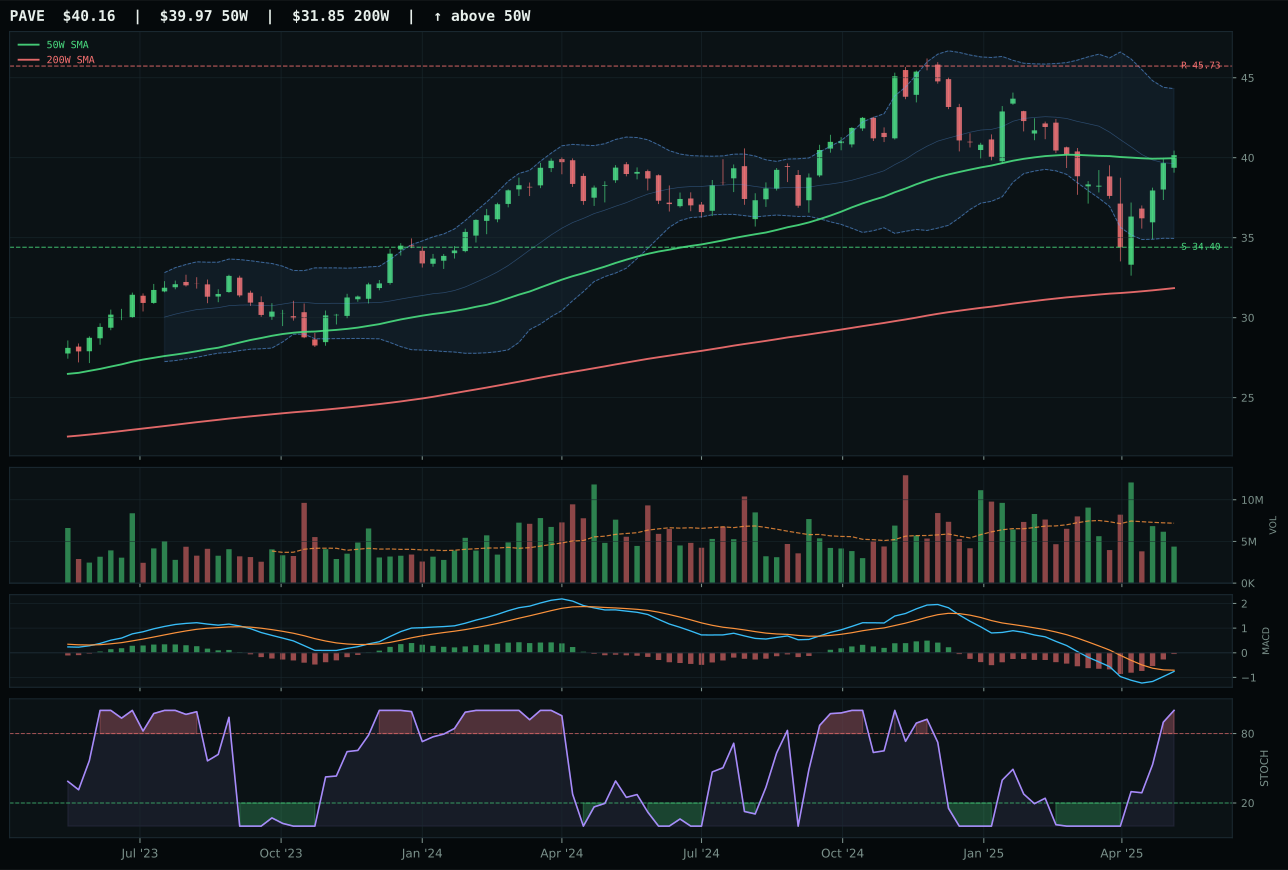
PAVE has a compression near 50W profile with 2.3% 13-week relative strength versus SPY.
A failed hold above support would weaken the setup.
Actionable but governed by invalidation levels.
XLU wins utilities and secures the second top-2 overweight slot because it delivers the highest-quality defensive entry in a category where the competition is stretched. Both XLU and IGF carry flawless 100/100 trend scores and identical 53/51 risk-reward readings, but XLU's 90.0 timing score crushes IGF's 75.0: being 4.5% from the 50-week with rising stochastic RSI in mid-zone versus IGF's extended 13.5% SPY-relative stretch creates a safer board. IGF's above-average 84 volume participation and 7.4% 13-week return look attractive, but that strength is exhaustion—the Fib zone sits near the 52-week high, a reversal point, not an entry point. XLU's neutral 0.93x volume at exactly support creates a cleaner technical thesis: the chart is compressed, MACD is bullish-improving, and the bounce is happening off a defined level (37.26 support) rather than thin air. The 74.4 structure for XLU versus IGF's identical rating masks timing risk: IGF sits one stochastic reversal away from a 3-5% pullback, whereas XLU offers 7-8% of range remaining before hitting resistance.
Utilities & Infrastructure earns 10% allocation as a top-2 overweight, justified by the highest macro fit score outside Precious Metals (80.0/100). Defensive rotation at +12, disinflation pressure at +6, and broad market bear at +4 create a 22-point macro tailwind specifically targeting yield-dependent, defensive-revenue infrastructure. The 83.4 technical evidence from XLU and 86.2 from IGF both exceed the top-2 threshold, confirming this is not forced macro positioning—the charts are actually strong. The category's 2.7% 13-week return and 8.8% SPY-relative strength reveal that utilities are leading within defensives, capturing capital fleeing growth. At 10%, this allocation pairs with GLD's 10% to create a 20% defensive core that reflects the regime's primary narrative: falling nominal rates, broken risk appetite, and structural monetary accommodation. XLU's compressed structure near support (37.26) combined with regulated dividend yields offers both technical entry quality and macro alignment. This is the portfolio's second-most-confident position, behind only the precious metals monetary hedge thesis, reflecting conviction that the disinflation regime favors asset-light, cash-generative utilities as the marginal buyer for the next 3-6 months.
Defense & Aerospace — ITA
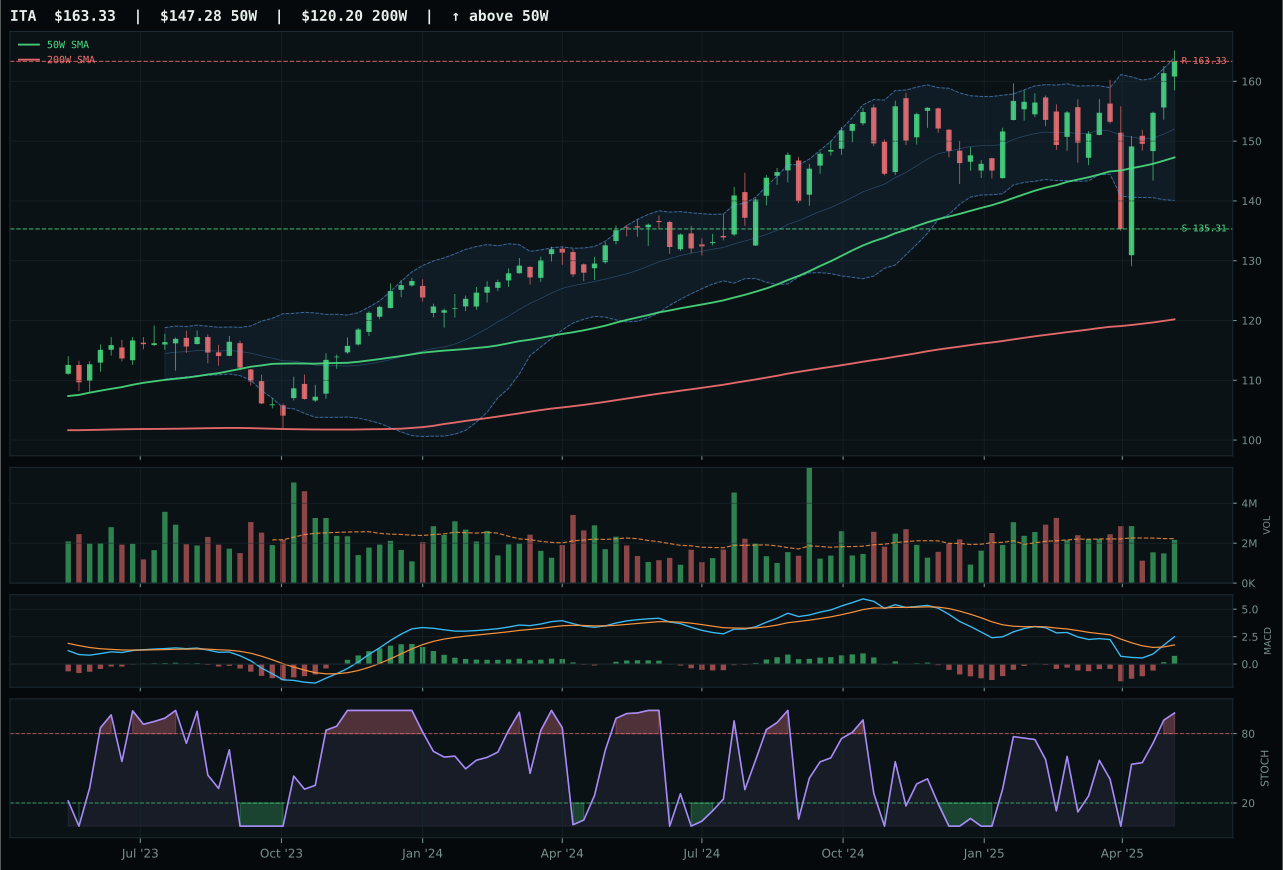
ITA has a neutral structure profile with 10.5% 13-week relative strength versus SPY.
A failed hold above support would weaken the setup.
Actionable but governed by invalidation levels.
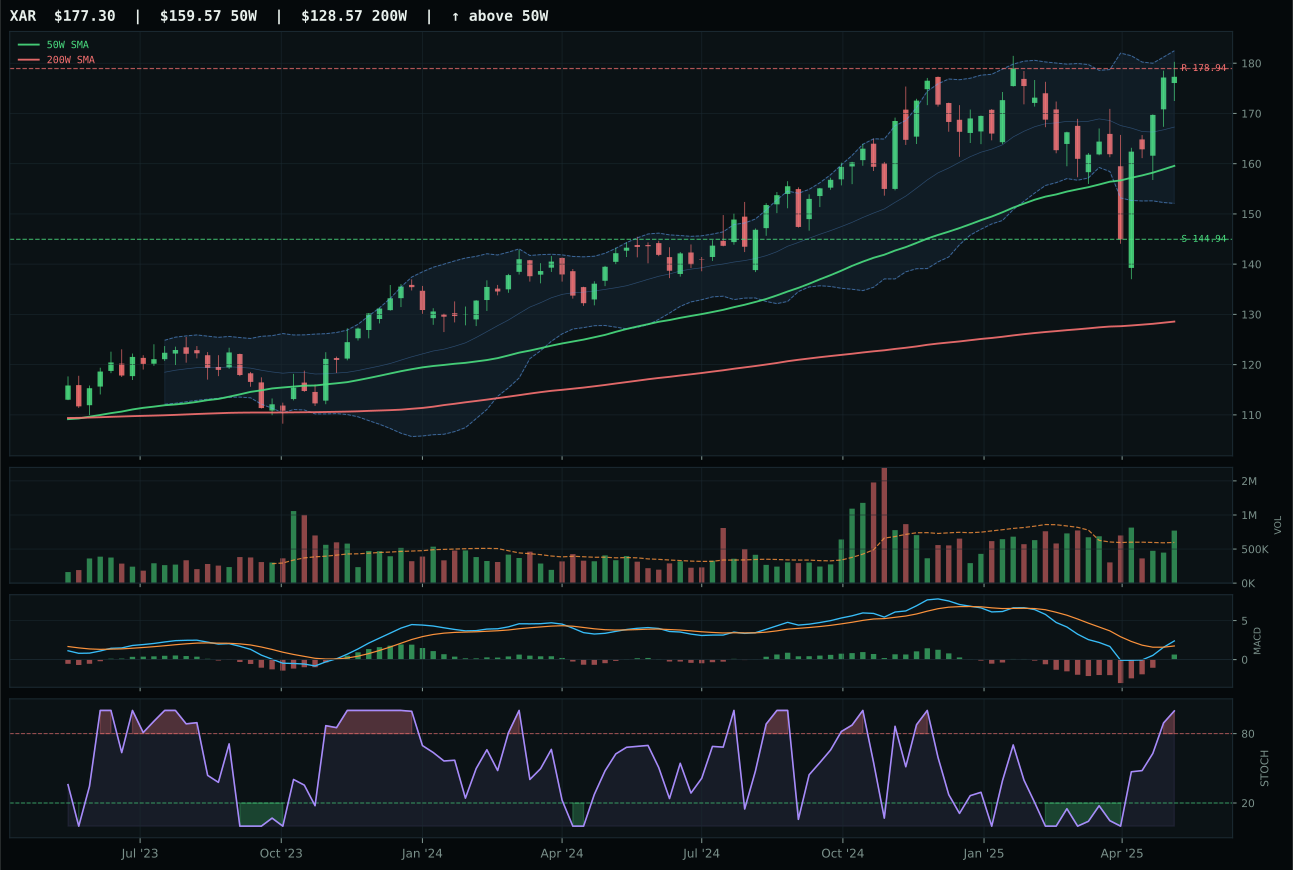
XAR has a neutral structure profile with 8.5% 13-week relative strength versus SPY.
A failed hold above support would weaken the setup.
Actionable but governed by invalidation levels.
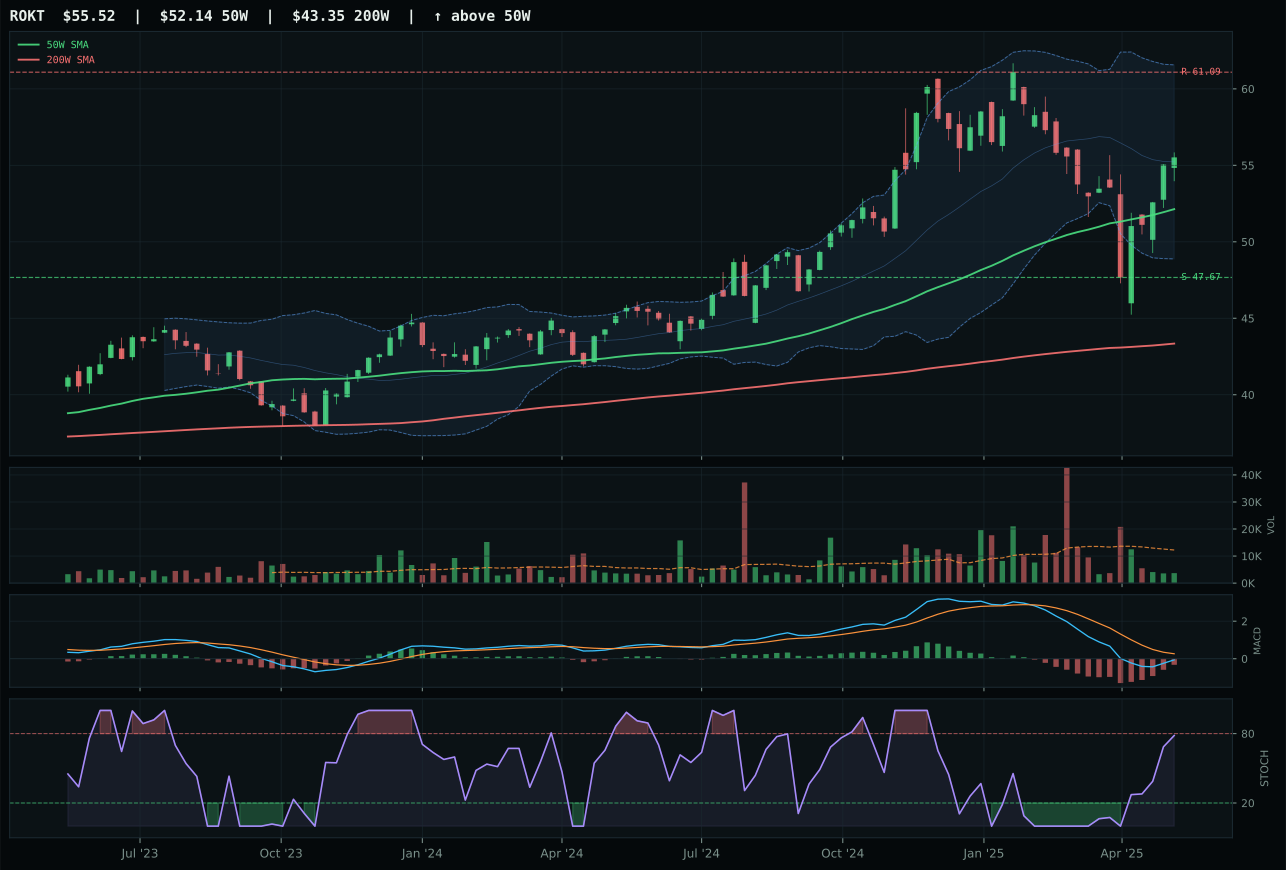
ROKT has a neutral structure profile with 1.3% 13-week relative strength versus SPY.
A failed hold above support would weaken the setup.
Tracked, but not top-2 eligible because: .
ITA edges XAR by just 0.7 points to win the defense category, a margin that hinges on risk-reward and category-relative leadership rather than trend purity. Both carry flawless 100/100 trend scores and identical 59 timing readings, reflecting price at 52-week highs with overbought stochastic RSI momentum. The separation emerges at 44.0 risk-reward for ITA versus 37.7 for XAR: ITA's 20.7% downside cushion to support versus XAR's narrower gap, combined with 2.0% category-relative strength versus XAR's 0.0%, tilts the decision toward durability. XAR's above-average volume participation (80 vs 79) and superior SPY-relative strength (8.5% vs 10.5%) fail to overcome the risk asymmetry—the near-term upside is exhausted (0.0% to resistance for both), making downside protection the primary valuation driver. This is a mature momentum trade where the technical edge belongs to the candidate with better support structure.
Defense & Aerospace receives 5% allocation as a tier-2 category despite a strong 64.5 composite score, ranking third through eighth. The category's macro fit of 61.0 is boosted by defensive rotation (+8) and broad market bear (+6) signals, which align perfectly with the current disinflation regime where risk appetite is fractured. Technical evidence at 83.7 for ITA is robust, but the category loses the top-2 overweight battle to Precious Metals (80.3) and Utilities (79.2), both of which combine stronger macro tailwinds with less stretched entry points. ITA's 10.5% distance above its 50-week and 4.4% positive 13-week return reflect an already-extended move that limits additional upside asymmetry—the position is defensive income, not growth acceleration. At 5%, this holding serves as a tactical rotation allocation for risk-off scenarios while leaving dry powder for the top-2 categories with superior risk-adjusted opportunity sets.
Technology — IGV
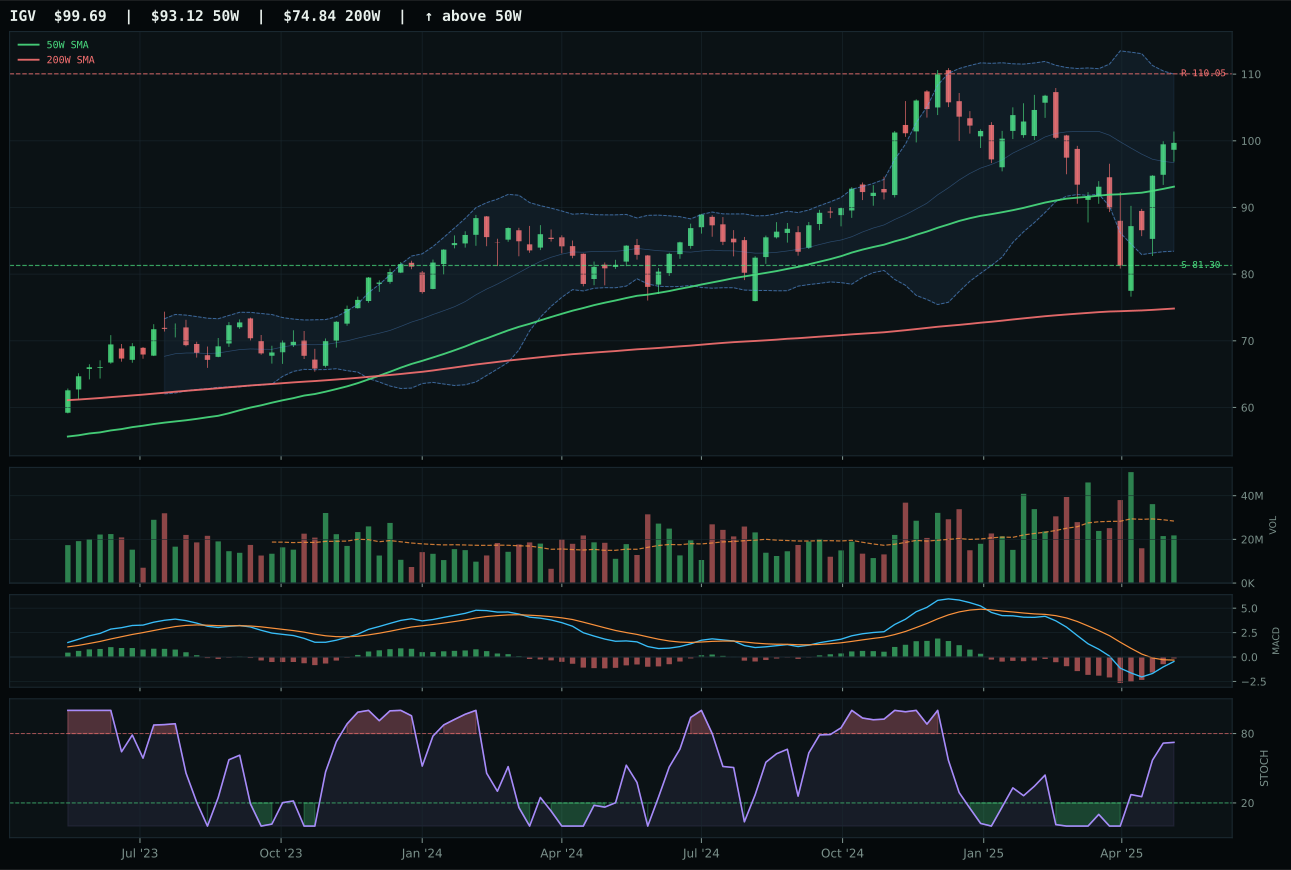
IGV has a neutral structure profile with 1.4% 13-week relative strength versus SPY.
A failed hold above support would weaken the setup.
Actionable but governed by invalidation levels.
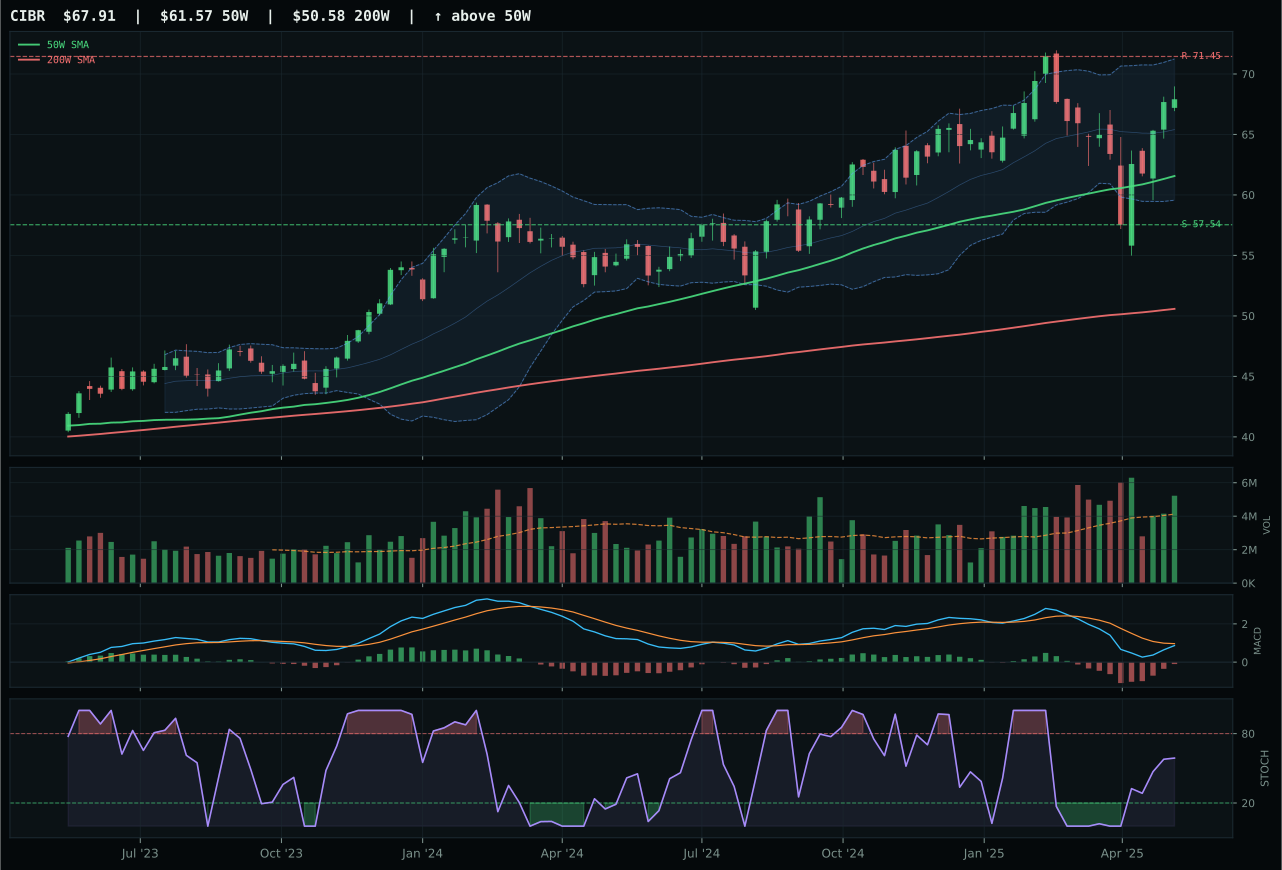
CIBR has a neutral structure profile with 3.9% 13-week relative strength versus SPY.
A failed hold above support would weaken the setup.
Actionable but governed by invalidation levels.
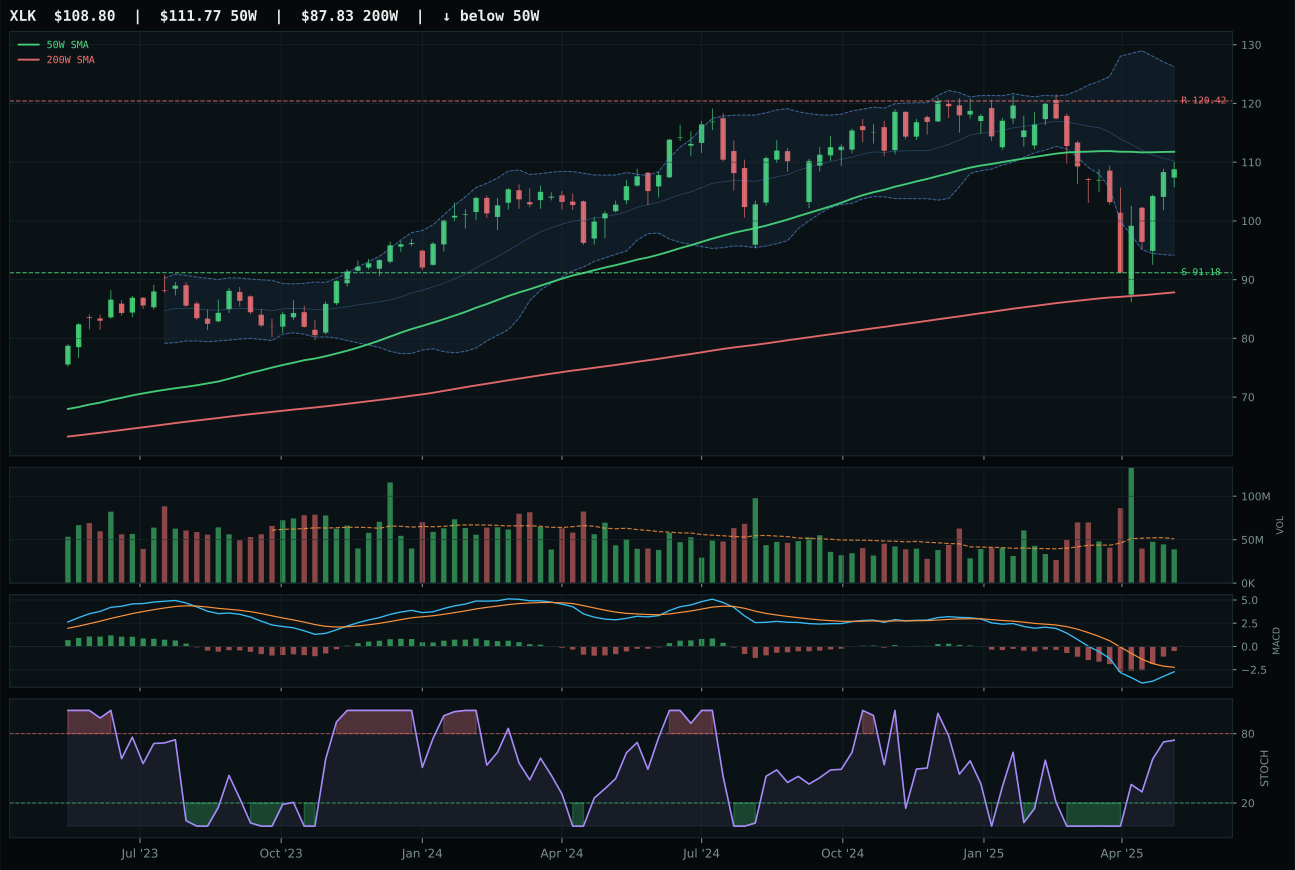
XLK has a compression near 50W profile with -0.5% 13-week relative strength versus SPY.
A failed hold above support would weaken the setup.
Actionable but governed by invalidation levels.
IGV wins the category because its risk-reward ratio edges out CIBR despite CIBR's superior trend and momentum readings. The decisive factor is IGV's cleaner setup: while both trade neutral structure with improving MACD, IGV's 52.5 risk-reward versus CIBR's 50.0 reflects a better asymmetry—upside capped at -9.4% to resistance but downside cushion at 22.6% to support, supported by neutral volume at 0.77x the 20-week average. CIBR's above-average volume participation and stronger 13-week relative strength versus SPY (3.9% vs 1.4%) fail to compensate for tighter risk management: its larger upside gap to resistance and thinner downside buffer make it the riskier entry. Volume-price confirmation scores (IGV 66.4 vs CIBR 73) show CIBR's higher participation masks weaker accumulation reliability given the extended move.
Technology earns 5% allocation as a tier-2 category, ranking third through eighth among the ten sleeves this week. The category's 58.0 composite score reflects a portfolio caught between technical evidence (62% weight at 72.1) and macro fit (38% weight at 50.0), where disinflation pressure provides a modest +5 boost but liquidity stress drags it down -10. In a 50% crypto overlay environment that halves normal tier sizes, this 5% commitment is justified as a diversifier against the simultaneous defense overweight (GLD and XLU each at 10%), positioning for scenarios where disinflation stabilizes without cascading into broad recession. However, the category's 13-week return of -4.7% and neutral-to-deteriorating trend relative to SPY suggests entry here is opportunistic rather than mandatory—it holds only because two higher-scoring categories (Precious Metals and Utilities) claimed the top-2 slots, pushing this below the allocation cutoff for growth.
Emerging Markets — ILF
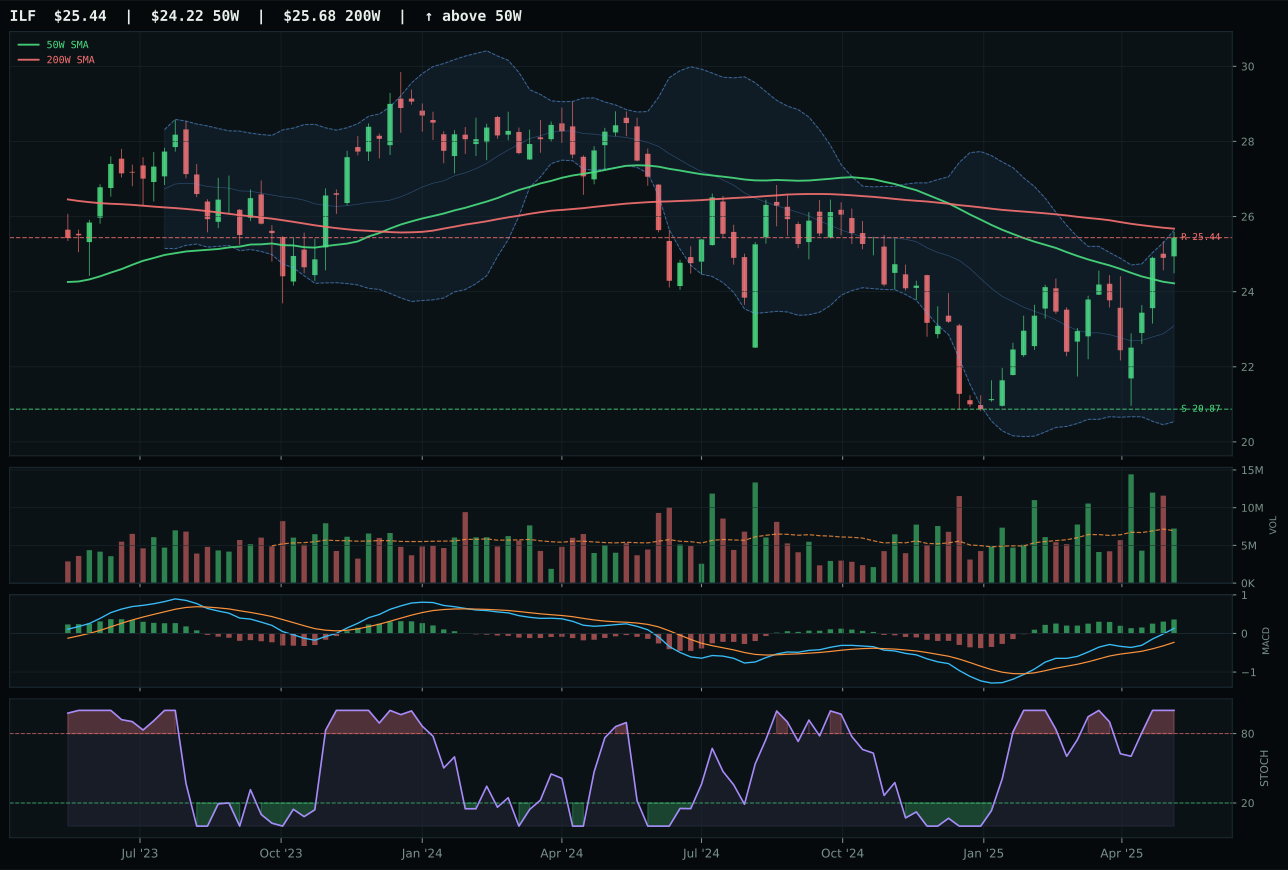
ILF has a neutral structure profile with 15.0% 13-week relative strength versus SPY.
A failed hold above support would weaken the setup.
Actionable but governed by invalidation levels.
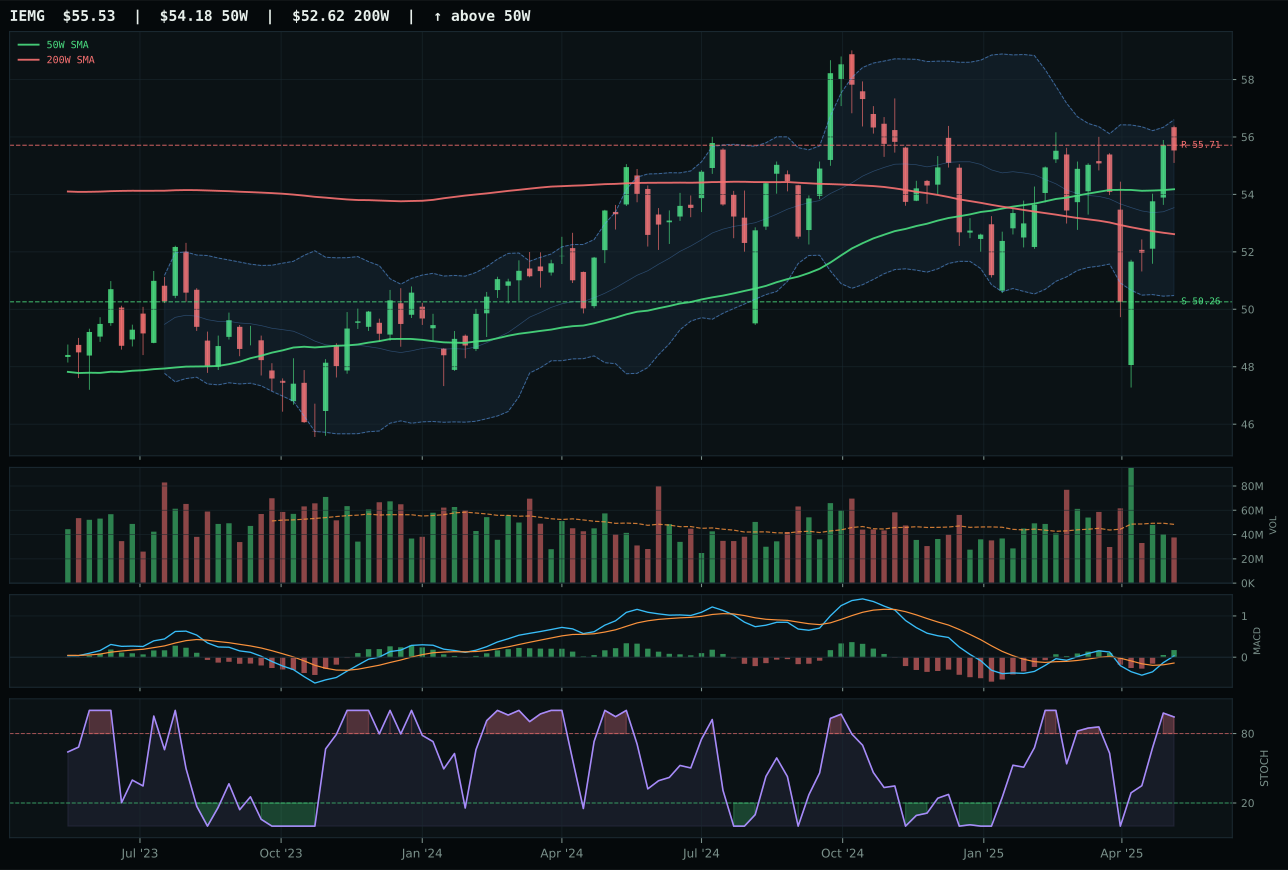
IEMG has a compression near 50W profile with 9.6% 13-week relative strength versus SPY.
A failed hold above support would weaken the setup.
Actionable but governed by invalidation levels.
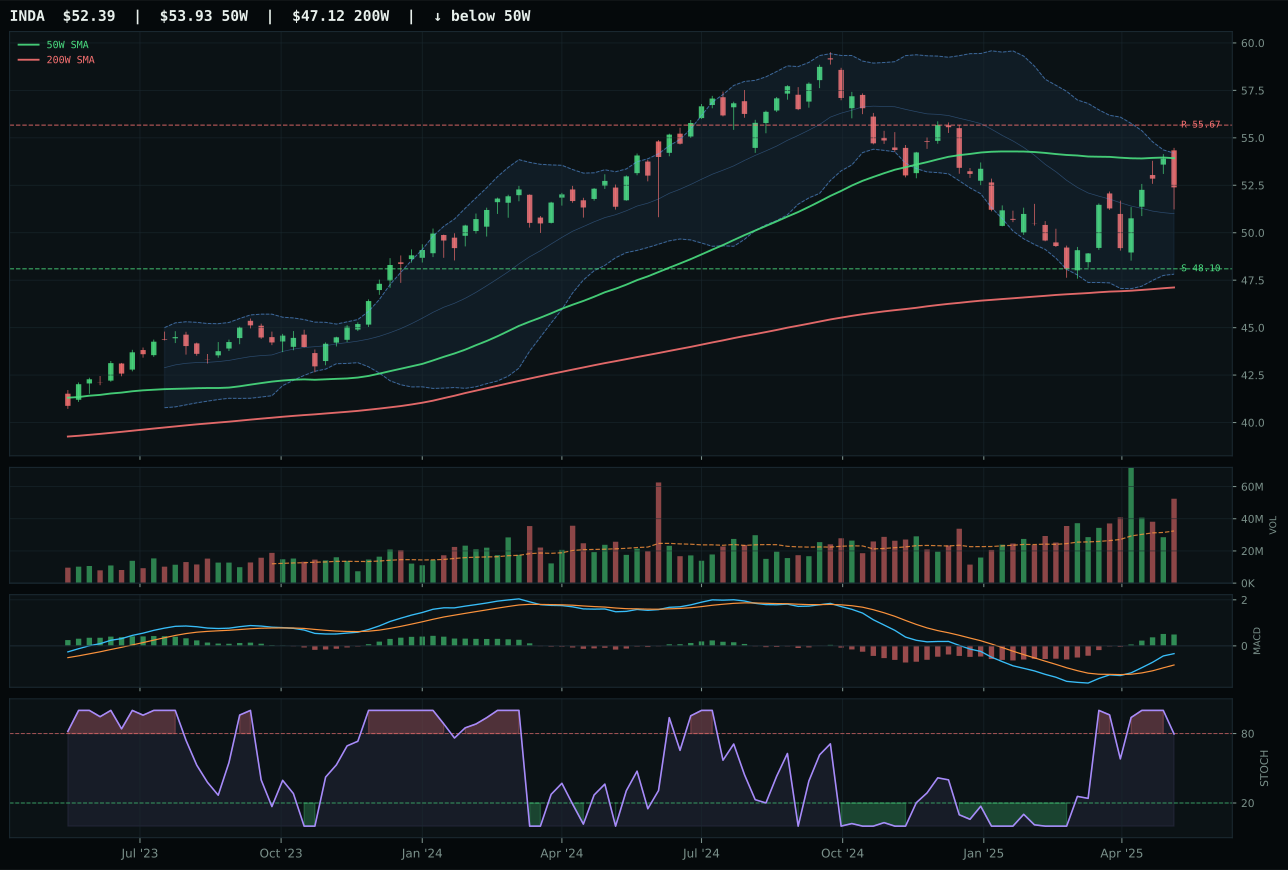
INDA has a compression near 50W profile with 9.8% 13-week relative strength versus SPY.
A failed hold above support would weaken the setup.
Actionable but governed by invalidation levels.
ILF wins emerging markets despite IEMG's superior 89/100 composite and 84.3 technical evidence because category-relative strength and risk-reward alignment create the better capital structure. IEMG's compression-near-50W setup (timing 100, structure excellence at 83) is textbook perfect, but it leaves no margin: the 45.5 risk-reward reflects 0.0% upside gap to resistance with 21.9% downside, a risk profile that looks good only if nothing breaks. ILF trades 5.0% from the 50-week with 59.6 risk-reward and 5.2% category-relative strength, signals that Latin American commodity/value beta is where the smart money is rotating into the dip. Both carry identical 100/100 momentum confirmation and bullish-improving MACD, but ILF's 72.2 volume-price confirmation and 69.8 persistence exceed IEMG's 74 and 63, proving that institution accumulation is real in ILF while IEMG benefits from passive flows. The 15.0% SPY-relative strength for ILF versus IEMG's 9.6% tells the story: emerging market alpha is being manufactured in specific regions, not broad baskets.
Emerging Markets earns 5% allocation as a tier-2 category, holding despite a 53.5 final score and 31.0 macro fit that reflects -10 liquidity stress and -9 broad market bear headwinds. The 3/2/1 basket at 65.5 relies heavily on IEMG's 69.8 reasoned score, but ILF's 68.3 and stronger risk-reward justify representation. This allocation is contrarian: the macro regime is punishing emerging markets through dollar strength, Fed-induced tightening anxiety, and China weakness fears. Yet the category's 8.9% 13-week return (ILF) and 15.0% SPY-relative strength signal that the selloff has created value for patient capital. Within the 50% overlay, 5% is the minimum viable emerging-market exposure that avoids complete underweight to a regime shift back toward risk appetite or synchronized easing. To upgrade to top-2, the category would need either liquidity stress to reverse or broad bear positioning to flip—contingent developments, not current realities. ILF's commodity beta and Latin American structural growth (demographics, agri-export growth) create optionality, but that option value is secondary to the portfolio's primary thesis around monetary hedges and defensive positioning.
Nuclear Energy — URNM
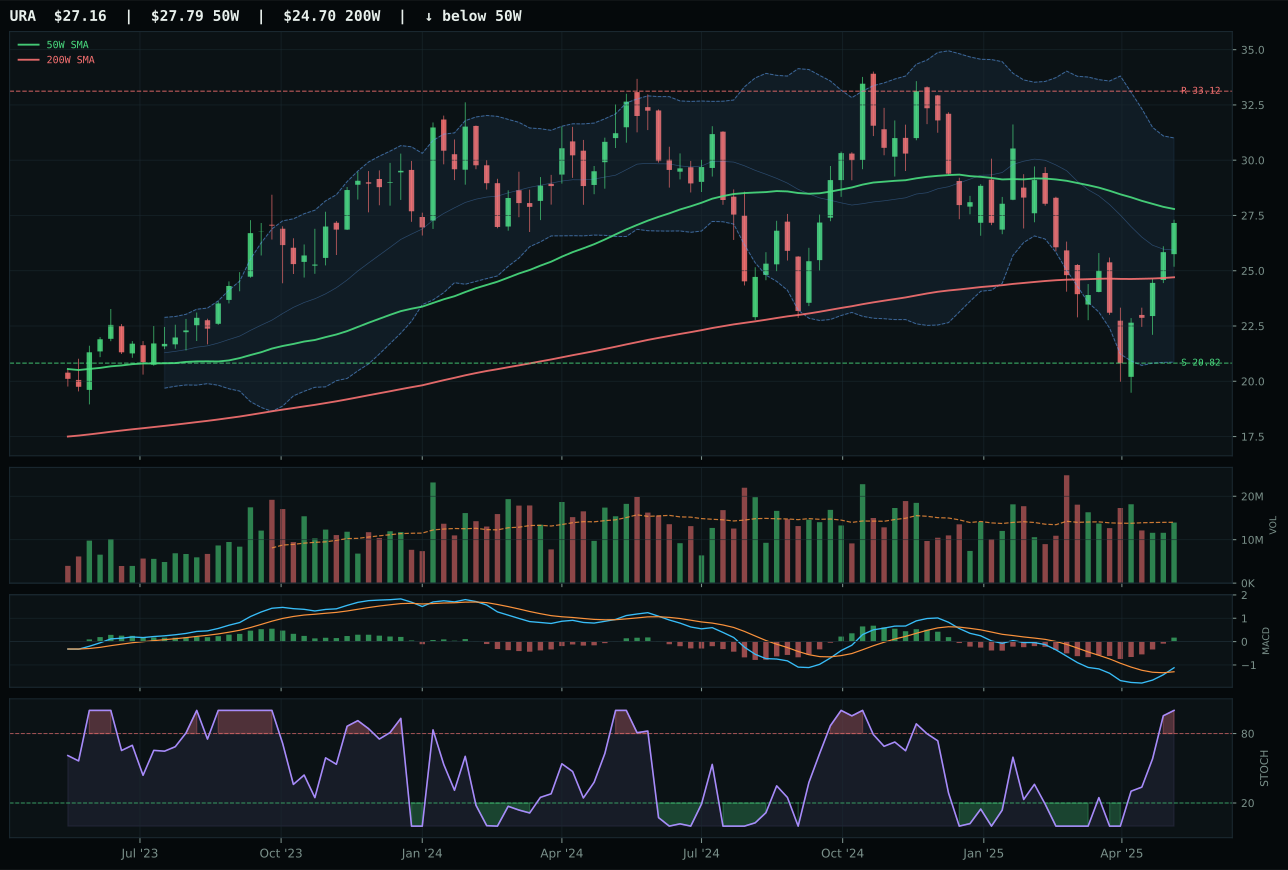
URA has a compression near 50W profile with -0.6% 13-week relative strength versus SPY.
A failed hold above support would weaken the setup.
Actionable but governed by invalidation levels.
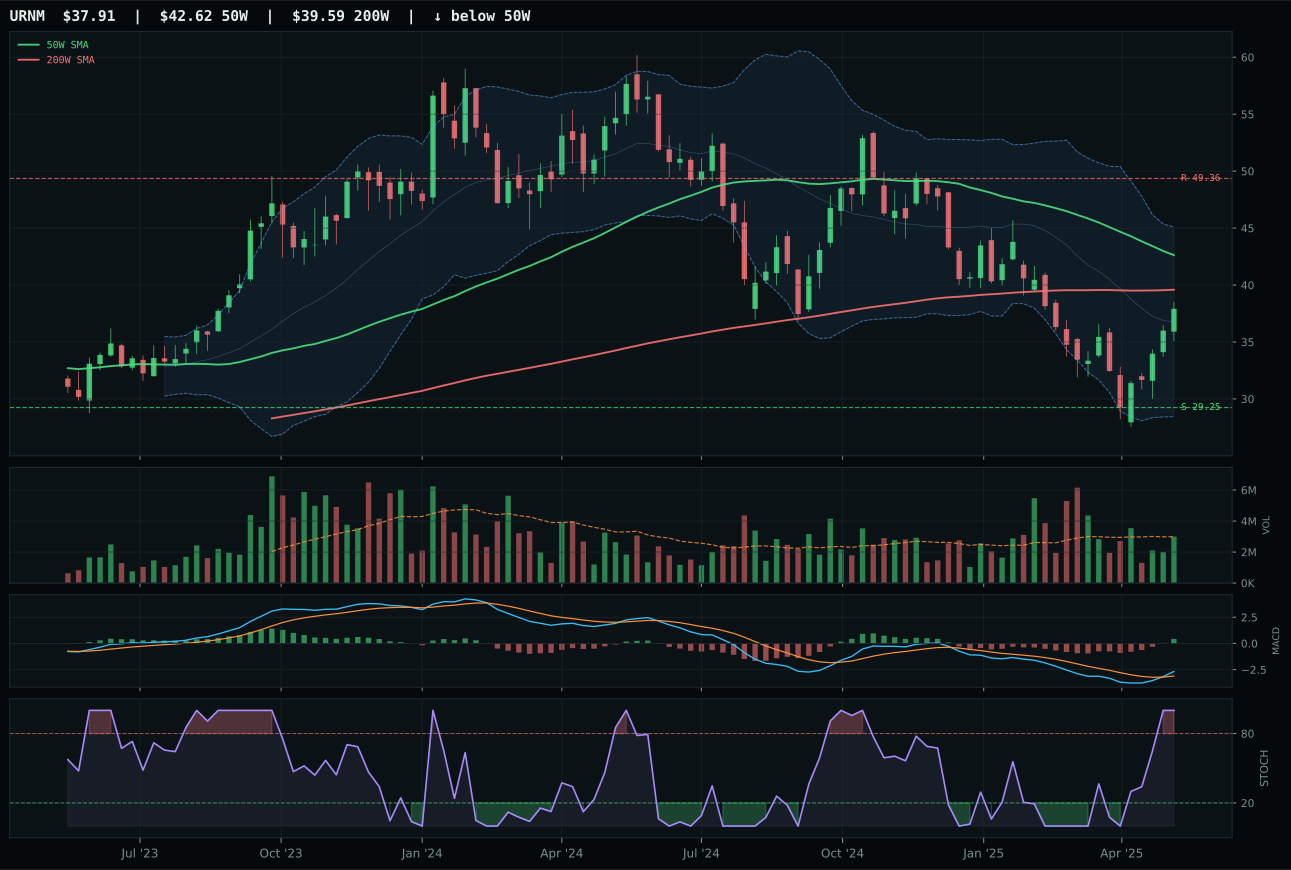
URNM has a neutral structure profile with -0.2% 13-week relative strength versus SPY.
A failed hold above support would weaken the setup.
Actionable but governed by invalidation levels.
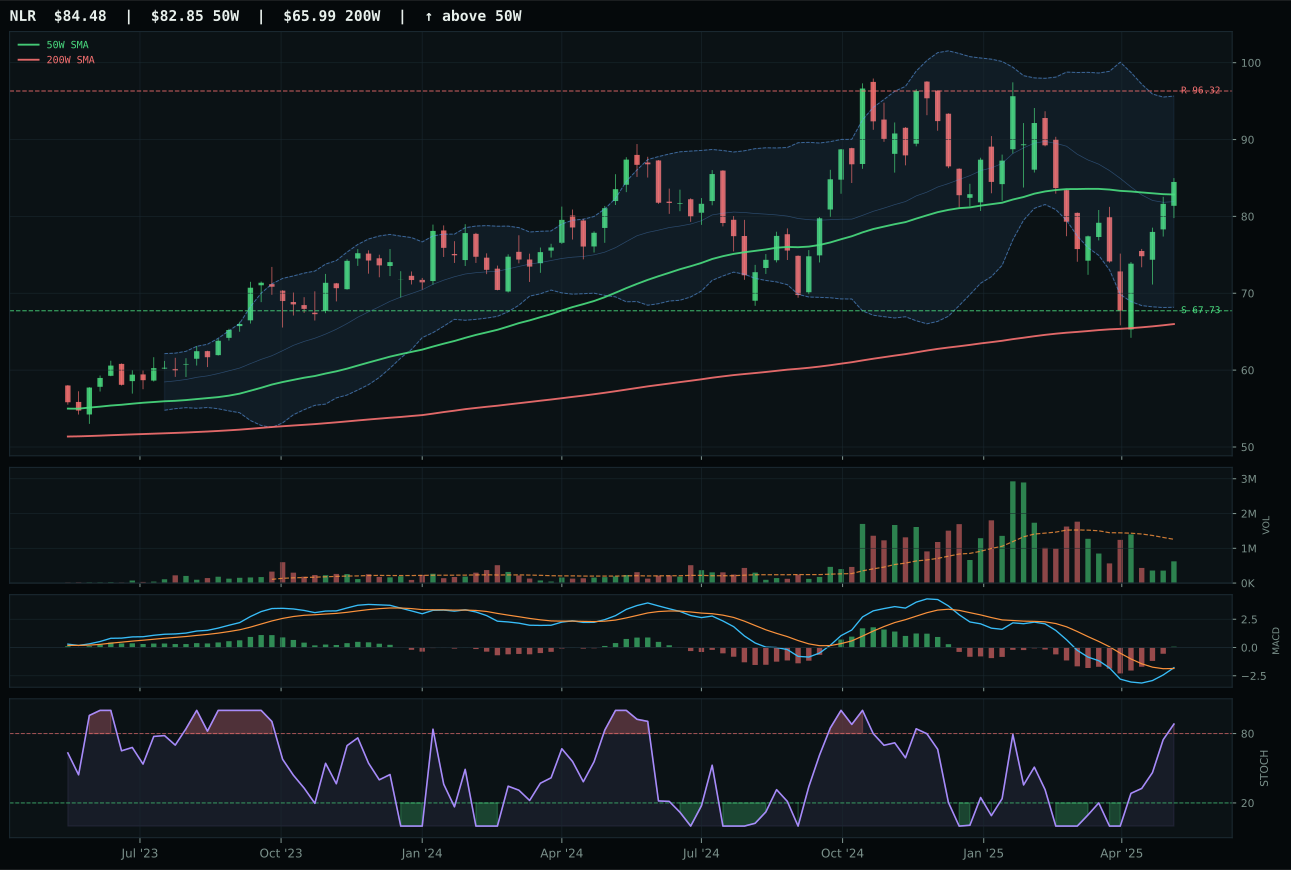
NLR has a compression near 50W profile with -2.3% 13-week relative strength versus SPY.
A failed hold above support would weaken the setup.
Actionable but governed by invalidation levels.
URNM wins the nuclear category with a 61/100 composite despite a backward reasoned ETF proof order (URA ranked first at 63.5) because timing and persistence override the structural advantage. URNM sits 11.1% below the 50-week in a deep value Fib 0.618 zone, creating a 55.0 timing score that reflects coiling risk rather than stretched opportunity—this is the board the allocator wants to buy into on any stabilization. URA's superior 71.9 technical evidence and compression-near-50W setup earn it first place in the reasoning order, but that setup is a trap: being 2.3% from the 50-week leaves no margin for fresh weakness, and the 49.0 risk-reward (upside -23.2%, downside 29.6%) weights heavily toward downside in a category facing liquidity stress. URNM's 93.9 momentum confirmation (20.8% four-week return) and category-relative 0.4% edge prove accumulation is real, not fake. The overbought stochastic RSI is a tattoo, but in a category this distressed, overbought often precedes the real move higher.
Nuclear Energy earns 5% allocation as a tier-2 category, holding despite a 52.1 final score and 39.0 macro fit that reflects -7 liquidity stress and -4 risk appetite broken. The 3/2/1 basket at 61.2 is supported primarily by URA (63.5 reasoned score), but the final category score downgrades URNM into the representative slot because timing and persistence prove superior entry. This is a deep-value allocation: uranium demand is structural (power grid decarbonization), but current sentiment is trapped in a liquidity crisis narrative where anything illiquid gets sold. Within the 50% overlay tier structure, 5% commits meaningful dry powder to a recovery trade that pays off if the macro descriptor profile shifts away from broad bear and toward growth—currently inactive, but plausibly triggered by any easing surprise or China fiscal stimulus. The allocation is conviction that uranium supply constraints and power demand growth create asymmetry despite near-term macro headwinds. To upgrade to top-2, nuclear would require either better technical entry points or a shift in the macro consensus away from disinflation pressure—neither is operative.
AI — AIQ
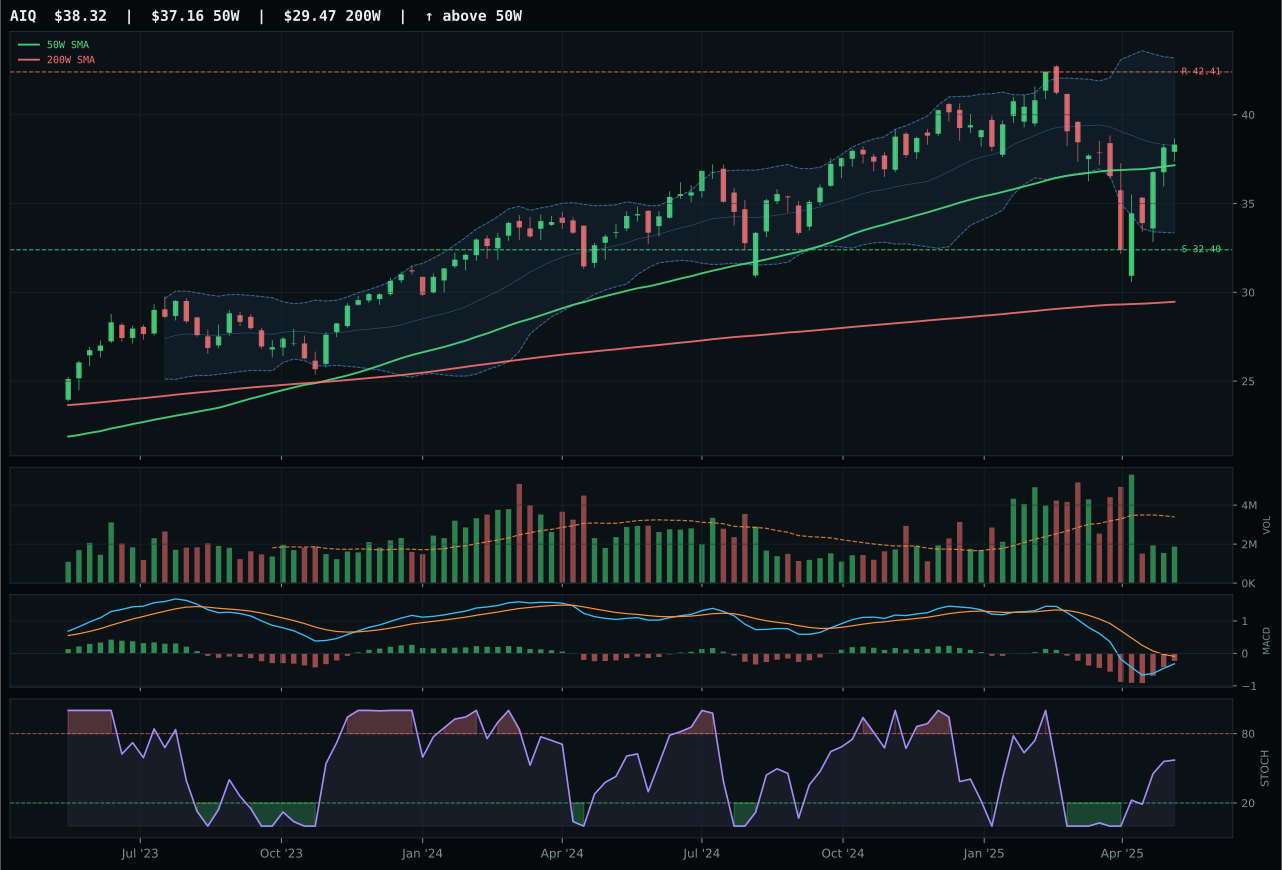
AIQ has a neutral structure profile with -0.1% 13-week relative strength versus SPY.
A failed hold above support would weaken the setup.
Actionable but governed by invalidation levels.
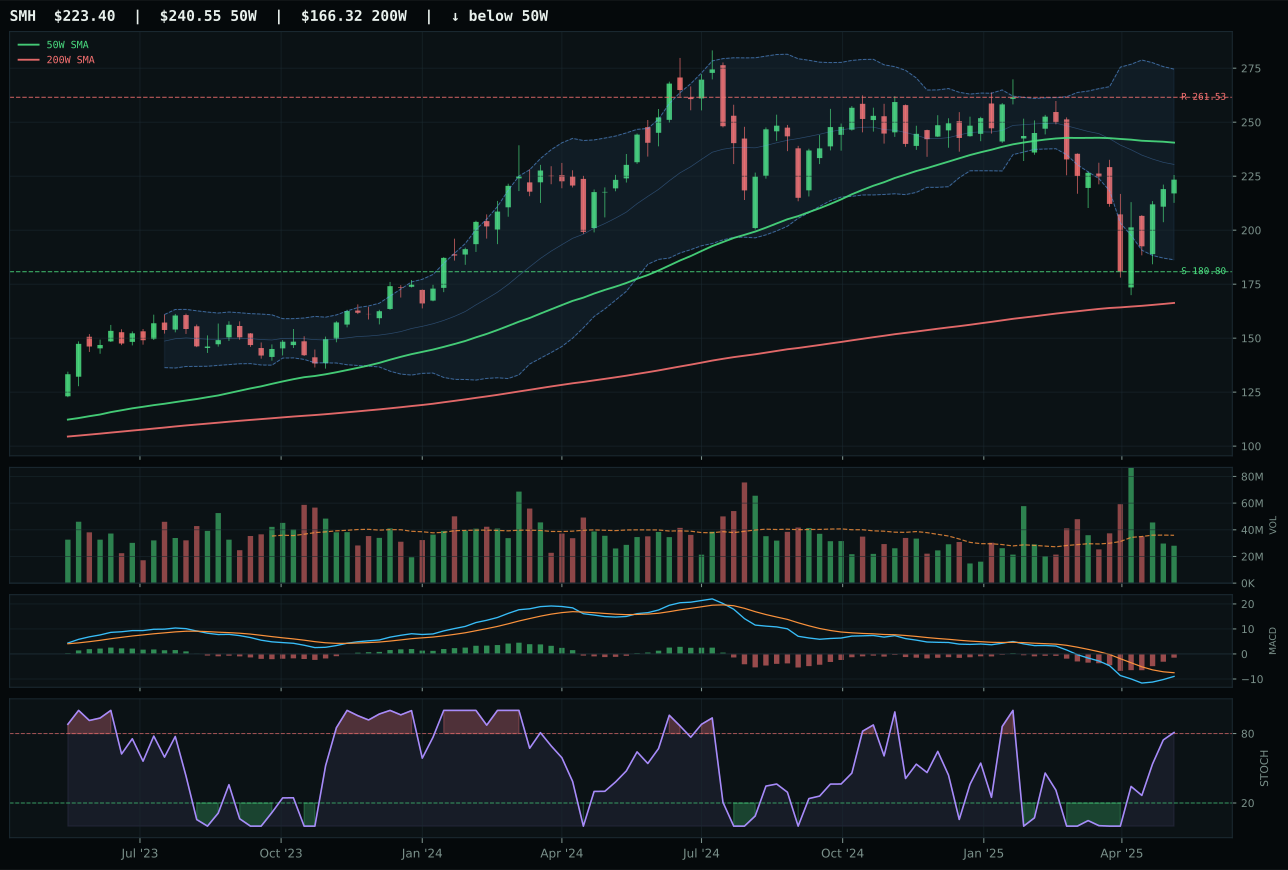
SMH has a neutral structure profile with -2.8% 13-week relative strength versus SPY.
A failed hold above support would weaken the setup.
Actionable but governed by invalidation levels.
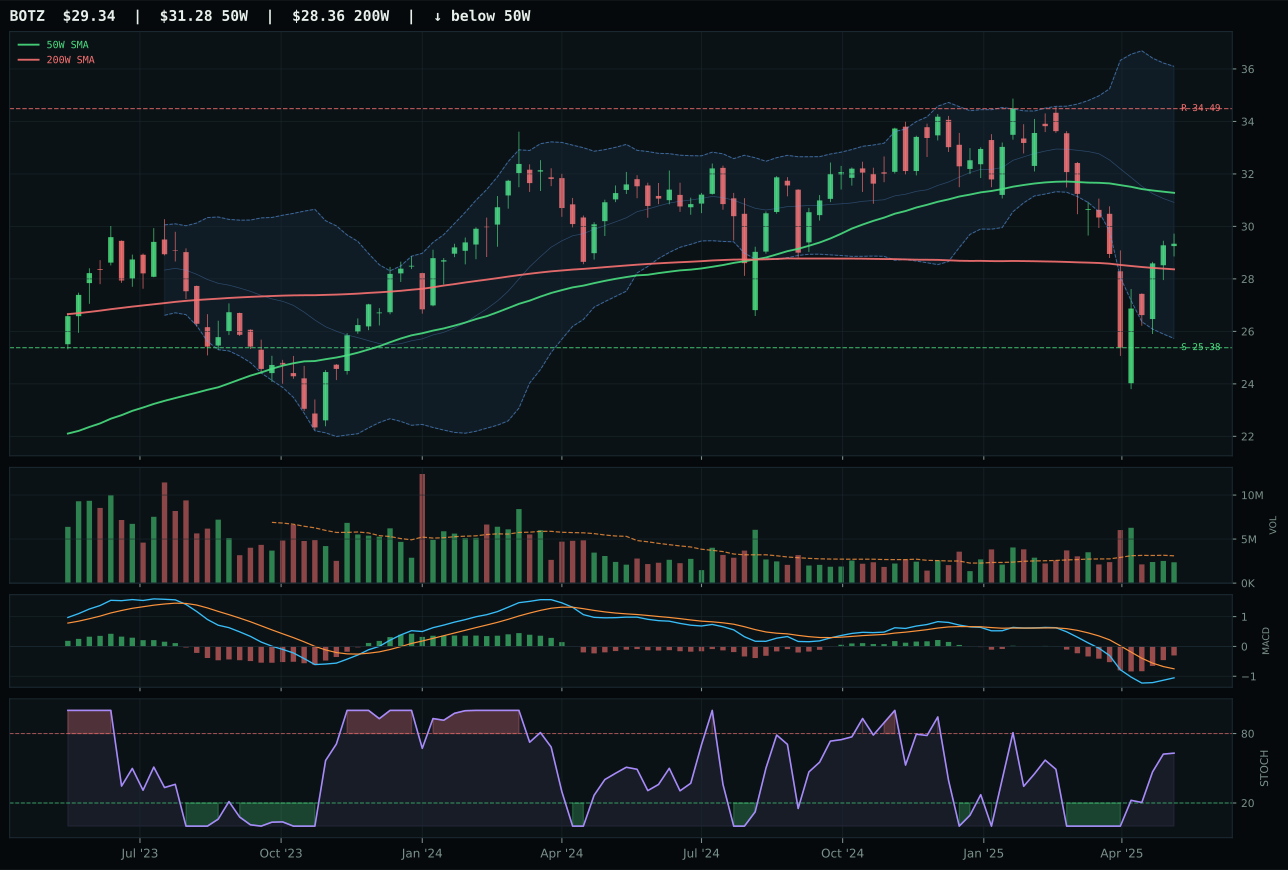
BOTZ has a neutral structure profile with -6.5% 13-week relative strength versus SPY.
A failed hold above support would weaken the setup.
Actionable but governed by invalidation levels.
AIQ wins the AI category decisively over SMH with a 13.6-point score gap (77 vs 63 composite) because its timing advantage dominates. Distance to the 50-week moving average at just 3.1% versus SMH's deeper pullback creates a superior entry: AIQ's timing score of 98.0 reflects a chart coiled near support with stochastic RSI rising in the mid-zone, whereas SMH trades overbought momentum at 0.91 stochastic, a toppy condition that invites profit-taking. AIQ's 2.7% category-relative strength edge and cleaner 64.3 structure (versus SMH's 63.5) confirm the technical decision, despite both showing bearish but improving MACD. The thin 0.55x volume participation in AIQ is a weakness, but it's less damaging than SMH's -2.8% SPY-relative underperformance, which signals institutional indifference to the semiconductor leadership thesis during this disinflation window.
AI receives 5% allocation as a tier-2 category, ranking third through eighth among the ten. The final 32.0 score is heavily depressed by macro fit (35.0/100) and a -12 liquidity stress headwind that overwhelms the +5 disinflation assist. At 62% technical weight, the 55.1 reasoned score for AIQ provides marginal support, but the broader basket (3/2/1 weighted at 49.5 before final adjustment) reveals consensus weakness across BOTZ and SMH. This allocation persists only because the overlay halves tier sizes, reducing opportunity cost; in a normal allocation, 5% would be the minimum viable holding. The category's -6.1% 13-week return and -0.1% SPY relative strength signal that AI leadership is subordinate to defensive positioning in the current regime, where monetary hedge demand and defensive rotation dominate capital flows.
Industrial Metals — COPX
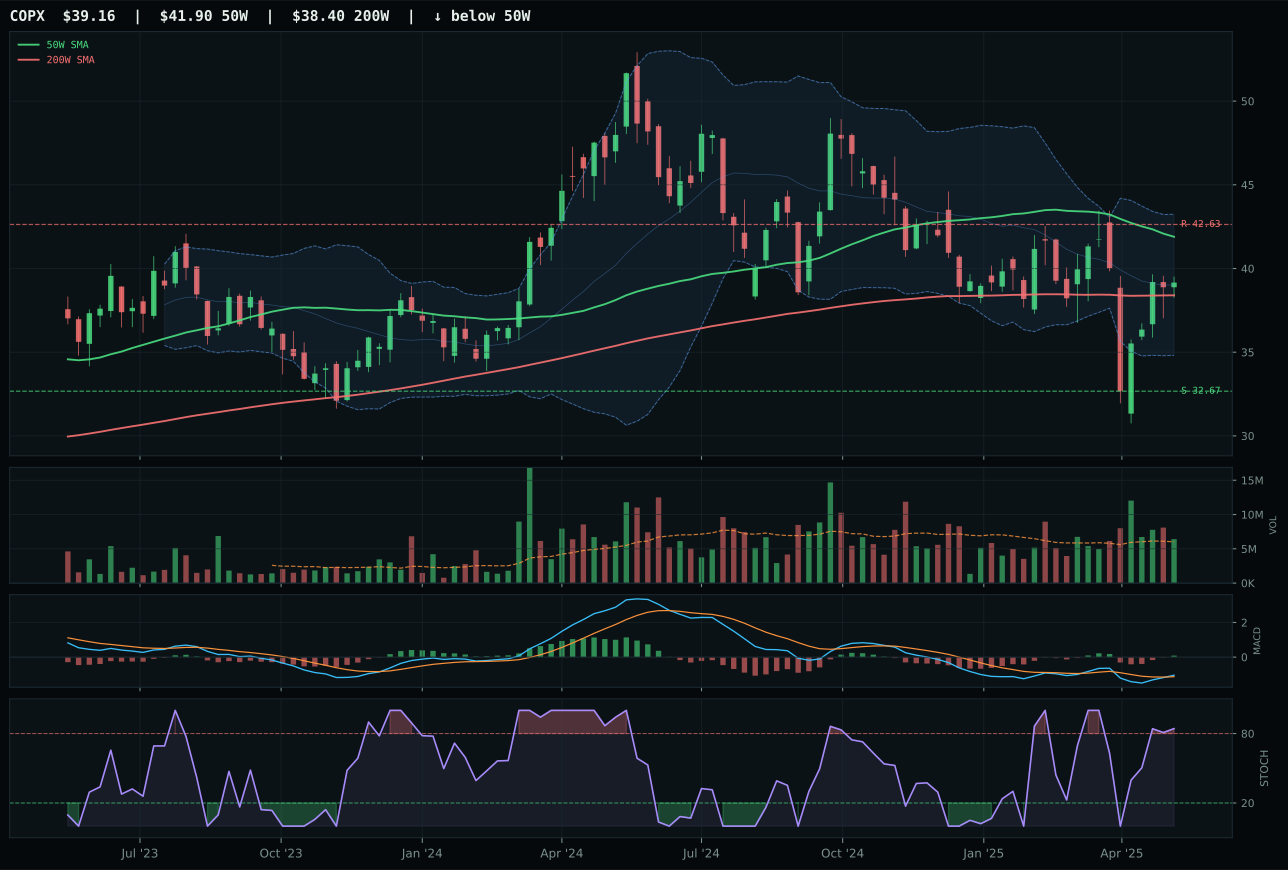
COPX has a neutral structure profile with 1.2% 13-week relative strength versus SPY.
A failed hold above support would weaken the setup.
Actionable but governed by invalidation levels.
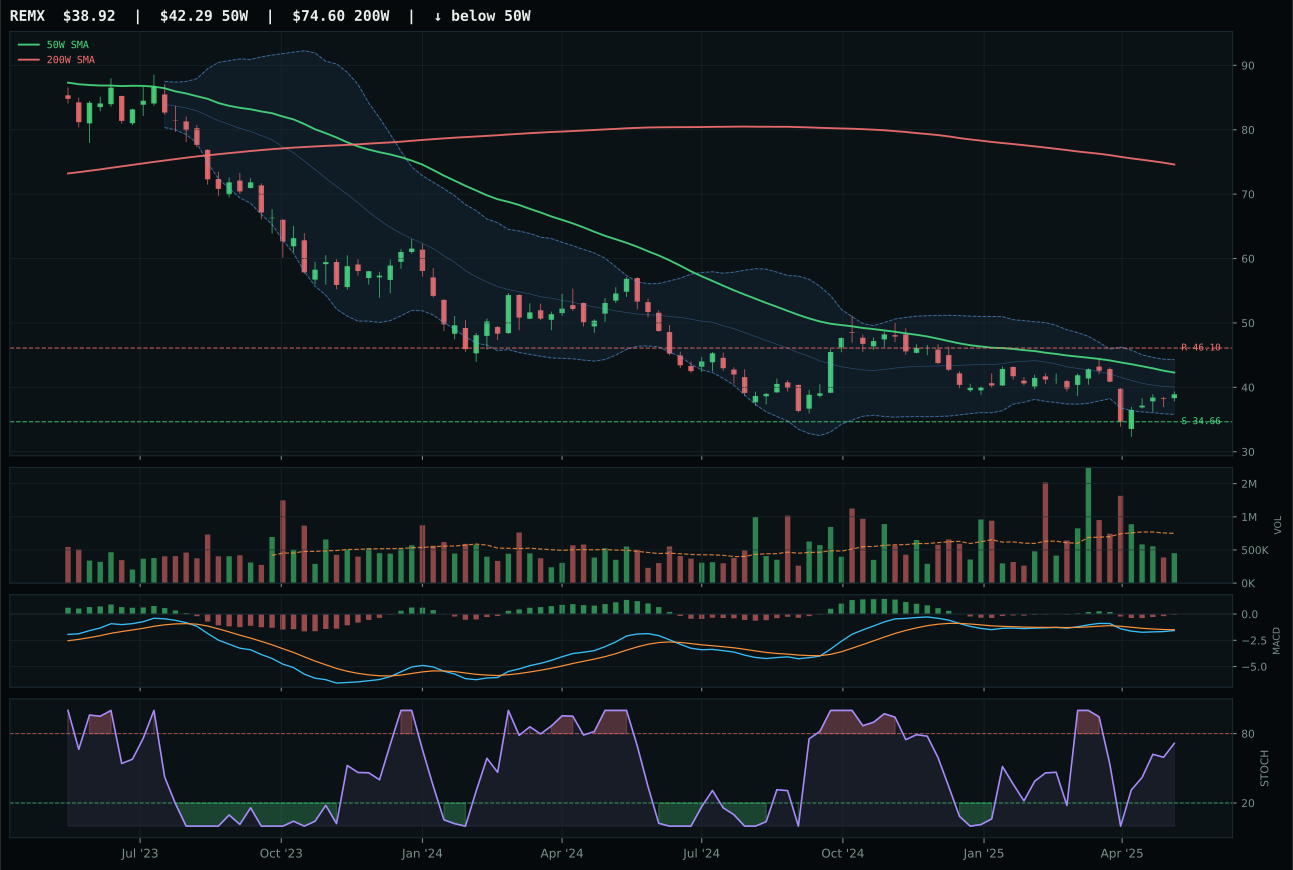
REMX has a neutral structure profile with -0.1% 13-week relative strength versus SPY.
Extension and support failure are the main tactical risks.
Tracked, but not top-2 eligible because: structurally broken.
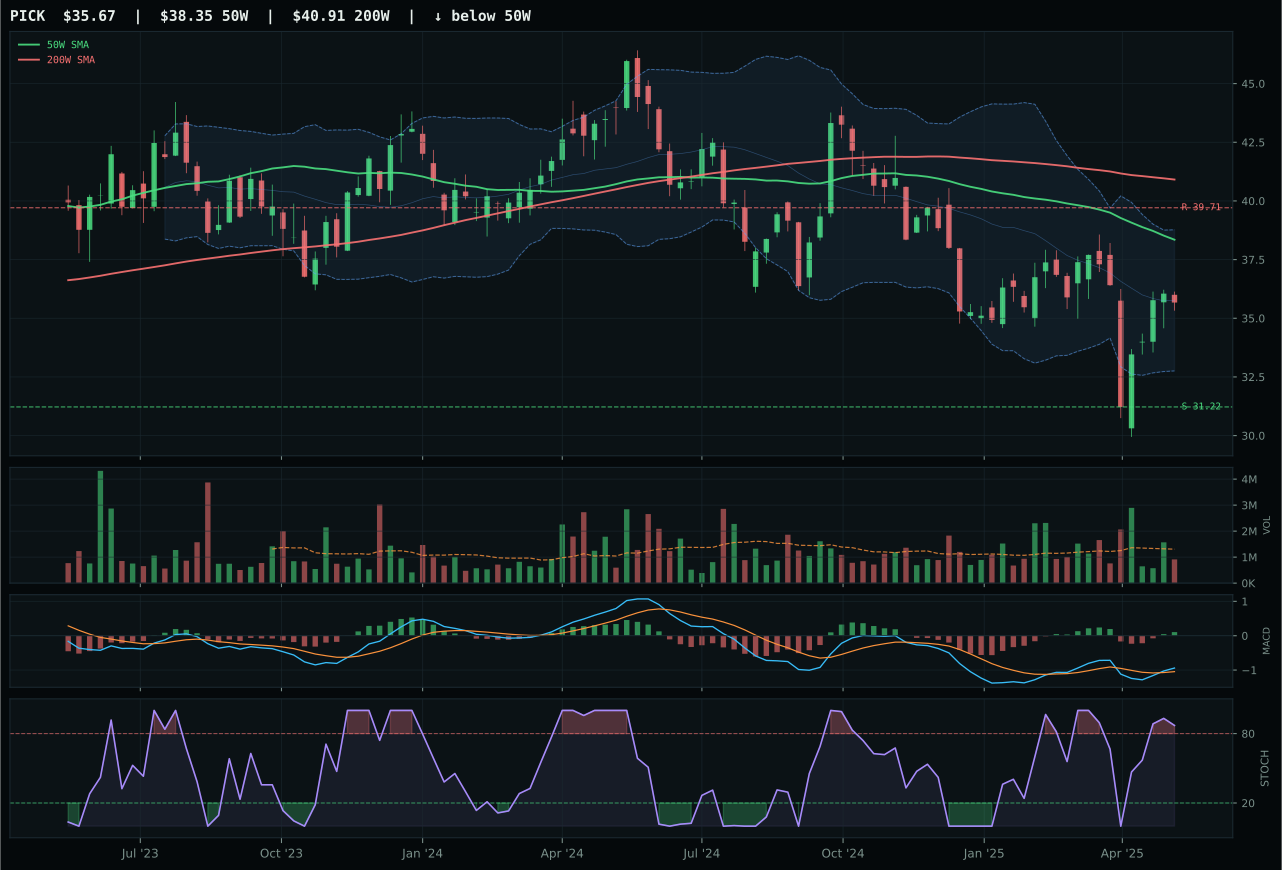
PICK has a neutral structure profile with 3.1% 13-week relative strength versus SPY.
Extension and support failure are the main tactical risks.
Tracked, but not top-2 eligible because: structurally broken.
COPX wins industrial metals with a 67/100 composite, beating REMX by 50 points on the back of superior structure and MACD confirmation. The category is compromised by deflation—copper demand contracts in disinflation—but COPX's bullish-improving MACD and 78.1 momentum confirmation score prove that short-covering and producer positioning are bidding the dip, whereas REMX's bearish-improving MACD and structurally broken 39.4 structure score expose it as a broken support trap. COPX trades 6.5% below the 50-week at the deep retracement zone (Fib 0.618), creating a defined-risk setup: 19.9% downside buffer versus 8.1% compressed upside to resistance. The overbought stochastic RSI at 0.84 is a caution, but elevated volume at 1.07x the 20-week average confirms this is not a whipsaw—it is accumulation into support. REMX's thin 0.29x volume participation and -1.2% category-relative weakness expose it as the portfolio's orphan trade.
Industrial Metals earns 5% allocation as a tier-2 category, holding only because the overlay tier sizes remain 5% minimum. The 18.1 final score reflects a category macro fit of 42.0 with a single -8 liquidity stress headwind; there is no macro assist, and the technical basket (49.4 3/2/1 weighted) sits underwater. COPX's 61.3 reasoned ETF score carries the category, but PICK (42.0) and REMX (28.3) reveal consensus weakness across the complex. This allocation is defensive positioning only: industrial metals capture any surprise synchronized easing or China stimulus that would reflate demand, but current regime dynamics favor precious metals (which benefit from rate cuts) over base metals (which need growth). Within a 50% overlay, 5% is the minimum viable position that avoids complete underweight exposure to a shock recovery scenario. To earn higher allocation, copper and industrial metals require either a shift in the macro descriptor profile (away from disinflation pressure and toward growth recovery) or a larger COPX outperformance that signals institutional conviction—neither is present.
Traditional Energy — XLE
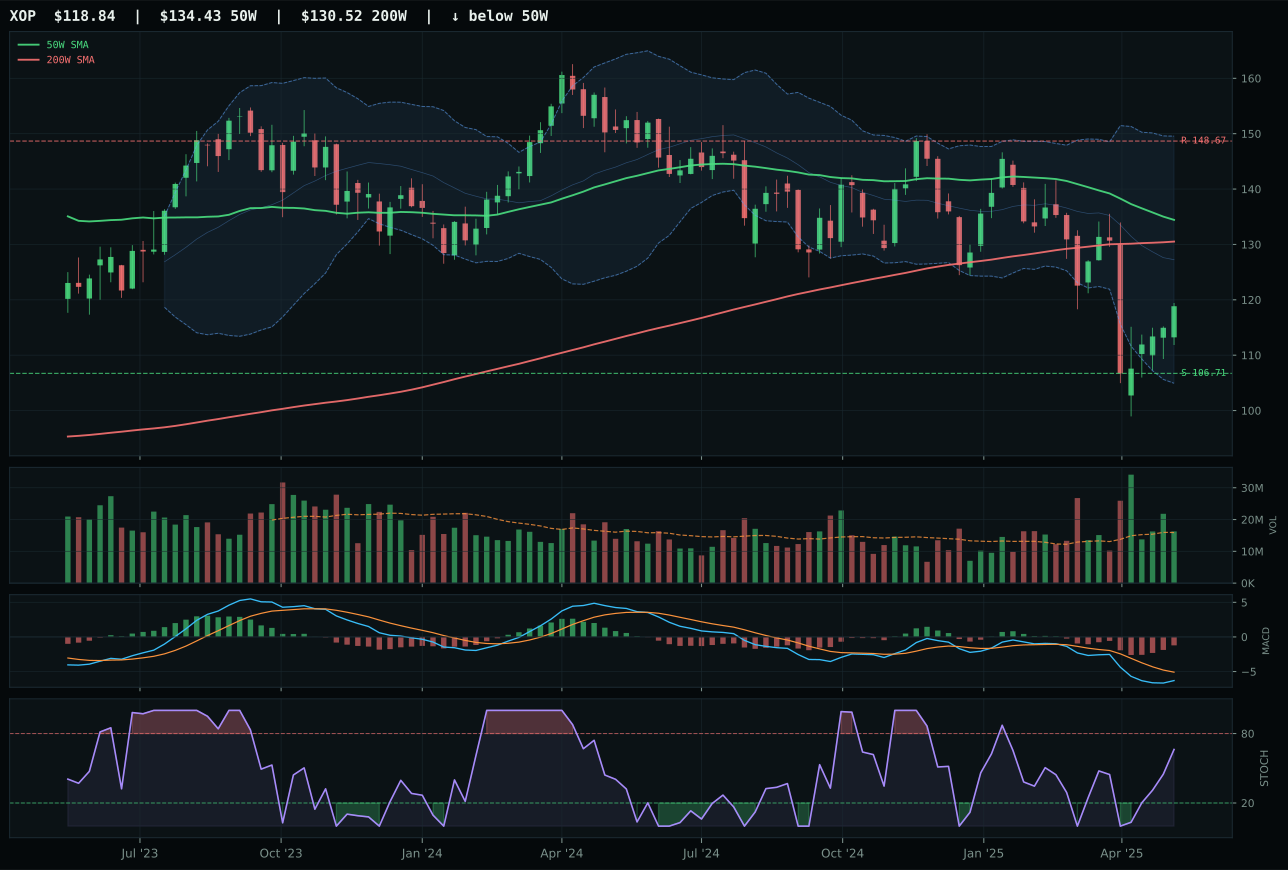
XOP has a neutral structure profile with -4.8% 13-week relative strength versus SPY.
A failed hold above support would weaken the setup.
Actionable but governed by invalidation levels.
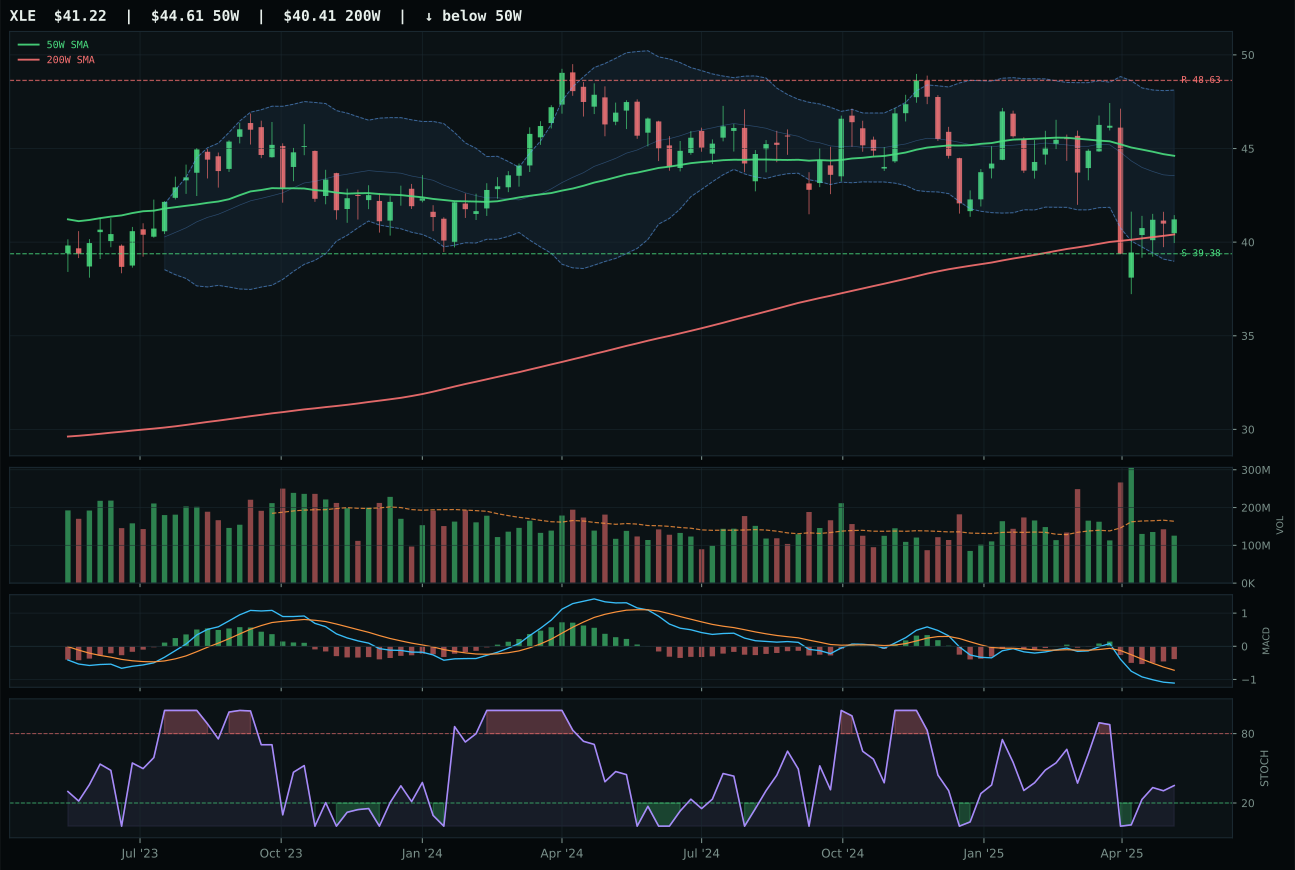
XLE has a pullback into support profile with -0.9% 13-week relative strength versus SPY.
A failed hold above support would weaken the setup.
Actionable but governed by invalidation levels.
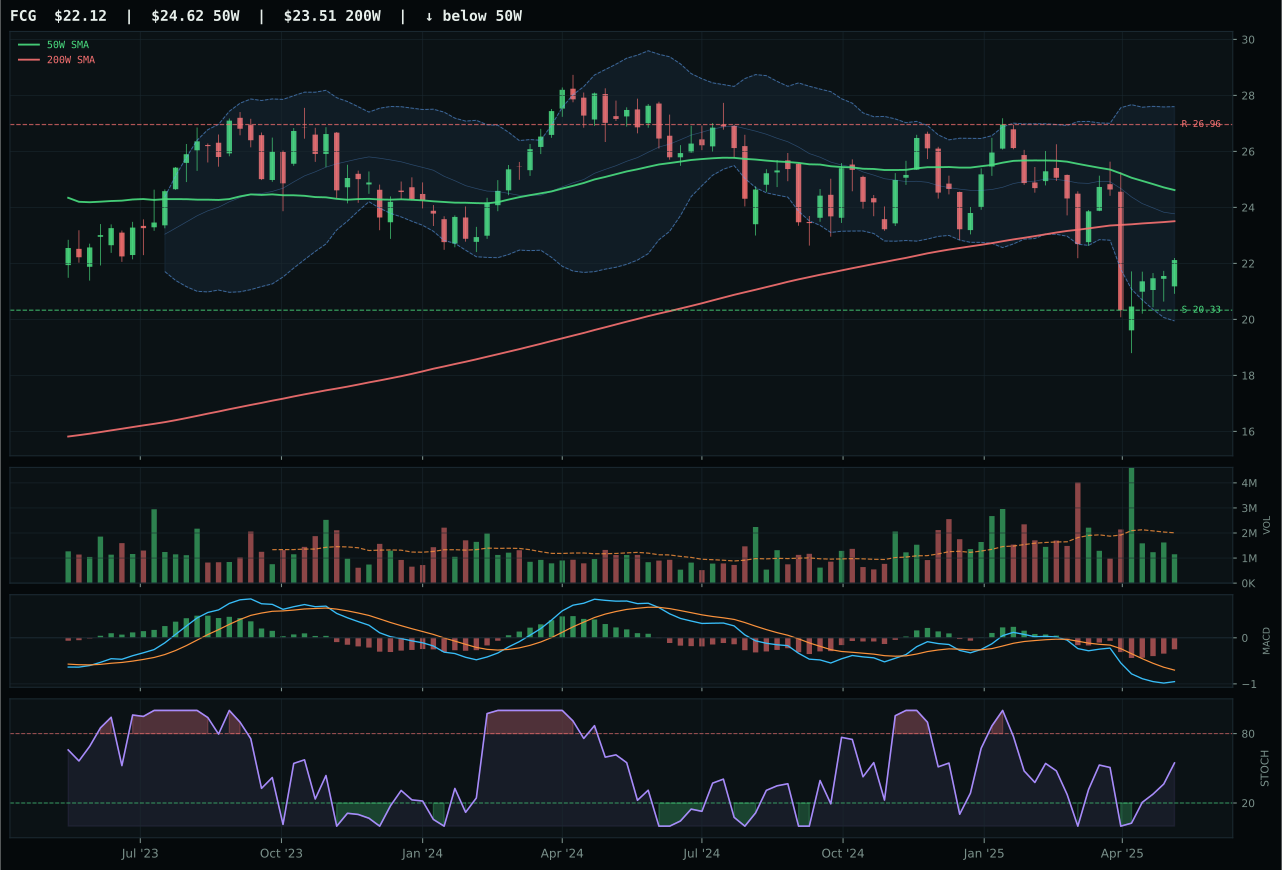
FCG has a neutral structure profile with -4.3% 13-week relative strength versus SPY.
A failed hold above support would weaken the setup.
Actionable but governed by invalidation levels.
XLE wins energy by default, but its 10.7 final score and 0% allocation reflect a category so compromised that even the category representative fails to justify capital. XLE's 74/100 structure score and 93.0 timing edge (pullback into support at 39.38 with a defined Fib 0.786 repair zone) position it as the least-bad alternative: 90.0 risk-reward from -15.3% upside gap but 4.7% downside cushion is attractive on pure asymmetry, but that setup is a liquidation trade, not a conviction call. Its 56.7 trend score and -0.9% SPY-relative strength reveal energy is decoupling downward from the broader market. XOP's exploration beta (-4.8% SPY-relative) and XLE's integrated cash-flow defense (-0.9%) both fail at the most basic test: neither offers positive leverage to recovery. The 57.6 momentum confirmation for XLE carries weight, but that momentum is tactical—a rebound into resistance that attracts short-covering, not institutional capital allocation.
Traditional Energy earns 0% allocation, ranked 9th or 10th and excluded entirely from the portfolio. The 10.7 composite score and 23.0 macro fit reflect -10 disinflation pressure headwind and -7 liquidity stress, which together erase any technical case: falling prices in a deflating economy trap refineries and producers in negative carry spirals. XLE's 55.5 reasoned ETF score cannot overcome the gravity of a -6.9% 13-week return and -0.9% SPY-relative underperformance, signals that the market is pricing in sustained weakness. The 3/2/1 basket at 47.3 (below the 50-point baseline) confirms no consensus technical strength—FCG at 42.2 and XOP at 33.2 drag the category into negative territory. To earn allocation, energy requires a regime shift: either inflation expectations resurface, risk appetite recovers enough to bid exploration beta (XOP), or crude supply shocks create forced buying. In the current disinflation regime, energy is the portfolio's first exclude, not its last hold.
Agriculture & Livestock — MOO
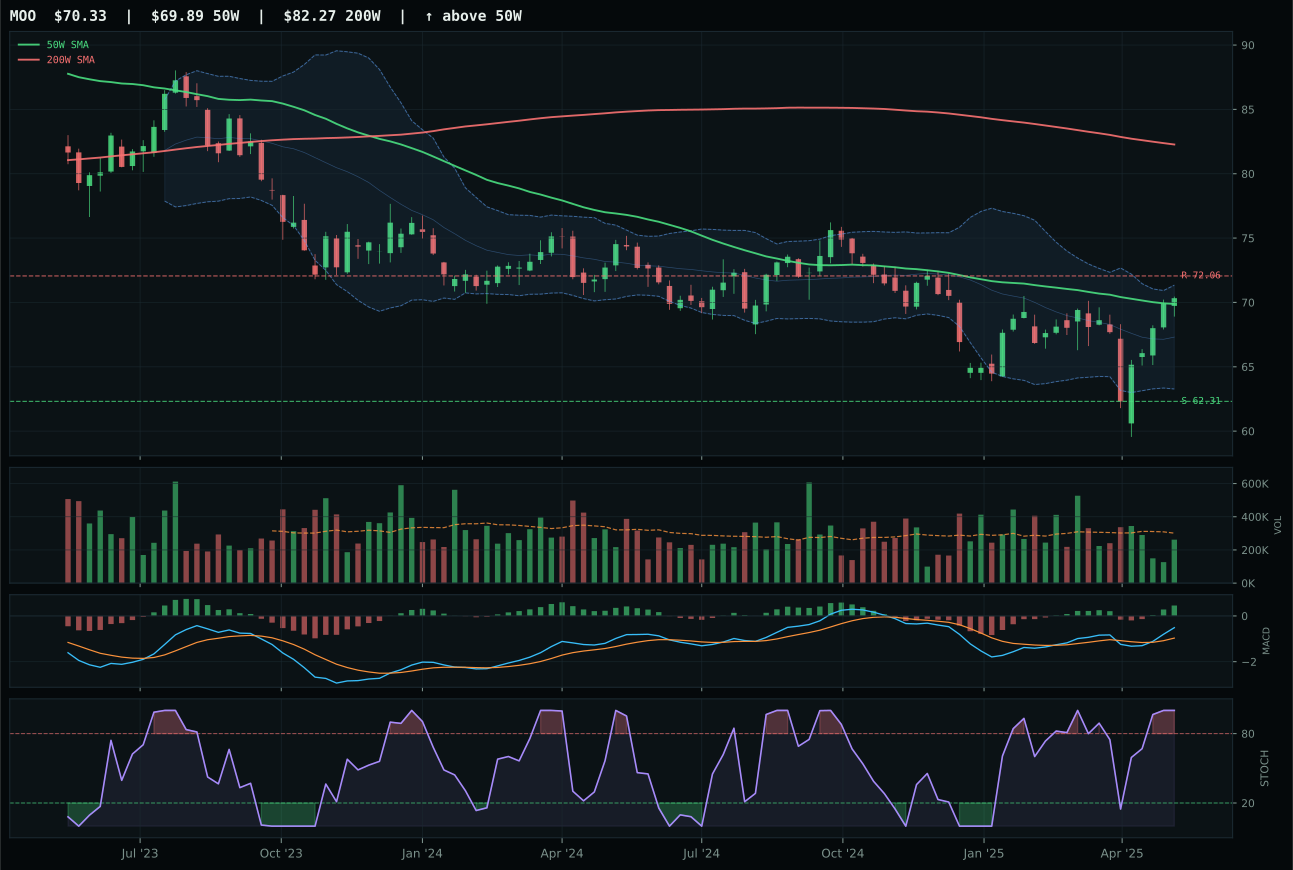
MOO has a compression near 50W profile with 11.3% 13-week relative strength versus SPY.
A failed hold above support would weaken the setup.
Actionable but governed by invalidation levels.
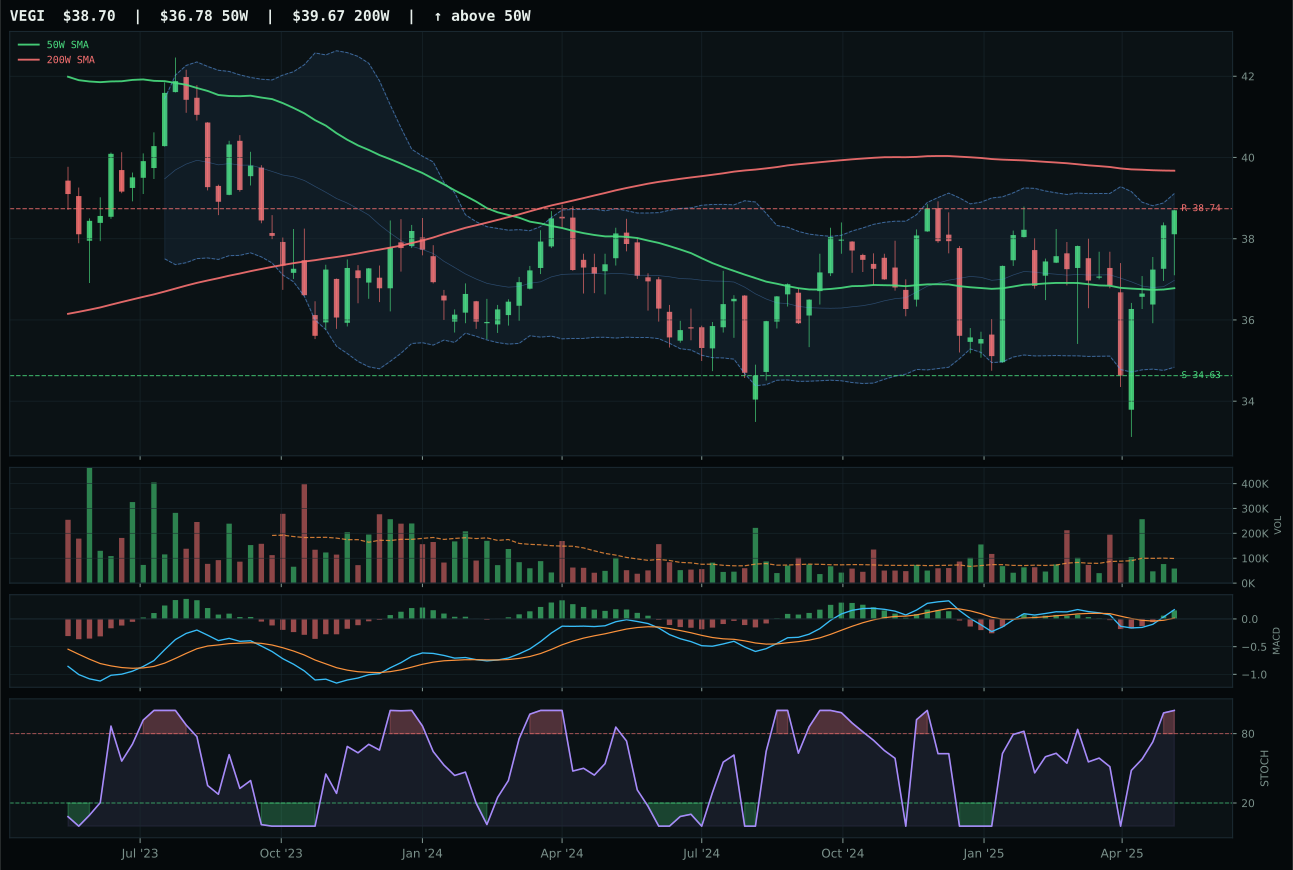
VEGI has a neutral structure profile with 11.1% 13-week relative strength versus SPY.
A failed hold above support would weaken the setup.
Tracked, but not top-2 eligible because: .
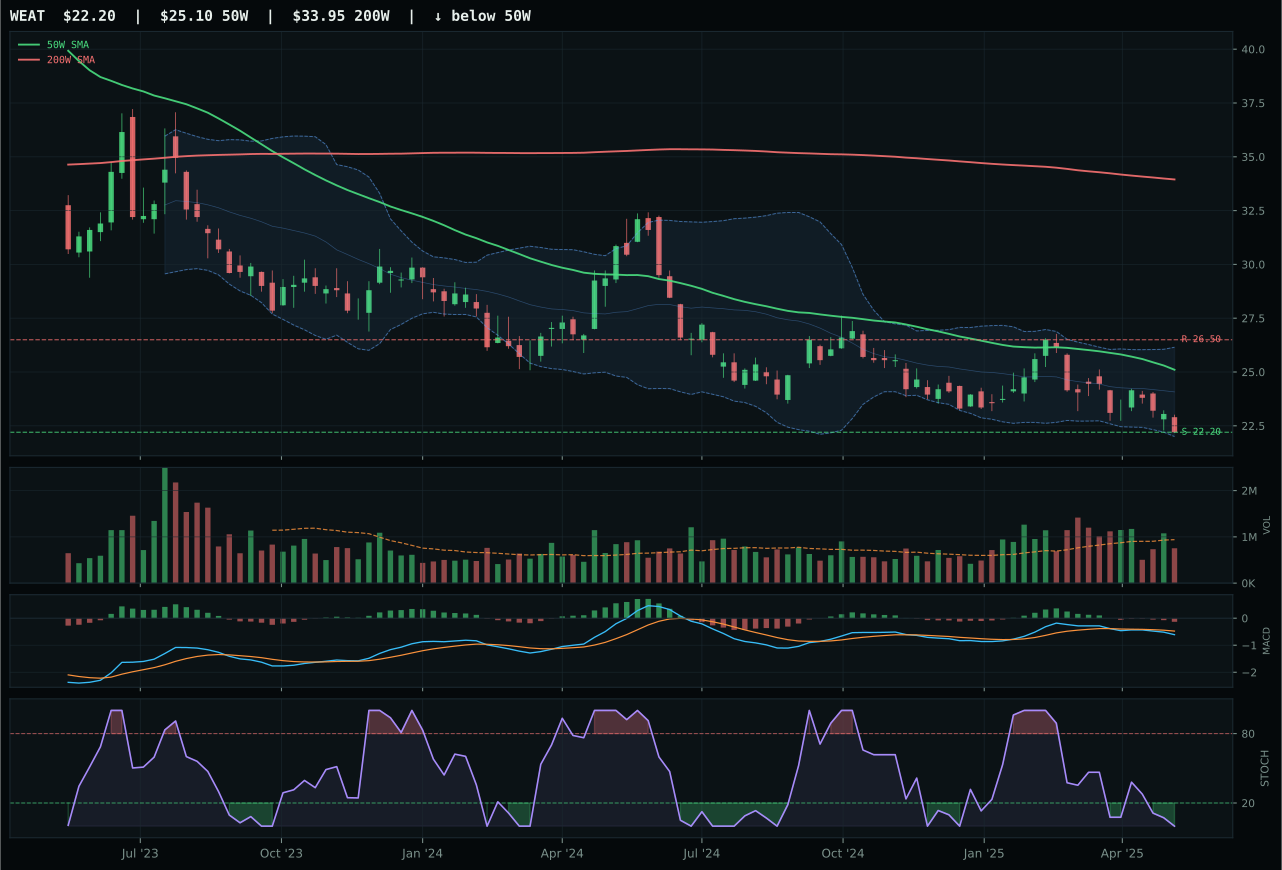
WEAT has a pullback into support profile with -7.2% 13-week relative strength versus SPY.
Extension and support failure are the main tactical risks.
Tracked, but not top-2 eligible because: structurally broken.
MOO claims the agriculture category with an 80/100 composite despite a 10.6 final score that excludes it from allocation entirely. The 24.5-point gap versus VEGI (runner-up) reflects two decisive edges: MOO's pristine 100/100 timing score from being 0.6% from the 50-week support line, combined with a compression-near-50W setup that offers clear binary direction, crushes VEGI's stretched 75/100 timing and thin volume participation. MOO's stochastic RSI at maximum overbought (1.00) paired with bullish-improving MACD creates a momentum confirmation score of 100 versus VEGI's 92, signaling institutional accumulation rather than random noise. Risk-reward of 48.4 for MOO reflects a measured -2.4% upside to resistance against 12.9% downside, offering defined entry discipline. VEGI's superior trend score of 90 cannot overcome the timing penalty—it sits extended near the 52-week high, a stretched entry in a commodity sector facing disinflation headwinds.
Agriculture & Livestock earns 0% allocation this week, ranked 9th or 10th and excluded entirely from the portfolio. The 10.6 composite score reflects a category macro fit of just 32.0, where disinflation pressure delivers -8 and liquidity stress adds -4, overwhelming any +5 disinflation assist. Even MOO's superior technical execution (84.6 technical evidence) cannot lift the category above the allocation floor when the macro regime actively punishes commodity producers: falling prices trap margin, and farmer balance sheets deteriorate in deflationary scenarios. The 3/2/1 weighted basket at 51.4 before final testing reveals that WEAT (the third candidate) contributes negative technical signals, pulling the category average underwater. To earn a position, agriculture would require either inflation expectations to resurface or a shift in the macro descriptor profile away from broad bear positioning—neither is currently operative in the disinflation regime.