
2025-05-02
Informational purposes only. The content in this report, including allocations, analysis, and commentary, is provided solely for informational and educational purposes. It does not constitute financial advice, investment advice, trading advice, or any other type of advice. Past performance does not guarantee future results. Always conduct your own research and consult a qualified financial professional before making investment decisions.
Weekly Allocation
| Ticker | Category | Weight | Role |
|---|---|---|---|
| FBTC | 50% | Overlay | |
| GLD | Precious Metals | 10% | Top-2 (10%) |
| PAVE | Utilities & Infrastructure | 10% | Top-2 (10%) |
| ILF | Emerging Markets | 5% | Tier-2 (5%) |
| XAR | Defense & Aerospace | 5% | Tier-2 (5%) |
| IGV | Technology | 5% | Tier-2 (5%) |
| SMH | AI | 5% | Tier-2 (5%) |
| URA | Nuclear Energy | 5% | Tier-2 (5%) |
| COPX | Industrial Metals | 5% | Tier-2 (5%) |
Trade Instructions — Monday Open
Sell the tranche from 2025-04-04 (completing its 4-week hold). Buy the new tranche. Instructions show net portfolio changes — same-asset positions cancel, weight changes show the delta.
| Action | Ticker | Instruction |
|---|---|---|
| SELL | IGF | Sell 25% of IGF position (reduce 10.00% → 7.50%) |
| SELL | ITA | Sell entire ITA position (1.25% of portfolio) |
| SELL | CIBR | Sell 33% of CIBR position (reduce 3.75% → 2.50%) |
| SELL | WEAT | Sell 50% of WEAT position (reduce 2.50% → 1.25%) |
| SELL | NLR | Sell 33% of NLR position (reduce 3.75% → 2.50%) |
| SELL | AIQ | Sell 25% of AIQ position (reduce 5.00% → 3.75%) |
| BUY | XAR | Buy XAR — 14.29% of freed cash (adds 1.25% to portfolio) |
| BUY | ILF | Buy ILF — 14.29% of freed cash (adds 1.25% to portfolio) |
| BUY | IGV | Buy IGV — 14.29% of freed cash (adds 1.25% to portfolio) |
| BUY | URA | Buy URA — 14.29% of freed cash (adds 1.25% to portfolio) |
| BUY | PAVE | Buy PAVE — 28.57% of freed cash (adds 2.50% to portfolio) |
| BUY | SMH | Buy SMH — 14.29% of freed cash (adds 1.25% to portfolio) |
Current Portfolio After Trade
Combined holdings across all 4 active tranches. Each tranche is 25% of the portfolio.
| Ticker | % of Portfolio | Weight Bar |
|---|---|---|
| FBTC | 50.00% | |
| GLD | 10.00% | |
| IGF | 7.50% | |
| XAR | 5.00% | |
| AIQ | 3.75% | |
| CIBR | 2.50% | |
| NLR | 2.50% | |
| MOO | 2.50% | |
| ILF | 2.50% | |
| IGV | 2.50% | |
| URA | 2.50% | |
| PAVE | 2.50% | |
| WEAT | 1.25% | |
| INDA | 1.25% | |
| XLE | 1.25% | |
| SMH | 1.25% | |
| COPX | 1.25% |
Macro Regime — Disinflation
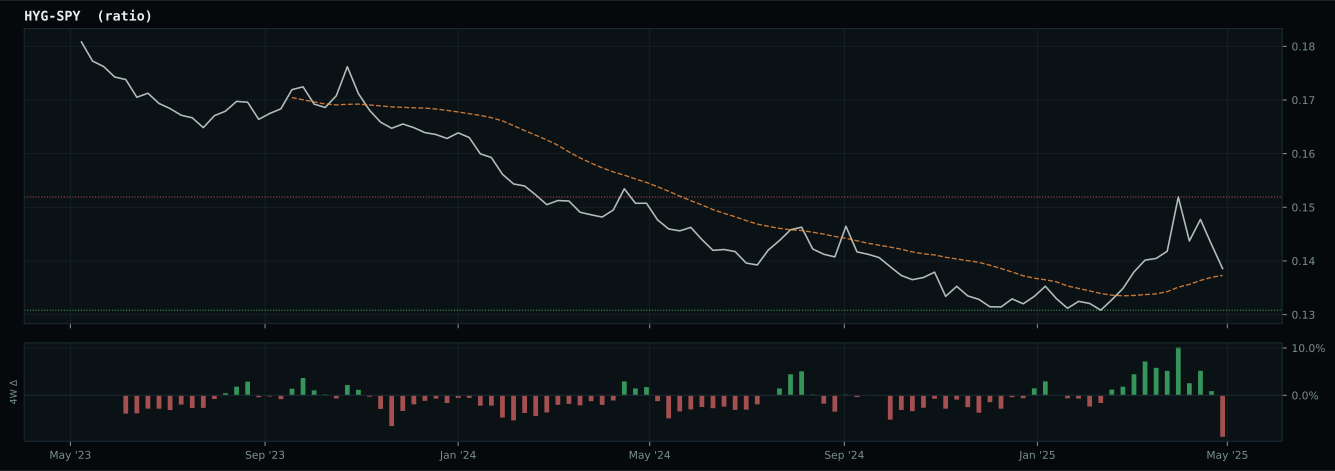
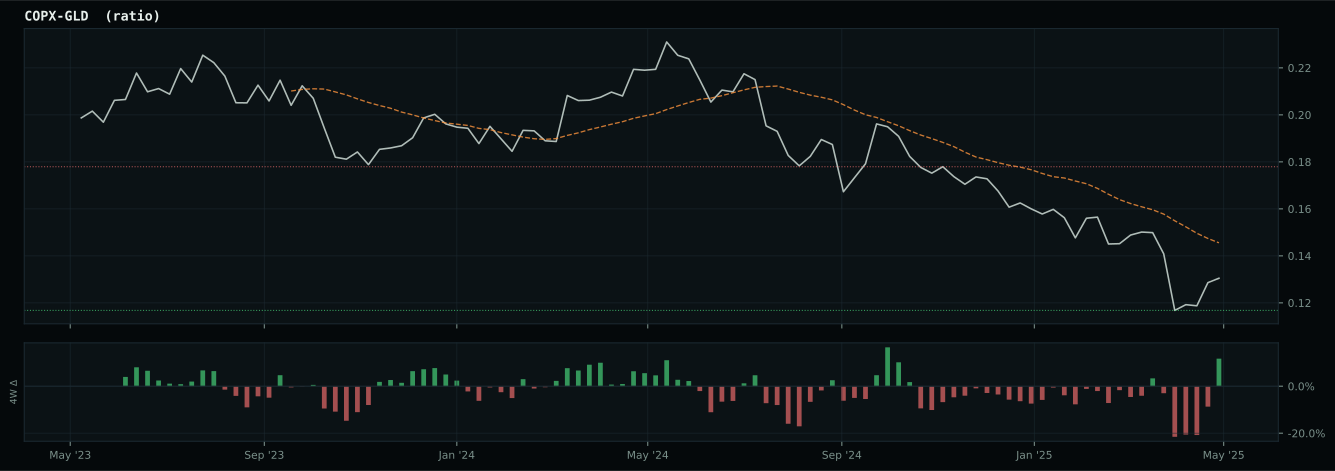
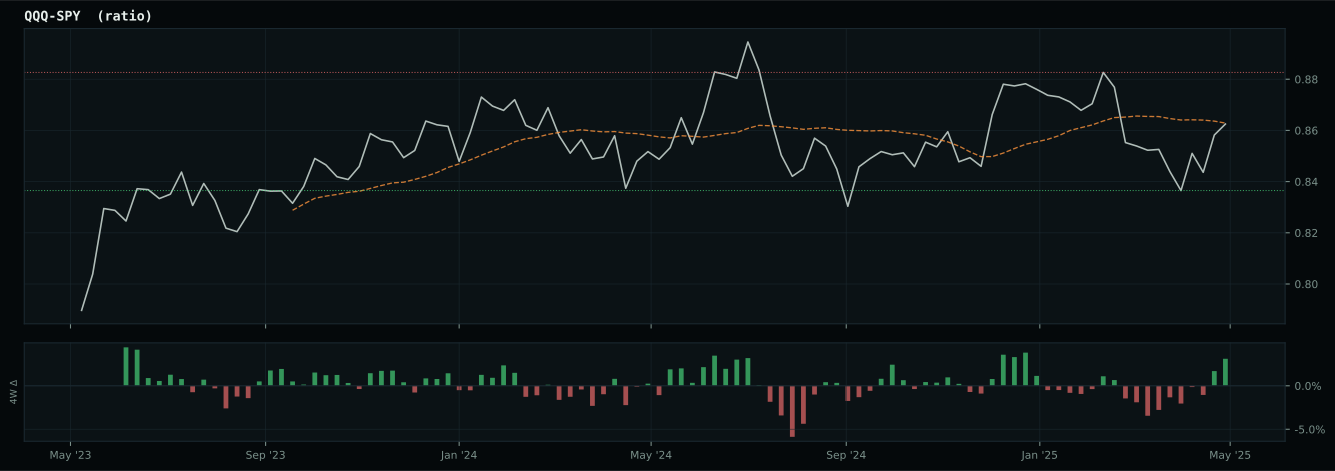
growth data is not confirming the weak market-implied risk appetite signal
Macro Evidence Charts
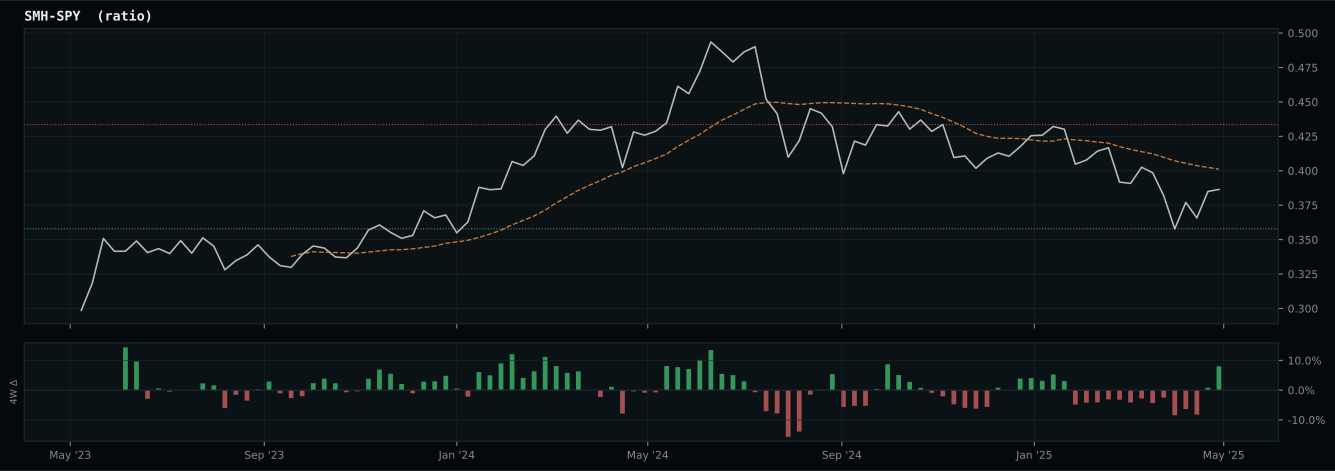
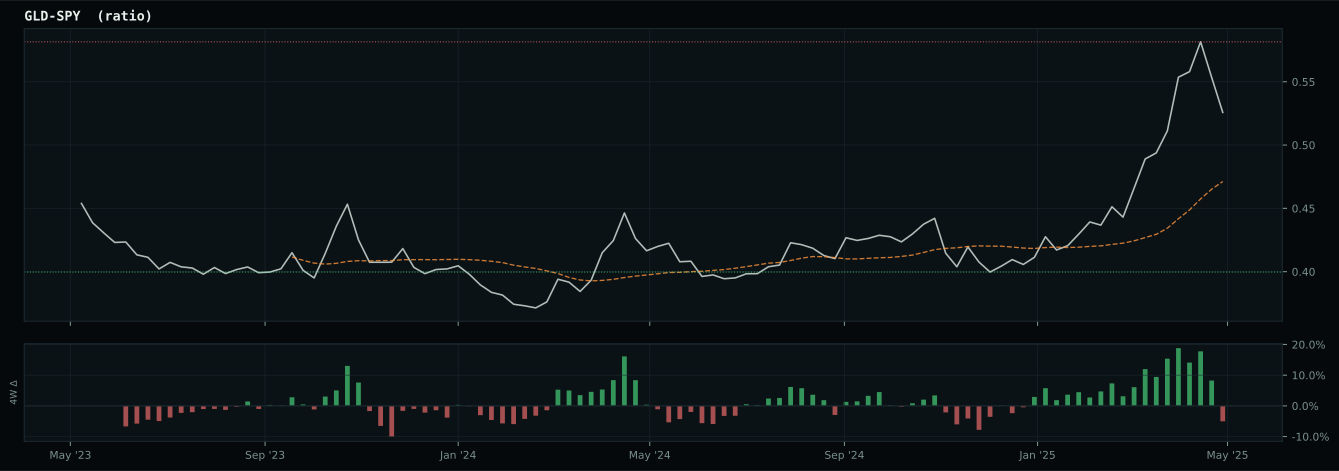
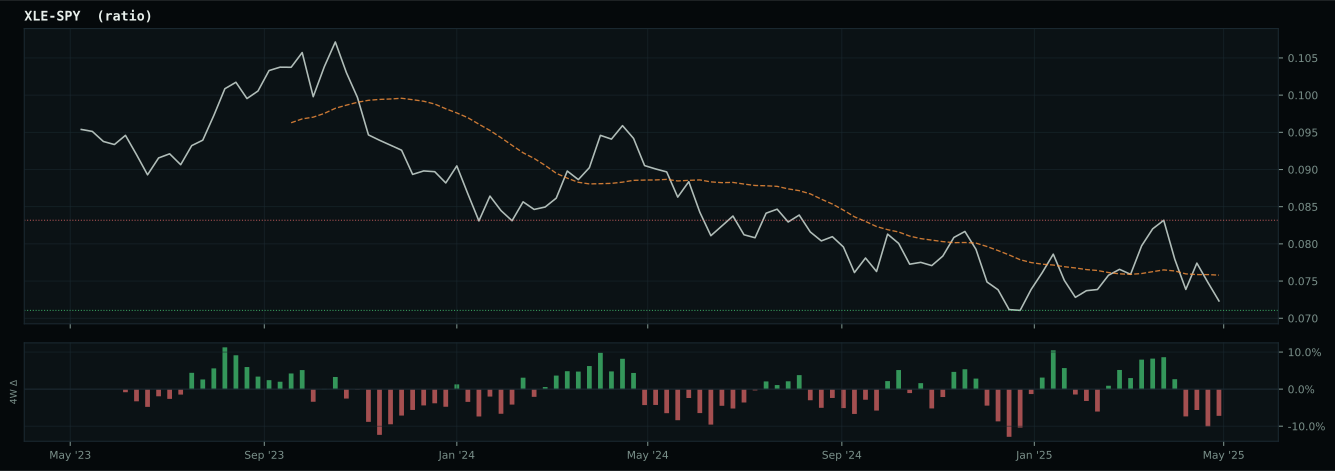
Market-implied signals behind the macro regime scores. Each ratio compares two assets; the direction and slope of the ratio is what the macro engine reads.
Crypto Regime — TrendBTC
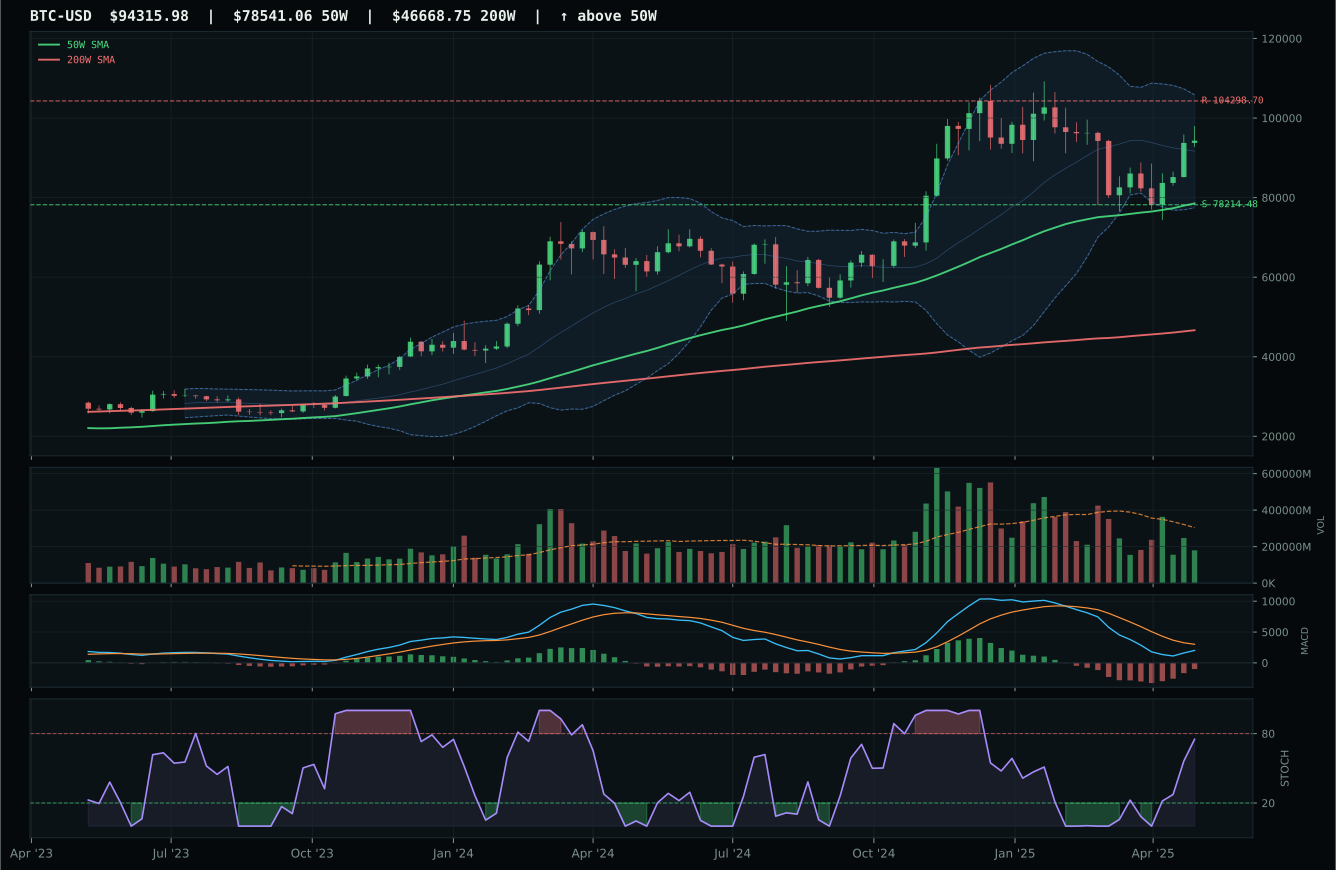
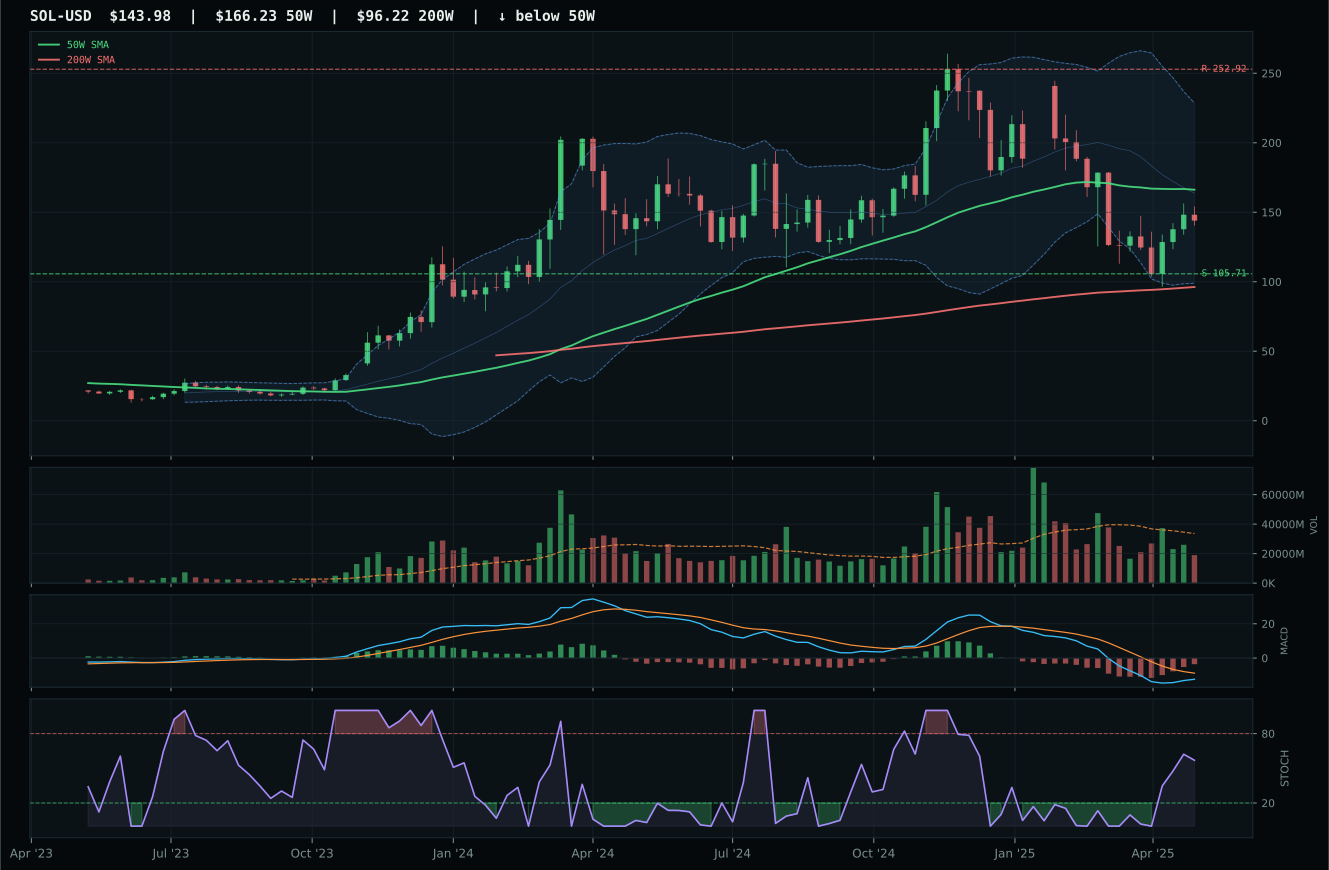
ValueBTC not armed: BTC has not made the first post-breakdown touch of the 200W buy zone after losing the 50W
TrendBTC confirmed: 2 consecutive closes above rising/flat 50W SMA
one or more available conditions failed
Category Rankings
| Rank | Category | Winner | Score | Alloc | 4W Ret | Peers (4W) |
|---|---|---|---|---|---|---|
| 1 | Precious Metals | GLD | 75.7 | 20% | +1.08% | GDX +5.8% · SLV +4.4% |
| 2 | Utilities & Infrastructure | PAVE | 71.0 | 20% | +5.79% | IGF +3.1% · XLU +2.6% |
| 3 | Emerging Markets | ILF | 59.0 | 10% | +1.92% | IEMG +1.0% · INDA +0.1% |
| 4 | Defense & Aerospace | XAR | 58.6 | 10% | +9.20% | ITA +10.6% · ROKT +6.4% |
| 5 | Technology | IGV | 57.9 | 10% | +4.46% | CIBR +6.7% · XLK +7.2% |
| 6 | AI | SMH | 34.9 | 10% | +10.21% | AIQ +6.1% · BOTZ +5.4% |
| 7 | Nuclear Energy | URA | 34.7 | 10% | +23.84% | NLR +18.3% · URNM +12.3% |
| 8 | Industrial Metals | COPX | 19.0 | 10% | +7.66% | PICK +3.1% · REMX -5.4% |
| 9 | Traditional Energy | XLE | 6.8 | 0% | +2.61% | XOP +8.5% · FCG +6.8% |
| 10 | Agriculture & Livestock | VEGI | 2.8 | 0% | +4.57% | MOO +3.8% · WEAT +0.9% |
Precious Metals — GLD
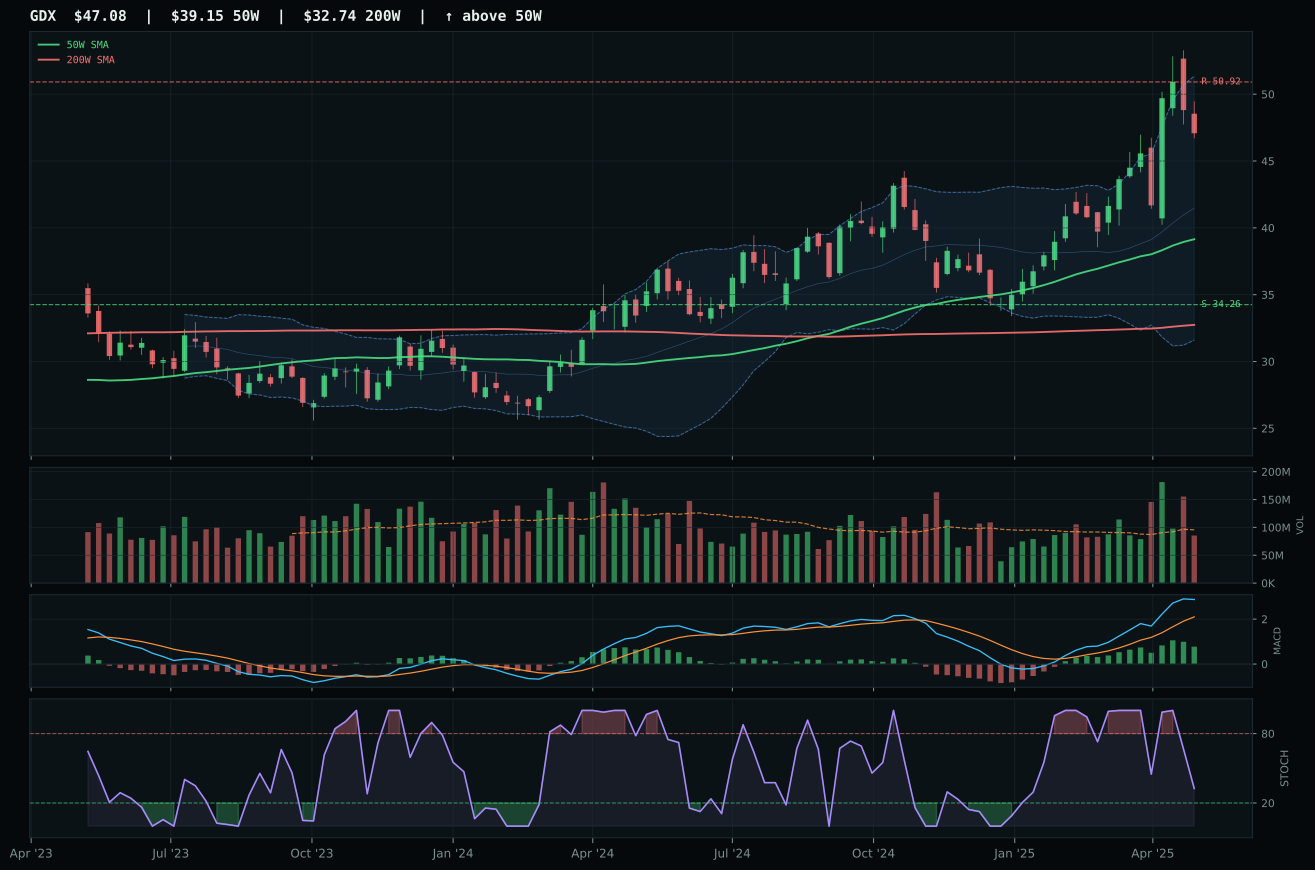
GDX has a vertical extension profile with 26.7% 13-week relative strength versus SPY.
A failed hold above support would weaken the setup.
Actionable but governed by invalidation levels.
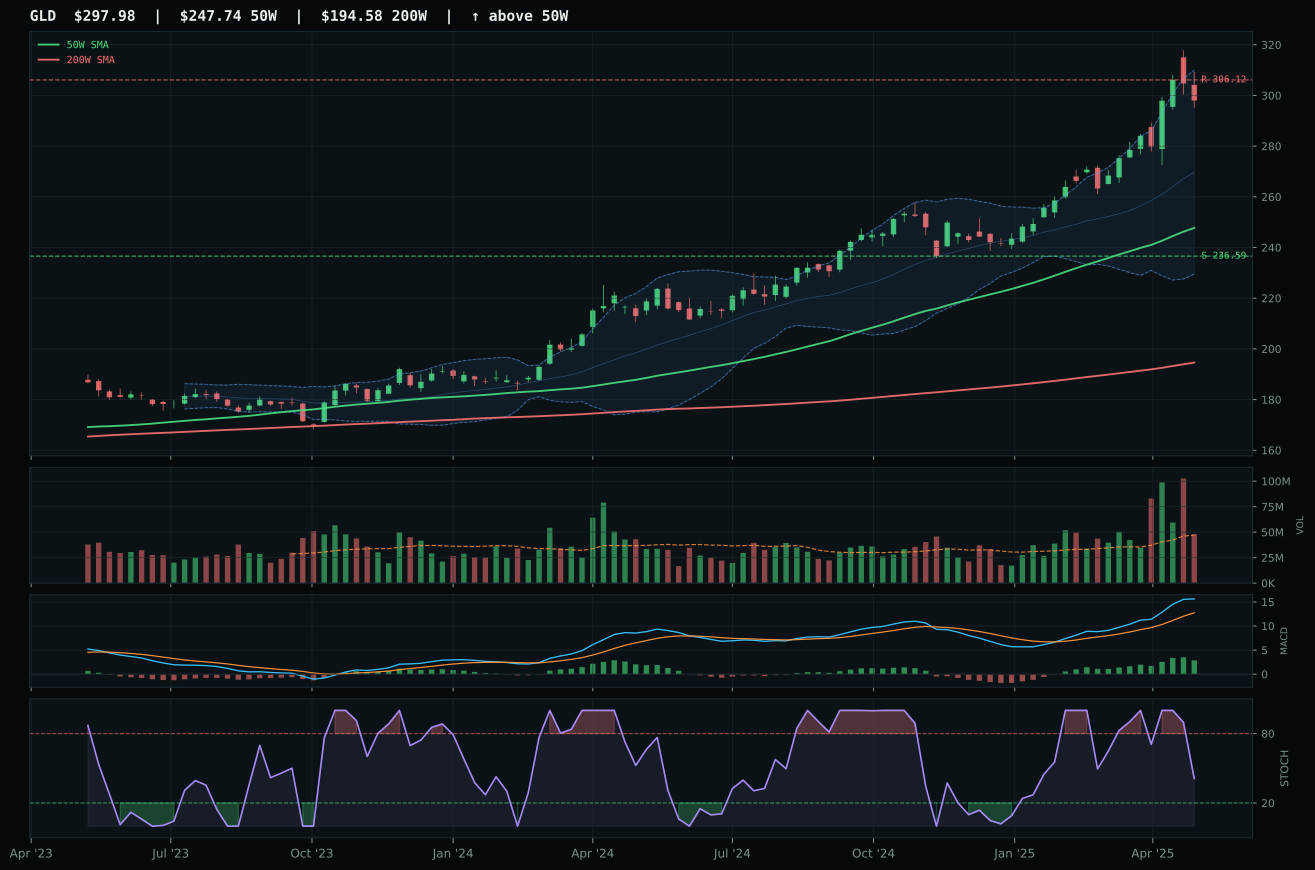
GLD has a vertical extension profile with 21.1% 13-week relative strength versus SPY.
A failed hold above support would weaken the setup.
Actionable but governed by invalidation levels.
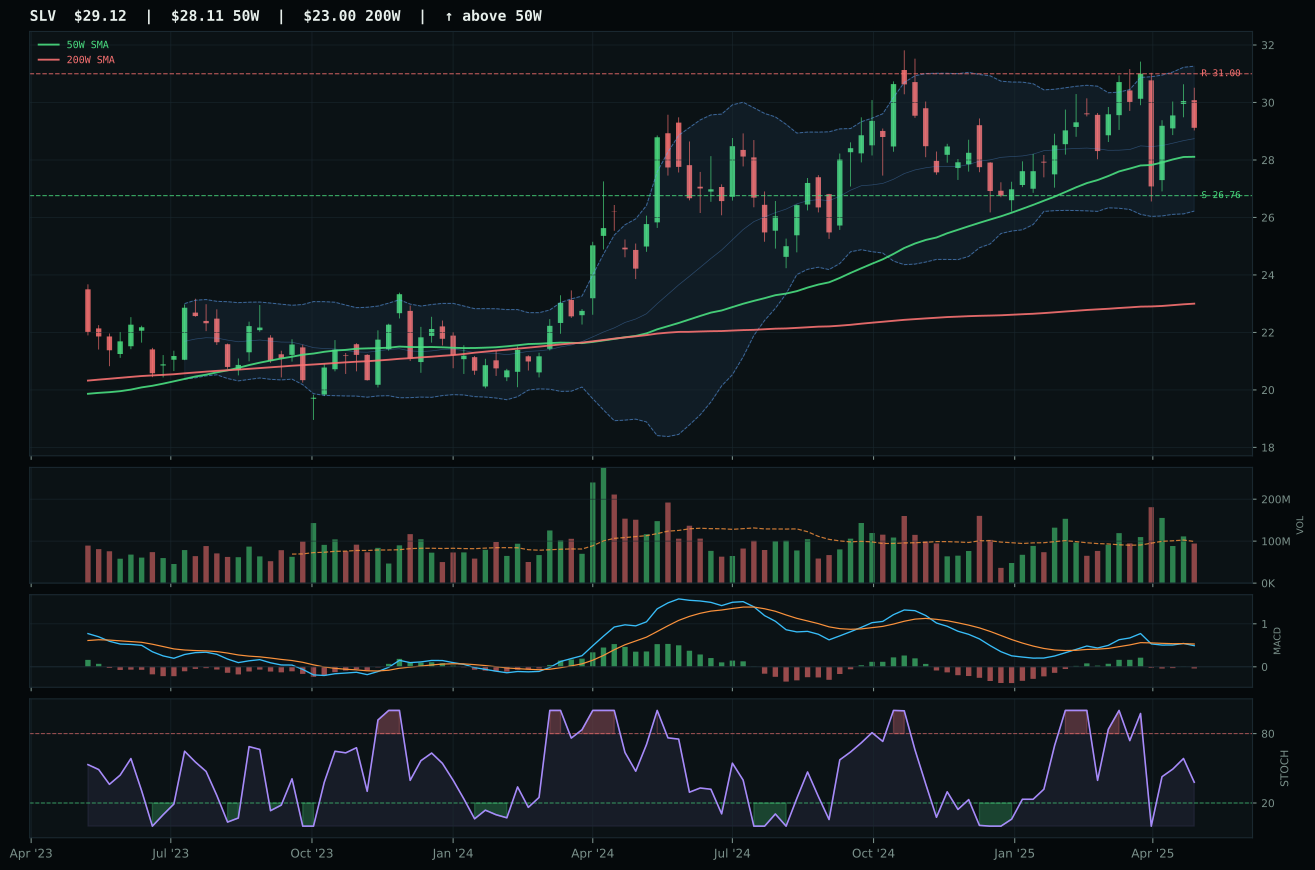
SLV has a neutral structure profile with 8.0% 13-week relative strength versus SPY.
A failed hold above support would weaken the setup.
Actionable but governed by invalidation levels.
GLD wins the precious metals category with perfect trend evidence (100/100) and perfect momentum (100/100), supported by a 21.1% advantage in RS versus SPY and a 15.2% thirteen-week return that confirms the strength is real and not just statistical. The price sits 20.3% above the 50W in what the structure labels vertical extension—typically a risk signal—but the stochastic RSI at 0.41 has already fallen from overbought extremes, and MACD is bullish and improving, suggesting power is being consolidated rather than exhausted. GDX is the closest rival, running 26.7% RS versus SPY and 20.8% thirteen-week return, but it loses the representative slot because structure cleanliness lags (70.0 vs 77.0) and, more critically, macro fit collapses (44.0 vs 78.0) as GDX's higher leverage exposes it to liquidity stress (-9) and risk appetite erosion (-5). GLD's monetary hedge bid (+14) and disinflation pressure (+8) are the active macro drivers, and GLD's simpler structure channels that bid without the leverage beta.
Precious Metals earns a top-2 overweight at 10% allocation, ranking second among all categories with a final score of 75.7. The macro case is unambiguous: monetary hedge bid is active (+14), disinflation pressure (+8), and defensive rotation (+6) are all firing simultaneously, creating a rare alignment where technical strength and macro regime are in lockstep. GLD's positioning at vertical extension (20.3% above the 50W) is ordinarily a cautionary sign, but the category score of 75.7 and technical evidence of 75.7/100 reflect that the move is being accumulated on volume at 1.03x average and that momentum confirmation is perfect (100/100). The timing score of only 53/100 is the honest brake on euphoria—it acknowledges entry risk and stretched risk/reward (upside to resistance just 2.7%)—yet the allocation committee has decided the macro regime dominates timing concerns. Precious metals hold 10% as a genuine defensive anchor, not a speculative trade.
Utilities & Infrastructure — PAVE
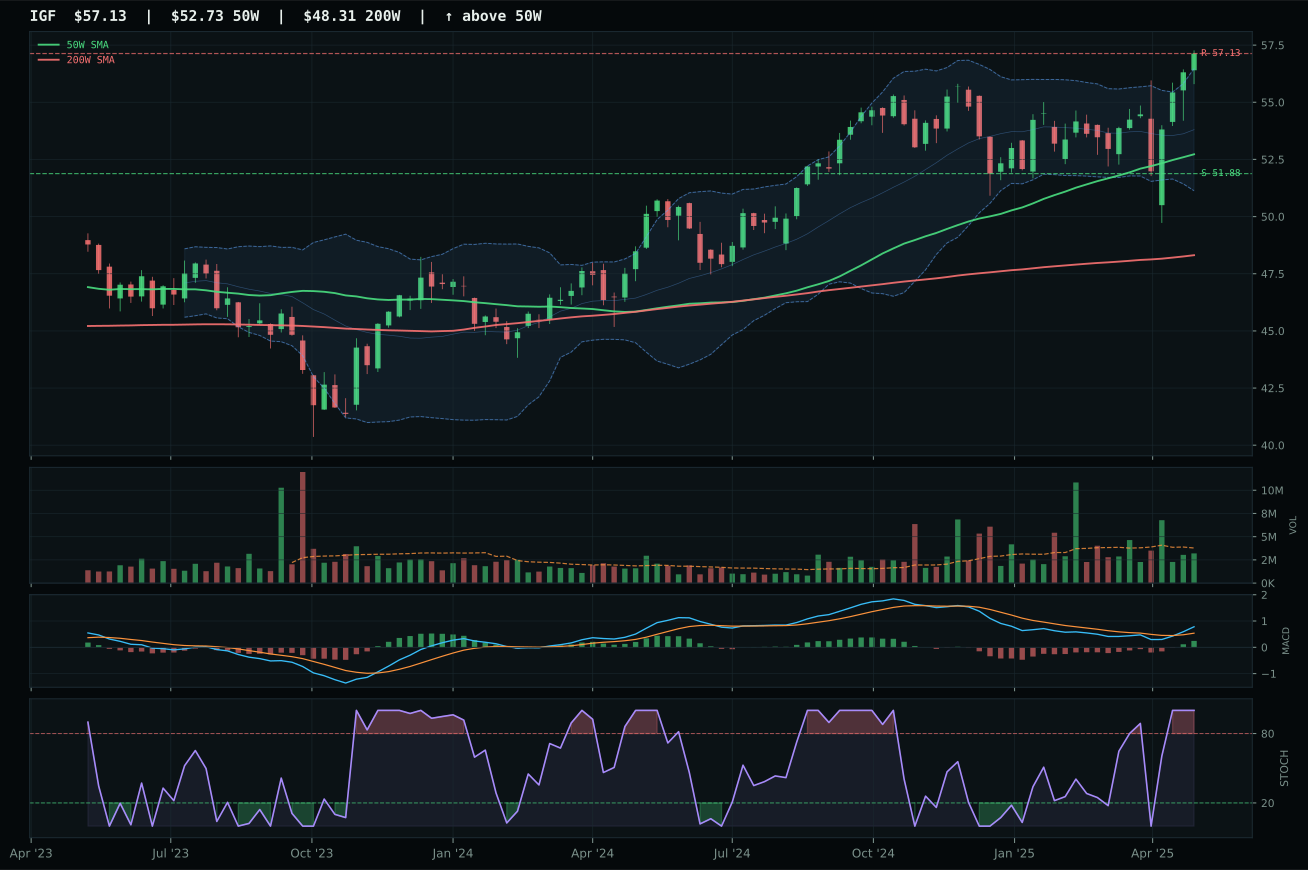
IGF has a neutral structure profile with 13.2% 13-week relative strength versus SPY.
A failed hold above support would weaken the setup.
Actionable but governed by invalidation levels.
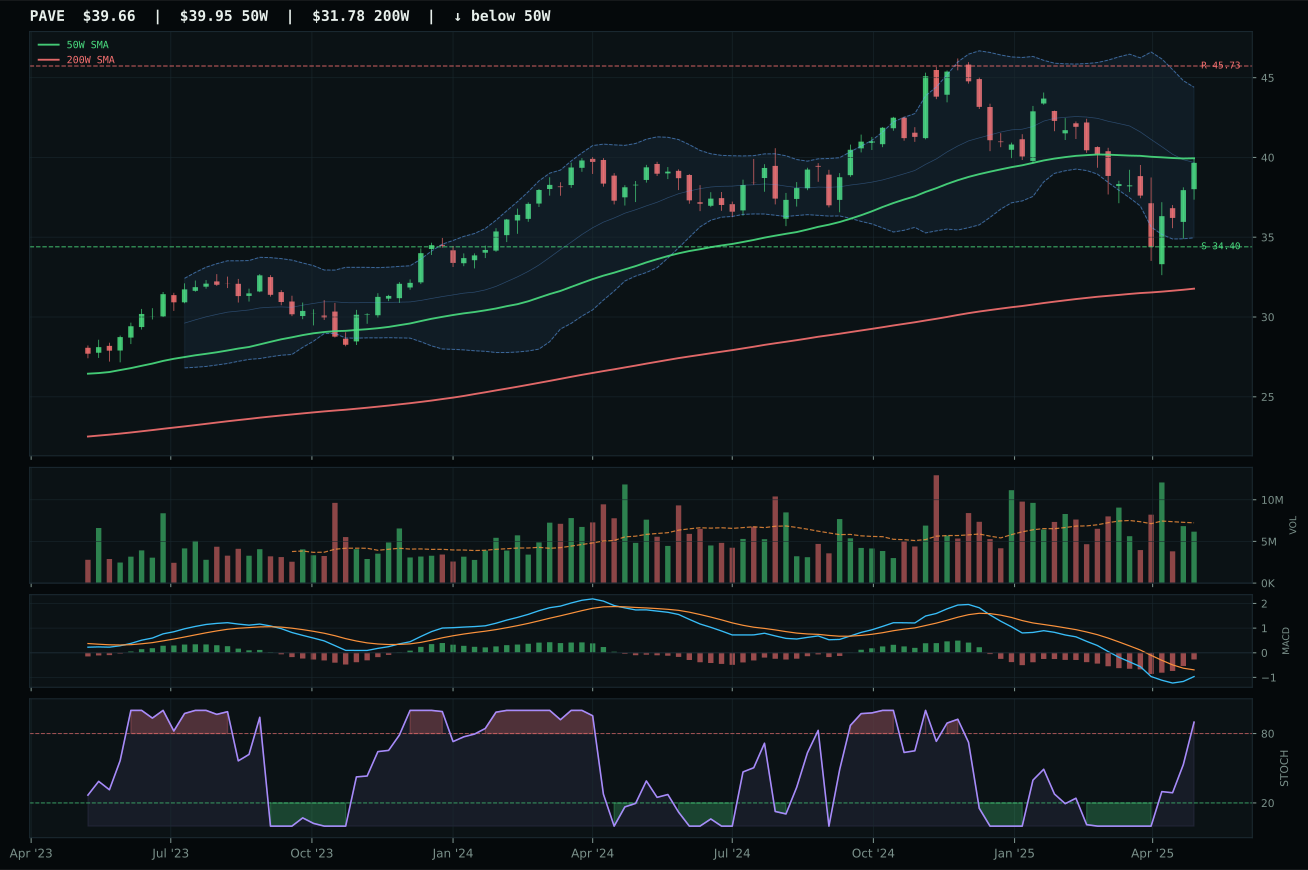
PAVE has a compression near 50W profile with -0.4% 13-week relative strength versus SPY.
A failed hold above support would weaken the setup.
Actionable but governed by invalidation levels.
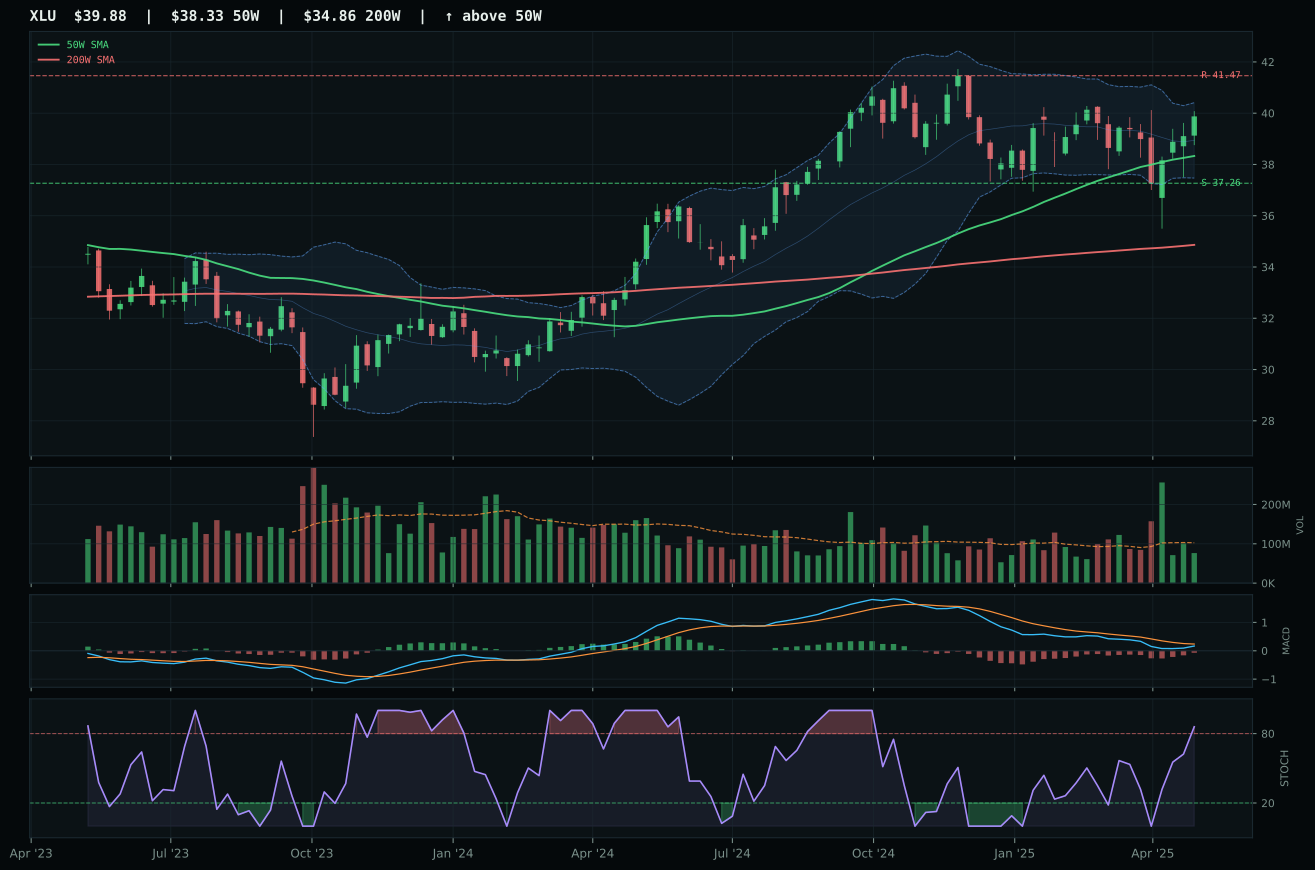
XLU has a neutral structure profile with 8.2% 13-week relative strength versus SPY.
A failed hold above support would weaken the setup.
Actionable but governed by invalidation levels.
PAVE wins the utilities and infrastructure category despite being marked the weaker technical representative because its timing is literally perfect (100/100) at a distance of -0.7% from the 50W—it is compressed into the centerline with MACD bearish but improving and stochastic RSI overbought momentum. The setup is compression near the 50W, which creates a coiled structure with binary expansion potential: either buyers step in for a squeeze higher or support breaks and the trade unwinds. The runner-up IGF carries far superior technical evidence (88.1 vs 39.8) and better macro fit (59 vs 44), with 13.2% RS versus SPY and a 7.4% thirteen-week return, yet it loses the representative slot because it is stretched 8.4% above the 50W (worse timing at 75 vs 100) and risk/reward is tighter (51.2 vs 68.6). Defensive rotation (+12) and disinflation pressure (+6) are macro tailwinds, and PAVE's domestic infrastructure capex profile is a cleaner expression of that rotation.
Utilities & Infrastructure earns a top-2 overweight at 10% allocation with a final category score of 71.0, ranking it as the second-highest category alongside precious metals. The macro case is crystalline: disinflation helps this exposure (+7), defensive rotation is hyperactive (+12), and disinflation pressure itself adds (+6), creating a 25-point macro tailwind that overrides any technical timing concern. PAVE's compression setup at the 50W centerline with perfect timing (100/100) is the technical equivalent of loading the gun—any volume spike or buyer interest triggers an extension move with minimal entry friction. The allocator is treating this 10% position as a true defensive anchor, not a spec trade; infrastructure and utilities survive disinflation better than cyclicals, and PAVE's positioning at zero distance from the 50W offers the cleanest entry geometry in the category. Continued allocation at 10% depends on PAVE holding above support at 34.40 and defensive rotation remaining the dominant market theme.
Emerging Markets — ILF
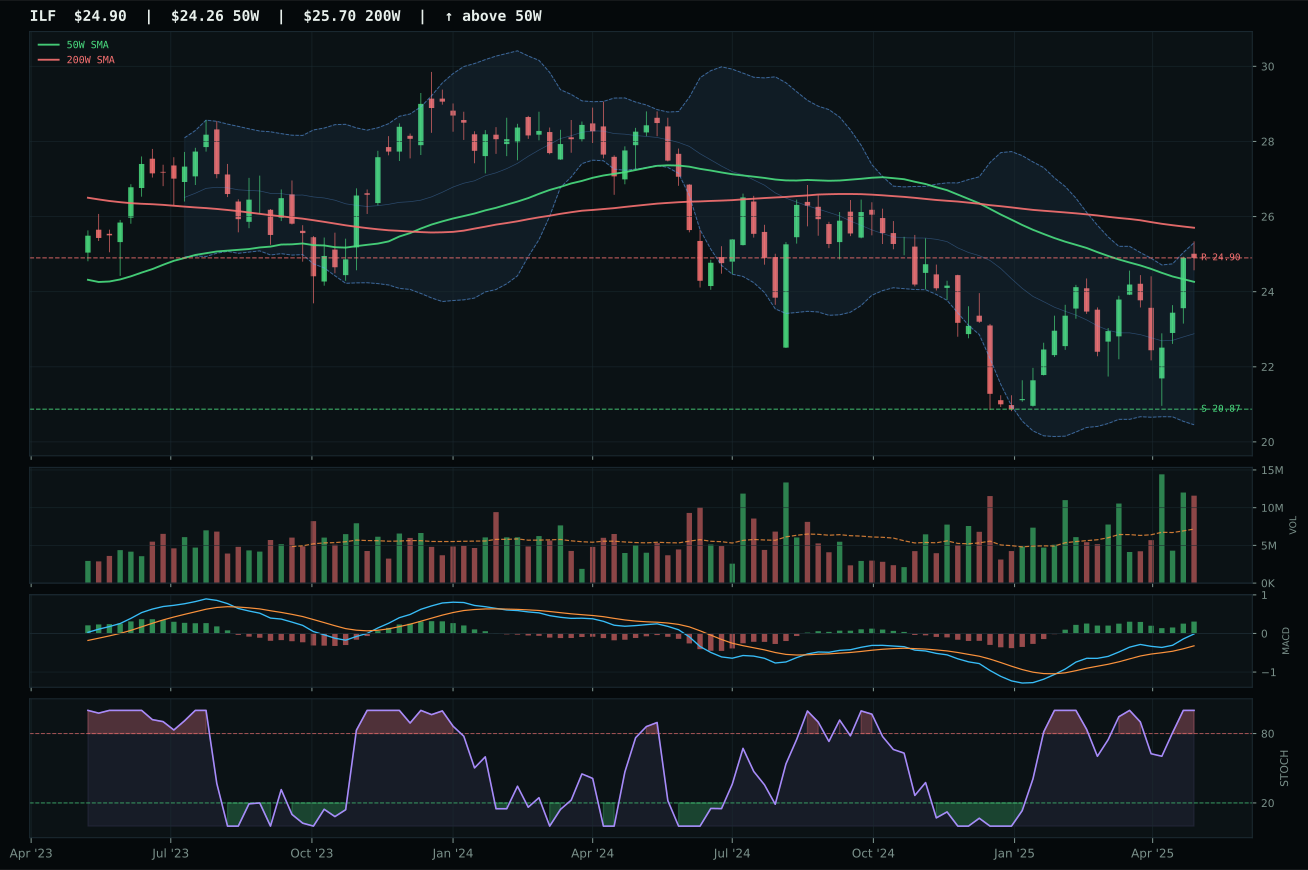
ILF has a compression near 50W profile with 14.3% 13-week relative strength versus SPY.
A failed hold above support would weaken the setup.
Actionable but governed by invalidation levels.
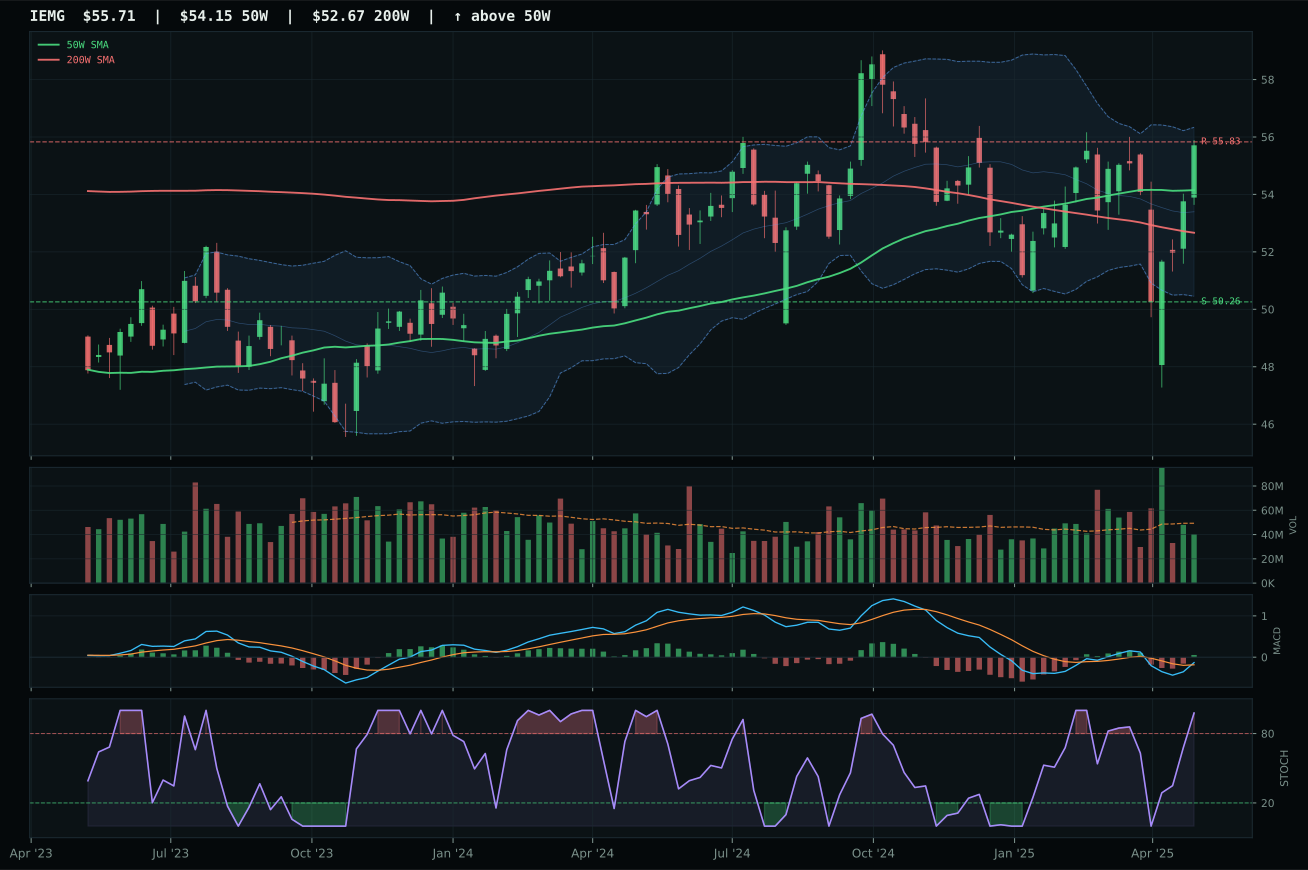
IEMG has a compression near 50W profile with 11.0% 13-week relative strength versus SPY.
A failed hold above support would weaken the setup.
Actionable but governed by invalidation levels.
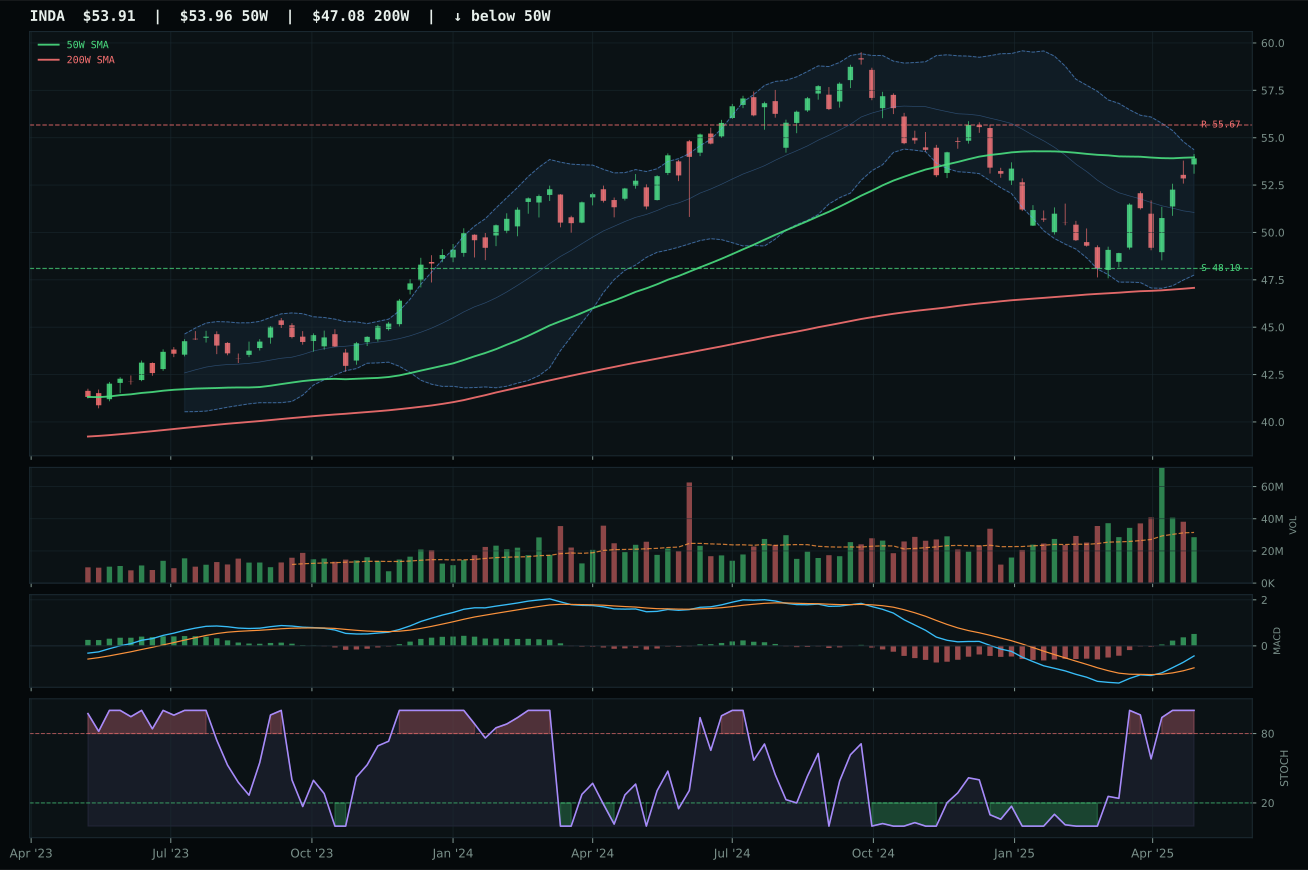
INDA has a compression near 50W profile with 11.6% 13-week relative strength versus SPY.
A failed hold above support would weaken the setup.
Actionable but governed by invalidation levels.
ILF wins the emerging markets category with perfect timing (100/100) based on compression near the 50W (2.6% distance) and perfect momentum confirmation (100/100) powered by 11.0% four-week returns and above-average volume participation at 1.62x the 20-week average. The structure is compression near 50W with Fibonacci location at 0.500 (the midpoint at 24.81), giving the setup both immediate entry appeal and expansion potential if support holds. The runner-up IEMG is more broadly representative and carries exceptional technical evidence (85.7), but it loses the slot because risk/reward is weaker (45.4 vs 60.5) and volume is neutral rather than above-average—meaning it has not yet attracted the accumulation that ILF demonstrates. ILF's 14.3% RS versus SPY and 2.7% category-relative strength confirm Latin American commodity and value beta is outperforming broad emerging markets.
Emerging Markets earns 5% in tier-2 allocation despite a final category score of 59.0, held back by severe macro headwinds (31/100 macro fit). Liquidity stress (-10) and broad market bear dynamics (-9) are actively demolishing emerging market sentiment, yet ILF's technical setup—compression with above-average volume and perfect momentum—suggests that Latin America is finding some shelter within the broader complexity. The allocator is accepting 5% as a tactical position where technical sponsorship is outweighing macro regime headwind. For emerging markets to earn top-two status, the category would need either a reversal in liquidity conditions (central bank pivot toward accommodation) or explicit evidence that emerging economies are decoupling from developed market macro stress. Until then, 5% in ILF reflects a bet that compression breakouts can work even in defensive regimes.
Defense & Aerospace — XAR
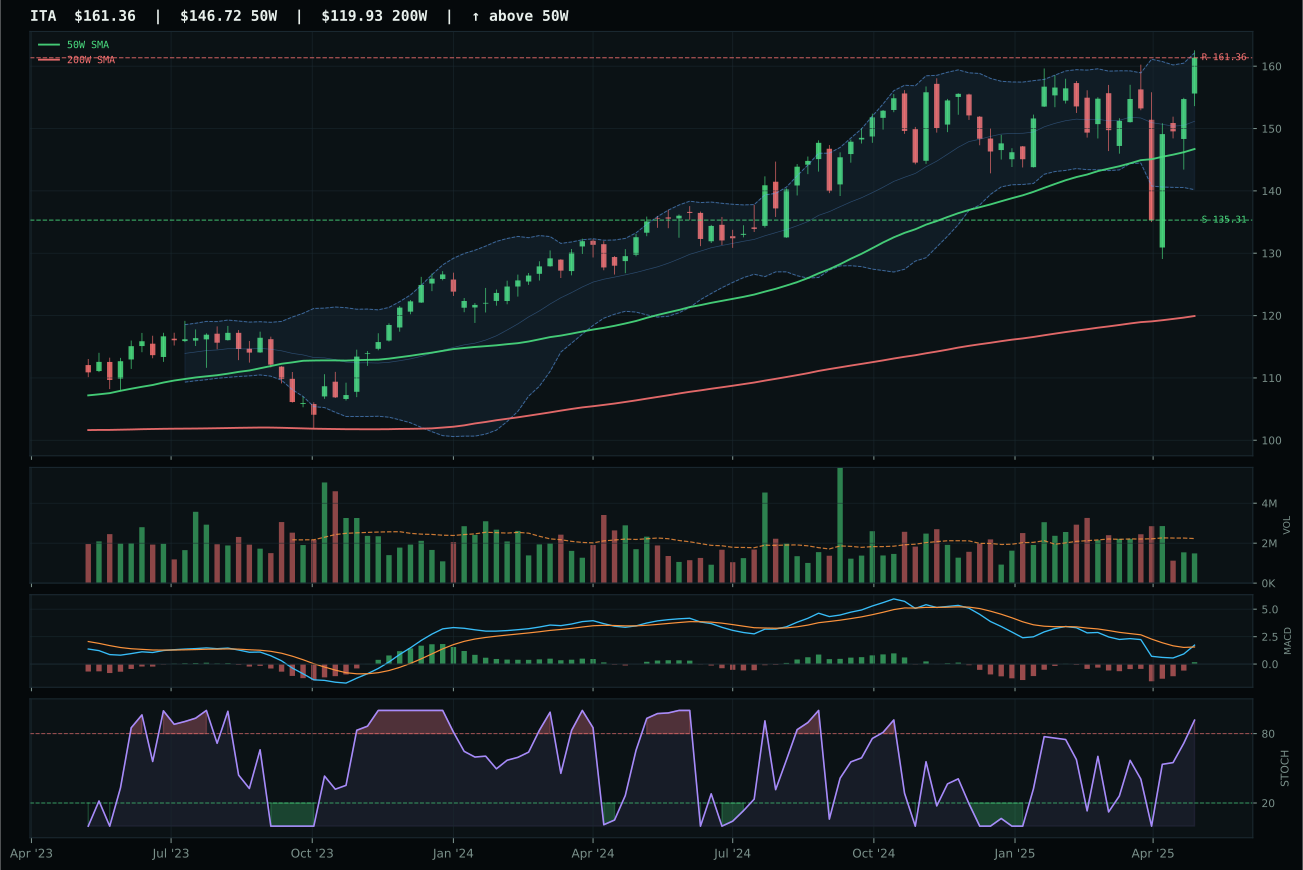
ITA has a neutral structure profile with 8.9% 13-week relative strength versus SPY.
A failed hold above support would weaken the setup.
Actionable but governed by invalidation levels.
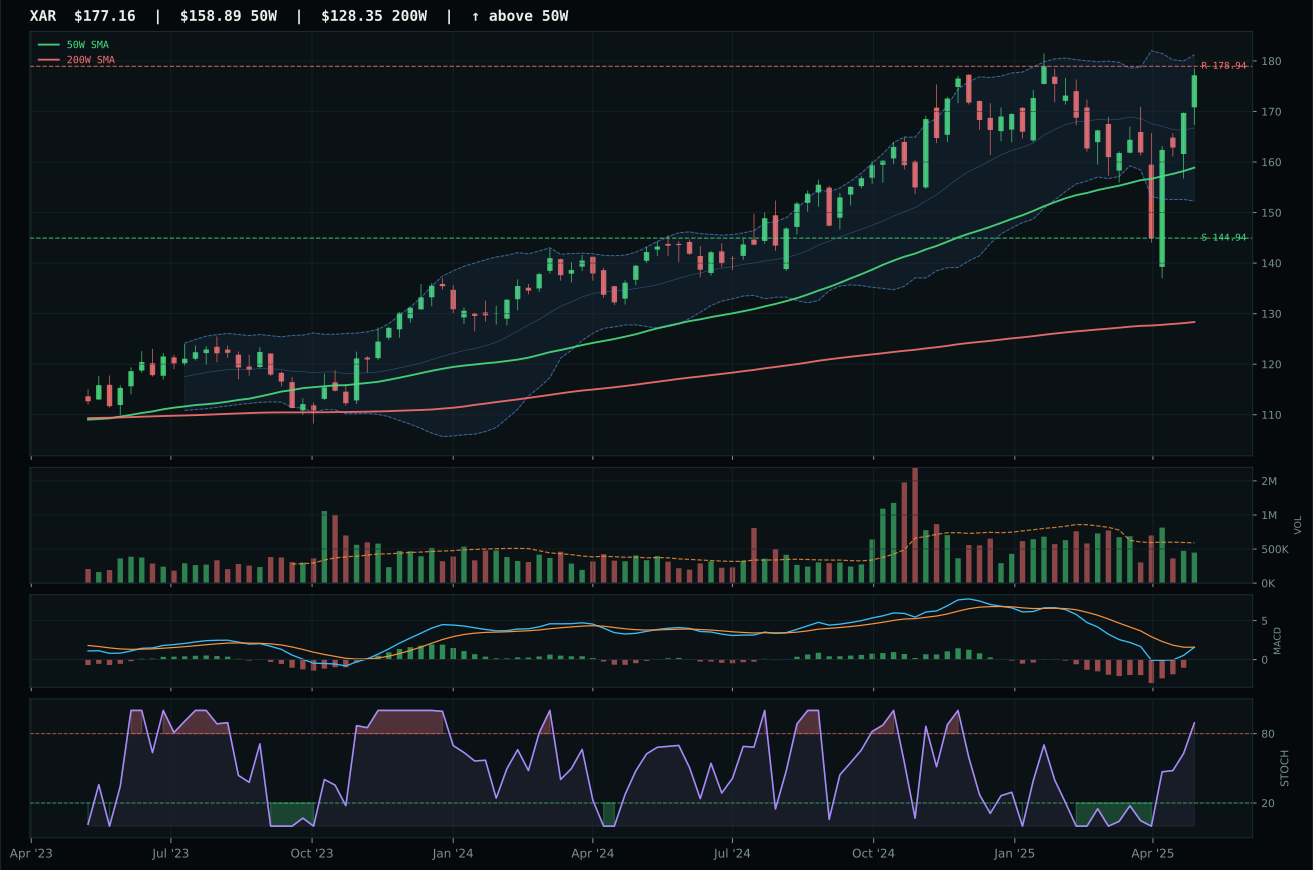
XAR has a neutral structure profile with 6.8% 13-week relative strength versus SPY.
A failed hold above support would weaken the setup.
Actionable but governed by invalidation levels.
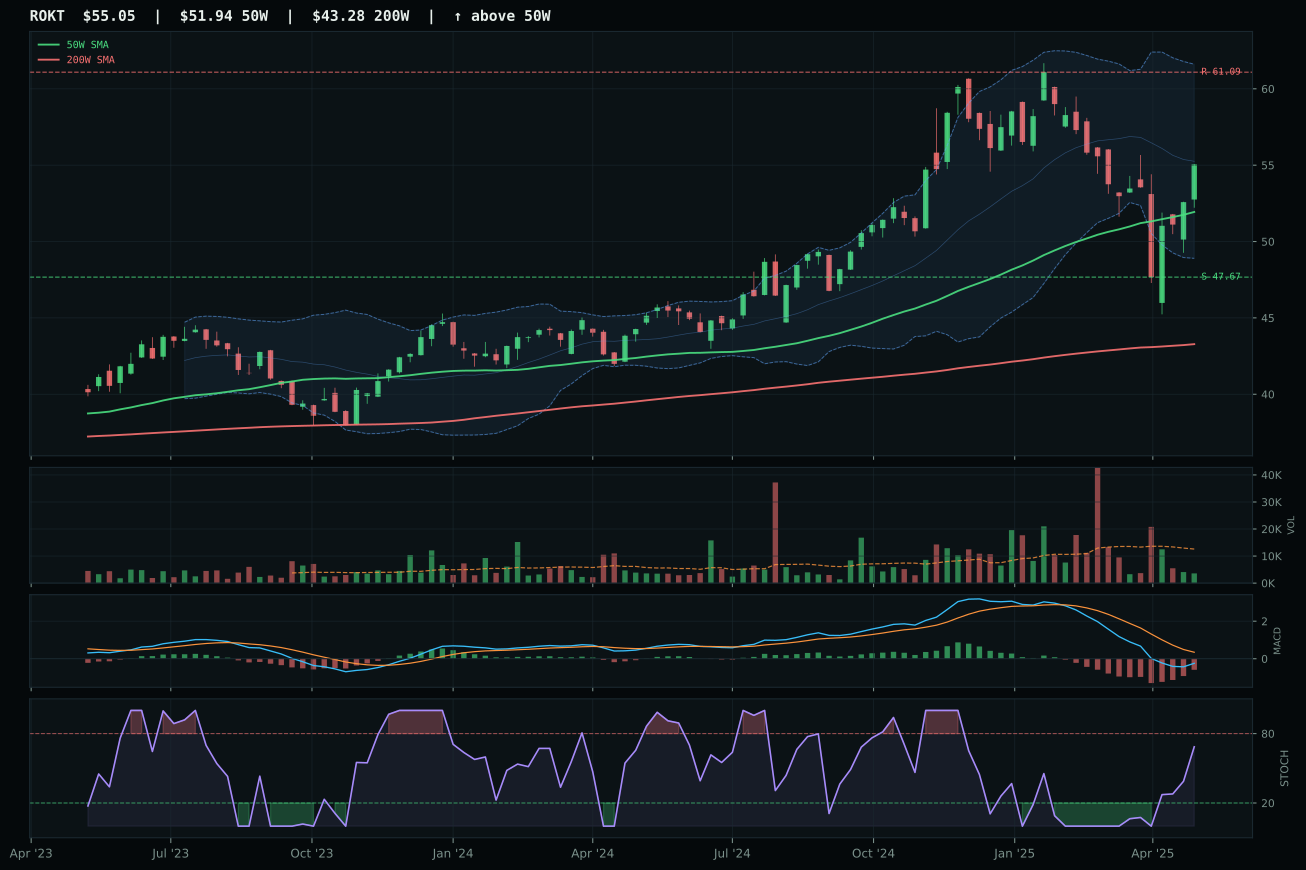
ROKT has a neutral structure profile with -0.9% 13-week relative strength versus SPY.
A failed hold above support would weaken the setup.
Tracked, but not top-2 eligible because: .
XAR wins the defense category with perfect trend confirmation (100/100) and perfect momentum (100/100), though its timing score of only 59/100 reveals the cost of being extended 11.5% above the 50W near the 52-week high. The runner-up ITA actually carries stronger technical evidence (75.1 vs 73.1) and better macro fit (60 vs 50), with bullish and improving MACD compared to XAR's bearish but improving posture, yet ITA loses the representative slot because structure is measurably less clean (70.7 vs 72.0) and volume confirmation is thinner. XAR's neutrality on macro fit (no category-specific descriptor profile available) is actually an advantage here—it avoids the liquidity stress penalty that would drag a more defensive trade. Risk/reward is stretched (37.8/100) because upside to resistance is only 1.0%, meaning entry here is strictly for momentum, not value.
Defense & Aerospace is allocated 5% in tier-2 despite a category score of 58.6, ranking it solidly in the middle tier. Defensive rotation is the macro hero (+8), broad market bear is constructive (+6), and the class benefits from flight-to-safety dynamics in a disinflation regime. However, the category fails to crack the top-two overweights because liquidity stress (-4) and risk appetite concerns (-2) trim upside, and XAR's extreme extension means the best entry is already closed. The 5% allocation acknowledges that equities are compressed into defensive trades, but it does so at a fair price rather than chasing into thinning volume and overextended risk/reward. For defense to earn top-two status, the category would need to rotate into a less stretched, cleaner structure—ideally pulling back to the 50W while maintaining buyer interest—or to see accelerating volume participation as institutional accounts rotate fresh capital into the space.
Technology — IGV
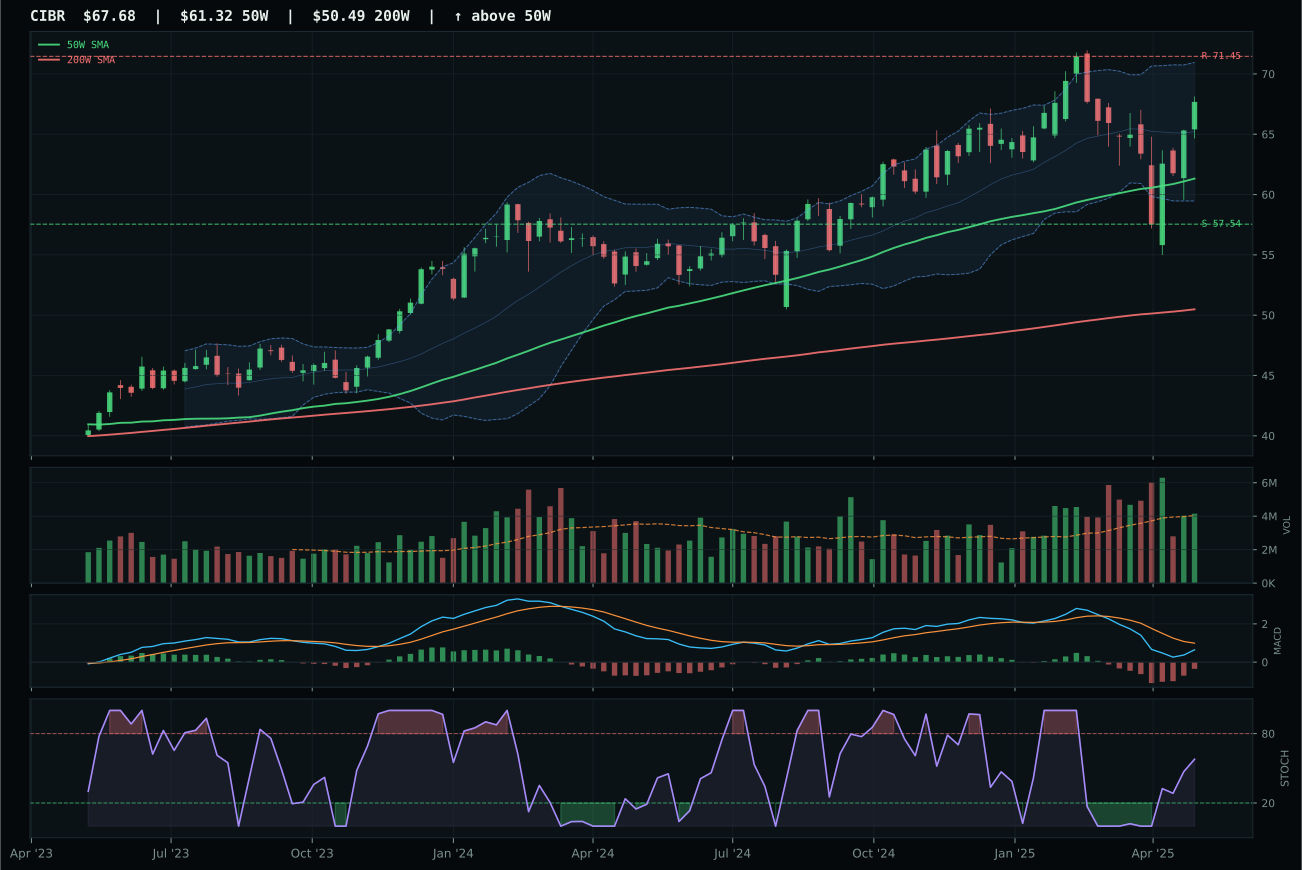
CIBR has a neutral structure profile with 5.9% 13-week relative strength versus SPY.
A failed hold above support would weaken the setup.
Actionable but governed by invalidation levels.
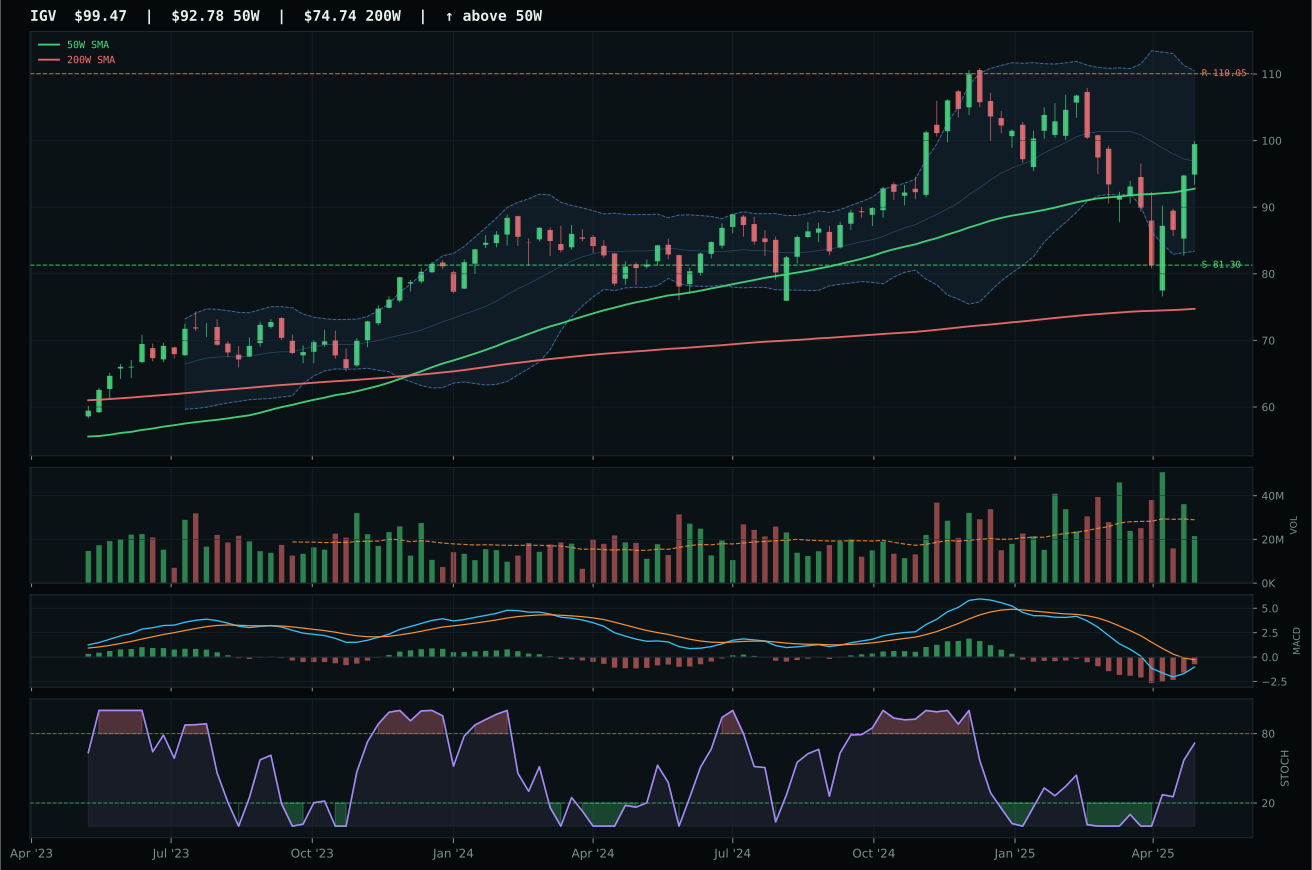
IGV has a neutral structure profile with 2.5% 13-week relative strength versus SPY.
A failed hold above support would weaken the setup.
Actionable but governed by invalidation levels.
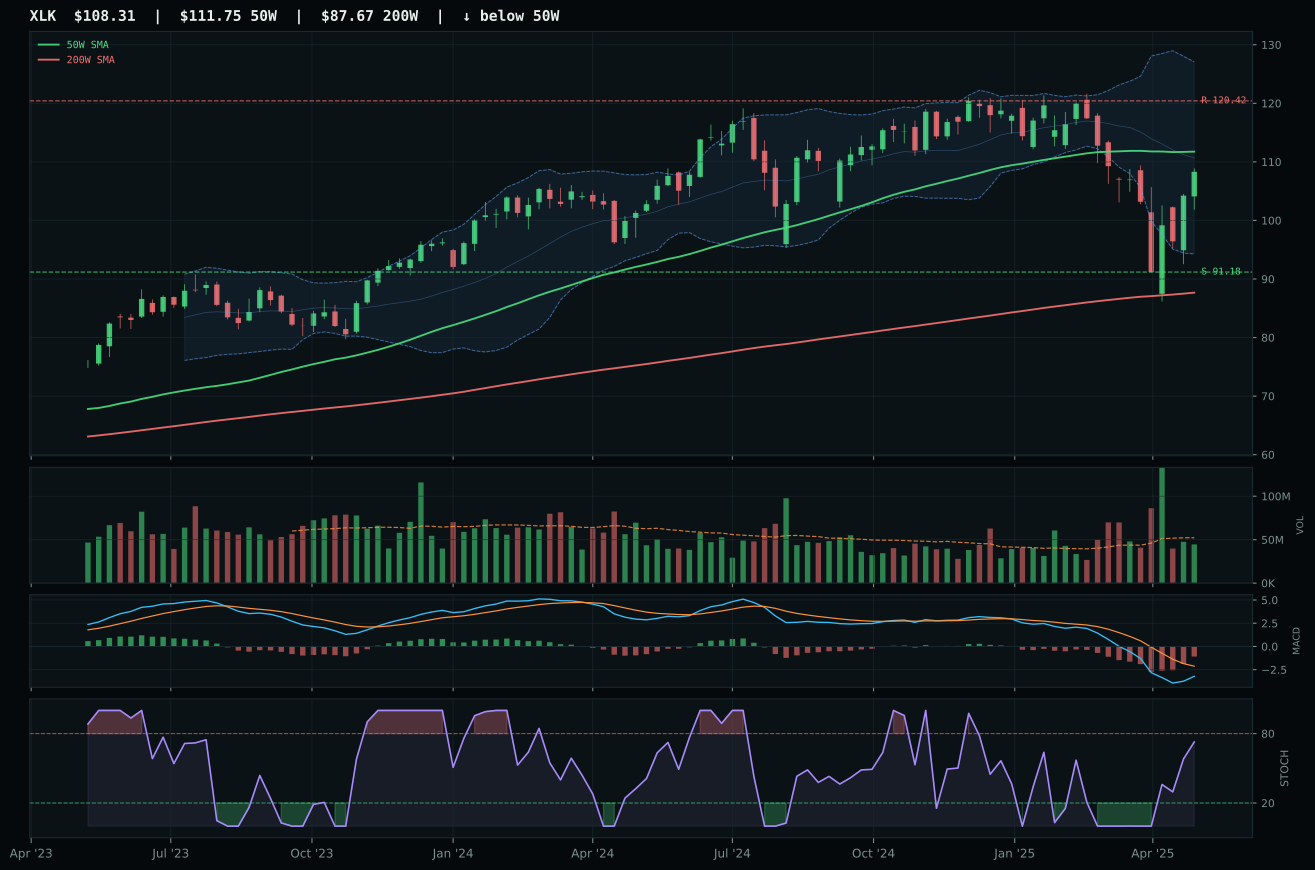
XLK has a compression near 50W profile with -0.3% 13-week relative strength versus SPY.
A failed hold above support would weaken the setup.
Actionable but governed by invalidation levels.
IGV wins the category by edging out CIBR on the basis of superior risk/reward positioning (52.7 vs 50.4), though the margin is narrow enough to signal a crowded setup. The price sits 7.2% above the 50-week moving average in what amounts to a neutral structure with deteriorating volume—only 0.74x the 20-week average—meaning new money is sparse even as MACD begins its recovery from bearish territory. CIBR offered better relative strength versus SPY (5.9% vs 2.5%) and a more robust timing score (both at 83 on distance to the 50W), but its volume was neutral rather than thin, making IGV the cleaner structural representative. The category itself carries a 52.0/100 macro fit score where disinflation pressure provides modest tailwinds (+5) while active liquidity stress drags hard (-10), leaving technology dependent on technical sponsorship rather than macro narrative support.
Technology earns a 5% allocation as a tier-2 category, well behind the top-two overweights. The final score of 57.9 reflects strong trend evidence (96.8/100 in IGV's favor—price well above both major moving averages with positive slope) tempered by timing and structure issues that prevent higher rank. Disinflation is supportive of duration-sensitive equities on paper, but the active descriptor checklist reveals that liquidity stress (-10) and risk appetite erosion are the dominant macro forces this week, making technology a secondary play. What would move this category up: a sustained bounce in volume participation, evidence that MACD is fully improving rather than merely recovering from oversold, and either a pullback to the 50W (improving risk/reward) or a breakout above resistance at 110 with volume confirmation. For now, it holds its 5% slot as a technical setup worth holding but not worthy of capital escalation.
AI — SMH
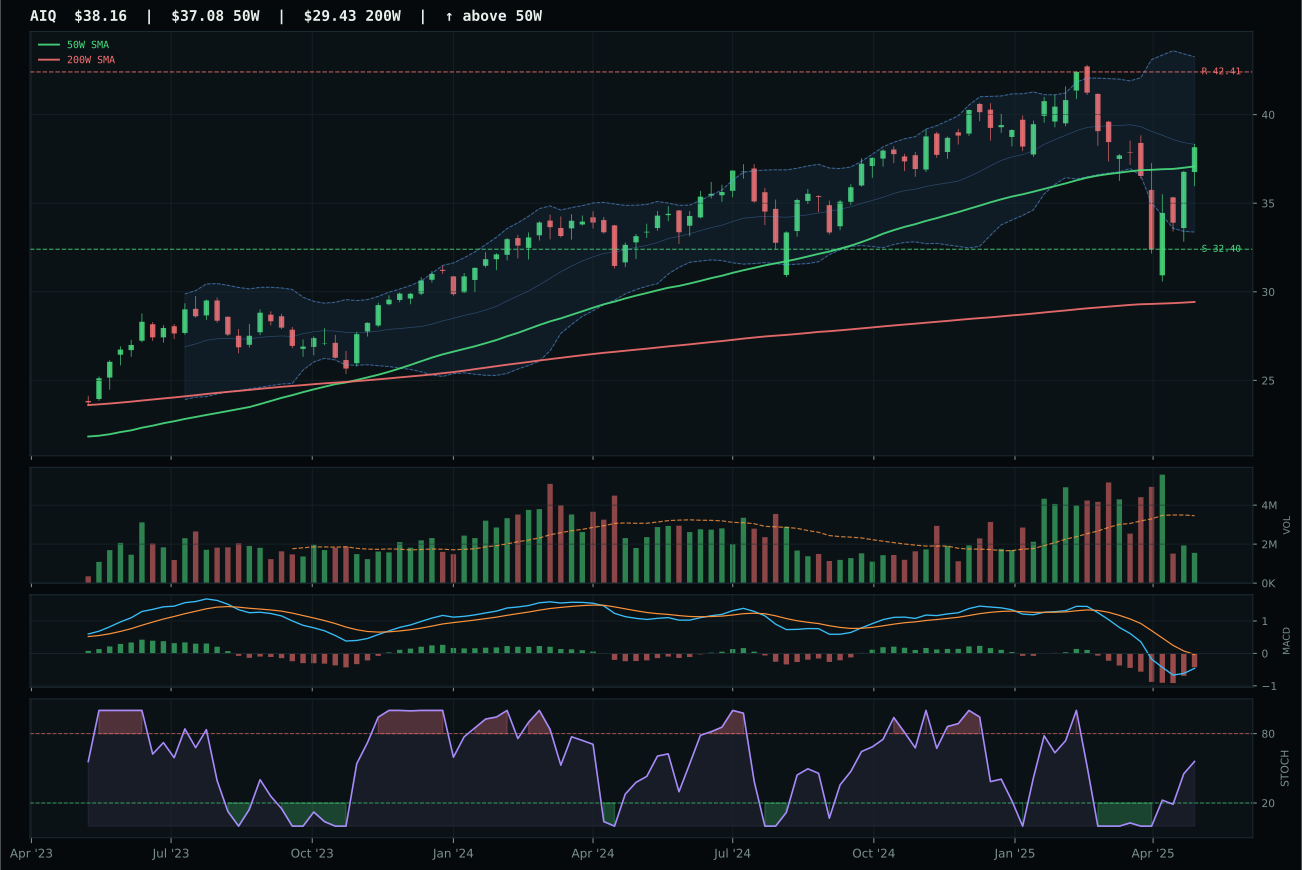
AIQ has a compression near 50W profile with 0.2% 13-week relative strength versus SPY.
A failed hold above support would weaken the setup.
Actionable but governed by invalidation levels.
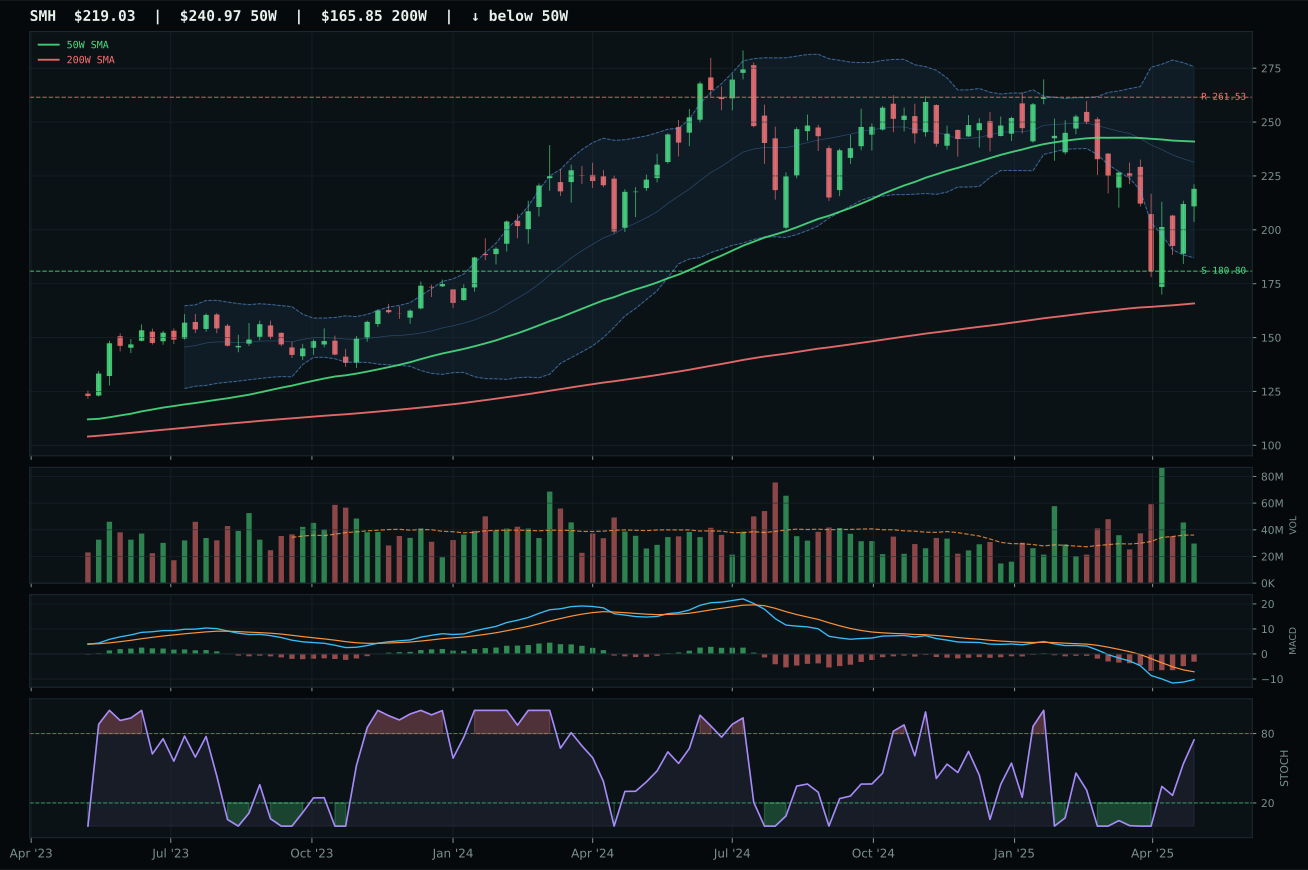
SMH has a neutral structure profile with -4.3% 13-week relative strength versus SPY.
A failed hold above support would weaken the setup.
Actionable but governed by invalidation levels.
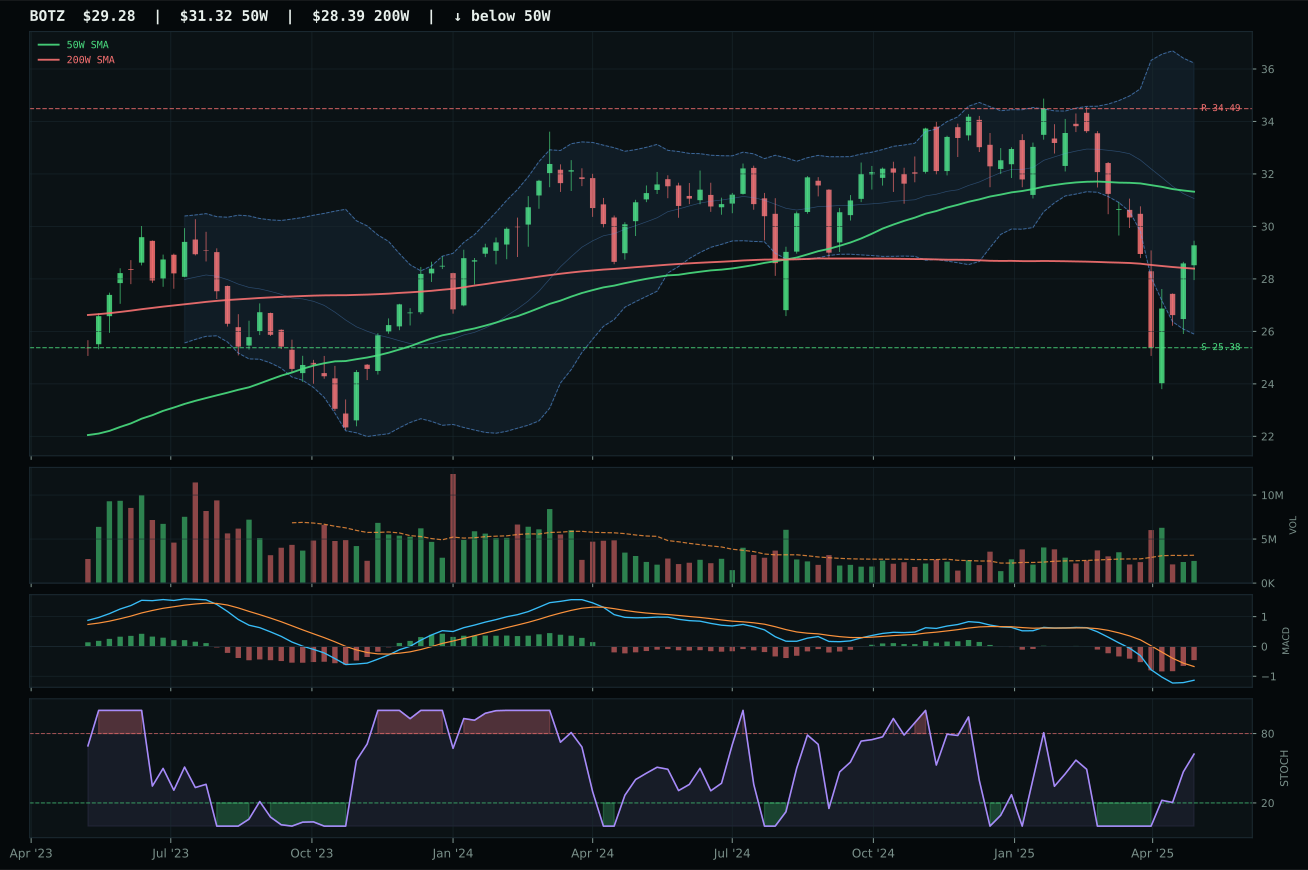
BOTZ has a neutral structure profile with -5.9% 13-week relative strength versus SPY.
A failed hold above support would weaken the setup.
Actionable but governed by invalidation levels.
SMH wins a crowded and weak category by virtue of neutral volume participation and a pullback setup that sits 9.1% below the 50-week line—a reset rather than an extended chase. Its 13-week return is -10.1% and RS versus SPY is -4.3%, both deeply negative, but the structure is cleaner than AIQ's compression near the 50W and the Fibonacci location (0.618 at 213.26) offers a defined value anchor. AIQ carried better technical evidence at the basket level (71.5 vs 62.8), but it paid the price for being compressed and overbought on an extended timeframe, with thin volume participation signaling weak accumulation. The stochastic RSI rising mid-zone at 0.74 and MACD improving from bearish offer the promise of reversal structure, but the entire category scores only 34.9—lower than six of ten categories this week—because liquidity stress (-12) and broad market bear dynamics (-8) are actively weaponized against momentum equities.
AI receives 5% as a tier-2 holding despite a final category score of just 34.9, placing it among the weaker six. The allocator is holding this position on mean-reversion timing and the technical promise of a coiled setup rather than on any macro conviction. Liquidity stress and risk appetite erosion are brutal headwinds; disinflation theory would ordinarily support semiconductors and compute infrastructure, but the market is punishing leverage and duration right now. The only reason to keep 5% here is that SMH's pullback structure—with momentum confirmation at 73.7/100 driven by strong four-week return (21.1%) despite weak thirteen-week performance—offers an asymmetric entry if buyers reappear at support. For AI to earn tier-one status or grow beyond 5%, the category would need to hold support above 180.80 and demonstrate volume participation above the 20-week average while broad market bear dynamics stay flat or reverse.
Nuclear Energy — URA
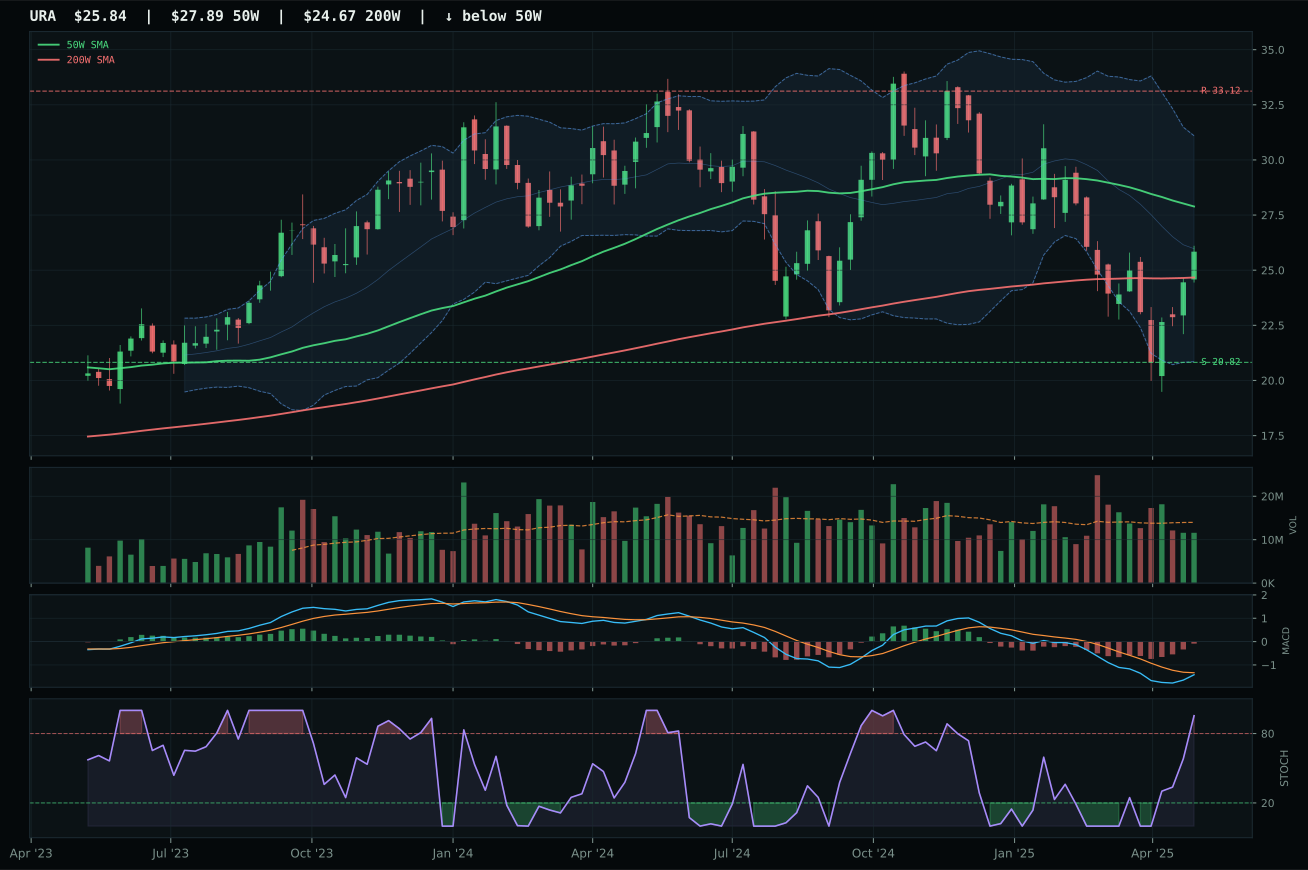
URA has a neutral structure profile with -2.9% 13-week relative strength versus SPY.
A failed hold above support would weaken the setup.
Actionable but governed by invalidation levels.
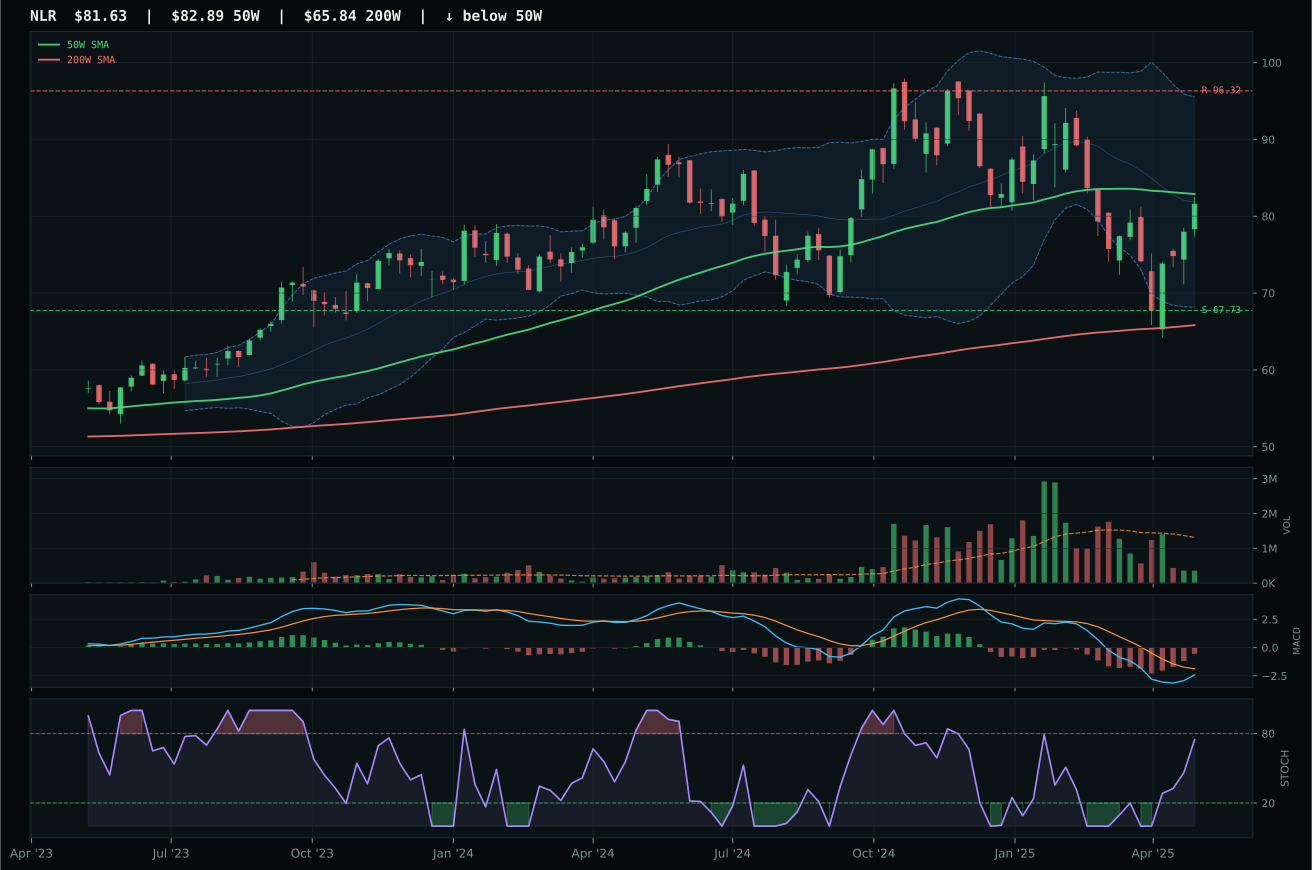
NLR has a compression near 50W profile with -2.8% 13-week relative strength versus SPY.
A failed hold above support would weaken the setup.
Actionable but governed by invalidation levels.
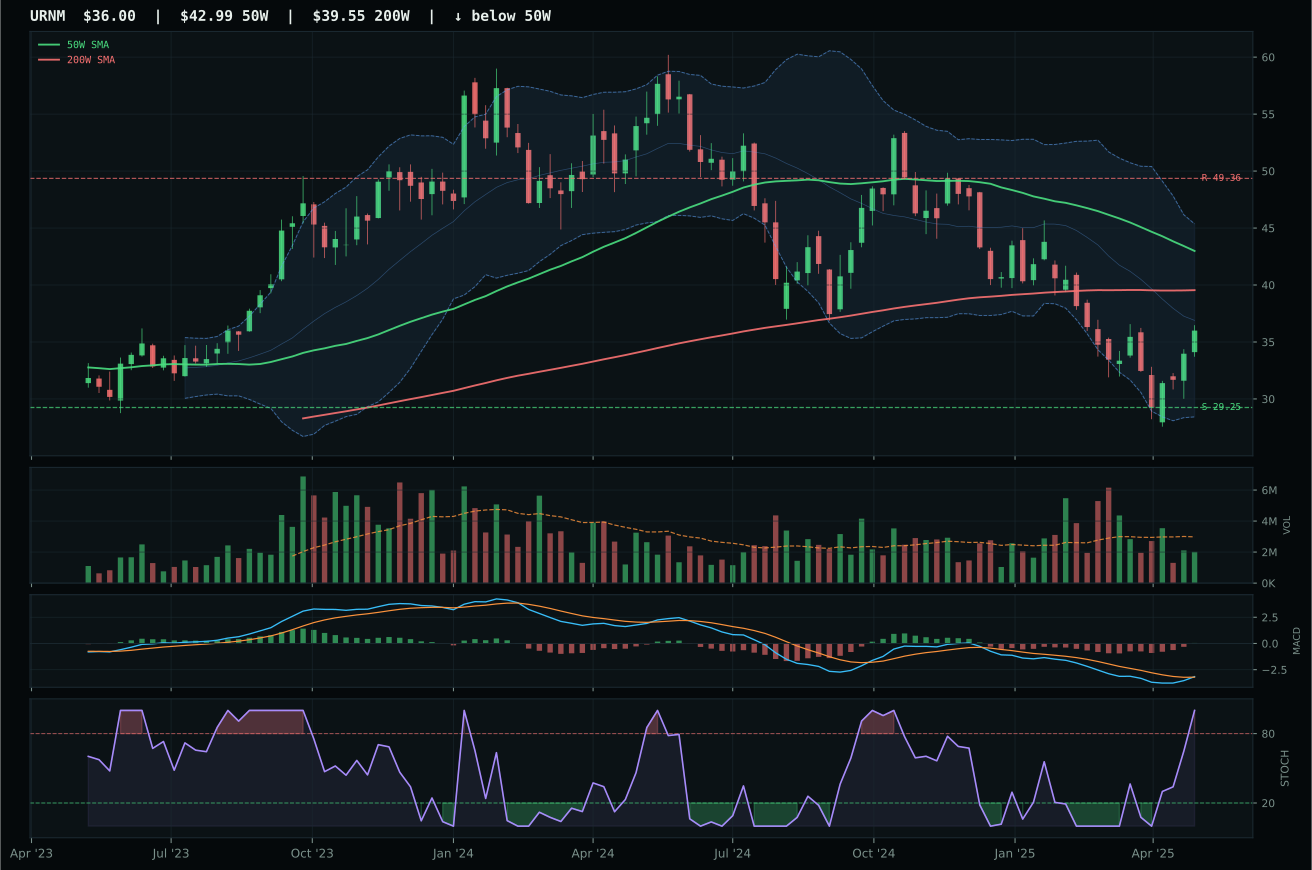
URNM has a neutral structure profile with -5.5% 13-week relative strength versus SPY.
A failed hold above support would weaken the setup.
Actionable but governed by invalidation levels.
URA wins the nuclear energy category with a pullback setup 7.3% below the 50W and perfect momentum confirmation (100/100) driven by a strong 24.1% four-week return and neutral volume. The structure is neutral with defined support at 20.82 and resistance at 33.12, offering a classic swing-trade range. The runner-up NLR carries stronger technical evidence (59.9 vs 57.8) and better macro fit (59 vs 50) with defensive rotation (+6) and broad market bear (+3) as active tailwinds, yet NLR loses the representative slot because volume is thin (not neutral) and it is compressed near the 50W at -1.5% distance instead of pulled back to a discounted entry. The category as a whole scores only 34.7—weak relative to top performers—because liquidity stress (-7) and risk appetite erosion (-4) restrain even defensive energy trades.
Nuclear Energy receives 5% in tier-2 allocation despite a final category score of 34.7, holding its slot as a secondary defensive position. Macro fit is neutral (39/100) because no category-specific descriptor profile is available, yet the technical setup in URA offers a defined pullback structure with momentum reversing higher on the four-week timeframe. The allocator is accepting this allocation to maintain diversification across energy types and to hedge portfolio duration through utilities-like power generation. For nuclear to advance to tier-one status, the category would need either an explicit macro pivot toward electricity demand growth or capital markets reopening for utilities financing, plus technical confirmation that URA holds support at 20.82 and establishes a higher low. Without those catalysts, nuclear remains a secondary tactical hold rather than a conviction position.
Industrial Metals — COPX
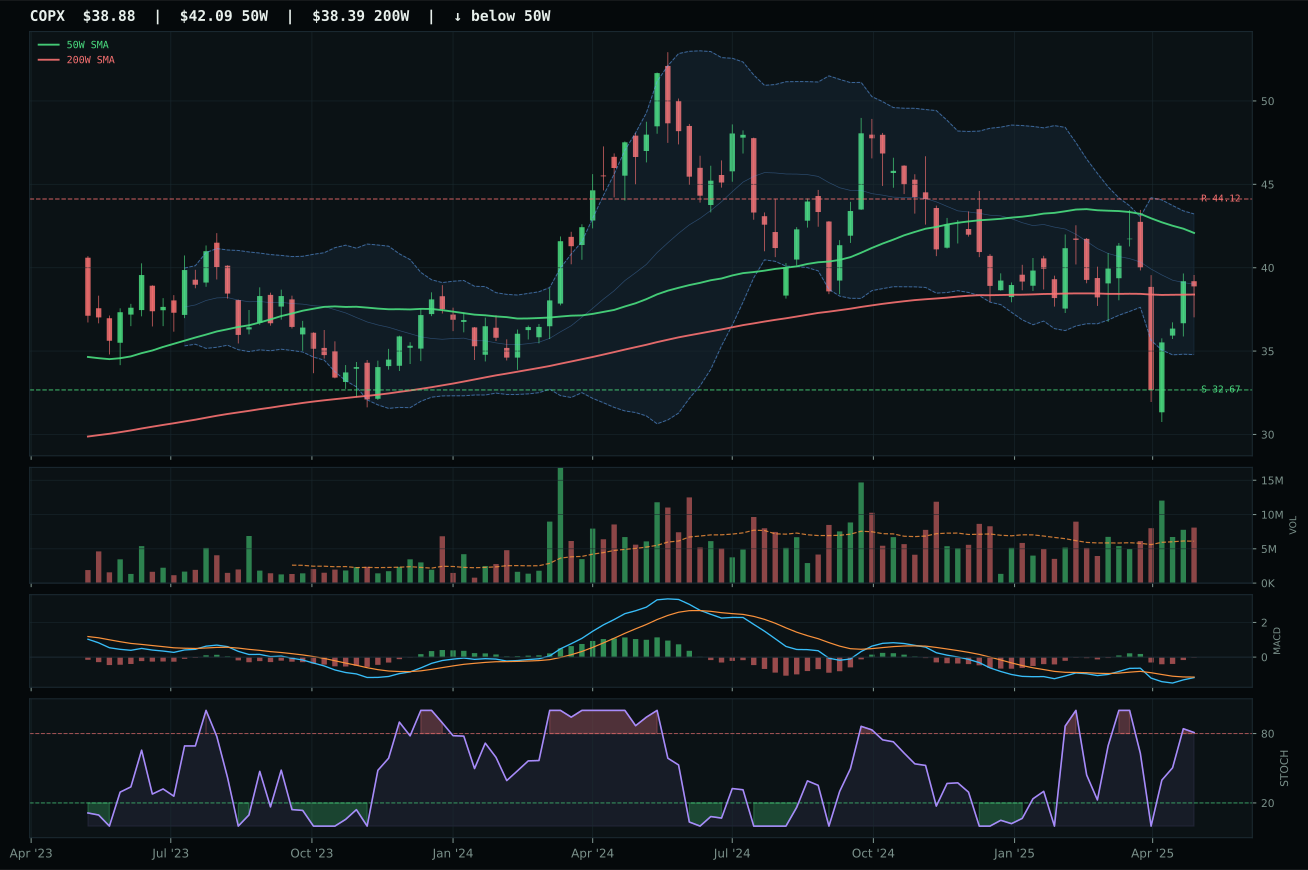
COPX has a neutral structure profile with 7.7% 13-week relative strength versus SPY.
A failed hold above support would weaken the setup.
Actionable but governed by invalidation levels.
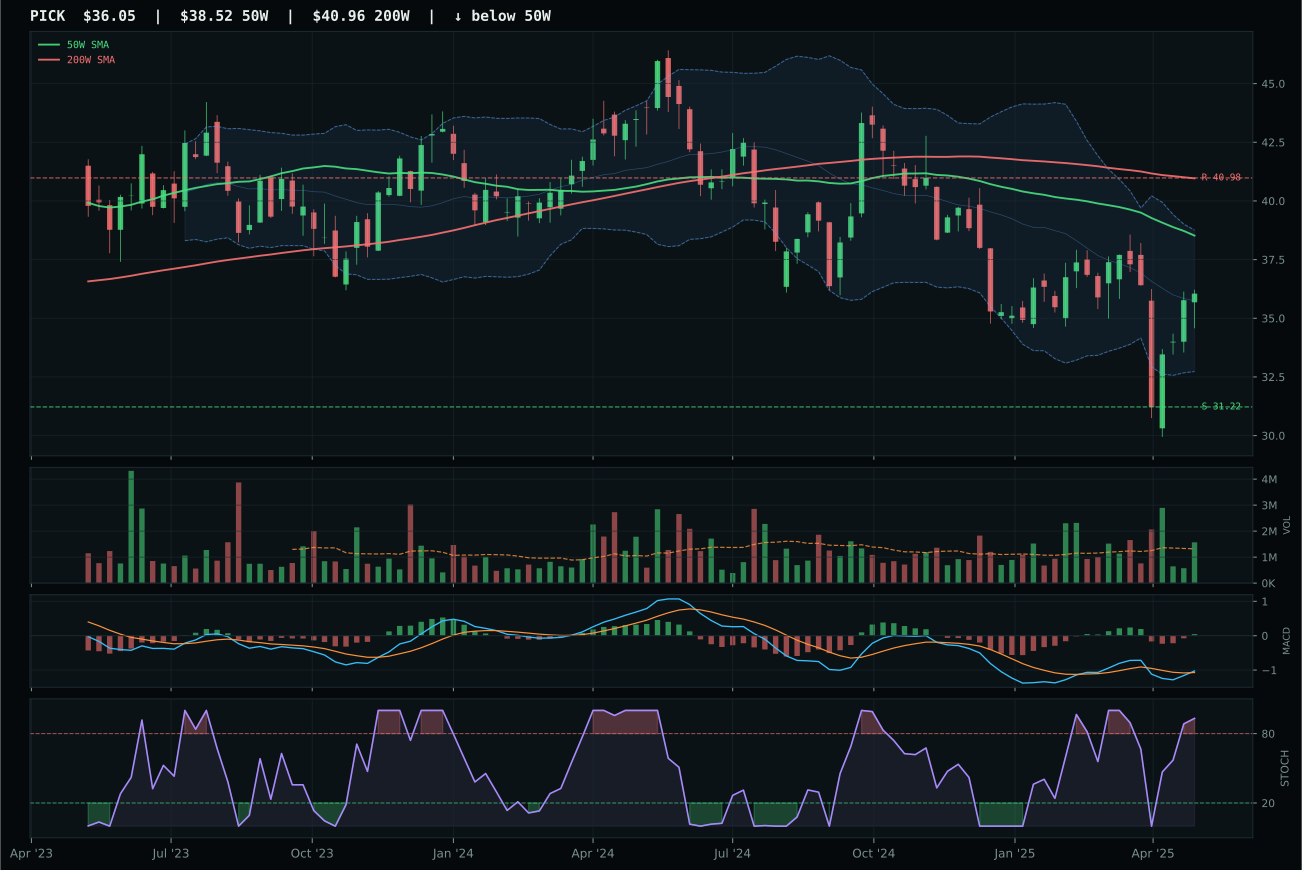
PICK has a neutral structure profile with 7.5% 13-week relative strength versus SPY.
Extension and support failure are the main tactical risks.
Tracked, but not top-2 eligible because: structurally broken.
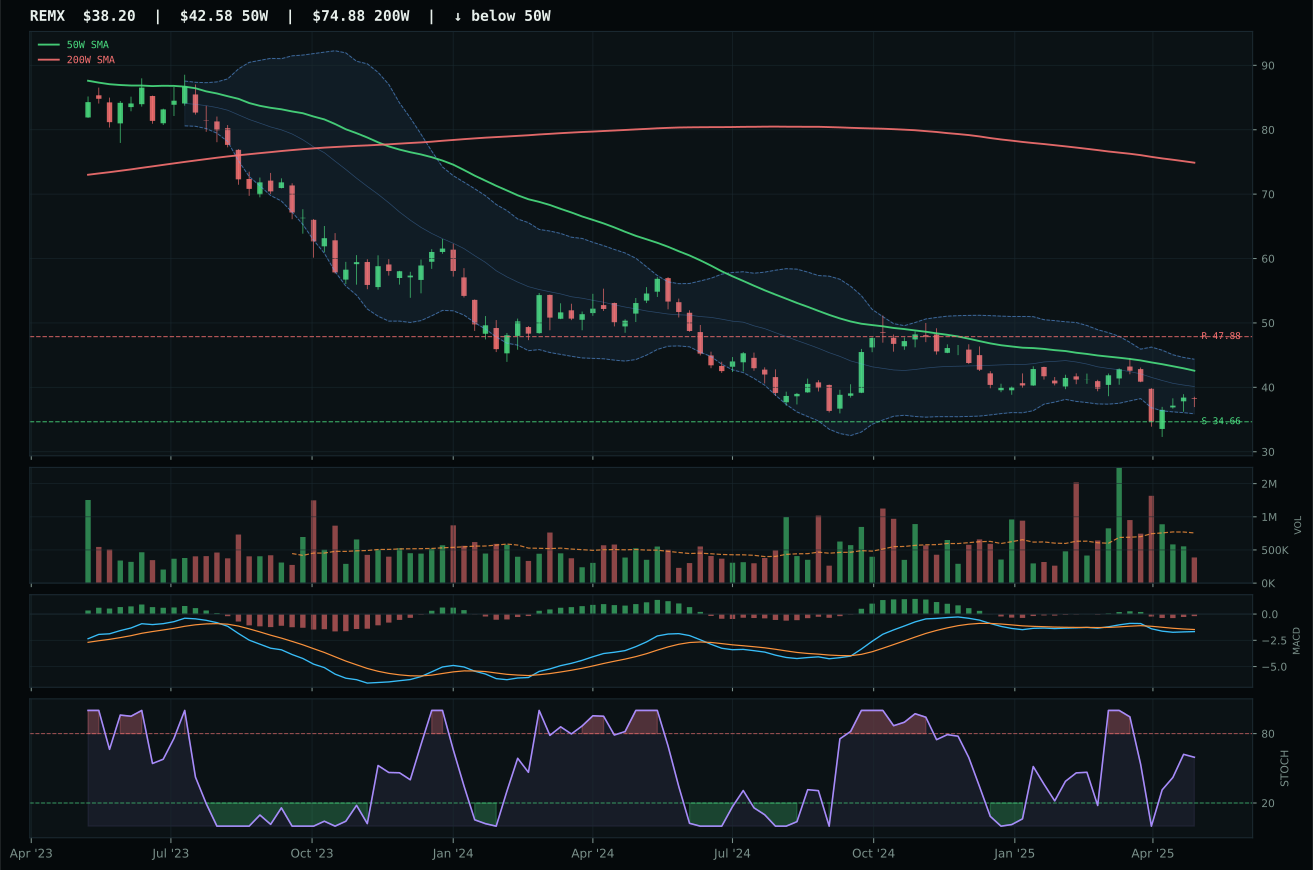
REMX has a neutral structure profile with -0.1% 13-week relative strength versus SPY.
Extension and support failure are the main tactical risks.
Tracked, but not top-2 eligible because: structurally broken.
COPX wins the industrial metals category with perfect momentum confirmation (100/100) driven by a 19.0% four-week return and above-average volume participation at 1.32x the 20-week average—genuine accumulation on a reset move. The price sits 7.6% below the 50W in the deep Fibonacci retracement zone (0.618 at 39.22), offering defined support at 32.67 and upside resistance at 44.12, creating a swing trade structure. The runner-up PICK is marked as structurally broken and carries only 42.0/100 technical evidence, so the gap is real (32.4 points on final category score). COPX's 7.7% RS versus SPY confirms that copper-specific demand (or scarcity narrative) is resonating even in a disinflation regime where industrial demand typically weakens. However, the category-level macro fit is only 42/100 because liquidity stress (-8) and disinflation pressure work against base metals, and the final category score bottoms out at 19.0—much weaker than top-tier categories.
Industrial Metals receives 5% in tier-2 allocation despite the weak category score of 19.0. The allocator is making a tactical bet that COPX's above-average volume participation (1.32x average) and perfect momentum confirmation signal real accumulation by informed buyers despite macro headwinds. Liquidity stress is the primary drag, and disinflation ordinarily crushes industrial demand, but COPX's relative strength versus SPY (7.7%) and category strength (0.2%) suggest the copper complex may be decoupling from broad risk sentiment on supply-side discipline or structural electrification demand. For industrial metals to earn tier-one status, the category would need to see macro regime clarity around inflation resurgence or explicit infrastructure stimulus, and technically, COPX would need to hold support at 32.67 and close a weekly bar above 40 with volume expansion. Until then, the 5% slot is a hedge position, not a conviction bet.
Traditional Energy — XLE
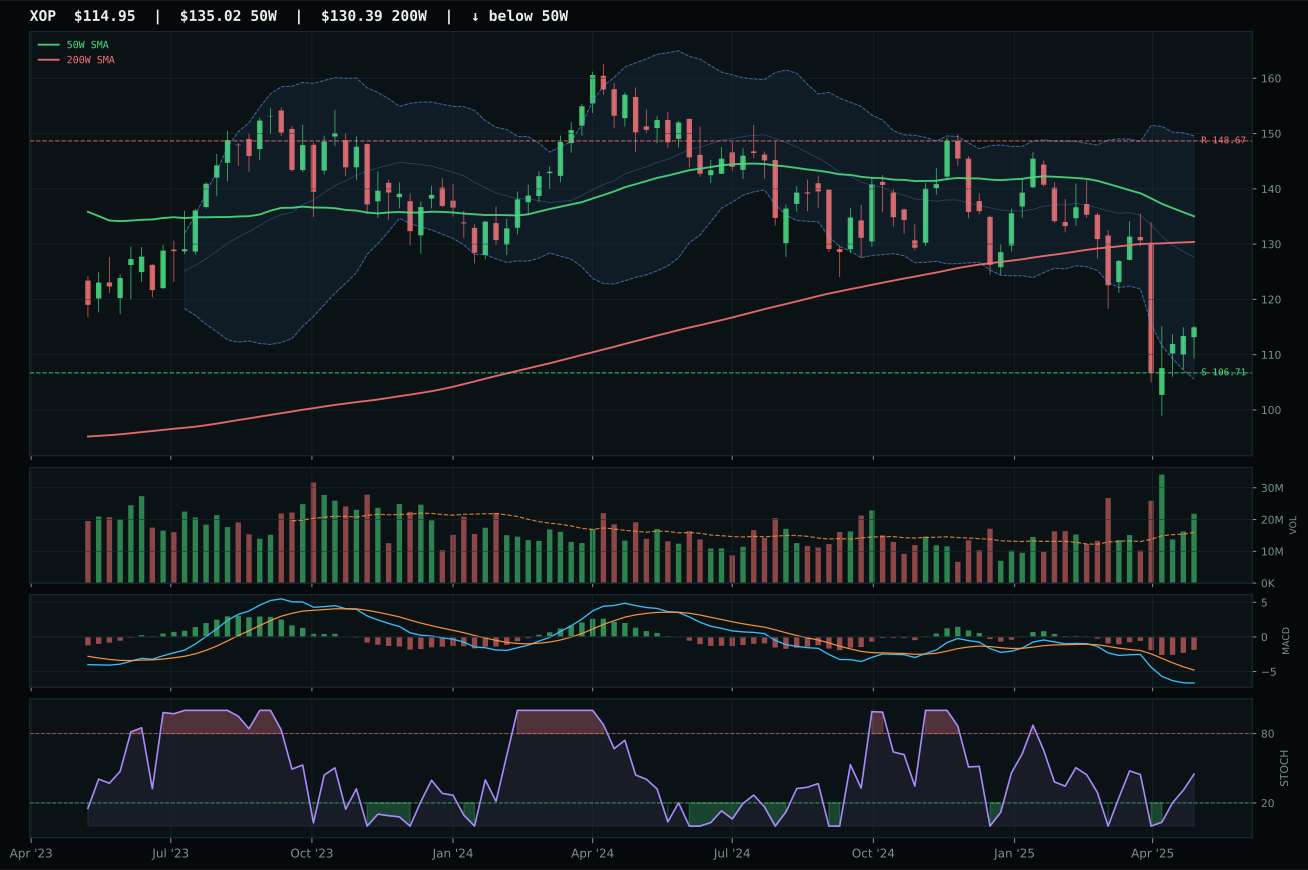
XOP has a neutral structure profile with -8.5% 13-week relative strength versus SPY.
A failed hold above support would weaken the setup.
Actionable but governed by invalidation levels.
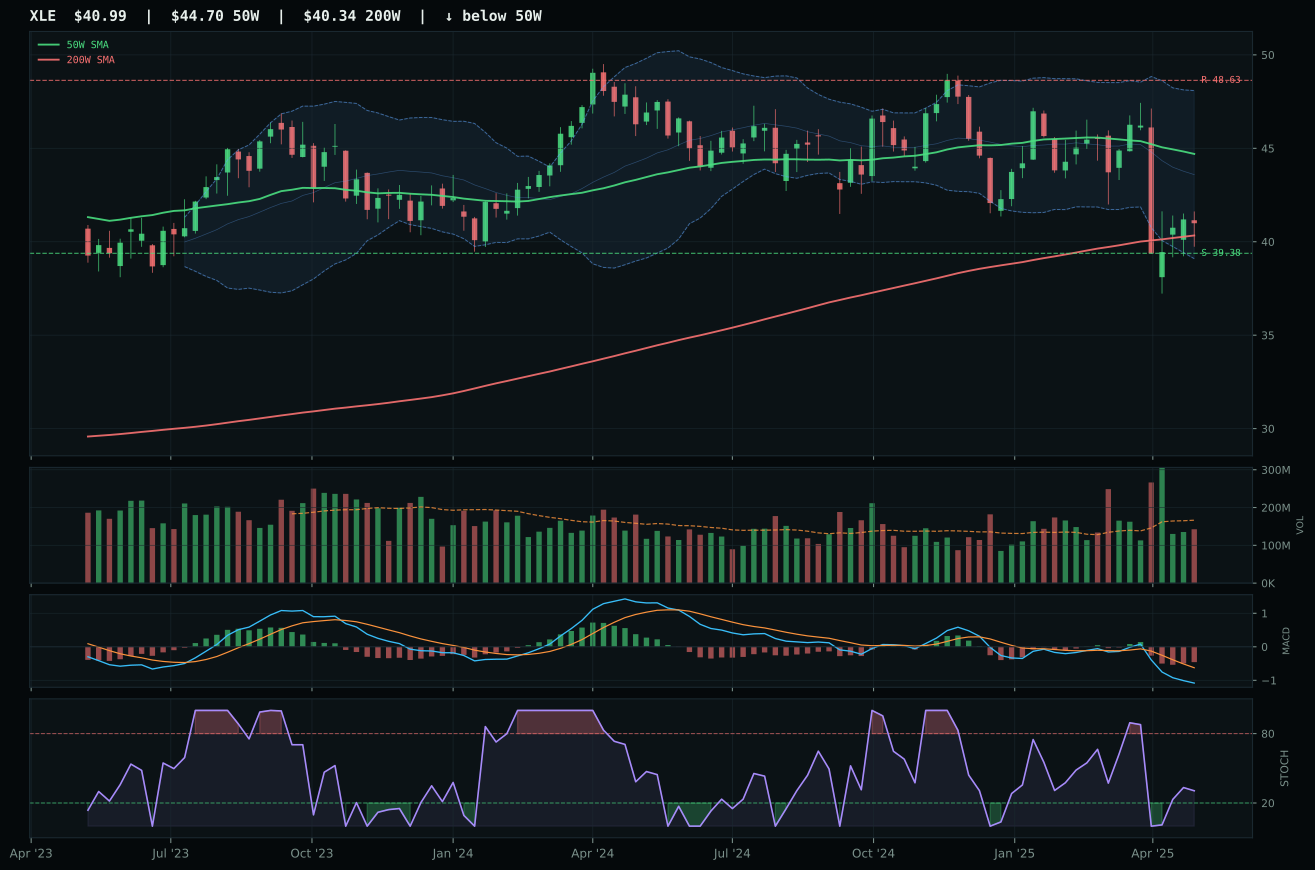
XLE has a pullback into support profile with -0.6% 13-week relative strength versus SPY.
A failed hold above support would weaken the setup.
Actionable but governed by invalidation levels.
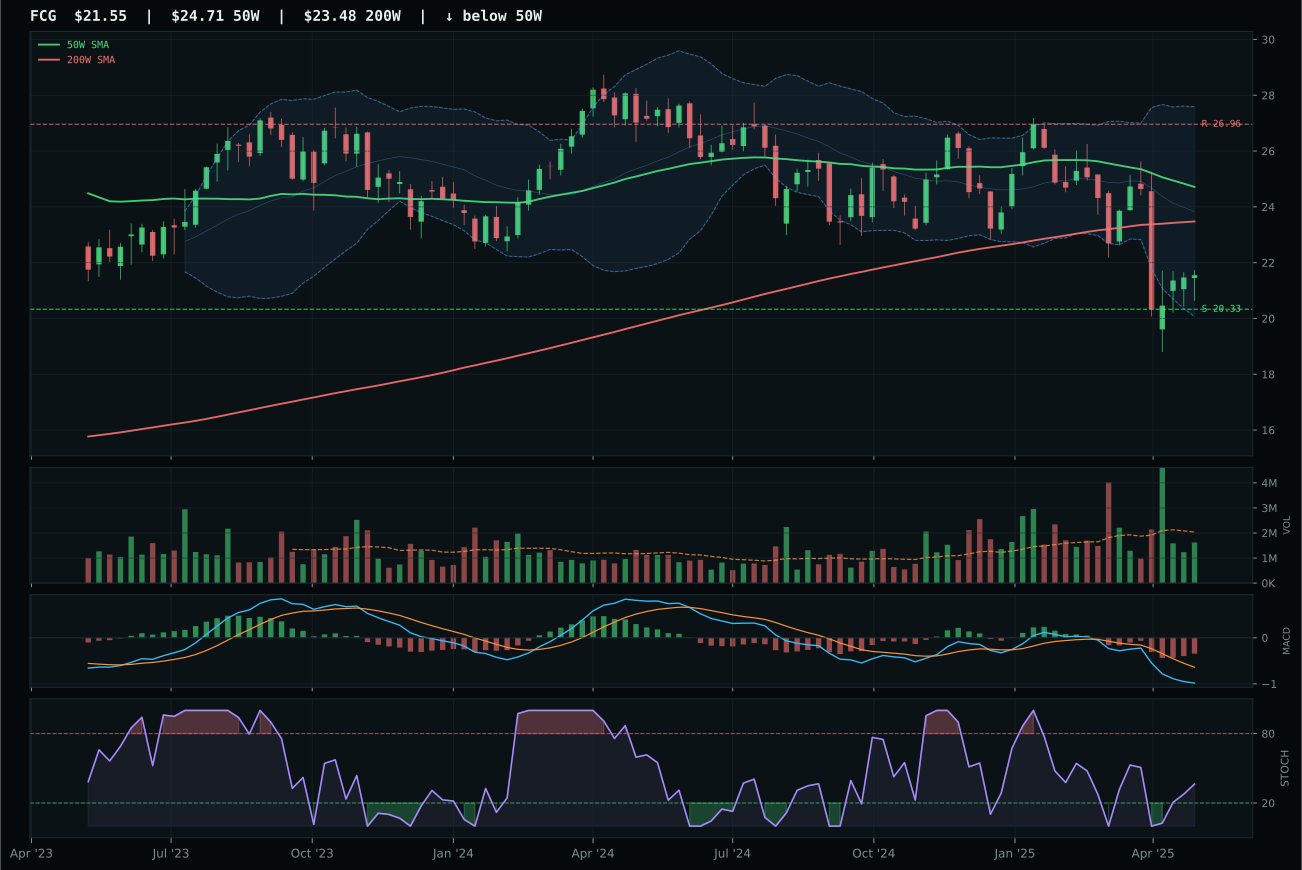
FCG has a neutral structure profile with -7.5% 13-week relative strength versus SPY.
A failed hold above support would weaken the setup.
Actionable but governed by invalidation levels.
XLE wins a deeply broken energy category (score 6.8) by virtue of superior timing (88 vs 63 for runner-up XOP), superior risk/reward (90 vs 75), and a cleaner pullback-into-support structure that offers defined invalidation at 39.38 near the 52-week low. The price is 8.2% below the 50W with MACD bearish but improving and stochastic RSI rising from oversold mid-zone, creating classic reversal setup geometry. XLE's relative strength versus the category median is 6.9%, the best in class, yet the stock is still -0.6% versus SPY, confirming that energy as a whole is being shunned. XOP loses because its -8.5% RS versus SPY reveals exploration beta is toxic in a liquidity-stressed environment, and timing score of only 63 means the reversal signal is less mature. The broader category is crushed by disinflation pressure (-10) and its associated destruction of commodity prices, making this a category failure rather than an ETF-selection failure.
Traditional Energy receives 0% allocation this week, ranked 9th or 10th with a final score of 6.8. Disinflation is outright hostile to oil and gas equities (-10), liquidity stress adds a secondary drag (-7), and the 3/2/1 basket never exceeds 43.0 on technical evidence. XLE's best-in-class timing and risk/reward signals (90/100) are admirable, but they are insufficient to overcome a macro regime where falling inflation rates and tight financial conditions suppress energy demand and reduce leverage capacity for energy investors. The category is simply outside the allocation entirely. Recovery would require an explicit inflation scare, a sudden supply disruption (geopolitical shock), or a reversal in monetary conditions toward accommodation. Until one of those occurs, energy is rationed to zero—not because the technical setup is broken, but because the macro regime is fundamentally opposed to the thesis.
Agriculture & Livestock — VEGI
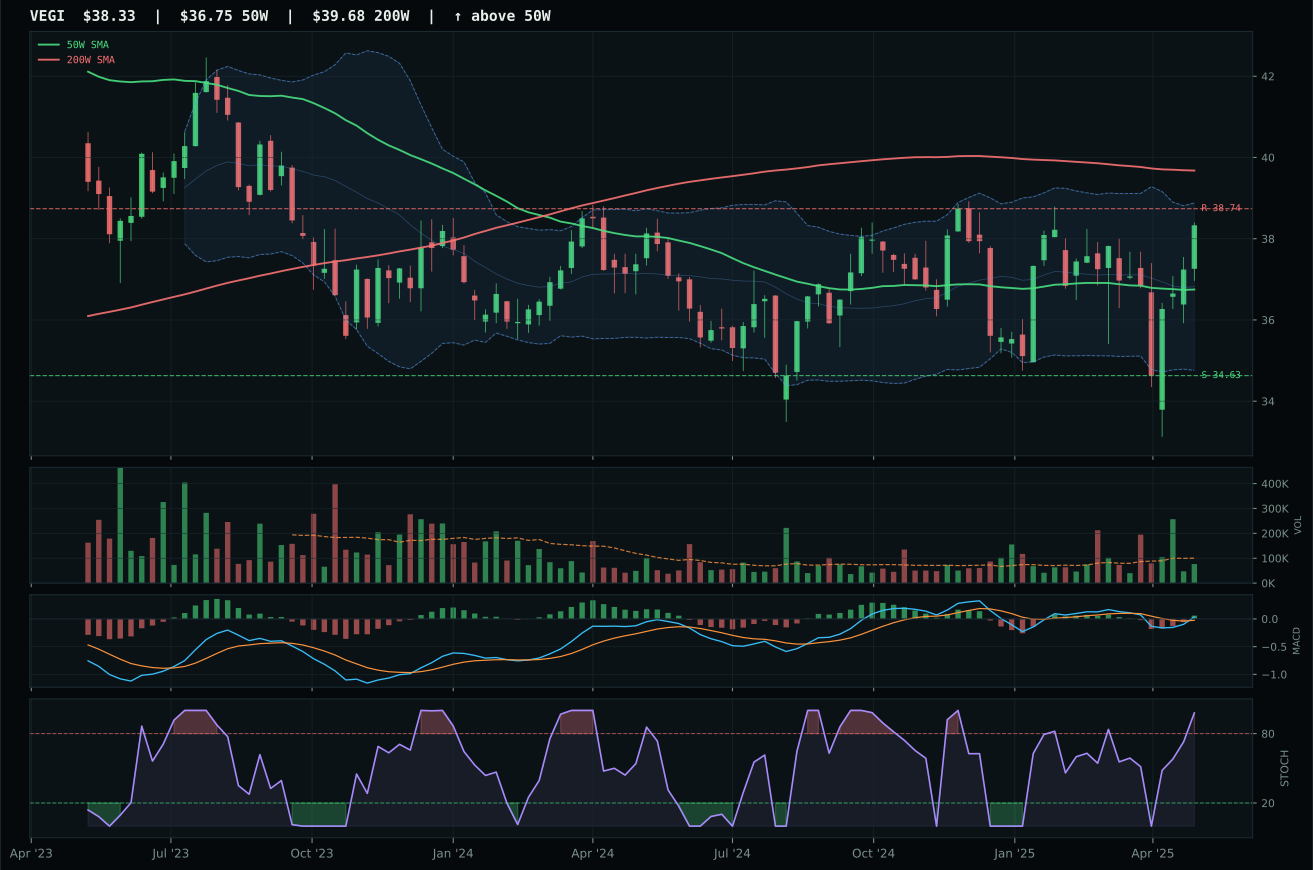
VEGI has a neutral structure profile with 6.1% 13-week relative strength versus SPY.
A failed hold above support would weaken the setup.
Tracked, but not top-2 eligible because: .
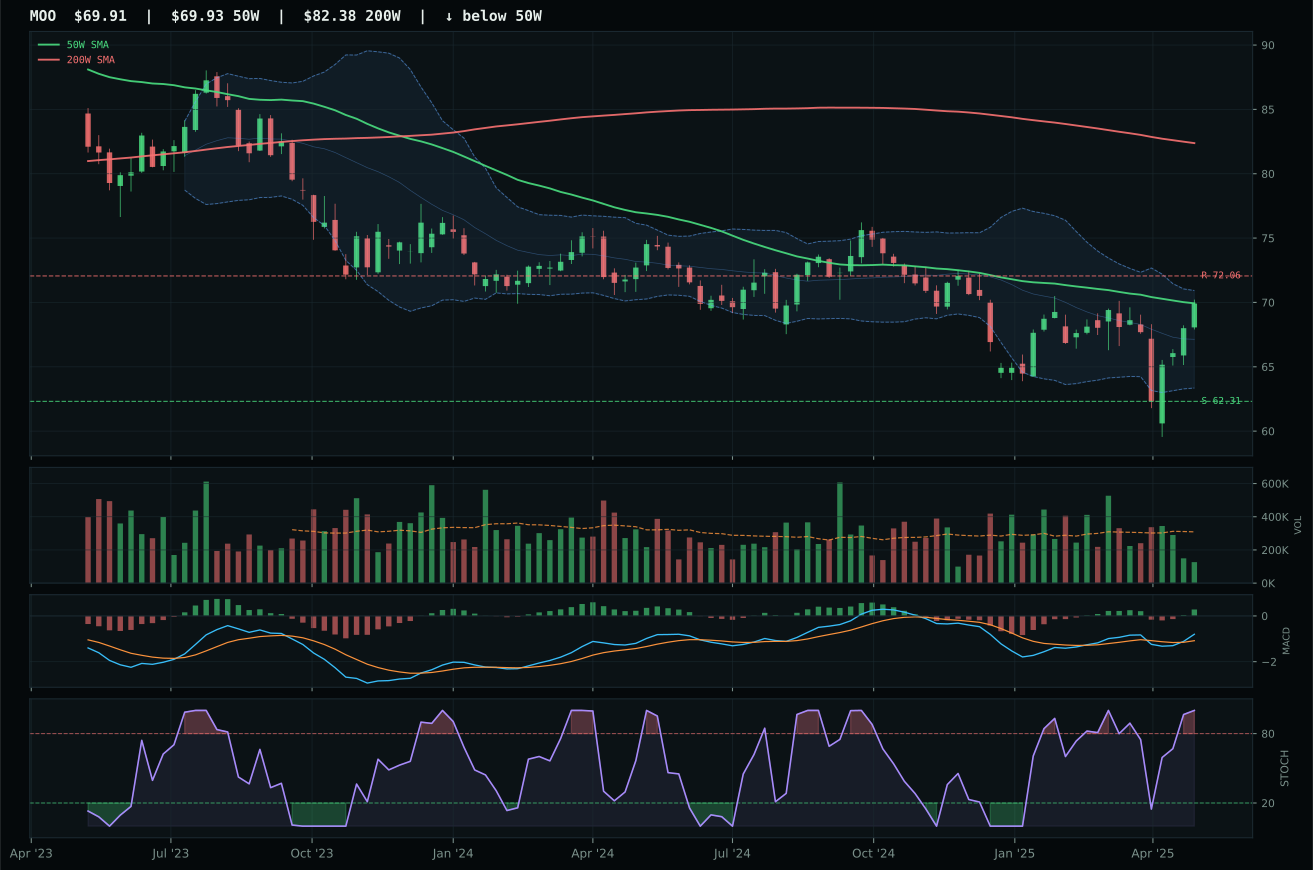
MOO has a compression near 50W profile with 6.8% 13-week relative strength versus SPY.
Extension and support failure are the main tactical risks.
Tracked, but not top-2 eligible because: structurally broken.
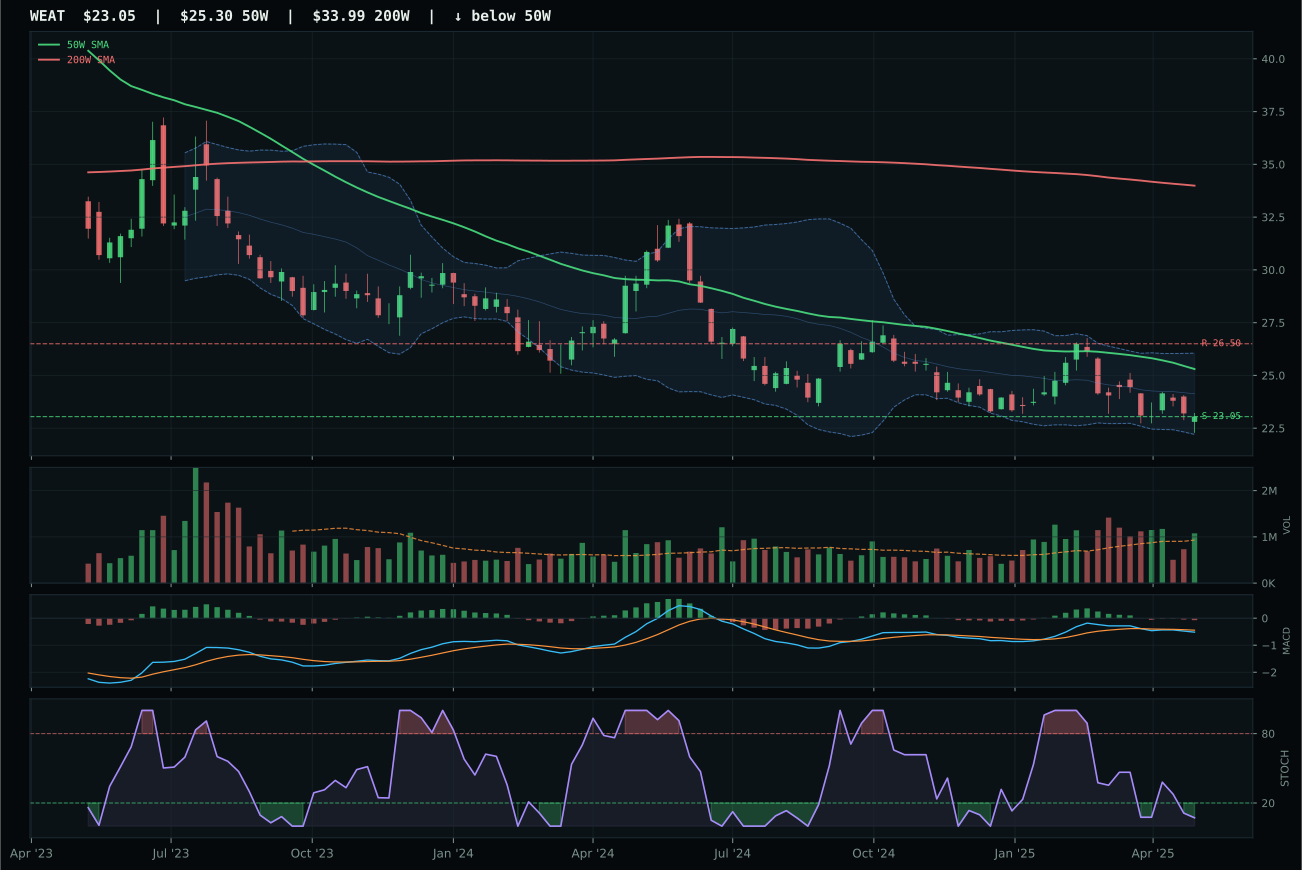
WEAT has a pullback into support profile with -1.0% 13-week relative strength versus SPY.
Extension and support failure are the main tactical risks.
Tracked, but not top-2 eligible because: structurally broken.
VEGI wins a category that has failed its eligibility filters and carries a final score of just 2.8, meaning it is not being allocated. Among three weak peers, VEGI exhibits the cleanest structure (76.7 vs MOO's 45.1), which in a broken category amounts to leading from weakness. The setup is neutral structure with price above the 50W but below the 200W, meaning buyers have arrived but have not yet convinced sellers. Momentum confirmation is exceptional at 91.9/100 thanks to strong four-week returns (10.7%) and bullish, improving MACD at overbought stochastic levels (0.98), yet this speed of move with thin participation and compressed risk/reward (upside to resistance just 1.1%) is precisely the kind of whipsaw that excludes the category from allocation. MOO's structure is described as compression near 50W but hard filters mark it as structurally broken—a technical term signaling unrecoverable setup damage.
Agriculture & Livestock receives 0% allocation this week and is ranked 9th or 10th among the ten categories. The final category score of 2.8 reflects catastrophic macro misfit: disinflation pressure penalizes commodity complexes (-8 directly), liquidity stress compounds the damage (-4), and the reasoned ETF basket (VEGI 42.5, MOO 40.8, WEAT 12.0) never gains traction above 43 on technical evidence. The representative ETF (VEGI) is explicitly marked ineligible despite having strong individual momentum signals. What would restore agriculture to eligibility: a clear macro pivot toward inflation or reflation risk, explicit central bank money-printing catalysts, or a structural shift in global crop conditions that supports pricing power. For now, the category is simply too undermined by the current regime—disinflation and liquidity stress—to justify any allocation even in a tactical slot. The setup quality is not the issue; the macro regime is wholly misaligned.