
2025-04-25
Informational purposes only. The content in this report, including allocations, analysis, and commentary, is provided solely for informational and educational purposes. It does not constitute financial advice, investment advice, trading advice, or any other type of advice. Past performance does not guarantee future results. Always conduct your own research and consult a qualified financial professional before making investment decisions.
Weekly Allocation
| Ticker | Category | Weight | Role |
|---|---|---|---|
| FBTC | 50% | Overlay | |
| GLD | Precious Metals | 10% | Top-2 (10%) |
| IGF | Utilities & Infrastructure | 10% | Top-2 (10%) |
| ILF | Emerging Markets | 5% | Tier-2 (5%) |
| IGV | Technology | 5% | Tier-2 (5%) |
| XAR | Defense & Aerospace | 5% | Tier-2 (5%) |
| MOO | Agriculture & Livestock | 5% | Tier-2 (5%) |
| URA | Nuclear Energy | 5% | Tier-2 (5%) |
| AIQ | AI | 5% | Tier-2 (5%) |
Trade Instructions — Monday Open
Sell the tranche from 2025-03-28 (completing its 4-week hold). Buy the new tranche. Instructions show net portfolio changes — same-asset positions cancel, weight changes show the delta.
| Action | Ticker | Instruction |
|---|---|---|
| SELL | SLV | Sell entire SLV position (2.50% of portfolio) |
| SELL | ITA | Sell 50% of ITA position (reduce 2.50% → 1.25%) |
| SELL | CIBR | Sell 25% of CIBR position (reduce 5.00% → 3.75%) |
| SELL | NLR | Sell 25% of NLR position (reduce 5.00% → 3.75%) |
| SELL | VEGI | Sell entire VEGI position (1.25% of portfolio) |
| SELL | XLE | Sell 50% of XLE position (reduce 2.50% → 1.25%) |
| SELL | INDA | Sell 50% of INDA position (reduce 2.50% → 1.25%) |
| BUY | GLD | Buy GLD — 25.00% of freed cash (adds 2.50% to portfolio) |
| BUY | AIQ | Buy AIQ — 12.50% of freed cash (adds 1.25% to portfolio) |
| BUY | XAR | Buy XAR — 12.50% of freed cash (adds 1.25% to portfolio) |
| BUY | MOO | Buy MOO — 12.50% of freed cash (adds 1.25% to portfolio) |
| BUY | ILF | Buy ILF — 12.50% of freed cash (adds 1.25% to portfolio) |
| BUY | IGV | Buy IGV — 12.50% of freed cash (adds 1.25% to portfolio) |
| BUY | URA | Buy URA — 12.50% of freed cash (adds 1.25% to portfolio) |
Current Portfolio After Trade
Combined holdings across all 4 active tranches. Each tranche is 25% of the portfolio.
| Ticker | % of Portfolio | Weight Bar |
|---|---|---|
| FBTC | 50.00% | |
| IGF | 10.00% | |
| GLD | 10.00% | |
| AIQ | 5.00% | |
| CIBR | 3.75% | |
| NLR | 3.75% | |
| XAR | 3.75% | |
| WEAT | 2.50% | |
| MOO | 2.50% | |
| ITA | 1.25% | |
| XLE | 1.25% | |
| INDA | 1.25% | |
| COPX | 1.25% | |
| ILF | 1.25% | |
| IGV | 1.25% | |
| URA | 1.25% |
Macro Regime — Disinflation
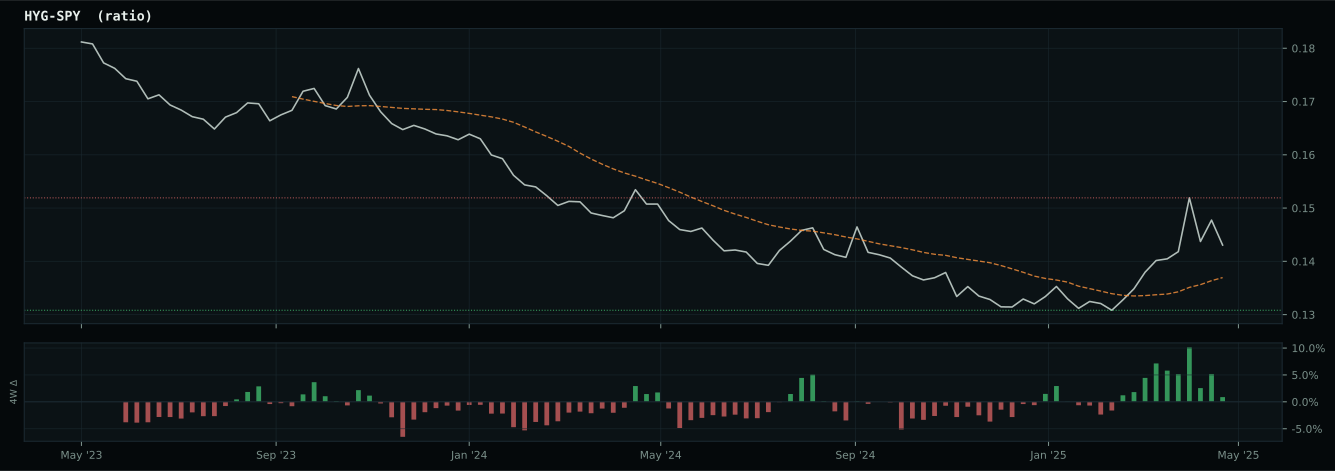
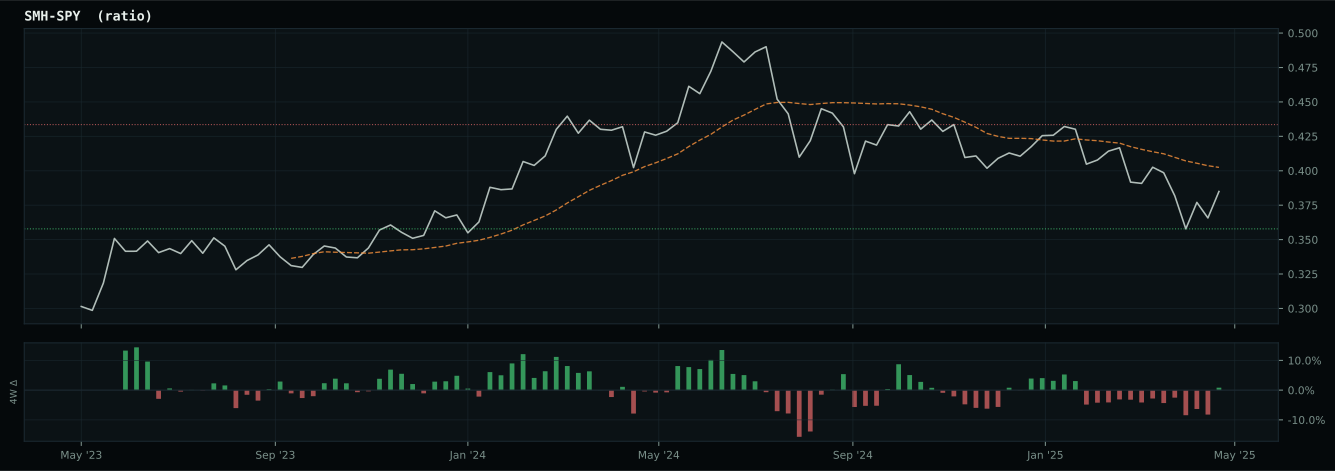
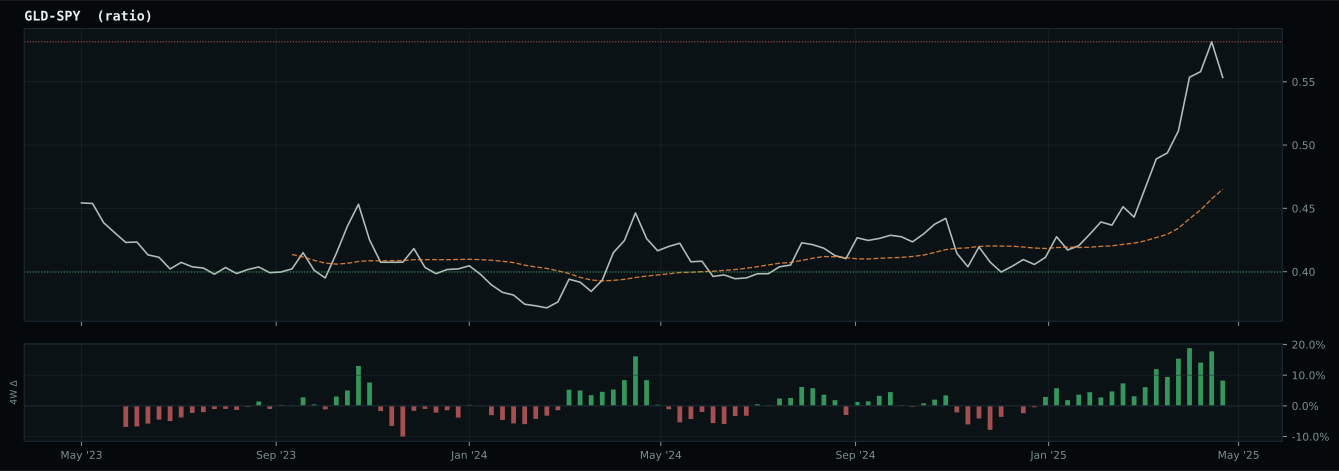
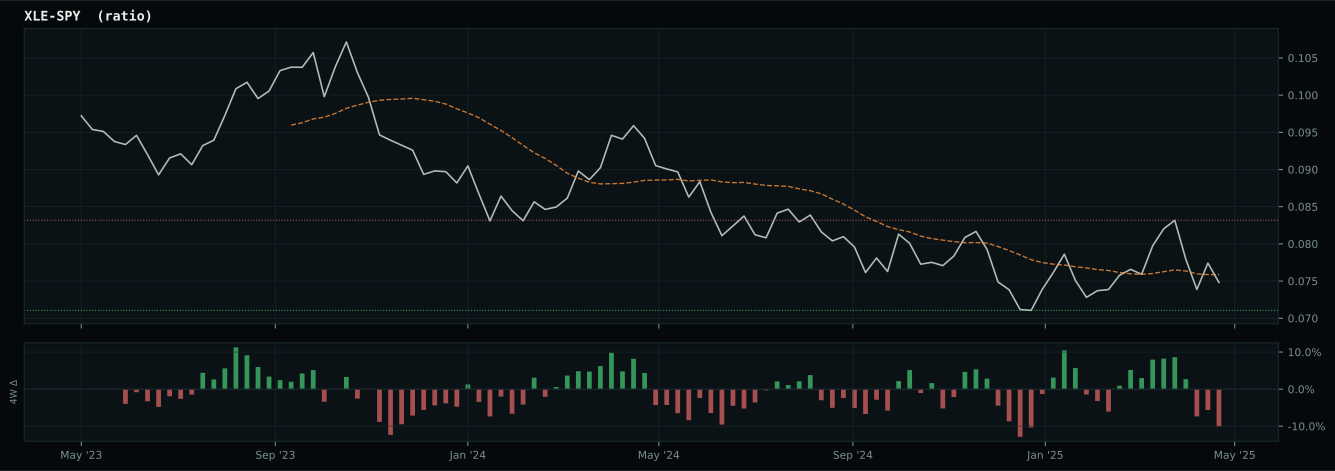
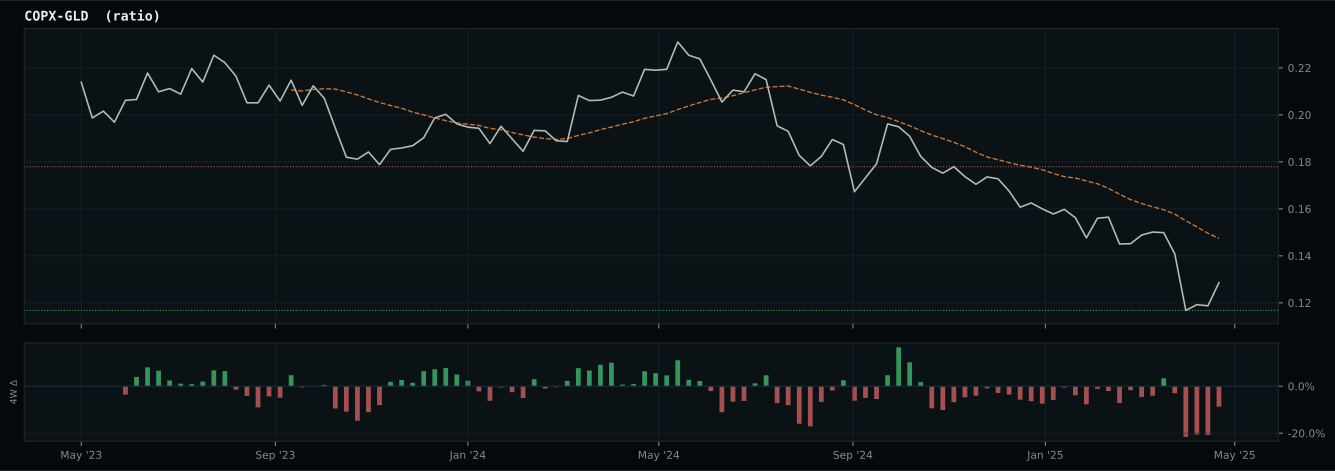
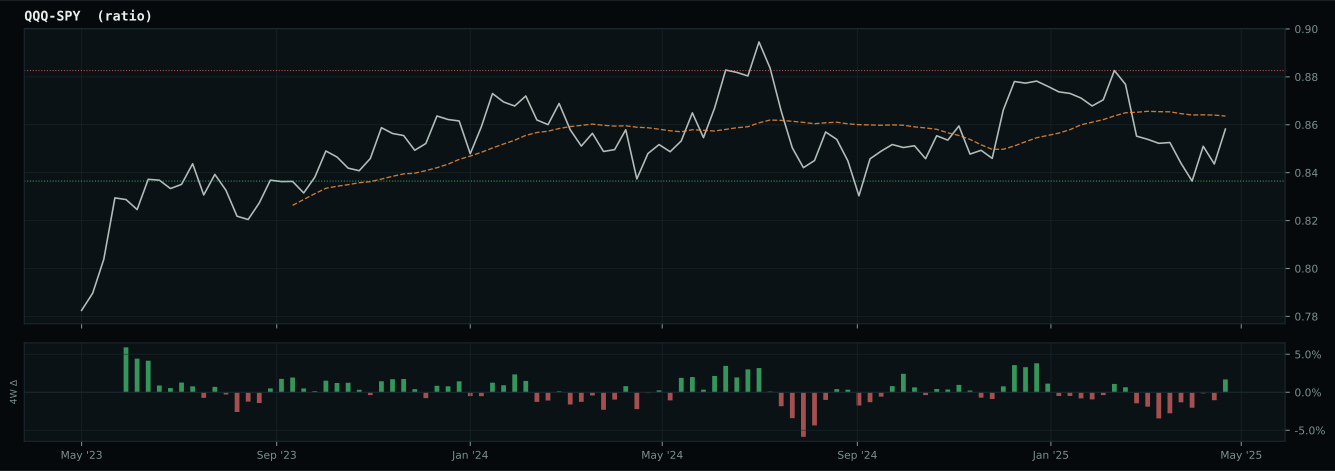
growth data is not confirming the weak market-implied risk appetite signal
Macro Evidence Charts
Market-implied signals behind the macro regime scores. Each ratio compares two assets; the direction and slope of the ratio is what the macro engine reads.
Crypto Regime — TrendBTC
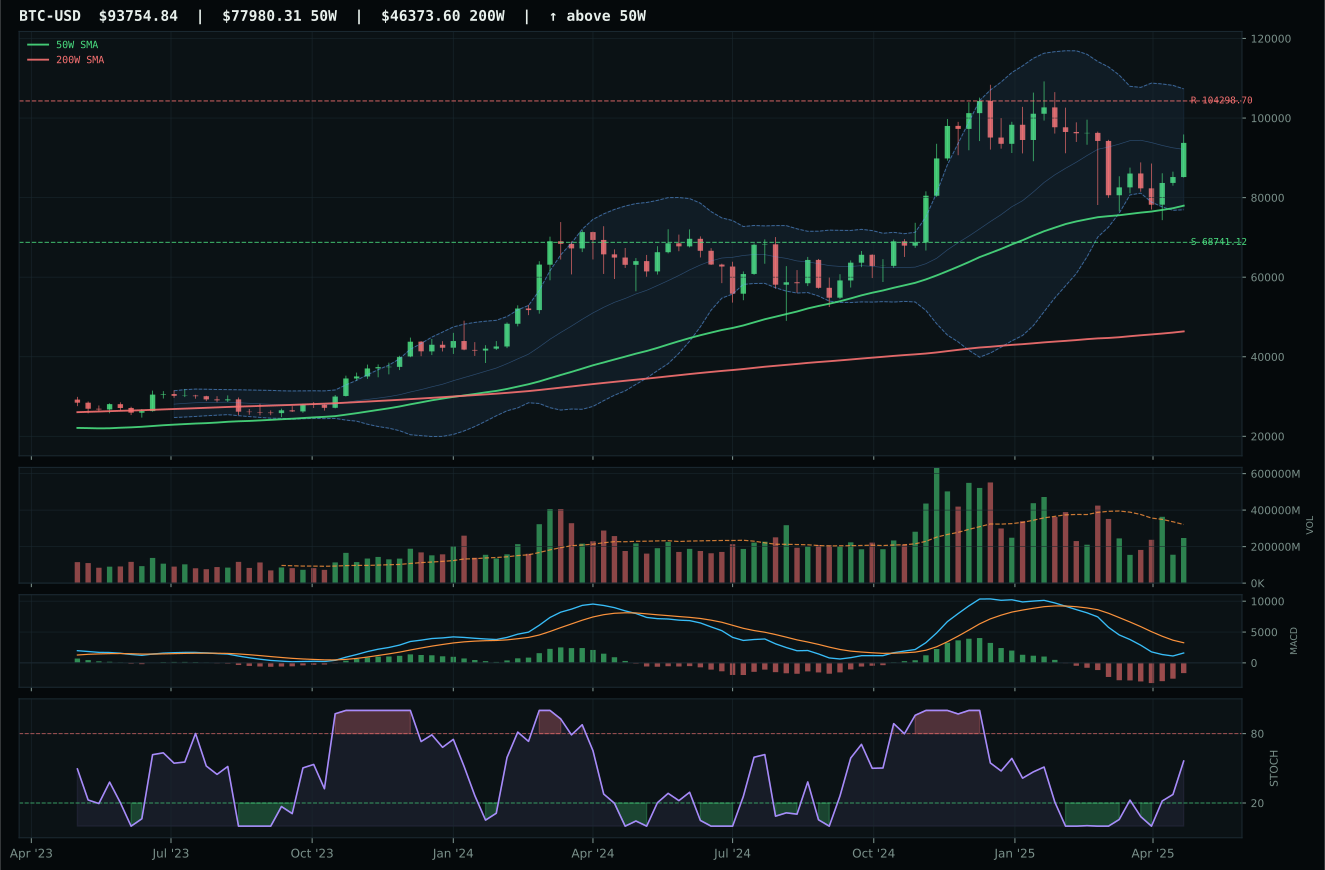
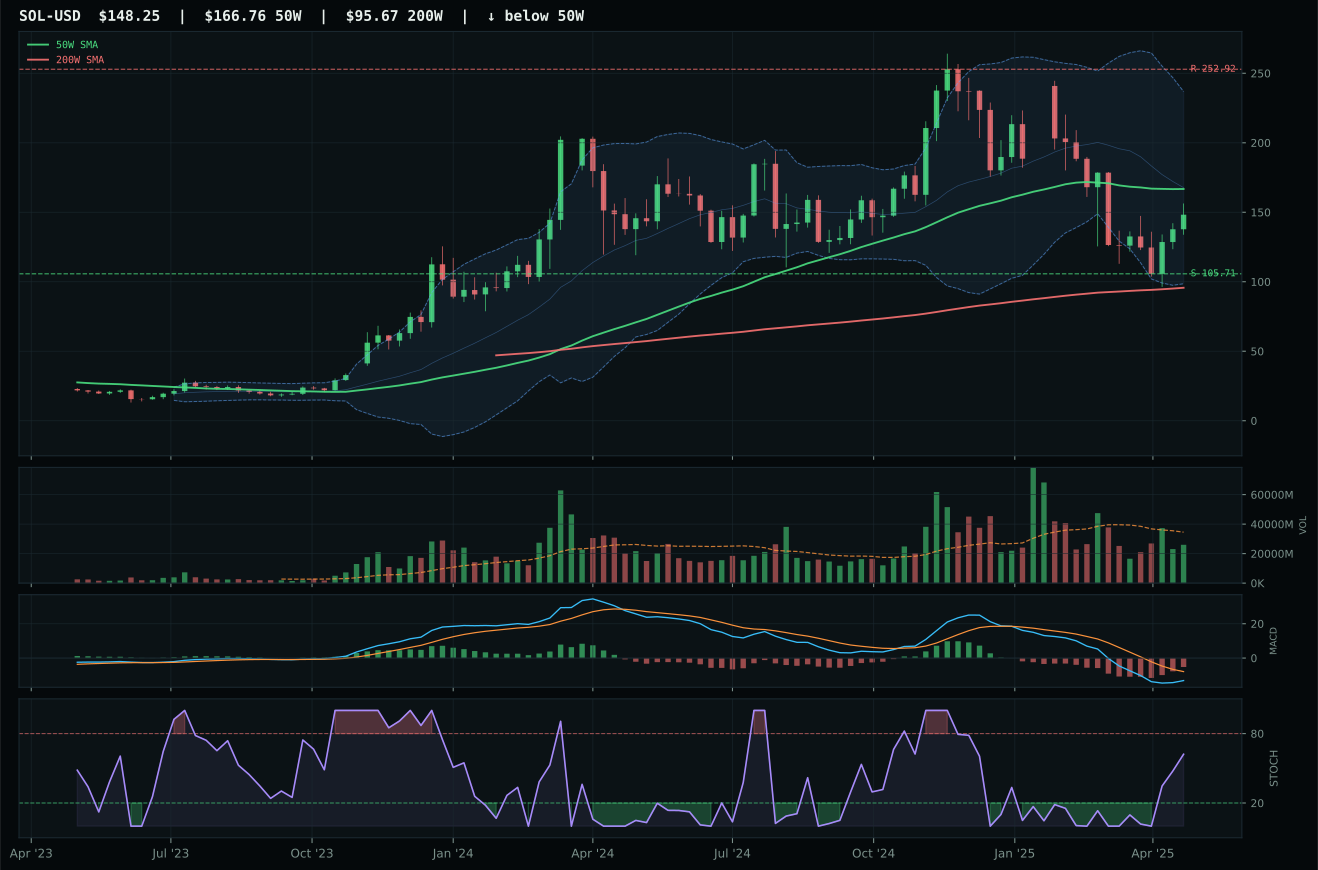
ValueBTC not armed: BTC has not made the first post-breakdown touch of the 200W buy zone after losing the 50W
TrendBTC confirmed: 2 consecutive closes above rising/flat 50W SMA
one or more available conditions failed
Category Rankings
| Rank | Category | Winner | Score | Alloc | 4W Ret | Peers (4W) |
|---|---|---|---|---|---|---|
| 1 | Precious Metals | GLD | 73.7 | 20% | -0.11% | GDX +1.8% · SLV -0.1% |
| 2 | Utilities & Infrastructure | IGF | 61.6 | 20% | +4.79% | XLU +4.4% · PAVE +9.6% |
| 3 | Emerging Markets | ILF | 55.8 | 10% | +3.36% | INDA +1.8% · IEMG +6.3% |
| 4 | Technology | IGV | 53.7 | 10% | +8.94% | CIBR +10.2% · XLK +10.6% |
| 5 | Defense & Aerospace | XAR | 48.3 | 10% | +10.85% | ITA +11.5% · ROKT +9.7% |
| 6 | Nuclear Energy | URA | 25.7 | 10% | +33.44% | NLR +26.2% · URNM +23.8% |
| 7 | AI | AIQ | 22.6 | 10% | +10.12% | BOTZ +9.4% · SMH +15.0% |
| 8 | Industrial Metals | COPX | 11.8 | 10% | +5.82% | PICK +3.9% · REMX -2.0% |
| 9 | Traditional Energy | XLE | 0.4 | 0% | +0.32% | FCG +4.8% · XOP +7.6% |
| 10 | Agriculture & Livestock | MOO | — | 0% | +6.26% | VEGI +7.5% · WEAT +0.2% |
Precious Metals — GLD
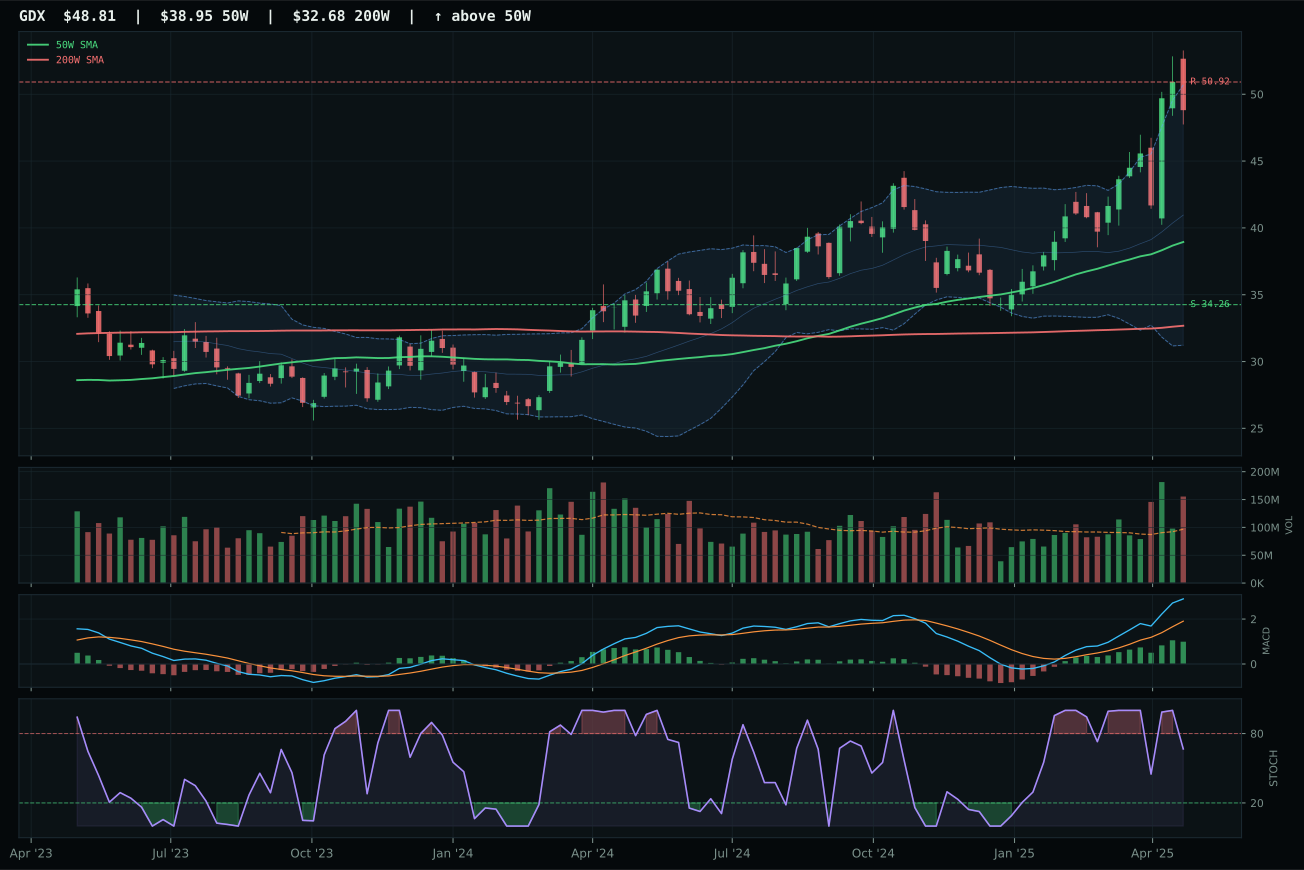
GDX has a vertical extension profile with 38.0% 13-week relative strength versus SPY.
A failed hold above support would weaken the setup.
Actionable but governed by invalidation levels.
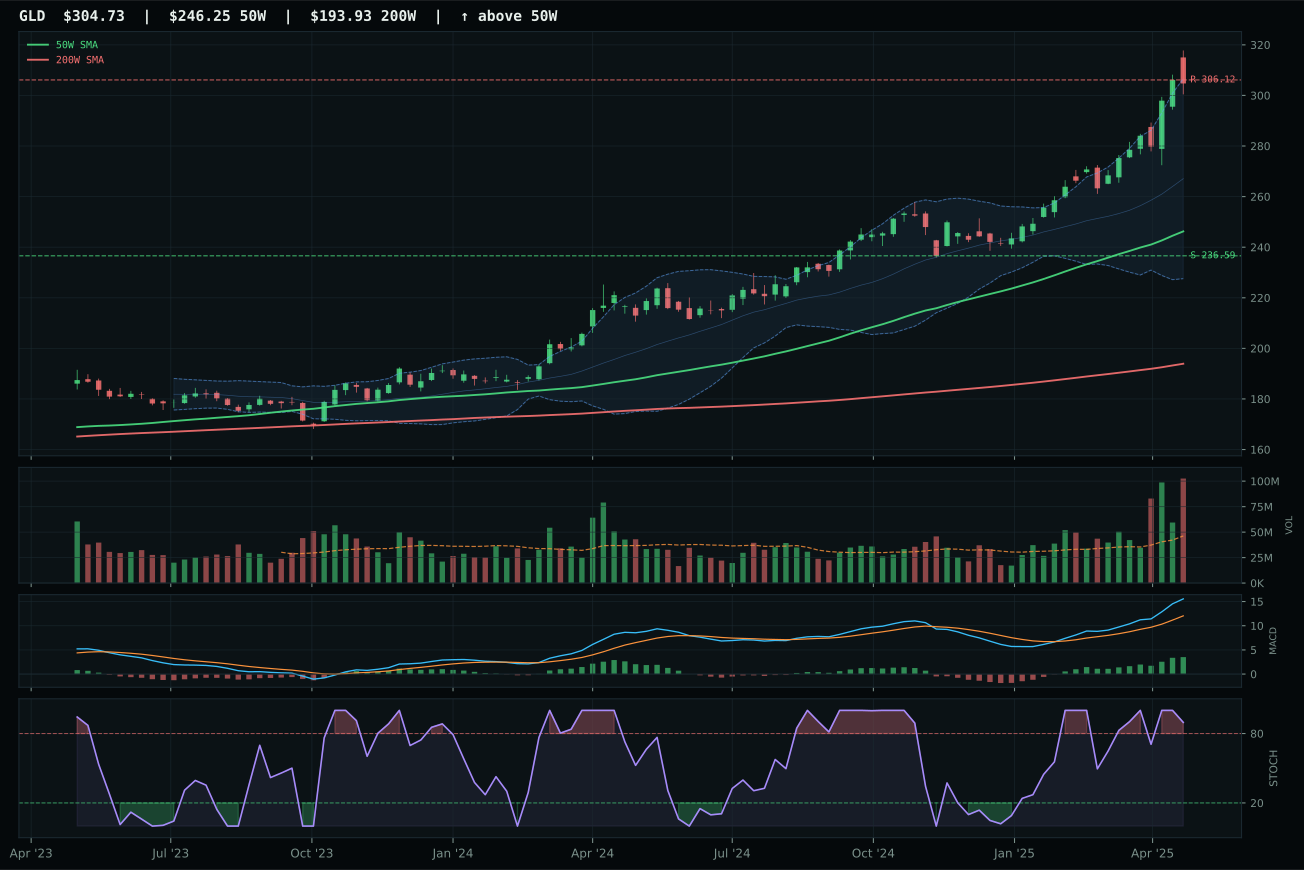
GLD has a vertical extension profile with 28.6% 13-week relative strength versus SPY.
A failed hold above support would weaken the setup.
Actionable but governed by invalidation levels.
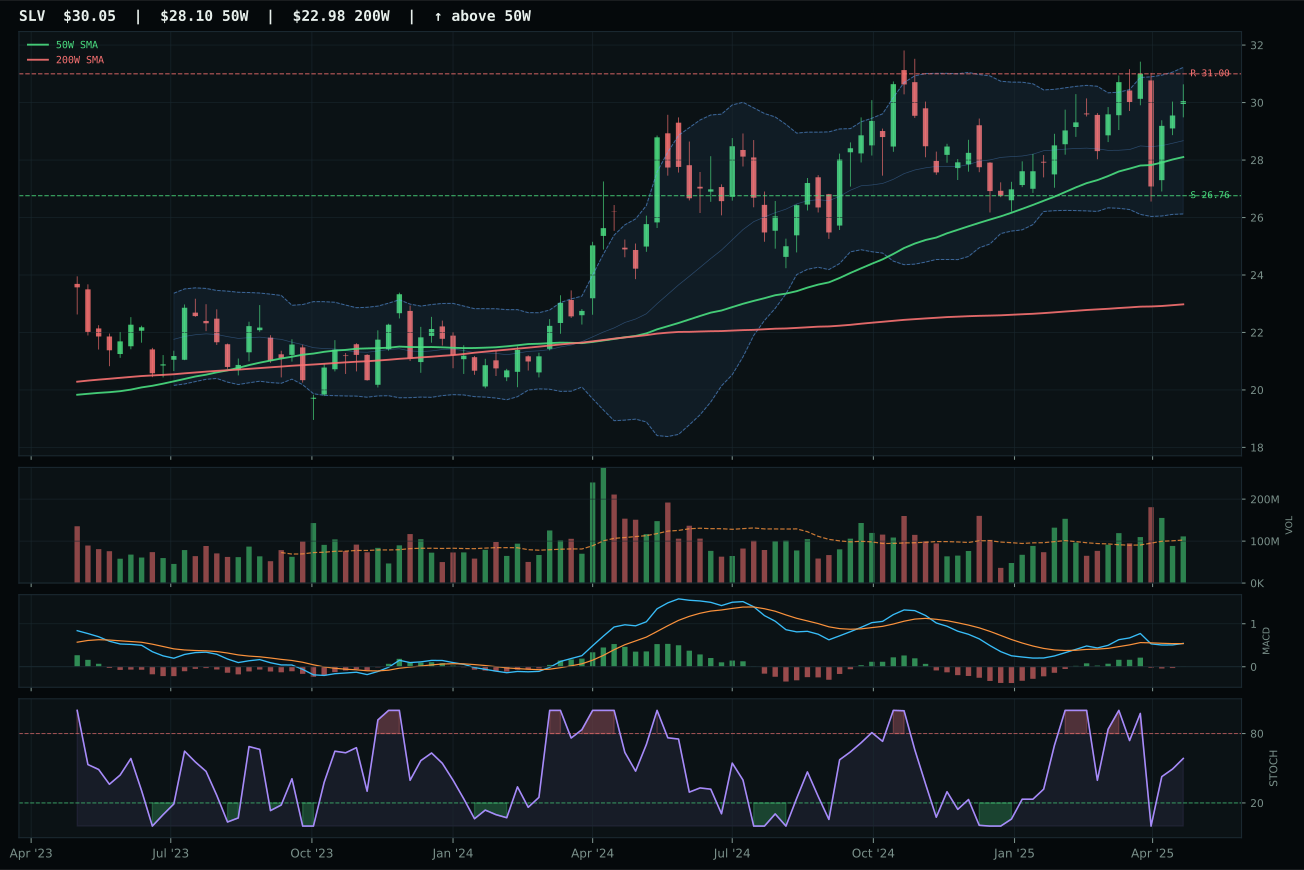
SLV has a neutral structure profile with 17.1% 13-week relative strength versus SPY.
A failed hold above support would weaken the setup.
Actionable but governed by invalidation levels.
Precious Metals earns its top-2 allocation slot at 10% because the category score of 73.7 reflects the strongest macro fit in the portfolio at 85.0/100. The monetary hedge bid descriptor is active and adds 14 points—the highest single-descriptor contribution across all categories—while disinflation pressure adds 6 and defensive rotation adds 7. This is the portfolio's primary expression of insurance against currency debasement and financial system stress, and the macro regime is actively rewarding that bet. GLD's technical evidence of 48.9/100 is weaker than the category macro fit, meaning the allocation is driven by narrative advantage rather than pure technical purity. The 37.3 risk/reward score reflects the reality that gold is extended and offers limited upside to resistance at just 0.5%, but that is acceptable because the allocation is defensive, not speculative. The 10% weighting reflects confidence that the monetary hedge bid will persist through the disinflation cycle, even if near-term pullback risk is material. This is a portfolio hedge against tail scenarios, not a tactical trade; the distribution pressure volume reading and overbought stochastic suggest taking profits on any near-term strength would be prudent, but the position itself remains core.
Utilities & Infrastructure — IGF
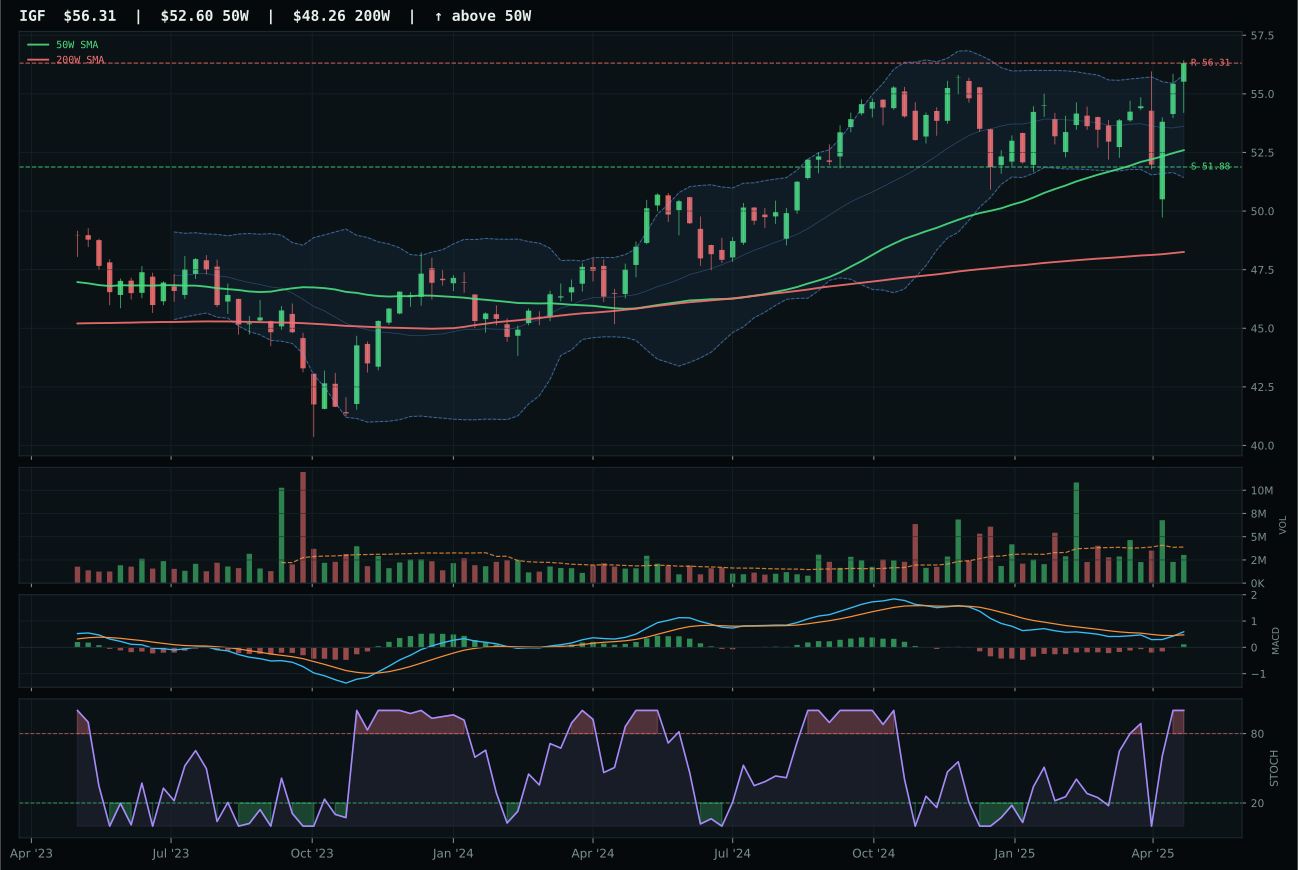
IGF has a neutral structure profile with 12.7% 13-week relative strength versus SPY.
A failed hold above support would weaken the setup.
Actionable but governed by invalidation levels.
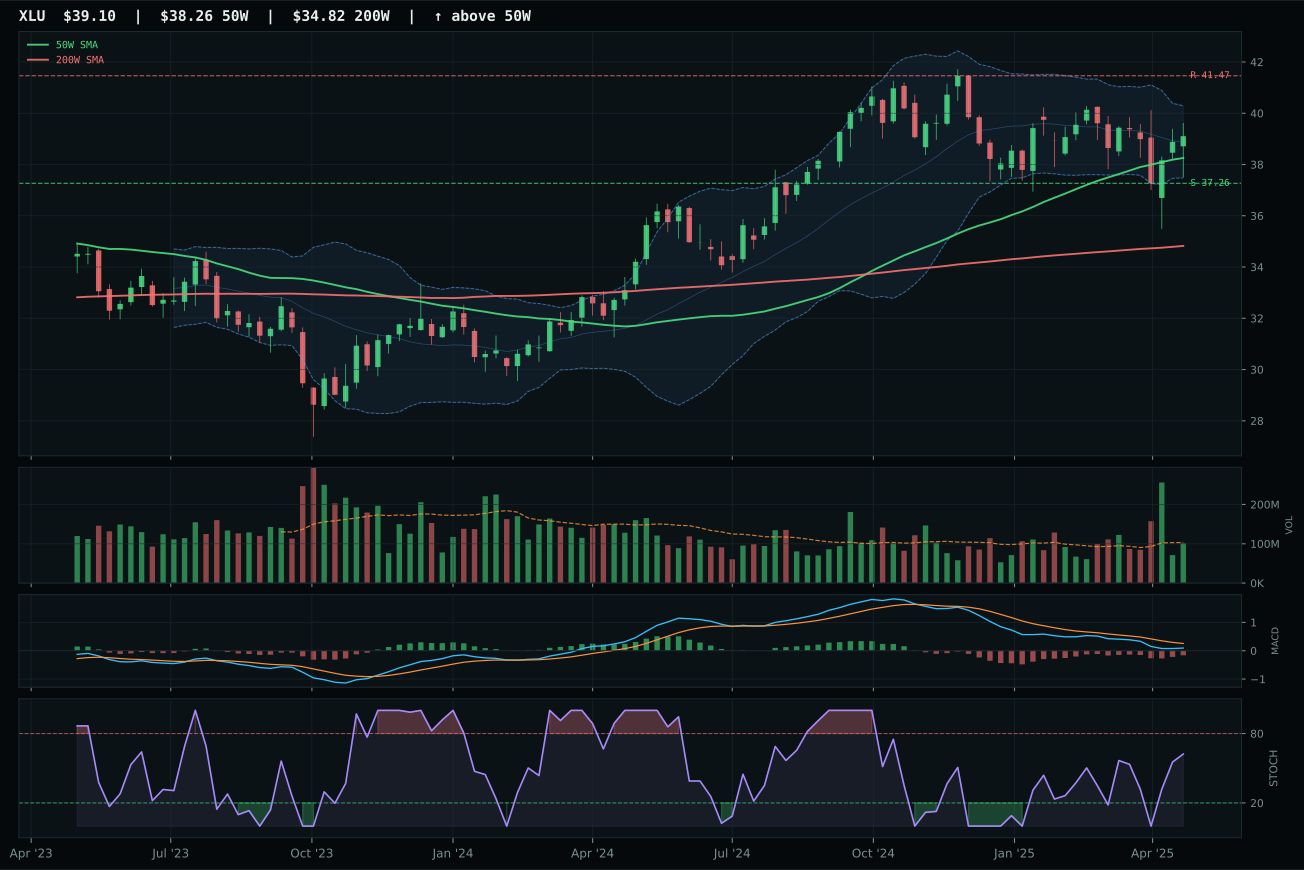
XLU has a pullback into support profile with 7.8% 13-week relative strength versus SPY.
A failed hold above support would weaken the setup.
Actionable but governed by invalidation levels.
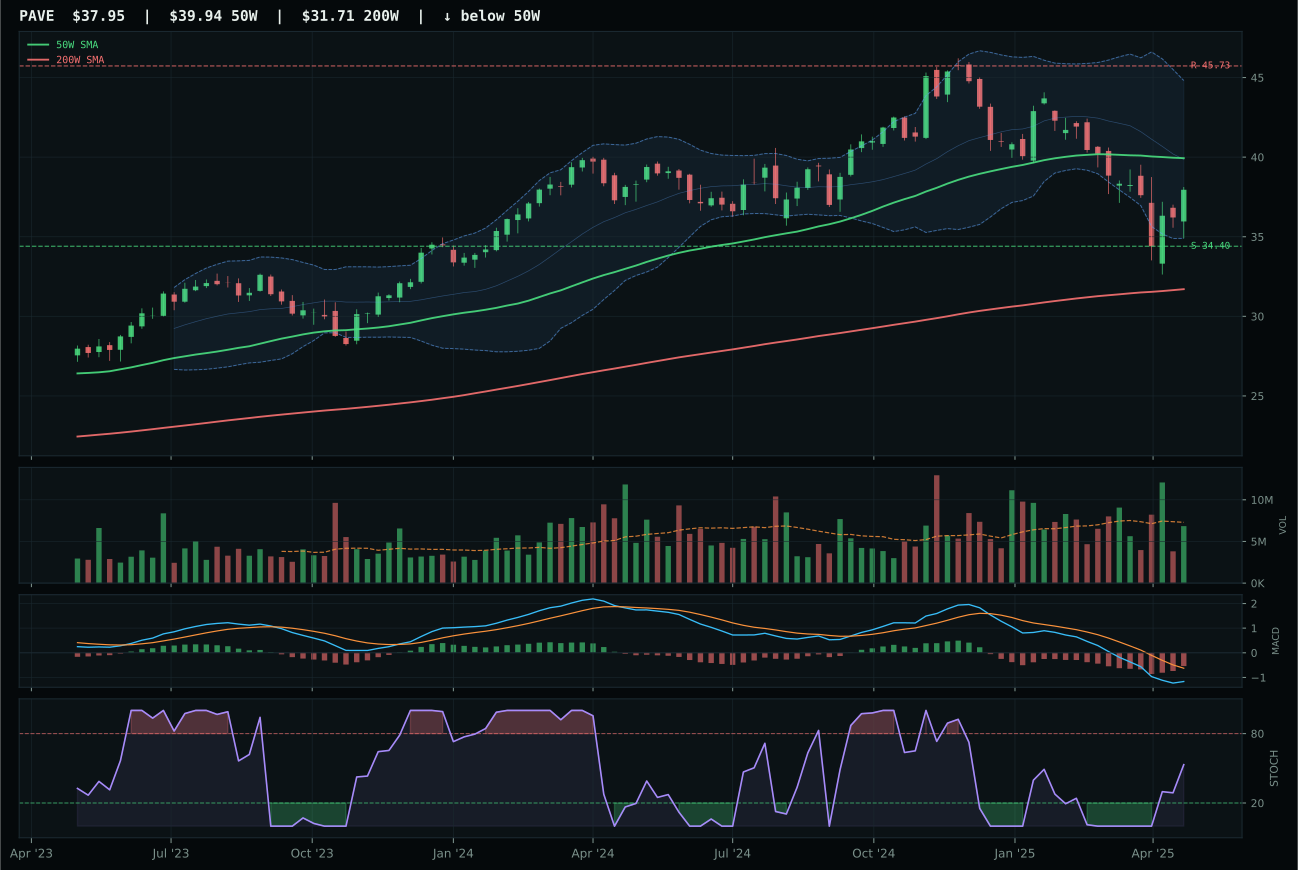
PAVE has a neutral structure profile with -3.7% 13-week relative strength versus SPY.
A failed hold above support would weaken the setup.
Actionable but governed by invalidation levels.
Utilities & Infrastructure earns its top-2 allocation at 10% because the category score of 61.6 ranks among the two highest final category scores this week, driven by both strong technical evidence (87.7 for IGF) and exceptional macro support (80.0 category-level fit). Defensive rotation adds 12 points, the highest single-descriptor contribution in the portfolio, while disinflation pressure adds 6 and broad market bear adds 4—all active macro signals that are structurally aligned with infrastructure and utility stability. IGF's 100.0 trend and momentum scores combined with 87.3 volume-price confirmation create a rare confluence of technical sponsorship inside a macro-favored category. The 75.0 timing score reflects the reality that price is extended 7.1% above 50W, diluting fresh entry appeal, but the tight structure and neutral volume mean there is no distribution pressure building toward reversal. This allocation is the portfolio's core defensive anchor alongside precious metals: while GLD provides macro insurance against currency debasement, IGF provides steady income and defensive equity exposure in an era of rotation away from growth. The 10% weighting reflects confidence that the defensive rotation will persist through the current market regime and that global infrastructure assets will continue attracting capital as risk appetite softens. The overbought stochastic RSI is a caution flag for near-term pullback, but the persistent positive momentum and category-level macro tailwind justify maintaining this position at full allocation.
Emerging Markets — ILF
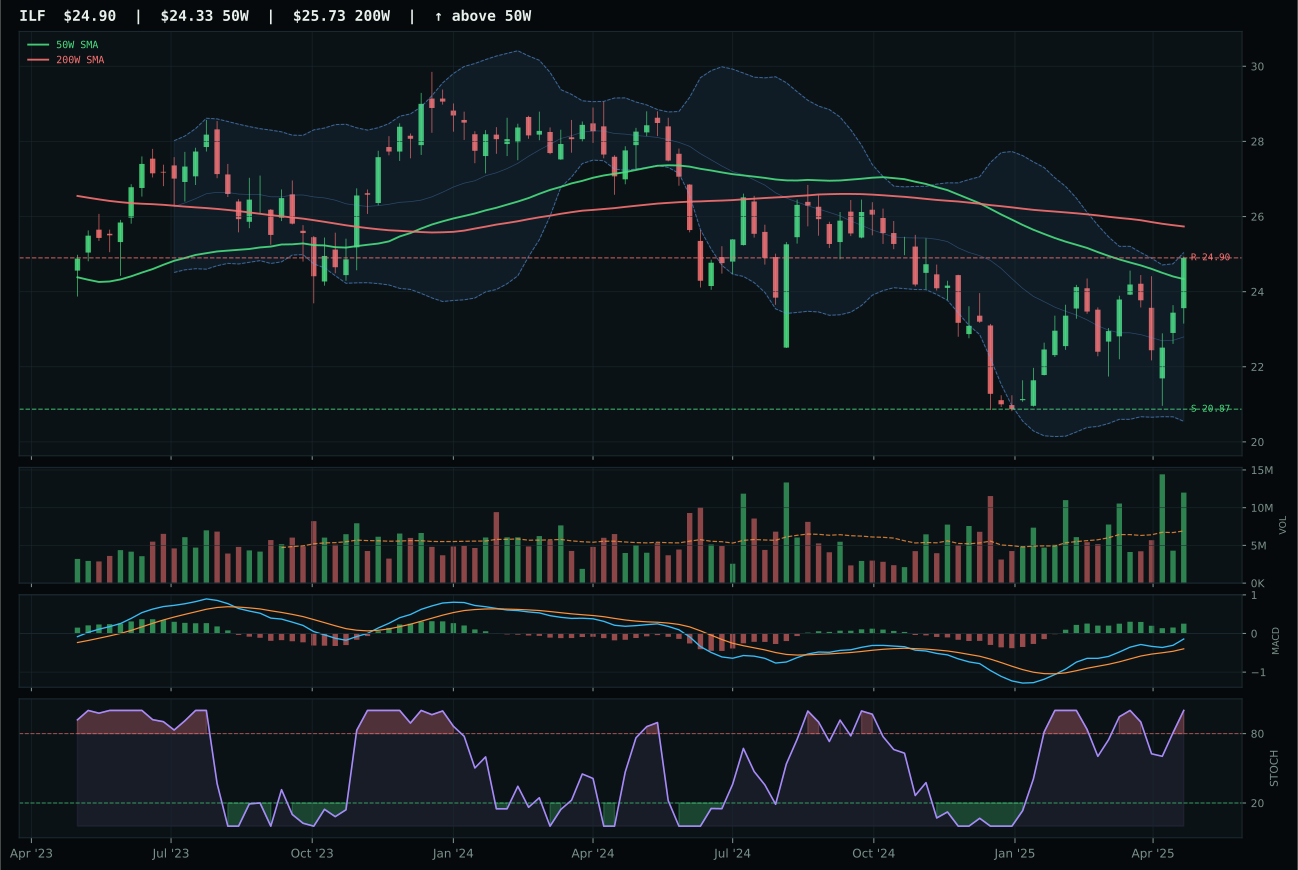
ILF has a compression near 50W profile with 20.3% 13-week relative strength versus SPY.
A failed hold above support would weaken the setup.
Actionable but governed by invalidation levels.
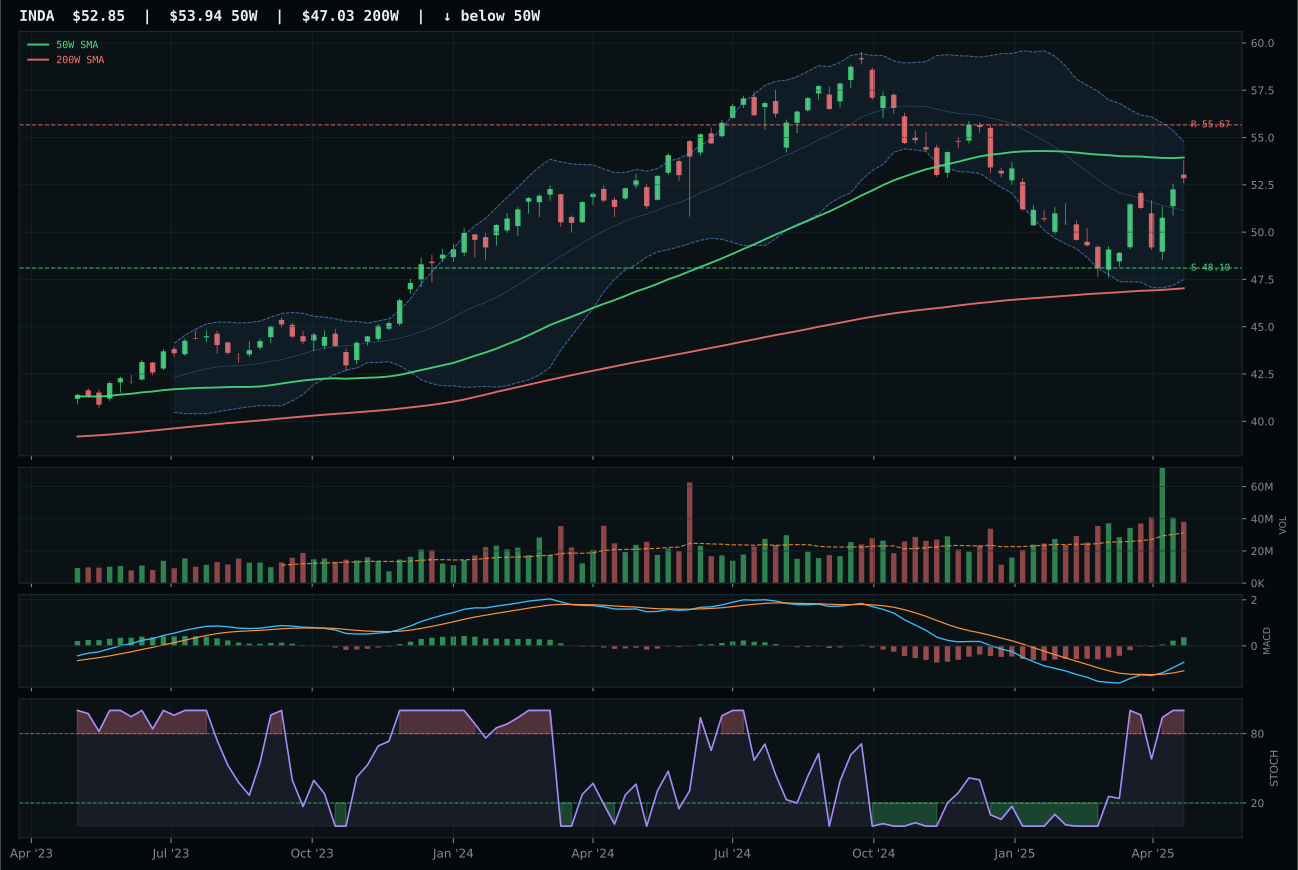
INDA has a compression near 50W profile with 13.7% 13-week relative strength versus SPY.
A failed hold above support would weaken the setup.
Actionable but governed by invalidation levels.
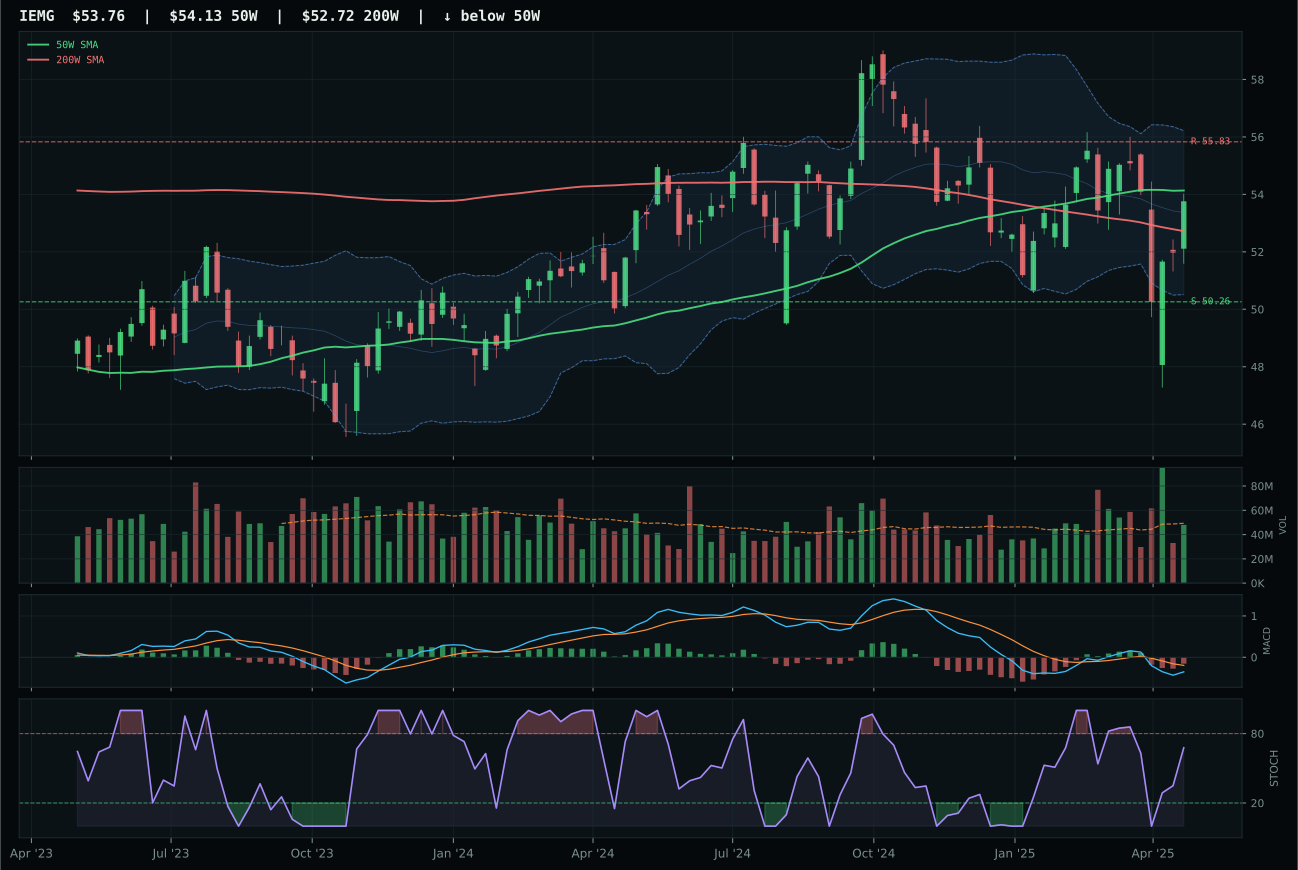
IEMG has a compression near 50W profile with 10.2% 13-week relative strength versus SPY.
A failed hold above support would weaken the setup.
Actionable but governed by invalidation levels.
Emerging Markets earns its 5% tier-2 allocation on the strength of ILF's technical excellence (100.0 technical evidence) despite a weak category-level macro fit of just 31.0/100. Liquidity stress subtracts 10 points and broad market bear subtracts 9, meaning this is a category winning on technicals alone. ILF's 80.9 reasoned ETF score is the highest concentration of technical strength in the category, and the volume-price confirmation at 87.3 and persistence at 83.5 are both in the top tier across the portfolio. The macro fit of 43.0 for ILF specifically is neutral-to-weak, but the 100.0 technical evidence carries 62% weight, overriding the headwind. This allocation is a risk-on bet funded by the disinflation/defensive macro regime: while precious metals provide insurance, Emerging Markets—particularly Latin America commodity exposure—provides the offensive upside if liquidity stress eases or risk appetite recovers. The accumulation-level volume at 1.73x average signals that smart money is flowing into ILF despite the market's defensiveness. The 5% slot is appropriate because the setup could reverse quickly if liquidity stress intensifies, but the technical conviction is high enough to justify the allocation within the tier-2 sleeve. ILF remains a tactical long, not a strategic hold, but its volume profile and relative strength make it the portfolio's best risk-on exposure this week.
Technology — IGV
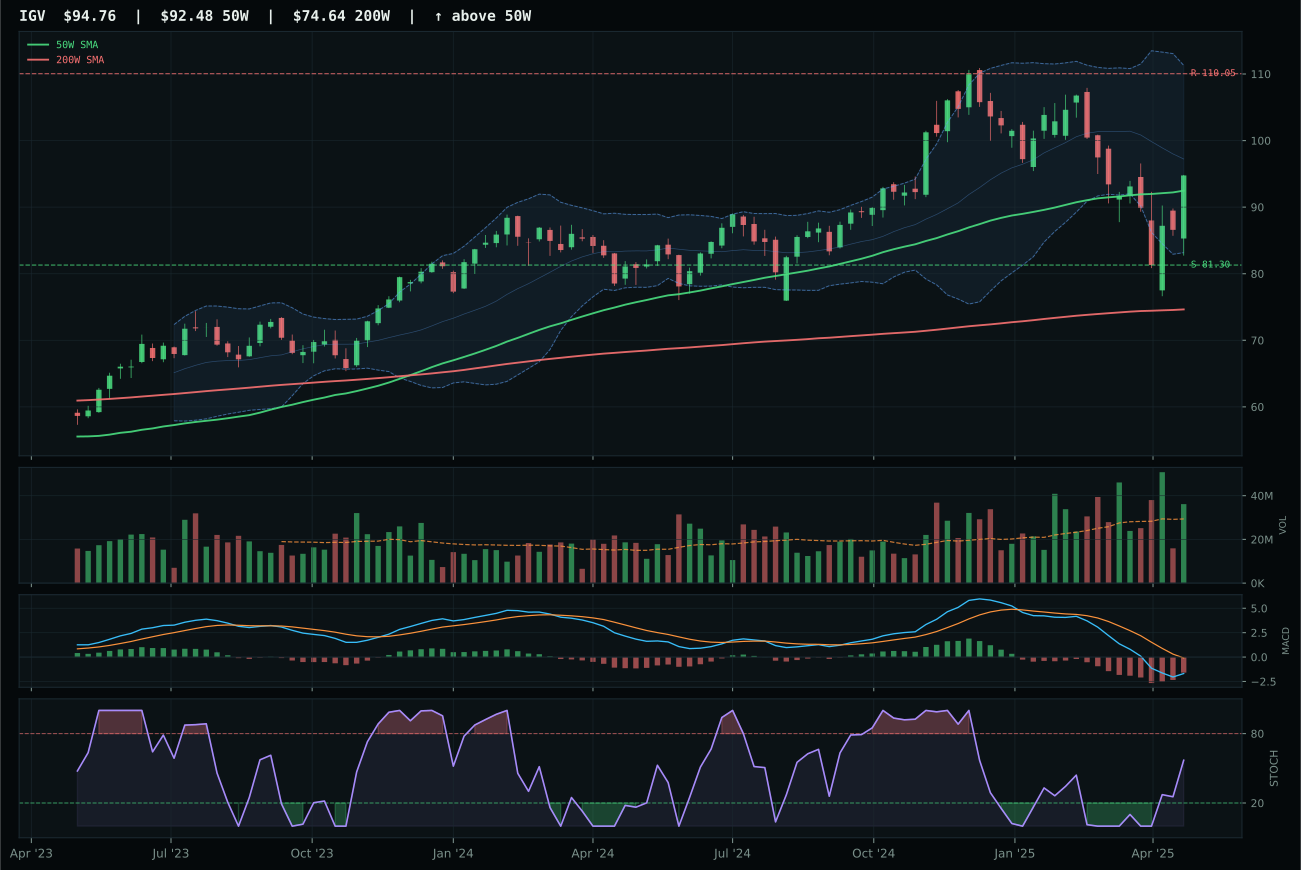
IGV has a compression near 50W profile with 0.7% 13-week relative strength versus SPY.
A failed hold above support would weaken the setup.
Actionable but governed by invalidation levels.
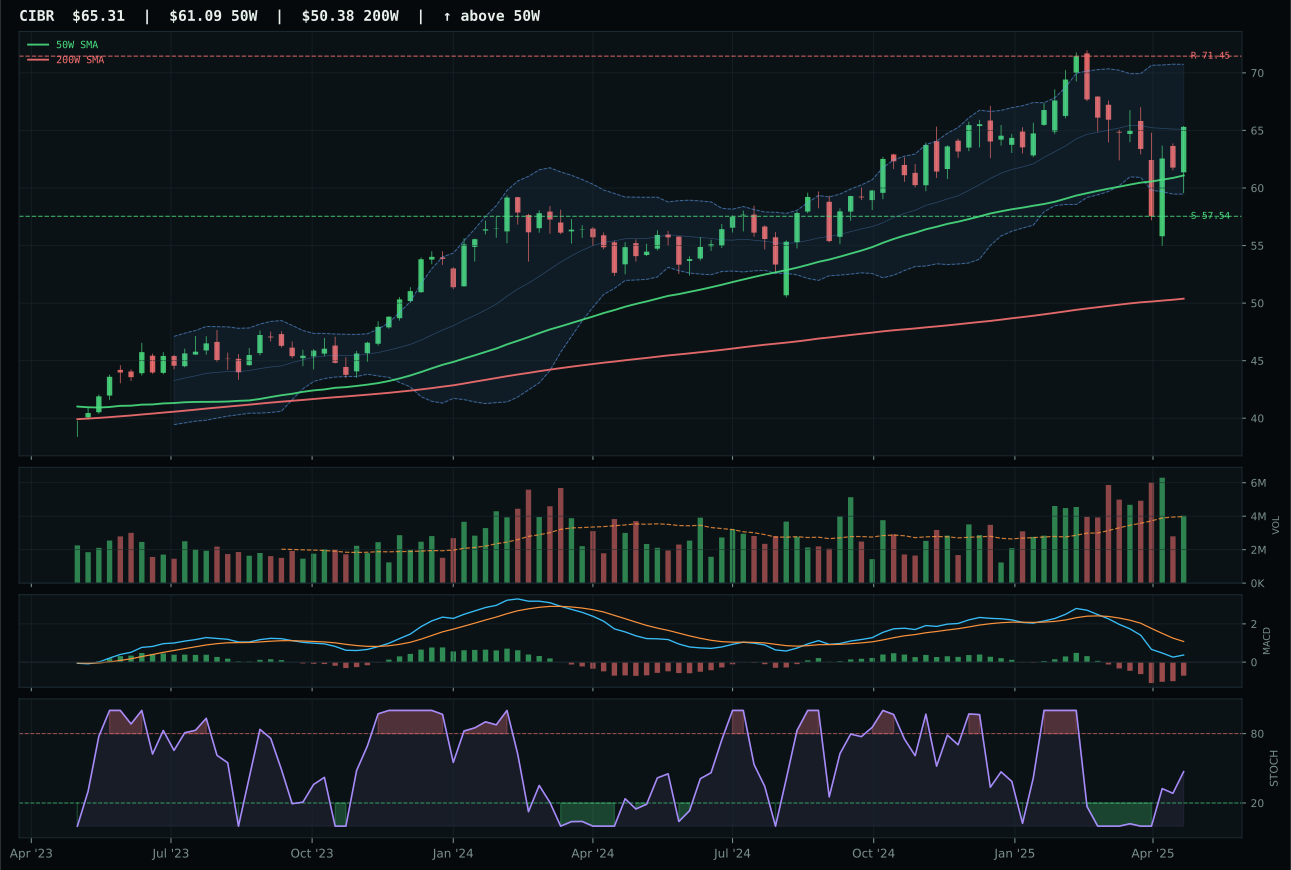
CIBR has a neutral structure profile with 7.2% 13-week relative strength versus SPY.
A failed hold above support would weaken the setup.
Actionable but governed by invalidation levels.
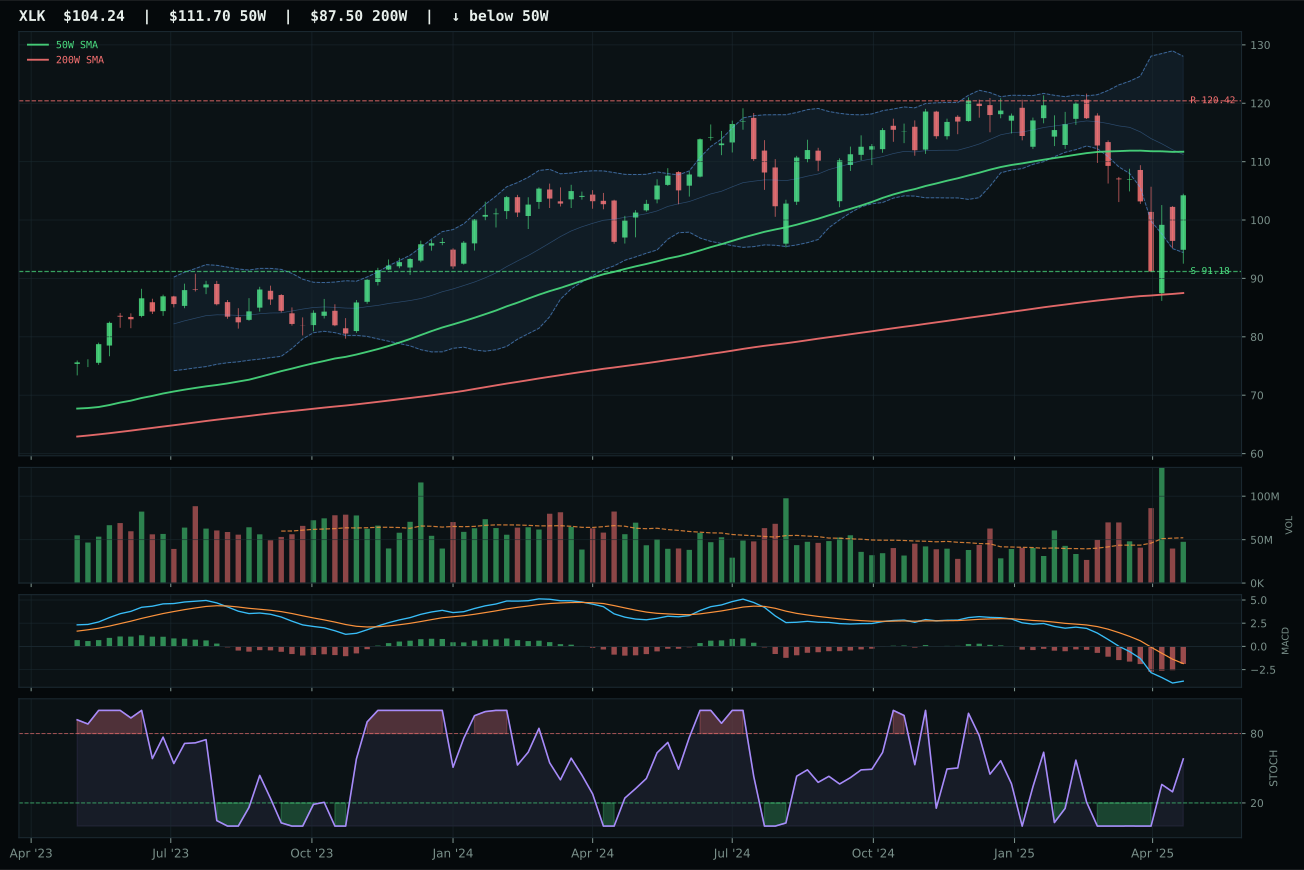
XLK has a neutral structure profile with -3.5% 13-week relative strength versus SPY.
A failed hold above support would weaken the setup.
Actionable but governed by invalidation levels.
IGV wins the category because it holds price above both the 50-week and 200-week moving averages with a gentle 0.3% slope, creating a foundation for trend persistence. The setup compresses near the 50W at just 2.5% distance, pairing tight entry timing with above-average volume participation at 1.23x the 20-week average—a combination that signals accumulation rather than bounce. CIBR lost on timing (78.0 vs 100.0), structure cleanliness (66.5 vs 68.0), and risk/reward (56.5 vs 68.1), hampered by a MACD that is not only bearish but actively weakening and neutral volume that offers no sponsorship confirmation. The gap of 11.8 points is decisive; IGV's compression setup near support with improving MACD technicals gives buyers a defined trigger, while CIBR's neutral structure and weakening momentum leave it stuck in repair mode.
Technology earns its 5% tier-2 slot despite ranking outside the top two categories this week. The 53.7 final score reflects macro headwinds that are heavier than the technical evidence can overcome: disinflation pressure adds 5 points to the narrative, but liquidity stress subtracts 10, and the category-level macro fit comes in at just 52.0/100. In a disinflation regime, technology—particularly enterprise software like IGV—typically benefits from multiple expansion, but that tailwind is offset by the active liquidity stress descriptor, which crimps risk appetite for growth names. The technical evidence at 76.2/100 is solid, but the 62/38 weight split (technical to macro) means the weak macro backdrop keeps this category from top-tier allocation. The compression setup near the 50W offers a low-risk entry if buyers can defend that level, making it a reasonable hold for the 5% sleeve while monitoring whether MACD follows through with a true bullish cross.
Defense & Aerospace — XAR
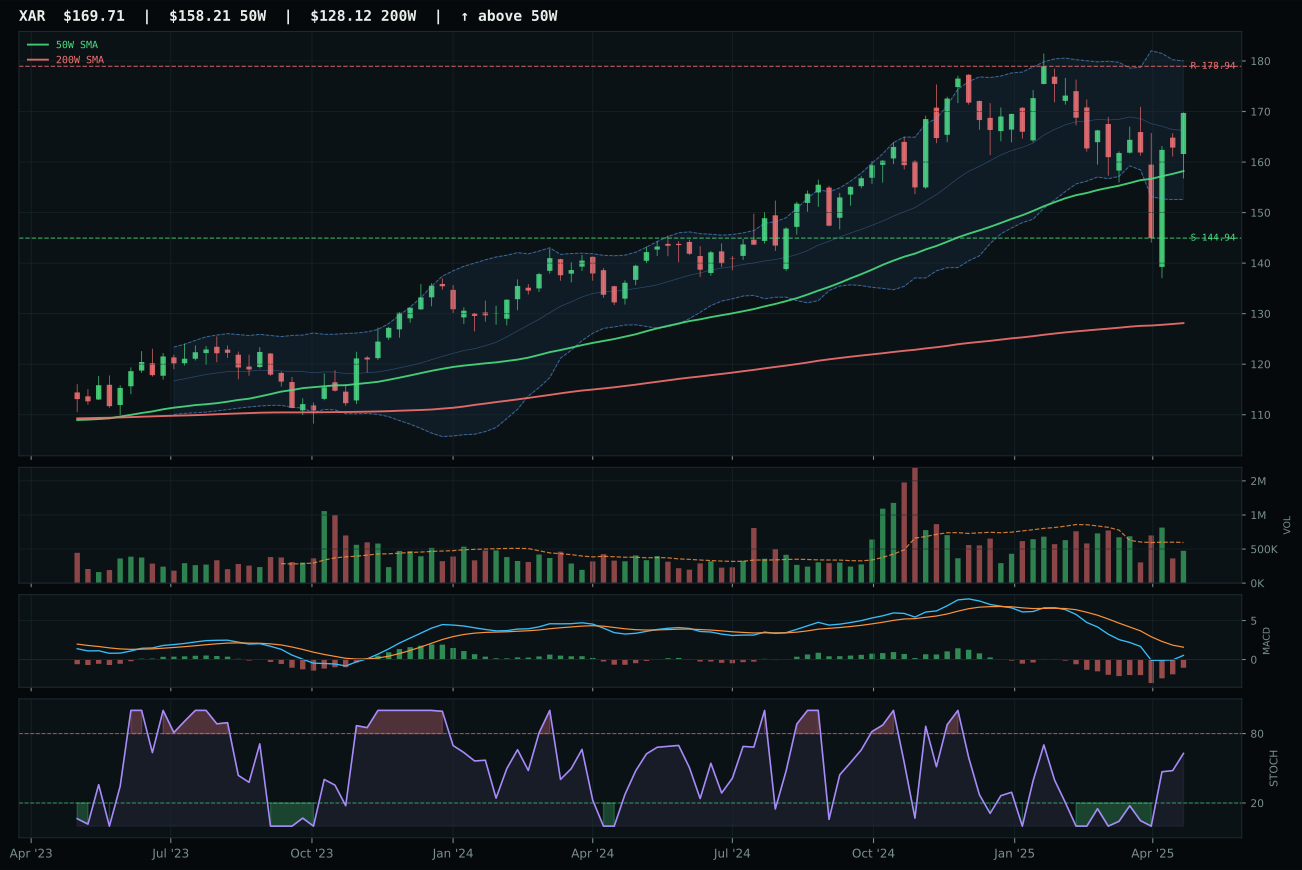
XAR has a neutral structure profile with 4.3% 13-week relative strength versus SPY.
A failed hold above support would weaken the setup.
Actionable but governed by invalidation levels.
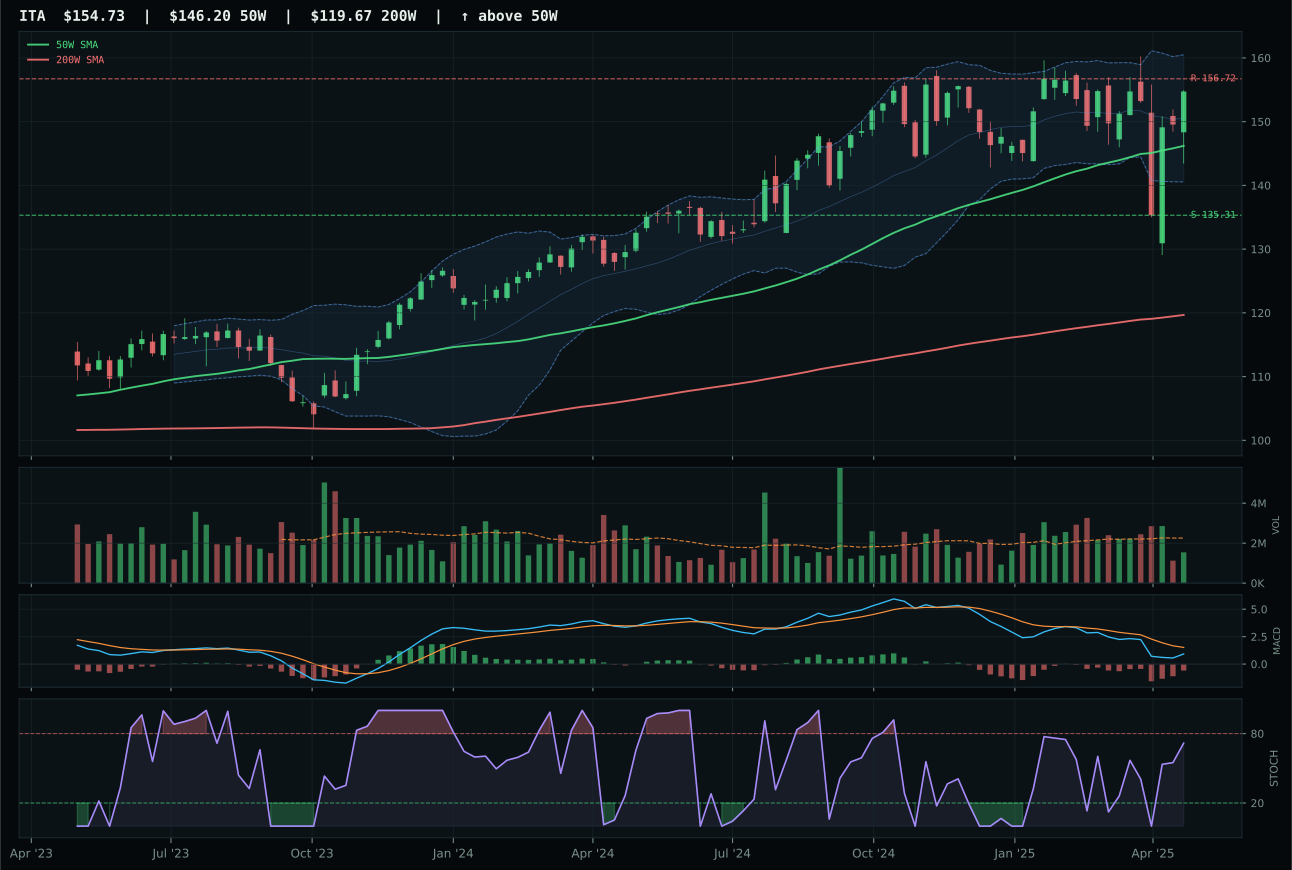
ITA has a neutral structure profile with 8.2% 13-week relative strength versus SPY.
A failed hold above support would weaken the setup.
Actionable but governed by invalidation levels.
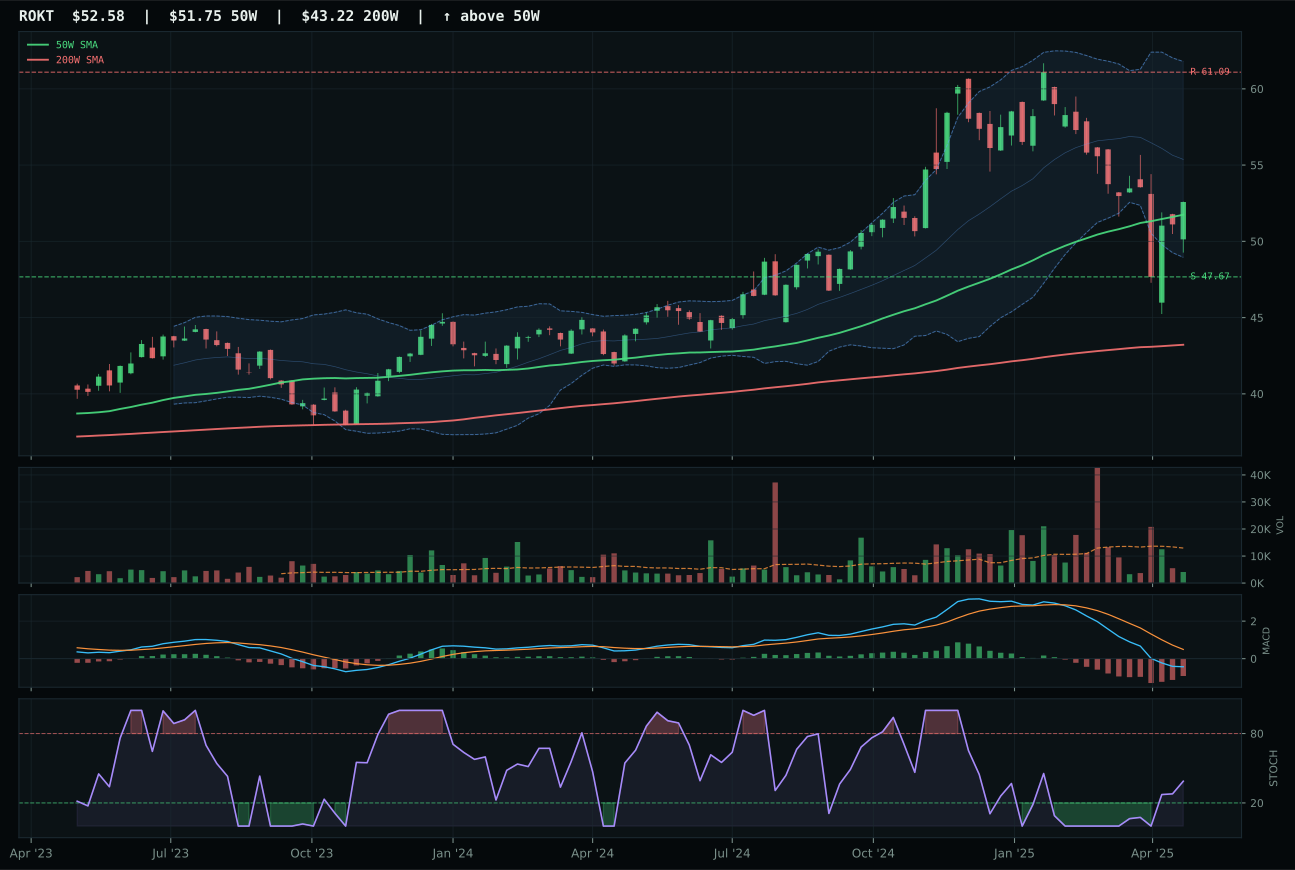
ROKT has a compression near 50W profile with -4.5% 13-week relative strength versus SPY.
A failed hold above support would weaken the setup.
Tracked, but not top-2 eligible because: .
Defense & Aerospace holds its 5% tier-2 allocation on the strength of a 48.3 category score powered by active defensive rotation and broad market bear descriptors that add 8 and 6 points respectively. The macro fit reaches 61.0/100, providing meaningful tailwind in a disinflation regime where rotation into defensive durability is proving durable. XAR's technical evidence of 71.9/100 is solid—strong trend, volume-price confirmation, and persistence all exceed 63/100—but the category-level macro fit carries heavy weight: 38% of the final score. The risk/reward profile is unfavorable (50.4/100), which normally would be disqualifying, but the disinflation pressure (+5) and defensive rotation (+8) signals overcome that headwind. This allocation is essentially a duration hedge inside the broader portfolio; the 61.0 category-level macro fit tells the story—defensive names are performing their job, and XAR's neutral structure with improving MACD offers a steady hold without excitement. Liquidity stress (-4) remains a quiet drag that keeps this out of top-2 consideration despite the category's resilience.
Nuclear Energy — URA
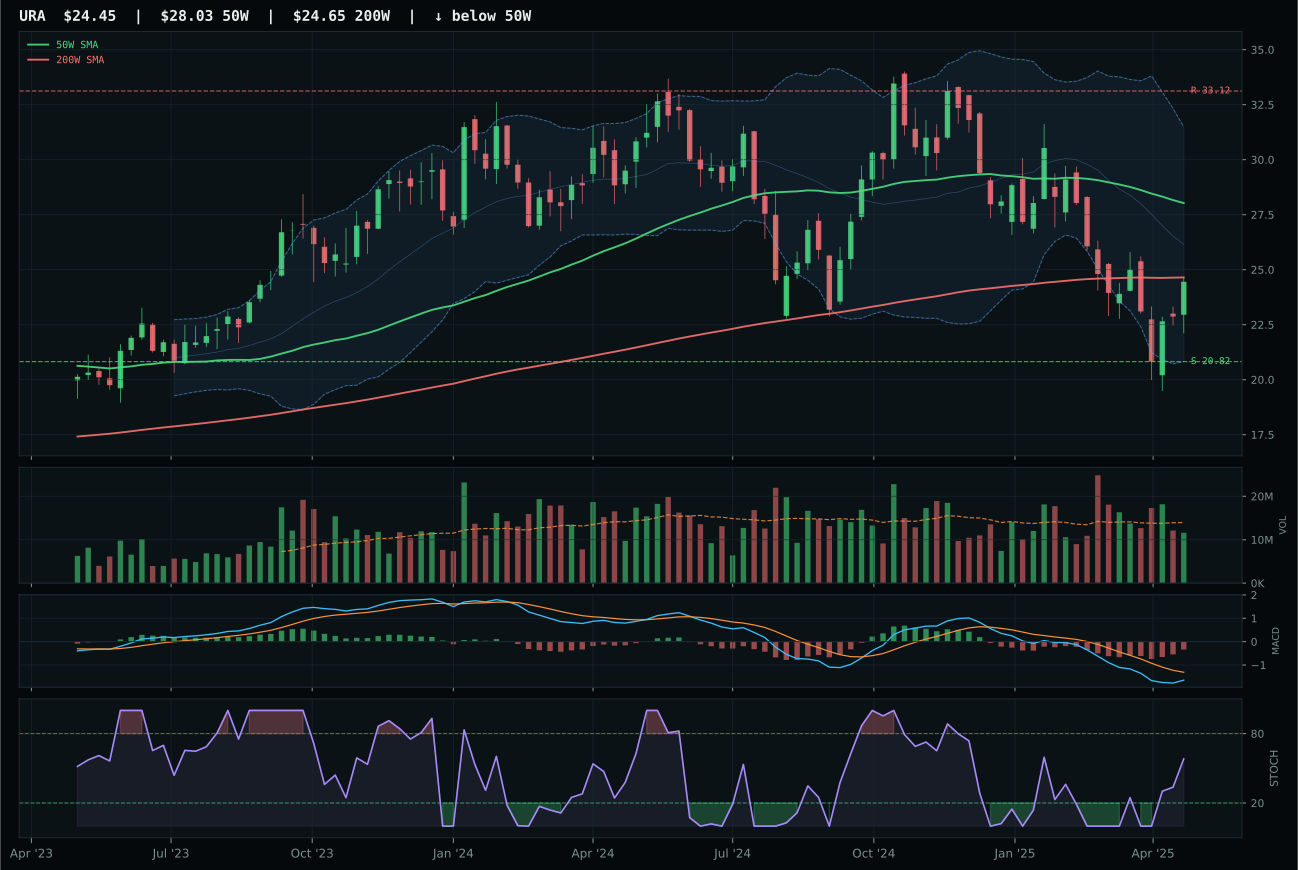
URA has a neutral structure profile with -10.5% 13-week relative strength versus SPY.
A failed hold above support would weaken the setup.
Actionable but governed by invalidation levels.
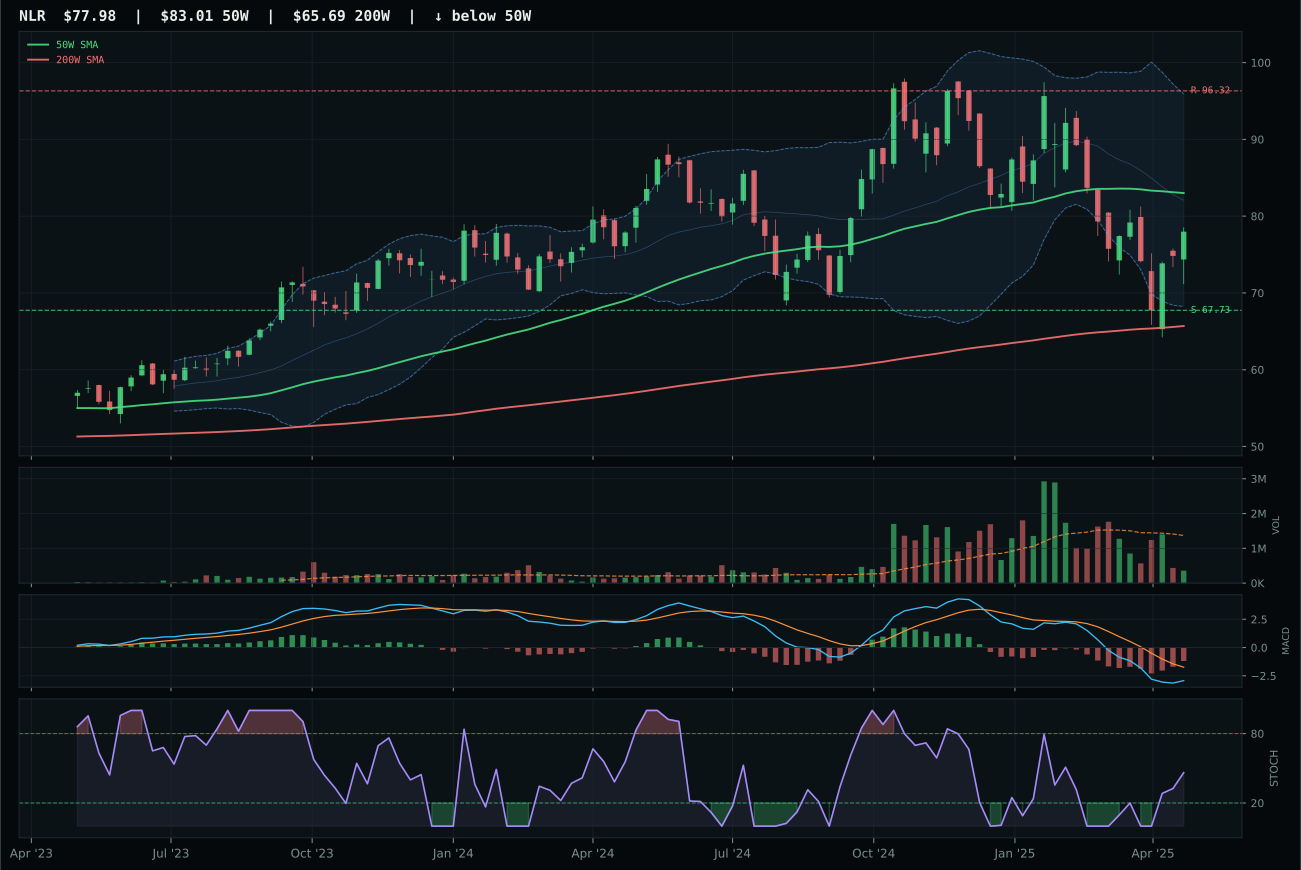
NLR has a neutral structure profile with -9.0% 13-week relative strength versus SPY.
A failed hold above support would weaken the setup.
Actionable but governed by invalidation levels.
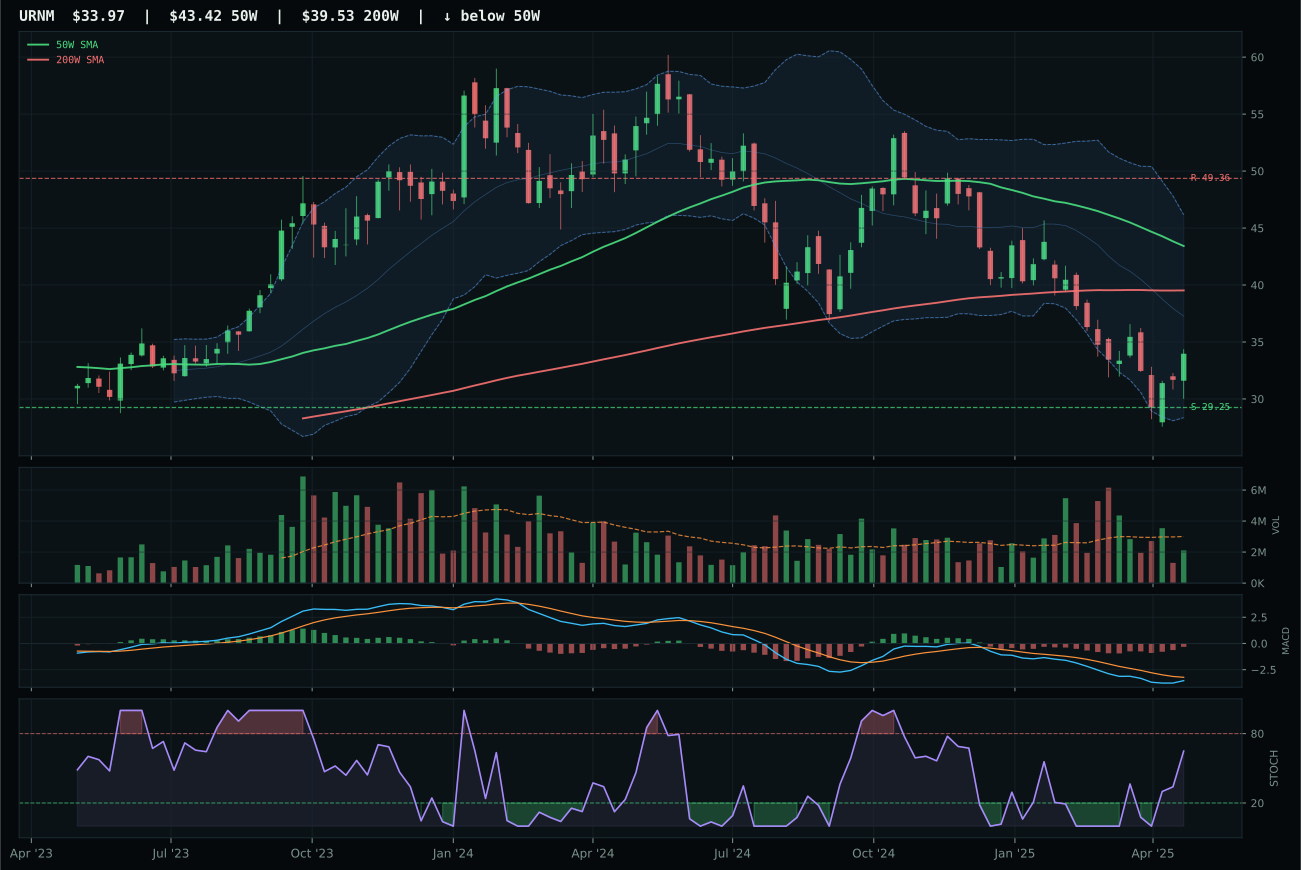
URNM has a neutral structure profile with -13.0% 13-week relative strength versus SPY.
A failed hold above support would weaken the setup.
Actionable but governed by invalidation levels.
Nuclear Energy holds 5% allocation as a tier-2 position despite a 25.7 category score that ranks it outside the top six. The category-level macro fit is 39.0/100, held back by liquidity stress (-7) and risk appetite broken (-4), but neither descriptor is catastrophic. URA's technical evidence at 36.8/100 is weak, and the 100.2-point reasoned ETF score gap between first (NLR at 45.3) and second (URA at 38.9) suggests the scoring system prefers NLR's steadier utility structure; however, URA won on timing, structure, and risk/reward, making it the category representative despite NLR's superior macro fit. The allocation here is a proxy bet on energy security and decarbonization tailwinds, not technical conviction. The portfolio holds nuclear as a tail hedge against rising electricity demand colliding with renewable intermittency and is willing to tolerate negative momentum and weak technical evidence because the macro narrative—even in a disinflation regime—remains supportive of nuclear capacity buildout. The -19.9% 13-week return and -10.5% SPY lag are severe, and volume is thin, signaling capitulation rather than accumulation; the 5% slot is acceptable only because the category lacks better options and the narrative bet on energy security justifies maintaining exposure.
AI — AIQ
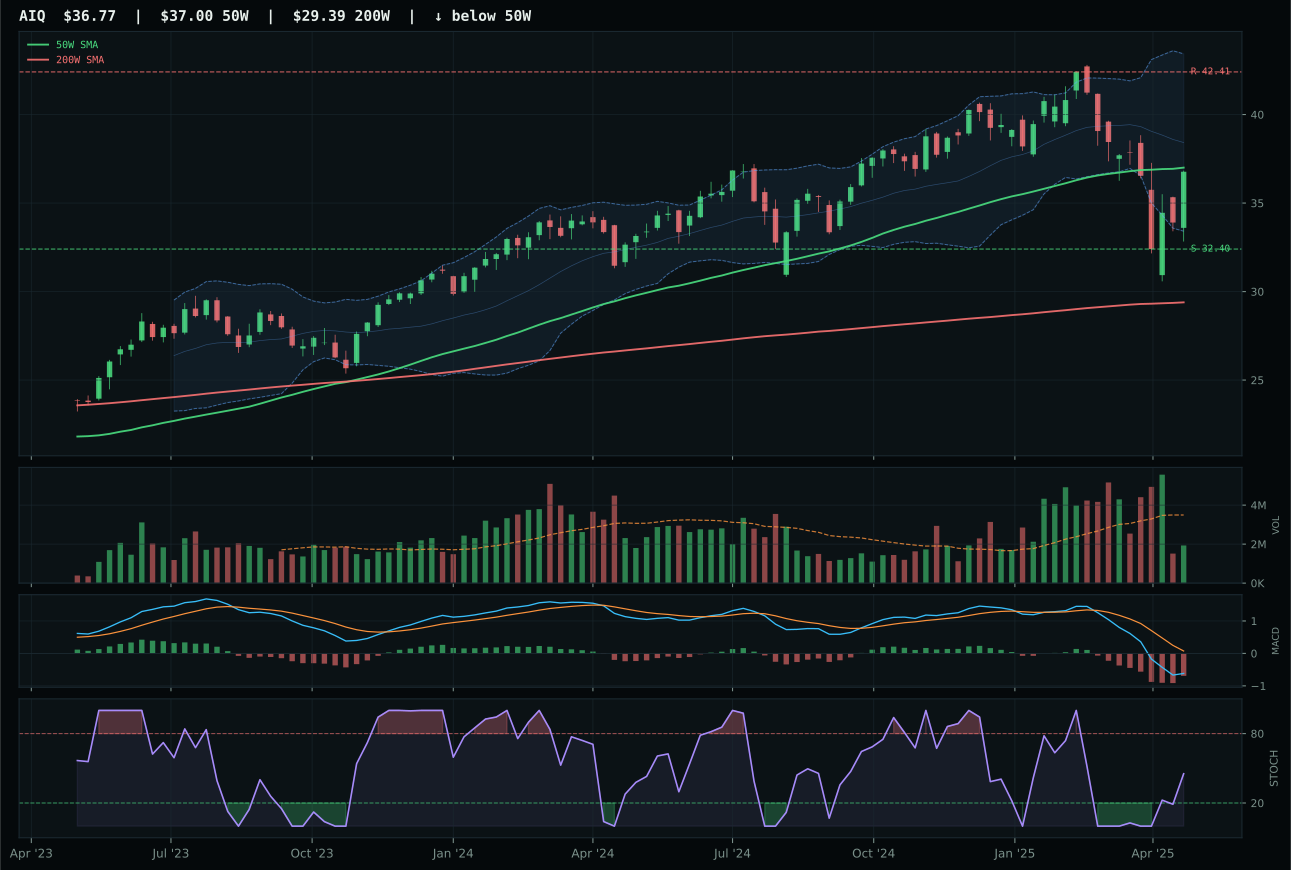
AIQ has a compression near 50W profile with -0.4% 13-week relative strength versus SPY.
A failed hold above support would weaken the setup.
Actionable but governed by invalidation levels.
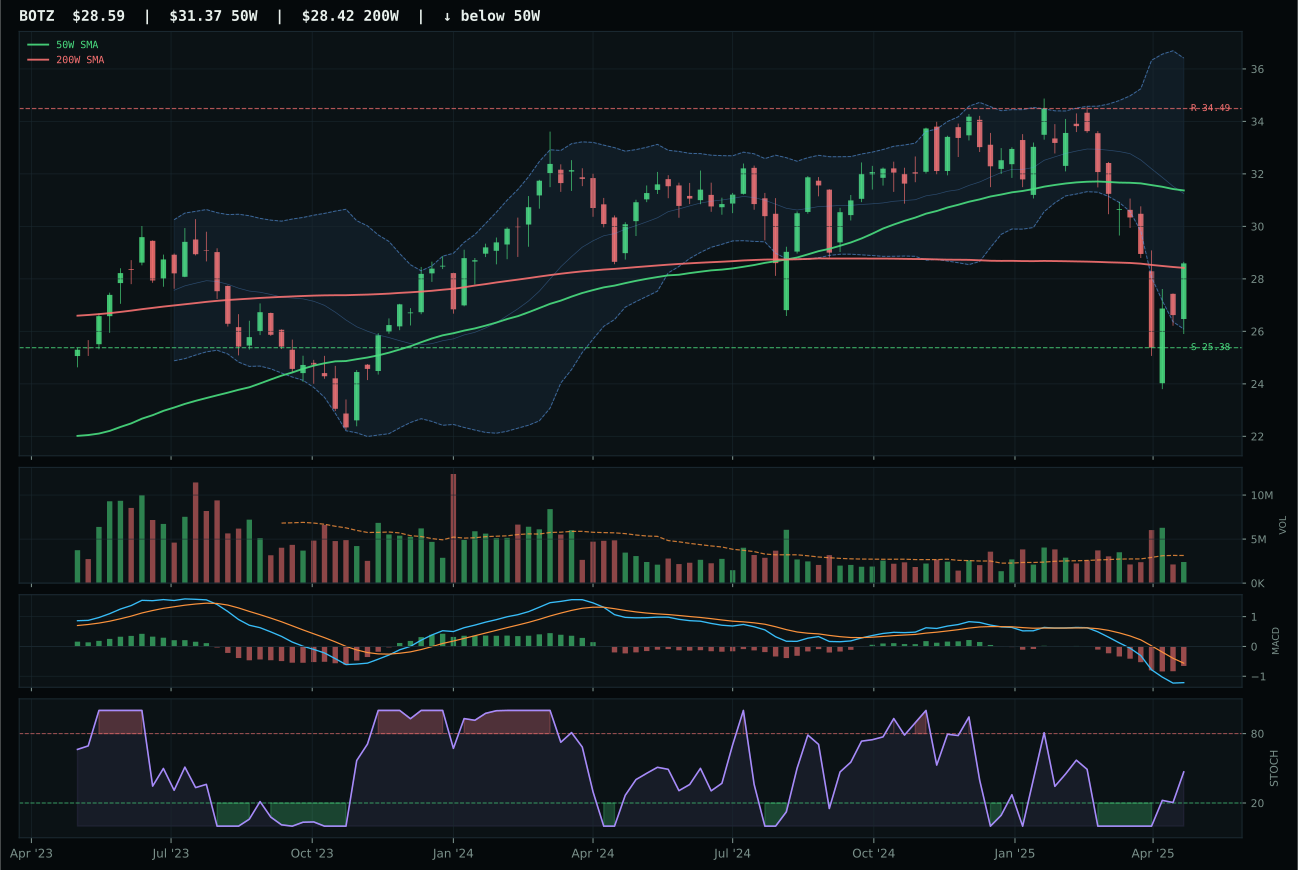
BOTZ has a neutral structure profile with -7.7% 13-week relative strength versus SPY.
A failed hold above support would weaken the setup.
Actionable but governed by invalidation levels.
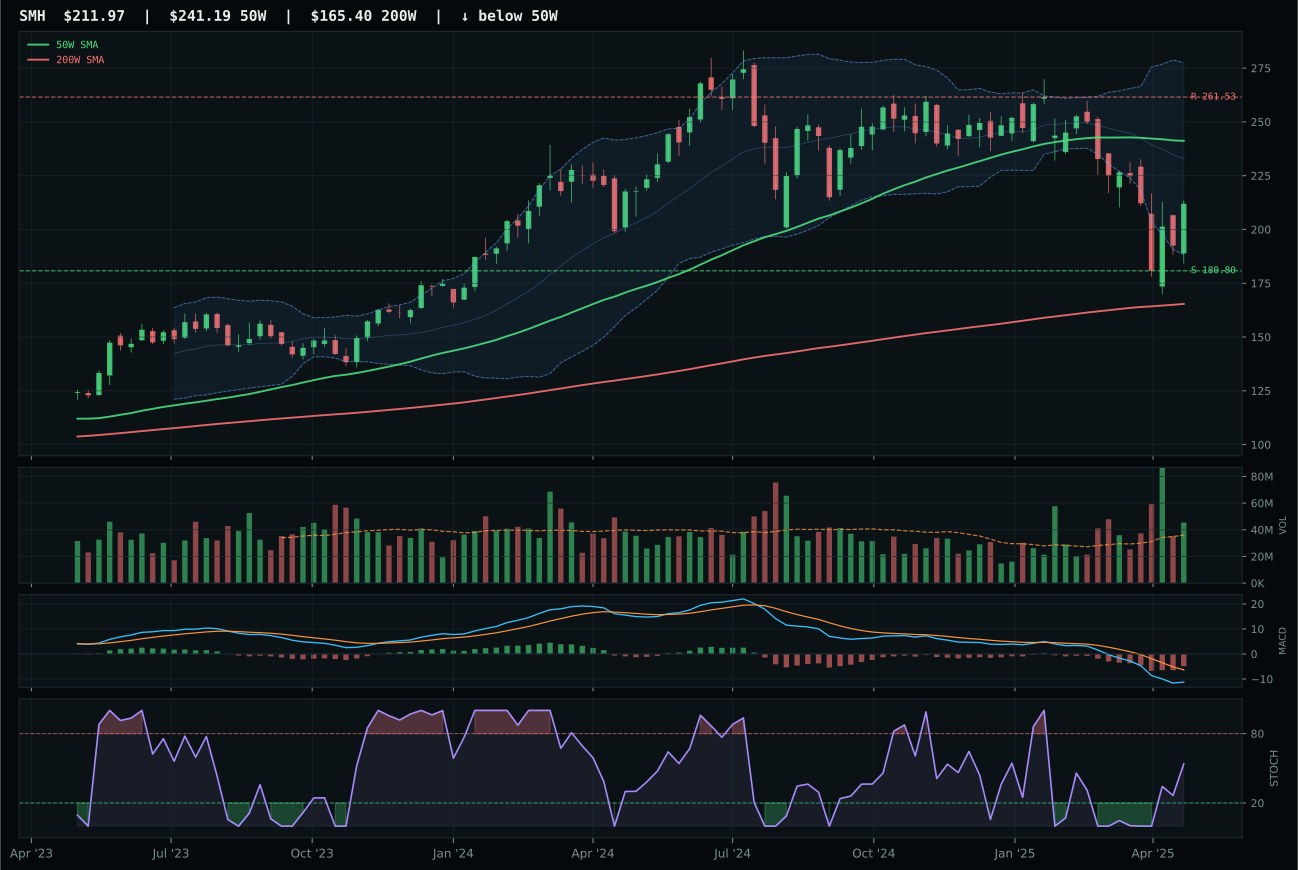
SMH has a neutral structure profile with -9.5% 13-week relative strength versus SPY.
A failed hold above support would weaken the setup.
Actionable but governed by invalidation levels.
AI receives 5% allocation despite its 22.6 final score because it represents the cleanest technical setup available inside a challenged category. The macro fit is deeply negative at 35.0/100: liquidity stress subtracts 12 points and broad market bear subtracts 8, reflecting the reality that growth-dependent AI names are first to fold when risk appetite breaks. Technical evidence for AIQ sits at 53.4/100, meaning the momentum and setup quality are mediocre by absolute standards. This is a category without good options—AIQ's 48.7 reasoned ETF score barely outdistances BOTZ at 30.7 and SMH at 12.3. Holding 5% here is a placeholder allocation, not conviction: the setup is compression near the 50W with an improving MACD, which could turn into a coil breakout if buyers step in, but thin volume at 0.55x the 20-week average means there is no accumulation sponsorship yet. The category would need either macro relief from the liquidity stress headwind or a sustained volume surge to justify elevation above tier 2.
Agriculture & Livestock — MOO
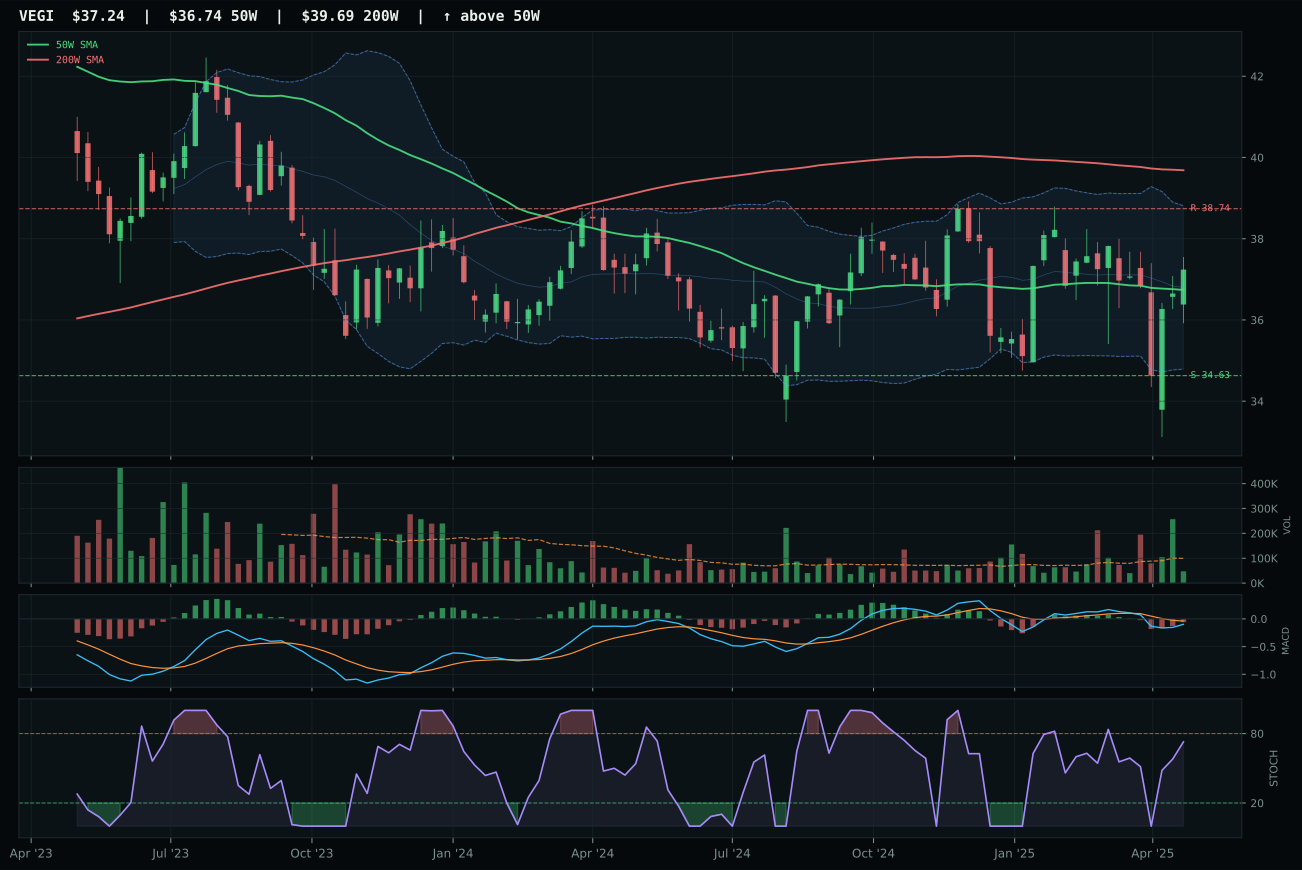
VEGI has a compression near 50W profile with 7.2% 13-week relative strength versus SPY.
A failed hold above support would weaken the setup.
Tracked, but not top-2 eligible because: .
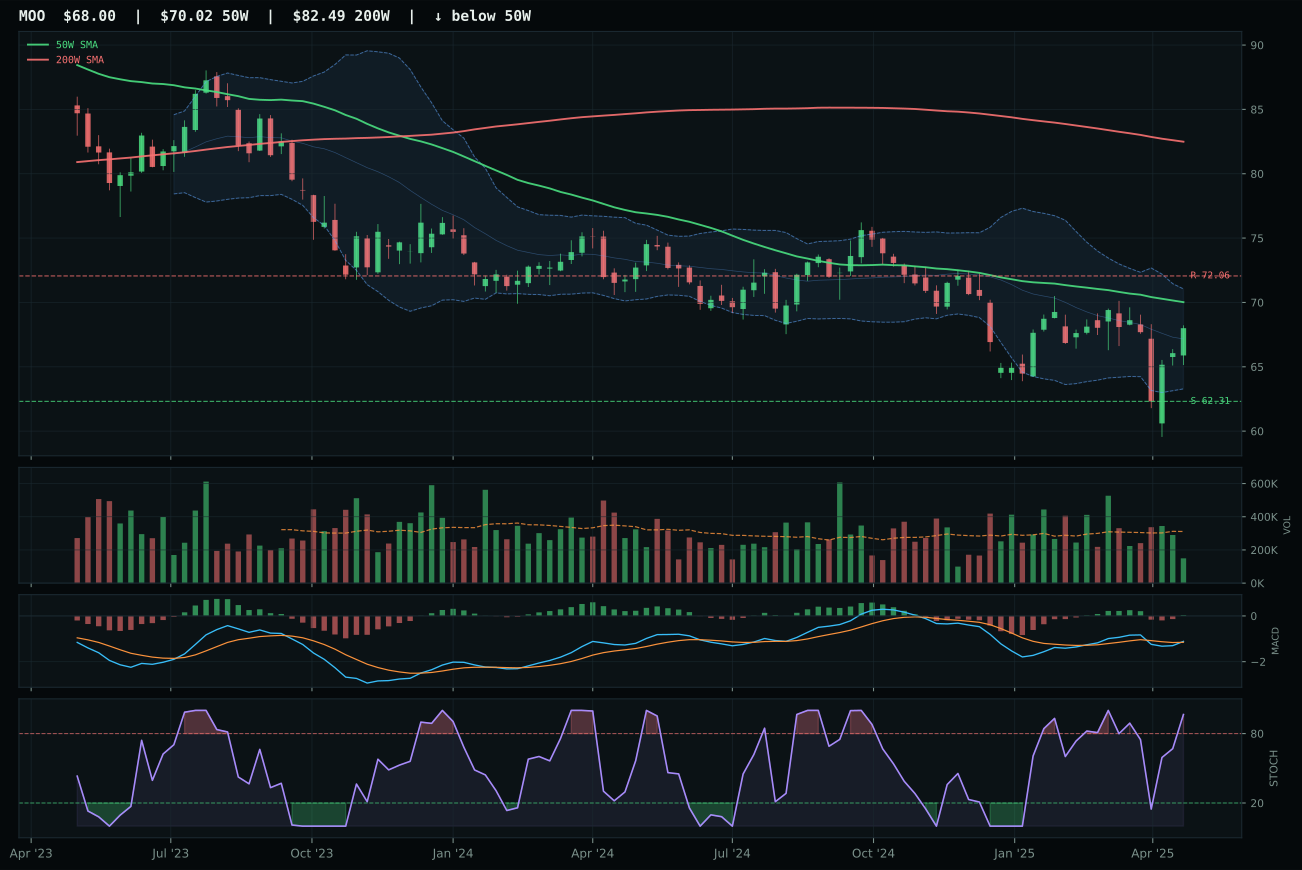
MOO has a compression near 50W profile with 8.4% 13-week relative strength versus SPY.
Extension and support failure are the main tactical risks.
Tracked, but not top-2 eligible because: structurally broken.
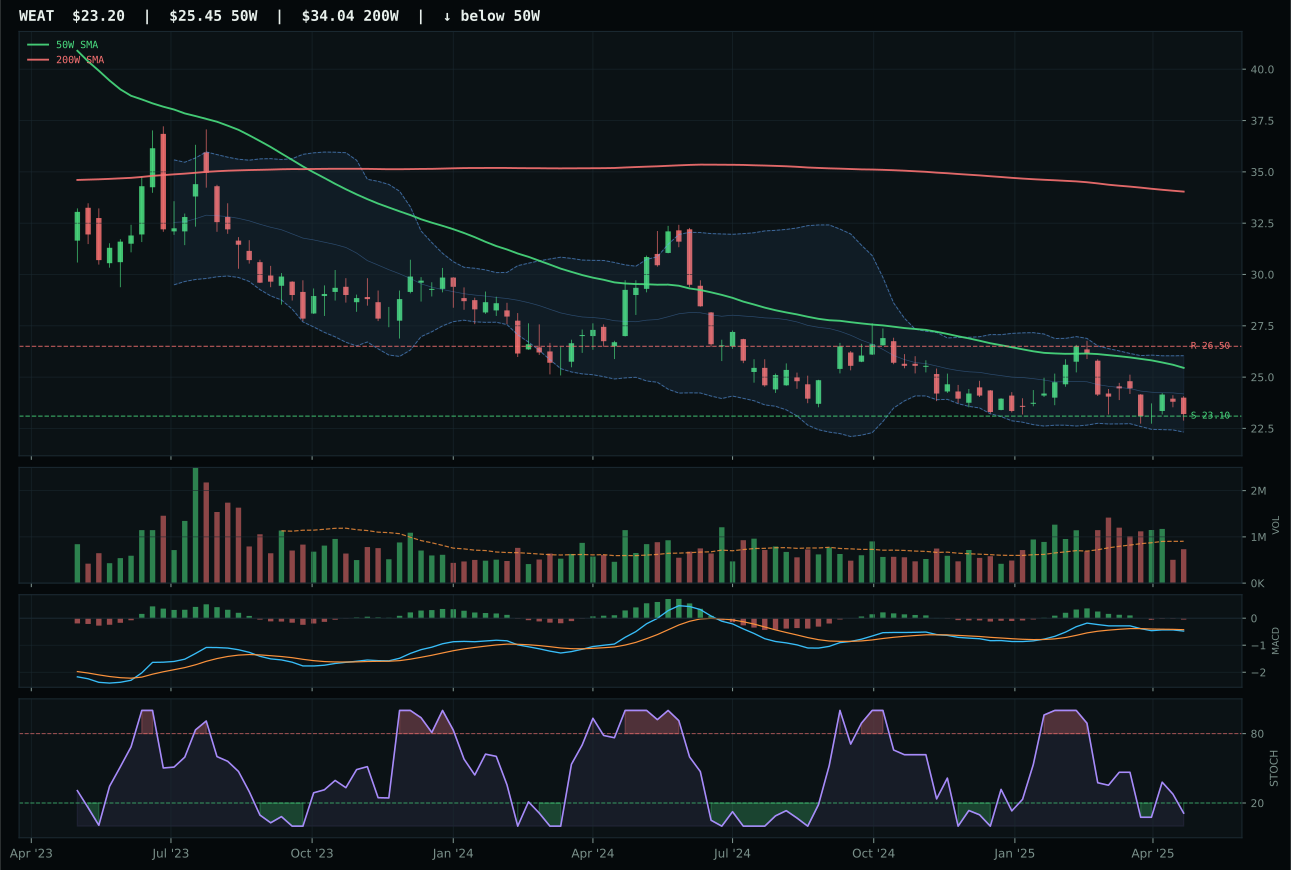
WEAT has a pullback into support profile with 5.3% 13-week relative strength versus SPY.
Extension and support failure are the main tactical risks.
Tracked, but not top-2 eligible because: structurally broken.
Agriculture & Livestock is excluded entirely this week with a 0.5% allocation, ranking outside the top-8 categories. The category score of 0.0 reflects an ineligible flag despite MOO's technical merits, signaling structural damage at the category level that cannot be overcome by individual ETF strength. The macro fit is deeply negative at 32.0/100: disinflation hurts agricultural commodity exposure by 6 points, disinflation pressure subtracts 8 more, and liquidity stress removes another 4. A disinflation regime suppresses prices for basic commodities when demand expectations weaken, and that dynamic is now active in the macro checklist. MOO's timing setup is attractive on its own—compression near 50W with bullish MACD turn—but the category's macro incompatibility overrides individual technical quality. For this allocation to reverse, the system would need either an active monetary hedge bid descriptor or removal of the liquidity stress and disinflation pressure flags. Until the macro regime shifts toward inflation expectations or central bank accommodation bias, agricultural commodities lack the narrative support needed even for tier-2 status.
Industrial Metals — COPX
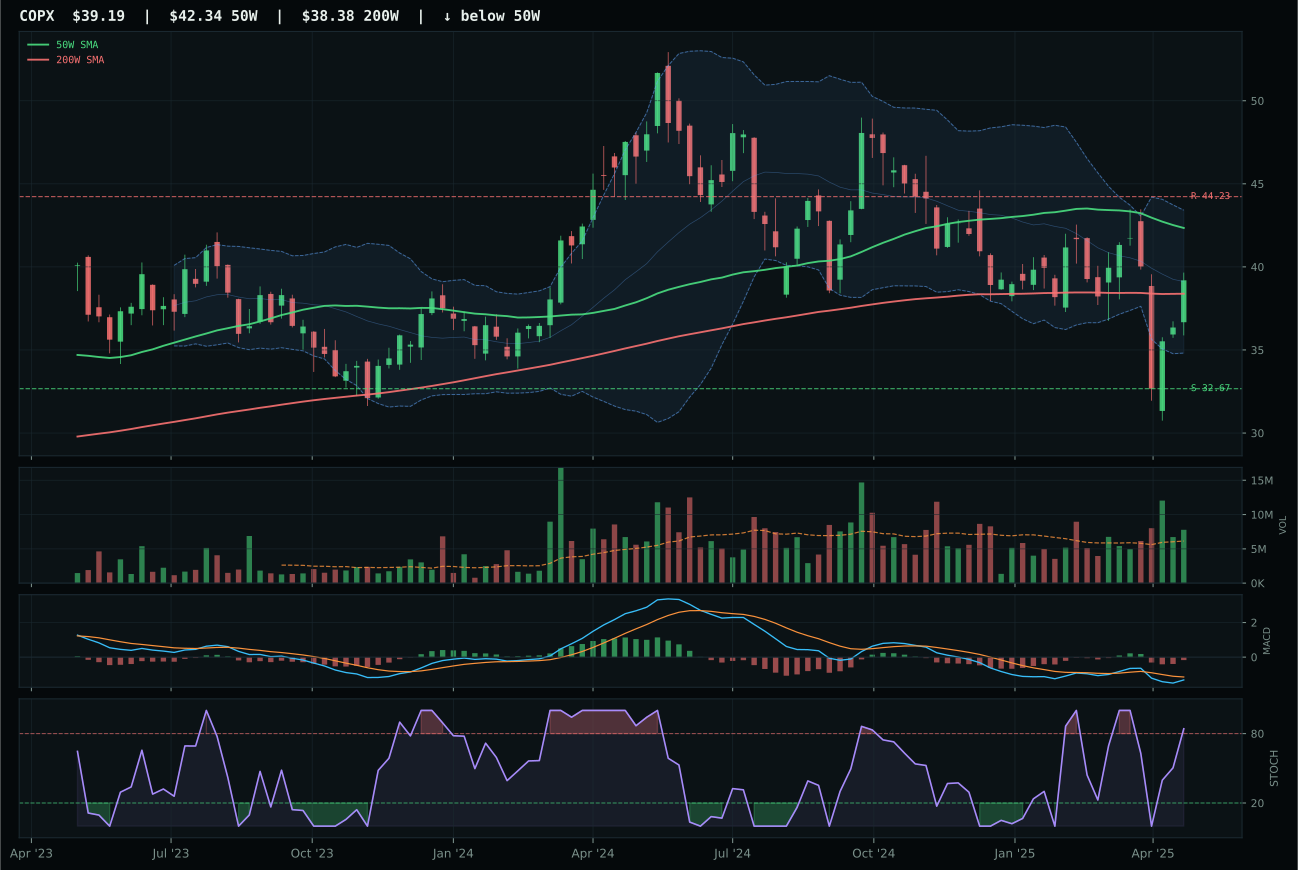
COPX has a neutral structure profile with 7.6% 13-week relative strength versus SPY.
A failed hold above support would weaken the setup.
Actionable but governed by invalidation levels.
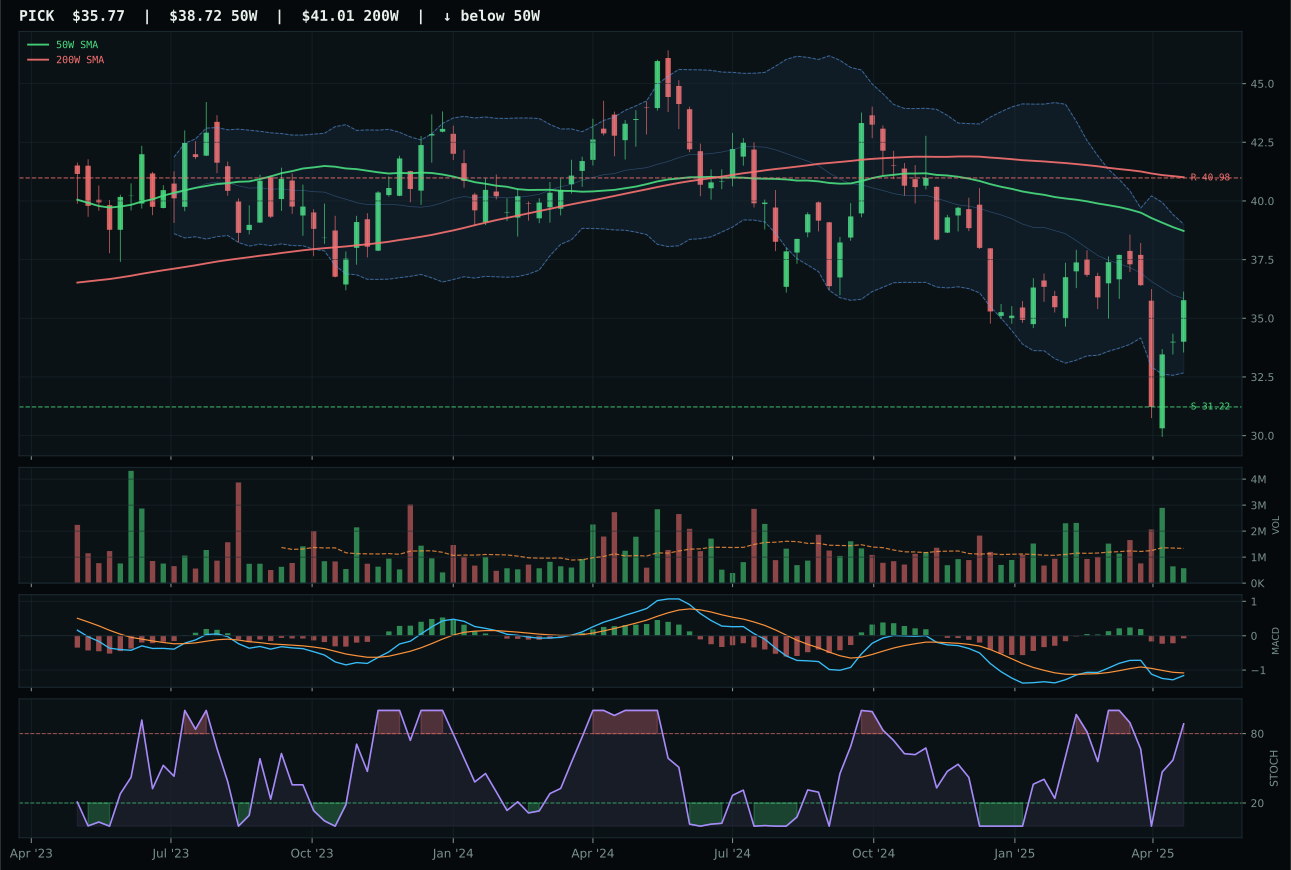
PICK has a neutral structure profile with 7.9% 13-week relative strength versus SPY.
Extension and support failure are the main tactical risks.
Tracked, but not top-2 eligible because: structurally broken.
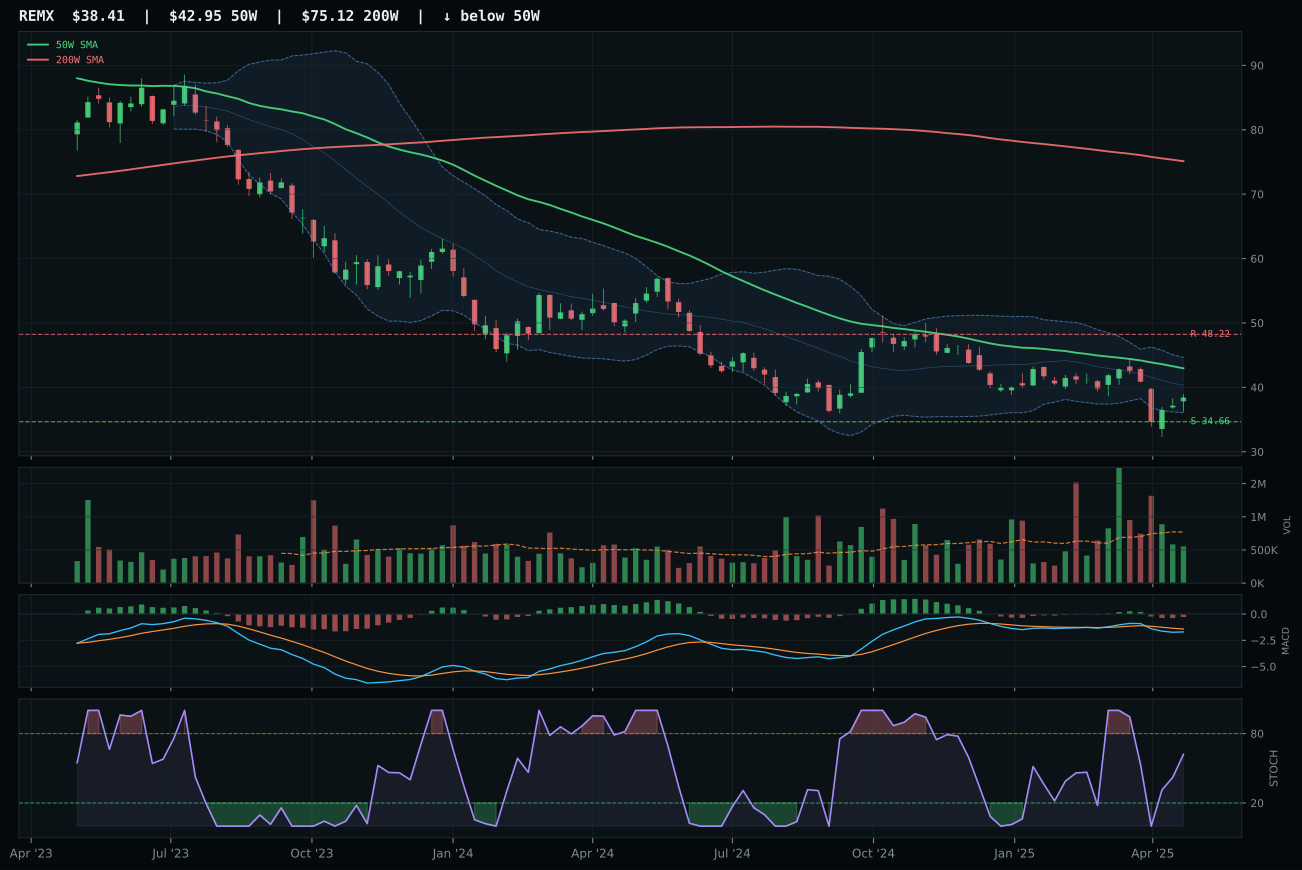
REMX has a neutral structure profile with 1.5% 13-week relative strength versus SPY.
Extension and support failure are the main tactical risks.
Tracked, but not top-2 eligible because: structurally broken.
Industrial Metals receives 0% allocation this week, excluded entirely from the opportunity set. The 11.8 category score reflects a macro fit of just 42.0/100, with only liquidity stress (-8) providing meaningful headwind and no supportive descriptors active. A disinflation regime suppresses industrial metal demand expectations by definition: copper, zinc, and aluminum all soften when growth forecasts weaken and manufacturing activity cools. COPX's 40.3 technical evidence is meager by portfolio standards, and the macro backdrop provides zero relief. The category would need either removal of the liquidity stress flag or activation of a monetary stimulus descriptor to earn tier-2 consideration. Until then, the allocation sits outside the portfolio despite COPX's relative strength within its basket. The setup does offer defined support at 32.67, but in a category without macro tailwind, that technical merit is insufficient. This is a forced exclusion, not a close call: the disinflation regime is explicitly hostile to industrial commodity exposure, and the technical setup, while cleaner than its peers, does not overcome that structural headwind.
Traditional Energy — XLE
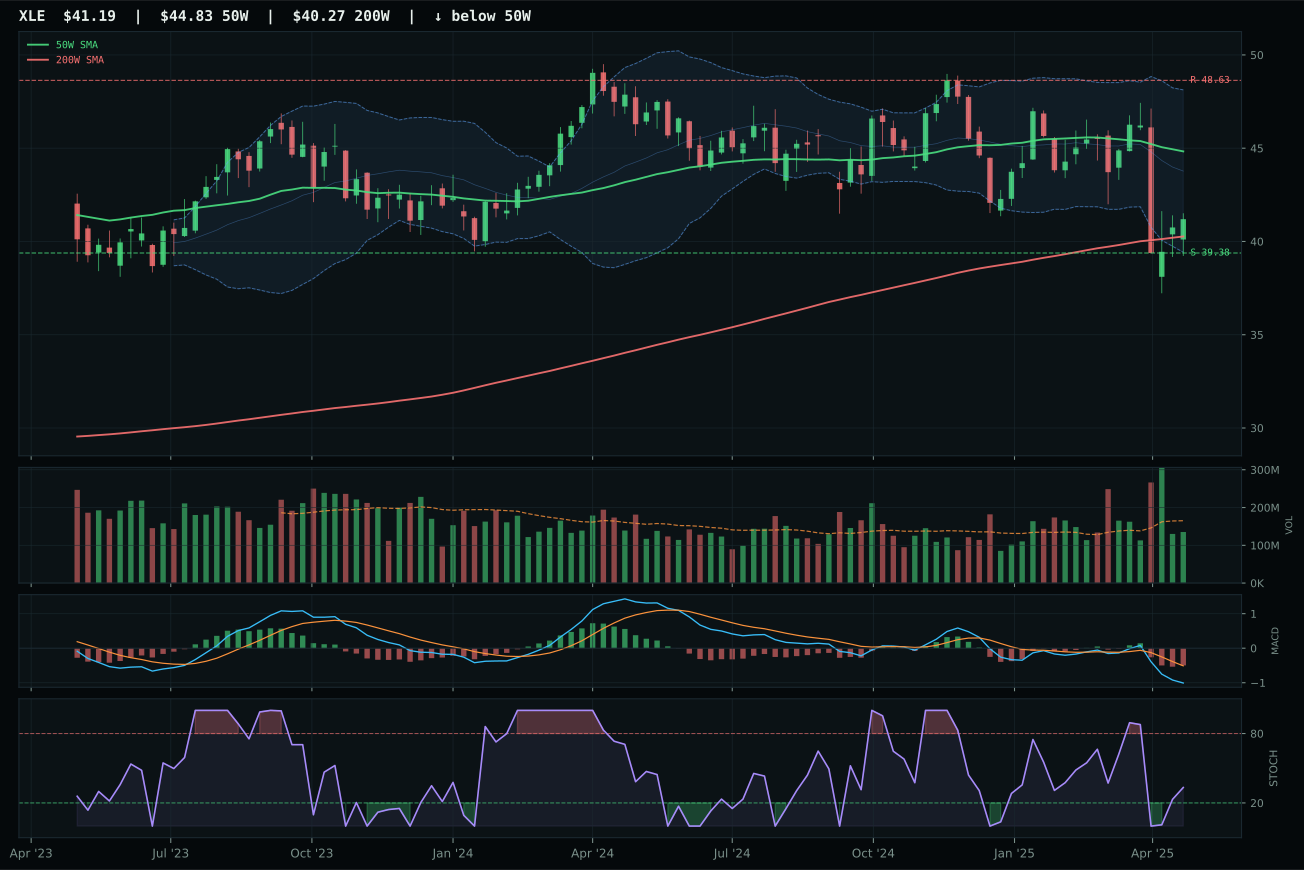
XLE has a pullback into support profile with -0.3% 13-week relative strength versus SPY.
A failed hold above support would weaken the setup.
Actionable but governed by invalidation levels.
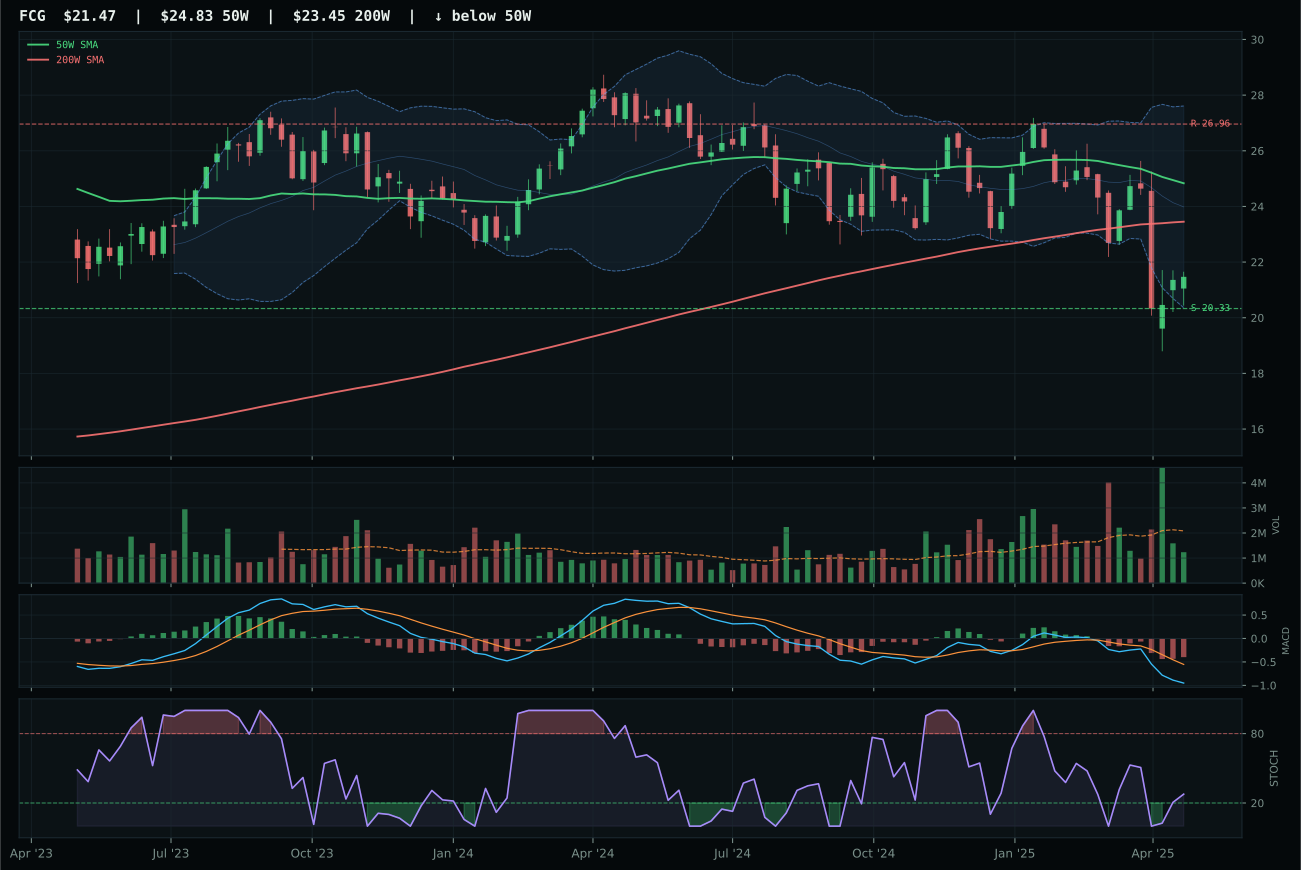
FCG has a neutral structure profile with -8.4% 13-week relative strength versus SPY.
A failed hold above support would weaken the setup.
Actionable but governed by invalidation levels.
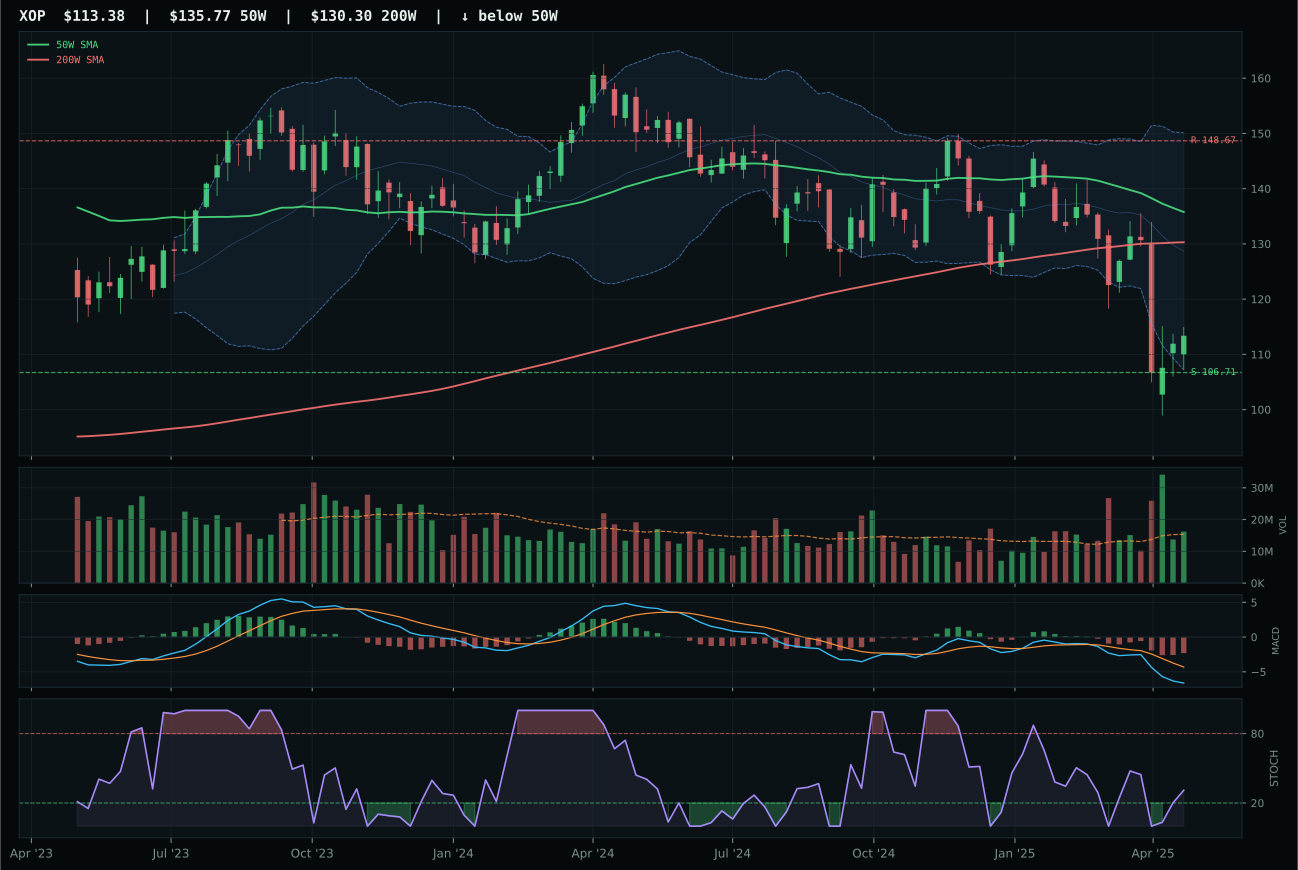
XOP has a neutral structure profile with -10.0% 13-week relative strength versus SPY.
A failed hold above support would weaken the setup.
Actionable but governed by invalidation levels.
Traditional Energy receives 0% allocation despite XLE's relative appeal because the category-level score of just 0.4 is functionally defeated by macro. The macro fit registers at 23.0/100, the lowest or near-lowest of any category this week, driven by disinflation pressure (-10) and disinflation itself (-10) subtracting 20 points combined. In a disinflation regime, energy demand cools, refining margins compress, and oil-price momentum inverts. XLE's technical evidence of 42.8/100 is mediocre, and the macro narrative provides zero support—no monetary hedge bid, no defensive rotation tailwind for energy, just headwind. The pullback-into-support setup at 39.38 with a 90.0 risk/reward score is the category's only technical merit, but without macro sponsorship, that setup is a value trap, not a buy. The portfolio would need either activation of a monetary stimulus descriptor or a macro regime shift to inflation/reflation for energy to re-enter the allocation. Until then, Traditional Energy is structurally excluded: even the cleanest technical setup in a disinflation environment cannot overcome the regime headwind, and XLE's neutral volume-price confirmation (34.8/100) signals that accumulation is not occurring despite the support setup.