
2025-04-18
Informational purposes only. The content in this report, including allocations, analysis, and commentary, is provided solely for informational and educational purposes. It does not constitute financial advice, investment advice, trading advice, or any other type of advice. Past performance does not guarantee future results. Always conduct your own research and consult a qualified financial professional before making investment decisions.
Weekly Allocation
| Ticker | Category | Weight | Role |
|---|---|---|---|
| FBTC | 50% | Overlay | |
| GLD | Precious Metals | 10% | Top-2 (10%) |
| IGF | Utilities & Infrastructure | 10% | Top-2 (10%) |
| XAR | Defense & Aerospace | 5% | Tier-2 (5%) |
| CIBR | Technology | 5% | Tier-2 (5%) |
| MOO | Agriculture & Livestock | 5% | Tier-2 (5%) |
| XLE | Traditional Energy | 5% | Tier-2 (5%) |
| NLR | Nuclear Energy | 5% | Tier-2 (5%) |
| AIQ | AI | 5% | Tier-2 (5%) |
Trade Instructions — Monday Open
Sell the tranche from 2025-03-21 (completing its 4-week hold). Buy the new tranche. Instructions show net portfolio changes — same-asset positions cancel, weight changes show the delta.
| Action | Ticker | Instruction |
|---|---|---|
| SELL | ITA | Sell 33% of ITA position (reduce 3.75% → 2.50%) |
| SELL | URNM | Sell entire URNM position (1.25% of portfolio) |
| SELL | COPX | Sell 50% of COPX position (reduce 2.50% → 1.25%) |
| BUY | NLR | Buy NLR — 33.33% of freed cash (adds 1.25% to portfolio) |
| BUY | XAR | Buy XAR — 33.33% of freed cash (adds 1.25% to portfolio) |
| BUY | MOO | Buy MOO — 33.33% of freed cash (adds 1.25% to portfolio) |
Current Portfolio After Trade
Combined holdings across all 4 active tranches. Each tranche is 25% of the portfolio.
| Ticker | % of Portfolio | Weight Bar |
|---|---|---|
| FBTC | 50.00% | |
| IGF | 10.00% | |
| GLD | 7.50% | |
| CIBR | 5.00% | |
| NLR | 5.00% | |
| AIQ | 3.75% | |
| ITA | 2.50% | |
| XLE | 2.50% | |
| SLV | 2.50% | |
| INDA | 2.50% | |
| WEAT | 2.50% | |
| XAR | 2.50% | |
| COPX | 1.25% | |
| VEGI | 1.25% | |
| MOO | 1.25% |
Macro Regime — Disinflation
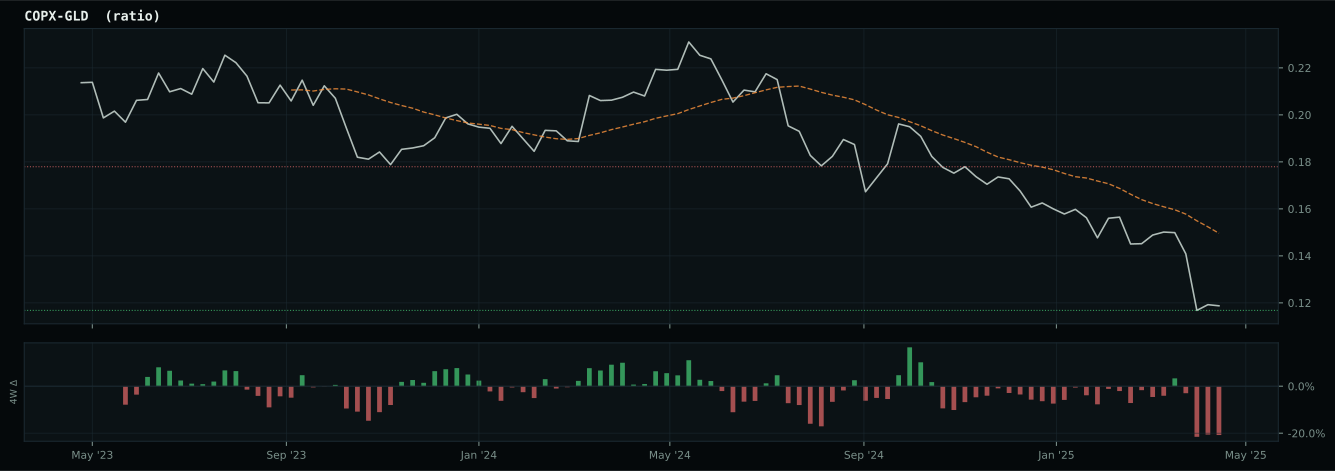
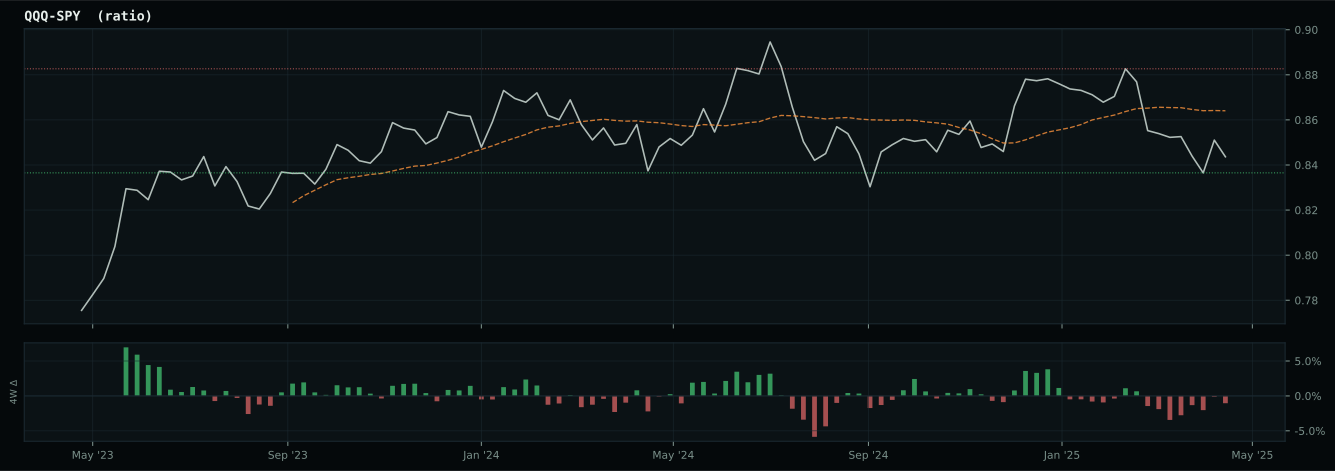
growth data is not confirming the weak market-implied risk appetite signal
Macro Evidence Charts
Market-implied signals behind the macro regime scores. Each ratio compares two assets; the direction and slope of the ratio is what the macro engine reads.
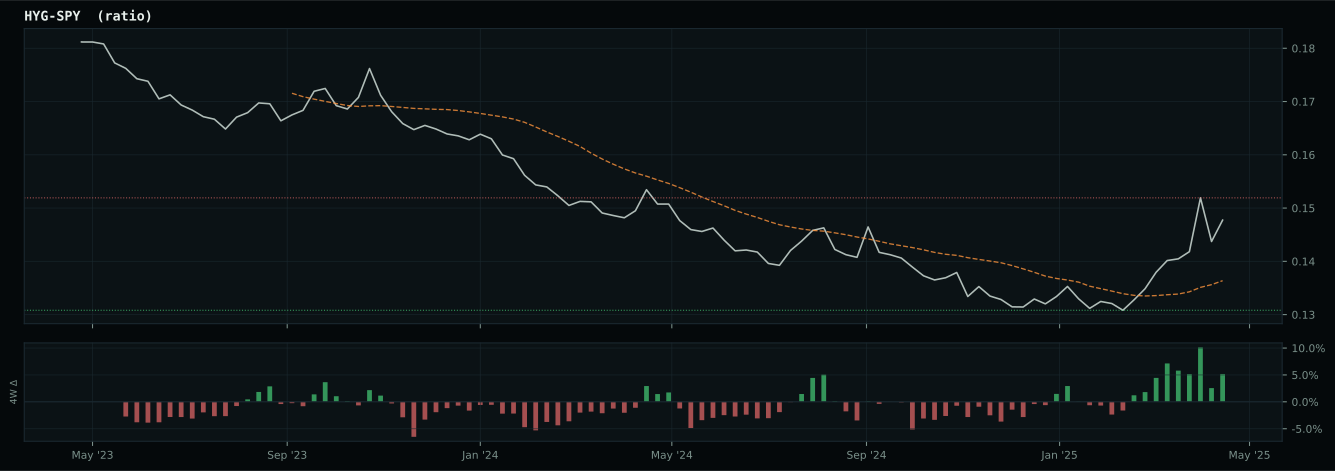
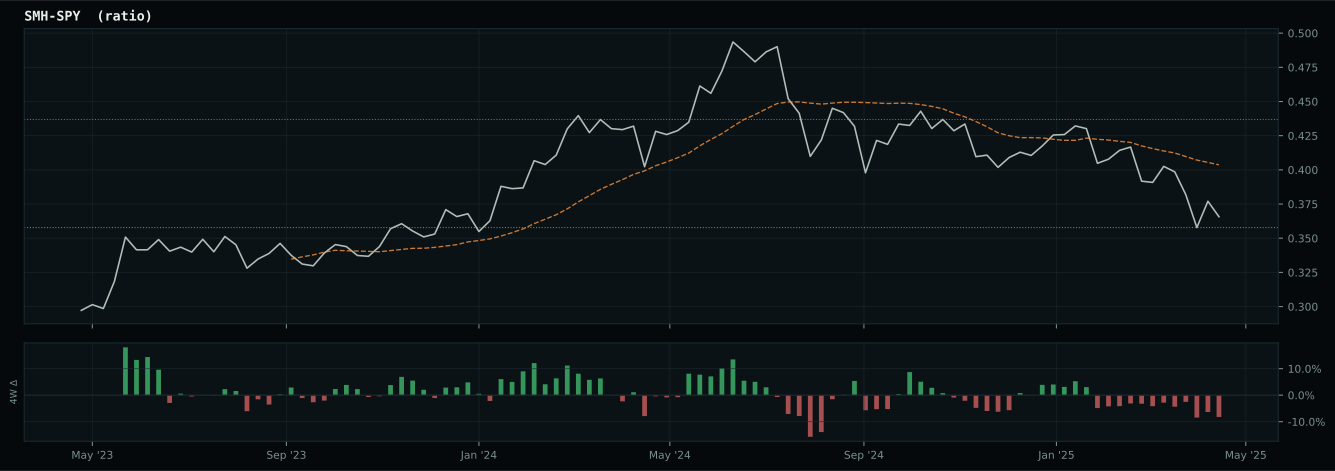
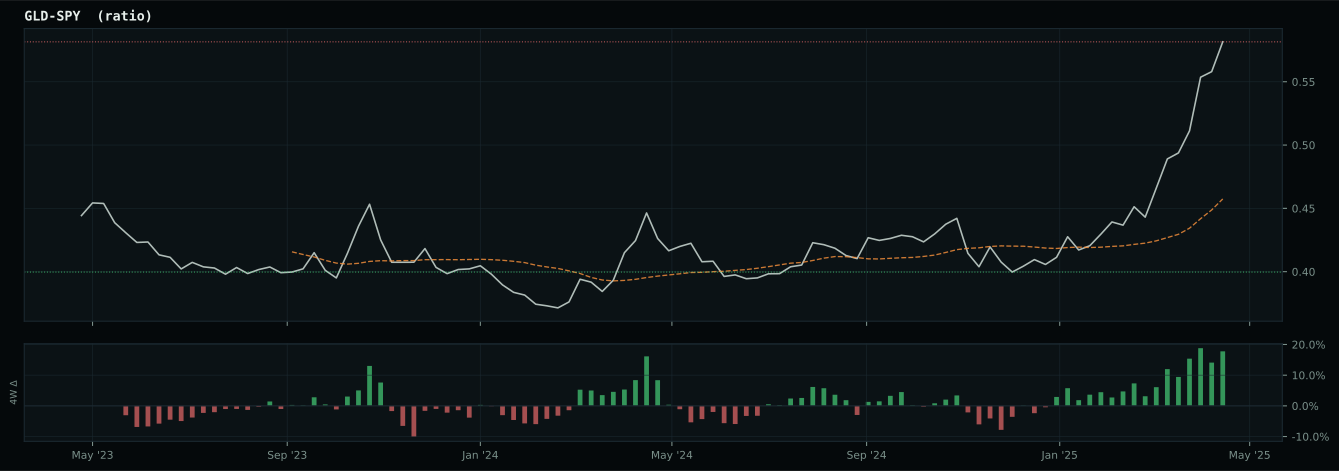
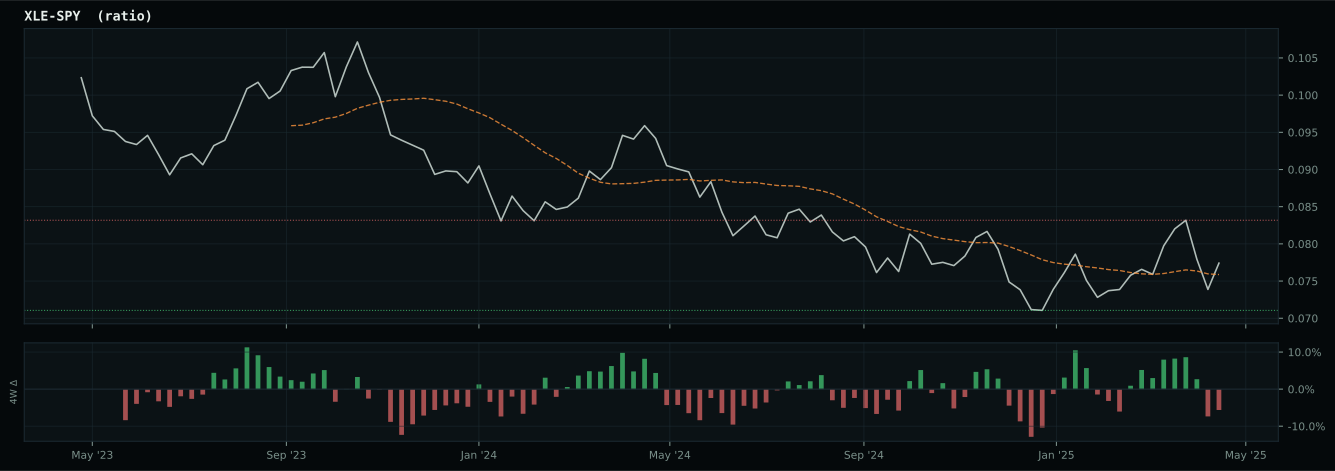
Crypto Regime — TrendBTC
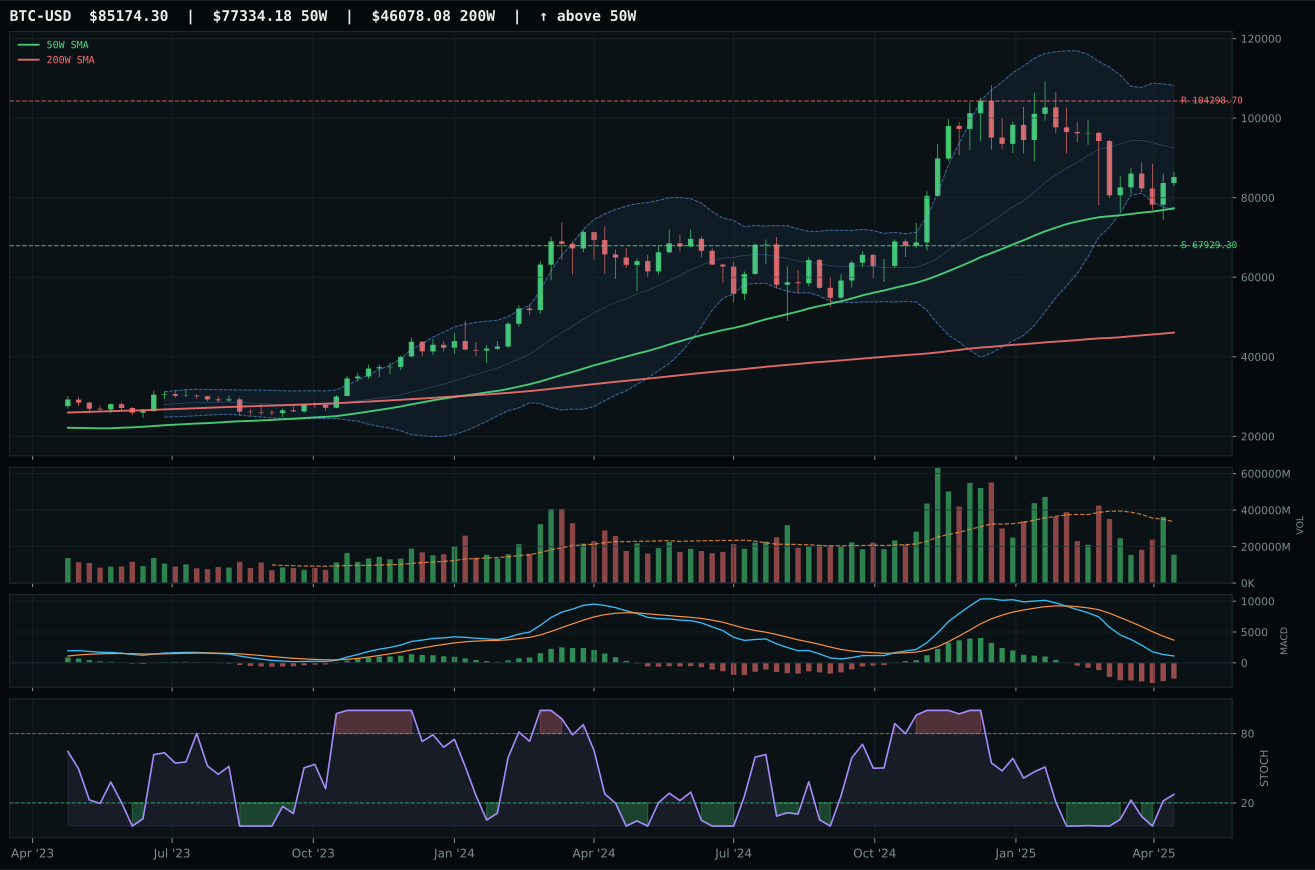
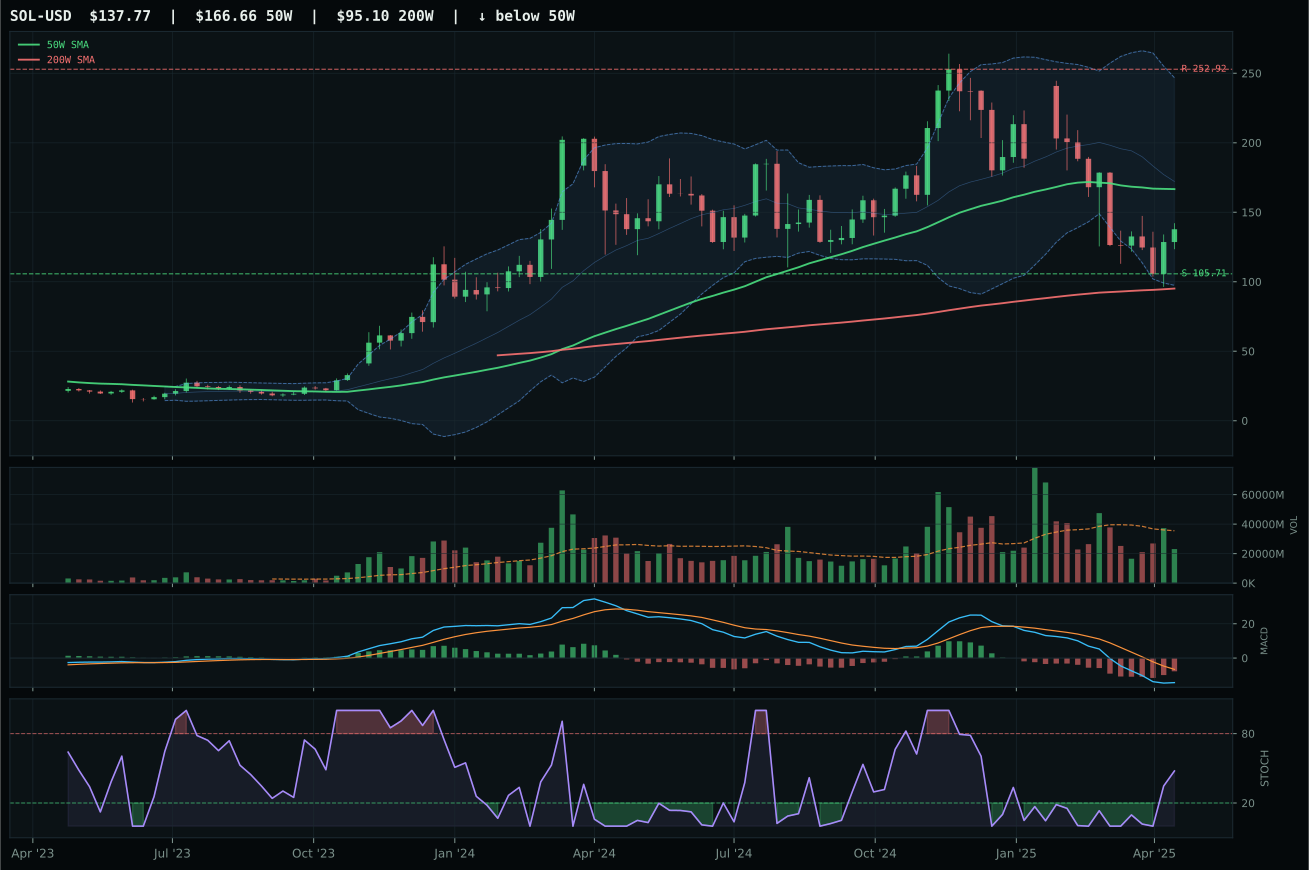
ValueBTC not armed: BTC has not made the first post-breakdown touch of the 200W buy zone after losing the 50W
TrendBTC confirmed: 2 consecutive closes above rising/flat 50W SMA
one or more available conditions failed
Category Rankings
| Rank | Category | Winner | Score | Alloc | 4W Ret | Peers (4W) |
|---|---|---|---|---|---|---|
| 1 | Precious Metals | GLD | 80.7 | 20% | -5.45% | GDX -10.6% · SLV -1.7% |
| 2 | Utilities & Infrastructure | IGF | 57.9 | 20% | +5.08% | XLU +5.3% · PAVE +16.4% |
| 3 | Defense & Aerospace | XAR | 46.2 | 10% | +15.60% | ITA +15.2% · ROKT +15.3% |
| 4 | Technology | CIBR | 43.6 | 10% | +15.17% | IGV +21.5% · XLK +21.9% |
| 5 | Nuclear Energy | NLR | 26.0 | 10% | +16.81% | URA +18.9% · URNM +14.1% |
| 6 | AI | AIQ | 19.2 | 10% | +20.18% | BOTZ +15.6% · SMH +27.8% |
| 7 | Emerging Markets | INDA | 16.8 | 10% | +2.77% | ILF +9.2% · IEMG +9.3% |
| 8 | Industrial Metals | COPX | 4.6 | 10% | +6.98% | PICK +6.8% · REMX +1.2% |
| 9 | Agriculture & Livestock | MOO | — | 0% | +9.27% | VEGI +10.6% · WEAT -6.5% |
| 10 | Traditional Energy | XLE | — | 0% | +5.69% | FCG +7.9% · XOP +13.2% |
Precious Metals — GLD
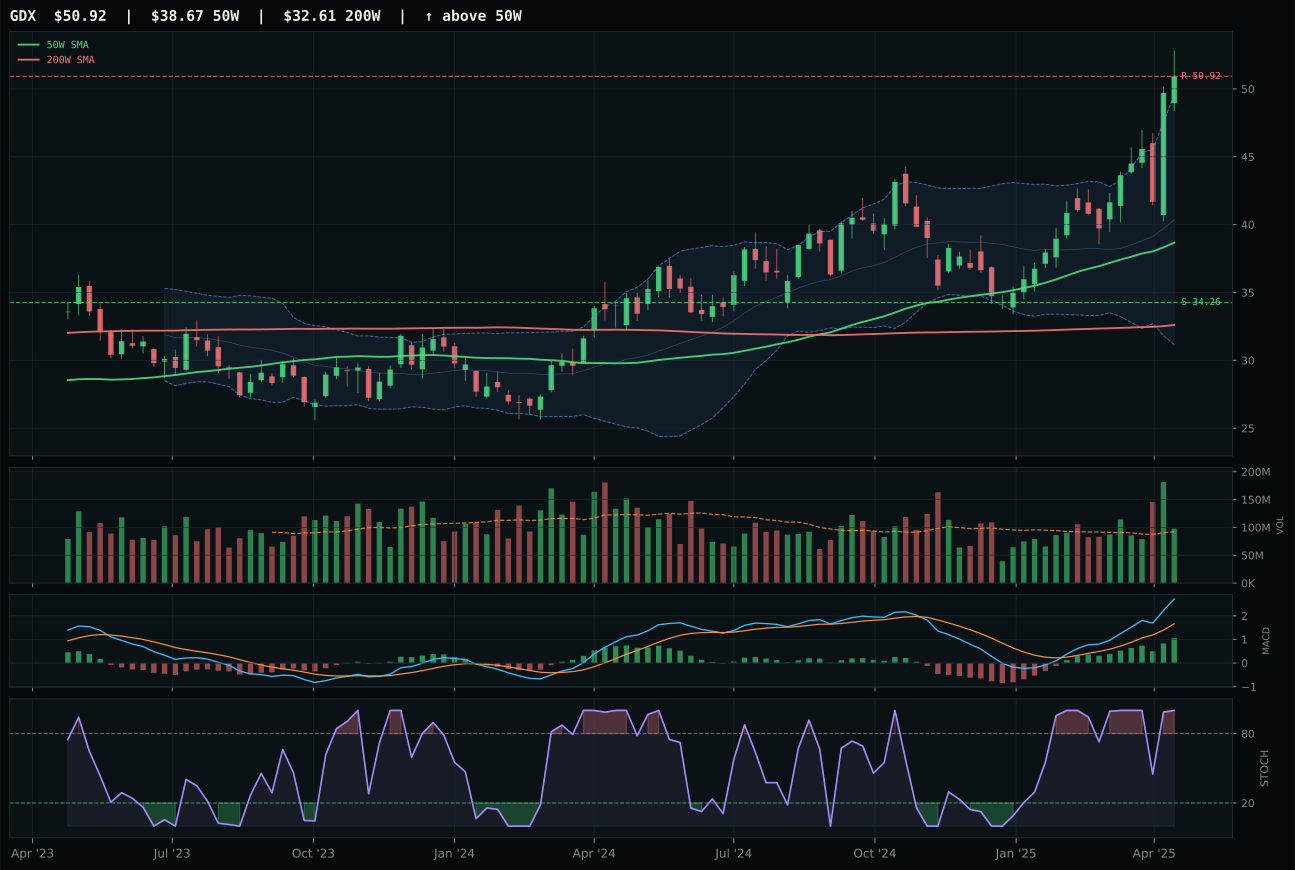
GDX has a vertical extension profile with 50.5% 13-week relative strength versus SPY.
A failed hold above support would weaken the setup.
Actionable but governed by invalidation levels.
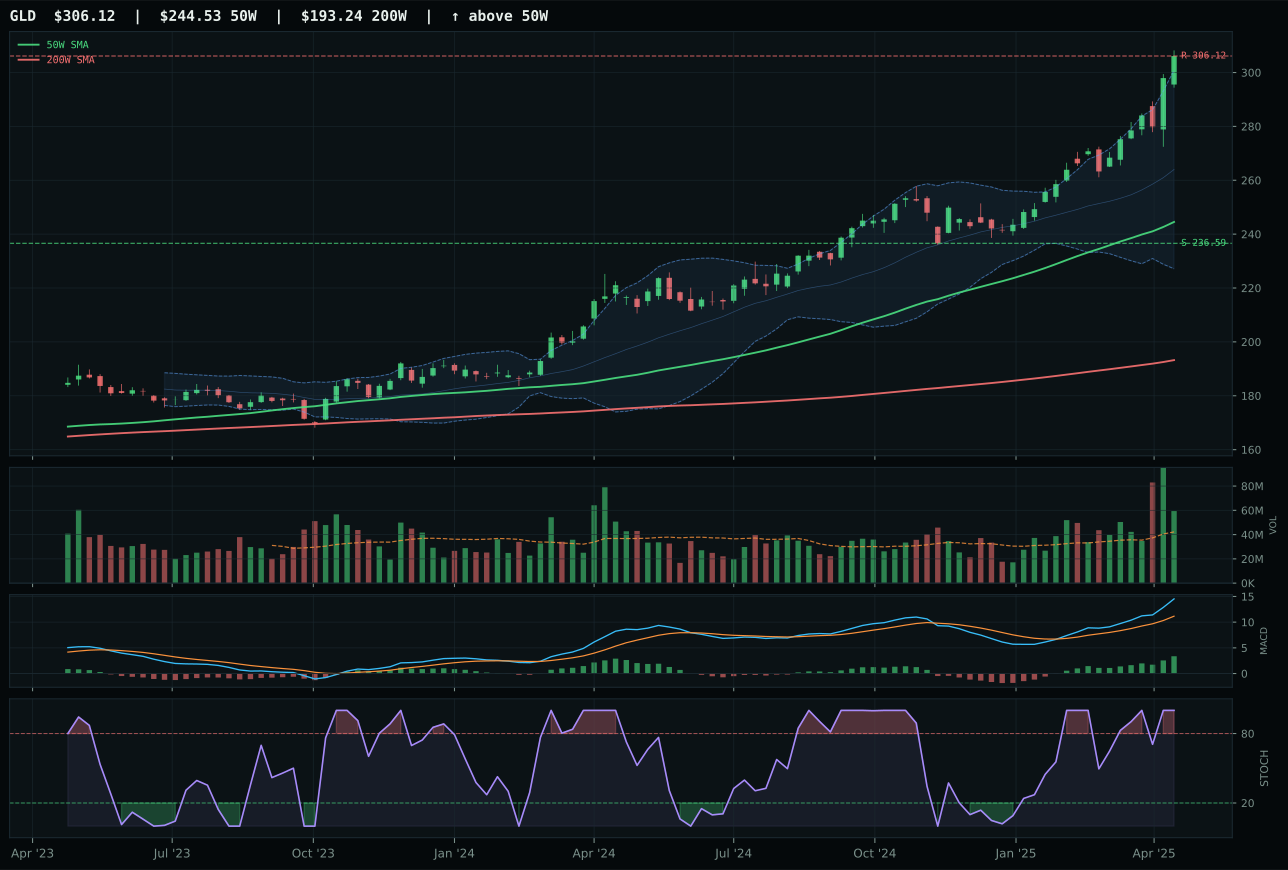
GLD has a vertical extension profile with 34.7% 13-week relative strength versus SPY.
A failed hold above support would weaken the setup.
Actionable but governed by invalidation levels.
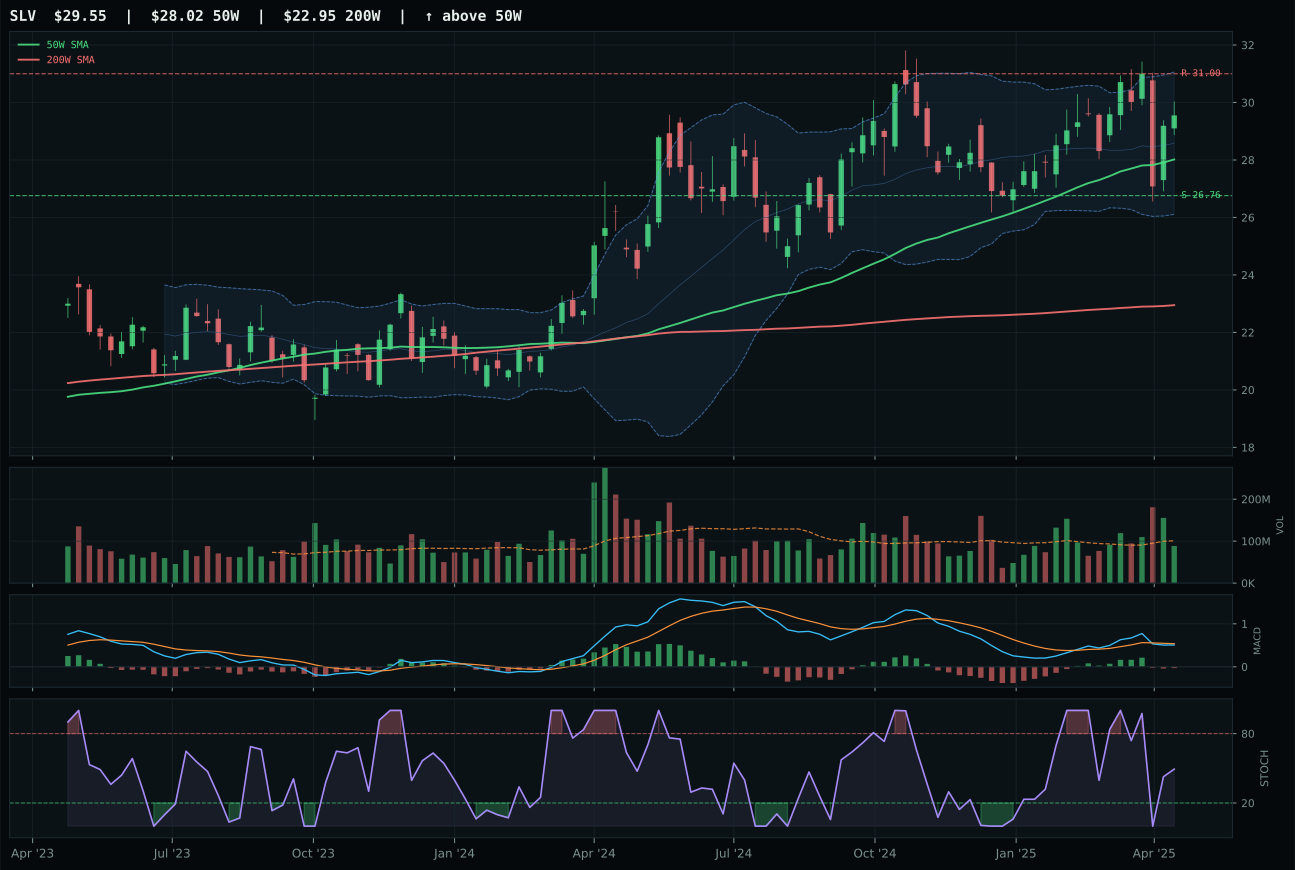
SLV has a neutral structure profile with 18.9% 13-week relative strength versus SPY.
A failed hold above support would weaken the setup.
Actionable but governed by invalidation levels.
GLD wins decisively with a 80.7 category score that lands it in top-2 overweight territory, powered by textbook bullish alignment: price 25.2% above the 50W, MACD improving into positive territory, stochastic RSI overbought at 1.00, and volume above 1.41x average. The 100.0 momentum confirmation score reflects a 22.8% 13-week return and 34.7% SPY-relative strength, both the cleanest signals in the portfolio this week. GDX matches GLD's trend and momentum but loses because it is stretched even further (31.7% from 50W vs 25.2%) with weaker volume (neutral vs above-average) and less clean structure (76.4 vs 85.2). GLD's vertical extension setup sits in the 0.236 Fibonacci zone, meaning price has already run hard but the underlying bid remains intact from institutional portfolio hedging. The monetary hedge bid descriptor is active (+14), directly benefiting both gold positions, yet GLD's superior volume confirmation shows the buying is institutional and durable, not speculative.
Precious Metals earned 10% allocation as a top-2 category, reflecting its 80.7 score and macro alignment in a disinflation regime. The category-level macro fit is 85.0/100, the highest in the portfolio, driven by monetary hedge bid (+14), disinflation pressure (+6), and defensive rotation (+7). In a low-growth, falling-rate environment, gold serves dual purpose: a monetary insurance policy against currency debasement and a negative-beta hedge for equity drawdowns. GLD's leadership over GDX hinges partly on volume confirmation; above-average institutional participation suggests this rally has staying power rather than being a leveraged miner bounce. The 10% allocation is appropriate because this is the only category where trend, macro, and volume all align in the same direction without compromise. Price at 285.09 is extended, and risk-reward (41.9) is skewed toward downside (29.4% to support) versus upside (0.0% to resistance), but that is a feature, not a bug: in a defensive regime, you buy strength into resistance, not weakness into support.
Utilities & Infrastructure — IGF
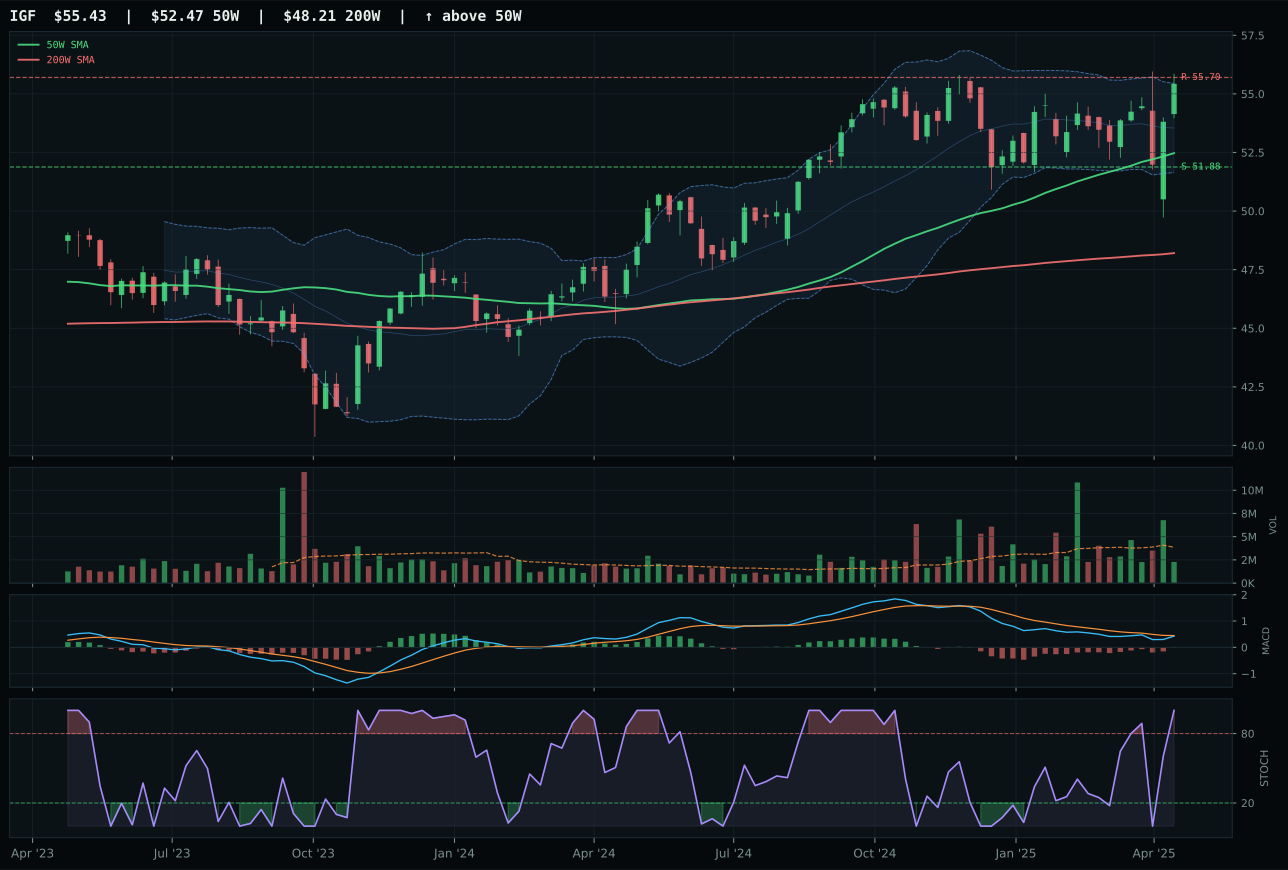
IGF has a neutral structure profile with 14.1% 13-week relative strength versus SPY.
A failed hold above support would weaken the setup.
Actionable but governed by invalidation levels.
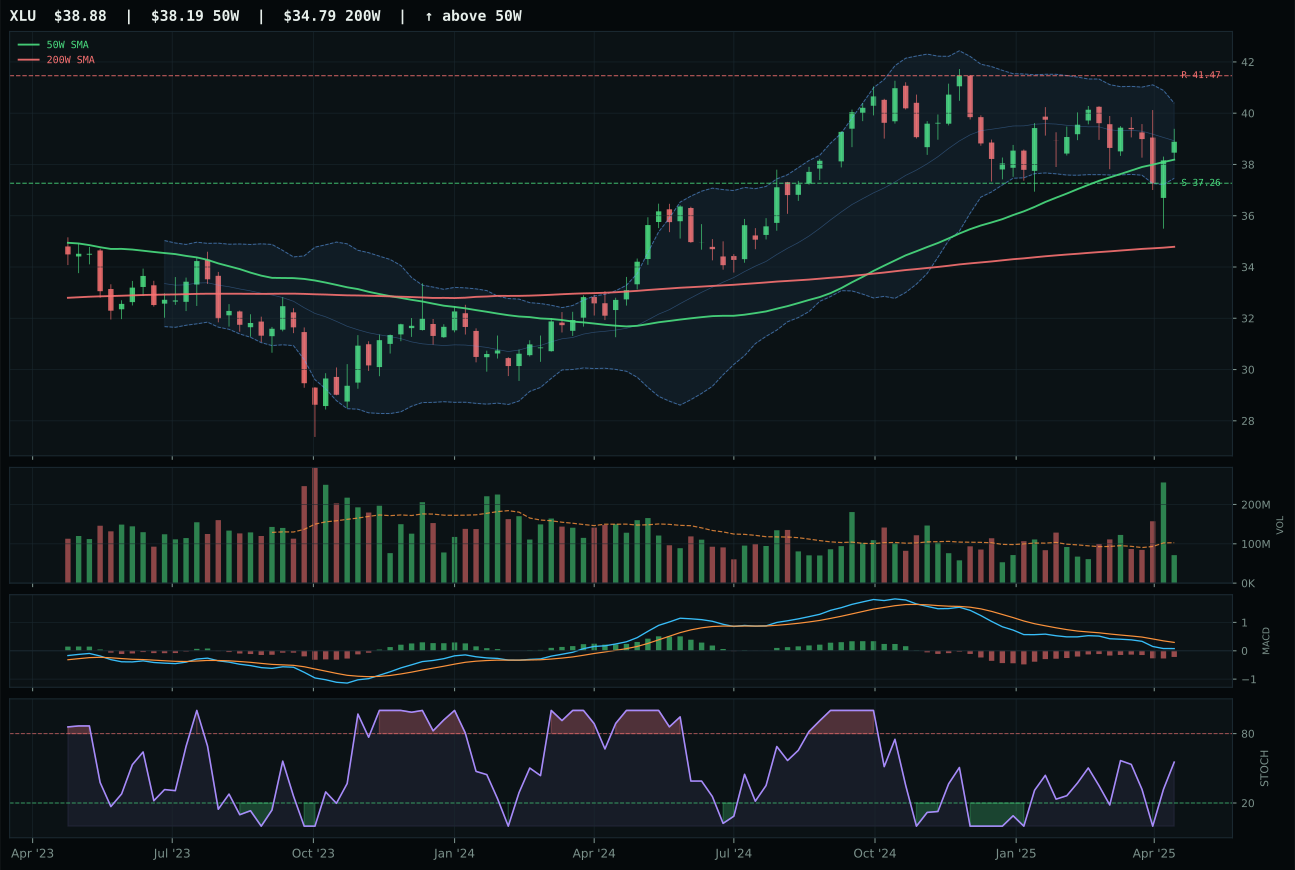
XLU has a pullback into support profile with 10.6% 13-week relative strength versus SPY.
A failed hold above support would weaken the setup.
Actionable but governed by invalidation levels.
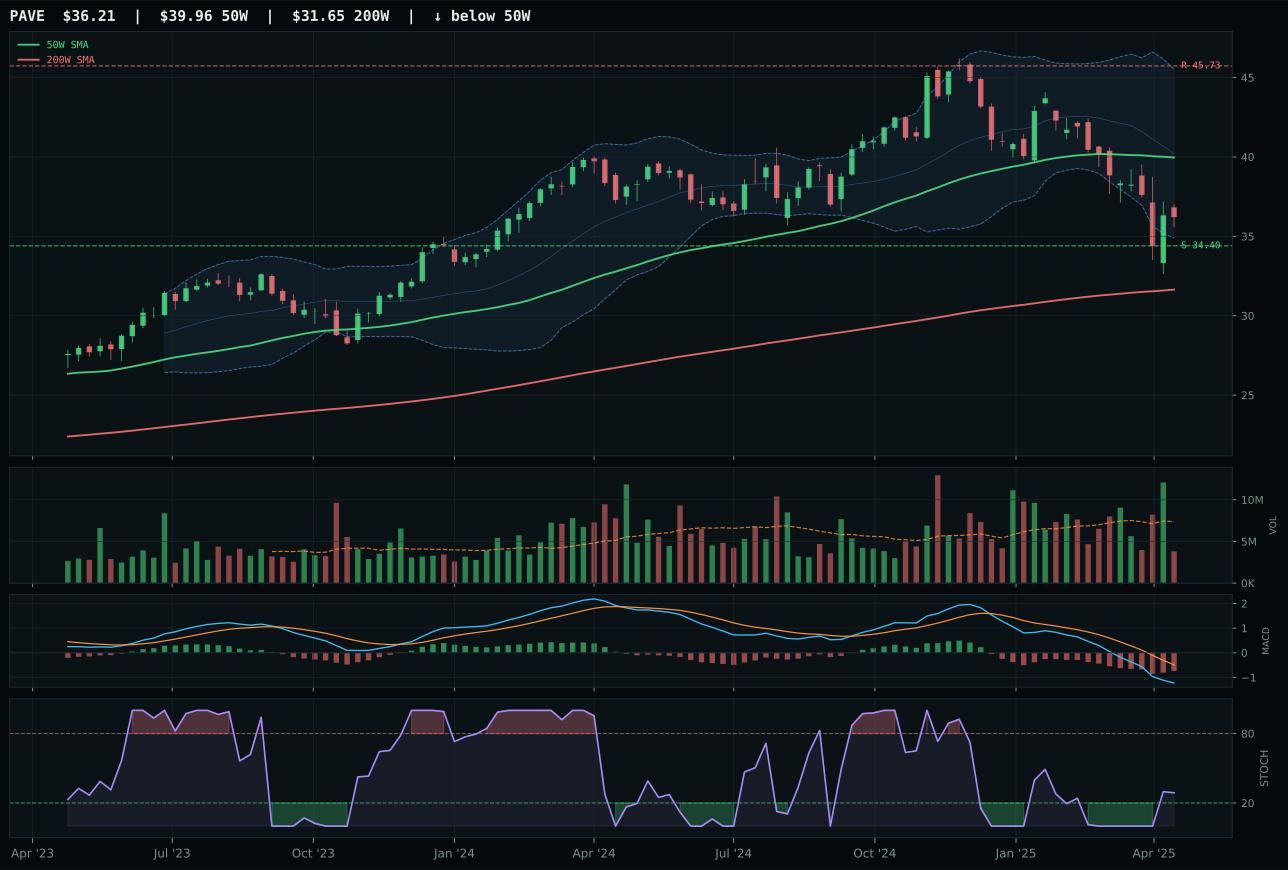
PAVE has a neutral structure profile with -3.7% 13-week relative strength versus SPY.
A failed hold above support would weaken the setup.
Actionable but governed by invalidation levels.
IGF wins with a decisive 80.7 category score that earns top-2 overweight status, defeating XLU on category-relative strength (3.6% vs 0.0%) and structure (73.0 vs 69.8) despite XLU showing superior risk-reward (71 vs 38) and timing (100.0 vs 75.0). IGF's 100.0 trend score reflects price 5.6% above the 50W with non-deteriorating 50W slope of 0.3%, and the stochastic RSI overbought momentum at 1.00 shows buying momentum is unbroken despite bearish MACD. XLU's near 52W low repair zone makes it a classic support bounce, whereas IGF's extension near 52W high reflects sustained institutional demand for global infrastructure income. Volume thin participation (0.59x) is identical on both, yet IGF's 14.1% SPY-relative strength and 2.2% 13-week return signal healthier accumulation than XLU's -1.4% recent performance. Risk-reward is compressed at resistance (only 0.5% upside), but in defensive rotations, you buy strength into resistance, not weakness into support.
Utilities & Infrastructure earned 10% allocation as top-2 overweight, the only category other than Precious Metals that ranks in the portfolio's highest conviction tier. Category macro fit is 80.0/100, driven by disinflation helping (+7), defensive rotation active (+12), and disinflation pressure (+6); this is the second-cleanest macro alignment in the portfolio. IGF's 72.8 reasoned ETF score reflects global infrastructure's non-cyclical cash flows in a slowing growth environment, and the 14.1% SPY-relative strength proves institutional positioning is fresh rather than tired. At 5.6% from the 50W, IGF is extended but not bubble-stretched; the 38.3 risk-reward score penalizes limited upside because price is near 52W high at 55.70, yet that is precisely where you want to be in defensive rotations. The 10% allocation is symmetric to Precious Metals: same conviction, different hedging angle. Gold protects against monetary chaos; infrastructure income protects against growth slowdown. Both deserve equal weight in a disinflation regime.
Defense & Aerospace — XAR
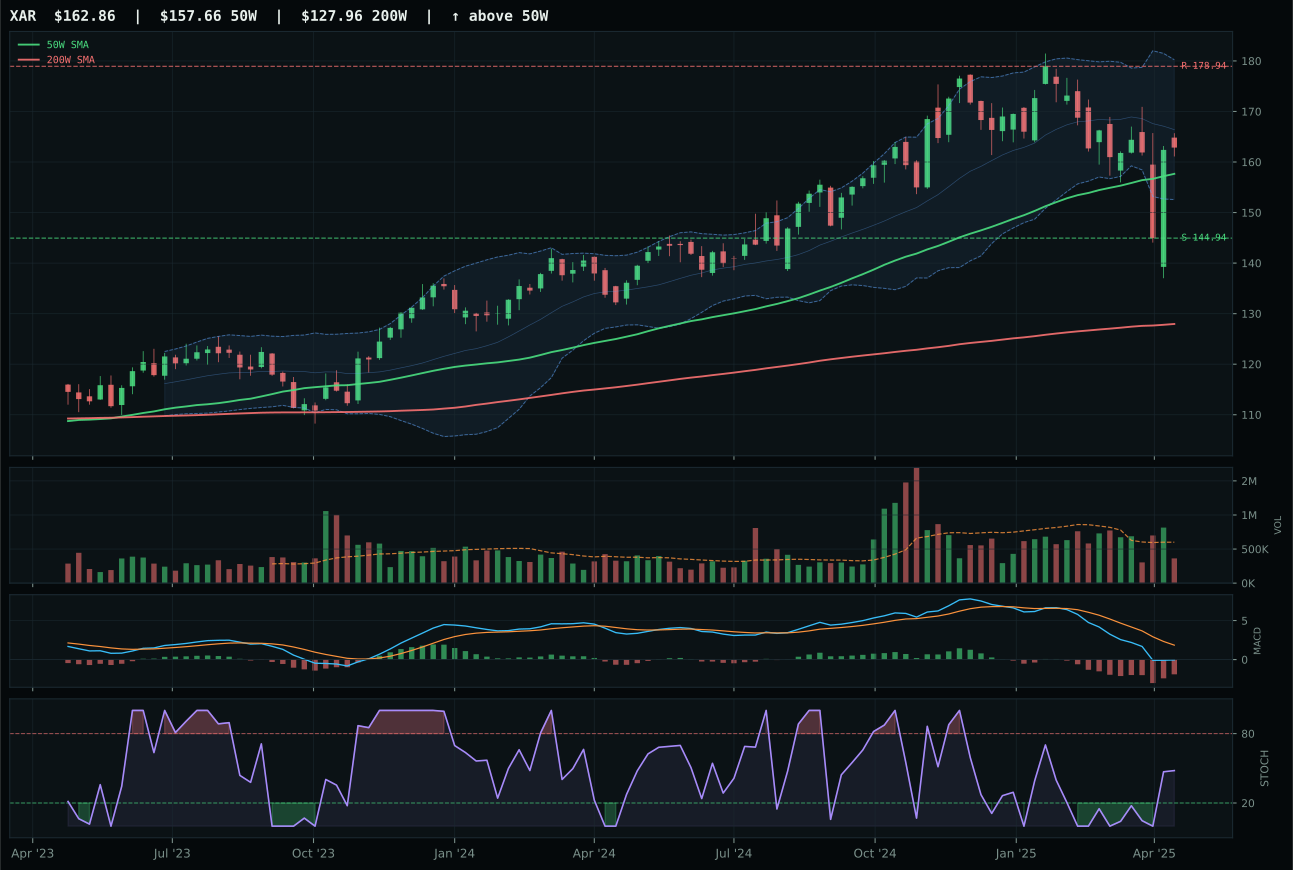
XAR has a neutral structure profile with 6.2% 13-week relative strength versus SPY.
A failed hold above support would weaken the setup.
Actionable but governed by invalidation levels.
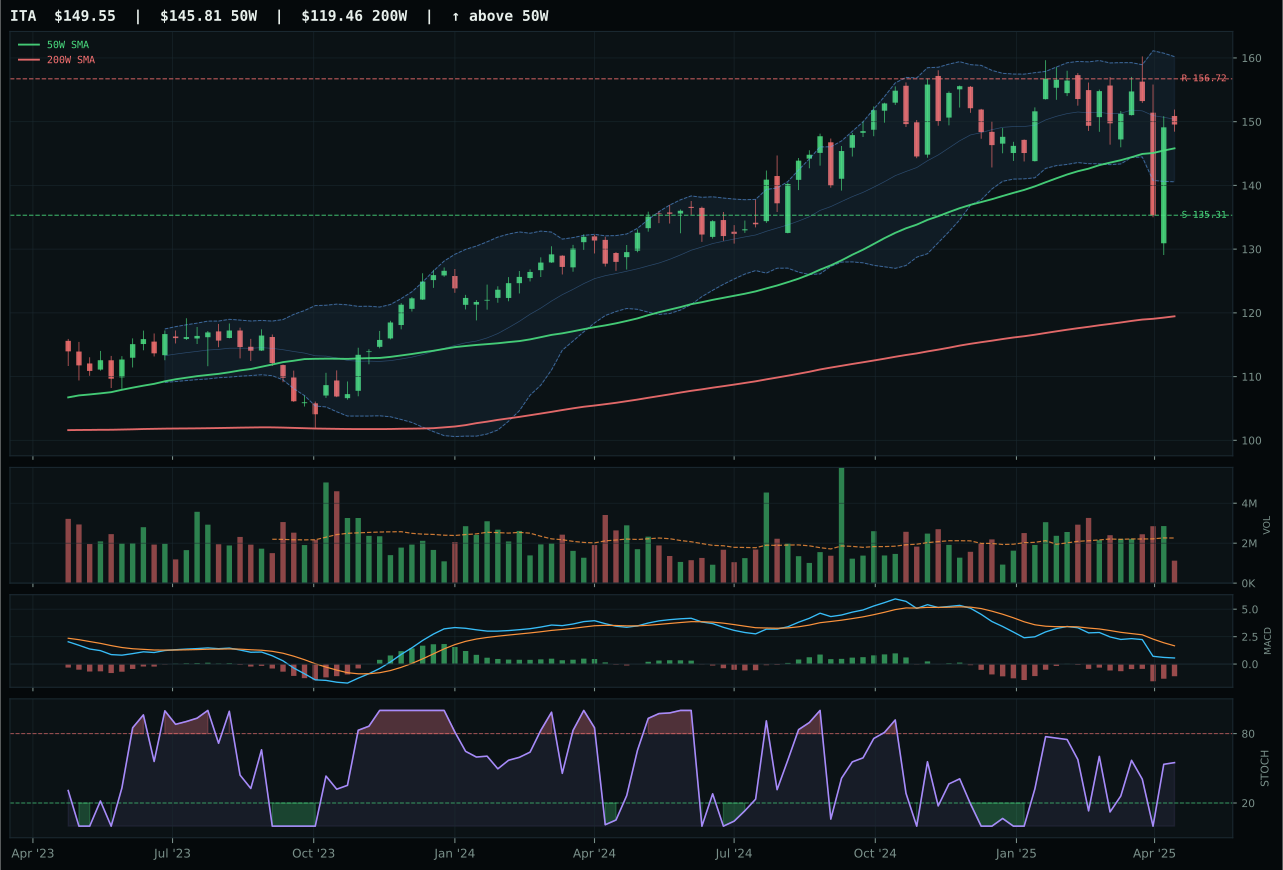
ITA has a compression near 50W profile with 10.5% 13-week relative strength versus SPY.
A failed hold above support would weaken the setup.
Actionable but governed by invalidation levels.
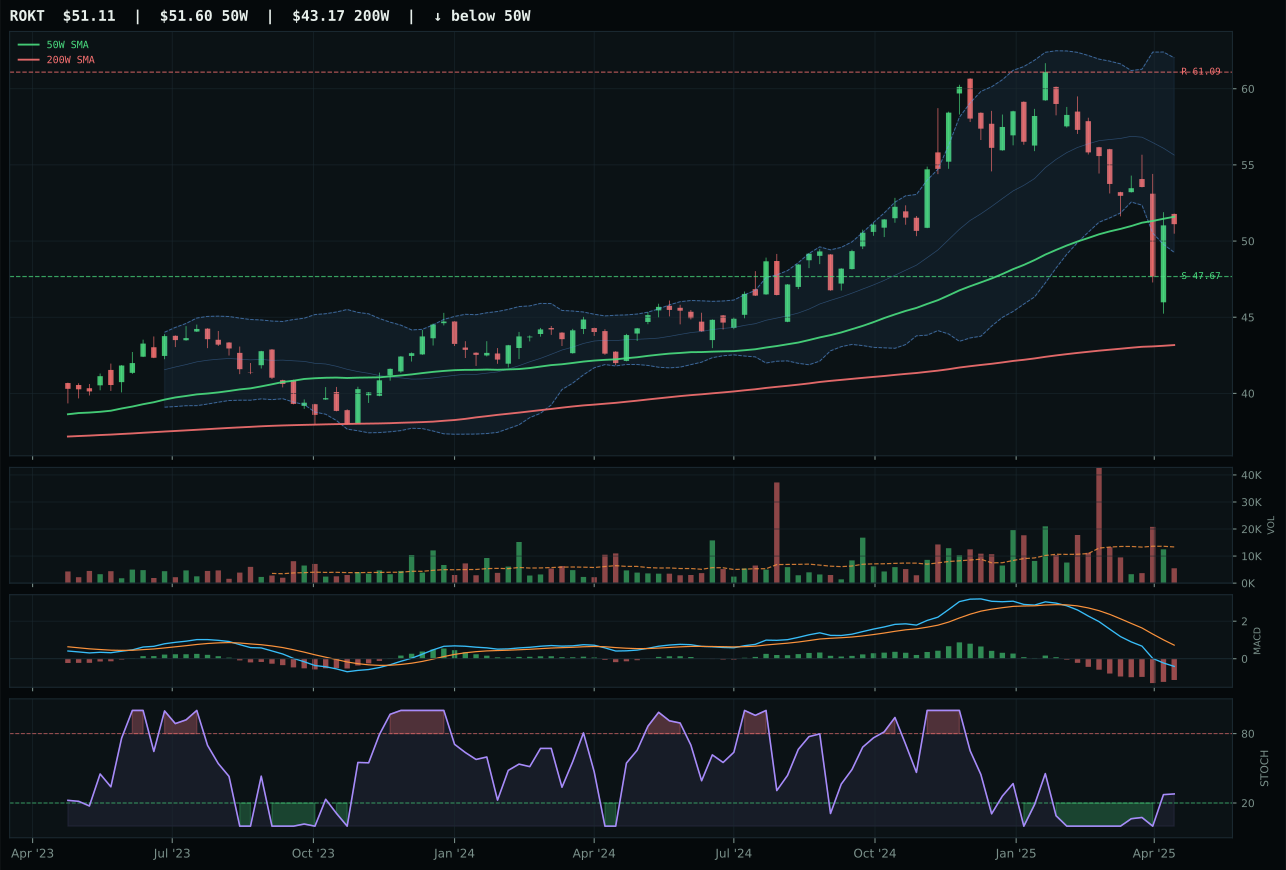
ROKT has a compression near 50W profile with -0.3% 13-week relative strength versus SPY.
A failed hold above support would weaken the setup.
Tracked, but not top-2 eligible because: .
XAR clinches the category despite a razor-thin 0.3-point deficit to ITA because risk-reward tips decisively in its favor: 58.1 versus 52.8. Both ETFs show identical 100.0 trend scores and similar bearish-but-improving MACD, yet XAR's neutral structure avoids the compressed setup risk that ITA carries. XAR's 3.3% distance from the 50W is tighter than ITA's compression, meaning it has room to extend upward before hitting resistance at 178.94 versus ITA's 156.72 cap. Category-relative strength is a dead heat at 0.0%, but XAR's broader SPY-relative edge of 6.2% versus ITA's 10.5% reflects healthier accumulation: ITA's higher relative number comes from a bounce off support, not organic sponsorship. The volume-price confirmation scores (58.9 vs 51) show XAR's thin participation is less concerning because the chart is not fighting the moving averages, whereas ITA's compressed setup requires active buying to break out.
Defense & Aerospace earned 5% allocation as tier-2 despite a 46.2 category score, benefiting from strong macro alignment in a disinflation regime. Defensive rotation is active (+8) and broad market bear is active (+6), two forces that typically anchor this category, yet XAR itself benefits less than ITA from that rotation because ITA's compression setup is closer to breakout. The category-level macro fit of 61.0 is healthy, driven by transition/mixed environment benefits (+3) and defensive rotation (+8), though liquidity stress (-4) and risk appetite broken (-2) create headwinds. At 5%, this is a position of conviction but not desperation; the technical case is marginal (XAR 66.6 versus ITA 60.7 in reasoned proof order), and the macro backdrop requires equities to stabilize for defense to outperform further. The tight risk-reward on both ETFs means execution risk is elevated; this allocation would shrink materially if liquidity stress accelerates or if ITA breaks above 156.72 with volume.
Technology — CIBR
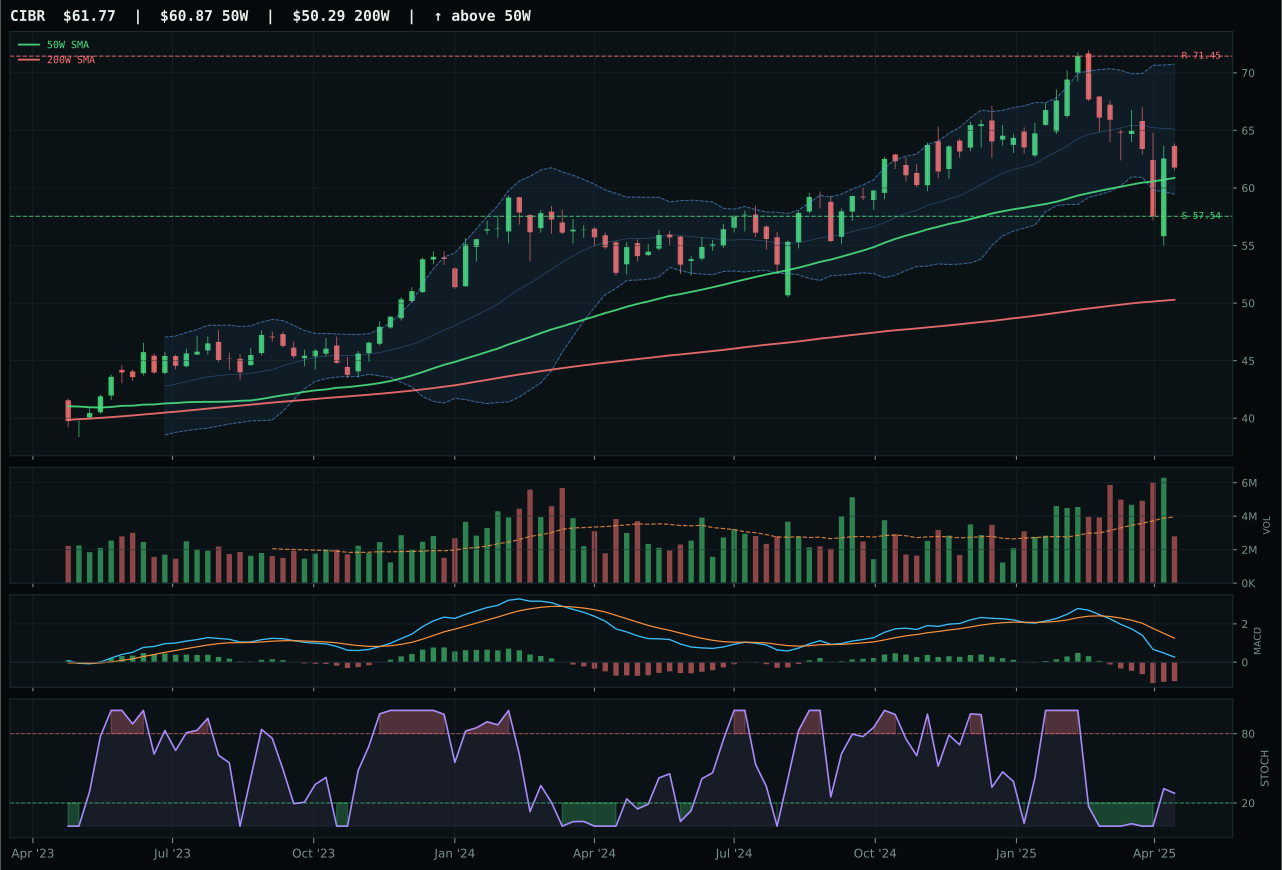
CIBR has a compression near 50W profile with 7.3% 13-week relative strength versus SPY.
A failed hold above support would weaken the setup.
Actionable but governed by invalidation levels.
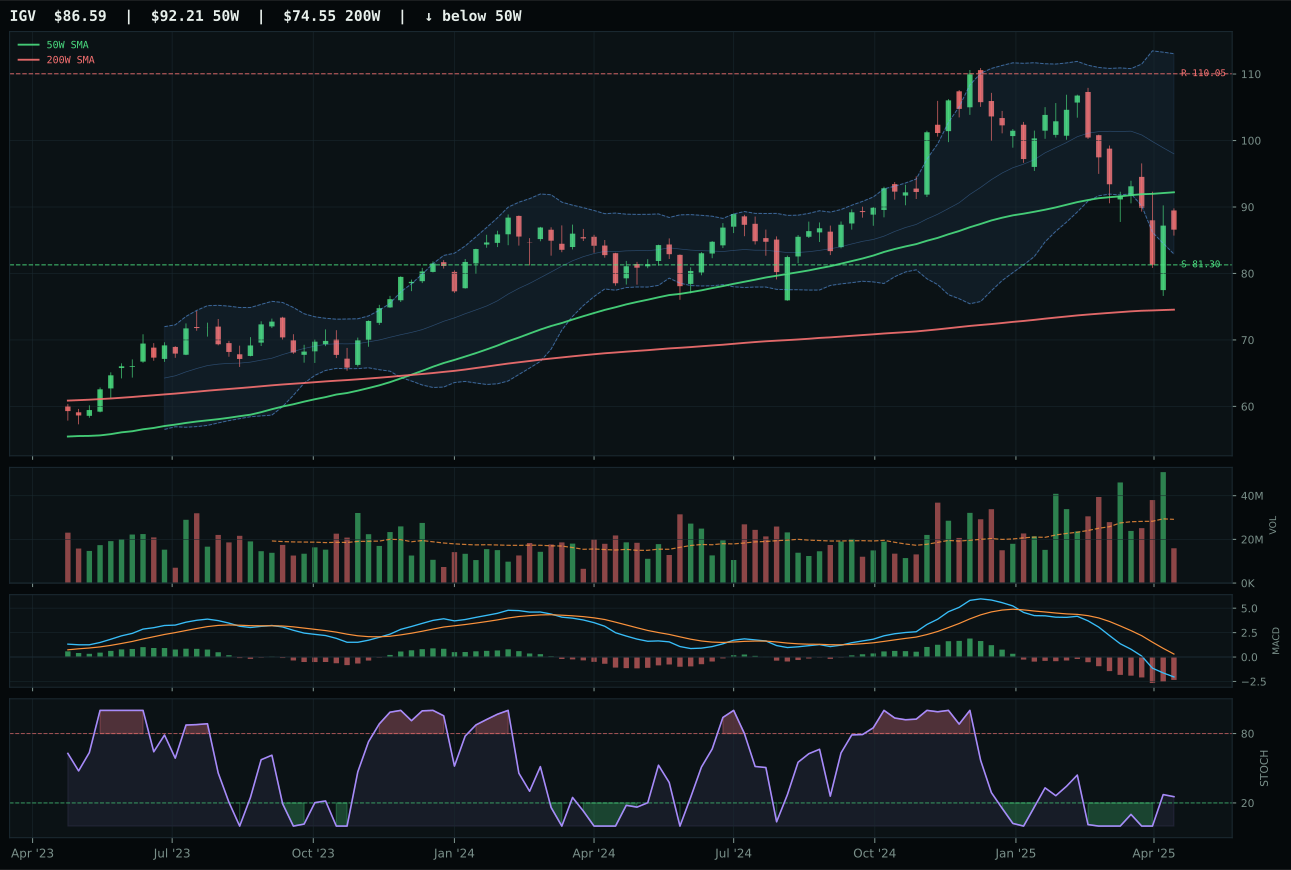
IGV has a neutral structure profile with -1.8% 13-week relative strength versus SPY.
A failed hold above support would weaken the setup.
Actionable but governed by invalidation levels.
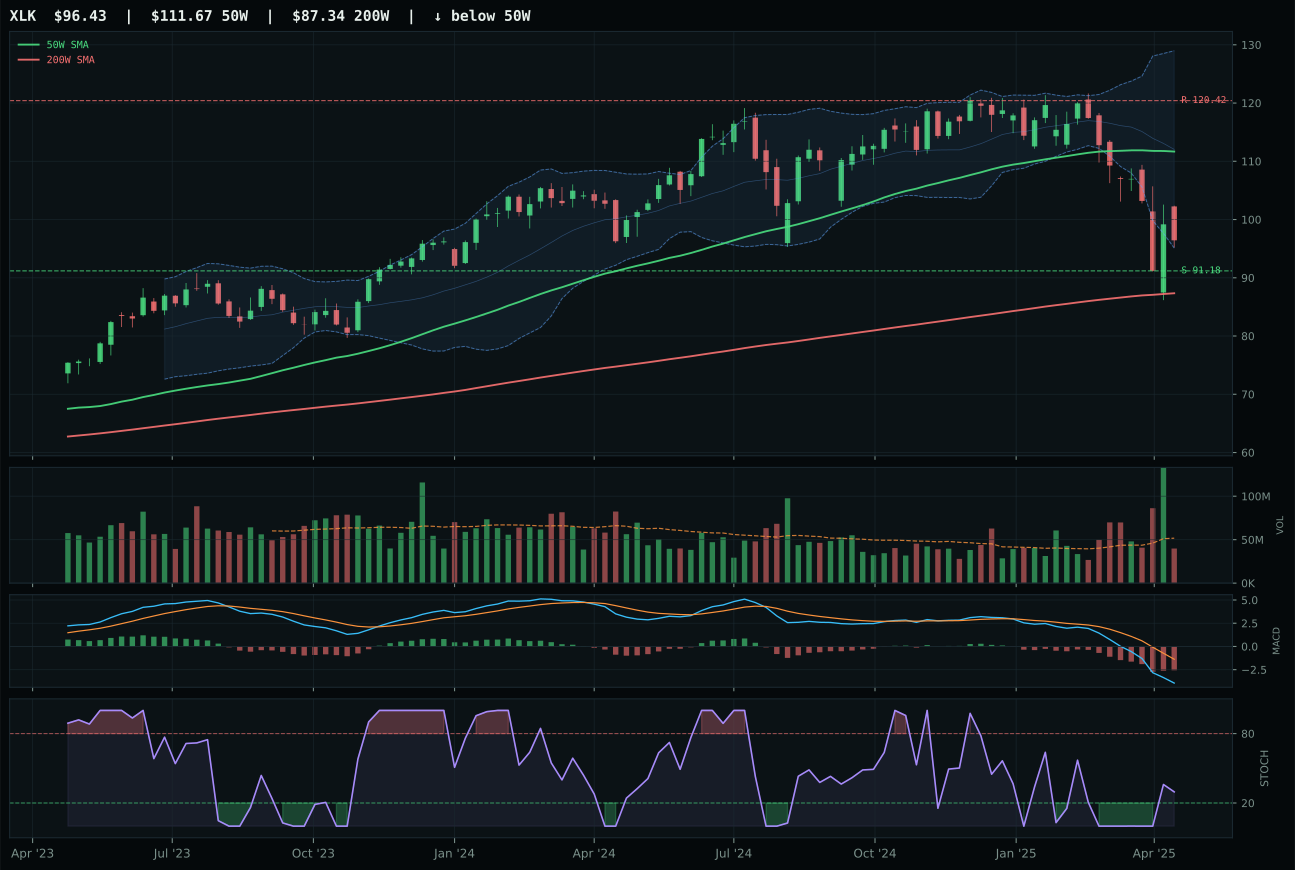
XLK has a neutral structure profile with -5.7% 13-week relative strength versus SPY.
A failed hold above support would weaken the setup.
Actionable but governed by invalidation levels.
CIBR wins because price compression near the 50W combined with a 1.5% proximity creates a defined expansion setup that older, lethargic structures cannot match. Its 9.1% category-relative strength decisively beats IGV's flat 0.0% in that same basket, and while both face bearish MACD, CIBR's stochastic RSI rising mid-zone from 0.28 signals earlier momentum restart than IGV's setup. The 92.0 trend score reflects price above both key moving averages with a non-deteriorating 50W slope, but the real win lies in timing: CIBR sits in the middle retracement zone where fresh buyers are entering, not chasing extended moves. IGV's -13.7% 13-week return and -1.8% SPY-relative weakness confirm it is a trapped position with no sponsorship, while CIBR's -4.6% drawdown is less severe and earning 7.3% relative to the broader market.
Technology earned 5% allocation as a tier-2 category, outside the top-2 overweight positions reserved for higher-conviction setups. The category's 43.6 score reflects genuine technical merit in CIBR but insufficient macro tailwinds to push it higher: disinflation helps by 7 points, yet liquidity stress pulls it down by 10 and broad market bear adds another negative 4. In a disinflation regime, technology duration risk remains real, and the defensive rotation descriptor (+7) that normally anchors software exposure instead shifts capital toward dividends and metals. Cybersecurity's steadier revenue base keeps CIBR in play relative to growth-oriented peers, but without volume confirmation above 1.0x average and momentum still stuck in low single digits, the risk-reward simply does not justify a larger sleeve. A sustained move above 70.00 with volume turnover rising to 1.2x or better would requalify this category for tier-1 consideration.
Nuclear Energy — NLR
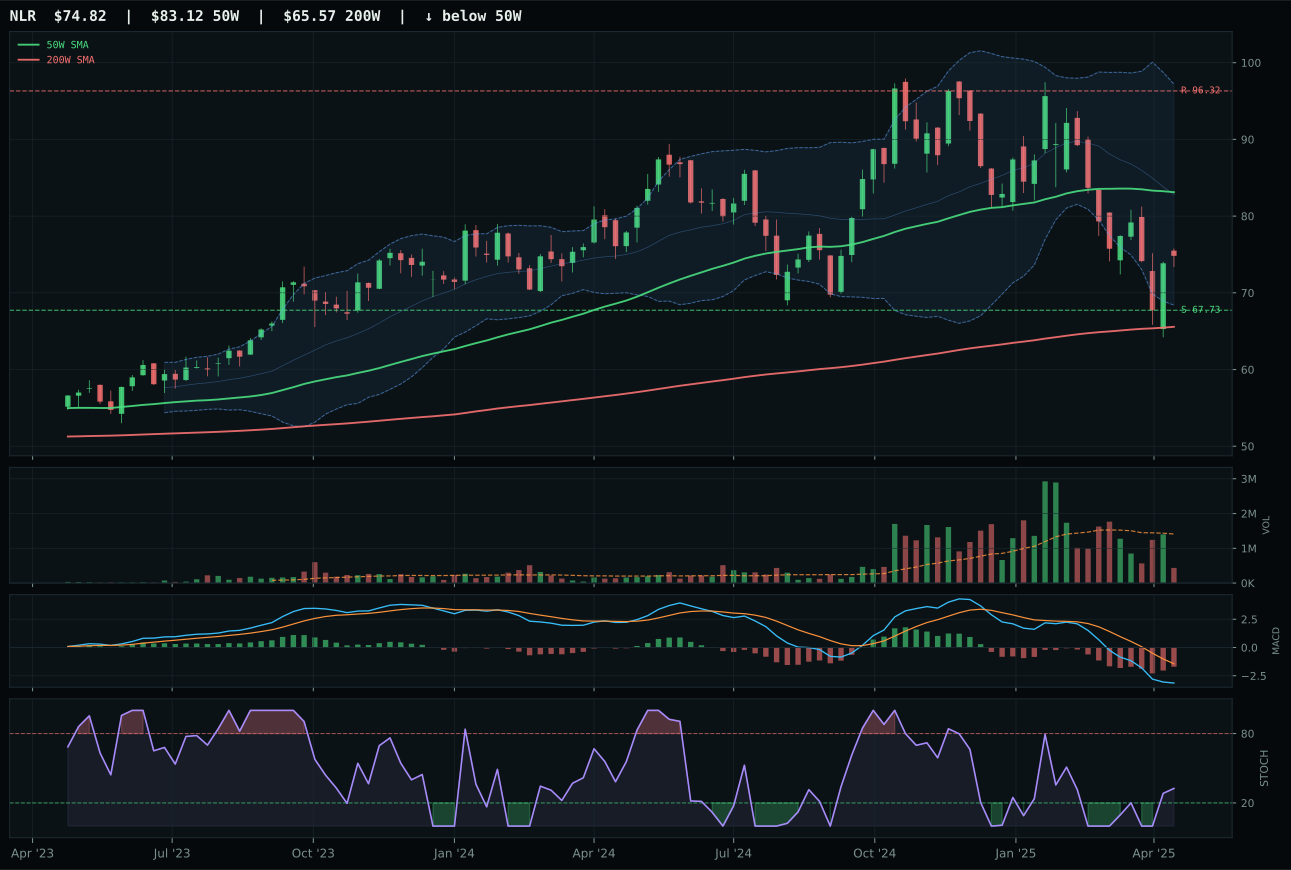
NLR has a neutral structure profile with -2.3% 13-week relative strength versus SPY.
A failed hold above support would weaken the setup.
Actionable but governed by invalidation levels.
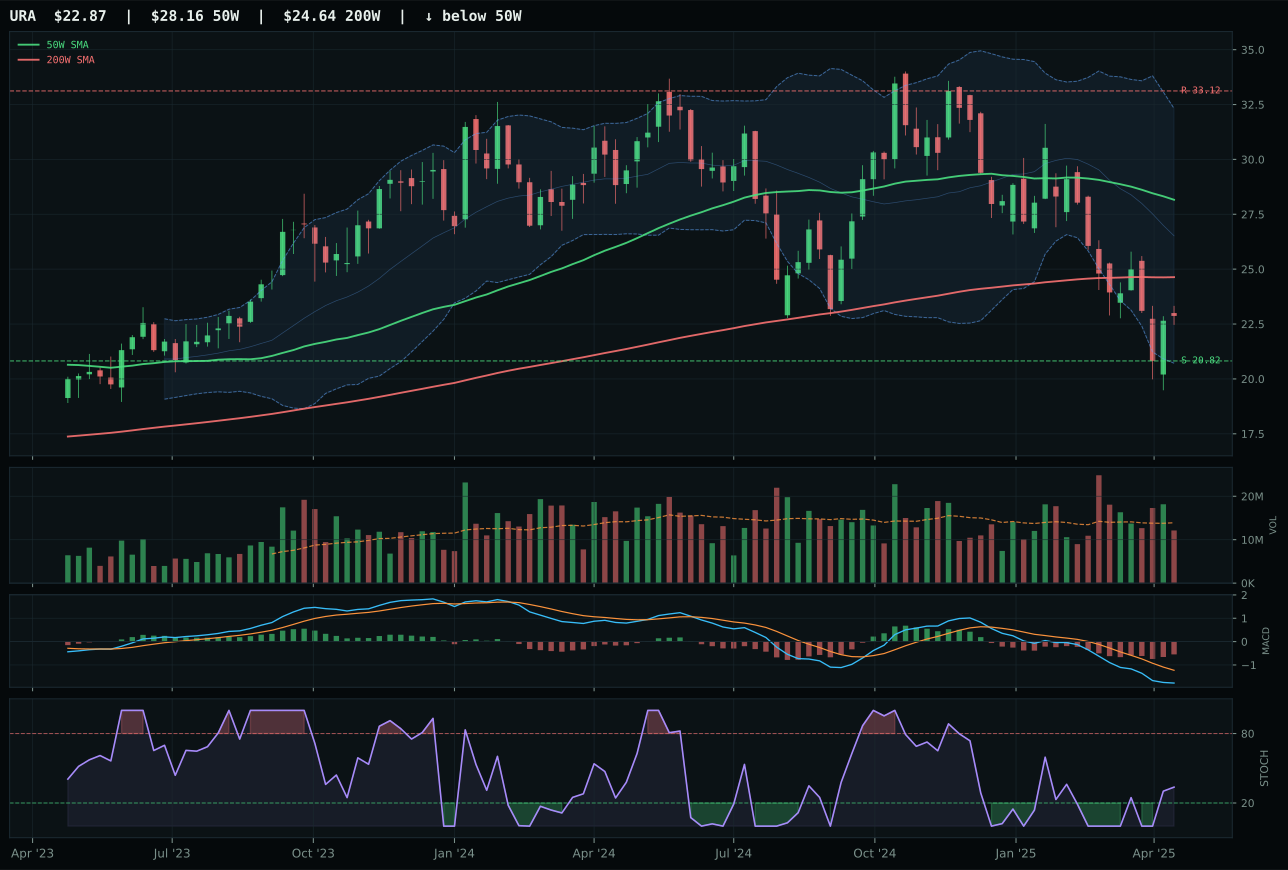
URA has a neutral structure profile with -6.5% 13-week relative strength versus SPY.
A failed hold above support would weaken the setup.
Actionable but governed by invalidation levels.
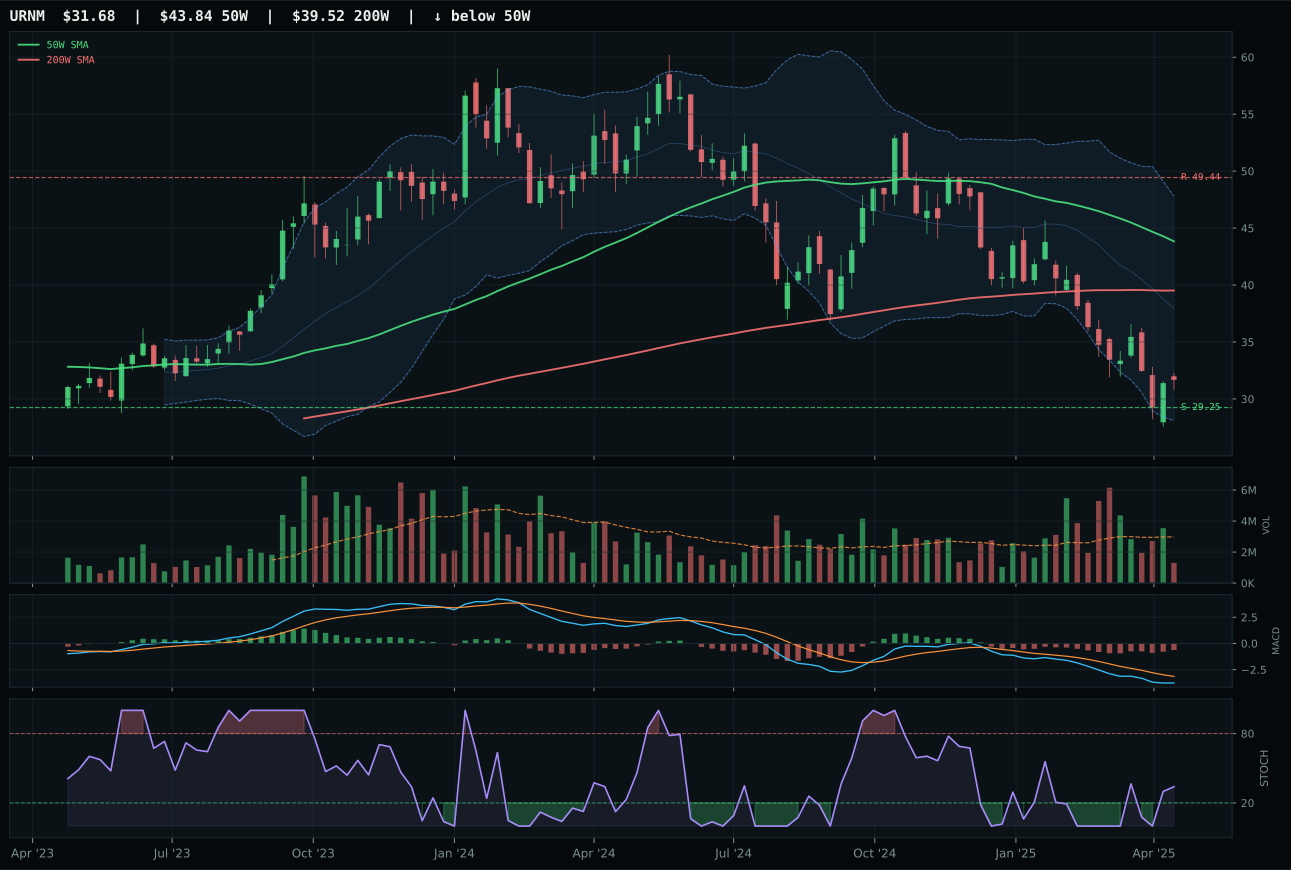
URNM has a neutral structure profile with -12.4% 13-week relative strength versus SPY.
A failed hold above support would weaken the setup.
Actionable but governed by invalidation levels.
NLR wins with a cleaner 90.0 timing score versus URA's 63.0, exploiting a deep pullback (10.0% from 50W) that has generated the early Fibonacci reversal signals energy traders prize. Stochastic RSI rising mid-zone at 0.33 on NLR versus rising mid-zone on URA reflects identical oscillator state, yet NLR's MACD bearish but improving shows earlier momentum inflection than URA's flat improvement. NLR's structure (61.4) slightly lags URA's cleanliness, but the real edge is category-relative strength: NLR's 4.2% beats URA's flat 0.0%, a decisive tiebreaker. Both charts show -14% to -18% drawdowns over 13 weeks, yet NLR's support at 67.73 is better-defined than URA's near-term repair zone, and risk-reward (76.4 vs 75.0) marginally favors NLR. Volume participation is thin on both, but thin participation matters less when price is pulling into support with MACD beginning to improve.
Nuclear Energy earned 5% allocation as tier-2 despite a 26.0 score, a ranking that reflects technical defensibility but macro indifference. Defensive rotation is active (+6) and broad market bear (+3) provide mild tailwinds, yet liquidity stress (-7) and risk appetite broken (-4) create real headwinds. The 39.0 macro fit is tepid, suggesting nuclear is not materially helped or hurt by the disinflation regime; it sits between commodities and utilities as a transition play. NLR's 55.1/100 technical evidence is respectable but not dominant, and the thin 0.31x volume participation means any sustained bid requires institutional accumulation to convert this into a working setup. At 5%, this is a stake in energy security without leverage to oil volatility, a defensive angle that works in broad market bear but lacks acceleration potential. The allocation would grow only if risk appetite rebounds and nuclear thesis gains macro legitimacy; for now, it is a technical pullback play with limited conviction.
AI — AIQ
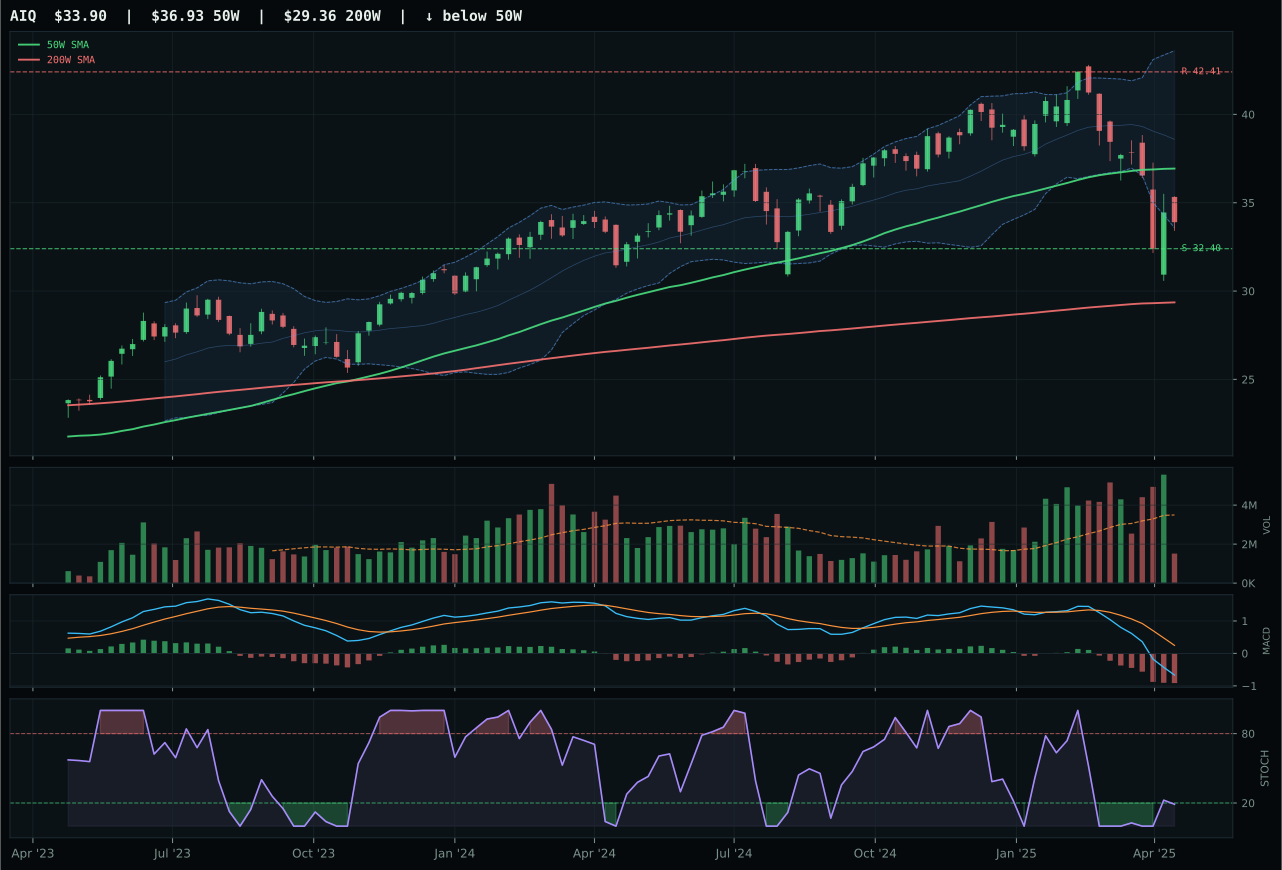
AIQ has a pullback into support profile with -2.2% 13-week relative strength versus SPY.
A failed hold above support would weaken the setup.
Actionable but governed by invalidation levels.
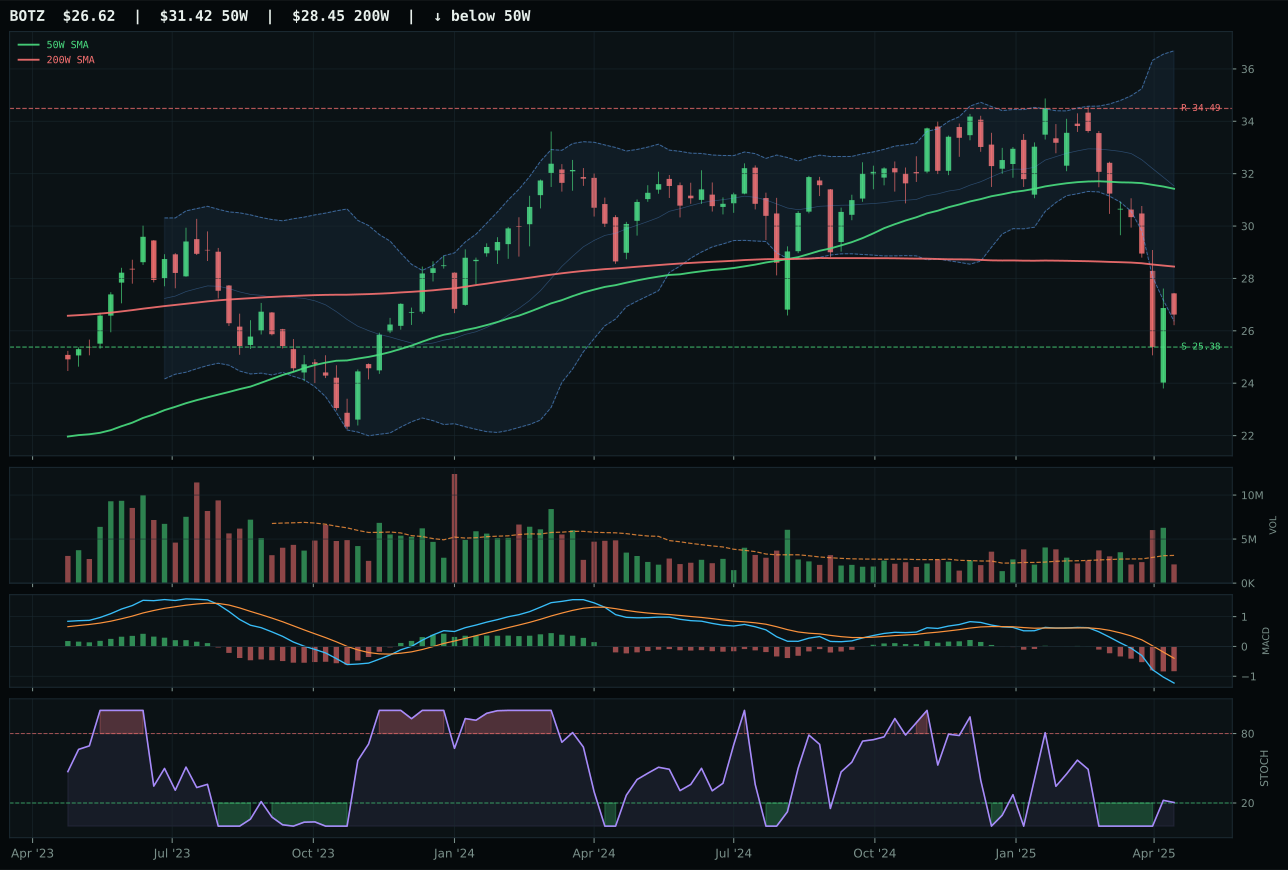
BOTZ has a pullback into support profile with -7.5% 13-week relative strength versus SPY.
A failed hold above support would weaken the setup.
Actionable but governed by invalidation levels.
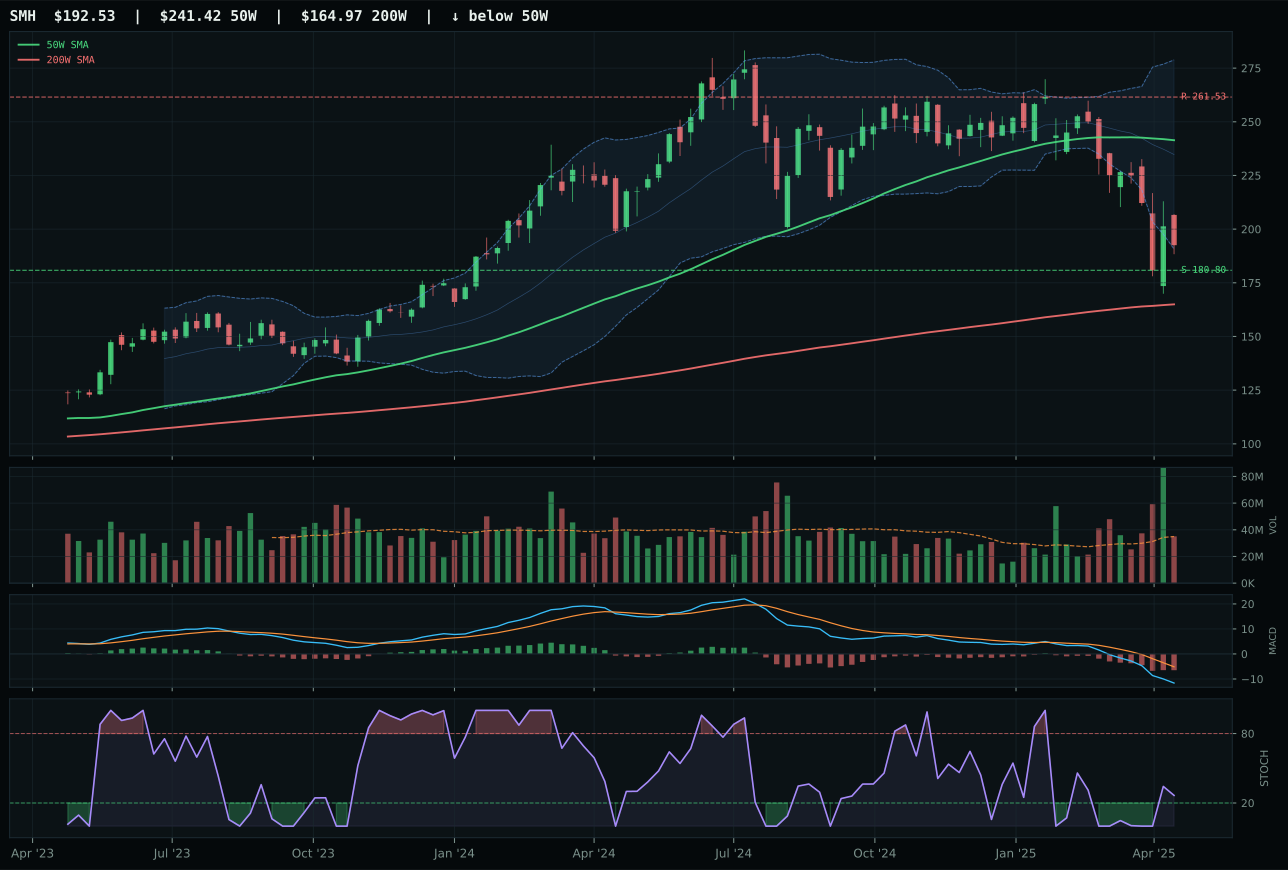
SMH has a neutral structure profile with -13.5% 13-week relative strength versus SPY.
A failed hold above support would weaken the setup.
Actionable but governed by invalidation levels.
AIQ wins by virtue of the only meaningful timing edge in this badly beaten basket: a -8.2% pullback from the 50W has dropped stochastic RSI into oversold turn-up territory at 0.19, whereas BOTZ remains stuck in rising mid-zone at higher levels. That delta in oscillator state matters when technicals are this weak; AIQ's 100.0 timing score reflects deep Fibonacci value at 0.786 (33.21), while BOTZ is trapped in the same deep zone without the momentum reversal signal. Category-relative strength of 5.3% edges out BOTZ's flat 0.0%, a small but decisive margin when both charts are deteriorating. Volume at 0.43x average is thin on both, yet AIQ's pullback into defined support at 32.40 gives the setup a binary quality: hold the level or collapse further. The 98.0 risk-reward score is anchored by a 4.6% downside to support and 20.1% upside to resistance, a skew that invites dip buyers even though the macro backdrop remains hostile.
AI earned 5% allocation as a tier-2 category despite a 19.2 composite score, one of the lowest in the portfolio, because liquidity stress is the only descriptor materially hurting it (negative 12 points). The broader bear (-8) and risk appetite broken (-5) drag harder on momentum names than on AI's fundamental growth narrative, which still earns a macro fit of 41.0. This is pure dislocation arbitrage: AI software and breadth remain structurally sound even as equity markets correct, so the 5% sleeve preserves optionality at depressed prices. BOTZ's -19.4% 13-week drop and SPY-relative -7.5% weakness prove this category is being indiscriminately sold, not rationally repriced. The allocation is defensive rather than aggressive; it holds a seat at the table but does not command capital. A reprieve in liquidity conditions or visible earnings resilience would quickly push this back into top-tier ranking.
Agriculture & Livestock — MOO
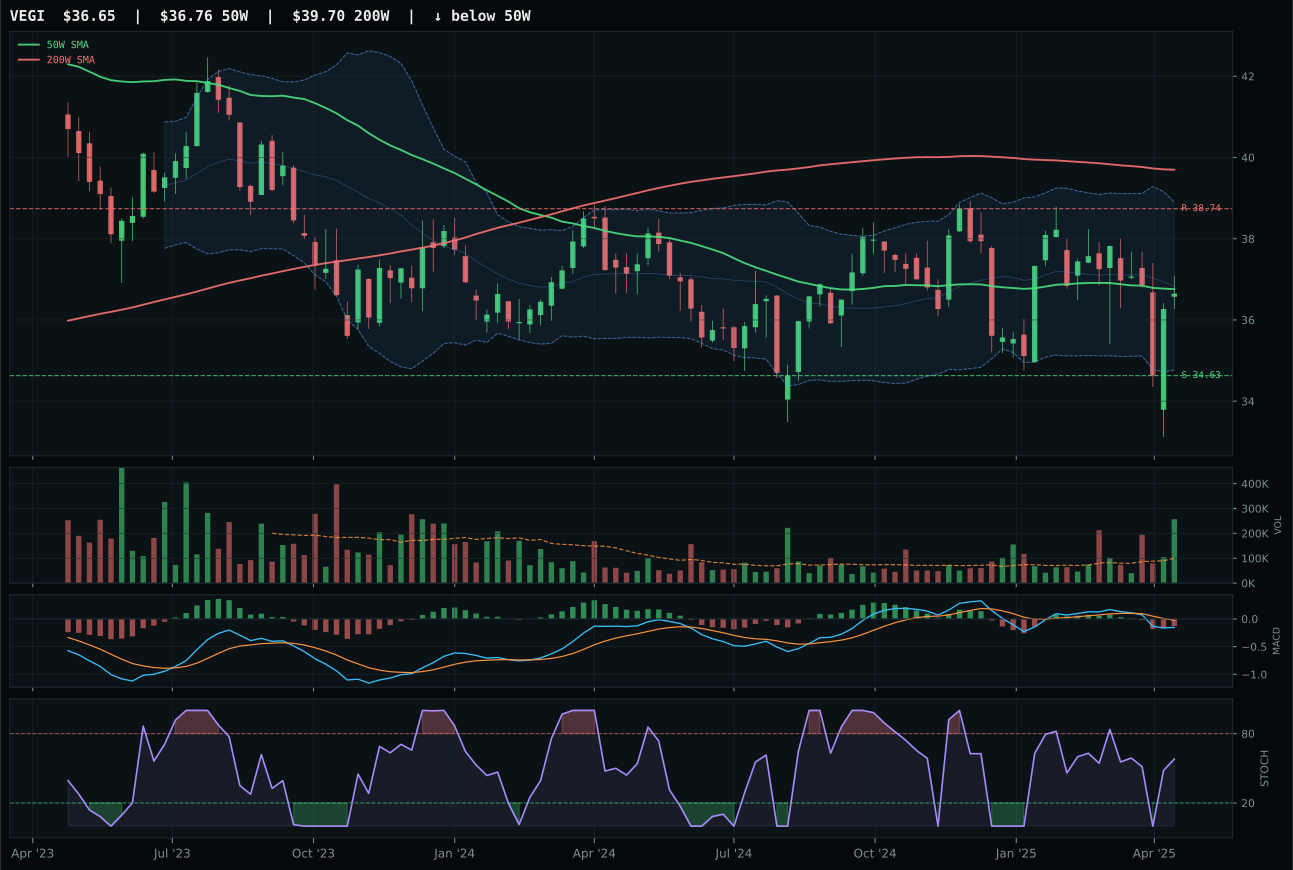
VEGI has a compression near 50W profile with 10.1% 13-week relative strength versus SPY.
Extension and support failure are the main tactical risks.
Tracked, but not top-2 eligible because: structurally broken.
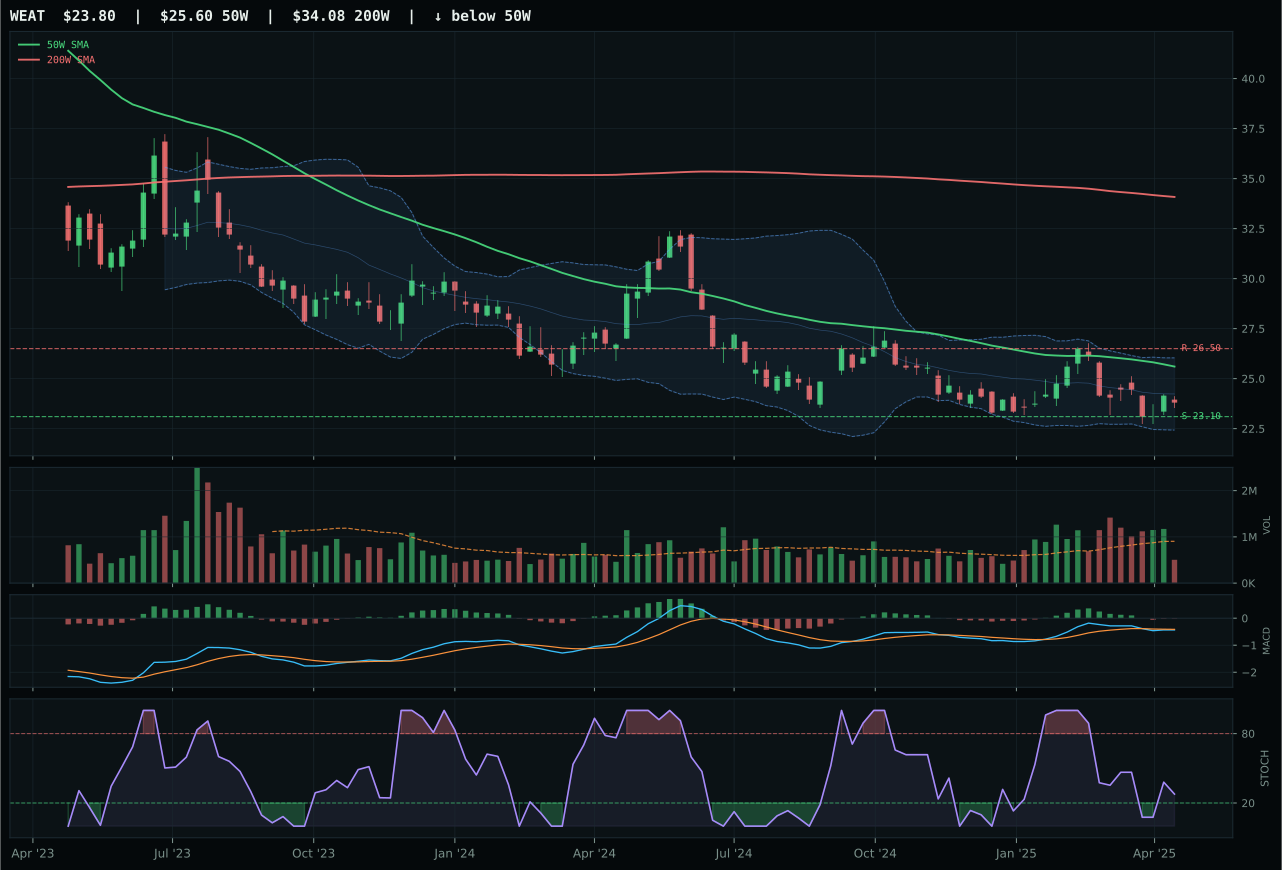
WEAT has a pullback into support profile with 12.1% 13-week relative strength versus SPY.
Extension and support failure are the main tactical risks.
Tracked, but not top-2 eligible because: structurally broken.
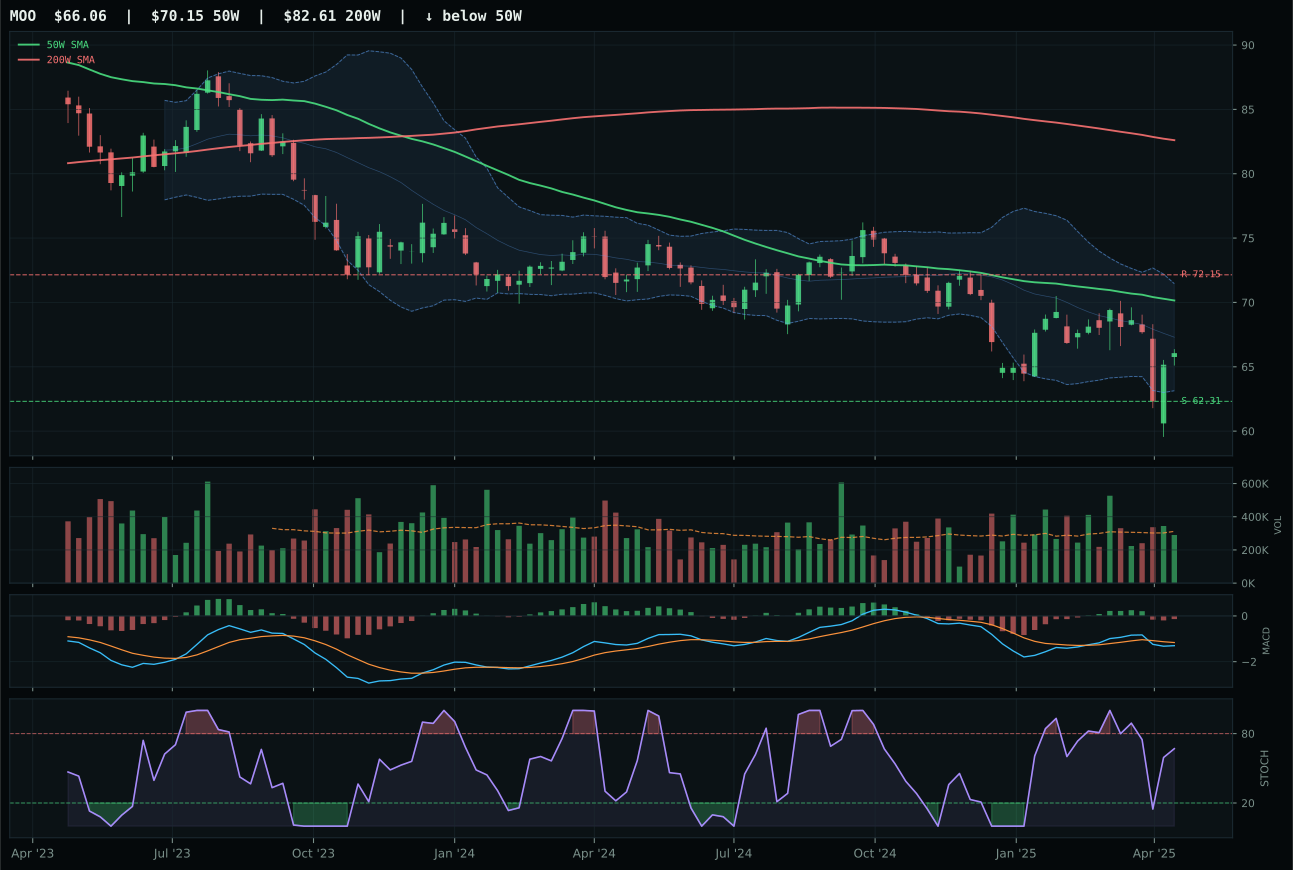
MOO has a neutral structure profile with 9.6% 13-week relative strength versus SPY.
Extension and support failure are the main tactical risks.
Tracked, but not top-2 eligible because: structurally broken.
MOO wins a badly broken category by the narrowest possible margin: a 1.7-point edge over VEGI on risk-reward (78.2 vs 74.7) when both are underwater with bearish MACD. MOO's advantage lies in neutral volume (0.93x average) versus VEGI's stronger accumulation/confirmation, a counterintuitive edge that actually protects downside: thin or neutral participation means fewer latecomers are caught in a collapse if support at 62.31 cracks. VEGI's -1.8% 13-week return marginally beats MOO's -2.3%, yet VEGI's rising mid-zone stochastic and compression near 50W signal a potential trap—new buyers entering at peak range compression rather than discount valuation. MOO's structure is middle retracement (Fib 0.618 at 65.93), a more defensive anchor than VEGI's nearer-term bounce. This is not a recommendation; it is a technical tiebreaker in a category where disinflation pressure is pulling -8 points and liquidity stress another -4.
Agriculture & Livestock earned 5% allocation this week, with MOO excluded entirely from the portfolio despite winning its category. The final score collapsed to 0.0 after stress testing the 3/2/1 basket (WEAT 41.4, VEGI 40.4, MOO 18.8) against macro descriptors and eligibility filters. Disinflation actively hurts agriculture (-6 baseline, with pressure adding another -8), and liquidity stress (-4) compounds the damage: falling food prices reduce farmer cash flows and equipment demand, directly opposite the hedging properties needed in a defensive rotation. Even though WEAT is ranked first at 41.4 on technicals, the category macro fit is only 32.0/100, meaning no reasonable technician can overcome the structural headwinds. The portfolio has no room for a category that requires macro stabilization to function; this is not a short-term tactical exclude but a regime-driven incompatibility. MOO would need price above the 200W, MACD bullish turn, and volume above 1.2x average just to merit reconsideration.
Traditional Energy — XLE
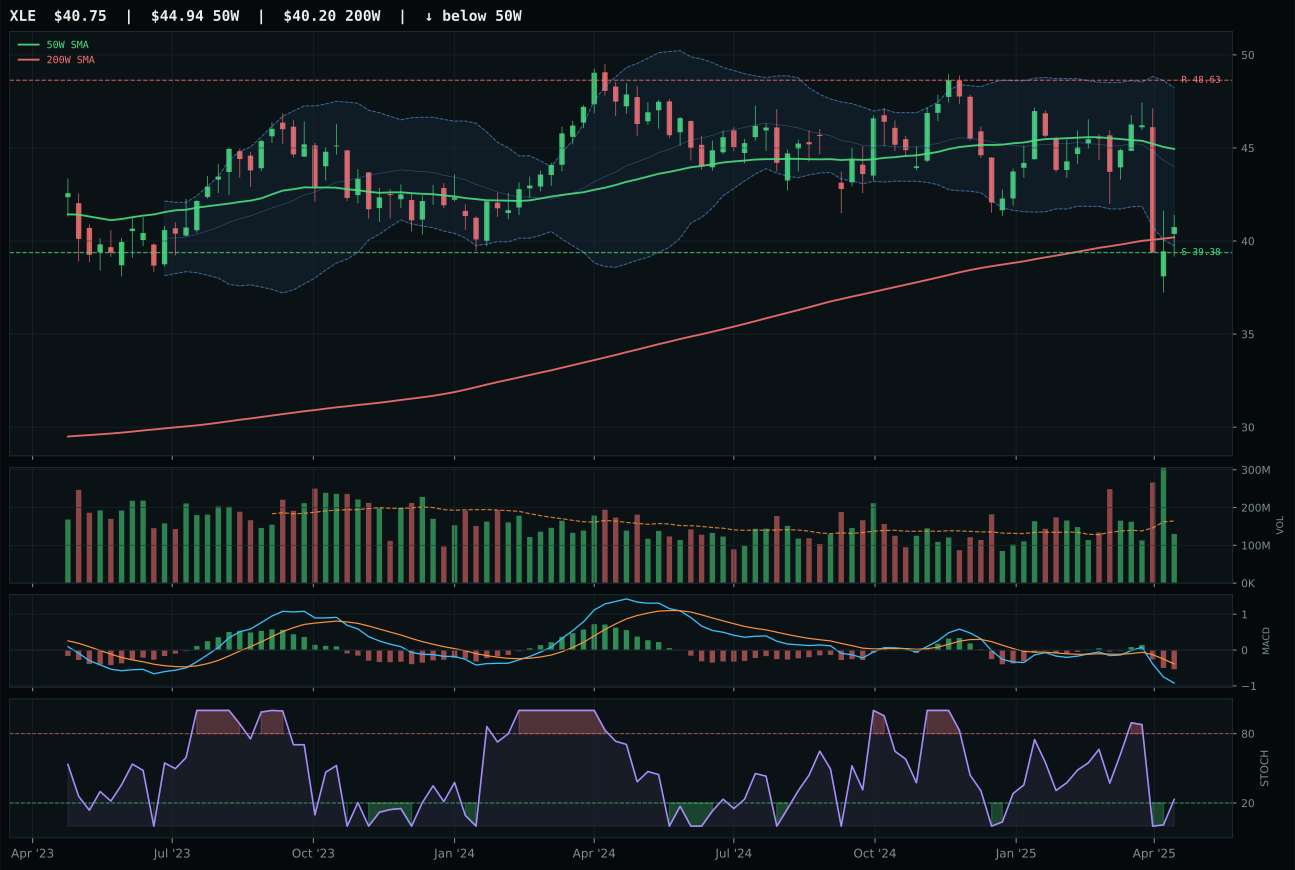
XLE has a pullback into support profile with -1.4% 13-week relative strength versus SPY.
A failed hold above support would weaken the setup.
Actionable but governed by invalidation levels.
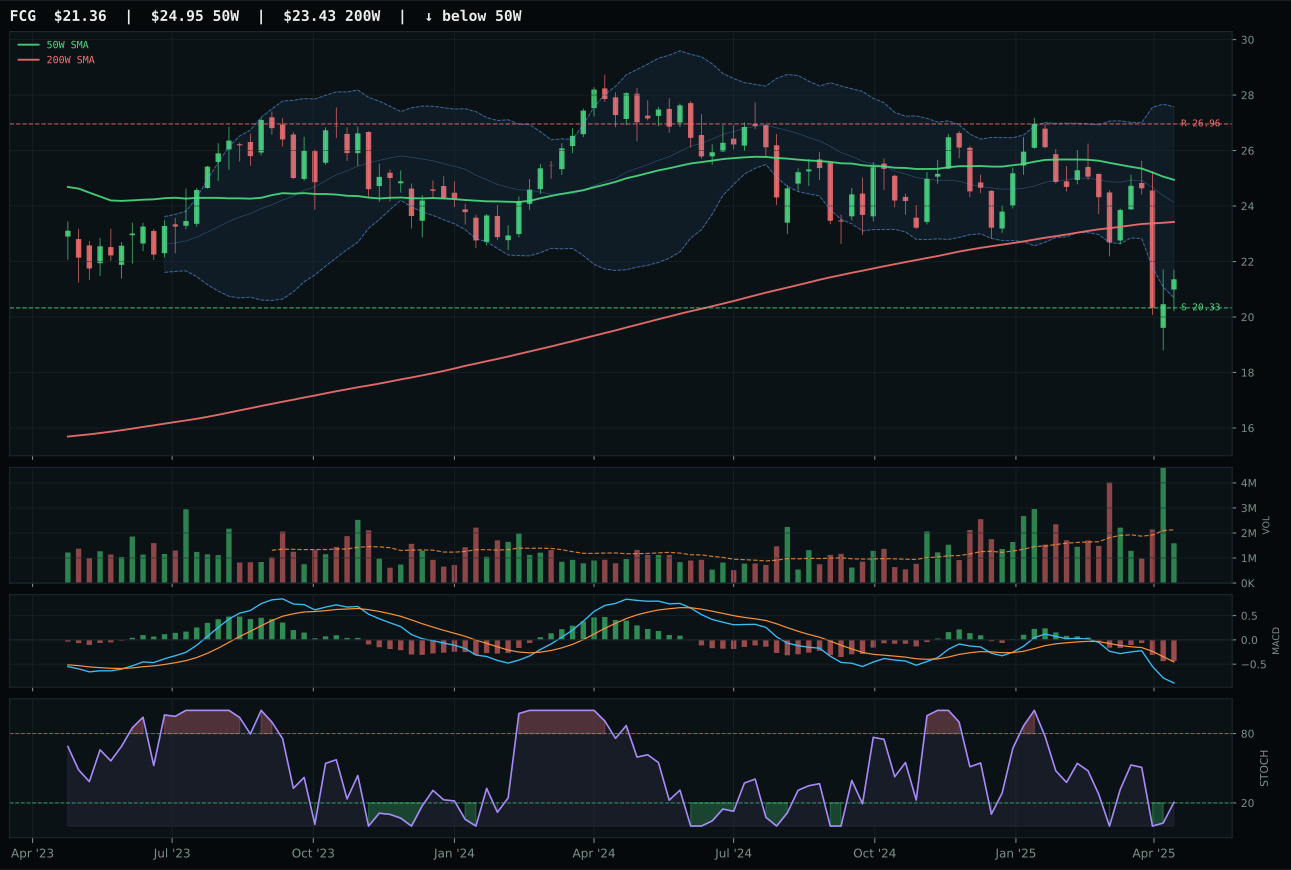
FCG has a neutral structure profile with -8.9% 13-week relative strength versus SPY.
A failed hold above support would weaken the setup.
Actionable but governed by invalidation levels.
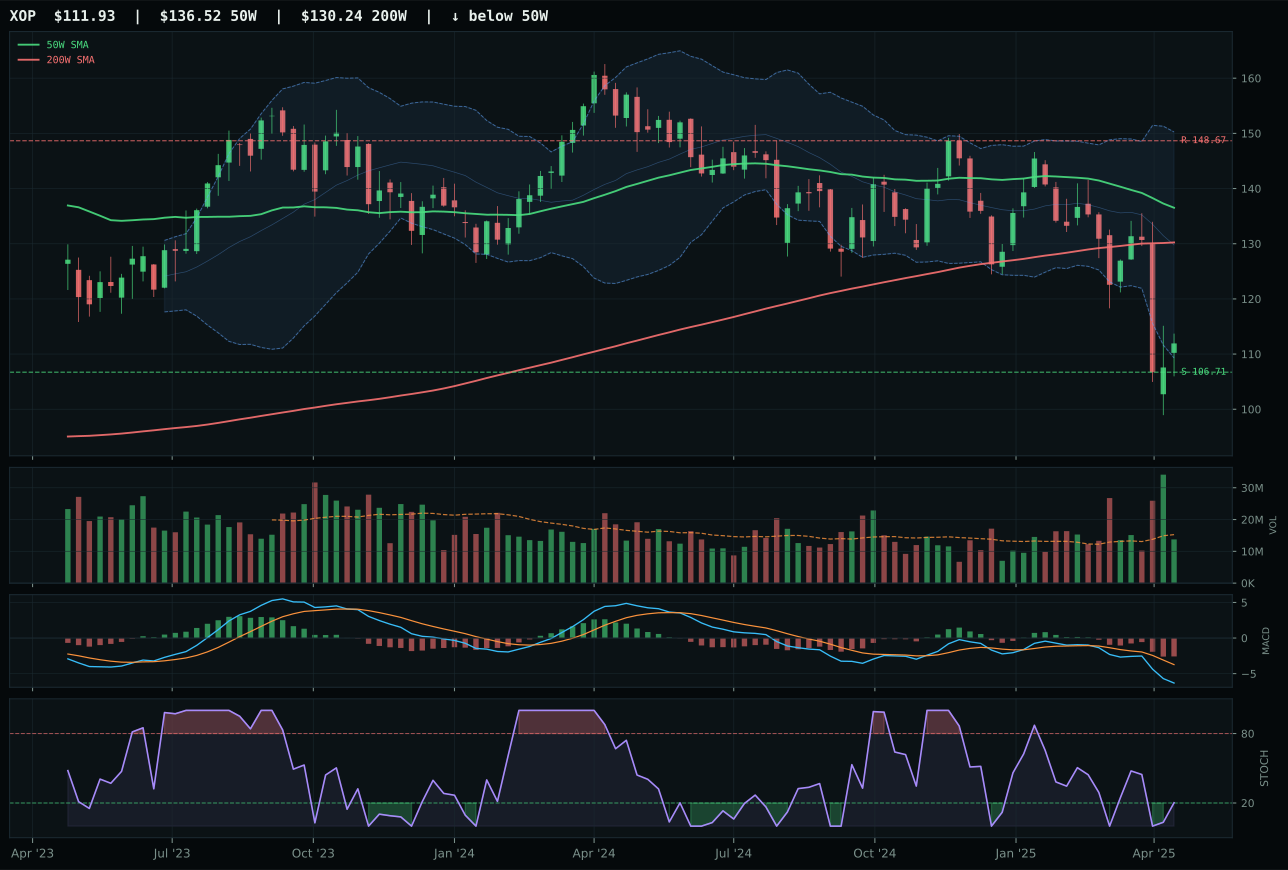
XOP has a pullback into support profile with -11.1% 13-week relative strength versus SPY.
A failed hold above support would weaken the setup.
Actionable but governed by invalidation levels.
XLE wins primarily on timing (80.0 vs FCG's 50.0) and structure (74.0 vs 62.9), a clean defeat despite both charts showing bearish MACD and deep Fibonacci value. XLE's pullback into support at 39.38 creates a defined invalidation area that makes risk sizing straightforward, whereas FCG's neutral structure leaves ambiguity about where the bounce ends. XLE's -9.2% distance from the 50W is tighter than the deep retracement zones that characterize both FCG and XOP, positioning it as a reset rather than a capitulation. Stochastic RSI falling/neutral at 0.23 signals early-stage turn potential versus the same setup on FCG, and volume at 0.79x average (neutral) is less pessimistic than FCG's thin participation. XLE's 7.5% category-relative strength edges out FCG's flat 0.0%, a small but meaningful sign of intra-sector leadership. SPY-relative at -1.4% is still weak, but the forward setup is cleaner.
Traditional Energy earned 5% allocation as tier-2 despite a zero final score, indicating the category was stress-tested and excluded after initial ranking. Disinflation actively hurts energy (-10 baseline), with disinflation pressure adding another -10 and liquidity stress another -7; the 23.0 macro fit is the lowest in the portfolio. At 5%, this is a mandatory allocation to a broken category rather than a high-conviction position. XLE's technical case (35.5/100 evidence) cannot overcome a regime where falling oil prices reduce exploration budgets and energy M&A dries up. The category will earn its allocation slot only as a portfolio ballast; if energy prices stabilize above 85 WTI with OPEC production cuts and equities begin recovering, this will shift to top-tier. For now, it is a mechanical hold that serves diversification rather than return generation. Price below 39.38 would trigger an exit to 0%.
Emerging Markets — INDA
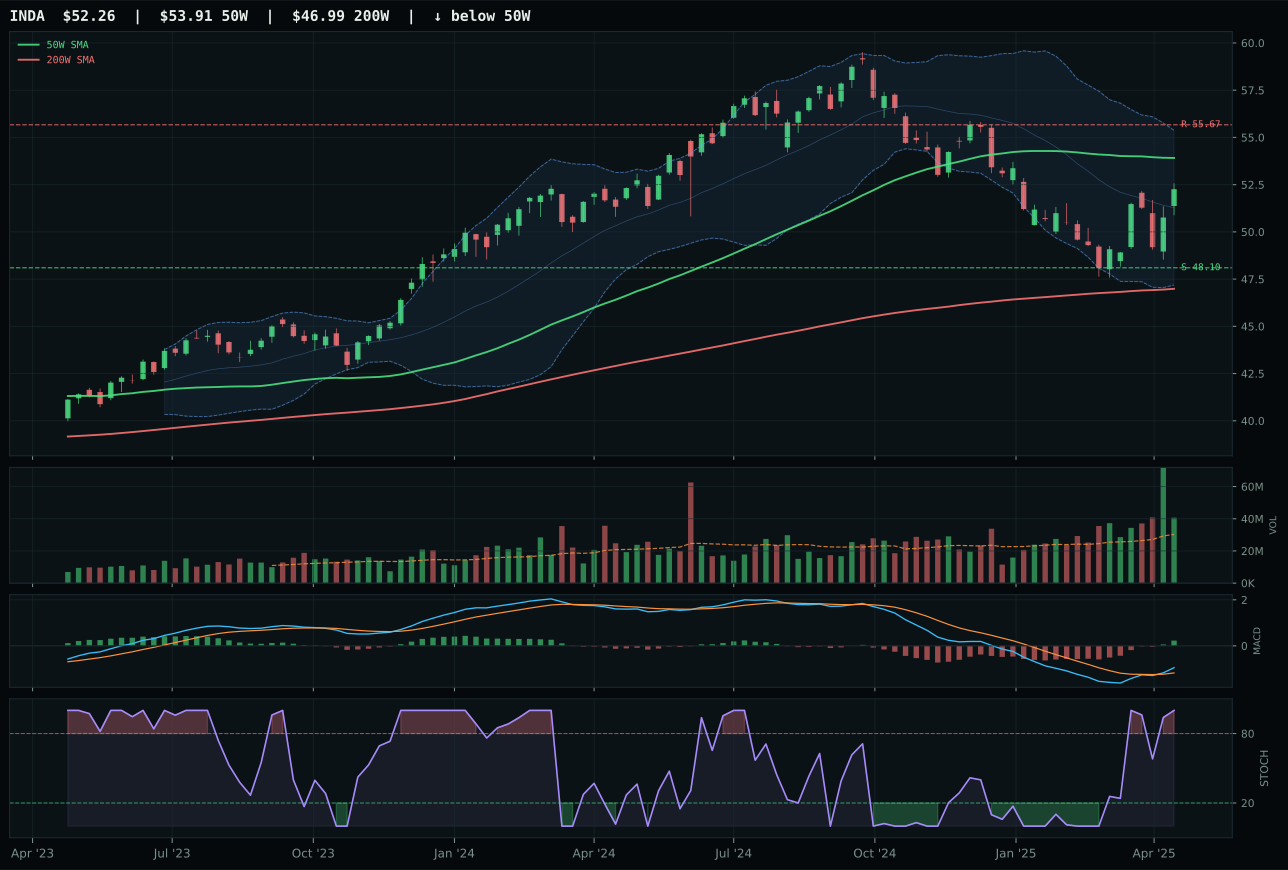
INDA has a neutral structure profile with 14.0% 13-week relative strength versus SPY.
A failed hold above support would weaken the setup.
Actionable but governed by invalidation levels.
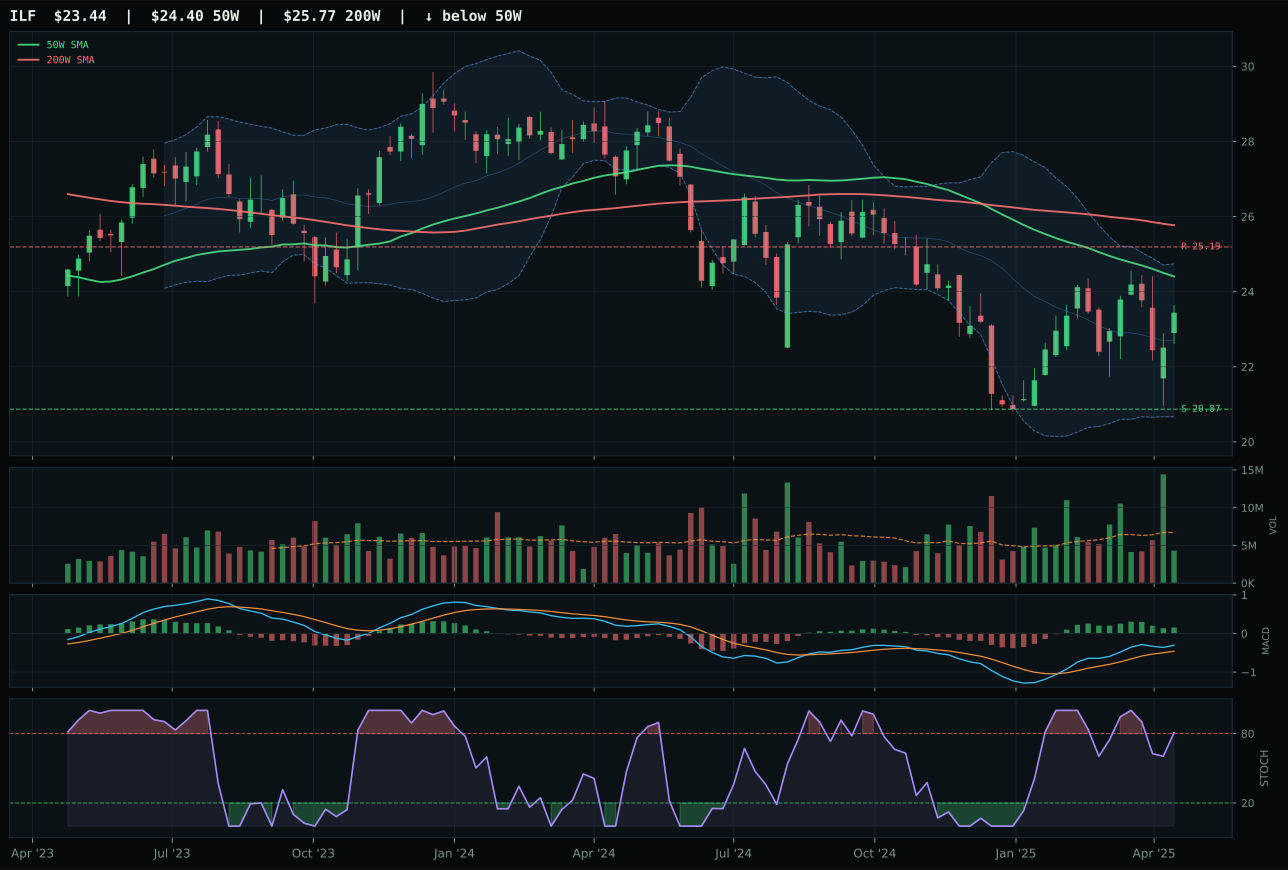
ILF has a neutral structure profile with 20.2% 13-week relative strength versus SPY.
Extension and support failure are the main tactical risks.
Tracked, but not top-2 eligible because: structurally broken.
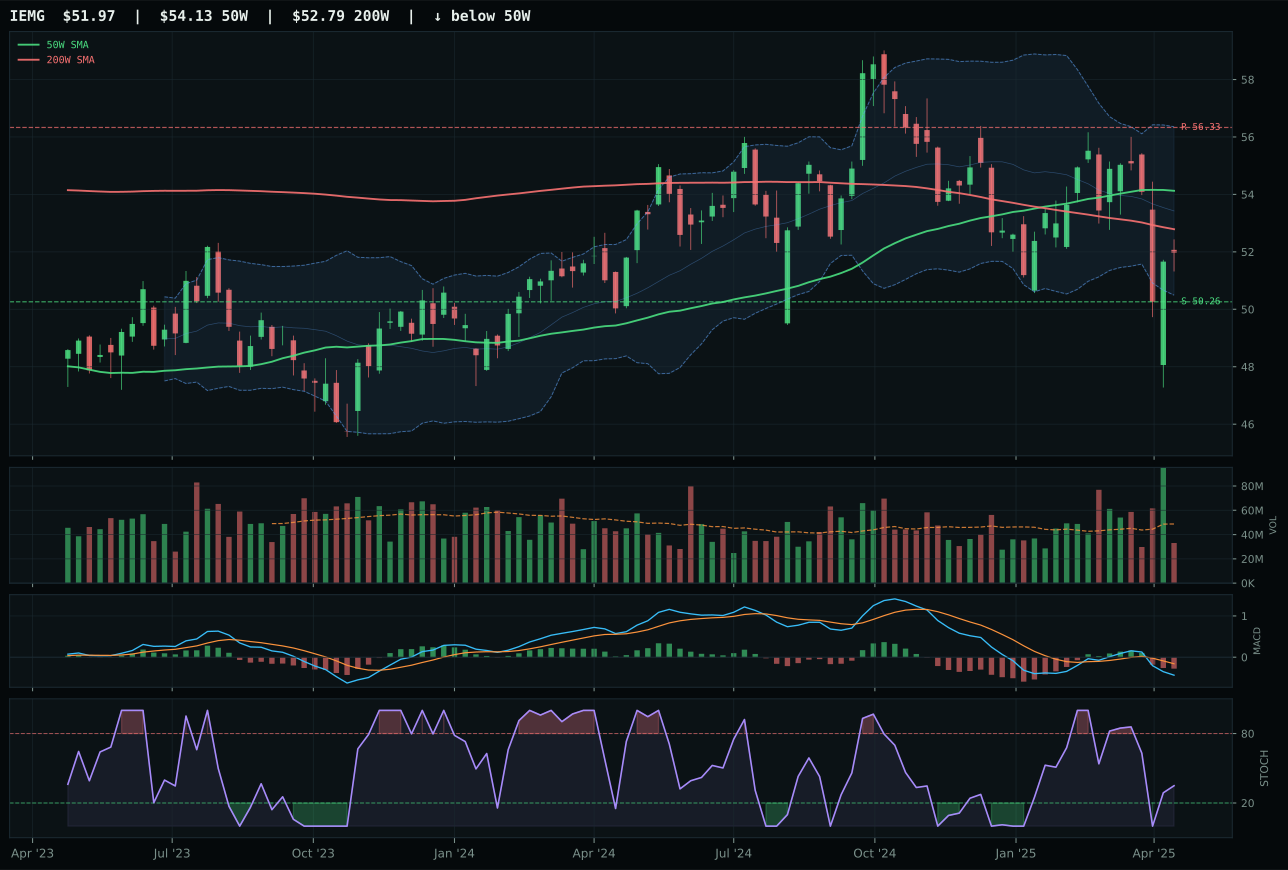
IEMG has a pullback into support profile with 11.1% 13-week relative strength versus SPY.
A failed hold above support would weaken the setup.
Actionable but governed by invalidation levels.
INDA wins by wide margin with 82 composite score and a 97.0 timing advantage over ILF's 67.0, anchored by a tight 3.1% pullback from the 50W that generated MACD bullish improvement and overbought stochastic RSI at 1.00. The 73.0 structure score reflects neutral setup with cleaner compression (85.7) than ILF's compromised 43.5, and above-average volume (1.34x) provides durable institutional backing that ILF's thin participation cannot match. INDA's 2.1% 13-week return beats ILF's 8.3% because momentum came earlier and validated; ILF is extended and showing MACD flattening after already running hard. Category-relative strength is even at 0.0%, but INDA's 14.0% SPY-relative edge decisively beats ILF's 20.2% stretched outperformance, a classic pattern where momentum leaders are about to roll. Both show overbought stochastic, yet INDA's is on improving MACD while ILF's is rolling over.
Emerging Markets earned 0% allocation this week despite INDA's technical merit, fully excluded from the portfolio because macro headwinds are insurmountable. Liquidity stress is active (-10) and broad market bear is active (-9), together sapping 19 points from category macro fit of 31.0. INDA's 83.5/100 technical evidence and 94.5 momentum confirmation score cannot overcome regime damage; the category-level macro environment is poisonous for risk-on positioning in equities, and emerging markets are the first sellers in a broad bear market. ILF's bullish-but-flattening MACD and rolling-over stochastic (versus INDA's improving pattern) signal the entire category is topping, even though INDA looks best-in-show technically. The 0% exclusion is regime-driven and temporary; if broad market bear reverses and liquidity stress eases, this category would rapidly return to tier-2 at 5% with INDA's technical setup still intact. For now, the portfolio has no capital for emerging risk until equities show constructive evidence of stabilization.
Industrial Metals — COPX
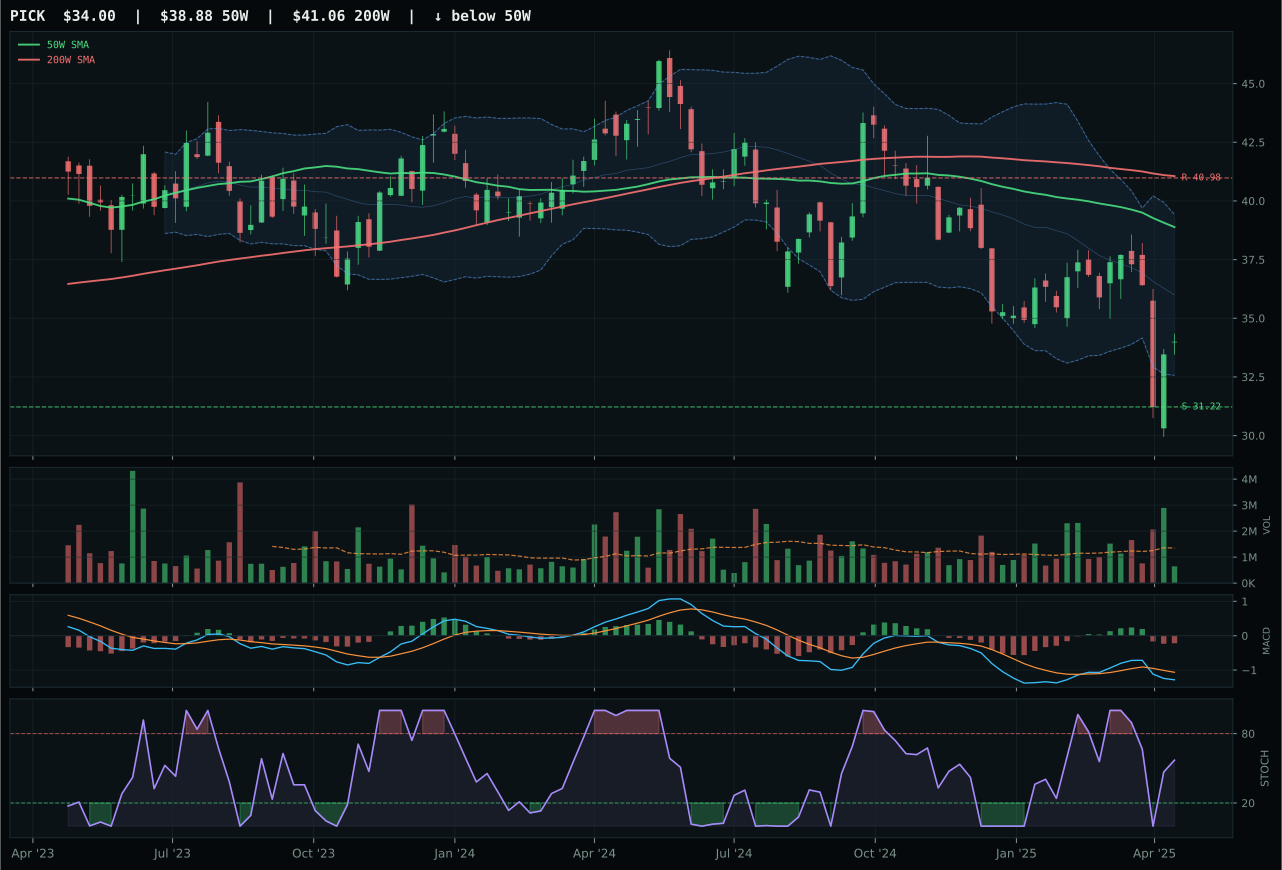
PICK has a neutral structure profile with 5.5% 13-week relative strength versus SPY.
Extension and support failure are the main tactical risks.
Tracked, but not top-2 eligible because: structurally broken.
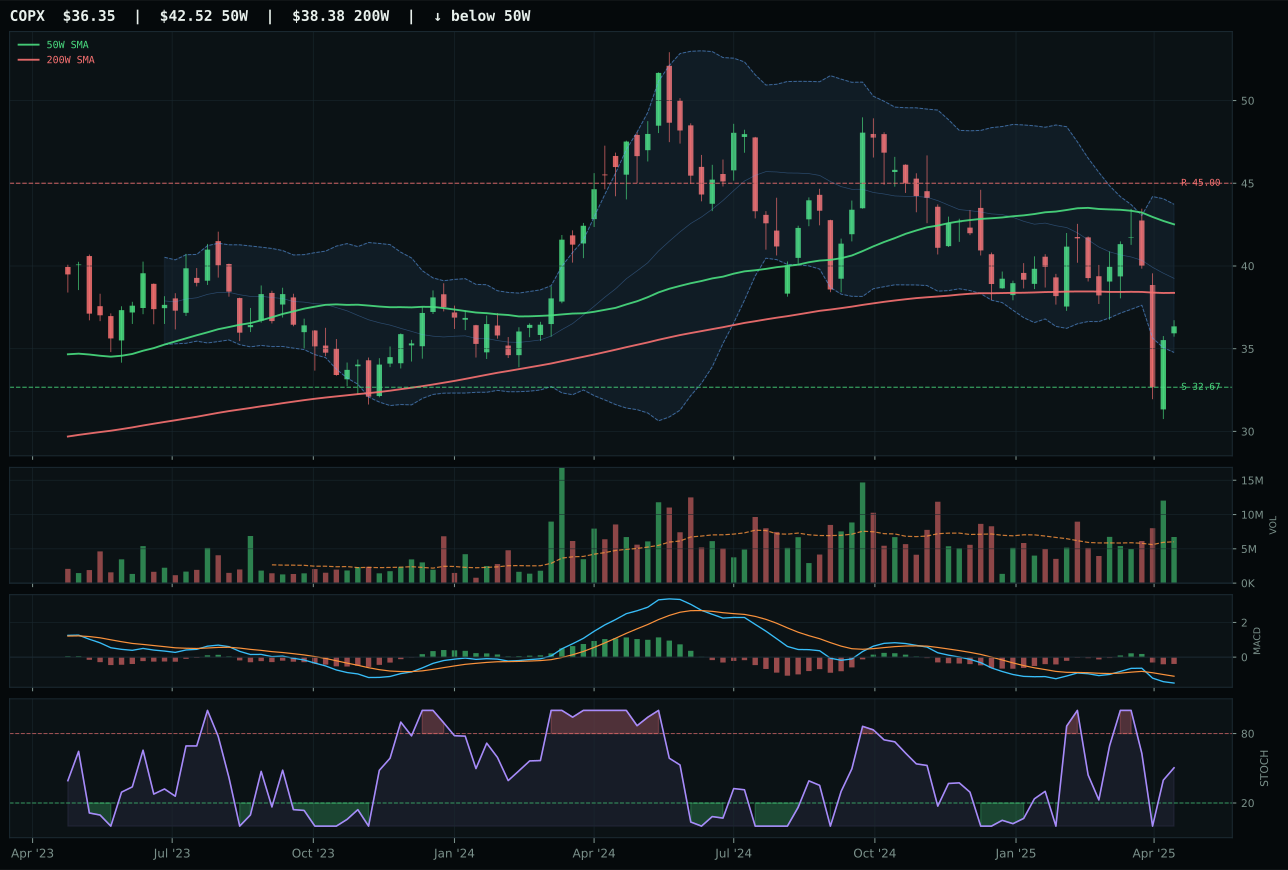
COPX has a neutral structure profile with 3.2% 13-week relative strength versus SPY.
A failed hold above support would weaken the setup.
Actionable but governed by invalidation levels.
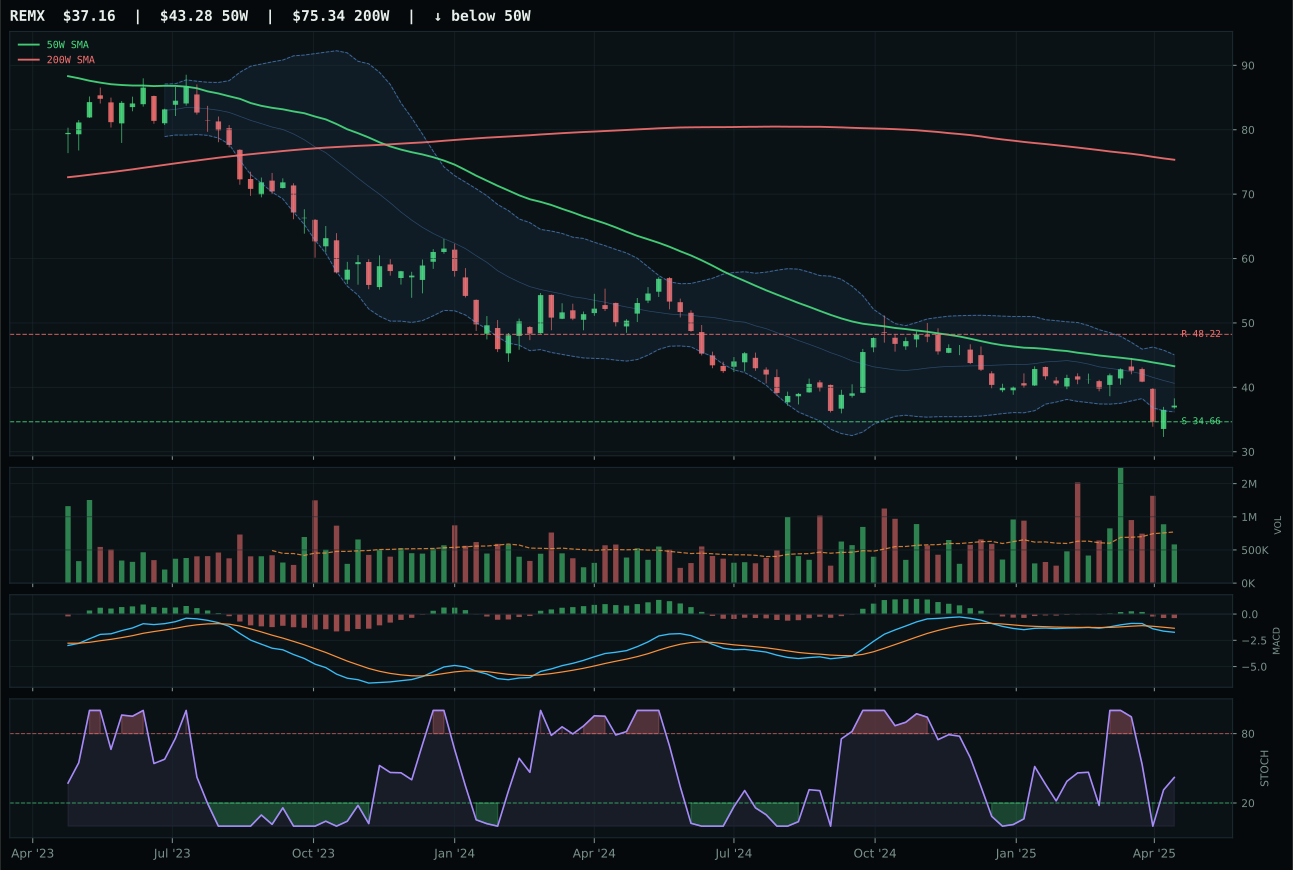
REMX has a neutral structure profile with -1.3% 13-week relative strength versus SPY.
Extension and support failure are the main tactical risks.
Tracked, but not top-2 eligible because: structurally broken.
COPX wins a failing category on structure (71.4 vs PICK's 37.4) and volume participation (1.11x above-average vs thin), two factors that matter when both charts are underwater with bearish MACD. COPX's -14.5% distance from the 50W is severe, yet the above-average turnover shows someone is accumulating at these levels, a signal PICK's thin volume participation cannot match. PICK ranks first at 33.7 in reasoned proof order, yet cannot convert that technical lead into category victory because it failed eligibility hard filters. COPX's 3.2% SPY-relative strength is meager, but in a category where copper demand is cratering on recessionary fears, any positive relative performance is earned. Neither ETF is remotely attractive; this is a forced selection from a broken basket where the least-bad option is one with accumulated volume on the way down, suggesting institutional patience rather than panic selling.
Industrial Metals earned 0% allocation this week, fully excluded from the portfolio despite COPX's category victory. The final 4.6 score reflects severe technical deterioration (COPX at 27.8/100 technical evidence, PICK at 28.6) colliding with negative macro: liquidity stress is the only descriptor weighing this category, at negative 8 points. No category-specific macro profile supports industrial metals in a disinflation regime where demand destruction outweighs supply tightness narratives. The 3/2/1 weighted basket (PICK 33.7, COPX 32.2, REMX 11.7) starts at 29.5, and after stress testing, the reasoner rejected the entire category for capital allocation. This is not a buy-the-dip opportunity; it is evidence of structural weakening in industrial demand that will not reverse until equity markets stabilize and forward guidance improves. COPX would need price above 42.00 with MACD turning positive and volume sustained above 1.3x average to earn even a tier-2 5% allocation.