
2025-04-11
Informational purposes only. The content in this report, including allocations, analysis, and commentary, is provided solely for informational and educational purposes. It does not constitute financial advice, investment advice, trading advice, or any other type of advice. Past performance does not guarantee future results. Always conduct your own research and consult a qualified financial professional before making investment decisions.
Weekly Allocation
| Ticker | Category | Weight | Role |
|---|---|---|---|
| FBTC | 50% | Overlay | |
| GLD | Precious Metals | 10% | Top-2 (10%) |
| IGF | Utilities & Infrastructure | 10% | Top-2 (10%) |
| CIBR | Technology | 5% | Tier-2 (5%) |
| XAR | Defense & Aerospace | 5% | Tier-2 (5%) |
| WEAT | Agriculture & Livestock | 5% | Tier-2 (5%) |
| NLR | Nuclear Energy | 5% | Tier-2 (5%) |
| AIQ | AI | 5% | Tier-2 (5%) |
| INDA | Emerging Markets | 5% | Tier-2 (5%) |
Trade Instructions — Monday Open
Sell the tranche from 2025-03-14 (completing its 4-week hold). Buy the new tranche. Instructions show net portfolio changes — same-asset positions cancel, weight changes show the delta.
| Action | Ticker | Instruction |
|---|---|---|
| SELL | XLU | Sell entire XLU position (2.50% of portfolio) |
| SELL | ITA | Sell 25% of ITA position (reduce 5.00% → 3.75%) |
| SELL | URNM | Sell 50% of URNM position (reduce 2.50% → 1.25%) |
| SELL | BOTZ | Sell entire BOTZ position (1.25% of portfolio) |
| SELL | COPX | Sell 33% of COPX position (reduce 3.75% → 2.50%) |
| SELL | IEMG | Sell entire IEMG position (1.25% of portfolio) |
| BUY | IGF | Buy IGF — 28.57% of freed cash (adds 2.50% to portfolio) |
| BUY | AIQ | Buy AIQ — 14.29% of freed cash (adds 1.25% to portfolio) |
| BUY | NLR | Buy NLR — 14.29% of freed cash (adds 1.25% to portfolio) |
| BUY | INDA | Buy INDA — 14.29% of freed cash (adds 1.25% to portfolio) |
| BUY | WEAT | Buy WEAT — 14.29% of freed cash (adds 1.25% to portfolio) |
| BUY | XAR | Buy XAR — 14.29% of freed cash (adds 1.25% to portfolio) |
Current Portfolio After Trade
Combined holdings across all 4 active tranches. Each tranche is 25% of the portfolio.
| Ticker | % of Portfolio | Weight Bar |
|---|---|---|
| FBTC | 50.00% | |
| IGF | 10.00% | |
| GLD | 7.50% | |
| CIBR | 5.00% | |
| ITA | 3.75% | |
| AIQ | 3.75% | |
| NLR | 3.75% | |
| COPX | 2.50% | |
| XLE | 2.50% | |
| SLV | 2.50% | |
| INDA | 2.50% | |
| WEAT | 2.50% | |
| URNM | 1.25% | |
| VEGI | 1.25% | |
| XAR | 1.25% |
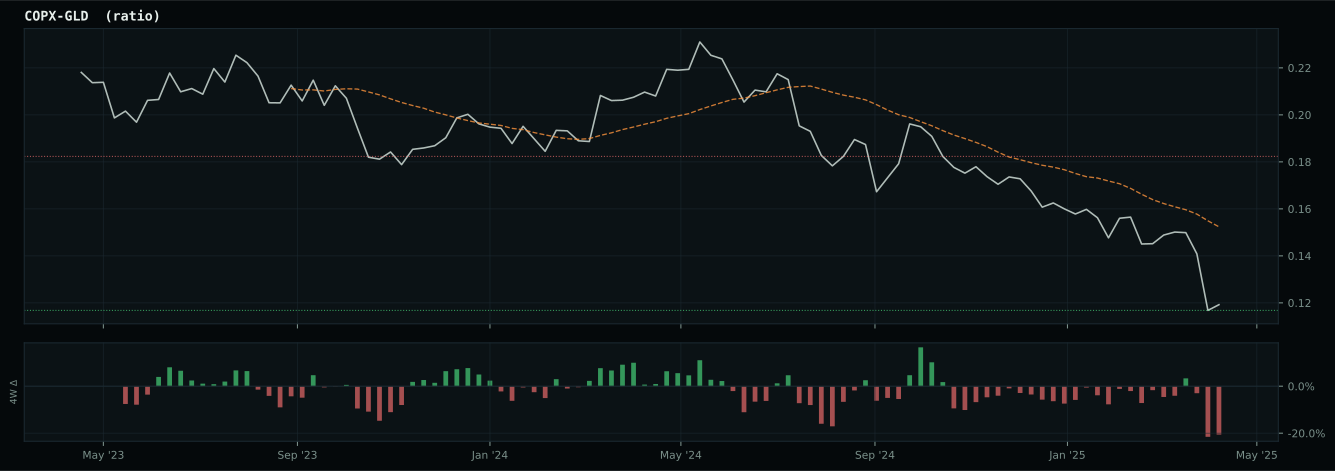
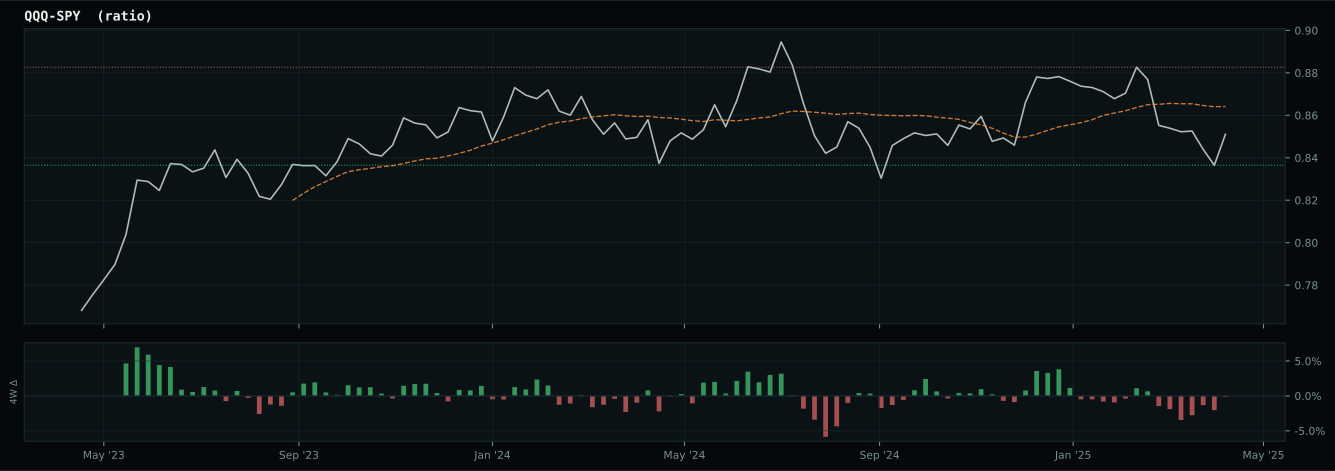
Macro Regime — Disinflation
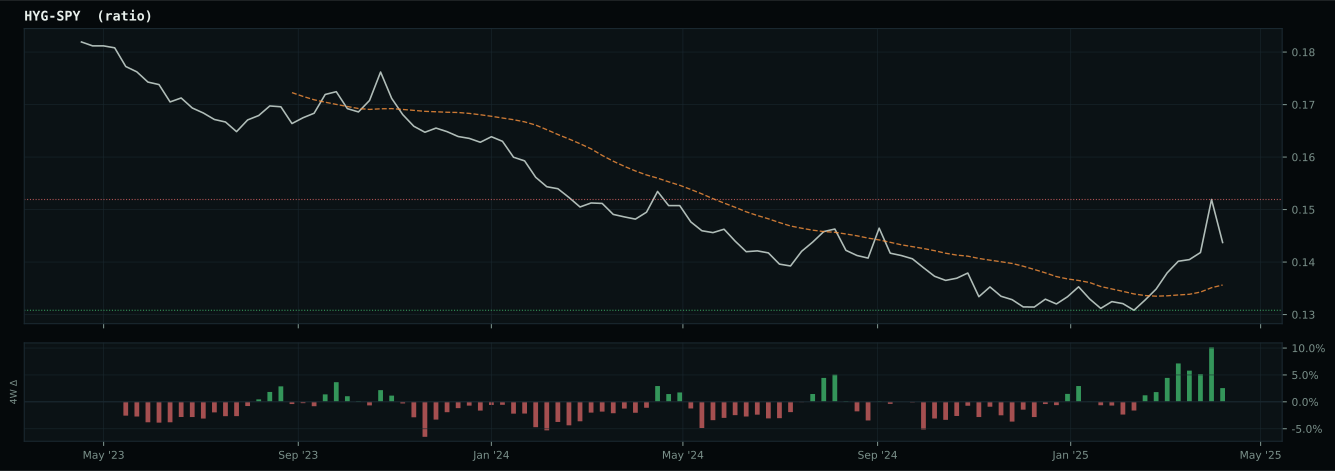
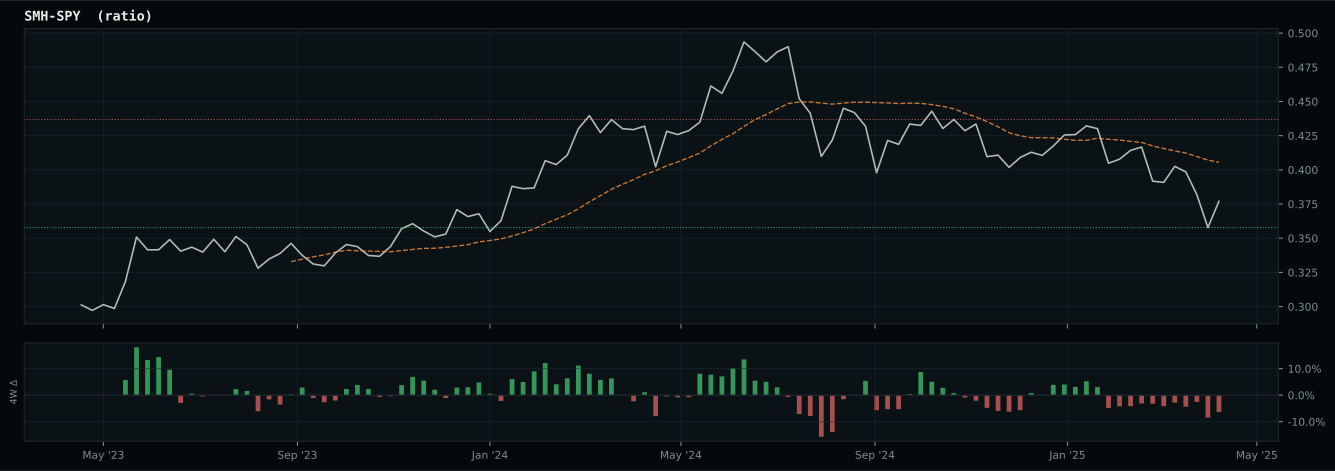
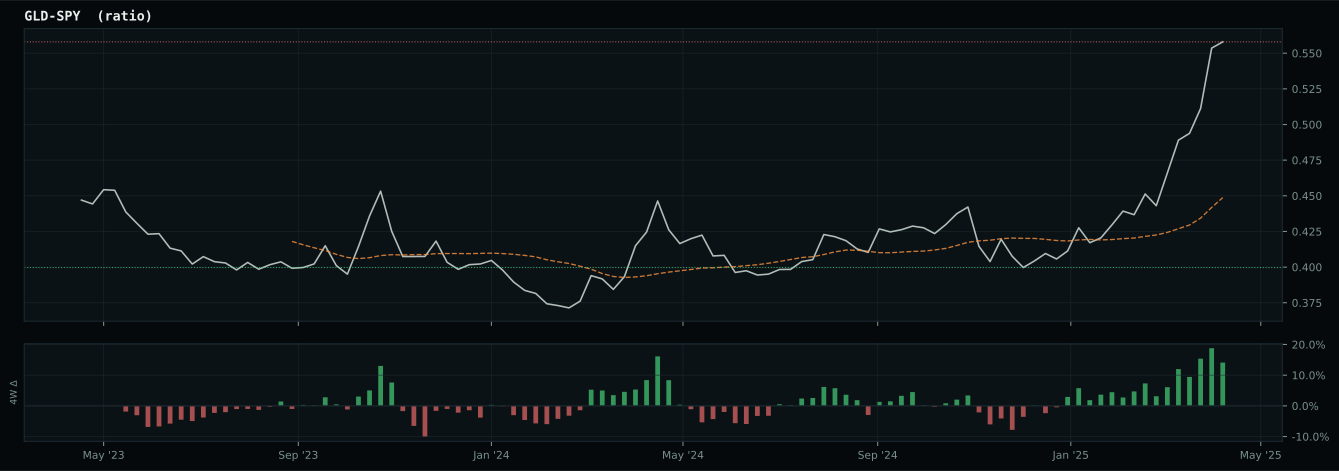
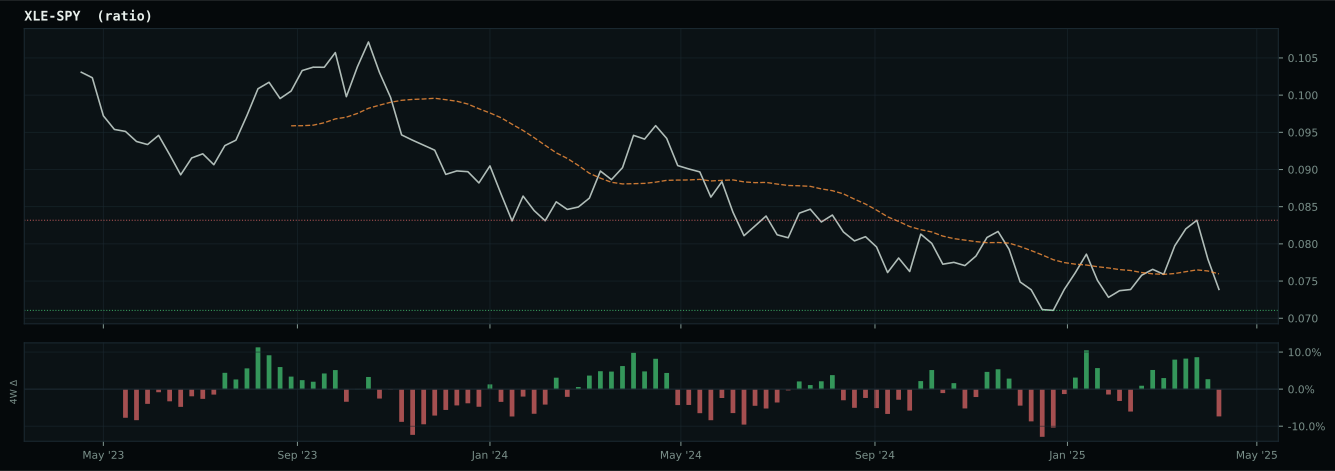
growth data is not confirming the weak market-implied risk appetite signal
Macro Evidence Charts
Market-implied signals behind the macro regime scores. Each ratio compares two assets; the direction and slope of the ratio is what the macro engine reads.
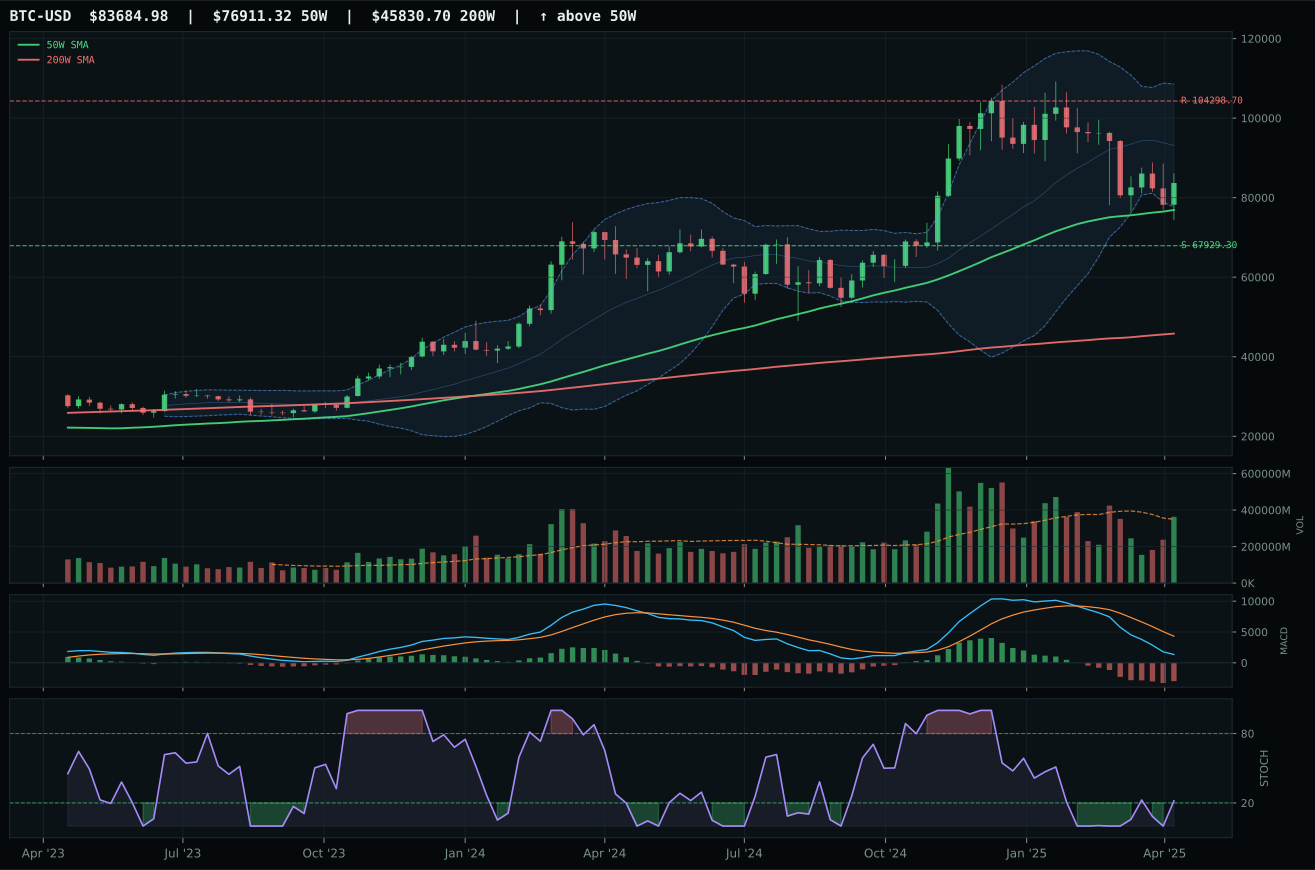
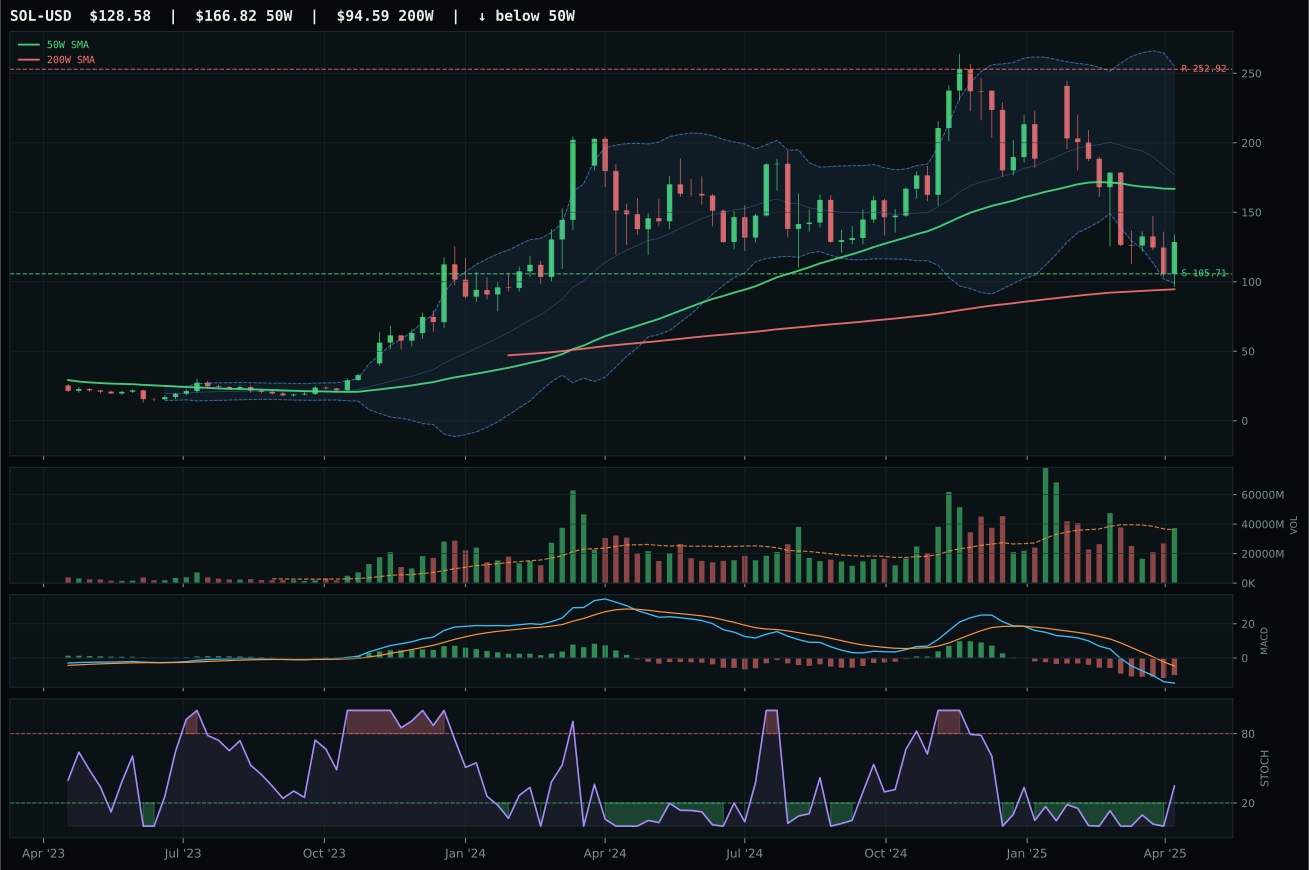
Crypto Regime — TrendBTC
ValueBTC not armed: BTC has not made the first post-breakdown touch of the 200W buy zone after losing the 50W
TrendBTC confirmed: 2 consecutive closes above rising/flat 50W SMA
one or more available conditions failed
Category Rankings
| Rank | Category | Winner | Score | Alloc | 4W Ret | Peers (4W) |
|---|---|---|---|---|---|---|
| 1 | Precious Metals | GLD | 84.2 | 20% | +0.94% | GDX -1.8% · SLV +2.0% |
| 2 | Utilities & Infrastructure | IGF | 69.7 | 20% | +6.10% | XLU +4.8% · PAVE +13.3% |
| 3 | Technology | CIBR | 48.3 | 10% | +10.02% | IGV +14.6% · XLK +10.9% |
| 4 | Defense & Aerospace | XAR | 44.7 | 10% | +10.42% | ITA +10.9% · ROKT +9.0% |
| 5 | Nuclear Energy | NLR | 22.9 | 10% | +14.94% | URA +20.5% · URNM +20.8% |
| 6 | AI | AIQ | 22.6 | 10% | +13.13% | BOTZ +10.7% · SMH +14.6% |
| 7 | Emerging Markets | INDA | 21.3 | 10% | +6.00% | IEMG +9.3% · ILF +12.4% |
| 8 | Industrial Metals | COPX | 5.8 | 10% | +11.83% | PICK +8.3% · REMX +8.7% |
| 9 | Traditional Energy | XLE | 0.2 | 0% | +5.84% | FCG +9.8% · XOP +13.2% |
| 10 | Agriculture & Livestock | WEAT | — | 0% | -7.31% | VEGI +7.8% · MOO +8.1% |
Precious Metals — GLD
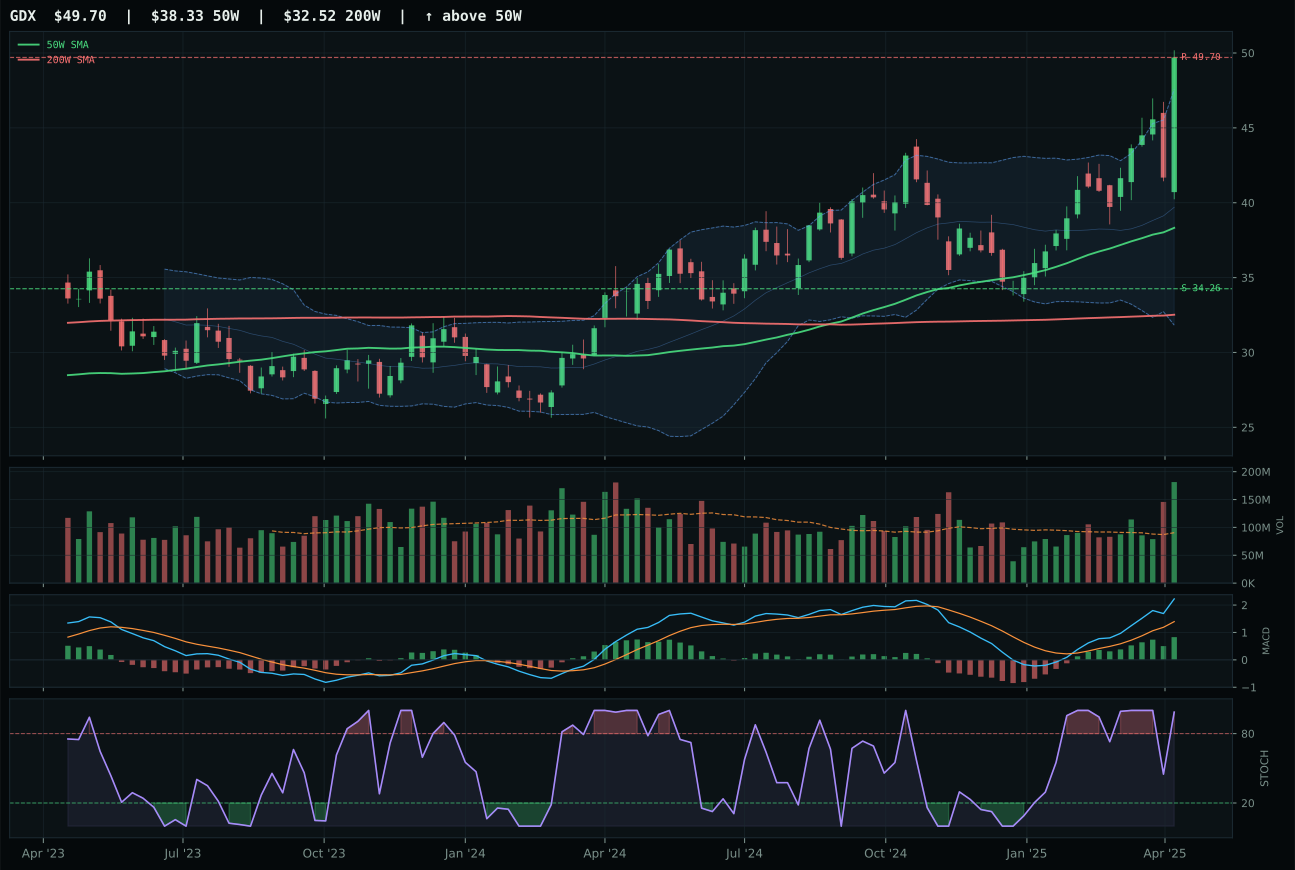
GDX has a vertical extension profile with 46.2% 13-week relative strength versus SPY.
A failed hold above support would weaken the setup.
Actionable but governed by invalidation levels.
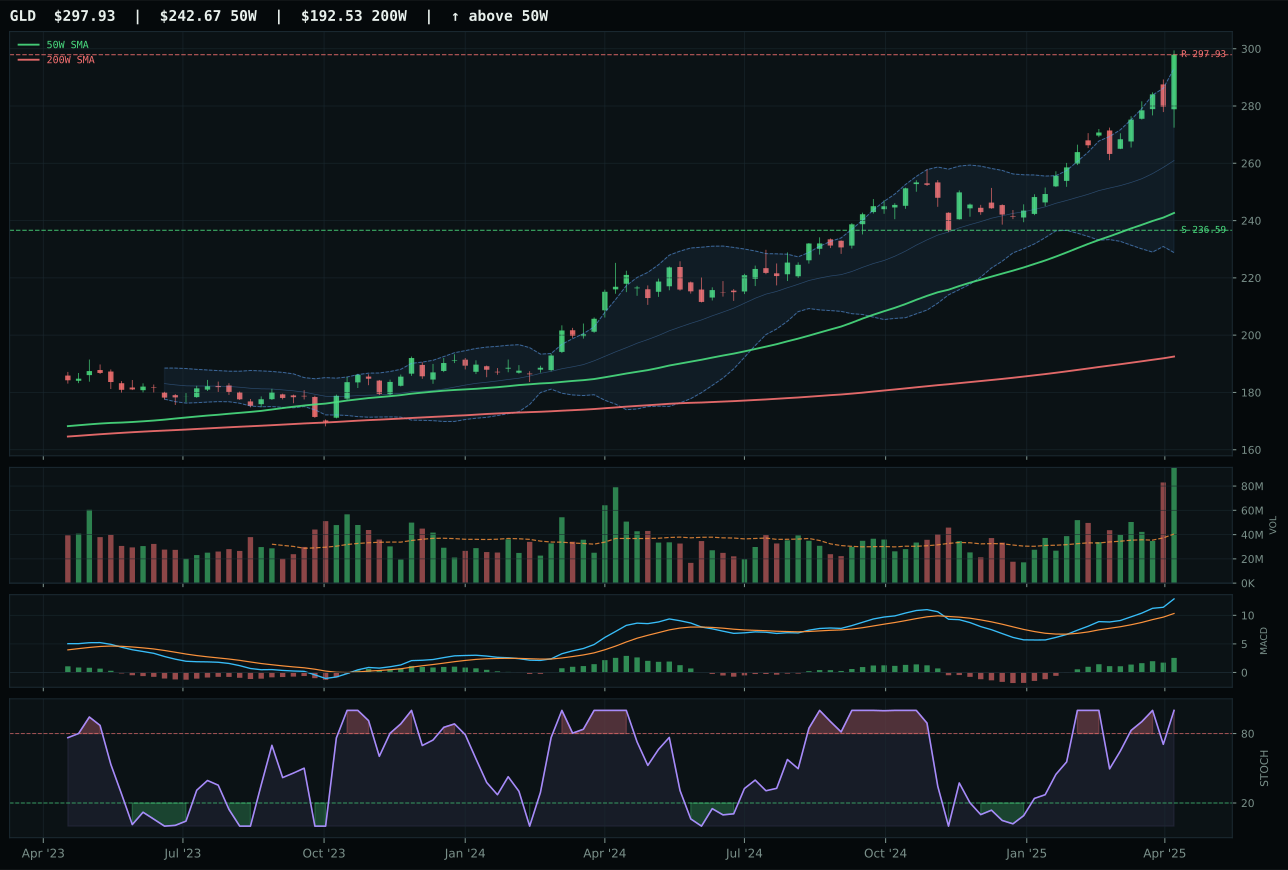
GLD has a vertical extension profile with 28.1% 13-week relative strength versus SPY.
A failed hold above support would weaken the setup.
Actionable but governed by invalidation levels.
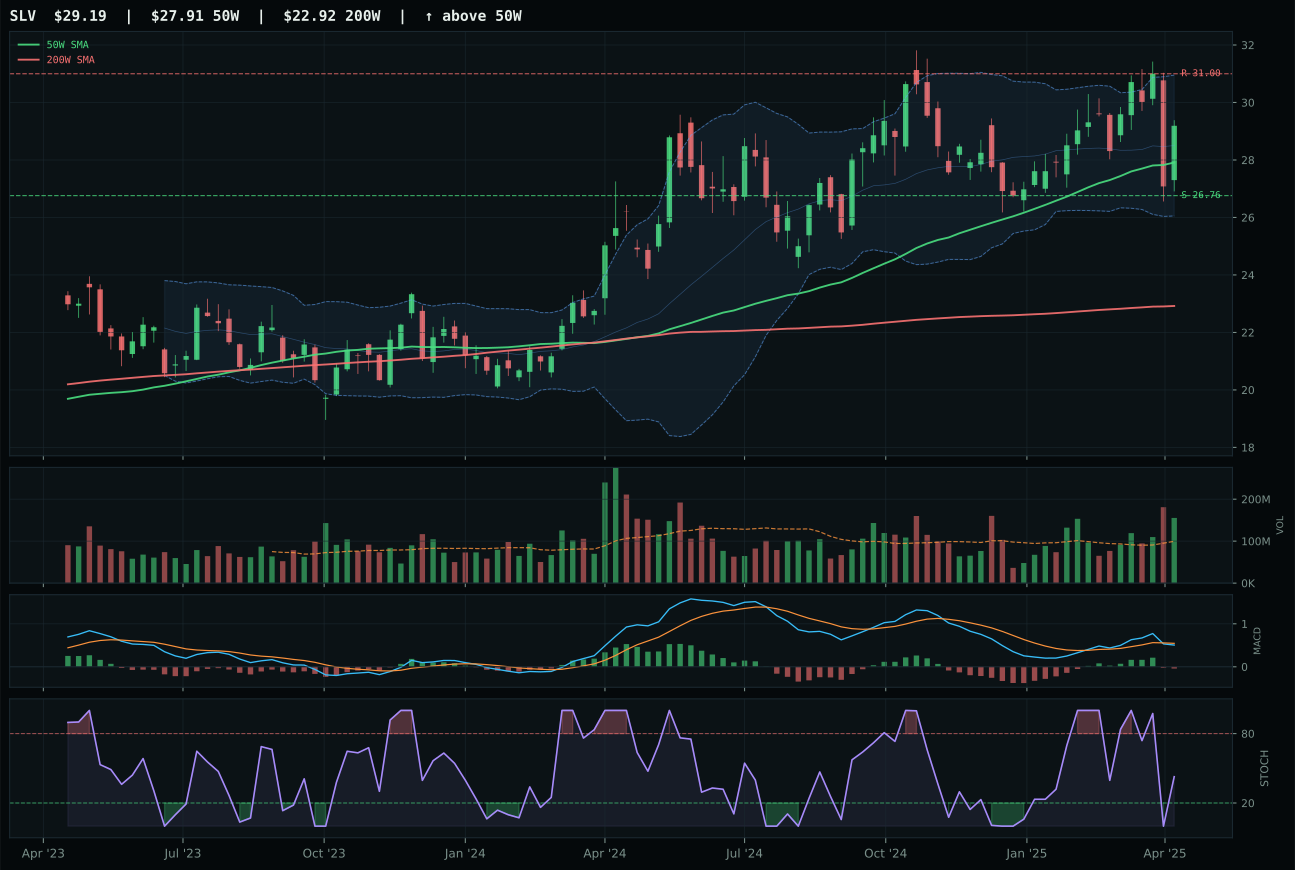
SLV has a neutral structure profile with 13.7% 13-week relative strength versus SPY.
A failed hold above support would weaken the setup.
Actionable but governed by invalidation levels.
GLD dominates its category by every measure that matters: perfect trend score of 100 from price 22.8% above the 50W with 0.7% weekly slope, flawless momentum at 100 driven by 20.0% thirteen-week return, and exceptional volume-price confirmation at 87.3 as 2.44x average volume accompanies the climb. The 28.1% relative strength versus SPY is extraordinary and earned zero category-relative penalization because GLD's median position means no peer is outrunning it. GDX, the runner-up, posted 46.2% RS versus SPY—nearly double GLD's advantage—yet it lost the decision because GLD's timing score of 37 beats GDX's 27, reflecting GLD's superior placement within the Fibonacci retracement and less-extended Fibonacci location. Stochastic RSI at 1.00 in GLD versus overbought rolling over in GDX signals that GLD's momentum has one more pulse left while GDX's is exhausting. The 9.9-point gap is decisive but not enormous; both are performing.
Precious Metals earns 10% as a top-2 overweight, the highest allocation awarded this week, reflecting its 84.2 category score and exceptional macro alignment. Monetary hedge bid is active and contributing 14 points—the single-largest macro descriptor boost in the portfolio—complemented by disinflation (plus 8) and defensive rotation (plus 6). Category-level macro fit stands at 85 percent, the highest among all ten categories, signaling that this regime is almost purpose-built for gold exposure. GLD's extension at 22.8% above the 50W normally represents elevated entry risk, yet the disinflation backdrop, Fed policy implying lower-for-longer rates, and flight-to-safety bid in equities all conspire to make vertical extension justified rather than dangerous. Volume accumulation and MACD improvement confirm the move is being sustained. The only caveat: timing score of 37 reflects that price has run hard; the next entry opportunity may require a pullback to test support at 236.59. Hold the full 10% and add weakness above that level.
Utilities & Infrastructure — IGF
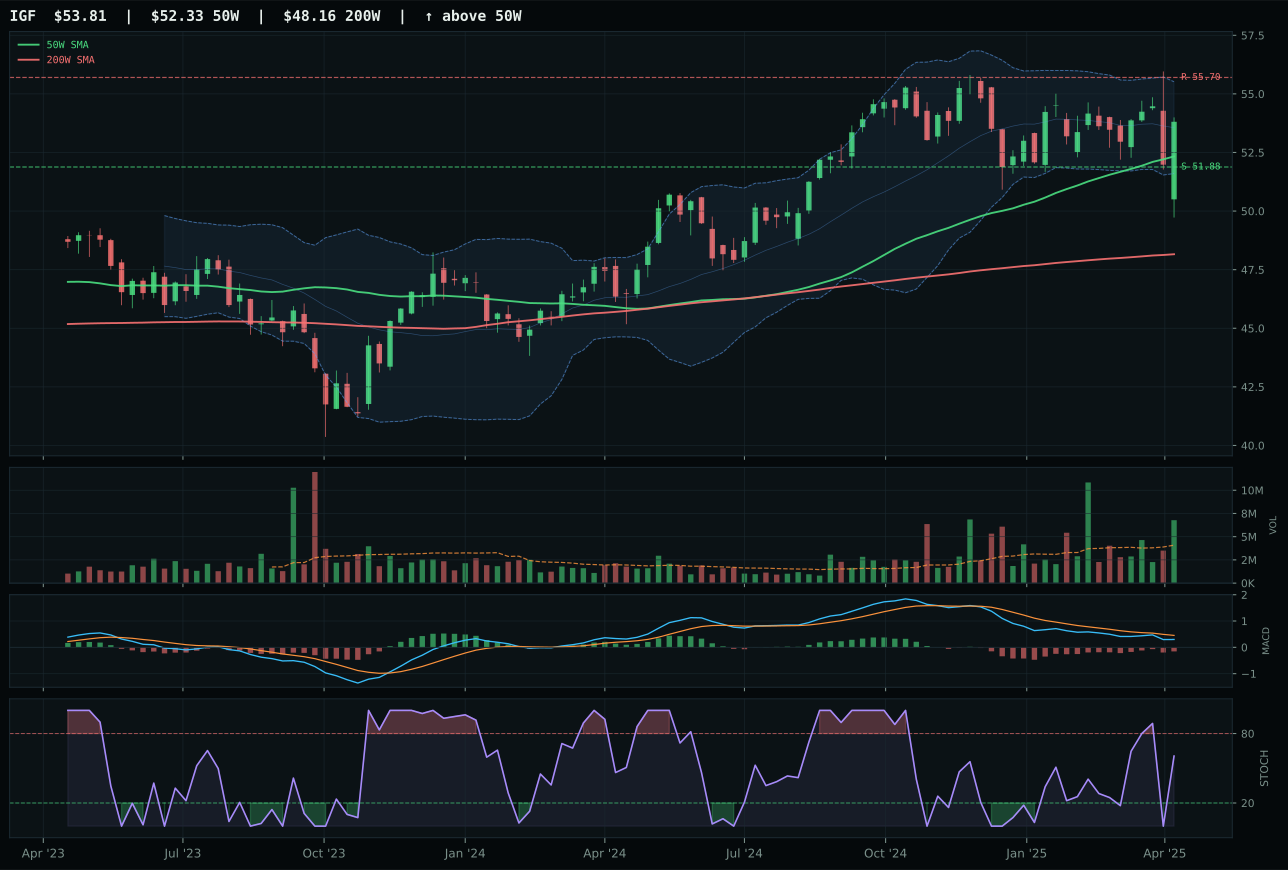
IGF has a pullback into support profile with 11.3% 13-week relative strength versus SPY.
A failed hold above support would weaken the setup.
Actionable but governed by invalidation levels.
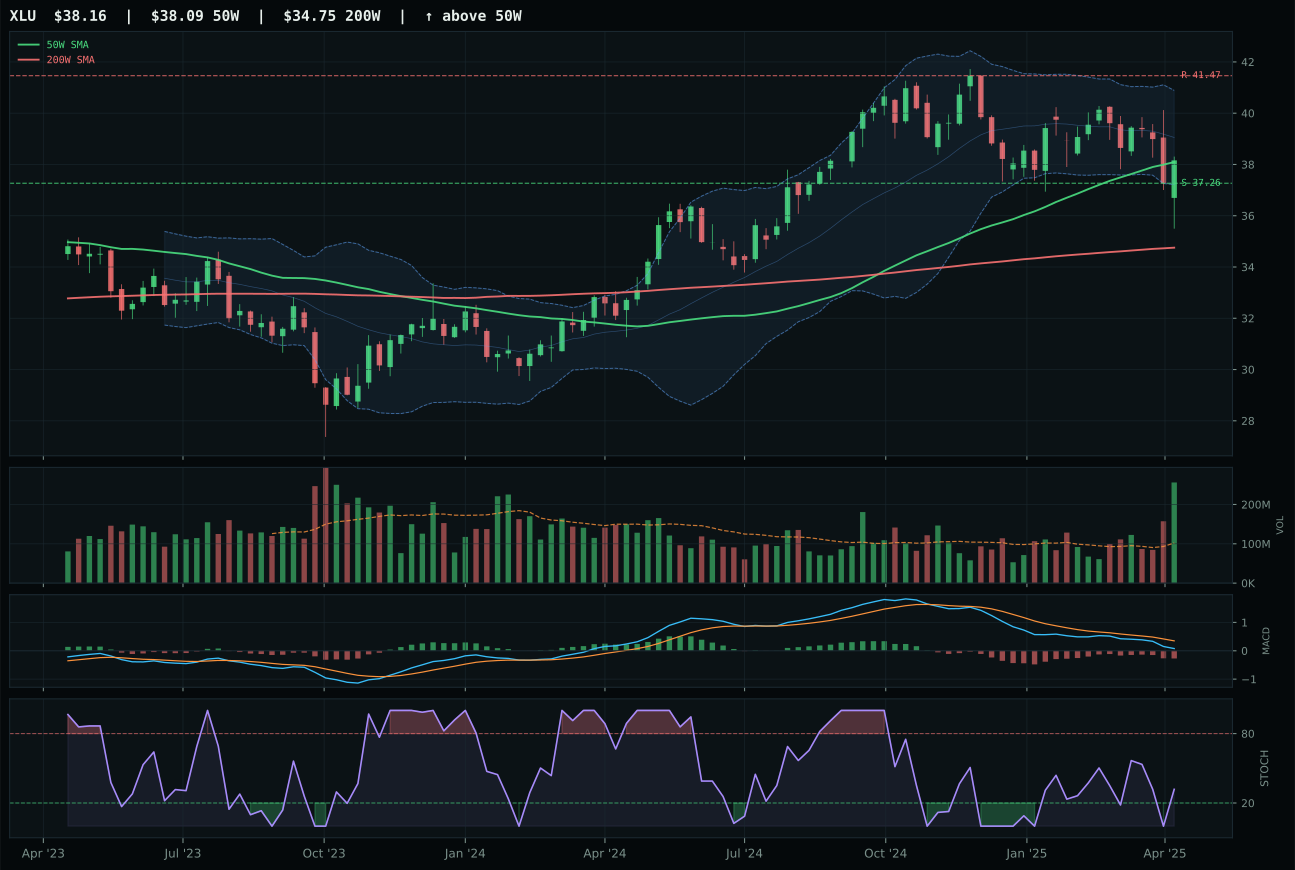
XLU has a pullback into support profile with 9.0% 13-week relative strength versus SPY.
A failed hold above support would weaken the setup.
Actionable but governed by invalidation levels.
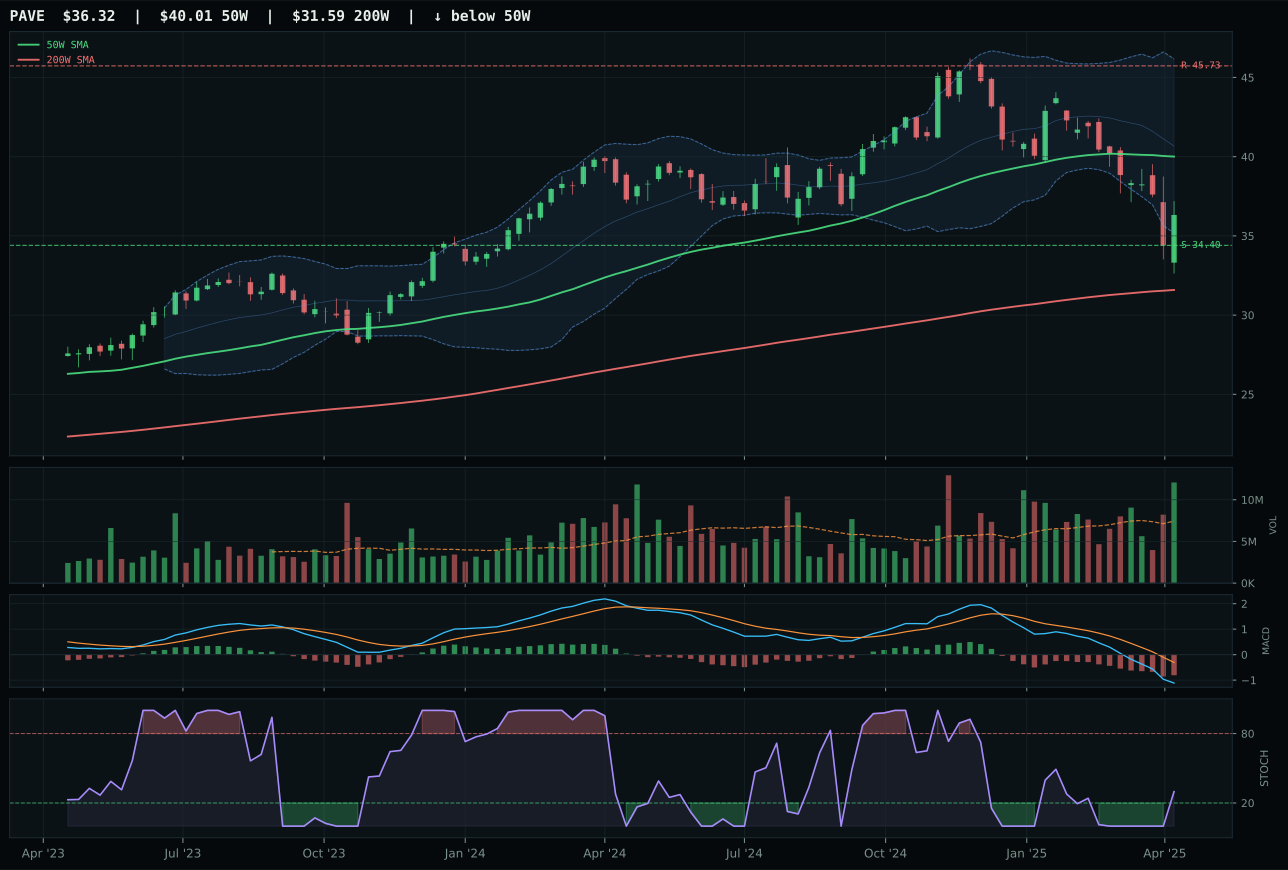
PAVE has a neutral structure profile with -1.3% 13-week relative strength versus SPY.
A failed hold above support would weaken the setup.
Actionable but governed by invalidation levels.
IGF captured the category by posting flawless timing and trend scores of 100 each, while XLU, the runner-up, scored 95 and 92 respectively—narrow gaps that underscore the quality of both setups. IGF's winning edge came from superior category-relative strength at 2.3 percent versus XLU's flat 0.0 percent, and a marginally better risk-reward profile at 66.4 versus XLU's 95. The latter is counterintuitive—XLU shows tighter risk geometry with only 0.2% downside to support against 3.7% for IGF—yet IGF's proximity to the 50W (2.8% versus XLU's testing deeper support) yields better timing. Both charts show clean pullback-into-support structures with volume accumulation and MACD improving, hallmarks of high-quality setups. IGF's global infrastructure positioning and 11.3% RS versus SPY versus XLU's 9.0% give IGF the peer edge, justifying the representation despite XLU's tighter downside.
Utilities & Infrastructure earns 10% as a top-2 overweight, the joint-highest allocation alongside Precious Metals, reflecting its 69.7 category score and exceptional macro alignment. Defensive rotation contributes 12 points, disinflation contributes 7, and disinflation pressure adds another 6—a cumulative macro boost that produces an 80-percent category-level fit, the second-highest in the portfolio. This is a regime-perfect trade: when growth disappoints and inflation recedes, income-producing assets with pricing power become the safe harbor. IGF's infrastructure focus—tolls, pipelines, utilities—offers duration-sensitive exposure that benefits from falling rates while maintaining real cash flows. The chart itself is sterling: price consolidating above the 50W with accumulation-confirmed volume, MACD improving despite technical weakness, and stochastic RSI in the opportunity zone. The 3.4% upside to resistance and 3.7% downside to support create a tightly controlled risk envelope ideal for a 10% core holding. Maintain full allocation; test the support at 51.88 is the only condition that would trigger a re-evaluation.
Technology — CIBR
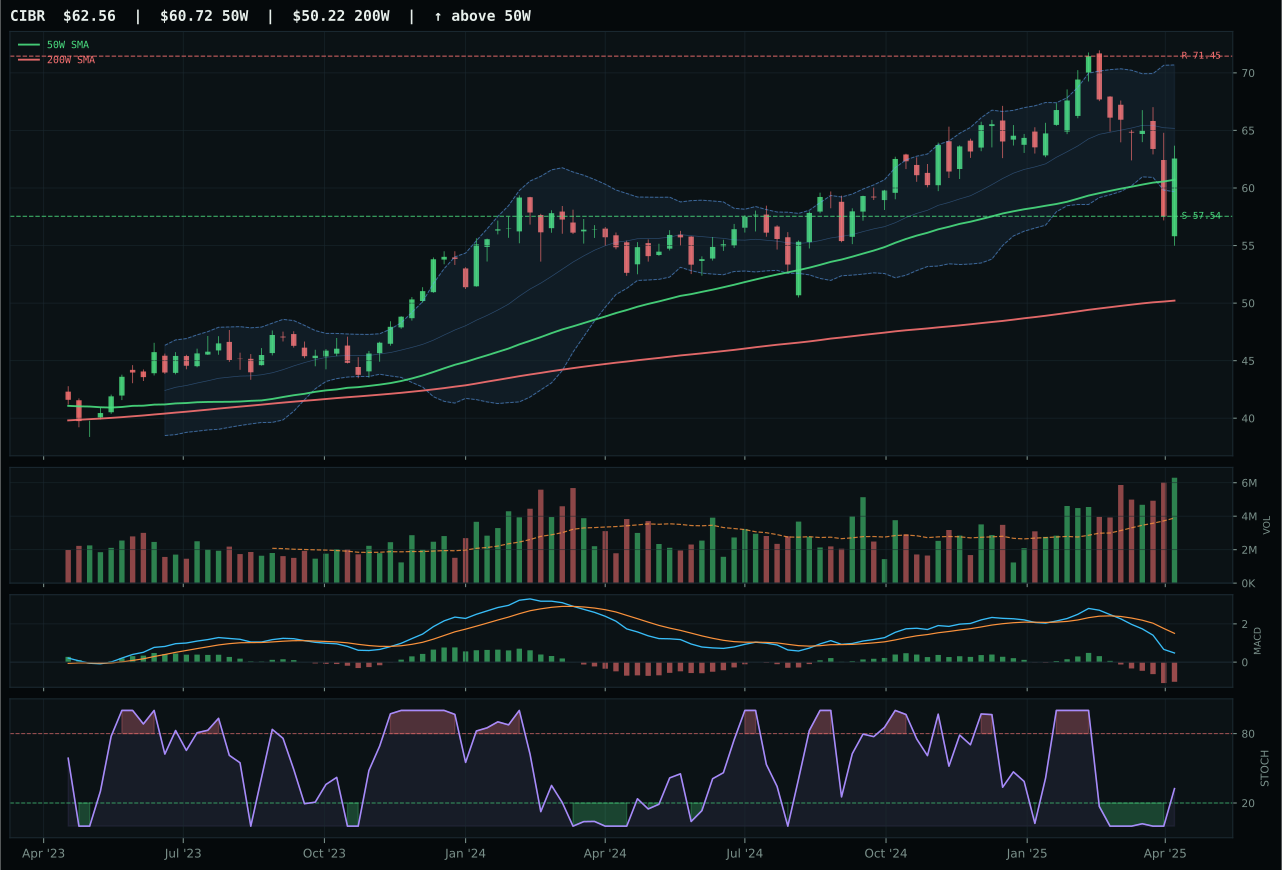
CIBR has a neutral structure profile with 6.5% 13-week relative strength versus SPY.
A failed hold above support would weaken the setup.
Actionable but governed by invalidation levels.
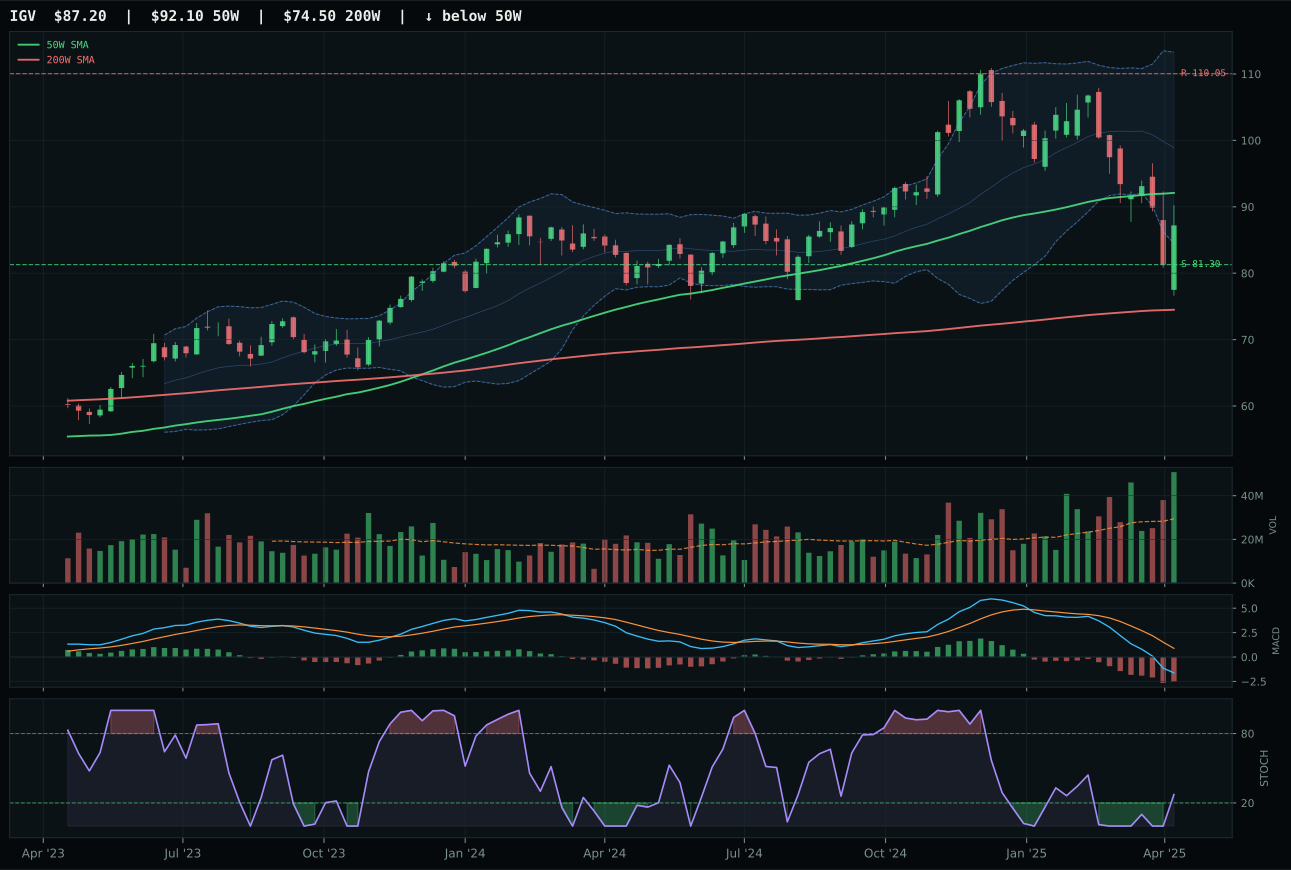
IGV has a neutral structure profile with -2.3% 13-week relative strength versus SPY.
A failed hold above support would weaken the setup.
Actionable but governed by invalidation levels.
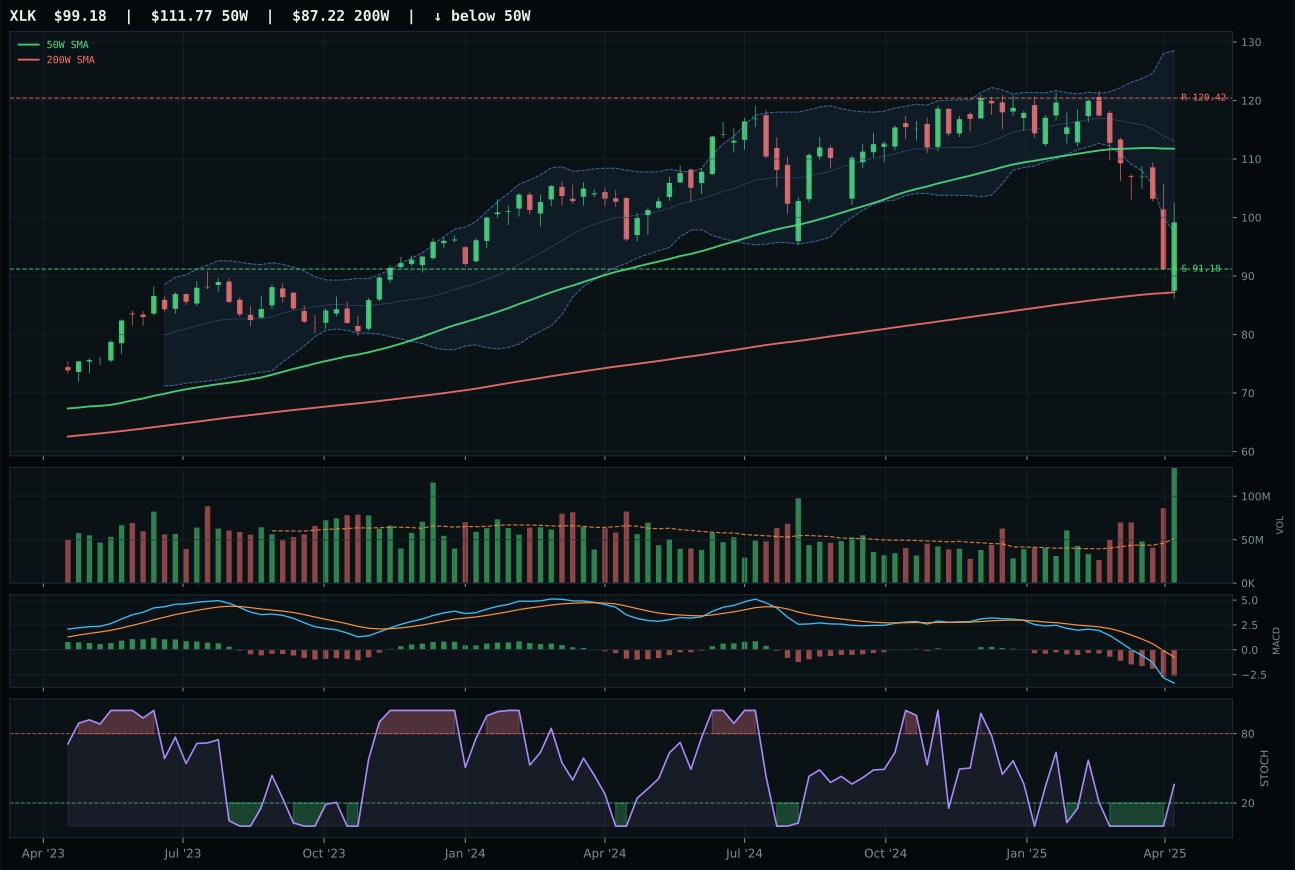
XLK has a neutral structure profile with -5.3% 13-week relative strength versus SPY.
A failed hold above support would weaken the setup.
Actionable but governed by invalidation levels.
CIBR captured the category by holding above both its 50-week and 200-week moving averages while sitting just 3.0% away from the 50W, a positioning that signals neither extended euphoria nor early-stage repair. Its 8.8% category-relative strength and 6.5% advantage over SPY established it as the clear peer leader, while volume at 1.62x the 20-week average confirmed that accumulation was active rather than passive. IGV's loss stemmed from three technical failures: a timing score of 85 versus CIBR's perfect 100, weaker structure at 71.3 against 75.3, and zero category-relative strength that left it neutral to its own peers. The setup in CIBR is textbook neutral-to-constructive—price in the middle Fibonacci retracement zone, MACD bearish but not collapsing, stochastic RSI rising from mid-range—all indicators of a coil rather than a breakdown.
Technology holds its 5% allocation as a tier-2 slot, a ranking that reflects its 48.3 category score sitting well below both Precious Metals and Utilities. The disinflation environment offers modest tailwinds—defensive rotation and broad market bear dynamics favor the sector—yet these are offset by active liquidity stress (-10 points at the category level). CIBR's cybersecurity positioning and MACD weakness signal that this isn't a momentum-driven trade but rather a consolidation play in a macro headwind. For Technology to earn promotion to top-2, it would need either a structural break above resistance at 71.45 with confirmation from MACD improvement, or a material shift in the macro descriptor scorecard away from liquidity stress. Until then, the 5% sleeve captures the setup without overcommitting.
Defense & Aerospace — XAR
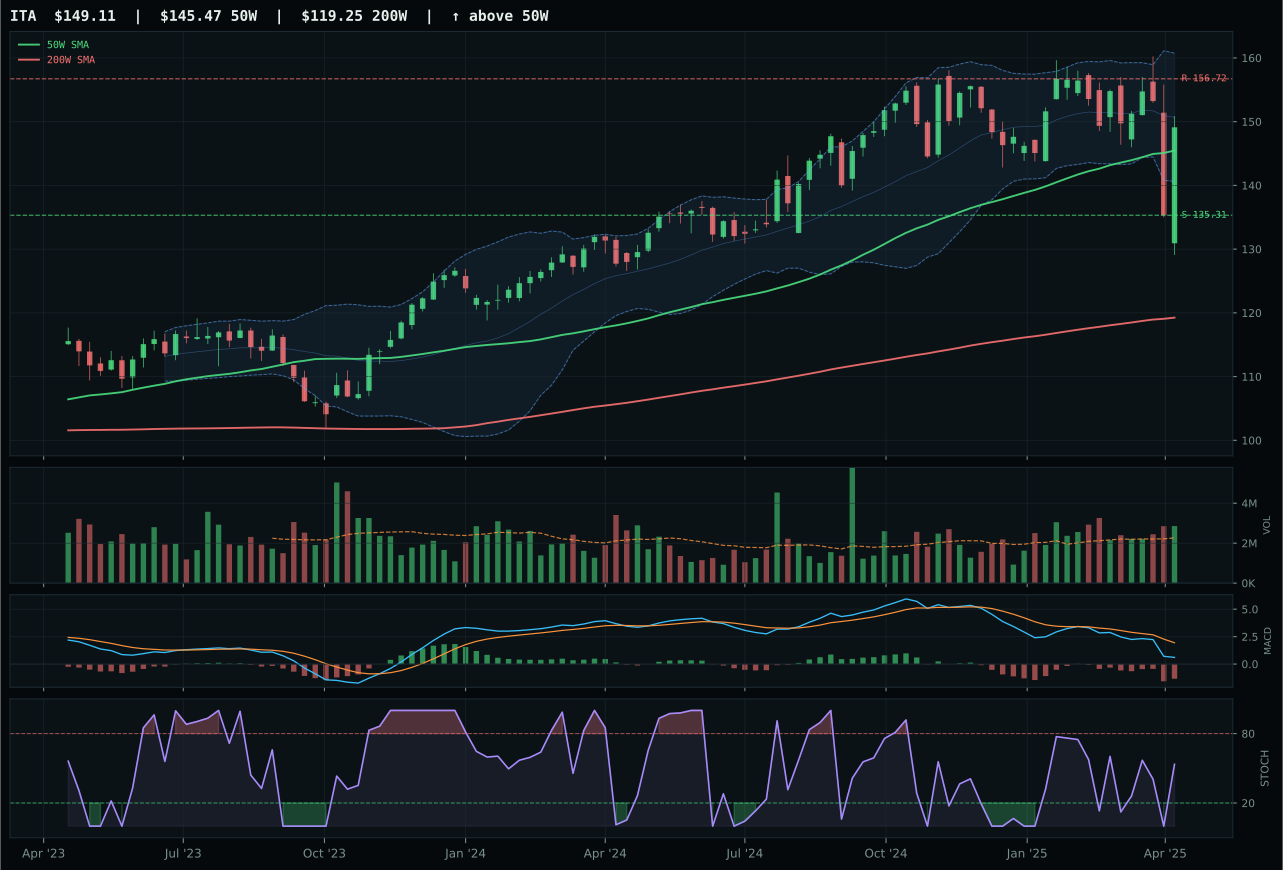
ITA has a compression near 50W profile with 10.8% 13-week relative strength versus SPY.
A failed hold above support would weaken the setup.
Actionable but governed by invalidation levels.
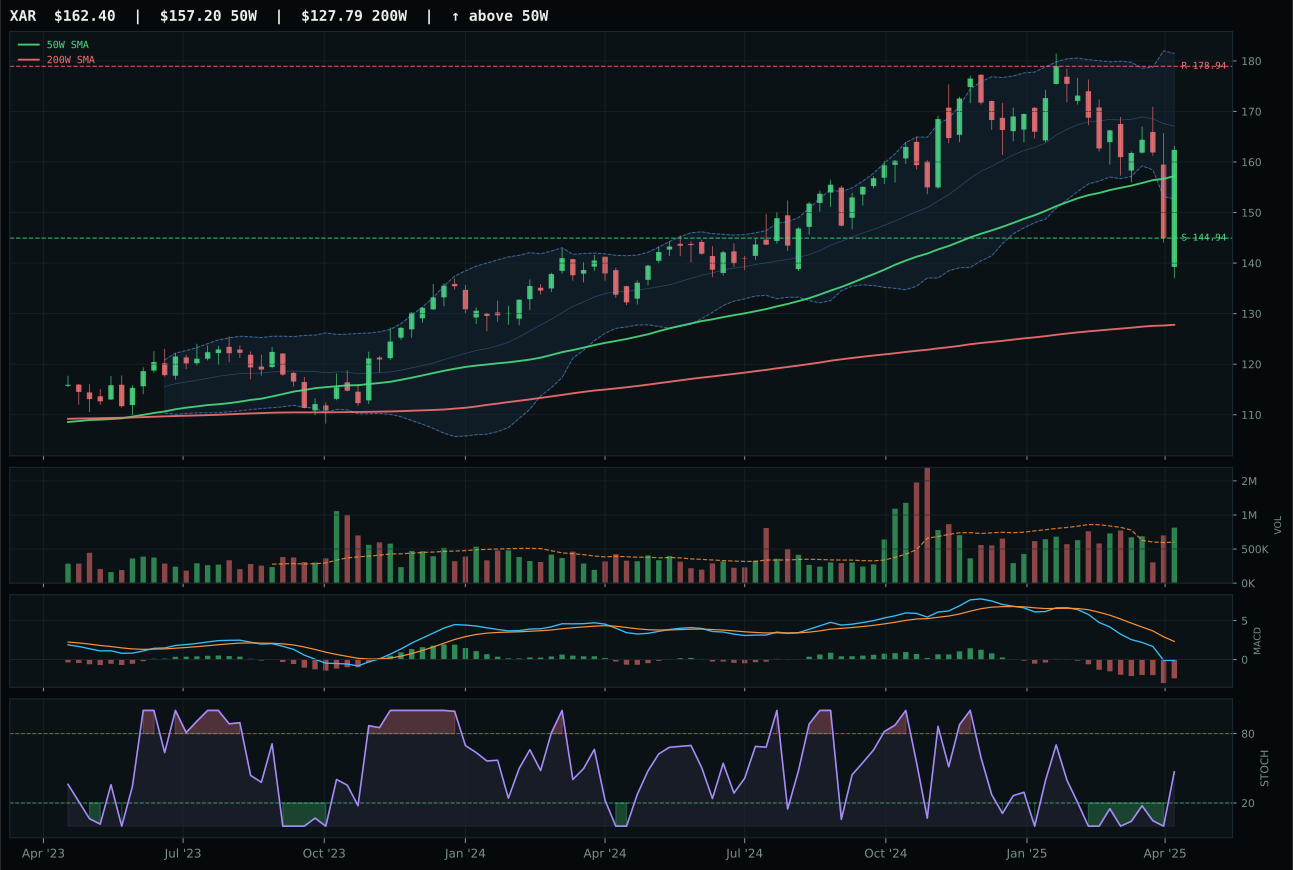
XAR has a neutral structure profile with 5.9% 13-week relative strength versus SPY.
A failed hold above support would weaken the setup.
Actionable but governed by invalidation levels.
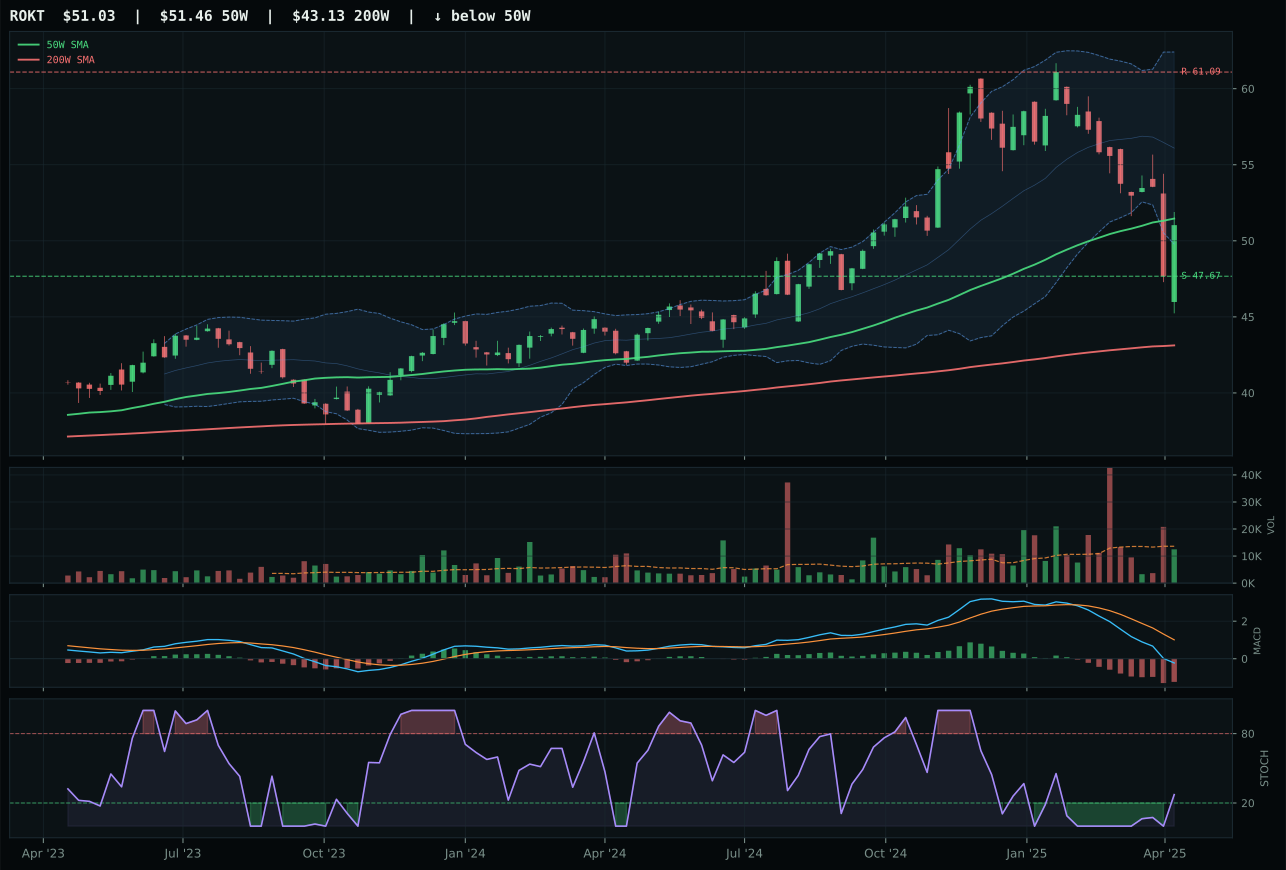
ROKT has a compression near 50W profile with -1.7% 13-week relative strength versus SPY.
A failed hold above support would weaken the setup.
Tracked, but not top-2 eligible because: .
XAR claimed the representative slot despite losing the reasoned proof order to ITA, winning on timing alone—its 100 score against ITA's 95—and benefiting from a Fibonacci location that favors consolidation over extended rally. Price sits 3.3% above the 50W in the classic mid-retracement decision zone, MACD is bearish but not deteriorating, and stochastic RSI is rising mid-zone at 0.47, all hallmarks of a setup that rewards patience over aggression. ITA, the runner-up, posted stronger technical evidence (61.3 versus 56.4) and better macro fit (60.0 versus 50.0), yet it stumbled on risk-reward—only 53.6 versus XAR's 66.8—because it sits extended above its 50W at 3.8% distance and faces tighter resistance. Stochastic RSI falling neutral rather than rising also signaled less immediate momentum. The 4.3-point category score loss is narrow, suggesting both are acceptable holdings.
Defense receives 5% as a tier-2 allocation, a decision driven by its 44.7 category score and rank well below the top two. Macro support is solid: defensive rotation and broad market bear conditions each contribute plus points, offsetting liquidity stress. The category-level macro fit sits at 61 percent, the second-highest among tier-2 slots, indicating that while conditions favor defensive posturing, Defense itself is not the preferred vehicle—that honor goes to Precious Metals and Utilities. XAR's neutral structure and mid-retracement positioning are constructive, but the category's relatively compressed timing window (ITA scored 95, XAR 100) means the window for entry is closing rather than opening. For Defense to reach top-2 allocation, either ITA's superior technical evidence would need to overtake the reasoned proof order, requiring XAR to break below support at 144.94, or broader macro descriptors would need to shift sharply toward risk-appetite-broken conditions that haven't yet materialized.
Nuclear Energy — NLR
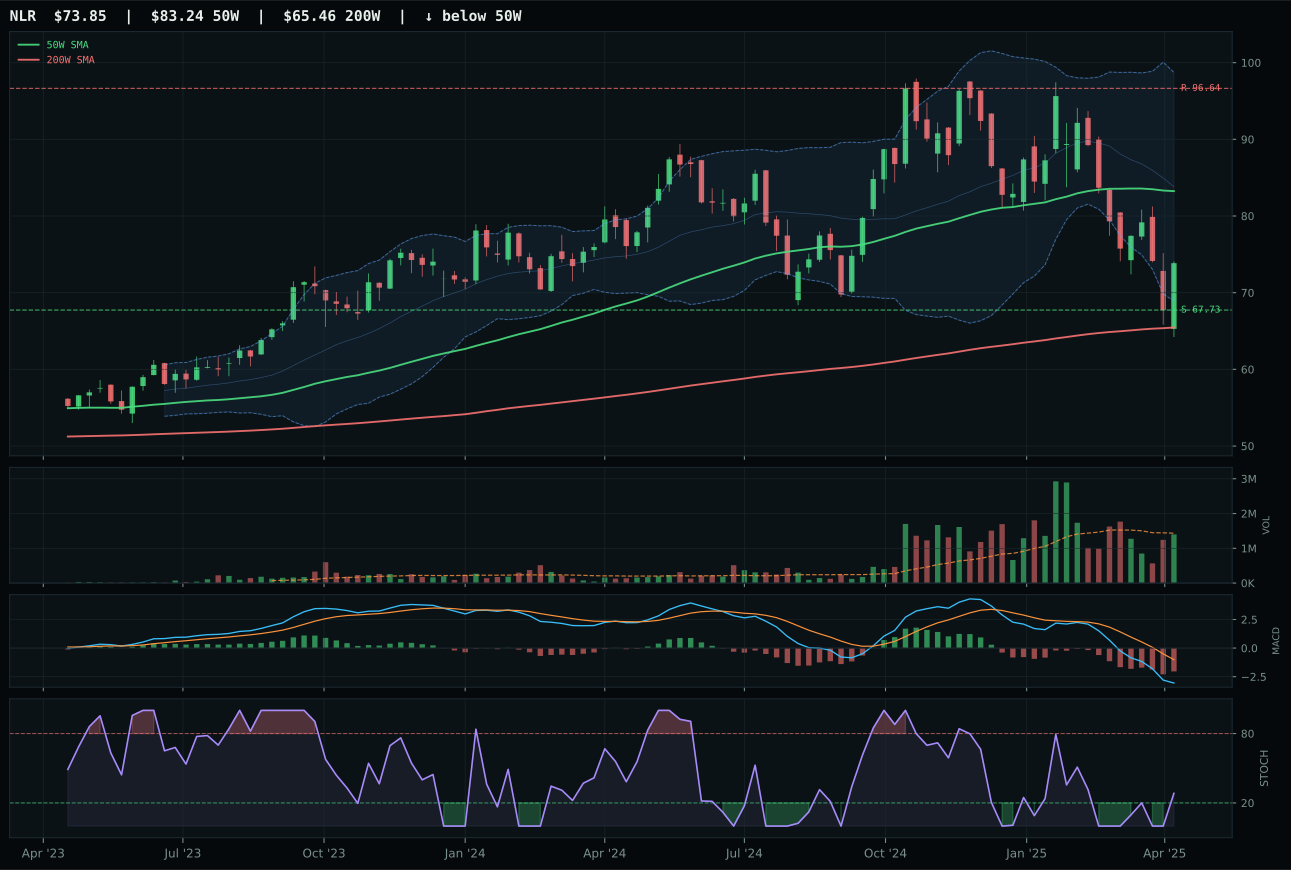
NLR has a neutral structure profile with -4.6% 13-week relative strength versus SPY.
A failed hold above support would weaken the setup.
Actionable but governed by invalidation levels.
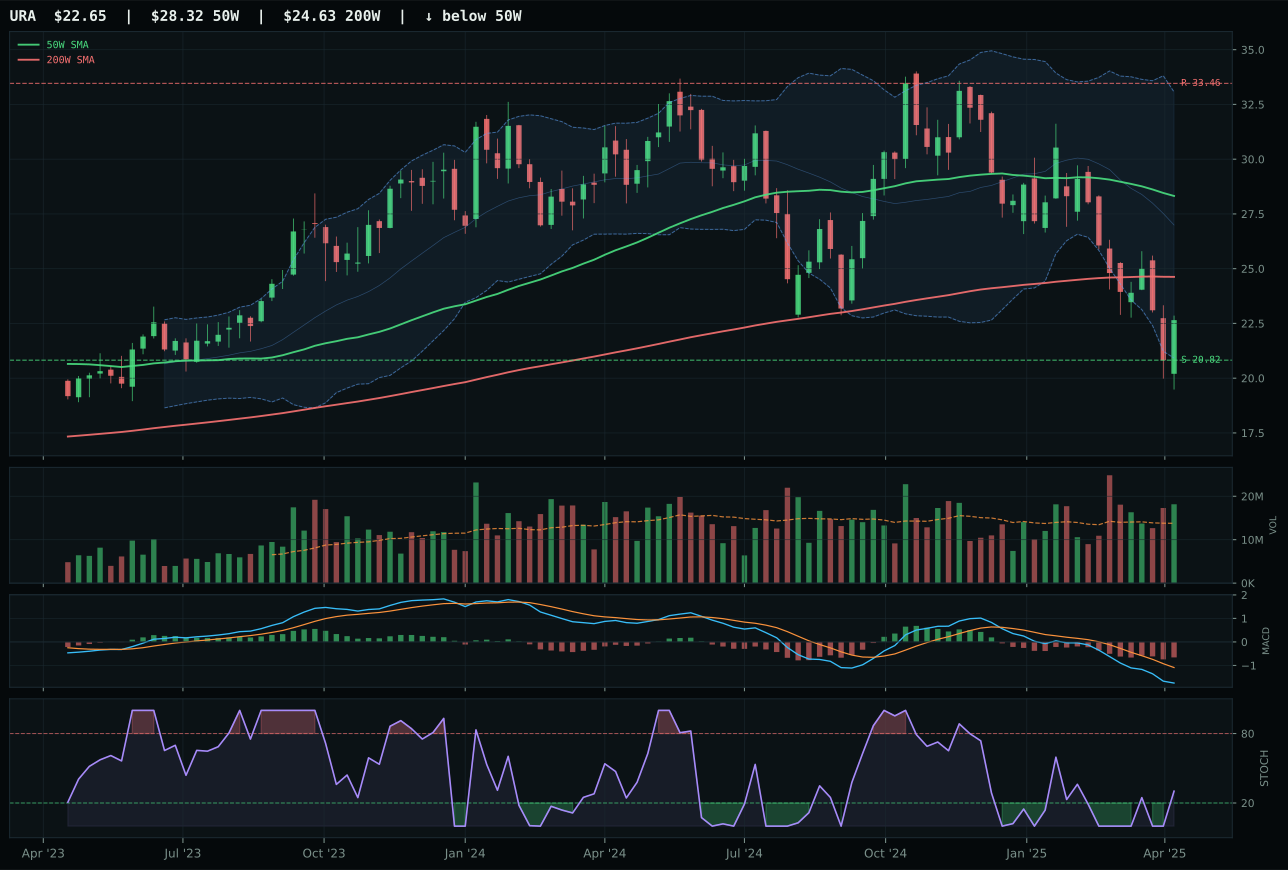
URA has a neutral structure profile with -8.6% 13-week relative strength versus SPY.
A failed hold above support would weaken the setup.
Actionable but governed by invalidation levels.
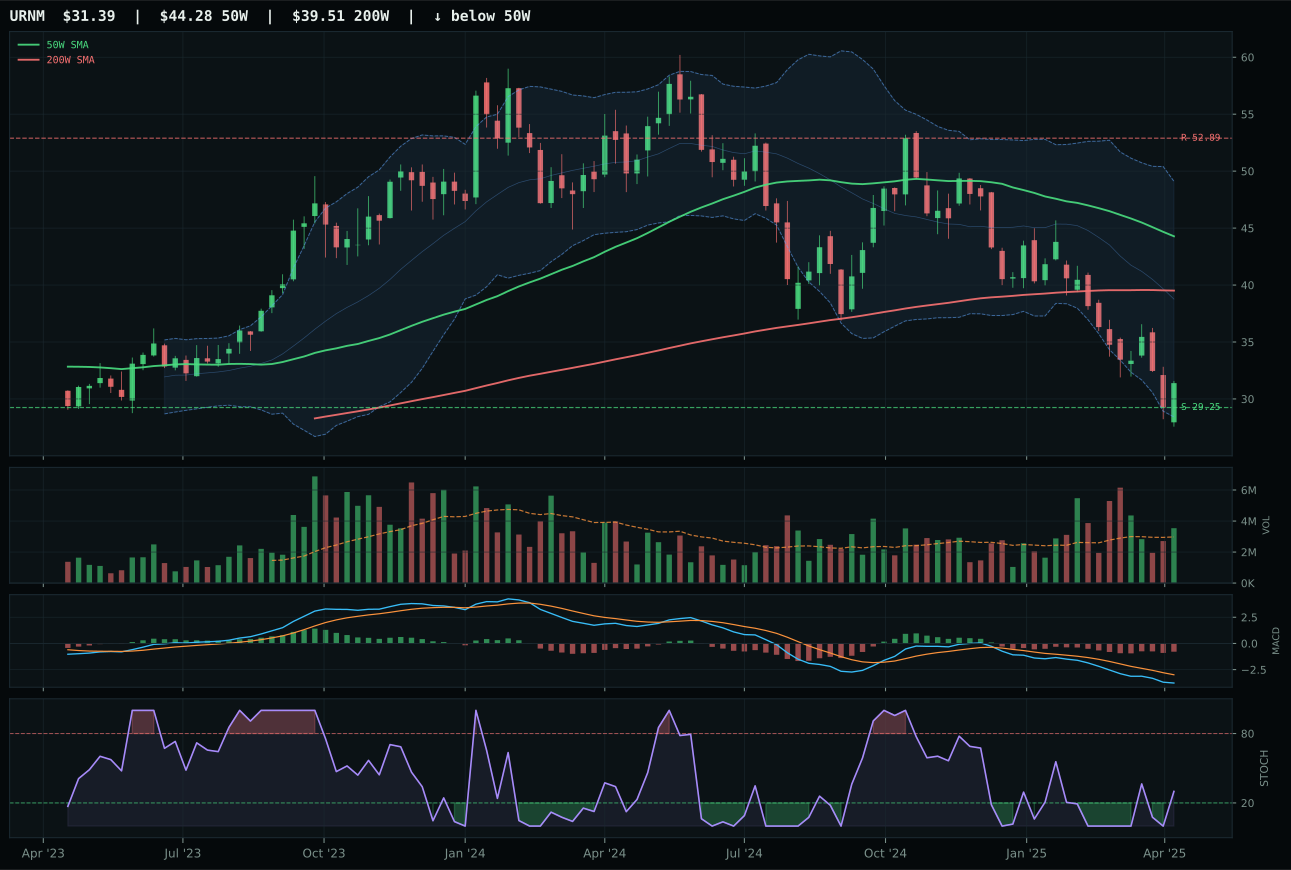
URNM has a neutral structure profile with -14.1% 13-week relative strength versus SPY.
A failed hold above support would weaken the setup.
Actionable but governed by invalidation levels.
NLR edged URA by the narrowest margin in the category—a 1.4-point gap in final scores—claiming the representative slot on marginally superior timing (65 versus 63) and structure cleanliness (62.6 versus 61.3). Both charts are in pullback-from-resistance territory with stochastic RSI rising from mid-range, a setup that implies neither momentum nor capitulation but rather a slow accumulation coil. NLR sits 11.3% below the 50W, above the 200W, in the classic repair zone where patience is rewarded more than speed. URA's volume participation is heavier at above-average versus NLR's neutral, yet URA's RS versus SPY lags at negative 8.6 against NLR's negative 4.6, indicating that NLR is holding relative strength through the pullback. The razor-thin 5.0-point score gap between the two candidates signals that either could hold the representative position depending on next week's technical evolution.
Nuclear Energy earns 5% as a tier-2 allocation, reflecting its 22.9 category score and ranking well below both top-2 overweights. Macro support is present but not dominant: defensive rotation adds 6 points and broad market bear adds 3, yet liquidity stress subtracts 7 and risk appetite broken subtracts 4, resulting in a 39.0 percent category-level macro fit—below the median. The disinflation regime offers neutral treatment for nuclear; it is neither an inflation hedge nor a pro-growth cyclical, instead occupying the steady-yield defensive space. NLR's price action—consolidating below resistance, MACD bearish but holding above zero, stochastic RSI rising—suggests accumulation is building but energy is low. For Nuclear to advance to top-2, it would require either a macro pivot toward energy security or supply-chain concerns that boost utility demand, or a technical breakout above resistance at 96.64 with MACD confirmation. The defensive posture is warranted, but conviction is reserved pending a more constructive setup.
AI — AIQ
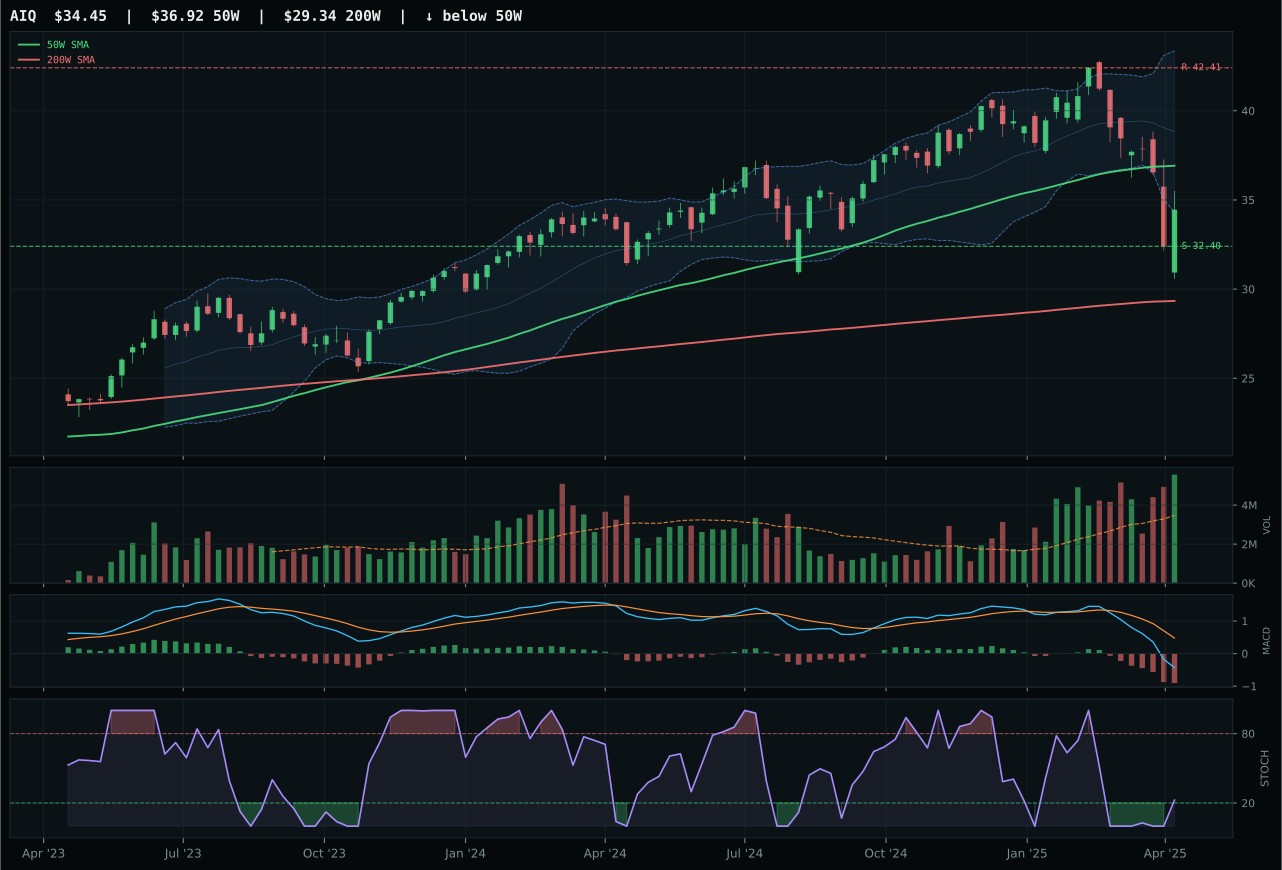
AIQ has a neutral structure profile with -1.8% 13-week relative strength versus SPY.
A failed hold above support would weaken the setup.
Actionable but governed by invalidation levels.
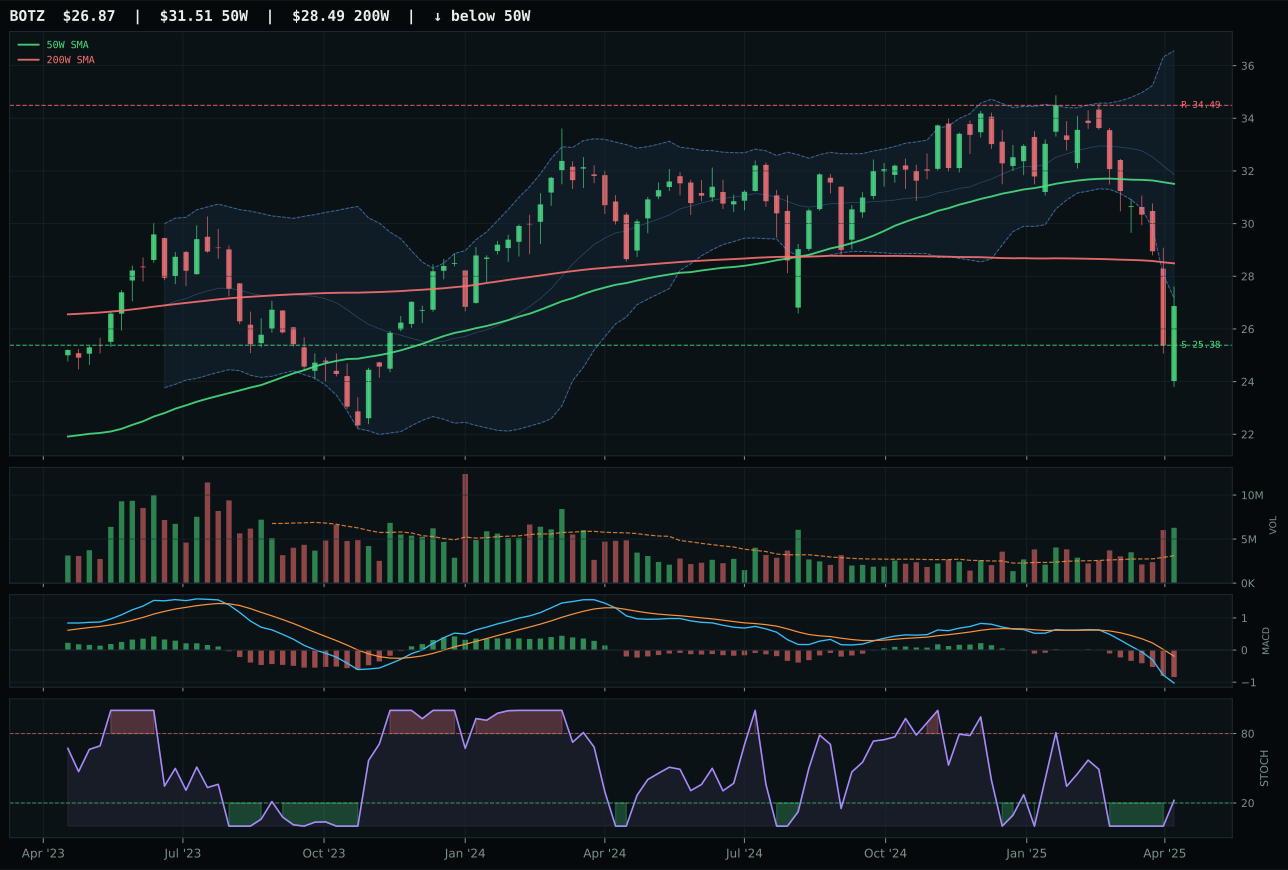
BOTZ has a neutral structure profile with -7.5% 13-week relative strength versus SPY.
A failed hold above support would weaken the setup.
Actionable but governed by invalidation levels.
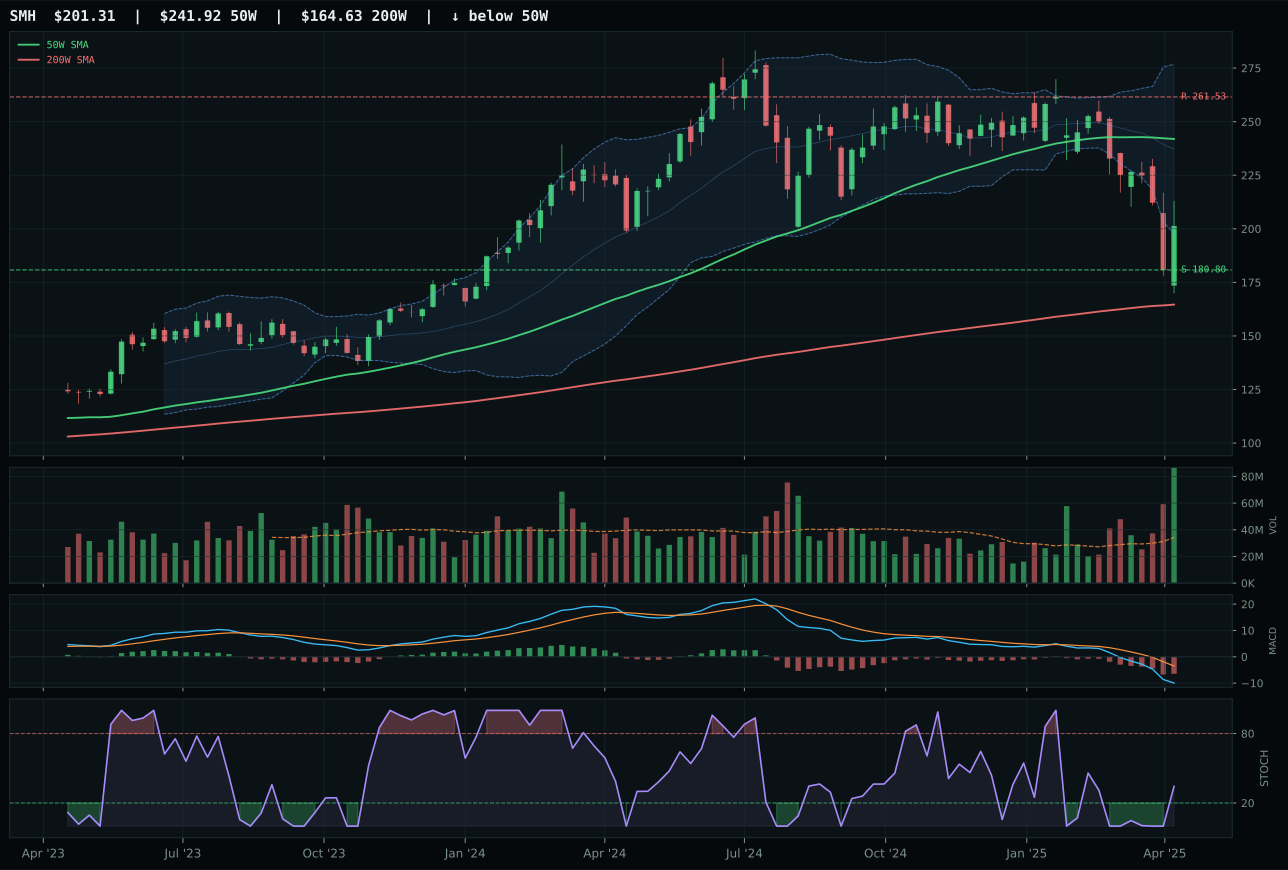
SMH has a neutral structure profile with -10.5% 13-week relative strength versus SPY.
A failed hold above support would weaken the setup.
Actionable but governed by invalidation levels.
AIQ won by posting a 22-point edge in the timing score—85 versus BOTZ's 58—and securing a 5.7% category-relative strength advantage that BOTZ could not match. The chart setup favors this outcome: price sits 6.7% below the 50W but holds above the 200W, placing AIQ squarely in pullback/repair territory where breadth and volume confirmation matter more than extended trending. AIQ's risk-reward profile scored a perfect 100, reflecting only 6.3% downside to support versus 18.8% upside to resistance, a skew that invites entry near capitulation rather than breakout. BOTZ deteriorated across all three dimensions—its trend score lagged at 16, momentum returned a zero, and category-relative strength stayed flat—creating a 23.9-point gap that rendered the decision mechanical. Volume accumulation at 1.60x average and stochastic RSI rising from the lower zone suggest that if this reset holds, it may prove constructive.
AI earns 5% as a tier-2 category, reflecting a 22.6 final score that trails both top-2 overweights and sits lower than Defense. Liquidity stress is the primary headwind here: it penalizes the category by 12 points at the category level and by 9 points specifically at the AIQ level. The macro regime is neutral to slightly negative—disinflation provides a mild plus, but risk appetite broken and broad market bear conditions suppress appetites for growth-oriented exposure. AIQ's fundamental positioning as a software and application breadth play remains intact, but the category-level macro fit of only 35 percent signals that capital flows are moving elsewhere. For AI to graduate to the 10% tier, it would need MACD to cross bullish and hold, support to remain unbroken through a test, and a material reduction in the risk-appetite-broken descriptor or a sharp pivot toward monetary hedge bid themes.
Emerging Markets — INDA
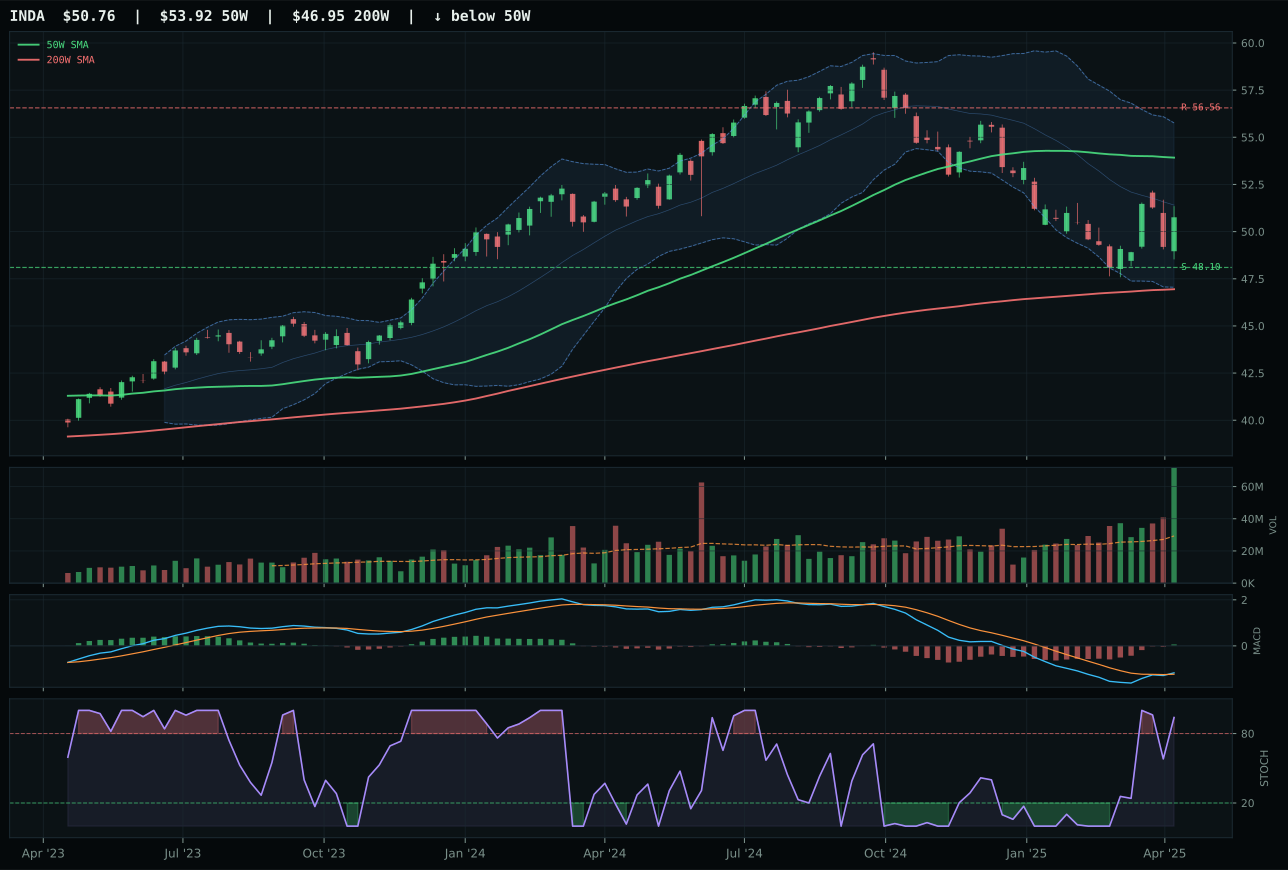
INDA has a neutral structure profile with 7.1% 13-week relative strength versus SPY.
A failed hold above support would weaken the setup.
Actionable but governed by invalidation levels.
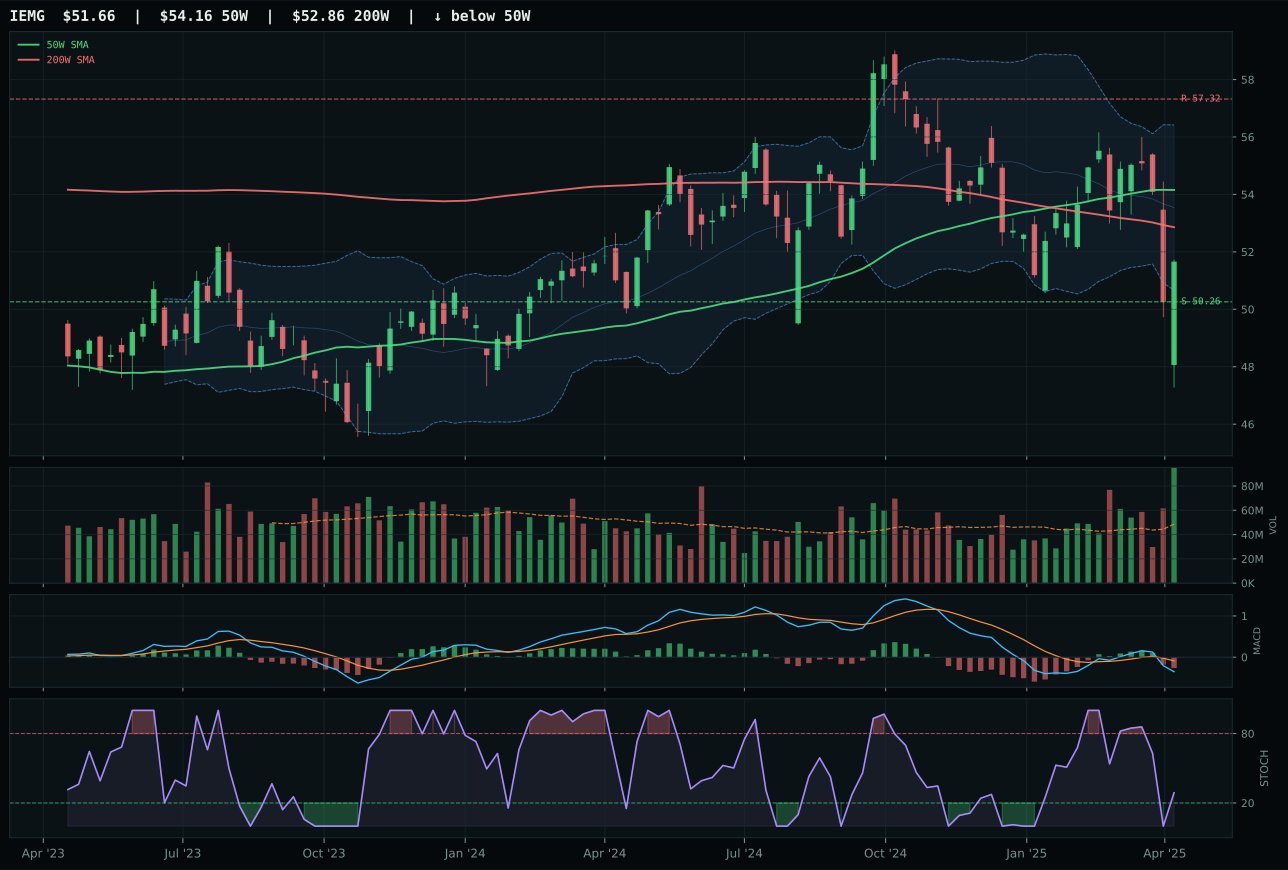
IEMG has a pullback into support profile with 8.9% 13-week relative strength versus SPY.
A failed hold above support would weaken the setup.
Actionable but governed by invalidation levels.
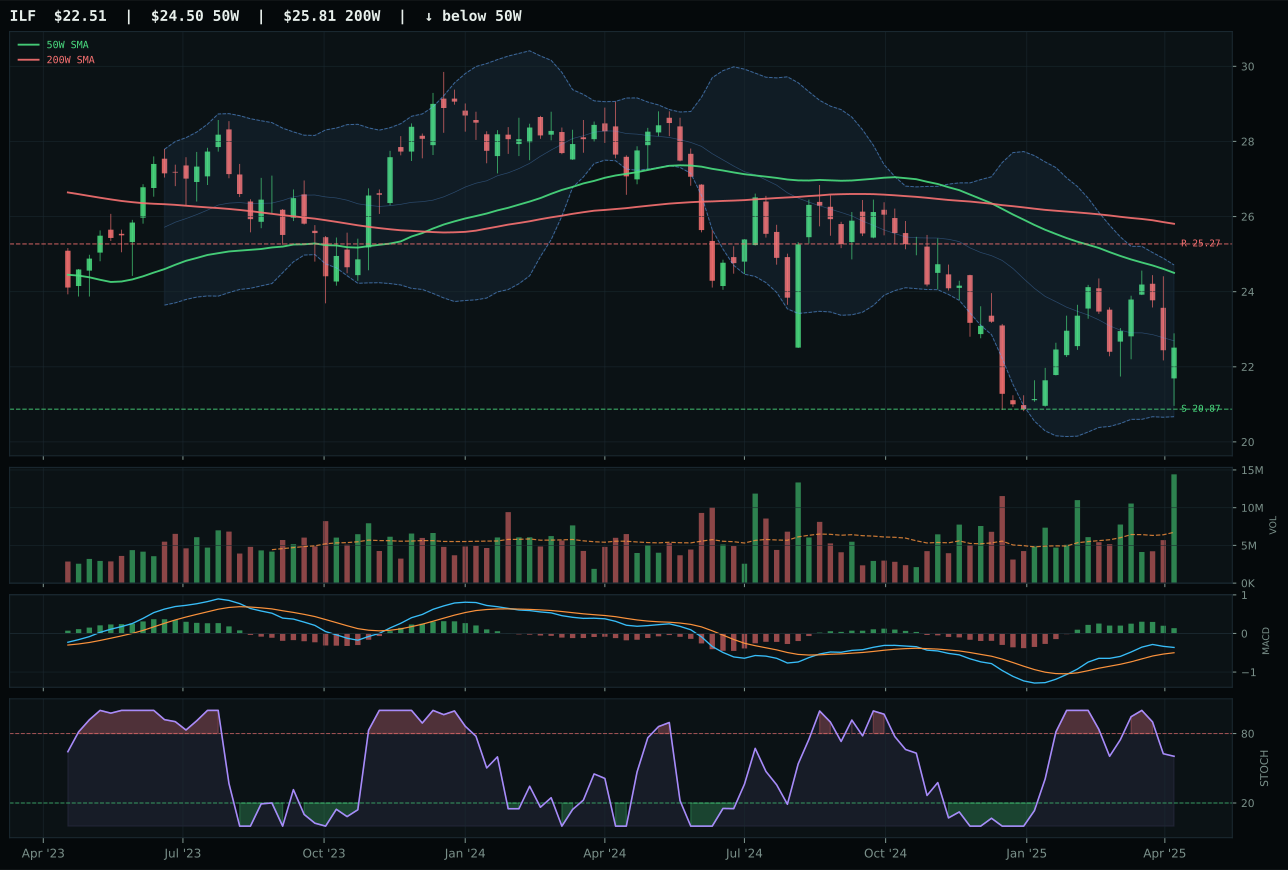
ILF has a neutral structure profile with 14.5% 13-week relative strength versus SPY.
Extension and support failure are the main tactical risks.
Tracked, but not top-2 eligible because: structurally broken.
INDA defeated IEMG on a single critical difference: MACD confirmation. INDA posted bullish and improving versus IEMG's bearish/weakening, a divergence that swung the 50-percent technical weight decisively. Both charts sit below the 50W but above the 200W, in identical repair-zone setups, with comparable risk-reward profiles and support structures. INDA's 7.1% RS versus SPY and 2.48x volume accumulation are positive, yet IEMG actually sports 8.9% RS versus SPY—higher than INDA—and identical volume confirmation. The win came down to MACD momentum: INDA's improvement signal and stochastic RSI rolling over from overbought suggest fresh accumulation, while IEMG's weakness and falling stochastic RSI signal distribution. The 7.7-point gap reflects the magnitude of that one difference; the categories are nearly twins.
Emerging Markets earns 5% as a tier-2 allocation, a rank that reflects its 21.3 category score and placement below all higher-tier categories. Macro headwinds are substantial: liquidity stress contributes minus 10 and broad market bear contributes minus 9, producing a category-level macro fit of only 31 percent—among the lowest in the portfolio. Disinflation offers no thematic boost to emerging markets; they are cyclical assets most favored in risk-on regimes. INDA's bullish MACD and higher RS versus SPY provide a relative edge within the category, yet both are insufficient to overcome the macro regime. The allocation preserves exposure to the recovery narrative without overcommitting to a bet that depends on macro conditions shifting. For Emerging Markets to earn top-2 status, it would require a fundamental macro pivot: either risk appetite descriptor flipping from broken to intact, or liquidity stress lifting materially. Until then, the 5% is a hold option rather than a conviction position.
Agriculture & Livestock — WEAT
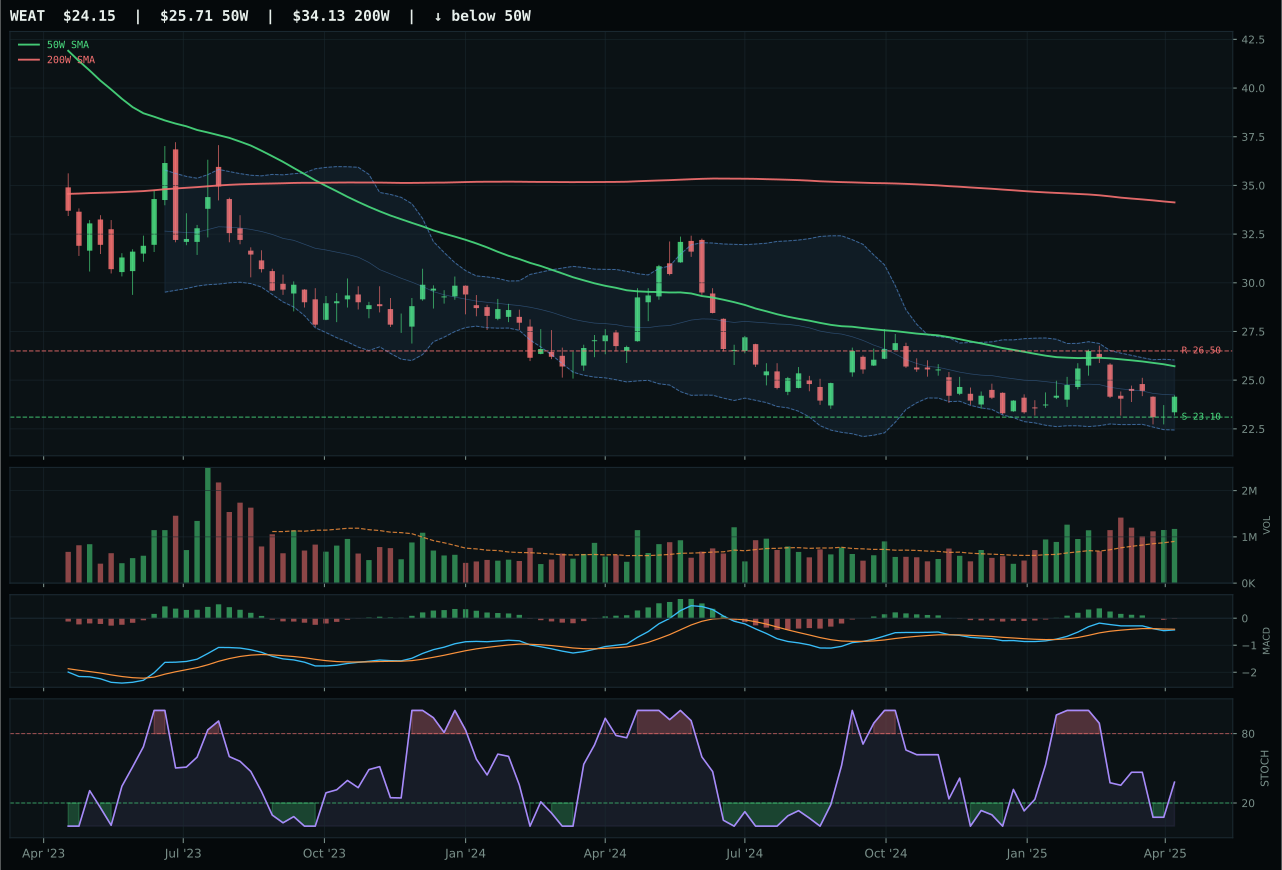
WEAT has a pullback into support profile with 10.6% 13-week relative strength versus SPY.
Extension and support failure are the main tactical risks.
Tracked, but not top-2 eligible because: structurally broken.
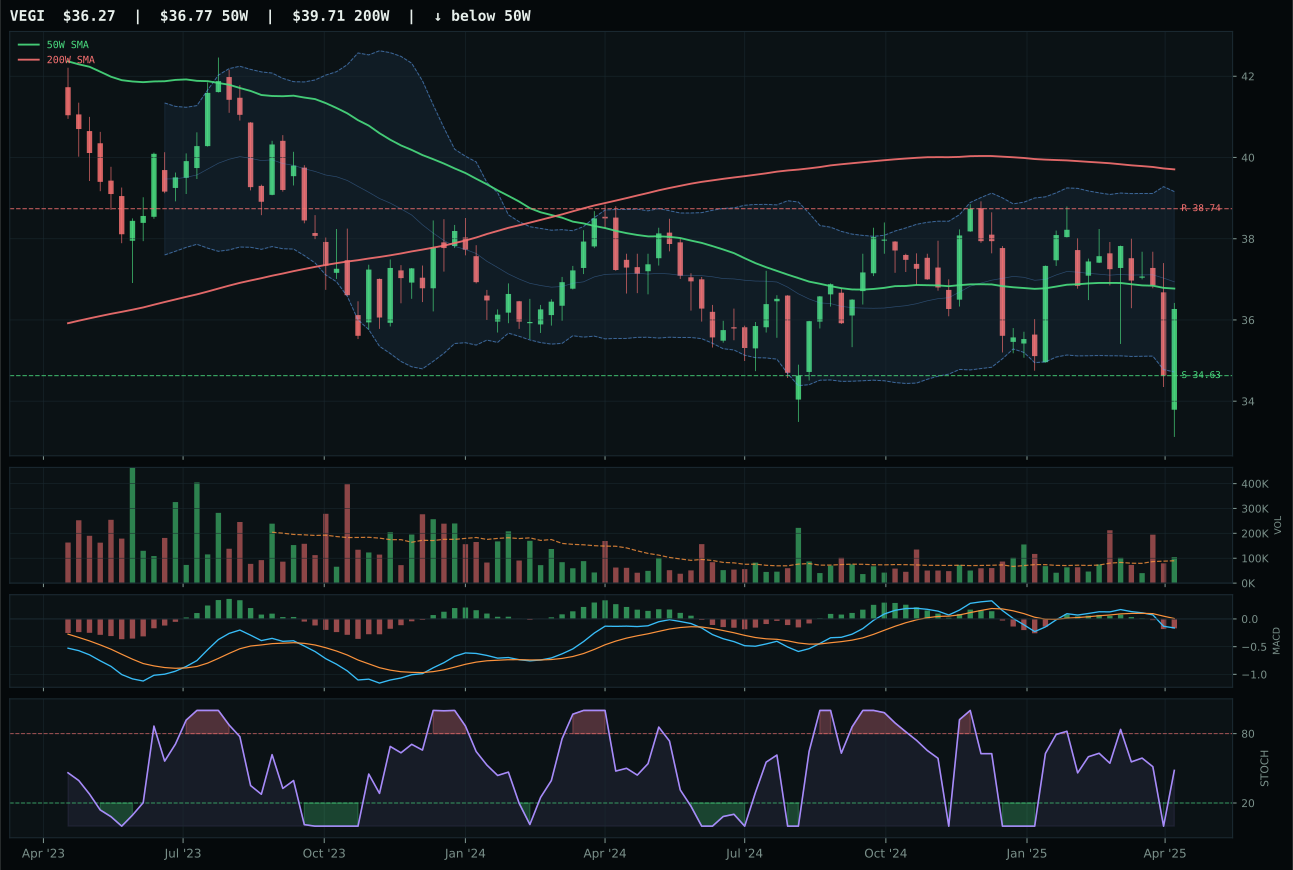
VEGI has a pullback into support profile with 11.3% 13-week relative strength versus SPY.
Extension and support failure are the main tactical risks.
Tracked, but not top-2 eligible because: structurally broken.
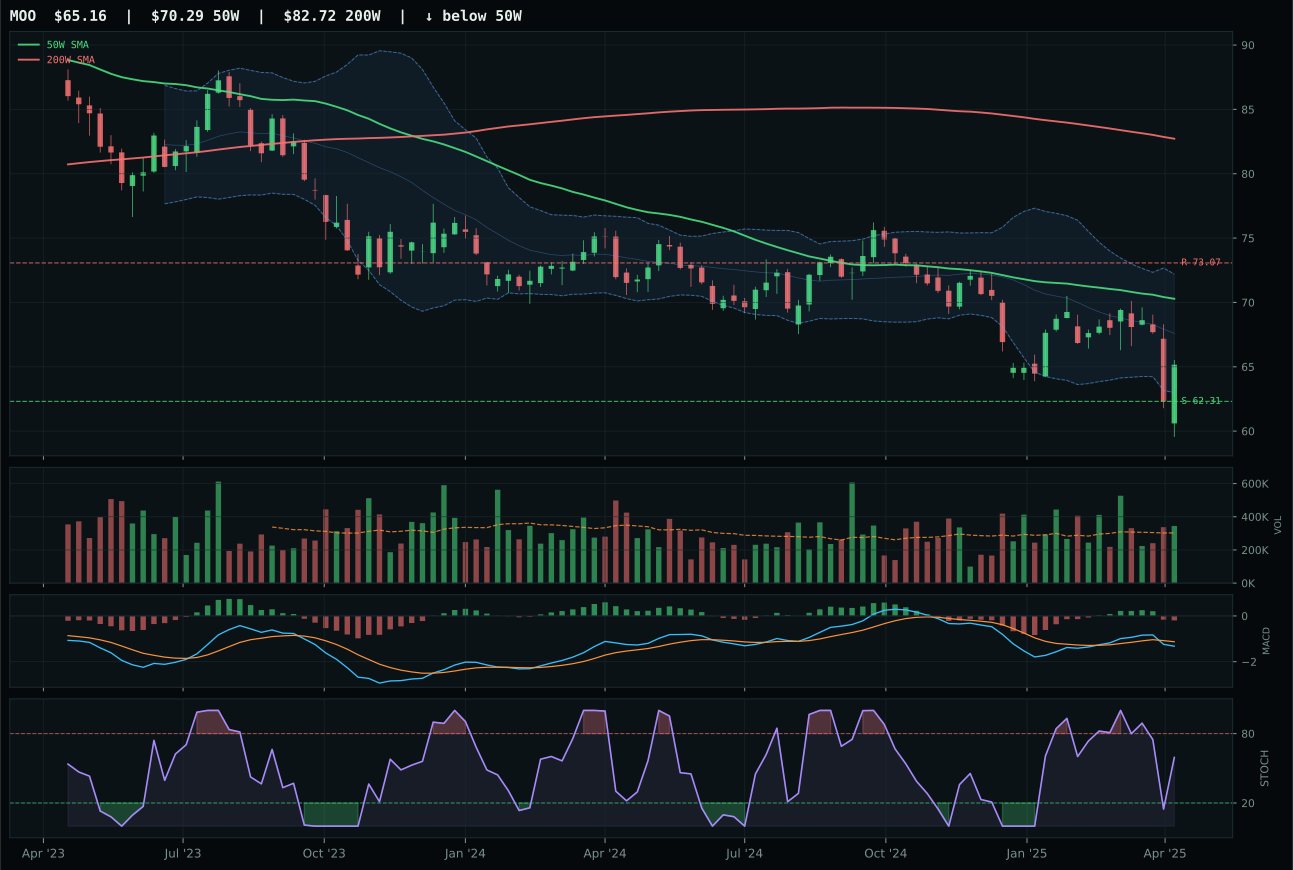
MOO has a pullback into support profile with 9.1% 13-week relative strength versus SPY.
Extension and support failure are the main tactical risks.
Tracked, but not top-2 eligible because: structurally broken.
WEAT won a shallow victory over VEGI, edging it by 18.2 points in composite score despite nearly identical chart setups—both are pullbacks into support with falling/neutral stochastic RSI and bearish/weakening MACD. WEAT's edge came from marginally better risk-reward (80.1 versus 77.2) and slightly cleaner structure (48.4 versus 46.5), but the wins are narrow and the setup itself is structurally broken according to hard filters. Price sits 6.1% below the 50W and below the 200W, placing it in deep repair territory where support at 23.10 becomes the only reliable reference point. Volume at 1.30x average shows participation but not conviction, and MACD deterioration points to exhaustion rather than accumulation. Category-relative strength is neutral, RS versus SPY is positive at 10.6%, yet the 13W return of 2.5% masks the longer-term deterioration: 26W return is -10.2%, confirming that recent strength is a bounce, not a trend.
Agriculture earns 5% allocation this week; the category is excluded entirely due to failed eligibility filters. Its 0.0 final score came after posting a 38.7 baseline from the 3/2/1 weighted basket, then failing hard structural tests. Disinflation is the primary macro headwind—the regime penalizes this category by 6 points and disinflation pressure by another 8, alongside liquidity stress at minus 4. Commodities and agricultural exposure are classical inflation hedges; in a disinflation environment, the narrative inverts entirely. WEAT's chart, despite ranking first, shows price below both moving averages and MACD weakness, confirming that technical deterioration matches macro regime misalignment. For this category to earn a 5% tier-2 slot, either MACD would need to snap bullish and hold above the 50W at 24.65, or the macro regime would need to shift toward inflation concerns—neither is imminent. Until then, capital is better deployed elsewhere.
Industrial Metals — COPX
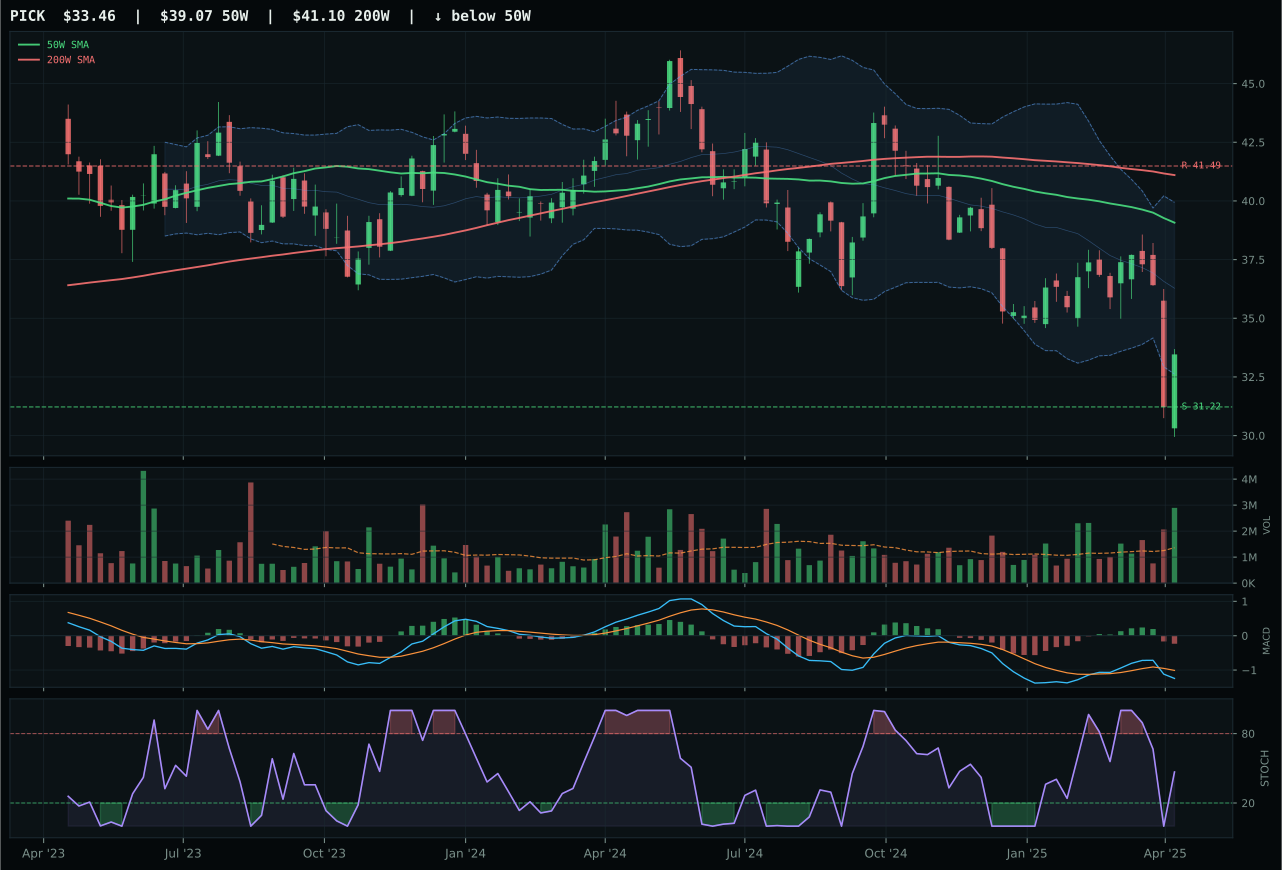
PICK has a neutral structure profile with 3.8% 13-week relative strength versus SPY.
Extension and support failure are the main tactical risks.
Tracked, but not top-2 eligible because: structurally broken.
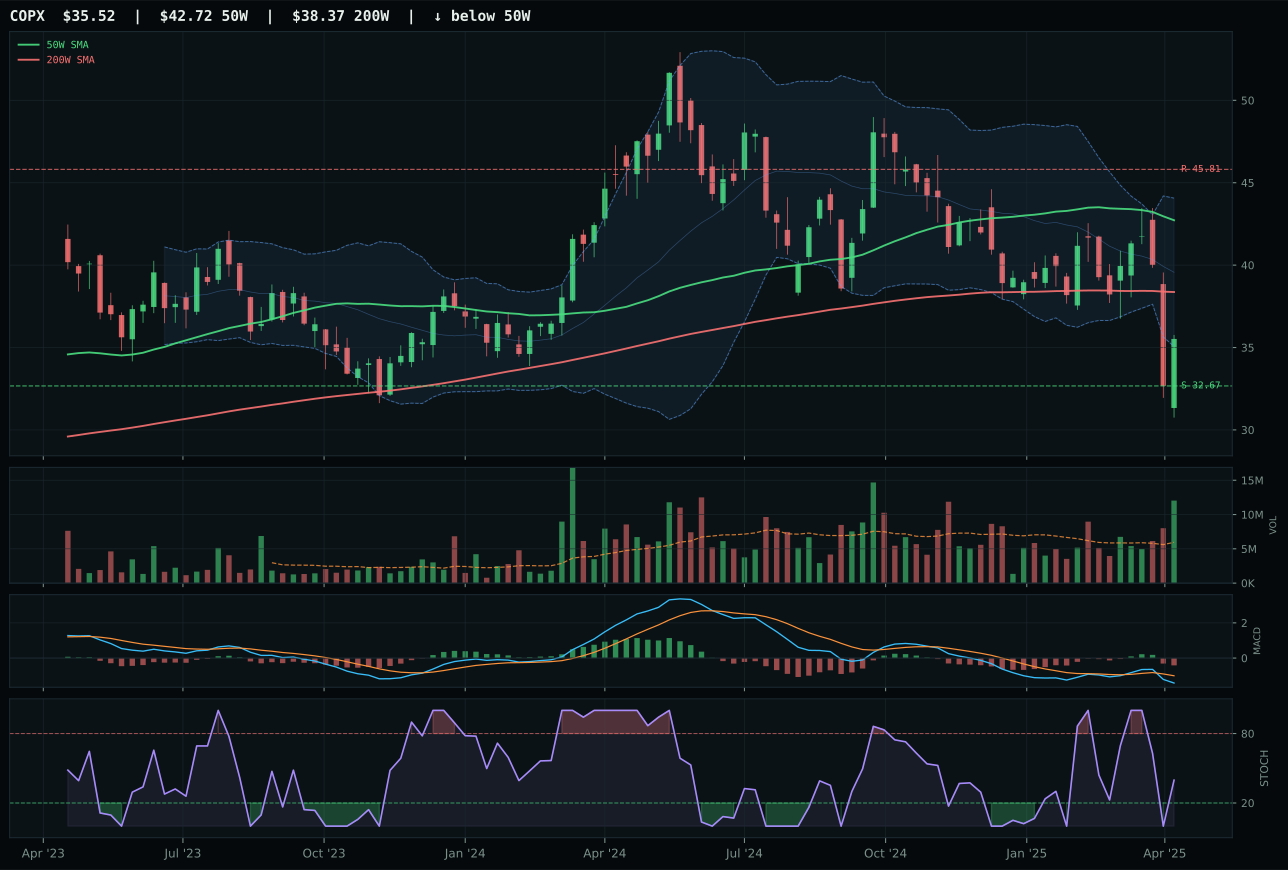
COPX has a neutral structure profile with -1.3% 13-week relative strength versus SPY.
A failed hold above support would weaken the setup.
Actionable but governed by invalidation levels.
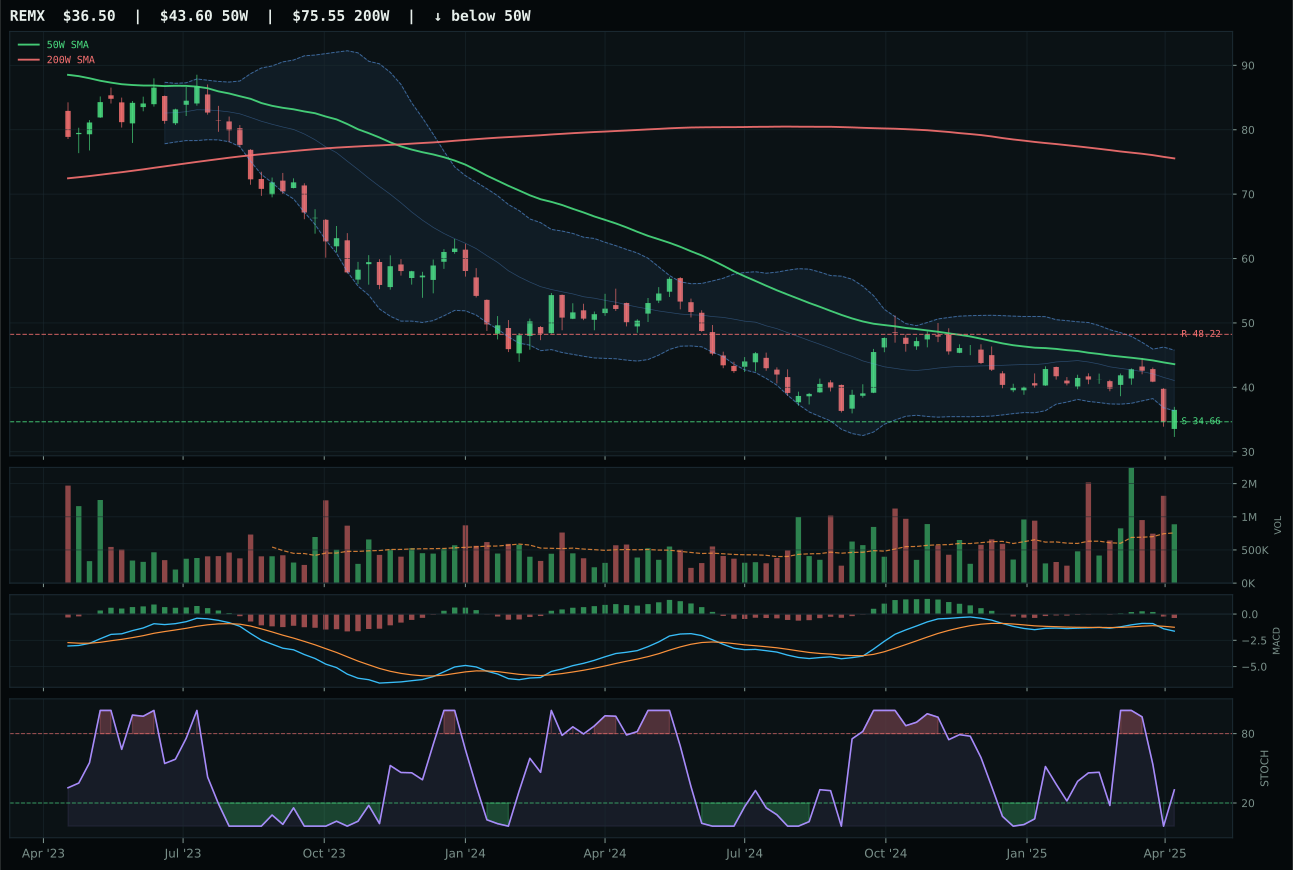
REMX has a neutral structure profile with -1.4% 13-week relative strength versus SPY.
Extension and support failure are the main tactical risks.
Tracked, but not top-2 eligible because: structurally broken.
COPX won the category representative role but failed to generate a category score above the exclusion threshold, earning only 5.8 and landing outside the allocation entirely. The victory over PICK came down to structure: COPX scored 74.7 versus PICK's 45.4, a decisive technical edge in a chart that is otherwise deeply challenged. Price sits 16.9% below the 50W, below the 200W, with MACD bearish/weakening and stochastic RSI falling neutral—all hallmarks of a sector in repair rather than accumulation. The 13W return of negative 9.3% and RS versus SPY of negative 1.3% confirm that industrial metals are lagging the broad market. Volume at 2.02x average appears heavy, yet it's accompanying downside, not upside, a classic sign of capitulation rather than sponsorship. PICK's 0.0% category-relative strength and structural failure filter meant it couldn't overcome COPX's marginally cleaner setup.
Industrial Metals receives 0% allocation this week and is excluded entirely from the tier structure. The category's 5.8 final score reflects its inability to pass eligibility filters, driven by a macro regime that is fundamentally misaligned. Disinflation pressures hurt industrial metals by 8 points at the descriptor level, and the category-level macro fit of only 42 percent underscores the mismatch: industrial metals are economically sensitive and inflation-correlated assets that lose appeal when deflation signals intensify. Liquidity stress adds another minus 8 penalty. COPX's chart—price deep below both moving averages, MACD deteriorating, stochastic RSI falling—mirrors the macro headwind perfectly. For this category to earn even a 5% tier-2 slot, it would require either a sharp reversal in the macro regime toward growth or inflation concerns, or a technical reset with MACD crossing bullish and price holding above the 200W. Neither is signaling. The capital preserved by excluding this category is better deployed to more regime-aligned exposures.
Traditional Energy — XLE
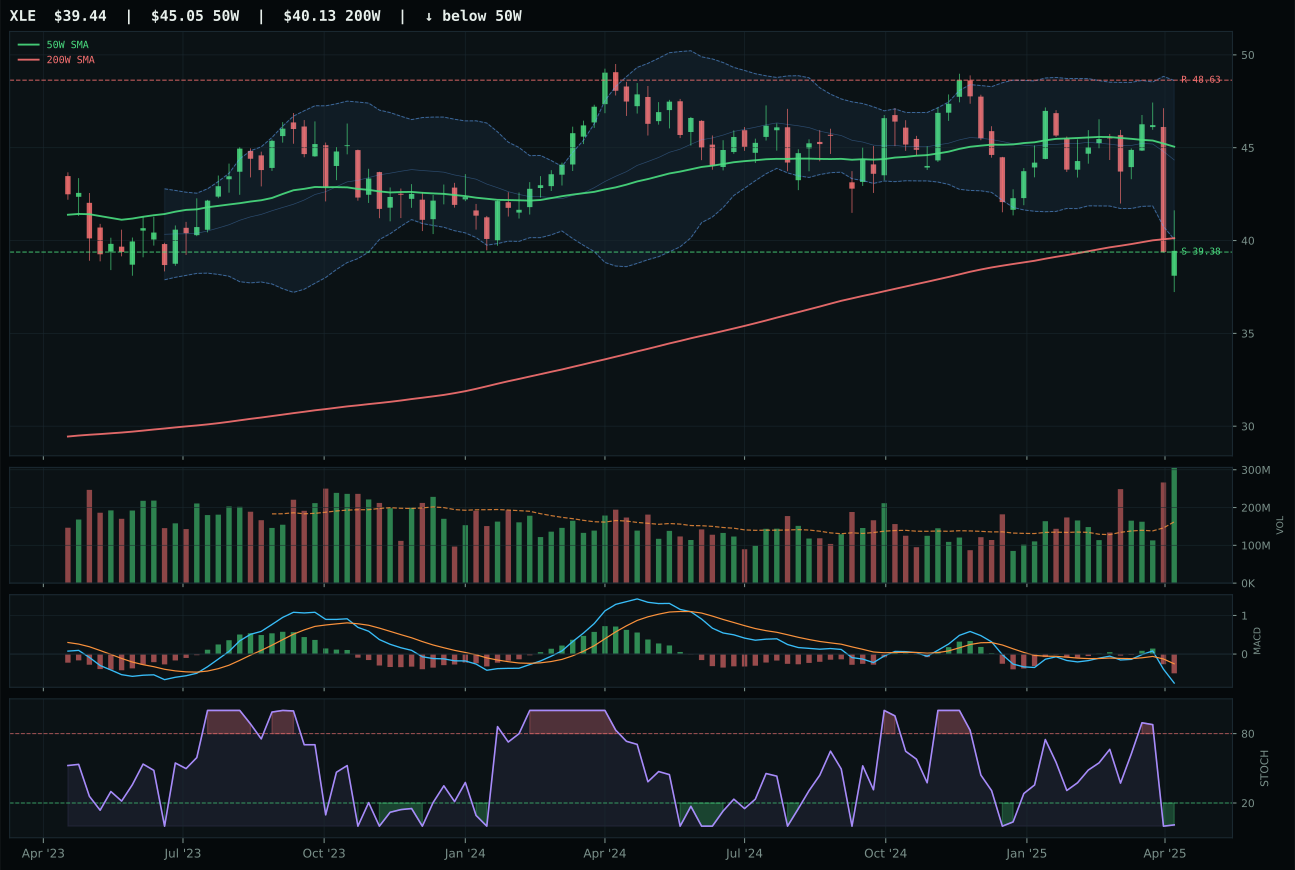
XLE has a pullback into support profile with -2.7% 13-week relative strength versus SPY.
A failed hold above support would weaken the setup.
Actionable but governed by invalidation levels.
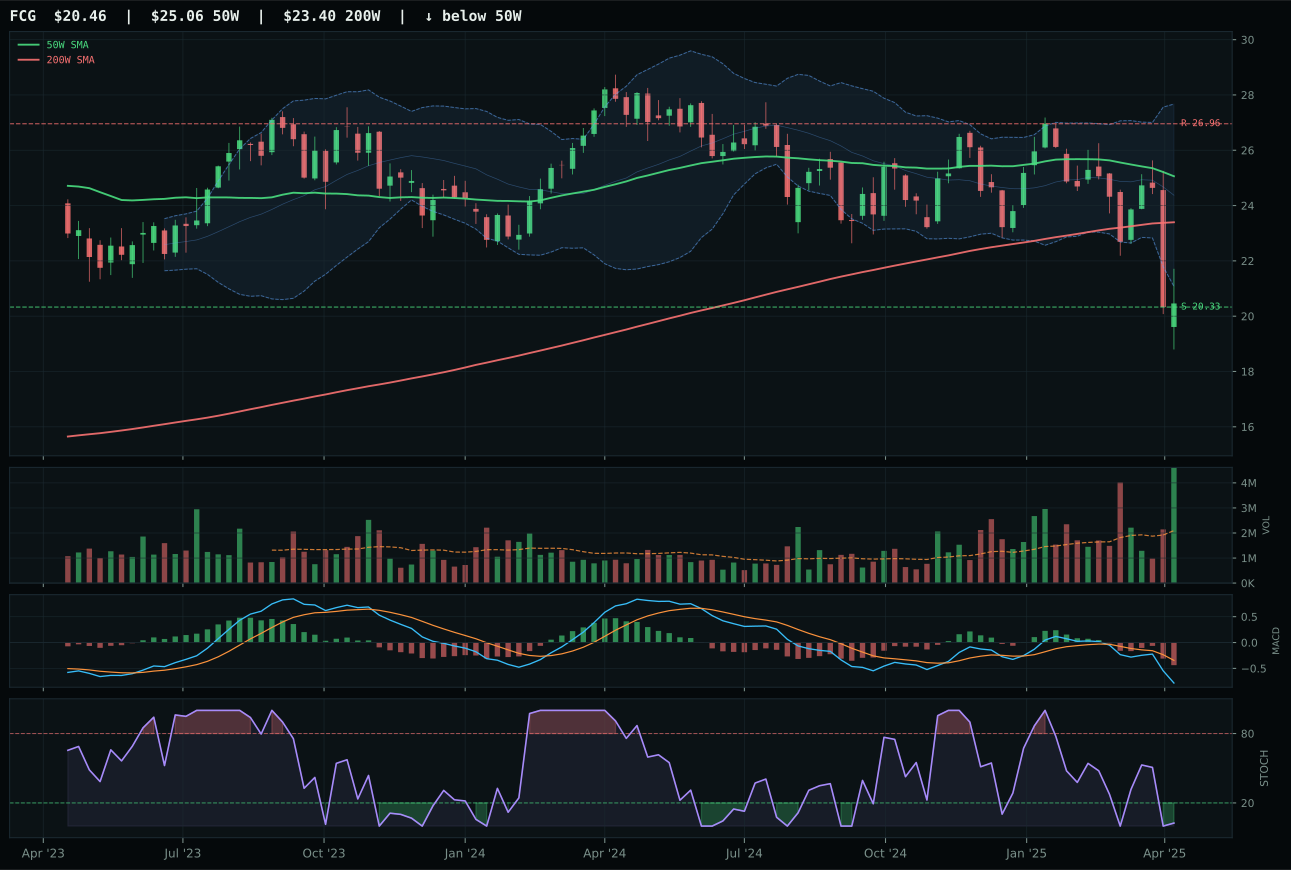
FCG has a pullback into support profile with -13.2% 13-week relative strength versus SPY.
A failed hold above support would weaken the setup.
Actionable but governed by invalidation levels.
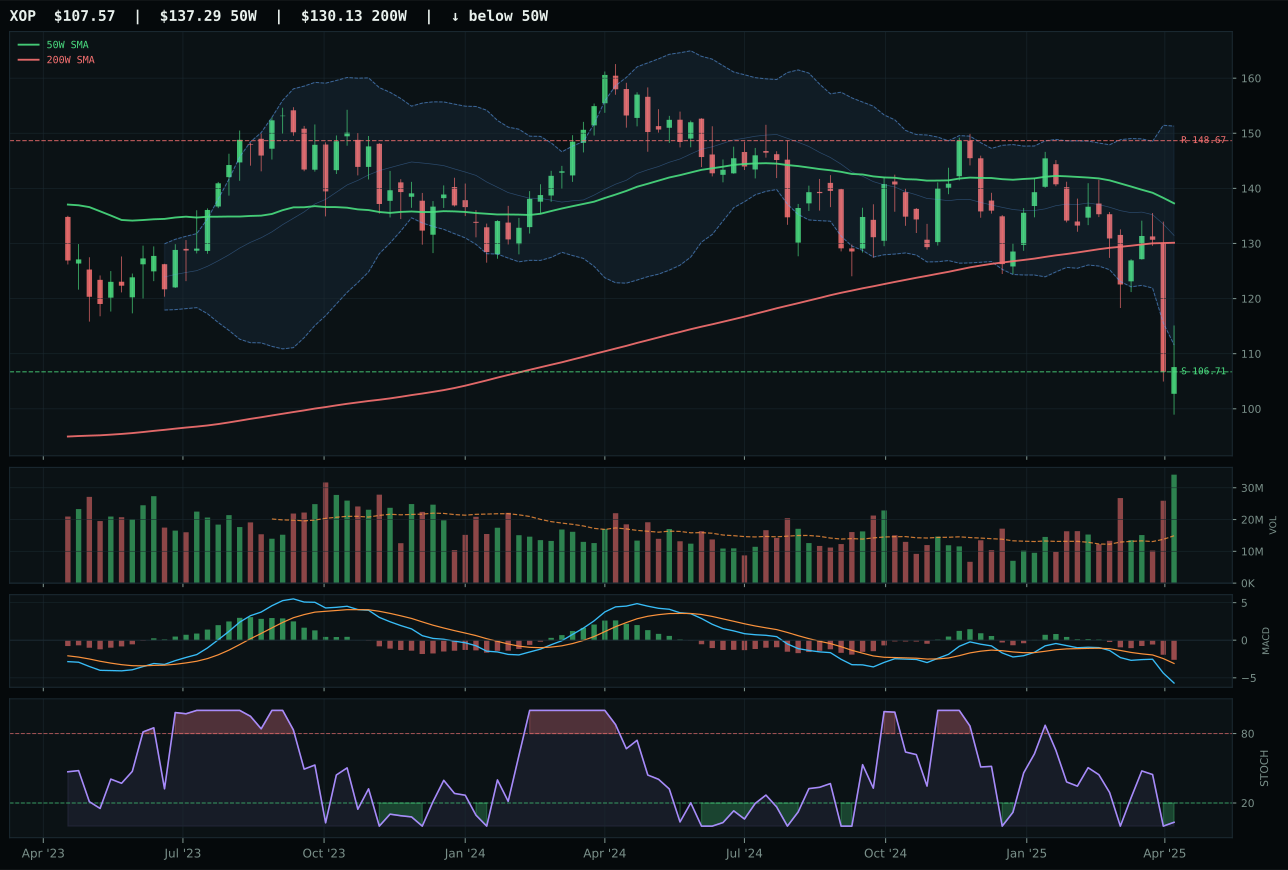
XOP has a pullback into support profile with -14.8% 13-week relative strength versus SPY.
A failed hold above support would weaken the setup.
Actionable but governed by invalidation levels.
XLE won the category representative designation but failed the eligibility filter, posting only 0.2 and earning zero percent allocation. Its victory over FCG came from superior risk-reward assessment (95.0 versus 80.0) and cleaner structure (77.7 versus 68.2), reflecting XLE's better positioning near defined support at 39.38. Price sits 12.4% below the 50W, deep in repair mode, yet the setup includes a clear invalidation point, meaning downside risk is quantifiable. Volume at 2.74x average is heavy but accompanying price testing lows, a sign of forced selling rather than constructive accumulation. Stochastic RSI is oversold at 0.01, technically extreme but not yet reversing—it needs to cross above 0.20 to confirm a bottom. FCG's 13W return of negative 21.2% and RS versus SPY of negative 13.2% disqualify it from competition, but XLE's negative 10.7% return is barely better.
Traditional Energy earns 0% allocation and is excluded from tier consideration. Its 0.2 category score and failed eligibility filters reflect a macro regime that is structurally hostile to fossil fuels. Disinflation pressure penalizes this category by 10 points, the most severe hit in the portfolio, and the broad category-level macro fit is only 23 percent—the lowest of all ten categories. In a disinflation regime, energy prices weaken, demand pressures ease, and the inflation hedge narrative inverts. XLE's chart confirms this: price is testing new lows near 39.38, MACD is deteriorating, and the 13W return is deeply negative. While the stochastic oversold extreme technically offers a mean-reversion argument, timing the bottom in a structurally unfavorable regime is a low-probability trade. For Traditional Energy to earn allocation, either the macro regime would need to pivot sharply toward growth or inflation (unlikely near-term), or prices would need to stabilize above the 50W at 44.85 with MACD crossing bullish—neither is in sight. Capital is better deployed to regime-favorable categories.