
2025-04-04
Informational purposes only. The content in this report, including allocations, analysis, and commentary, is provided solely for informational and educational purposes. It does not constitute financial advice, investment advice, trading advice, or any other type of advice. Past performance does not guarantee future results. Always conduct your own research and consult a qualified financial professional before making investment decisions.
XLE defensive overlay excluded: price is below its 8W SMA. Cause selector will use GLD or cash alternative.
Fast-crash circuit breaker triggered: SPY dropped more than 8% from its 4-week high this week. Defensive overlay activated immediately.
Slow macro Defensive trigger is active (Monetary Defense), but crypto-cycle exposure has priority for this run.
Weekly Allocation
| Ticker | Category | Weight | Role |
|---|---|---|---|
| FBTC | 50% | Overlay | |
| GLD | Precious Metals | 10% | Top-2 (10%) |
| IGF | Utilities & Infrastructure | 10% | Top-2 (10%) |
| ITA | Defense & Aerospace | 5% | Tier-2 (5%) |
| CIBR | Technology | 5% | Tier-2 (5%) |
| WEAT | Agriculture & Livestock | 5% | Tier-2 (5%) |
| NLR | Nuclear Energy | 5% | Tier-2 (5%) |
| COPX | Industrial Metals | 5% | Tier-2 (5%) |
| AIQ | AI | 5% | Tier-2 (5%) |
Trade Instructions — Monday Open
Sell the tranche from 2025-03-07 (completing its 4-week hold). Buy the new tranche. Instructions show net portfolio changes — same-asset positions cancel, weight changes show the delta.
| Action | Ticker | Instruction |
|---|---|---|
| SELL | VEGI | Sell 50% of VEGI position (reduce 2.50% → 1.25%) |
| SELL | FCG | Sell entire FCG position (1.25% of portfolio) |
| SELL | IEMG | Sell 50% of IEMG position (reduce 2.50% → 1.25%) |
| BUY | COPX | Buy COPX — 33.33% of freed cash (adds 1.25% to portfolio) |
| BUY | NLR | Buy NLR — 33.33% of freed cash (adds 1.25% to portfolio) |
| BUY | WEAT | Buy WEAT — 33.33% of freed cash (adds 1.25% to portfolio) |
Current Portfolio After Trade
Combined holdings across all 4 active tranches. Each tranche is 25% of the portfolio.
| Ticker | % of Portfolio | Weight Bar |
|---|---|---|
| FBTC | 50.00% | |
| GLD | 7.50% | |
| IGF | 7.50% | |
| ITA | 5.00% | |
| CIBR | 5.00% | |
| COPX | 3.75% | |
| AIQ | 2.50% | |
| XLU | 2.50% | |
| URNM | 2.50% | |
| XLE | 2.50% | |
| SLV | 2.50% | |
| NLR | 2.50% | |
| VEGI | 1.25% | |
| IEMG | 1.25% | |
| BOTZ | 1.25% | |
| INDA | 1.25% | |
| WEAT | 1.25% |
Macro Regime — Disinflation
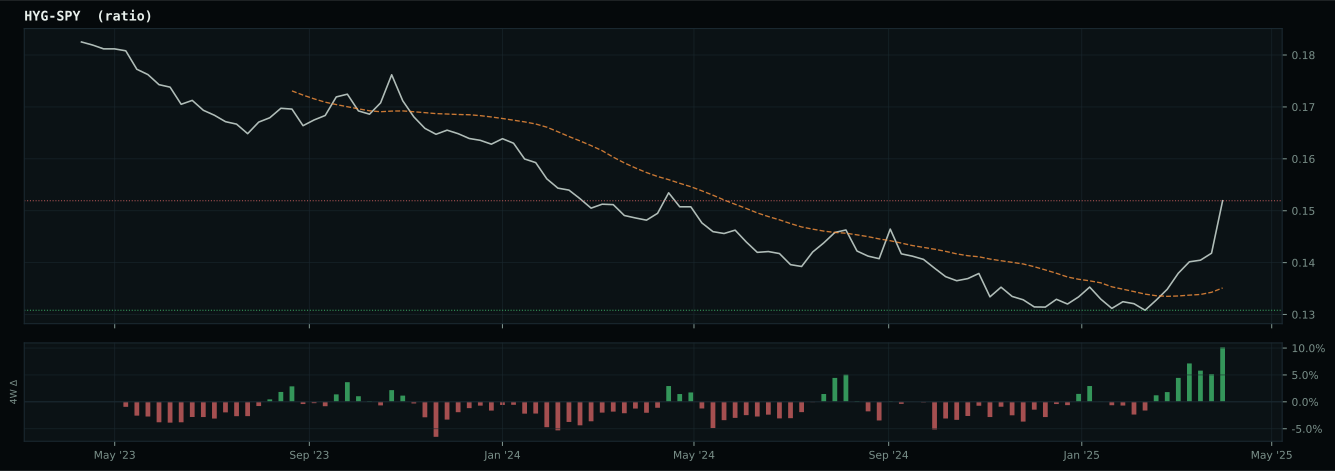
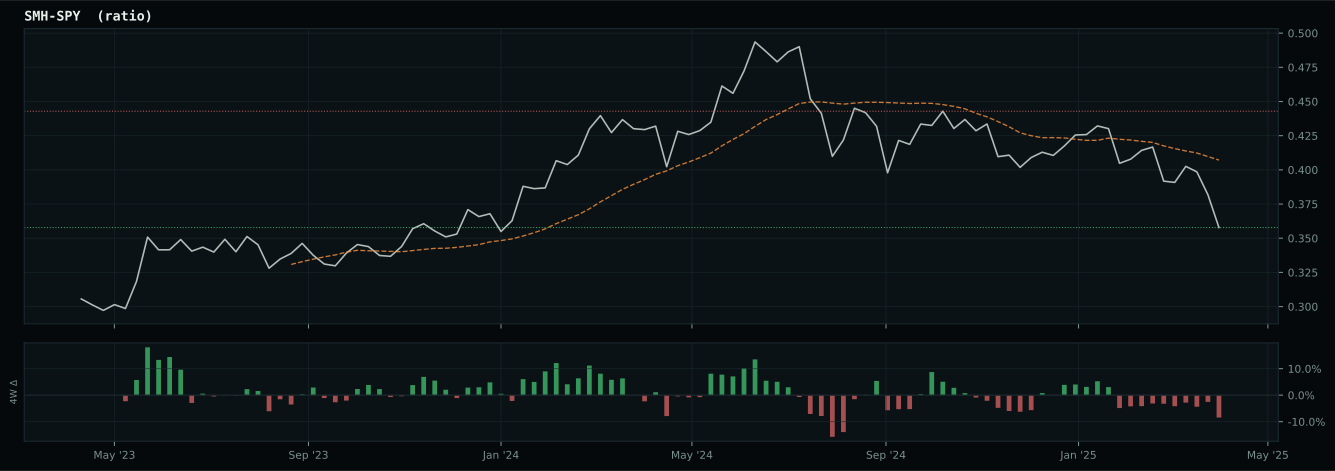
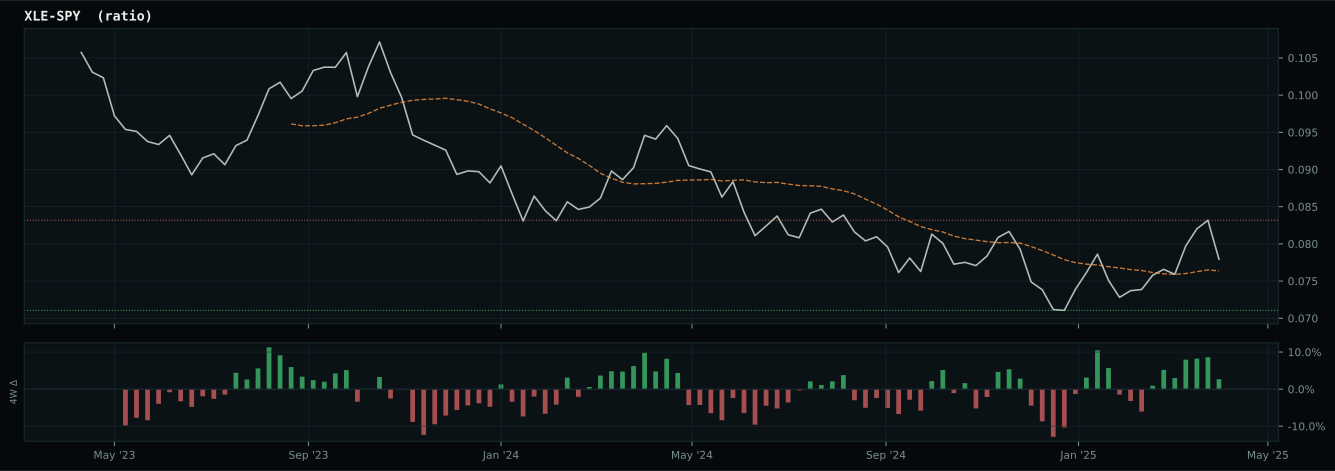
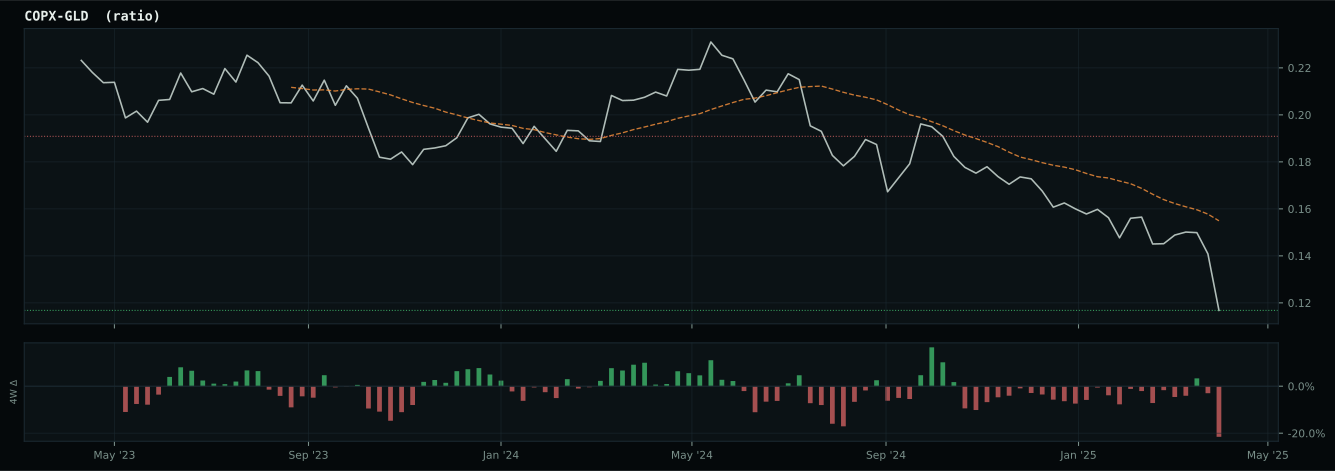
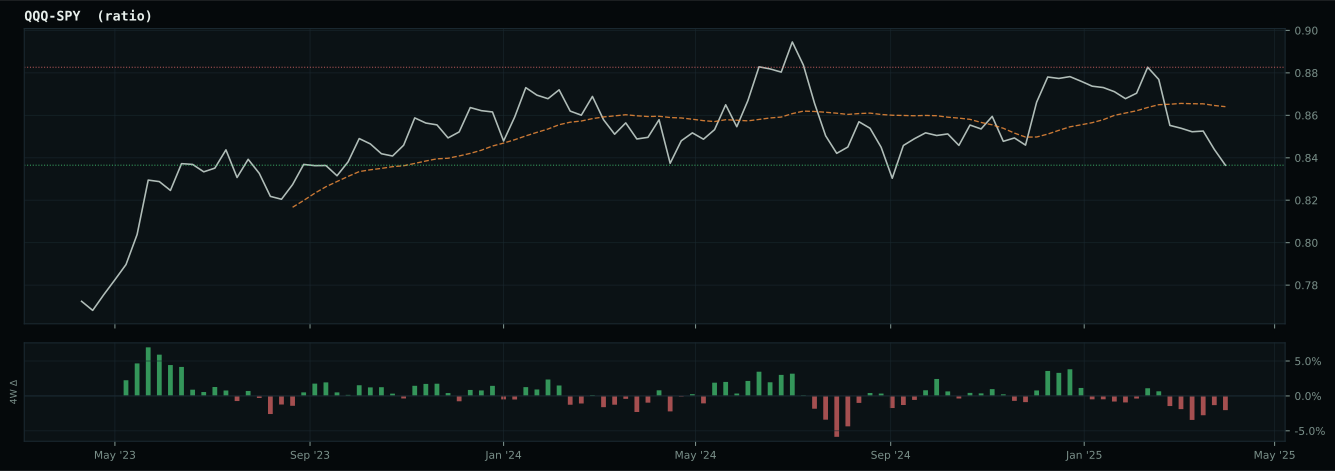
growth data is not confirming the weak market-implied risk appetite signal
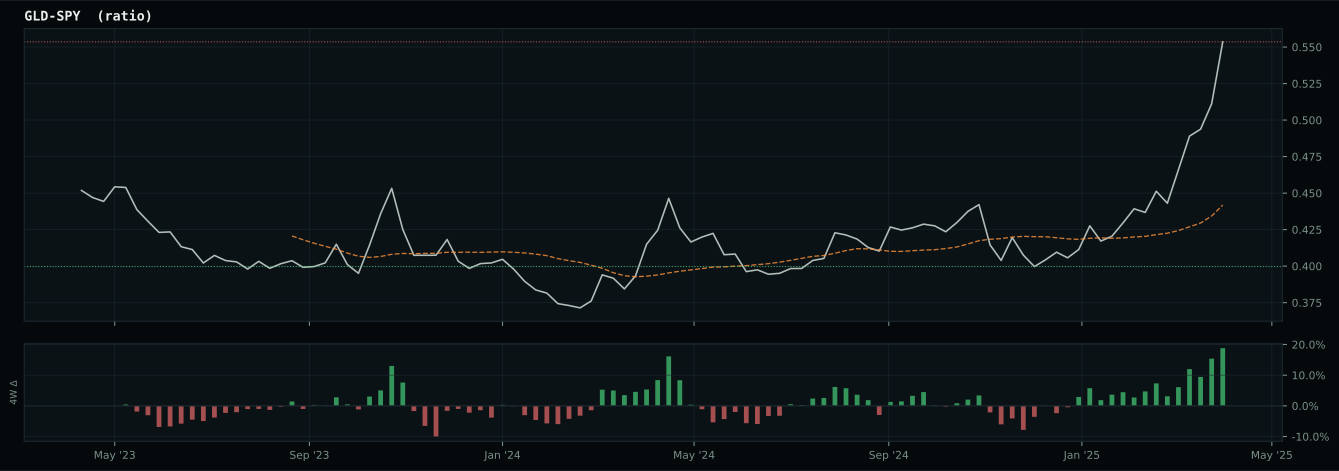
Defensive overlay cause is falling-growth or disinflation stress: gold is favored because falling real-yield pressure and monetary hedging are more relevant than cyclical commodity demand. GLD has been confirmed above its 8W SMA and is eligible.
Macro Evidence Charts
Market-implied signals behind the macro regime scores. Each ratio compares two assets; the direction and slope of the ratio is what the macro engine reads.
Crypto Regime — TrendBTC
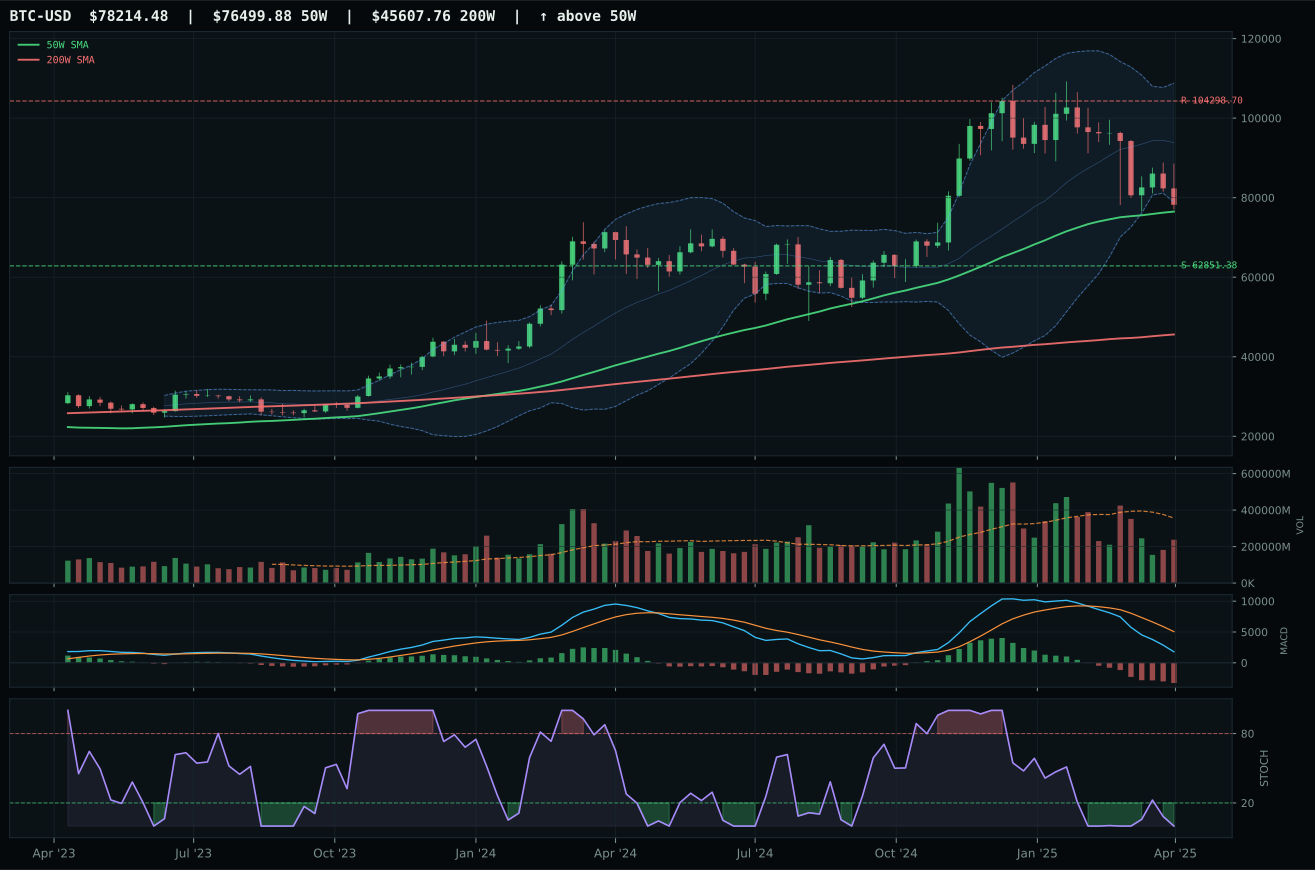
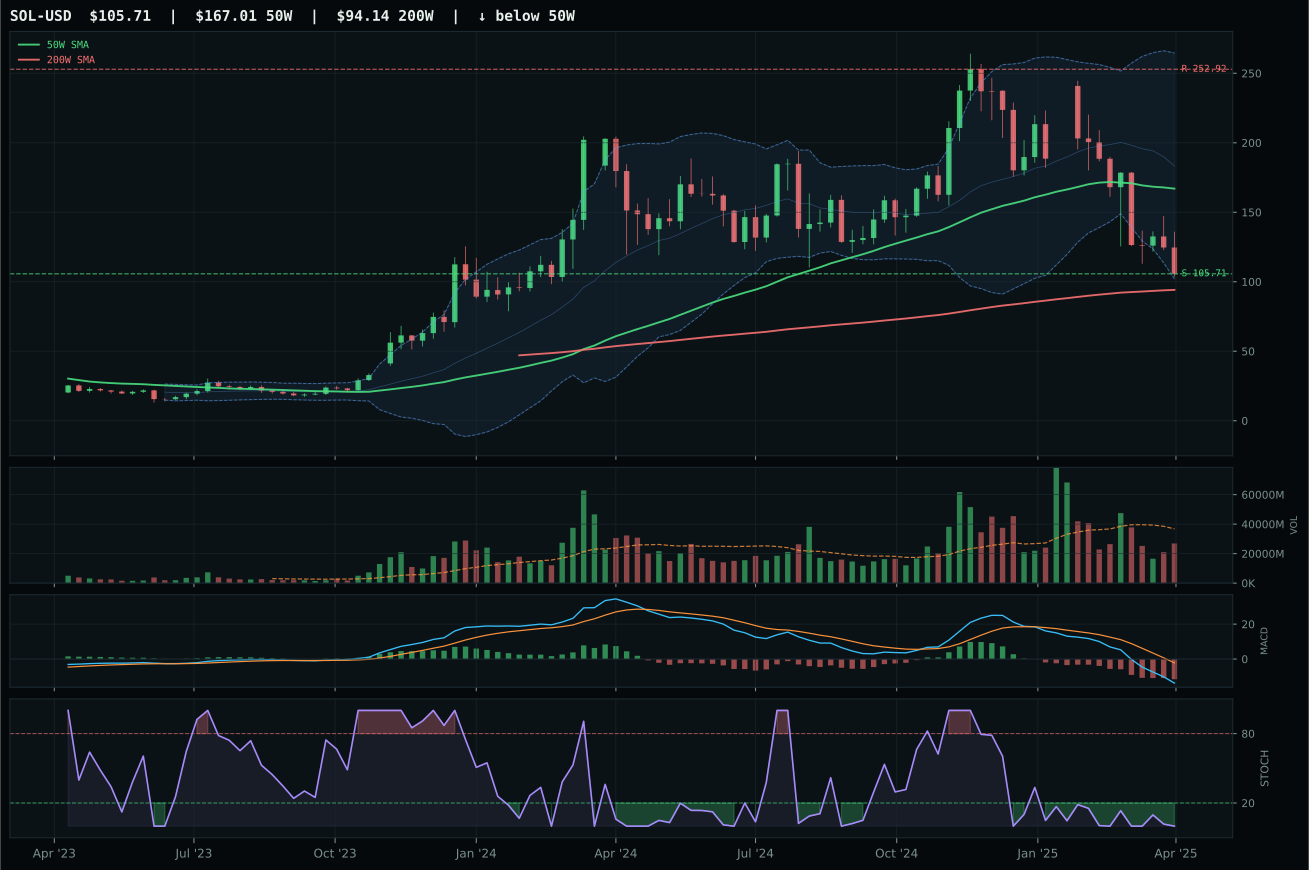
ValueBTC not armed: BTC has not made the first post-breakdown touch of the 200W buy zone after losing the 50W
TrendBTC confirmed: 2 consecutive closes above rising/flat 50W SMA
one or more available conditions failed
Category Rankings
| Rank | Category | Winner | Score | Alloc | 4W Ret | Peers (4W) |
|---|---|---|---|---|---|---|
| 1 | Precious Metals | GLD | 60.0 | 20% | +9.70% | GDX +20.0% · SLV +8.2% |
| 2 | Utilities & Infrastructure | IGF | 45.0 | 20% | +13.37% | XLU +8.3% · PAVE +18.2% |
| 3 | Defense & Aerospace | ITA | 37.1 | 10% | +22.82% | XAR +26.4% · ROKT +19.2% |
| 4 | Technology | CIBR | 36.5 | 10% | +20.41% | IGV +27.3% · XLK +22.8% |
| 5 | Nuclear Energy | NLR | 30.6 | 10% | +24.66% | URA +27.5% · URNM +28.5% |
| 6 | AI | AIQ | 13.0 | 10% | +22.57% | BOTZ +21.8% · SMH +25.1% |
| 7 | Emerging Markets | INDA | 11.4 | 10% | +10.99% | IEMG +17.2% · ILF +15.0% |
| 8 | Traditional Energy | XLE | 4.3 | 10% | +6.22% | FCG +8.0% · XOP +10.2% |
| 9 | Agriculture & Livestock | WEAT | — | 0% | -1.93% | VEGI +12.8% · MOO +15.1% |
| 10 | Industrial Metals | COPX | — | 0% | +24.10% | PICK +18.8% · REMX +14.3% |
Precious Metals — GLD
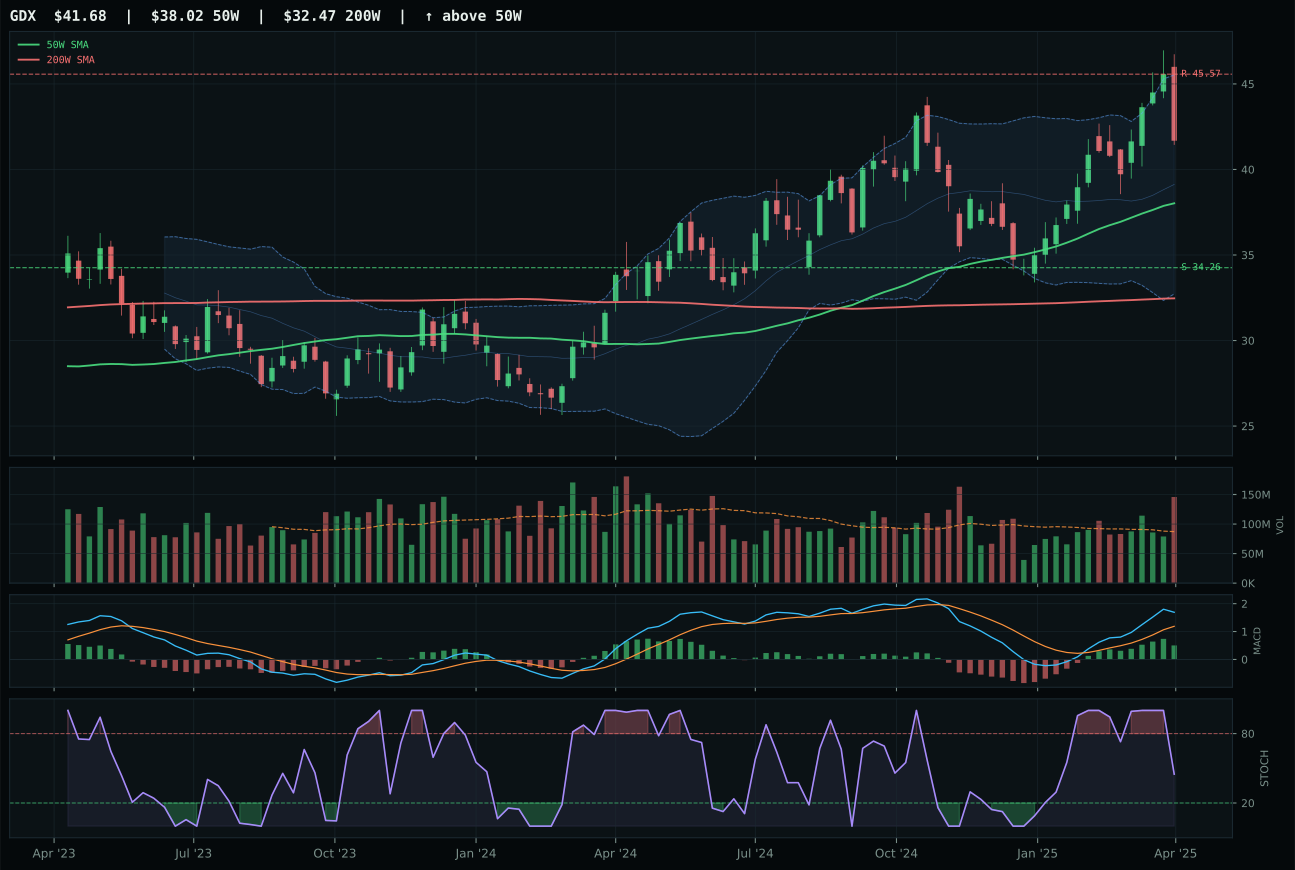
GDX has a neutral structure profile with 33.7% 13-week relative strength versus SPY.
A failed hold above support would weaken the setup.
Actionable but governed by invalidation levels.
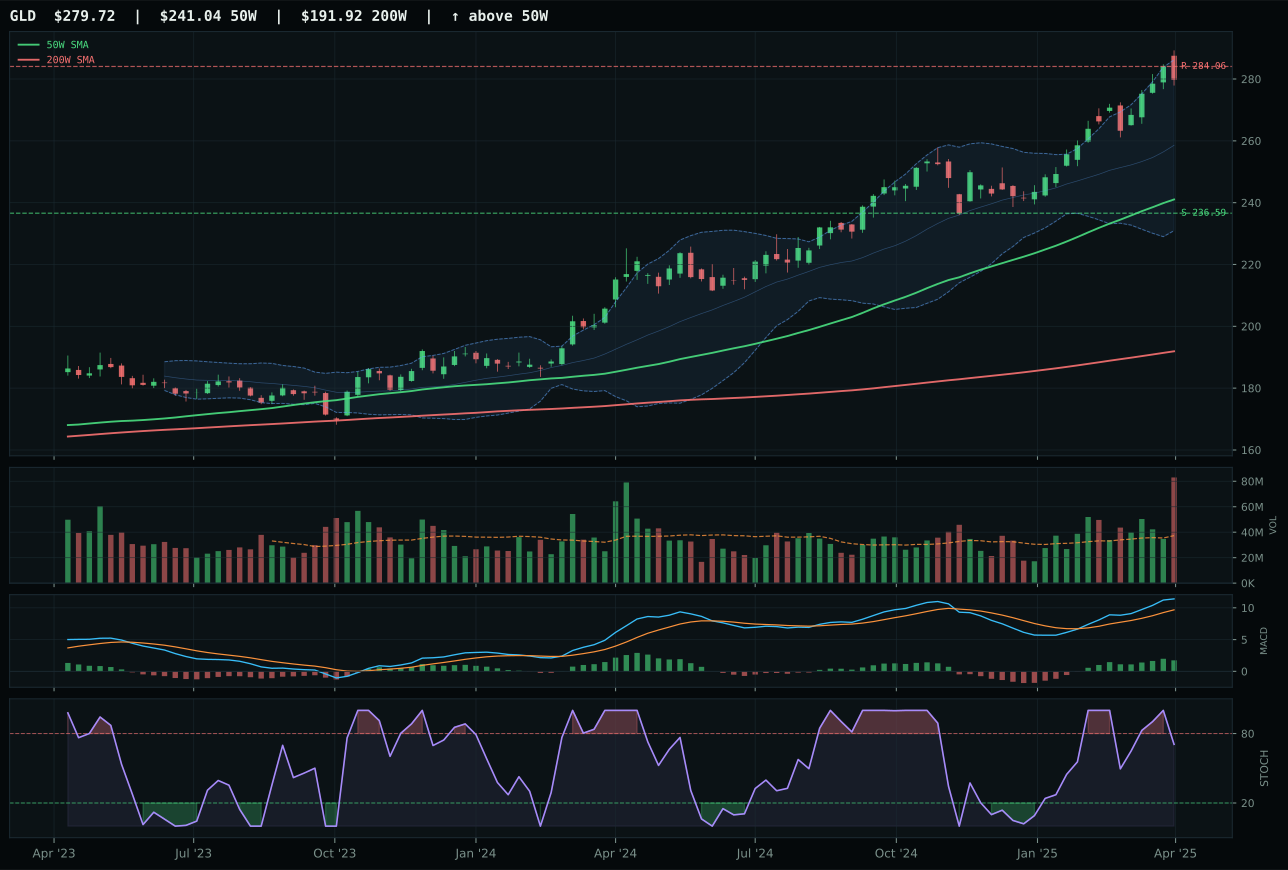
GLD has a vertical extension profile with 29.5% 13-week relative strength versus SPY.
A failed hold above support would weaken the setup.
Actionable but governed by invalidation levels.
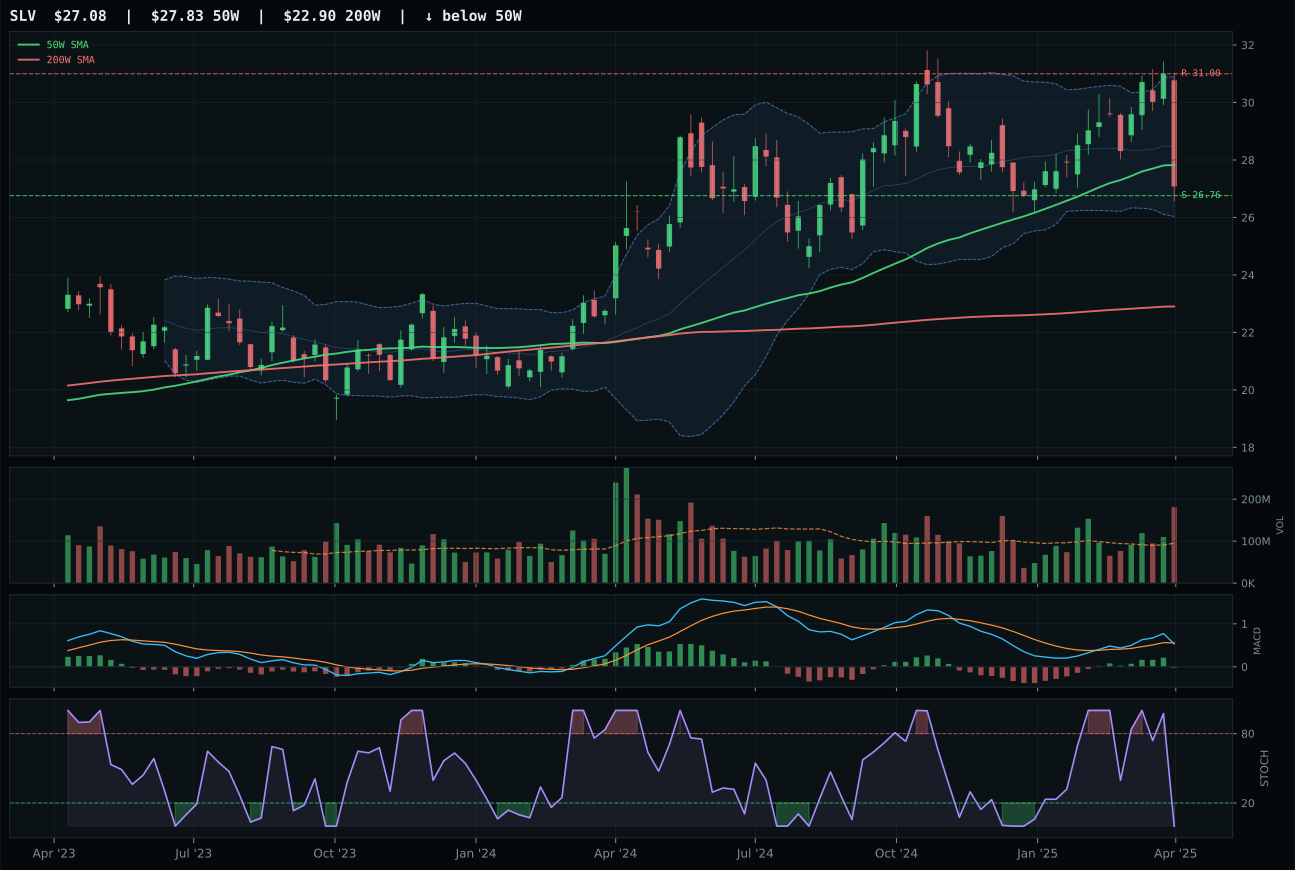
SLV has a pullback into support profile with 15.0% 13-week relative strength versus SPY.
A failed hold above support would weaken the setup.
Actionable but governed by invalidation levels.
GLD wins this category decisively despite facing structural headwinds that usually punish extended rallies. Price trades 16.0% above the 50-week moving average, placing it in vertical extension territory that would normally carry a timing penalty, yet the momentum confirmation score of 100.0 overwhelms that concern—a 13-week return of 14.9% and RS versus SPY of 29.5% indicate that gold is in a structural bull, not a tactical pop. GDX, the runner-up, shows superior 13-week momentum at 19.1% and higher RS at 33.7%, but GDX's structure cleanliness of 74.0 versus GLD's 80.2 reveals why the category representative goes to the cleaner name: gold mining leverage is amplifying momentum but at the cost of technical purity. GLD's MACD is bullish and improving with stochastic RSI falling but not yet oversold at 0.71, a setup profile that says institutional money is rotating into duration-protective hard assets with conviction rather than chasing a mean reversion. Volume at 2.22x the 20-week average quantifies the distribution pressure, but in a monetary hedge bid environment, that's accumulation masquerading as selling pressure.
Precious Metals earned top-2 overweight status at 10% allocation, a tier-1 slot reflecting the category's 60.0 final score and macro tailwinds that distinguish it from nearly every other category this week. The macro fit of 85.0 is the highest in the portfolio: monetary hedge bid active at plus-14, disinflation at plus-8, defensive rotation at plus-7, and disinflation pressure at plus-6 create a reinforcing narrative. Technical evidence contributes 50.8 points from GLD's strong trend (100) and momentum (100), partially offset by timing and risk-reward penalties inherent to extension. The portfolio's 50% crypto overlay does halve Precious Metals from a theoretical 20% to 10%, but even at this scaled size, it's the clearest expression of the current regime: deflation protection, monetary accommodation, and risk-off rotation are simultaneously active. GLD's position just 1.5% away from its resistance at 284.06 creates a near-term risk, but the downside to support at 236.59 is 18.2%, providing a 12-point asymmetry in the bear's favor. Maintain this allocation; the macro case has not weakened.
Utilities & Infrastructure — IGF
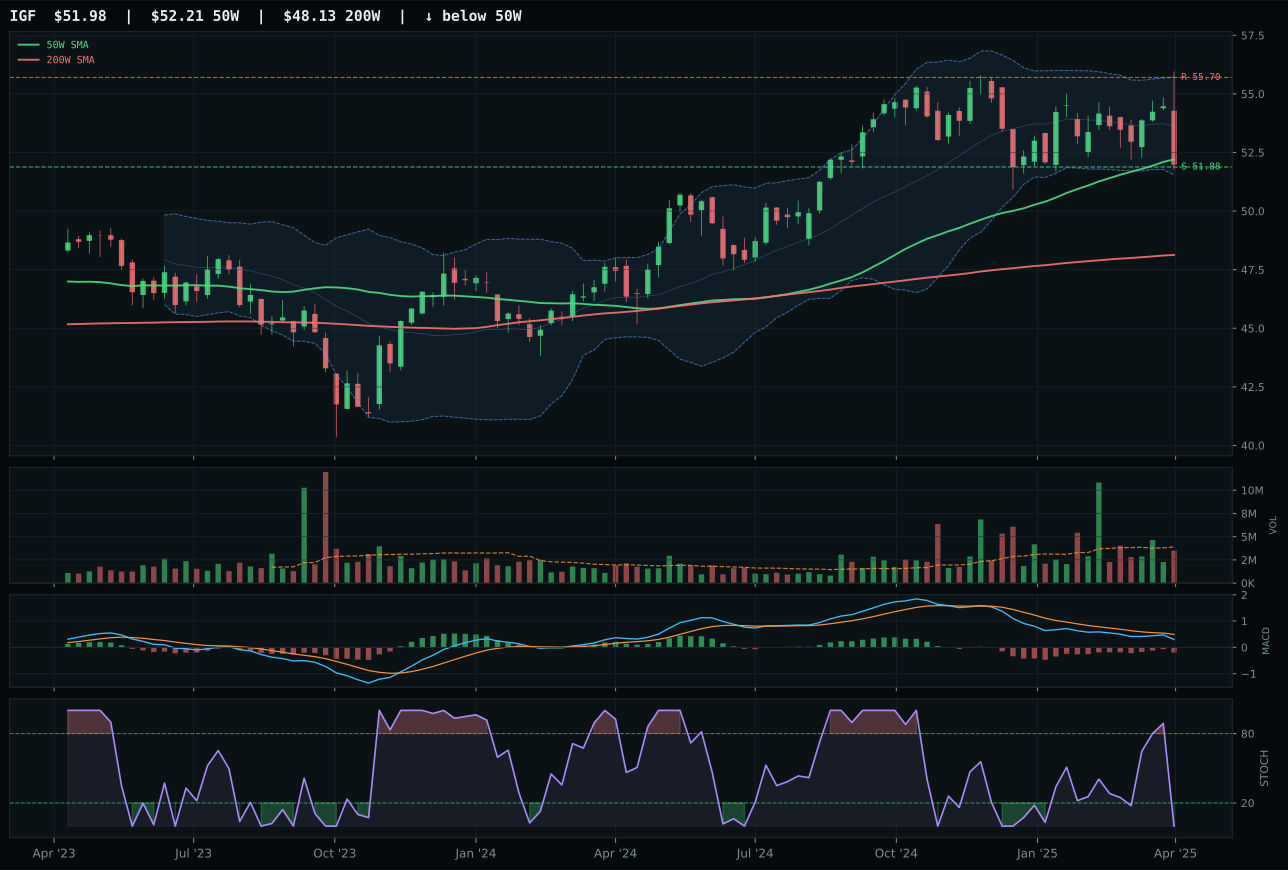
IGF has a pullback into support profile with 12.7% 13-week relative strength versus SPY.
A failed hold above support would weaken the setup.
Actionable but governed by invalidation levels.
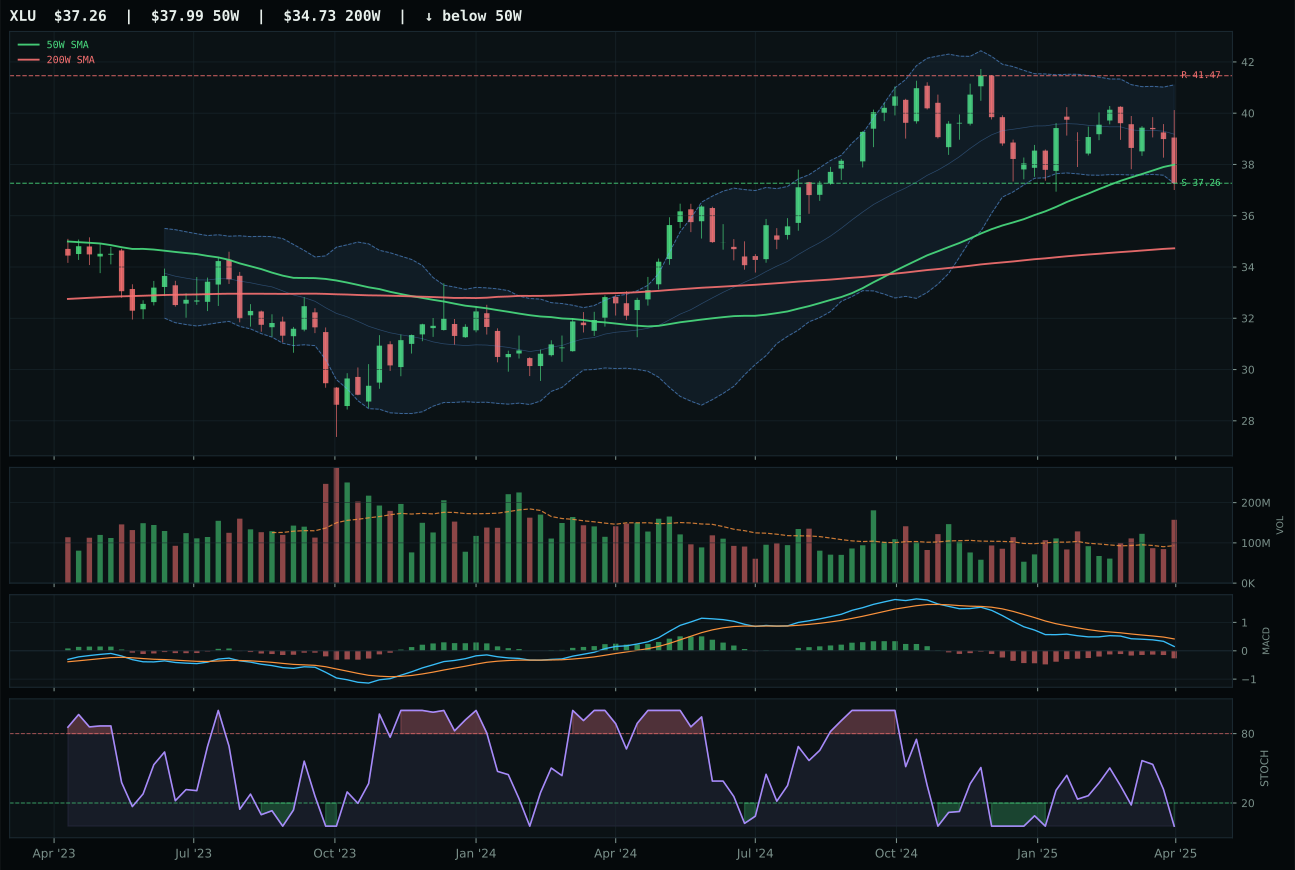
XLU has a pullback into support profile with 11.3% 13-week relative strength versus SPY.
A failed hold above support would weaken the setup.
Actionable but governed by invalidation levels.
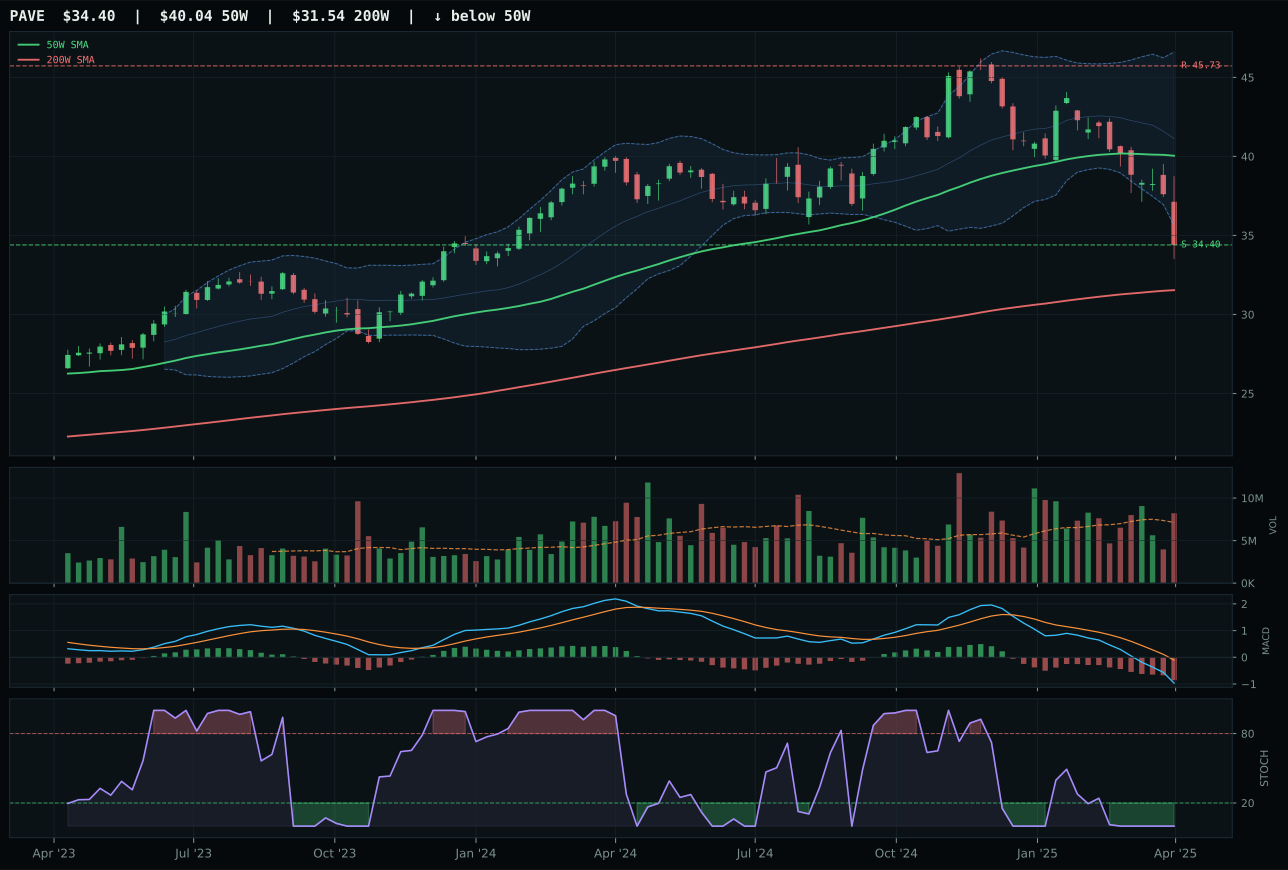
PAVE has a pullback into support profile with -1.1% 13-week relative strength versus SPY.
A failed hold above support would weaken the setup.
Actionable but governed by invalidation levels.
IGF wins by 25.4 points over XLU, a commanding margin that reflects technical superiority across nearly every dimension despite both facing pullback setups below the 50-week. IGF's timing score of 100 decimates XLU's 95, driven by IGF's near-zero distance to the 50-week (just negative 0.4%) combined with MACD bearish but improving and stochastic RSI oversold at the ideal entry zone. Risk-reward tells the story most clearly: IGF at 90.0 grants 6.7% upside to resistance and only 0.2% downside to support, a heavily asymmetric setup, while XLU at 59.8 allows 23.3% downside to support—a structure that penalizes late entry. Momentum confirmation at 70.6 for IGF versus 34 for XLU signals that global infrastructure income is holding relative to regulated utility dividend defense, a critical distinction in a defensive rotation where quality outflows. Category-relative strength of 1.4% for IGF versus 0.0% for XLU confirms that infrastructure is the preferred defensive proxy. Volume neutrality on IGF versus distribution pressure on XLU suggests infrastructure is being held for income while utilities are being trimmed despite higher yields.
Utilities & Infrastructure earned top-2 overweight status at 10% allocation, ranking second among all portfolio categories at a 45.0 final score, just 15 points behind Precious Metals. The macro fit of 80.0 is exceptional: defensive rotation at plus-12, disinflation pressure at plus-6, and broad market bear at plus-4 combine to create a reinforcing defensive narrative, while only liquidity stress carries neutral standing. Technical evidence from IGF contributes 74.0 points (the highest in the category trio), driven by exceptional trend (88) and timing (100) metrics. The 50% crypto overlay reduces the theoretical 20% tier-1 allocation to 10%, but even at this scaled size, IGF represents the clearest defensive income expression available in the portfolio, combining pullback-into-support entry mechanics with sub-50W proximity that minimizes entry timing risk. The category's 45.0 score was depressed from its 51.4 3/2/1 basket opening due to negative spillover in volume-price confirmation and persistence, yet the underlying macro and technical drivers remain solid. Maintain this allocation; IGF's timing setup combined with the disinflation tailwind justifies continued overweight.
Defense & Aerospace — ITA
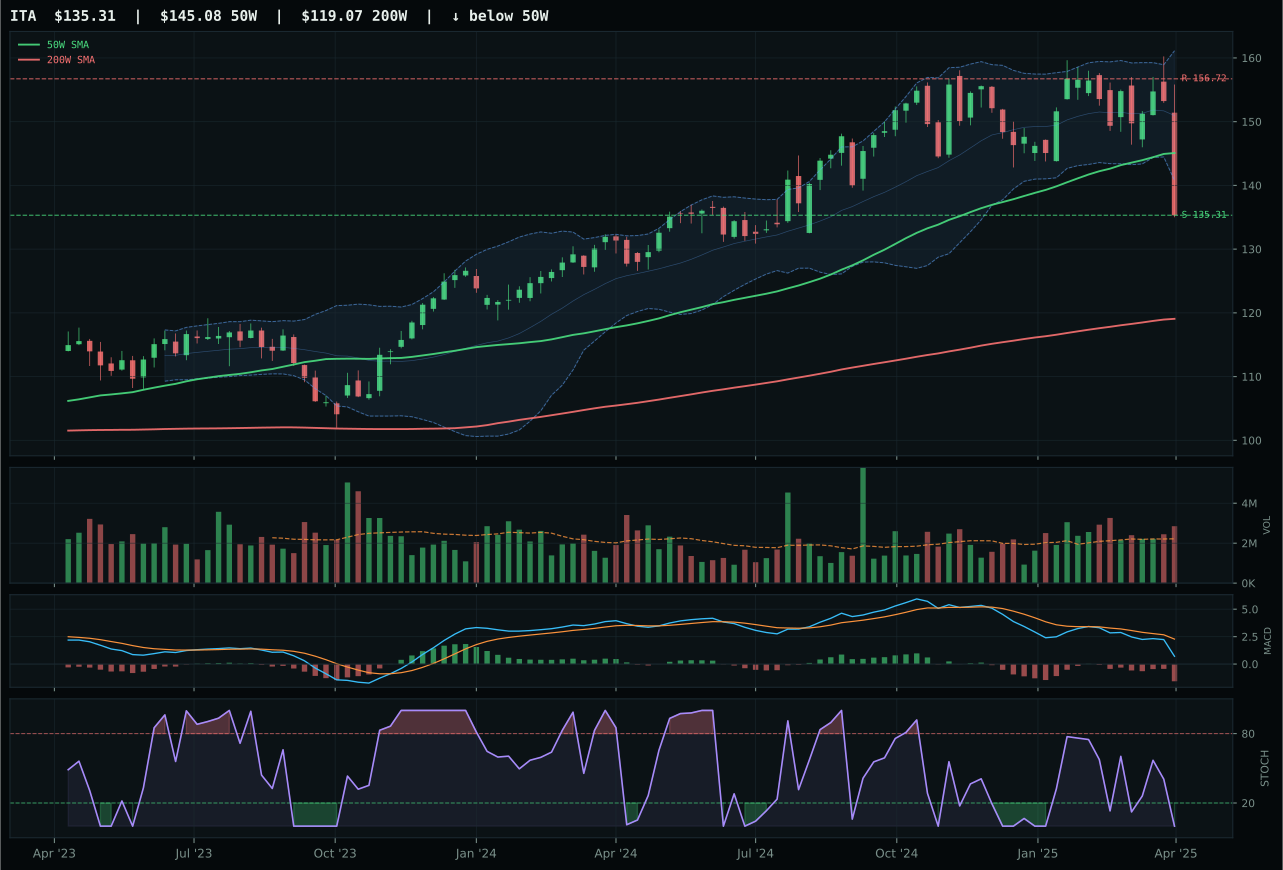
ITA has a pullback into support profile with 7.2% 13-week relative strength versus SPY.
A failed hold above support would weaken the setup.
Actionable but governed by invalidation levels.
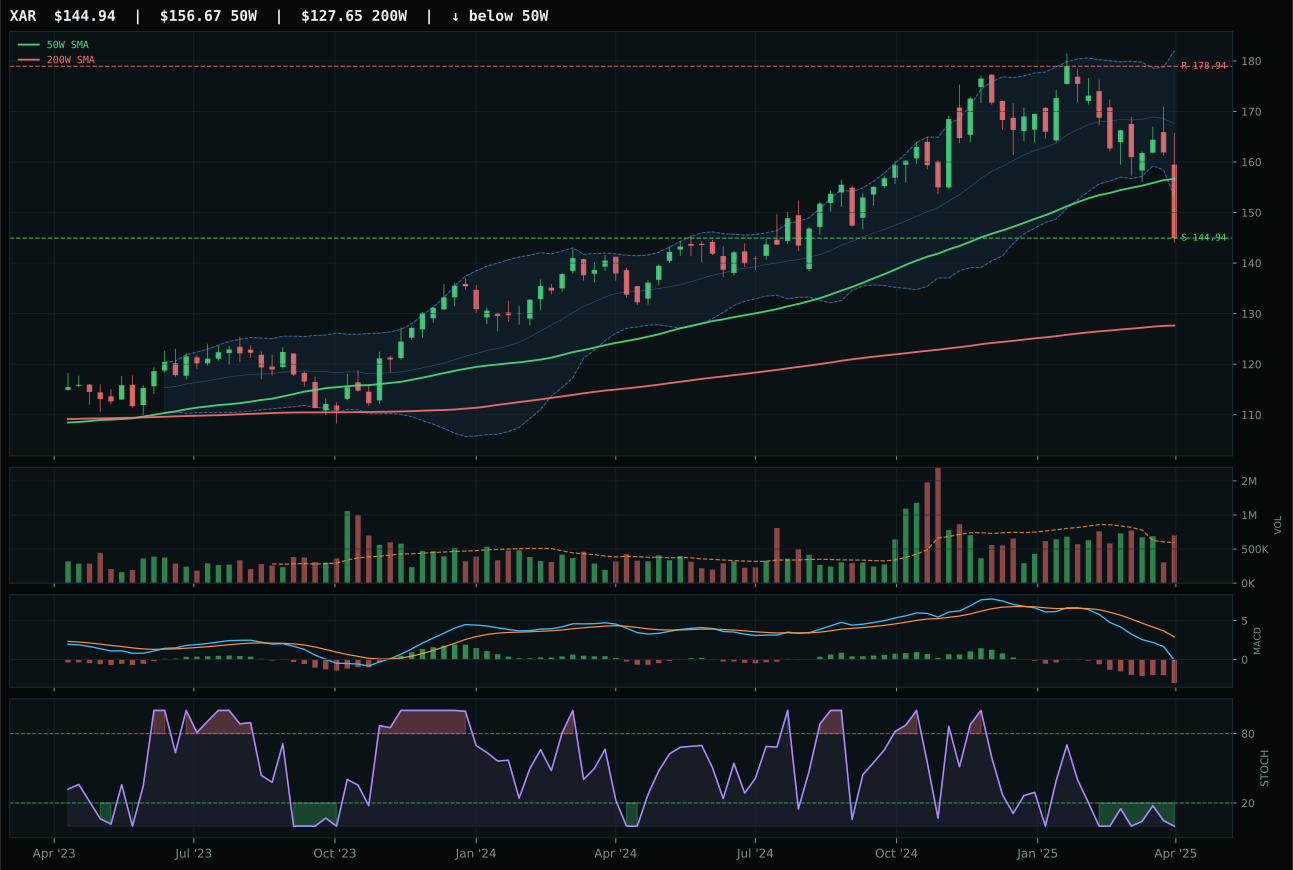
XAR has a pullback into support profile with 0.1% 13-week relative strength versus SPY.
A failed hold above support would weaken the setup.
Actionable but governed by invalidation levels.
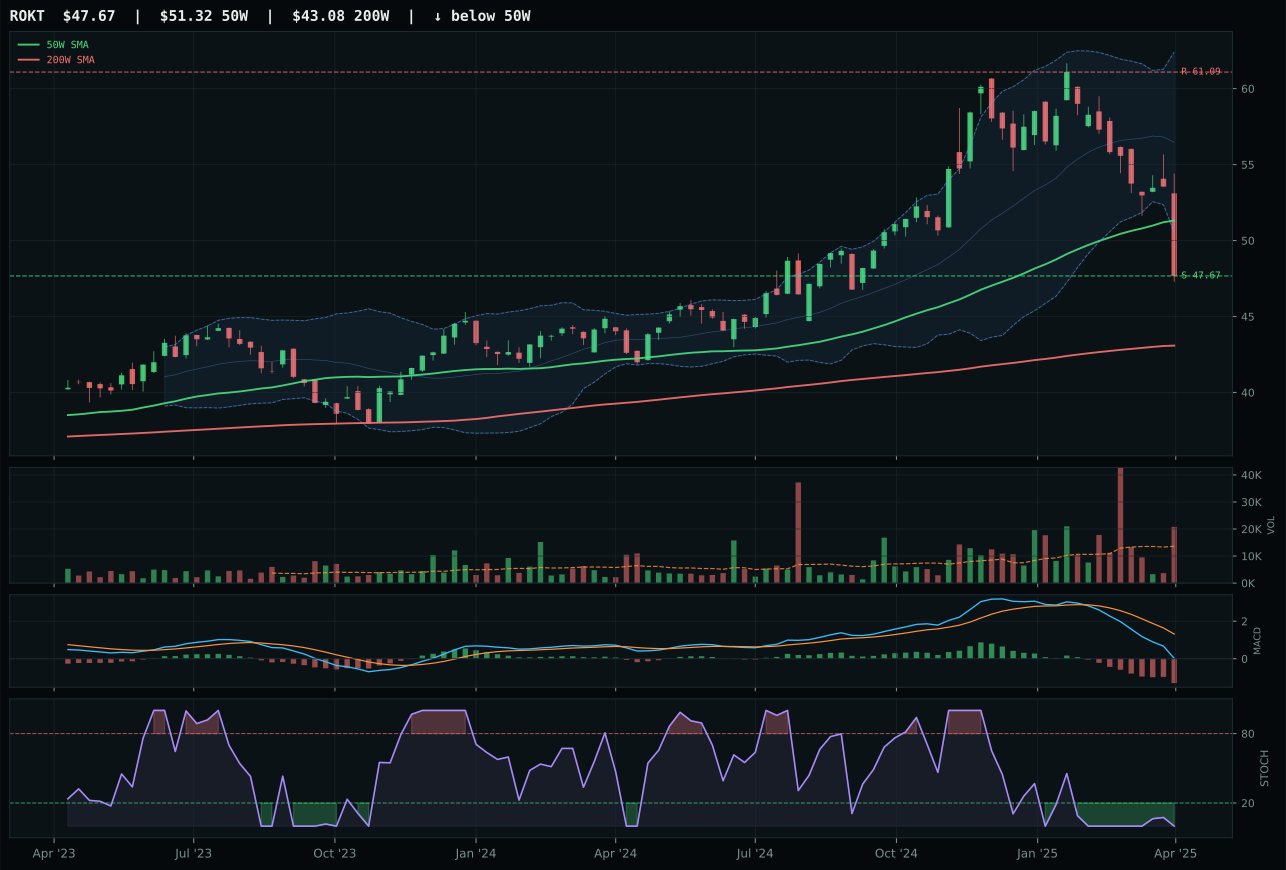
ROKT has a pullback into support profile with -3.9% 13-week relative strength versus SPY.
A failed hold above support would weaken the setup.
Tracked, but not top-2 eligible because: .
ITA wins with a decisive 5.9-point lead over XAR, driven by superior category-relative strength at 7.0% versus 0.0% and trending structure that shows more institutional commitment. Both face identical timing scores of 87, both pull into support at pullback lows, but ITA's momentum confirmation of 38.8 versus XAR's 9.0 reveals the critical difference—defense-prime durability is attracting incremental buyers at 7.2% RS versus SPY, while the broader defense category expression flatlines. ITA's risk-reward of 83.7 grants more runway to support than XAR's 96.0, a counterintuitive advantage because it signals the broader market has already priced in the upside. Cleanliness metrics are nearly identical (41.7), but ITA's 70.3 structure score edges higher due to its compression signature at 73.3, telling a story of coiled bids rather than distribution rejection.
Defense & Aerospace earned 5% allocation in tier-3, despite a category score of 37.1 that falls below Precious Metals and Utilities. Defensive rotation active at plus-8 and broad market bear at plus-6 create a strong macro tailwind at 61.0 category-level fit, yet this is offset by liquidity stress at minus-4 and risk appetite broken at minus-2. The portfolio's 50% crypto overlay halves all category sleeves, which means ITA's 5% is actually a 2.5% position after scaling, a material constraint on its relevance. Technical evidence contributes 48.3 points, respectable but not elite, and the category's 37.1 score reflects a setup that's defensible rather than exciting. The macro narrative is the real driver here: defensive rotation is one of six active descriptors working in favor, and the energy scarcity descriptor at plus-6 implies geopolitical risk is still pricing into defense contracts. What would elevate this: either a break above 156.72 resistance with volume acceleration, or a shift in the risk appetite descriptor that would lift the category-level macro fit closer to 70 and justify higher allocation.
Technology — CIBR
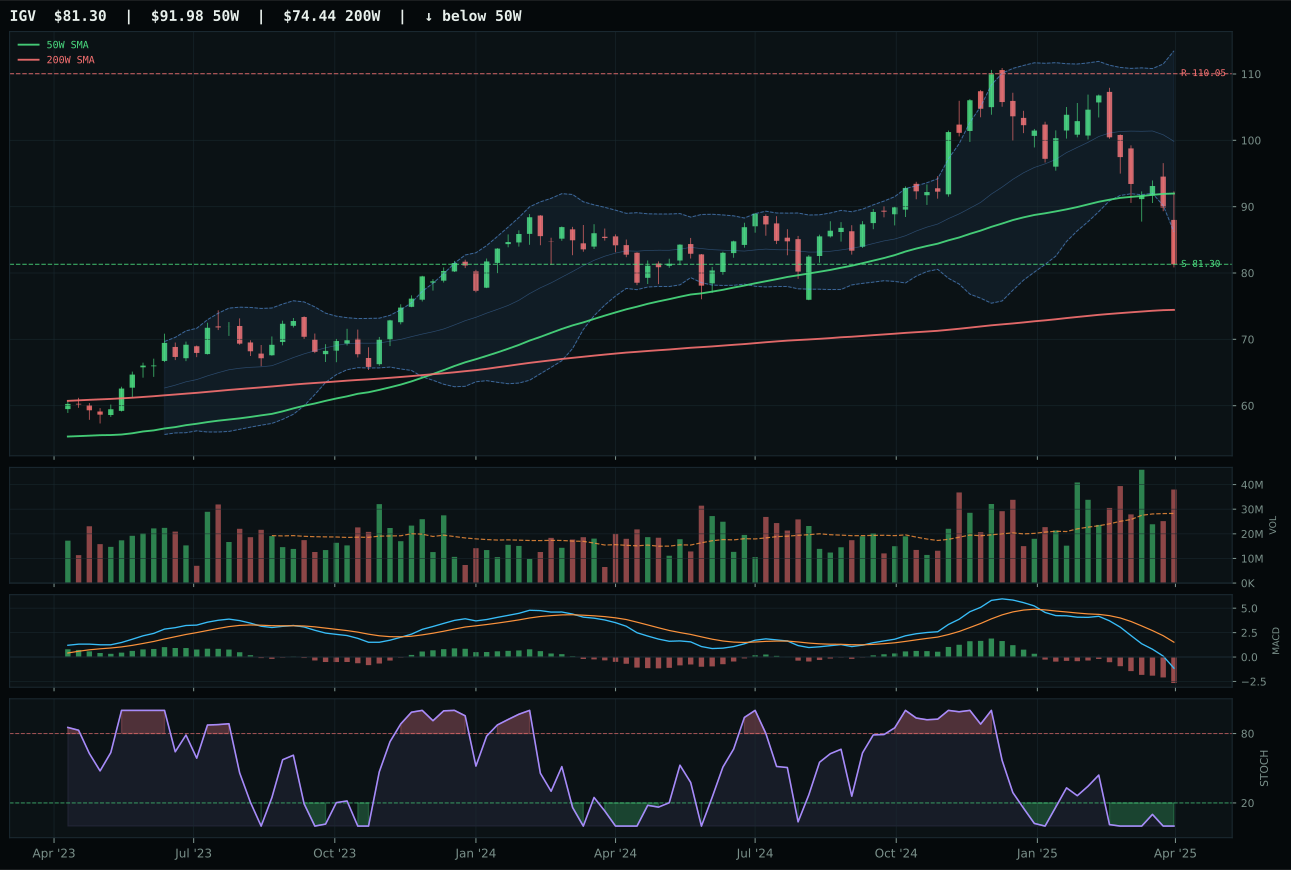
IGV has a pullback into support profile with -5.2% 13-week relative strength versus SPY.
A failed hold above support would weaken the setup.
Actionable but governed by invalidation levels.
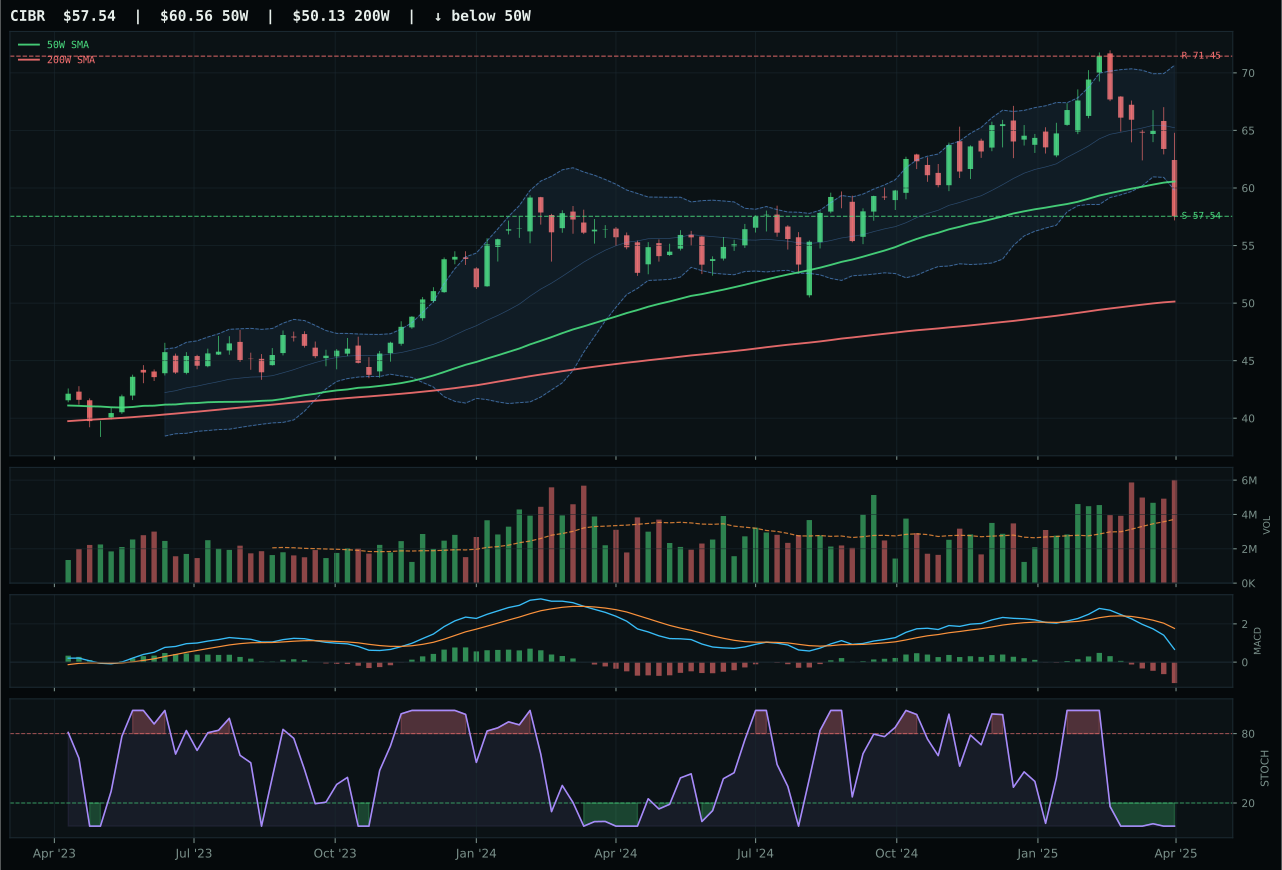
CIBR has a pullback into support profile with 4.1% 13-week relative strength versus SPY.
A failed hold above support would weaken the setup.
Actionable but governed by invalidation levels.
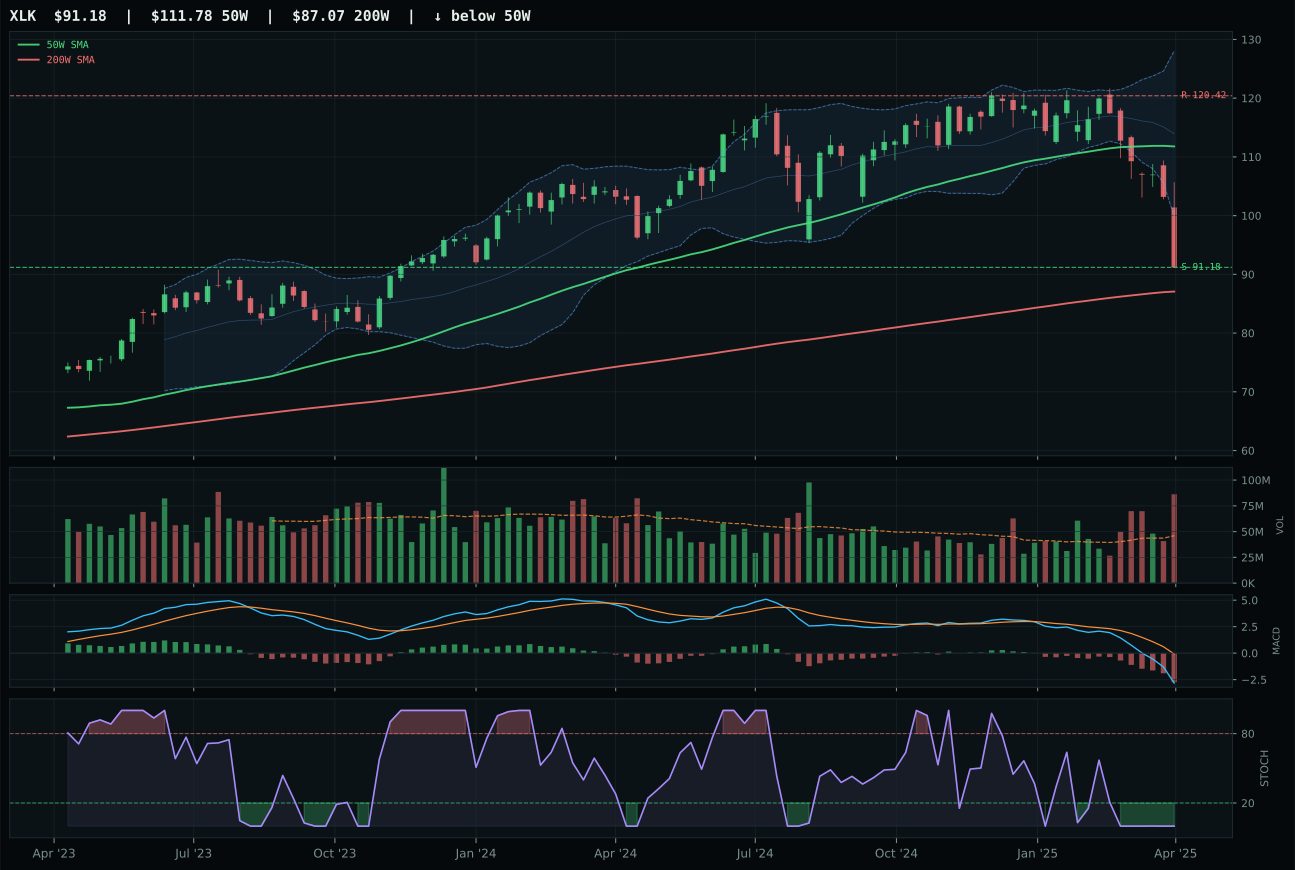
XLK has a pullback into support profile with -8.0% 13-week relative strength versus SPY.
A failed hold above support would weaken the setup.
Actionable but governed by invalidation levels.
CIBR wins because it carries relative strength versus the category median at 9.3% while maintaining a defined pullback setup into support at 57.54. IGV, the runner-up, lags on both the timing score (60 vs 100) and relative strength (0.0% vs 9.3%), a combination that signals weaker institutional sponsorship despite an oversold stochastic RSI. The 8.4-point score gap reflects CIBR's superior category leadership: cybersecurity is trading closer to its 50-week moving average at just 5.0% below, whereas enterprise software at 19.1% below presents an entry so extended that new money is chasing rather than accumulating. MACD deterioration is universal across the basket, but CIBR's volume running 1.62x the 20-week average tells a different story than IGV's participation—distribution pressure that suggests liquidation rather than resignation.
Technology earned 5% allocation as a tier-3 category, outside the top-2 overweights despite a 36.5 final score. The disinflation macro regime actively helps this category at plus-7, yet liquidity stress drags it down by 10 points, creating a net macro headwind. CIBR's timing score of 100 reflects its proximity to the 50W—a reset opportunity rather than a chase—but momentum confirmation at 12.4 reveals the hard truth: a 13-week return of negative 10.6% means this setup is a value trap, not a bounce. The category-level macro fit sits at 52.0, which is respectable but not compelling enough to justify overweight capital when defensive rotation is active. What would change this allocation: either a confirmed breakout above 71.45 resistance on volume expansion, or a shift in the active macro checklist toward risk-appetite repair that would make negative momentum less punitive to score.
Nuclear Energy — NLR
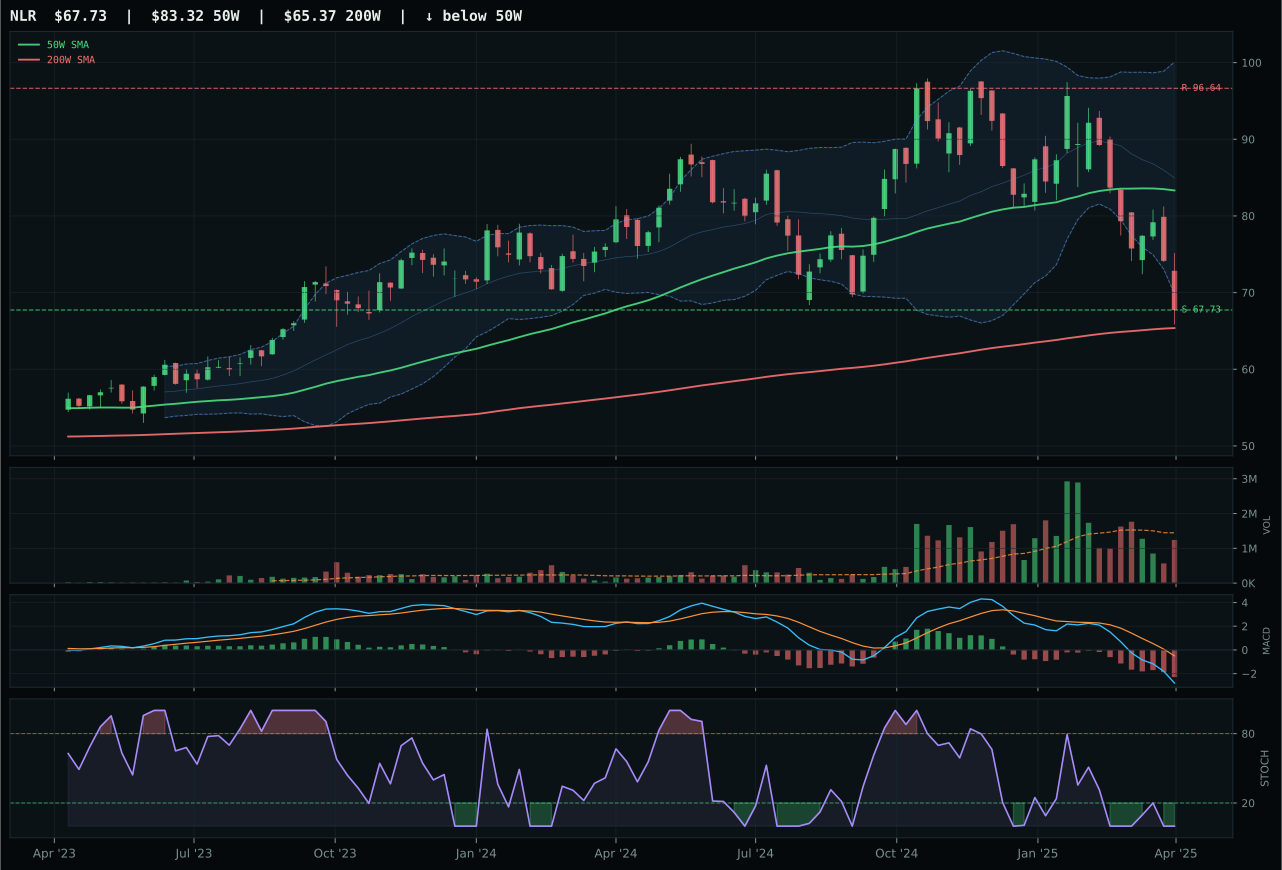
NLR has a pullback into support profile with -7.8% 13-week relative strength versus SPY.
A failed hold above support would weaken the setup.
Actionable but governed by invalidation levels.
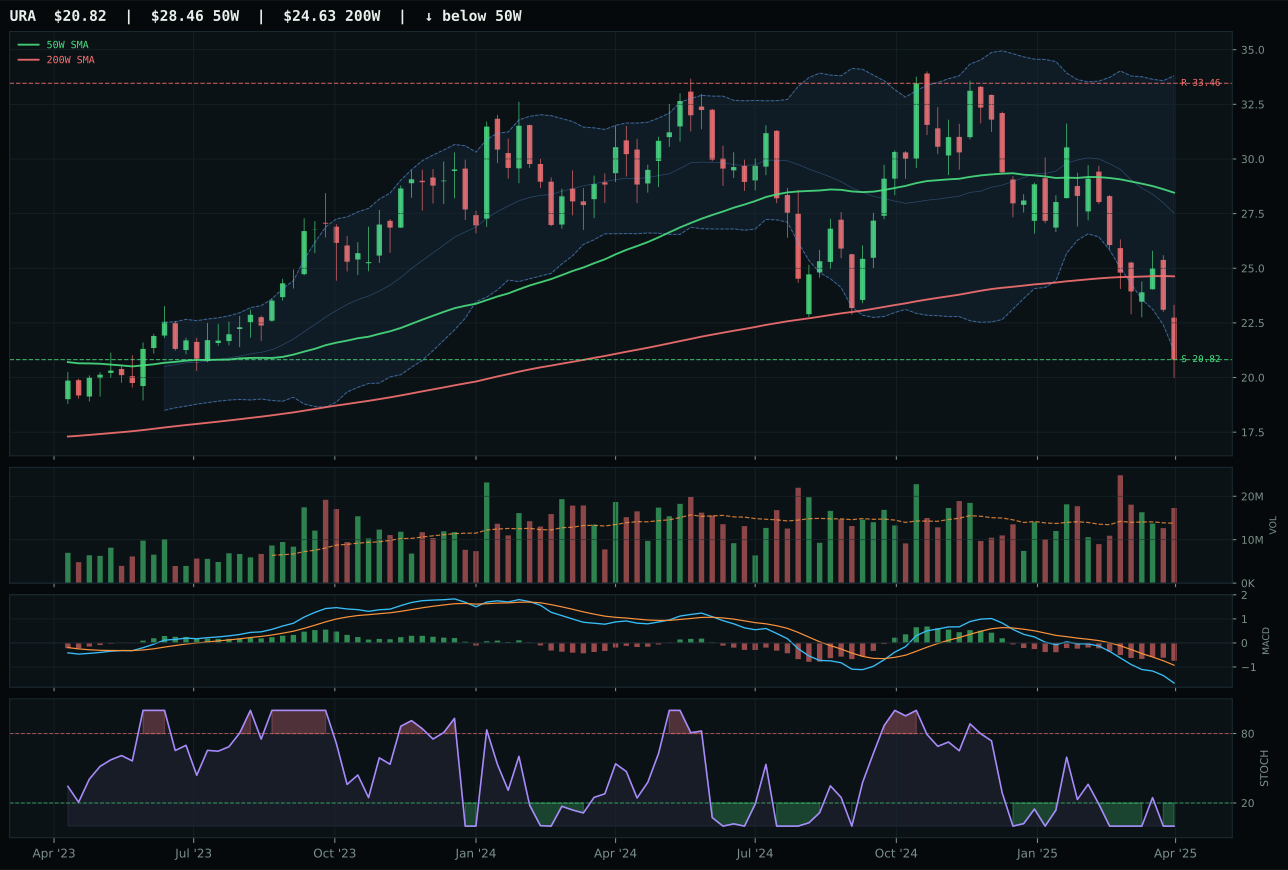
URA has a pullback into support profile with -13.2% 13-week relative strength versus SPY.
A failed hold above support would weaken the setup.
Actionable but governed by invalidation levels.
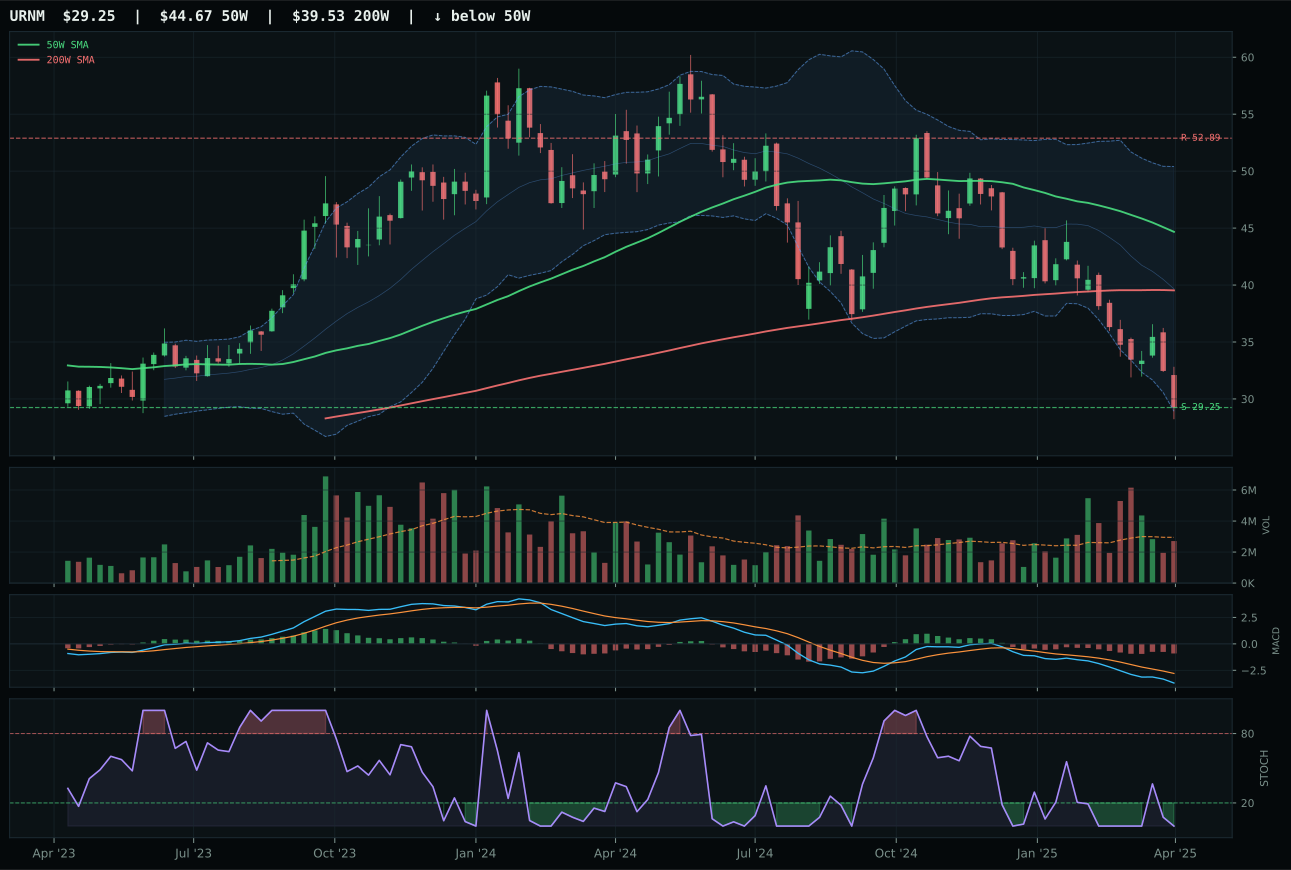
URNM has a pullback into support profile with -18.1% 13-week relative strength versus SPY.
A failed hold above support would weaken the setup.
Actionable but governed by invalidation levels.
NLR wins with a 7.7-point lead over URA, driven by marginally superior structure at 61.9 versus 60.6 and category-relative strength of 5.3% versus 0.0%. Both carry identical timing scores of 60 and pull into support at repair-zone lows (67.73 for NLR, 20.82 for URA), yet NLR's 13-week return of negative 22.5% versus URA's negative 27.8% suggests nuclear utilities are holding relative to pure-play uranium. Momentum confirmation across both registers at zero, reflecting a category where buyers have vanished regardless of technical trigger, but NLR's volume at 0.86x the 20-week (neutral) versus URA's above-average participation masks an important truth: NLR is finding support from holders refusing to sell, while URA is being rotated out despite lower prices. The risk-reward of 75.0 for NLR provides narrow downside room (0.0%) to support and wide upside room (29.9%) to resistance, a structure that works only if support holds.
Nuclear Energy holds 5% allocation in tier-3 despite a category score of 30.6, reflecting a macro narrative that partially offsets weak technicals. Energy scarcity active at plus-9 and defensive rotation active at plus-6 combine to create a 48.0 category-level macro fit, respectable but not compelling. Technical evidence for NLR at 15.9 is weak across trend (35.2), momentum (0.0), and volume-price confirmation (23.7), telling a story of a setup without institutional sponsorship. The allocation exists as a long-duration, quality-of-earnings defensive hedge within the broader energy sleeve, positioned for the scenario where disinflation persists long enough to drive utility rate compression while energy demand remains structurally supported by decarbonization mandates. To upgrade to tier-2: NLR would need to break above 96.64 resistance with volume acceleration and establish a bullish MACD divergence, confirming that institutional money is re-entering the nuclear thesis. Current allocation is a conviction play on regulatory support and dual-event optionality (inflation surprise or geopolitical escalation), not a momentum trade.
AI — AIQ
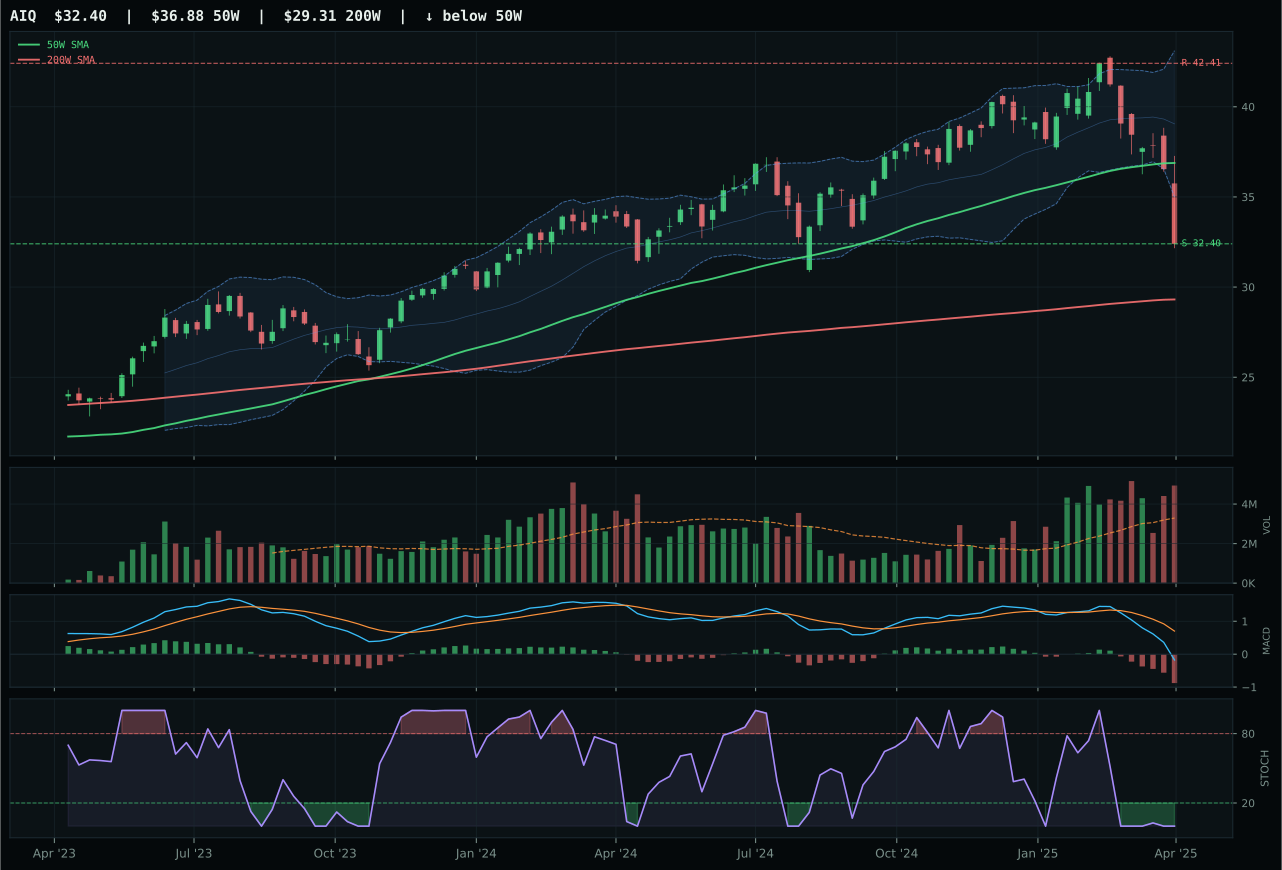
AIQ has a pullback into support profile with -2.6% 13-week relative strength versus SPY.
A failed hold above support would weaken the setup.
Actionable but governed by invalidation levels.
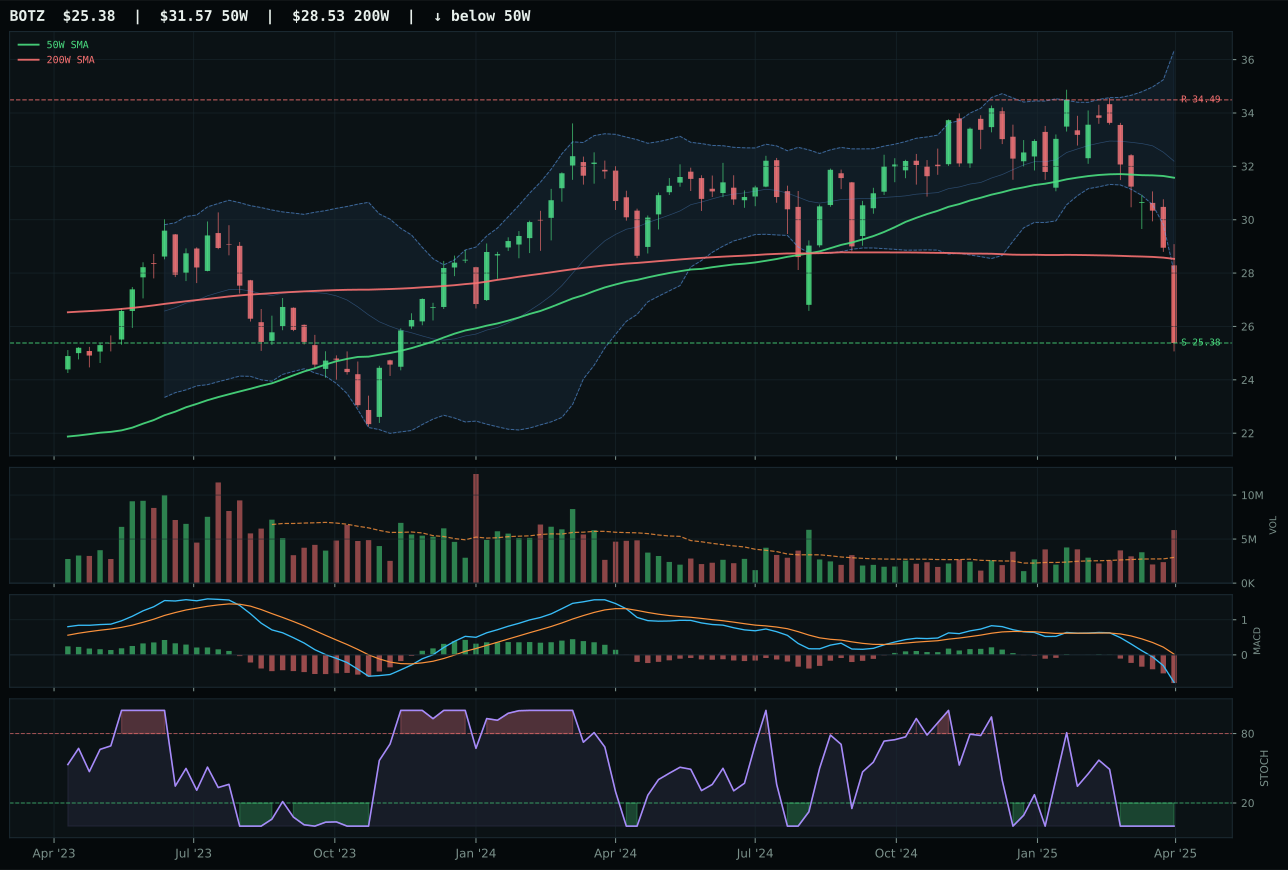
BOTZ has a pullback into support profile with -8.3% 13-week relative strength versus SPY.
A failed hold above support would weaken the setup.
Actionable but governed by invalidation levels.
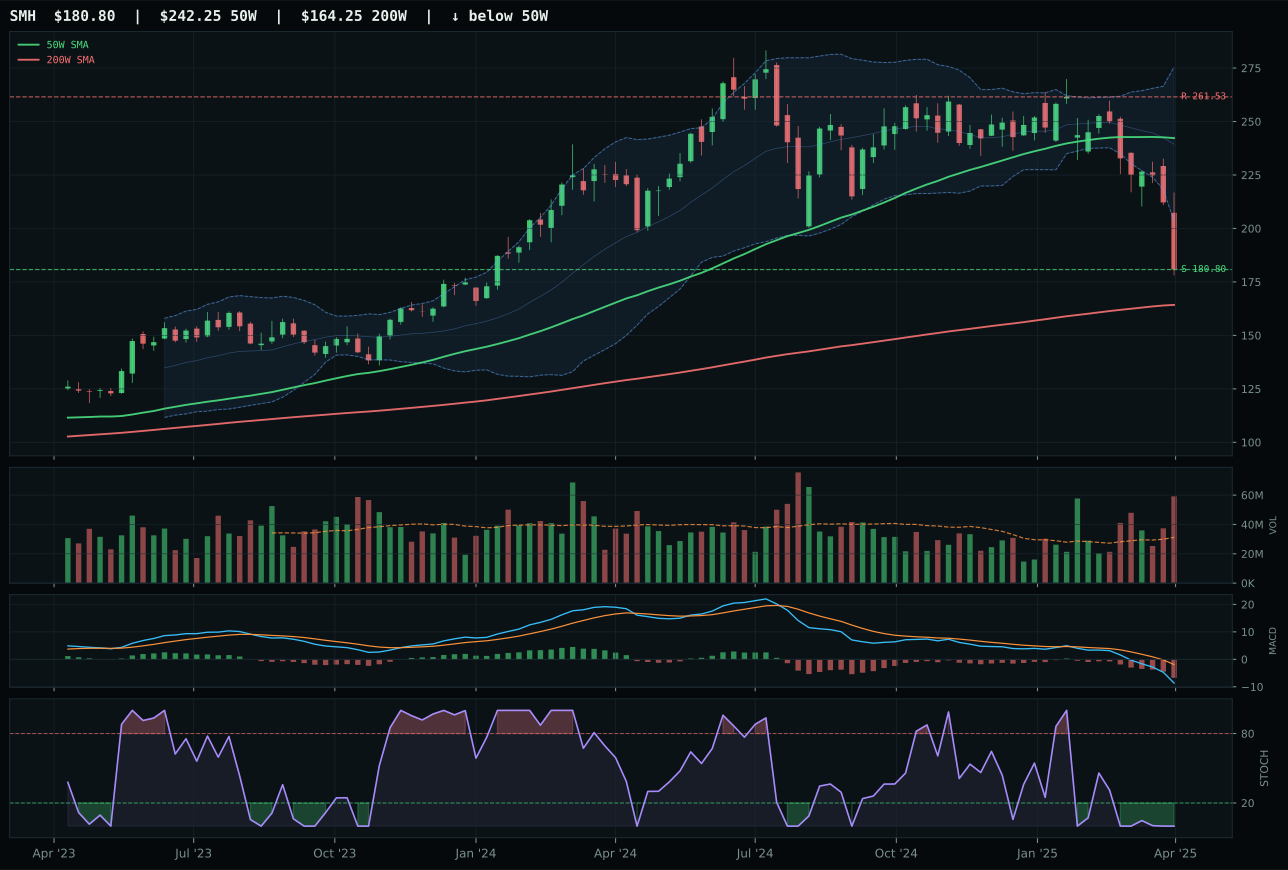
SMH has a pullback into support profile with -13.6% 13-week relative strength versus SPY.
A failed hold above support would weaken the setup.
Actionable but governed by invalidation levels.
AIQ wins with a 22.2-point score gap over BOTZ, the key differentiator being structural cleanliness at 68.9 versus BOTZ's 60.5 and superior risk-reward at 90.0 versus 82.0. Category-relative strength of 5.8% for AIQ versus 0.0% for BOTZ signals that software and application AI is holding better than robotics as liquidity stress ripples through the basket. Both trade below the 50-week at pullback lows, both face oversold stochastic conditions, but AIQ's volume profile—1.50x the 20-week average participation—contrasts sharply with BOTZ's distribution pressure. The timing score of 60 across both reflects the negative 12.2% distance to the 50W and near 52-week repair zone, yet AIQ's momentum confirmation of 0.5 and BOTZ's 0.0 reveal the real issue: neither is accumulating, but AI software ETF is at least not hemorrhaging relative to peers.
AI holds a 5% tier-3 slot despite a final score of 13.0, reflecting a portfolio with stronger alternatives competing for growth exposure. The category-level macro fit of 35.0 is the constraint: liquidity stress at minus-12 and broad market bear at minus-8 more than offset the plus-5 benefit from disinflation. Technical evidence contributes only 31.1 points, well below the portfolio median, meaning even the best ETF here (AIQ at 49 composite) is fighting structural headwinds rather than riding tailwinds. The score deterioration from the 21.8 3/2/1 basket opening to the final 13.0 reflects negative spillover from persistence and volume-price confirmation, both at the 20s, signaling that this category's setups lack conviction. For reallocation into top-2: AIQ would need to break above 42.41 resistance on sustained above-average volume, or macro descriptors would need to shift away from liquidity stress—either a credit market stabilization or a clear pivot away from the disinflation narrative.
Agriculture & Livestock — WEAT
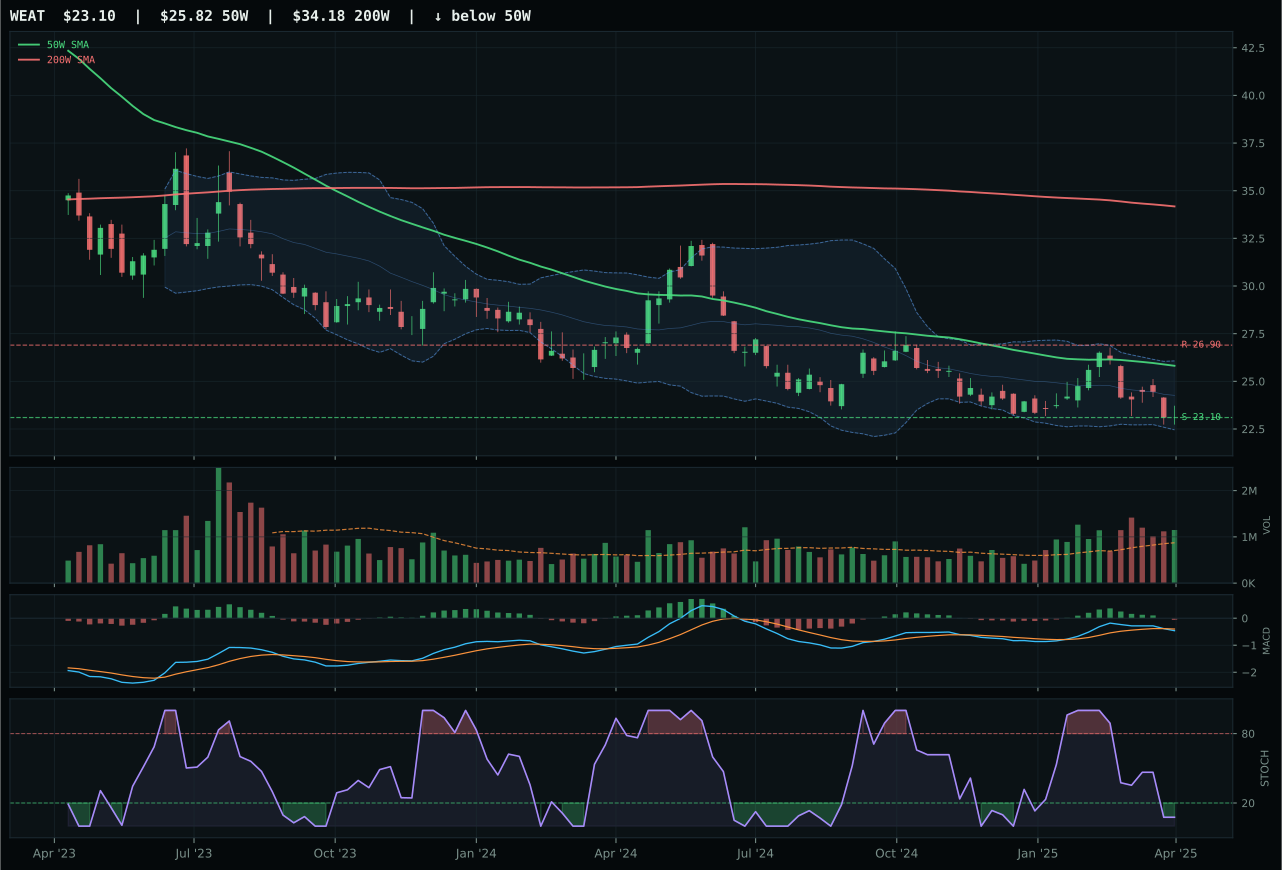
WEAT has a pullback into support profile with 13.6% 13-week relative strength versus SPY.
Extension and support failure are the main tactical risks.
Tracked, but not top-2 eligible because: structurally broken.
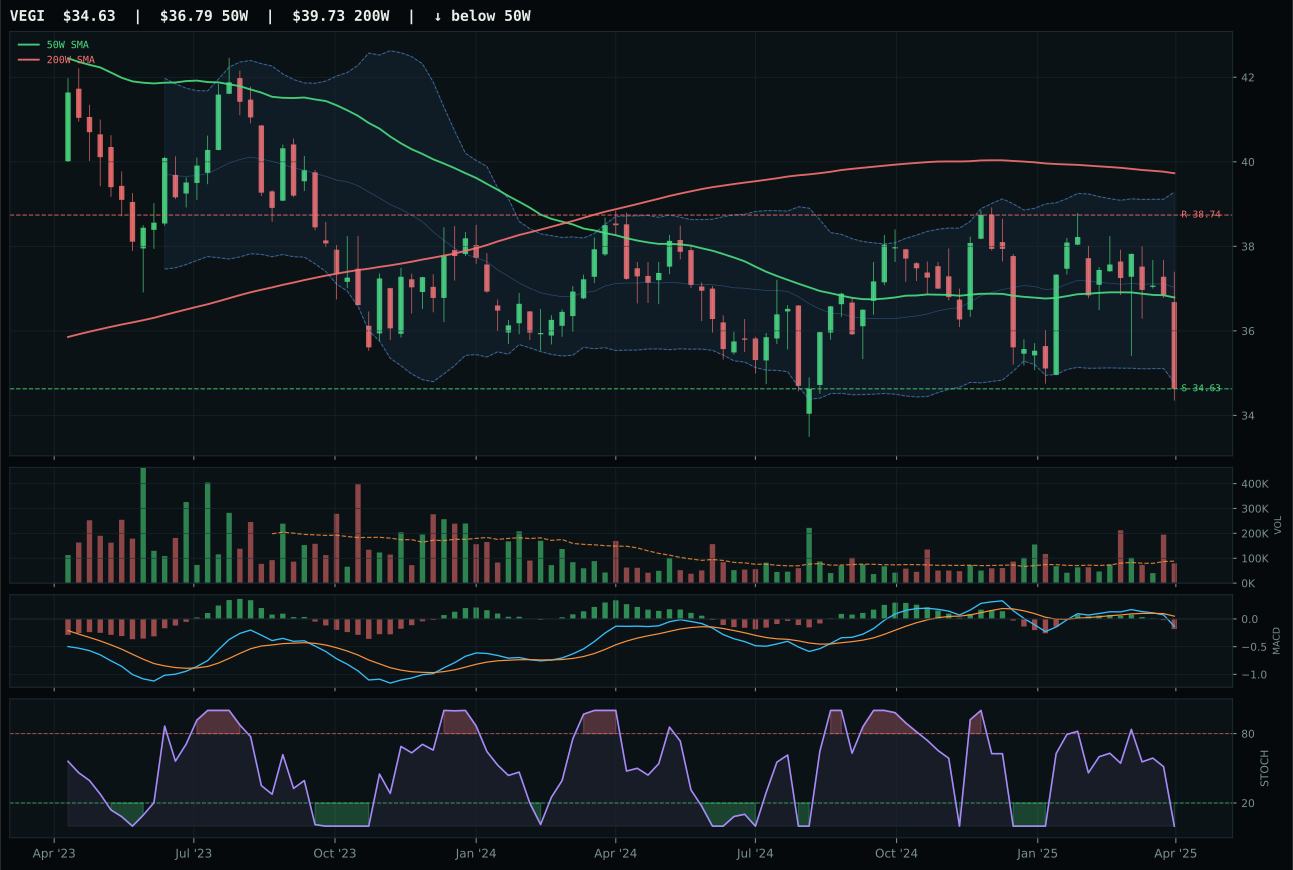
VEGI has a pullback into support profile with 12.1% 13-week relative strength versus SPY.
Extension and support failure are the main tactical risks.
Tracked, but not top-2 eligible because: structurally broken.
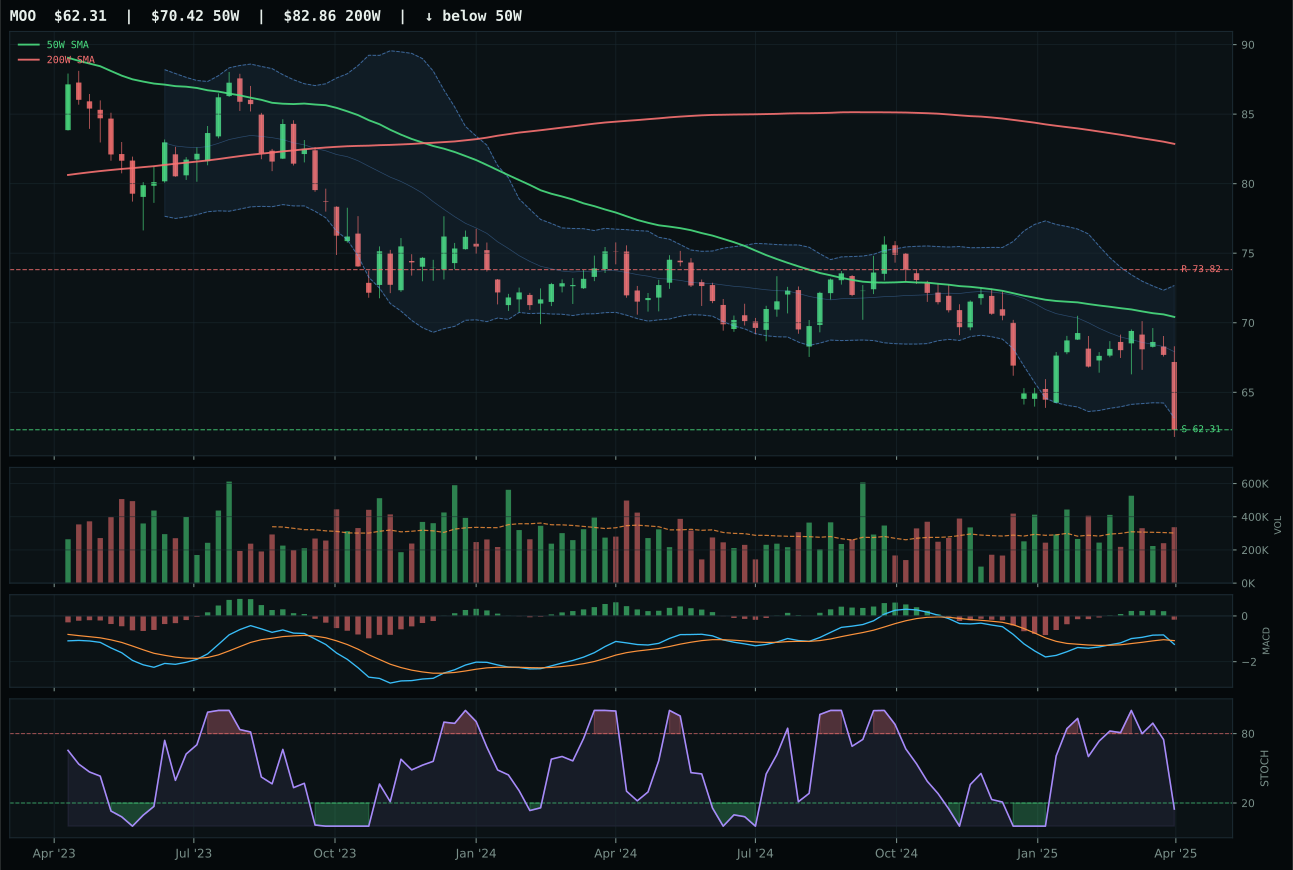
MOO has a pullback into support profile with 10.6% 13-week relative strength versus SPY.
Extension and support failure are the main tactical risks.
Tracked, but not top-2 eligible because: structurally broken.
WEAT wins by a 21.4-point margin despite both category leaders carrying weaker structures, a reflection of brutal macro headwinds crushing this entire category. WEAT's 13-week return of negative 1.1% beats VEGI's negative 2.5%, a trivial difference, but relative strength to the category median at 1.5% versus VEGI's 0.0% signals that wheat is the last to fall when all assets decline. Both trade below the 50-week and 200-week, placing both in structural breakdown rather than pullback, yet WEAT's momentum confirmation at 57.2 reveals grain buyers are at least engaged in the near term. The critical technical difference is volume: WEAT runs 1.32x the 20-week average participation, suggesting accumulation by real money despite negative momentum, while VEGI shows neutral volume and triggering hard filters for structural damage. WEAT's risk-reward of 76.8 still allows for a 14.1% upside rebound if support at 23.10 holds, though the downside remains binary.
Agriculture & Livestock holds 5% allocation but with a critical caveat: the category score came in at 0.0, making WEAT ineligible for top-2 ranking and flagging an eligibility gate failure. Disinflation actively hurts this category at minus-6, with disinflation pressure at minus-8 creating a structural macro headwind that no technical setup can overcome. The category-level macro fit of 32.0 is the lowest in the portfolio, reflecting a deflationary environment that crushes commodity producers. WEAT's technical evidence of 37.5 is modest, and the macro/narrative fit of 50.0 reflects a neutral descriptor profile—no category-specific protective tailwinds like defensive rotation or energy scarcity. The allocation exists purely as a hedge to duration and inflation-adjacent exposures elsewhere in the portfolio, and it's a marginal one at that. For WEAT to earn real portfolio weight: either inflation expectations would need to reverse sharply, or the active macro checklist would need to include energy scarcity at a high enough level to create supply-side commodity support—a scenario inconsistent with the current disinflation regime.
Industrial Metals — COPX
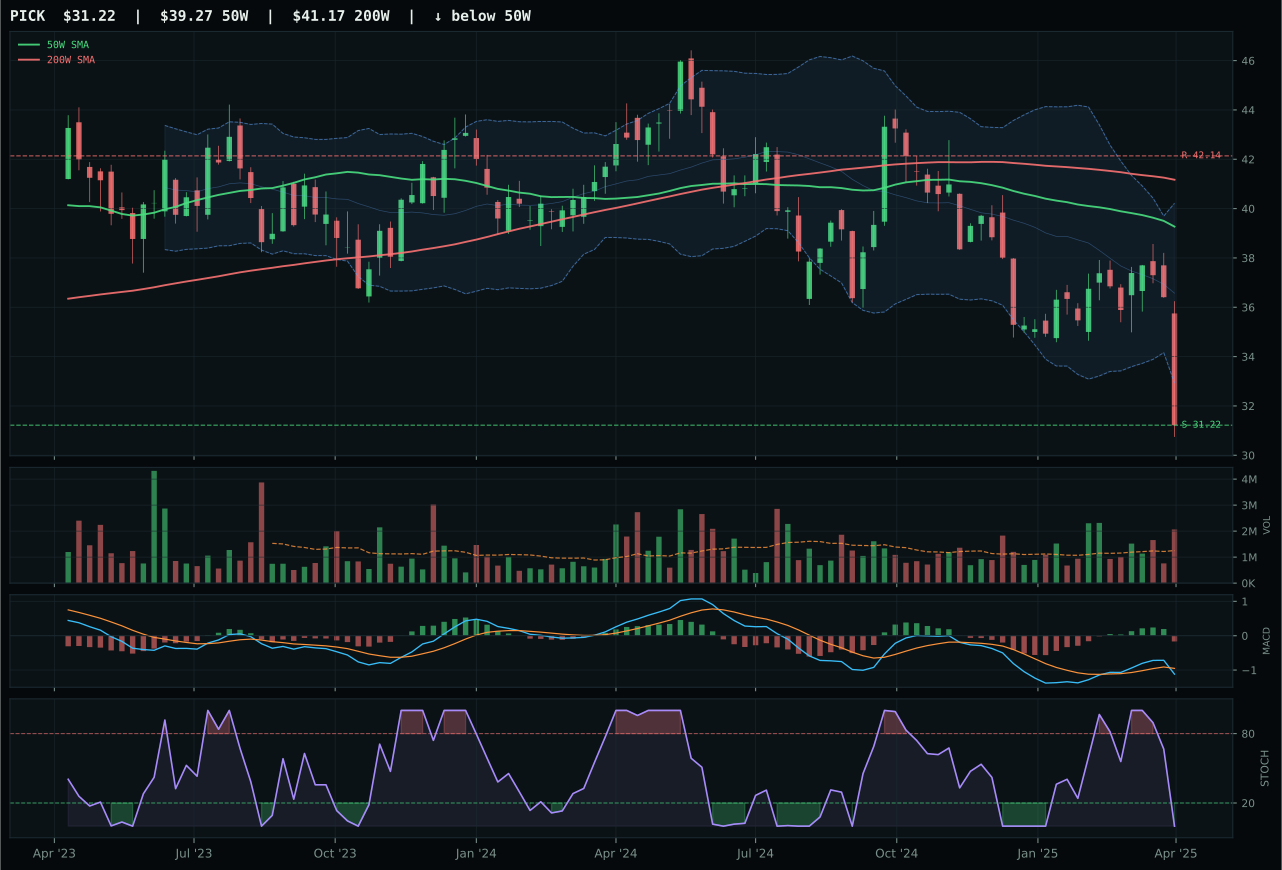
PICK has a pullback into support profile with 3.6% 13-week relative strength versus SPY.
Extension and support failure are the main tactical risks.
Tracked, but not top-2 eligible because: structurally broken.
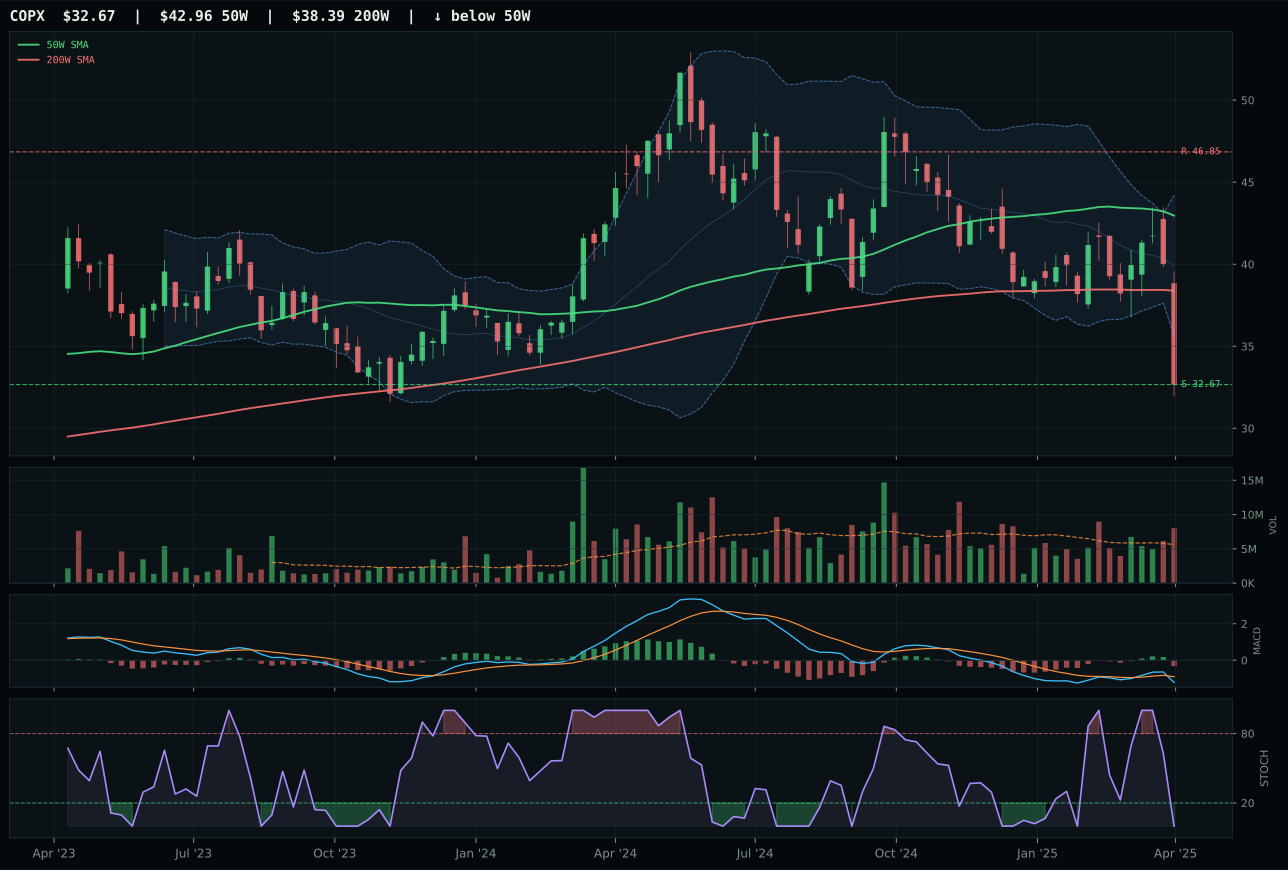
COPX has a pullback into support profile with -1.5% 13-week relative strength versus SPY.
A failed hold above support would weaken the setup.
Actionable but governed by invalidation levels.
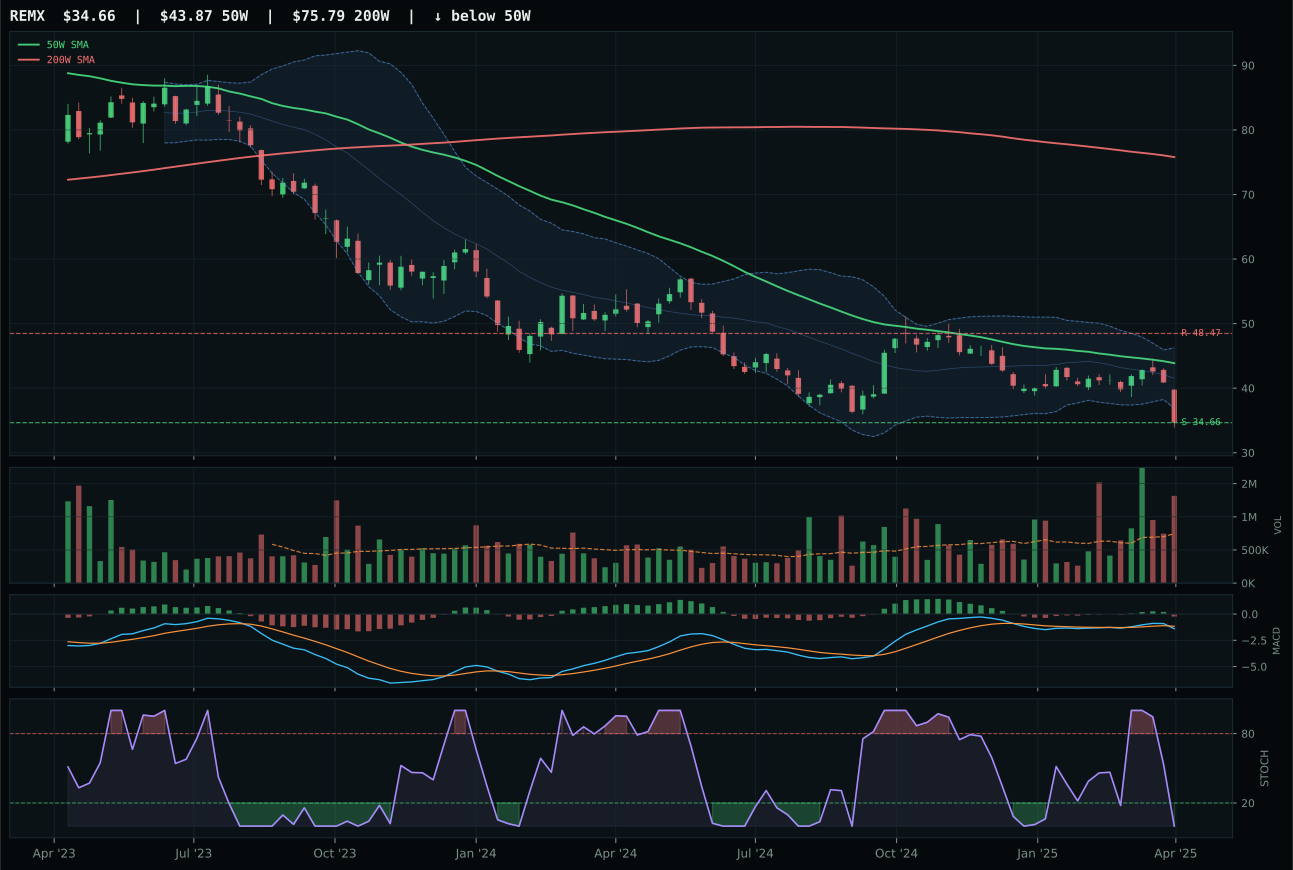
REMX has a pullback into support profile with 1.2% 13-week relative strength versus SPY.
Extension and support failure are the main tactical risks.
Tracked, but not top-2 eligible because: structurally broken.
COPX wins by 24.7 points over PICK, yet this is a pyrrhic victory in a category where no ETF registers as technically sound. COPX trades 24.0% below the 50-week, placing it in structural breakdown where support must hold or reversal cascades into the 200-week test. PICK's structure cleanliness at 36.7 versus COPX's 71.1 initially suggests COPX is cleaner, but this reflects pure positioning of the support level, not conviction—both carry zero momentum confirmation, zero category-relative strength, and matching bearish/weakening MACD. The key differentiator is volume: COPX shows 1.43x 20-week average participation suggesting some accumulation into 32.67 support, while PICK broadcasts distribution pressure at 52-week lows. Neither ETF offers a compelling long thesis; COPX merely offers slightly better entry timing if support holds, whereas PICK has already rolled over harder on relative strength at 3.6% versus SPY. Risk/reward is universally negative across the basket, with COPX's 75.0 being the least terrible at negative 30.3% to resistance and 0.0% downside.
Industrial Metals holds 5% allocation despite a final category score of 0.0, indicating ineligibility to the highest tiers and a failed eligibility gate. Liquidity stress at minus-8 is the sole active macro descriptor penalizing this category, reflecting copper and metals funding stress in a tightening credit environment. The category-level macro fit of 42.0 falls below even Agriculture, and technical evidence across all three ETFs (PICK 13.7, COPX 12.7, REMX 11.7) registers as uniformly weak in the 0.0 technical evidence bucket. COPX at 28 composite and PICK at 3 composite represent a category in structural decline, not consolidation. The allocation serves purely as a volatility hedge to duration and is positioned with the understanding that copper demand destruction in a deflationary cycle outweighs supply scarcity narratives. For reallocation upward: either liquidity stress would need to reverse (credit normalization), or the energy scarcity descriptor would need to introduce power-constrained mining dynamics that support prices—neither of which is visible in the current macro regime. This is a seat-warming allocation awaiting regime change.
Emerging Markets — INDA
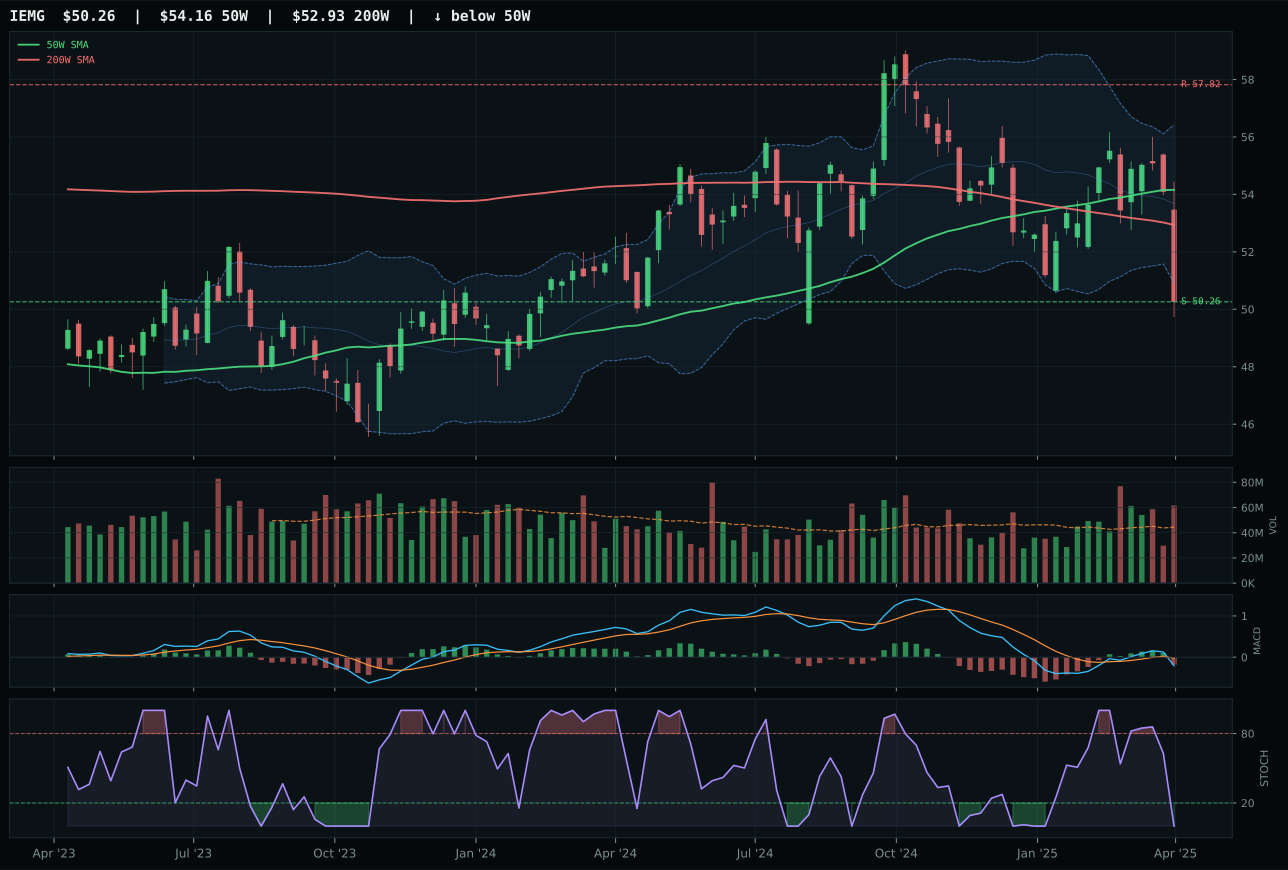
IEMG has a pullback into support profile with 10.2% 13-week relative strength versus SPY.
A failed hold above support would weaken the setup.
Actionable but governed by invalidation levels.
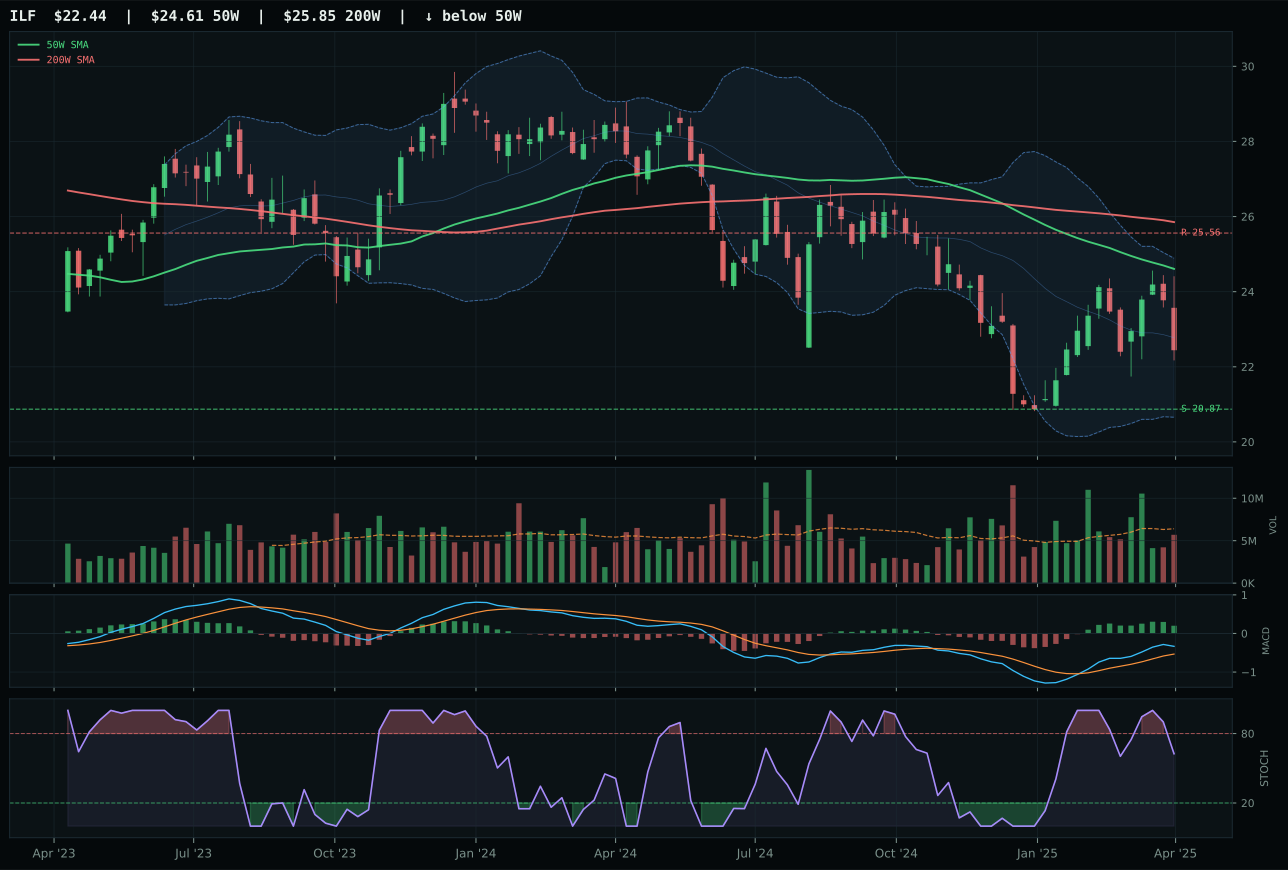
ILF has a neutral structure profile with 22.2% 13-week relative strength versus SPY.
Extension and support failure are the main tactical risks.
Tracked, but not top-2 eligible because: structurally broken.
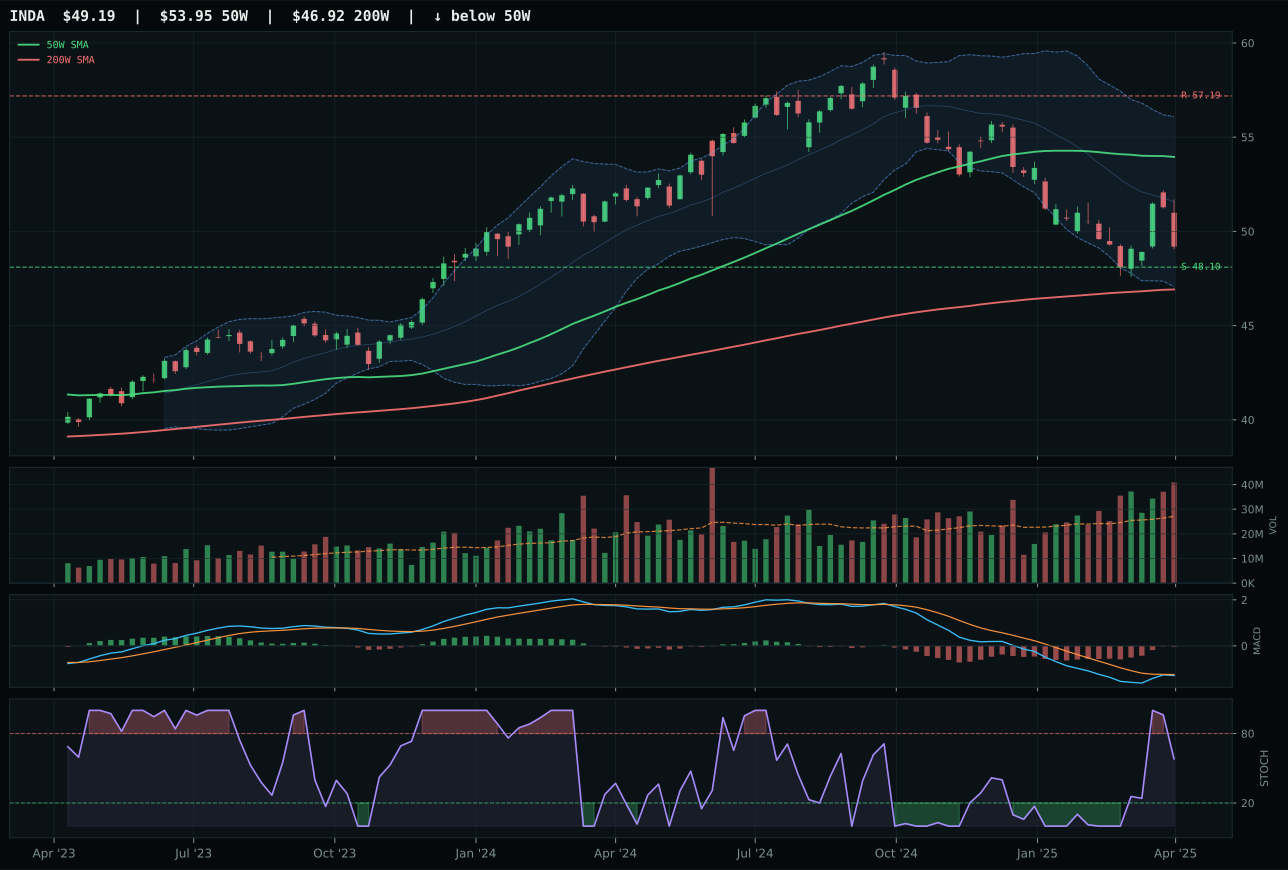
INDA has a pullback into support profile with 6.8% 13-week relative strength versus SPY.
A failed hold above support would weaken the setup.
Actionable but governed by invalidation levels.
INDA wins by 7.0 points over IEMG despite both trading below the 50-week in pullback consolidation, the decision hinging entirely on timing execution rather than directional momentum. INDA's timing score of 93 crushes IEMG's 80, reflecting superior positioning just 8.8% below the 50-week versus IEMG's deeper 10.2% retracement, combined with INDA's MACD bearish but improving and stochastic RSI rising mid-zone (0.58) versus IEMG's oversold (unable to recover). Risk-reward differentiates further: INDA at 82.0 grants 14.0% upside and 2.3% downside protection, while IEMG at 74.4 allows only 14.0% upside and takes on larger support risk. Category-relative strength of negative 3.4% for INDA versus 0.0% for IEMG signals that India quality growth is being hit harder than broad emerging-market beta, yet the superior timing mechanics suggest INDA is positioned to rebound first if the selloff exhausts. Volume distribution pressure on INDA contrasts with IEMG's above-average participation, meaning India holdings are sticky (holders refusing to exit) rather than rotating.
Emerging Markets earned 0% allocation, ranking 9th or 10th in the portfolio and excluded entirely from consideration. The category score of 11.4 reflects liquidity stress at minus-10 and broad market bear at minus-9 overwhelming any technical merit in INDA's setup. Category-level macro fit sits at 31.0, the second-lowest after Agriculture, creating a deflationary headwind that makes emerging-market beta a liability rather than a hedge. INDA's technical evidence of 14.7 is weak across all pillars, and even the superior timing at 93 cannot overcome the structural macro drag. Liquidity stress particularly punishes emerging markets, as capital flows northward toward developed-market safety during risk-off cycles. For INDA to re-enter the portfolio: either liquidity stress would need to reverse (capital market stabilization), or the broad market bear descriptor would need to flip, requiring a clear shift in equity risk appetite. The current regime favors defensive, income-generating exposures in developed markets over growth and volatility in emerging economies, making a zero allocation defensible.
Traditional Energy — XLE
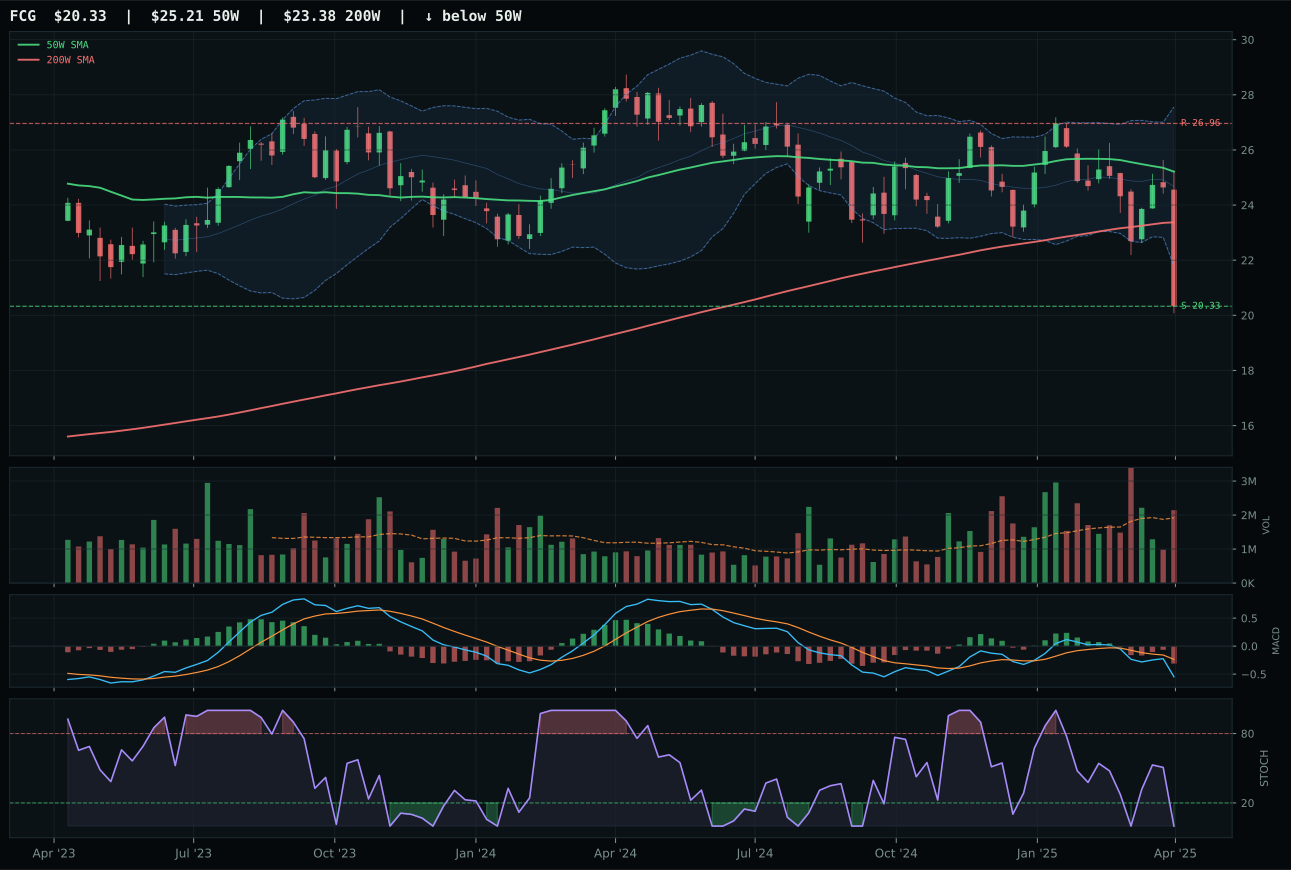
FCG has a pullback into support profile with -4.6% 13-week relative strength versus SPY.
A failed hold above support would weaken the setup.
Actionable but governed by invalidation levels.
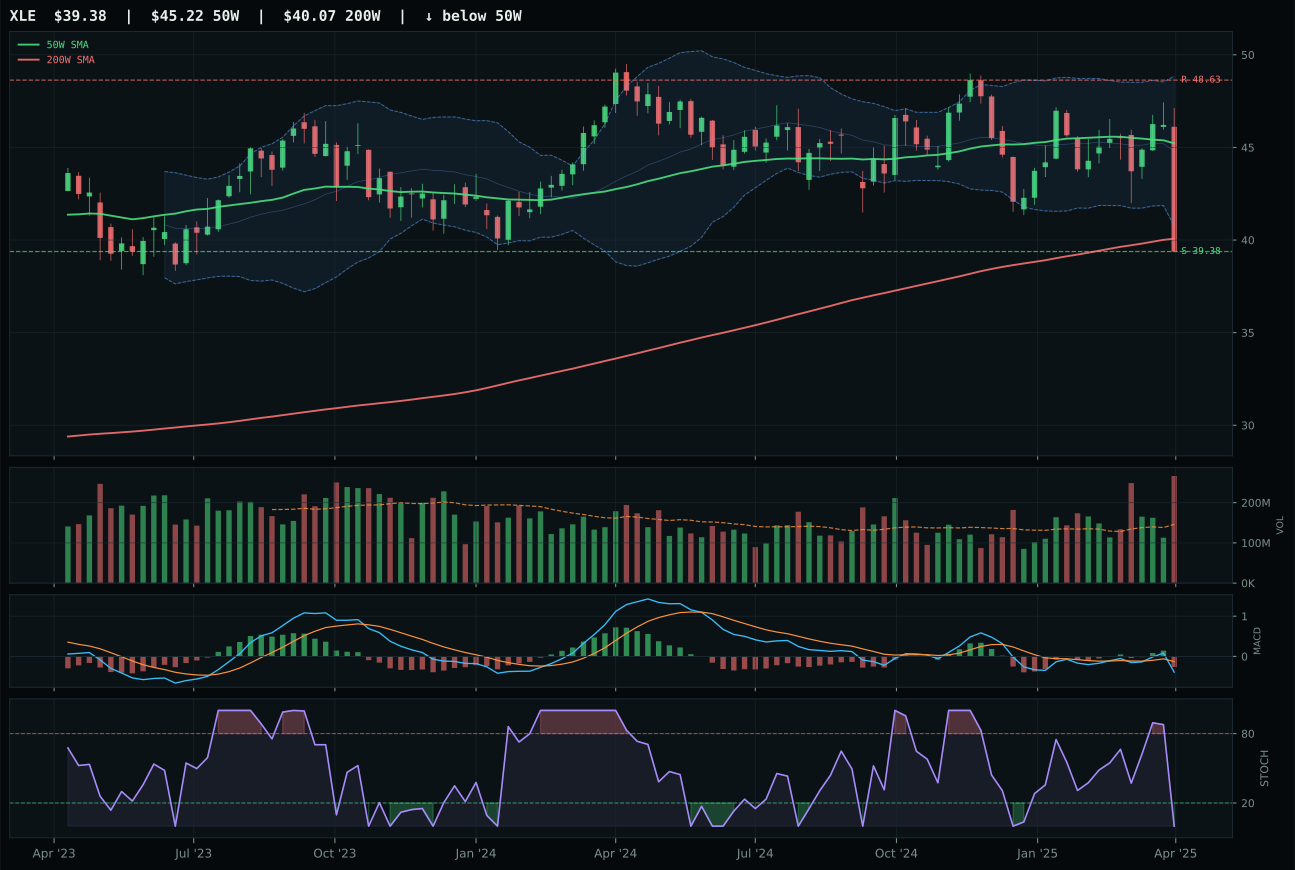
XLE has a pullback into support profile with 4.7% 13-week relative strength versus SPY.
A failed hold above support would weaken the setup.
Actionable but governed by invalidation levels.
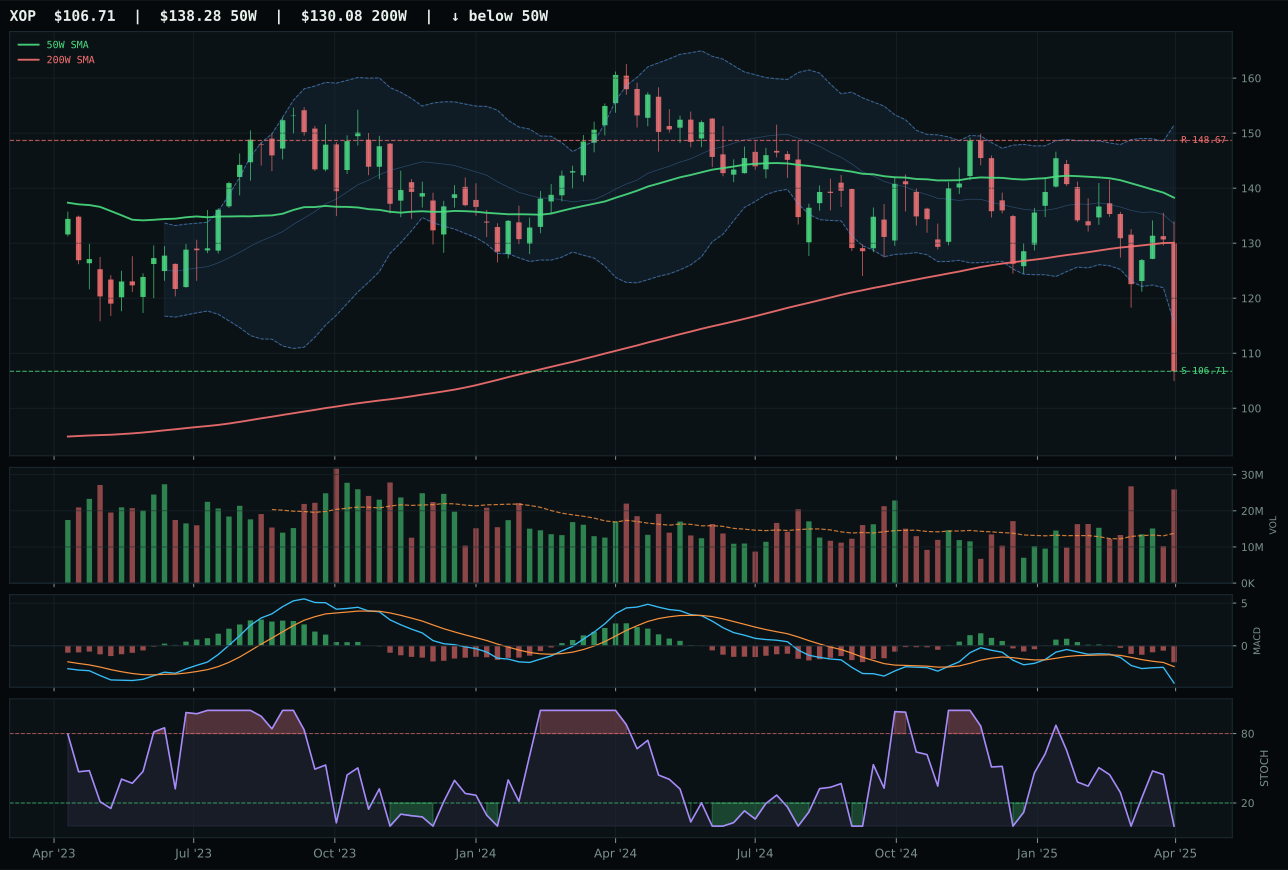
XOP has a pullback into support profile with -6.6% 13-week relative strength versus SPY.
A failed hold above support would weaken the setup.
Actionable but governed by invalidation levels.
XLE wins by just 0.4 points over FCG, a near-tie that masks deeper structural divergence. XLE carries momentum confirmation of 19.1 versus FCG's 0.0, driven by category-relative strength of 9.3% versus 0.0%, signaling that integrated energy cash flow is holding relative to pure natural gas plays. Both trade below the 50W and 200W in repair-zone pullbacks, both face oversold stochastic, and both show MACD deterioration. The technical advantage for XLE is negligible—trend scores of 44 versus 30—but it reflects the broader market's preference for integrated energy balance sheets over single-commodity exposure. Volume tells a critical story: XLE distributes at 1.82x while FCG accumulates at above-average participation, suggesting the market is rotating away from energy entirely but rotating out of pure plays first. Risk-reward is universally punitive (XLE 79.8 still means negative 19.0% to resistance), a market structure that says energy bulls are fighting against the macro current.
Traditional Energy earned 0% allocation this week, ranking outside the portfolio entirely (9th or 10th), a direct result of both weak technical evidence (8.6 for XLE) and a conflicted macro regime. Energy scarcity active at plus-14 would normally anchor this category, but it's overwhelmed by disinflation at minus-10 and liquidity stress at minus-7, creating a net macro fit of just 39.0. The category score of 4.3 reflects persistent deterioration from the 23.3 opening 3/2/1 basket after stress-testing against persistence, volume-price confirmation, and setup quality—all scoring in the teens. In a deflationary cycle, energy demand destruction outweighs supply-side constraints, and the energy scarcity descriptor, while active, is priced as a long-term structural risk rather than a near-term alpha driver. For XLE to re-enter the portfolio: either crude oil would need to establish support above $45 with bullish MACD divergence, or geopolitical events would need to amplify the energy scarcity descriptor to the point where it overrides disinflation headwinds. Current positioning reflects the regime accurately.