
2025-03-28
Informational purposes only. The content in this report, including allocations, analysis, and commentary, is provided solely for informational and educational purposes. It does not constitute financial advice, investment advice, trading advice, or any other type of advice. Past performance does not guarantee future results. Always conduct your own research and consult a qualified financial professional before making investment decisions.
Weekly Allocation
| Ticker | Category | Weight | Role |
|---|---|---|---|
| FBTC | 50% | Overlay | |
| SLV | Precious Metals | 10% | Top-2 (10%) |
| IGF | Utilities & Infrastructure | 10% | Top-2 (10%) |
| ITA | Defense & Aerospace | 5% | Tier-2 (5%) |
| CIBR | Technology | 5% | Tier-2 (5%) |
| NLR | Nuclear Energy | 5% | Tier-2 (5%) |
| VEGI | Agriculture & Livestock | 5% | Tier-2 (5%) |
| XLE | Traditional Energy | 5% | Tier-2 (5%) |
| INDA | Emerging Markets | 5% | Tier-2 (5%) |
Trade Instructions — Monday Open
Sell the tranche from 2025-02-28 (completing its 4-week hold). Buy the new tranche. Instructions show net portfolio changes — same-asset positions cancel, weight changes show the delta.
| Action | Ticker | Instruction |
|---|---|---|
| SELL | GLD | Sell 25% of GLD position (reduce 10.00% → 7.50%) |
| SELL | XLU | Sell 50% of XLU position (reduce 5.00% → 2.50%) |
| SELL | XLK | Sell entire XLK position (1.25% of portfolio) |
| SELL | BOTZ | Sell 50% of BOTZ position (reduce 2.50% → 1.25%) |
| BUY | IGF | Buy IGF — 33.33% of freed cash (adds 2.50% to portfolio) |
| BUY | CIBR | Buy CIBR — 16.67% of freed cash (adds 1.25% to portfolio) |
| BUY | SLV | Buy SLV — 33.33% of freed cash (adds 2.50% to portfolio) |
| BUY | INDA | Buy INDA — 16.67% of freed cash (adds 1.25% to portfolio) |
Current Portfolio After Trade
Combined holdings across all 4 active tranches. Each tranche is 25% of the portfolio.
| Ticker | % of Portfolio | Weight Bar |
|---|---|---|
| FBTC | 50.00% | |
| GLD | 7.50% | |
| IGF | 7.50% | |
| ITA | 5.00% | |
| CIBR | 5.00% | |
| XLU | 2.50% | |
| XLE | 2.50% | |
| VEGI | 2.50% | |
| AIQ | 2.50% | |
| IEMG | 2.50% | |
| URNM | 2.50% | |
| COPX | 2.50% | |
| SLV | 2.50% | |
| BOTZ | 1.25% | |
| FCG | 1.25% | |
| NLR | 1.25% | |
| INDA | 1.25% |
Macro Regime — Disinflation
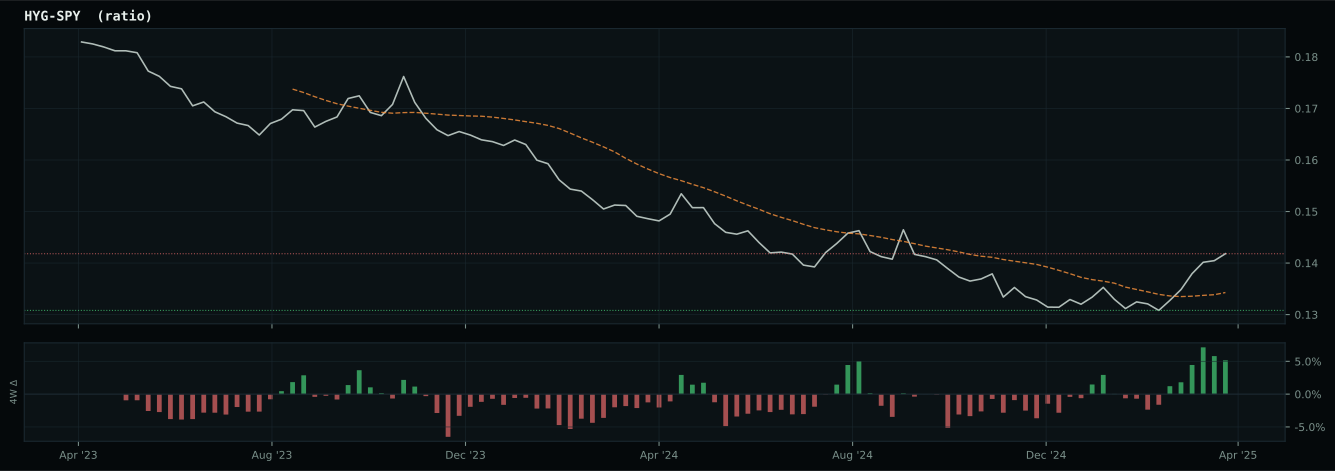
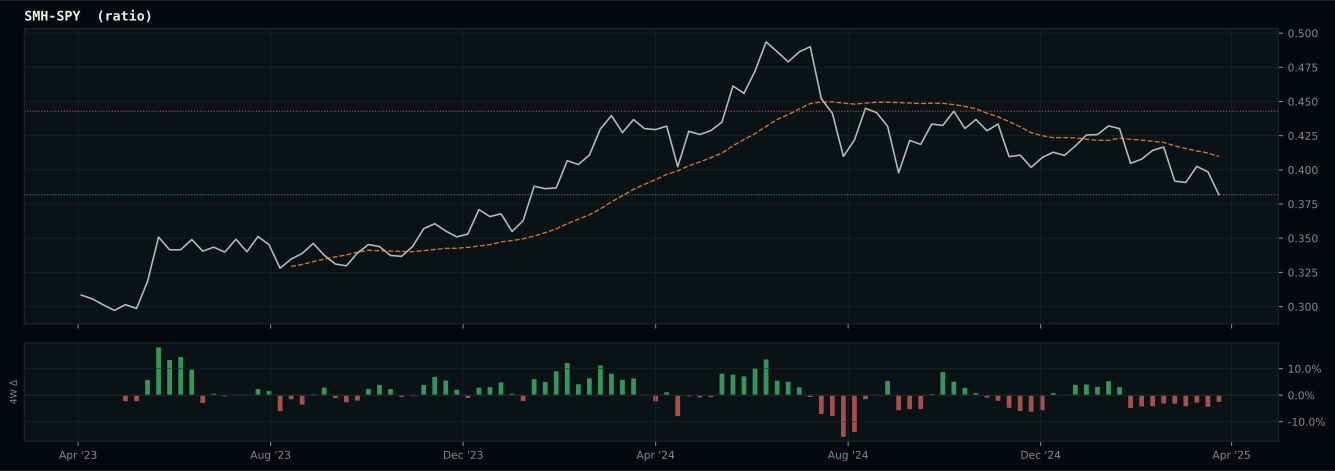
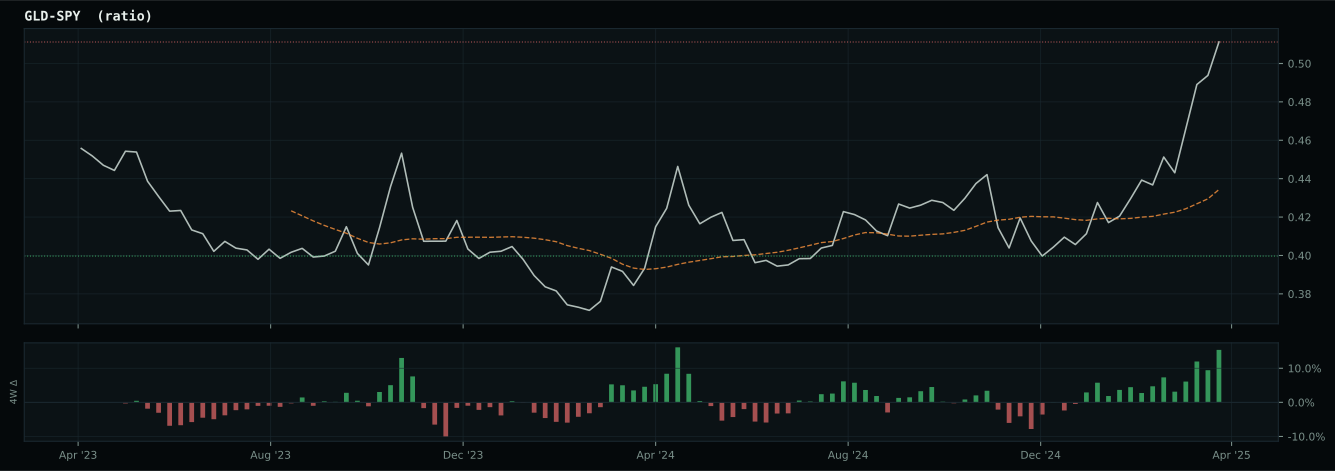
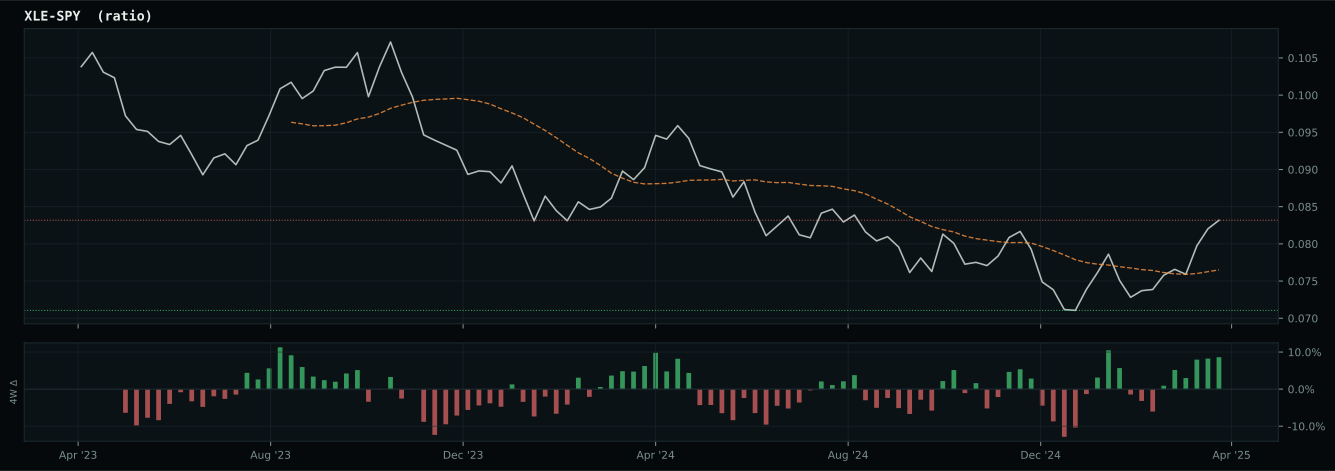
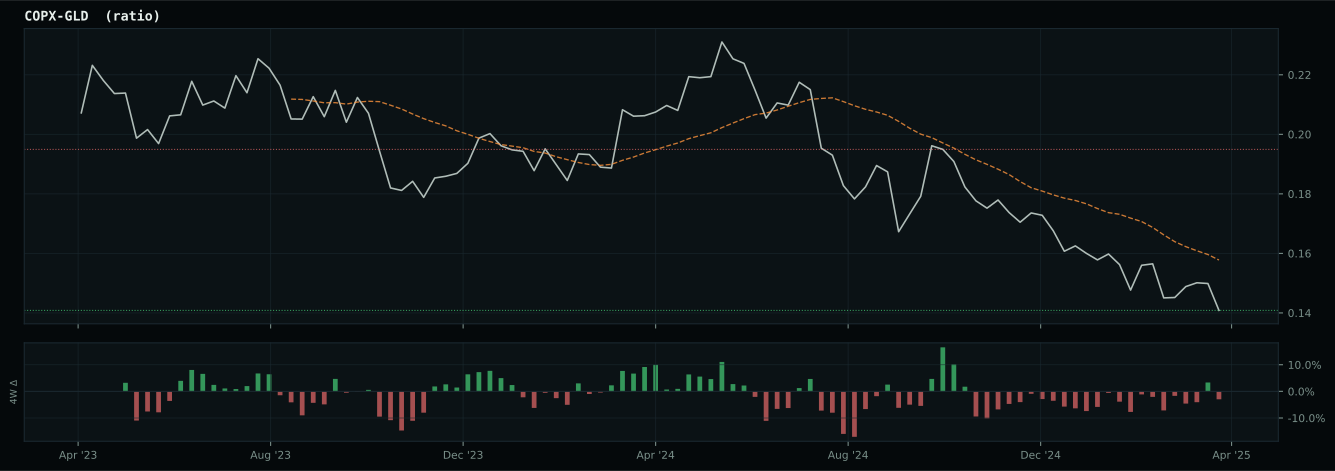
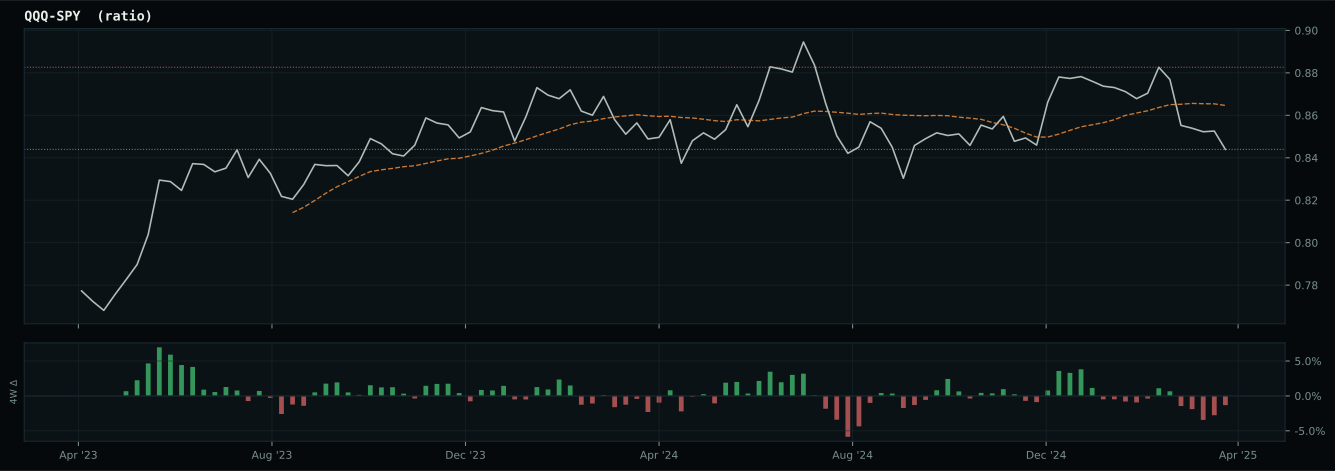
growth data is not confirming the weak market-implied risk appetite signal
Macro Evidence Charts
Market-implied signals behind the macro regime scores. Each ratio compares two assets; the direction and slope of the ratio is what the macro engine reads.
Crypto Regime — TrendBTC
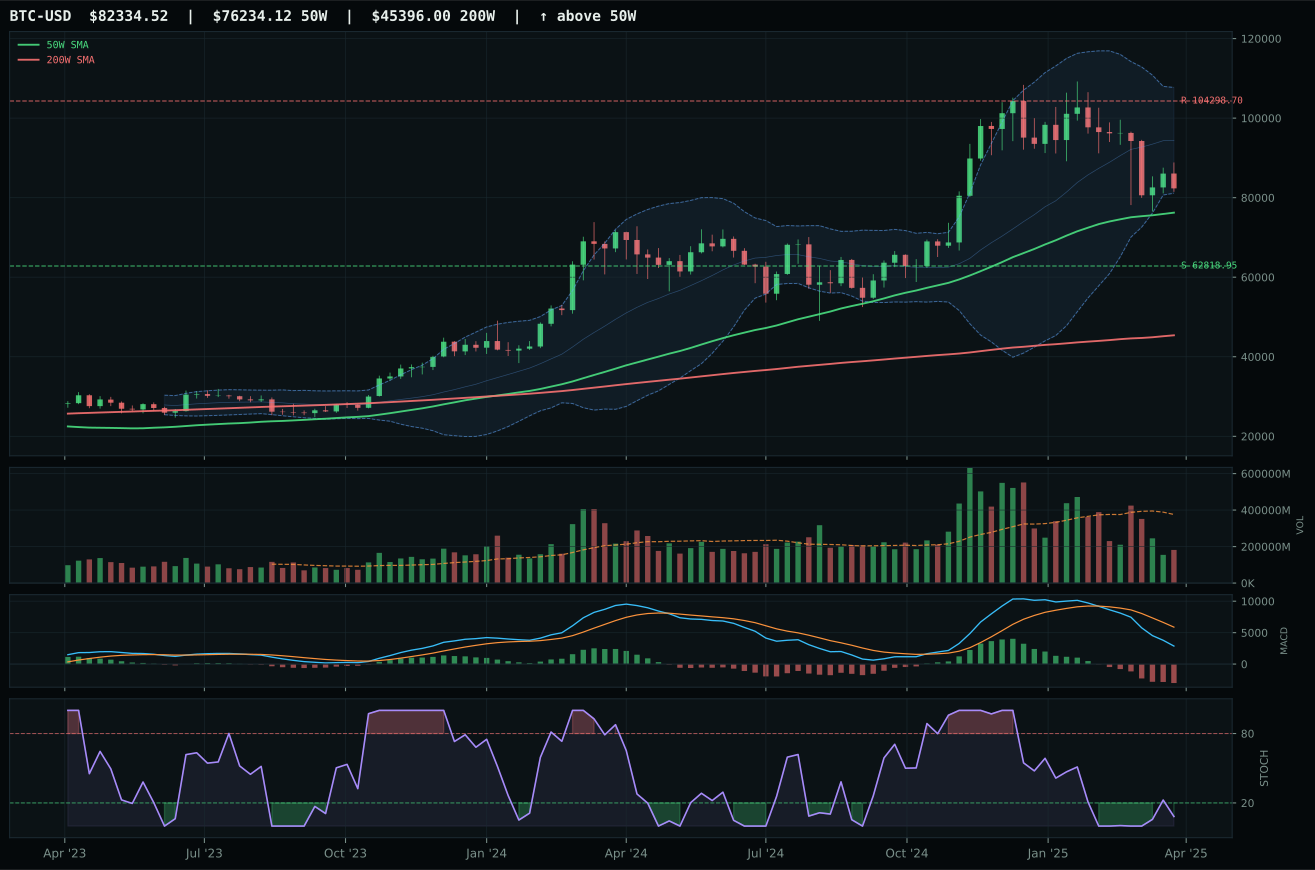
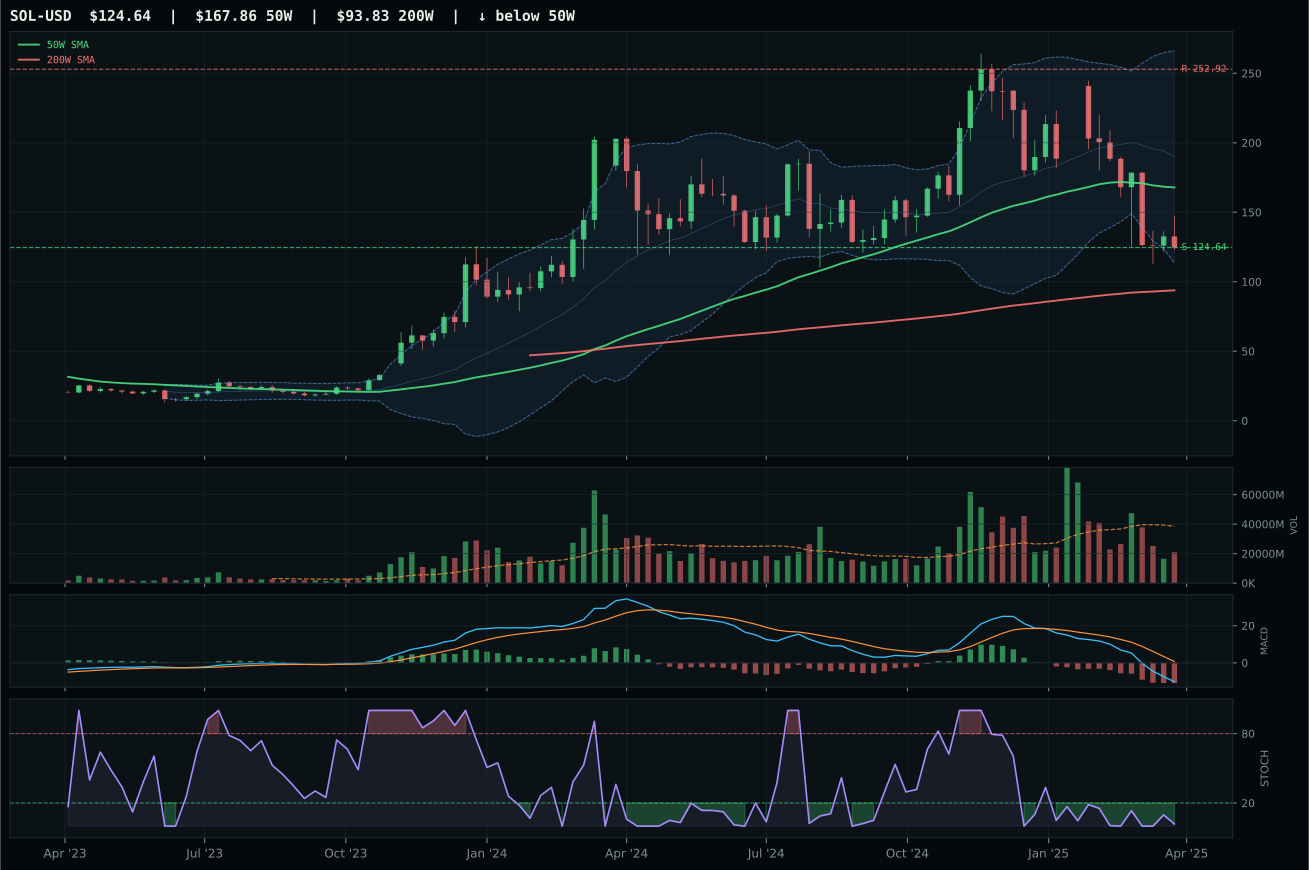
ValueBTC not armed: BTC has not made the first post-breakdown touch of the 200W buy zone after losing the 50W
TrendBTC confirmed: 2 consecutive closes above rising/flat 50W SMA
one or more available conditions failed
Category Rankings
| Rank | Category | Winner | Score | Alloc | 4W Ret | Peers (4W) |
|---|---|---|---|---|---|---|
| 1 | Precious Metals | SLV | 86.5 | 20% | -2.24% | GDX +5.5% · GLD +5.8% |
| 2 | Utilities & Infrastructure | IGF | 58.9 | 20% | +3.91% | XLU +0.2% · PAVE +2.4% |
| 3 | Defense & Aerospace | ITA | 46.0 | 10% | +2.78% | XAR +7.1% · ROKT -0.7% |
| 4 | Technology | CIBR | 43.3 | 10% | +4.76% | IGV +7.8% · XLK +2.7% |
| 5 | Nuclear Energy | NLR | 35.7 | 10% | +7.51% | URNM +6.3% · URA +8.1% |
| 6 | Traditional Energy | XLE | 27.5 | 10% | -10.77% | FCG -12.7% · XOP -13.0% |
| 7 | Emerging Markets | INDA | 21.4 | 10% | +5.10% | IEMG +0.8% · ILF +6.1% |
| 8 | AI | AIQ | 21.0 | 10% | +2.83% | BOTZ +0.8% · SMH +1.7% |
| 9 | Industrial Metals | COPX | 20.6 | 0% | +0.88% | REMX -3.7% · PICK -0.2% |
| 10 | Agriculture & Livestock | VEGI | — | 0% | +1.58% | MOO +1.3% · WEAT -1.3% |
Precious Metals — SLV
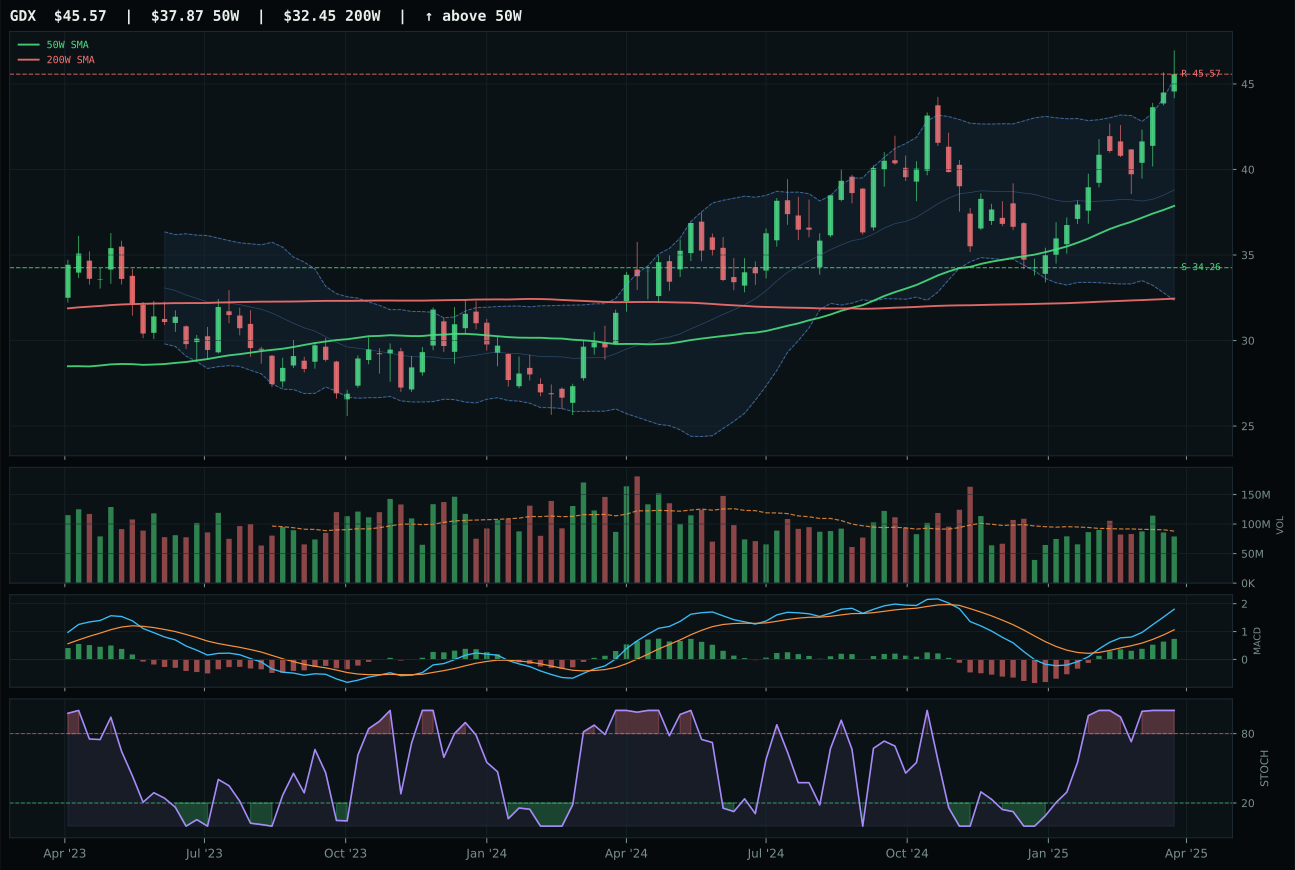
GDX has a vertical extension profile with 39.6% 13-week relative strength versus SPY.
A failed hold above support would weaken the setup.
Actionable but governed by invalidation levels.
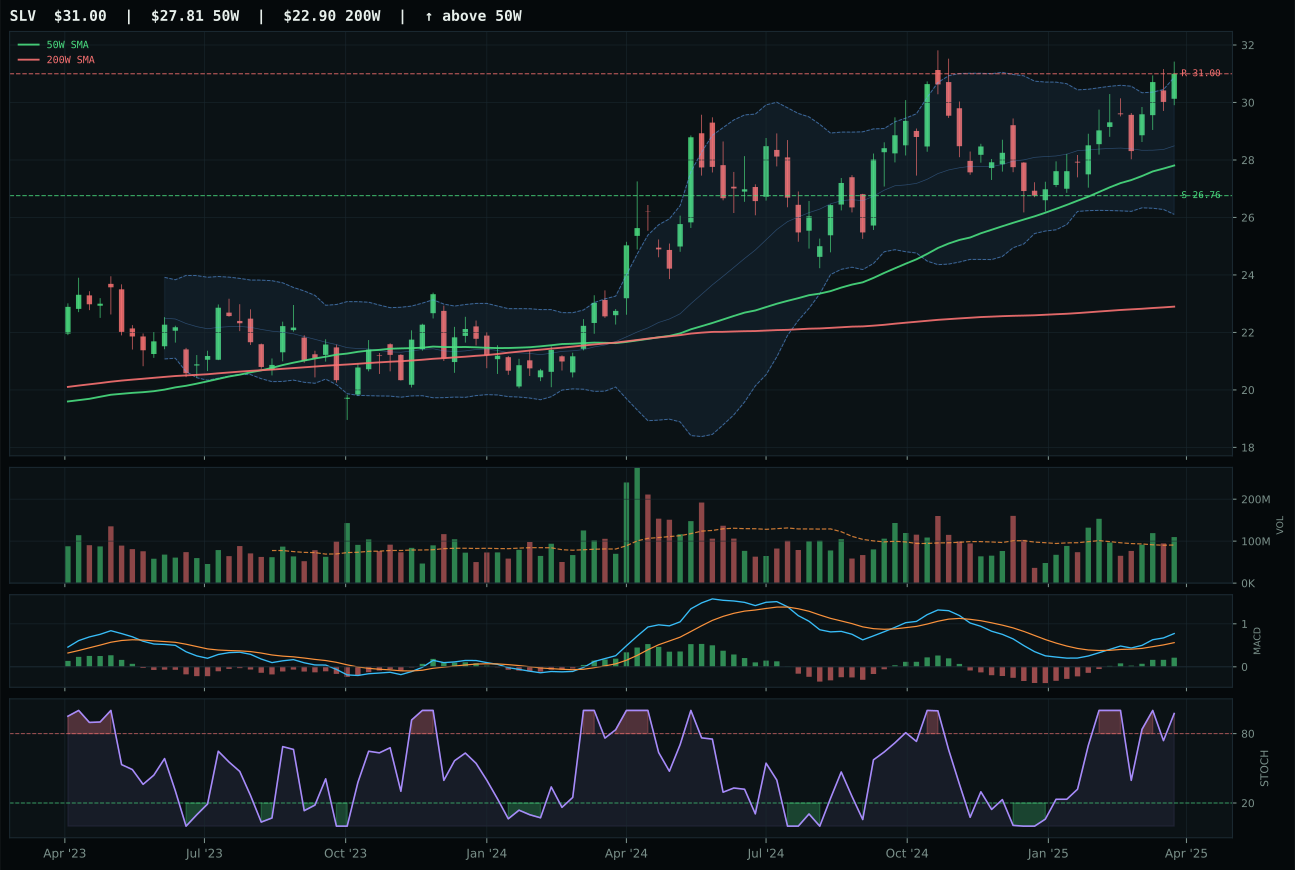
SLV has a neutral structure profile with 22.5% 13-week relative strength versus SPY.
A failed hold above support would weaken the setup.
Actionable but governed by invalidation levels.
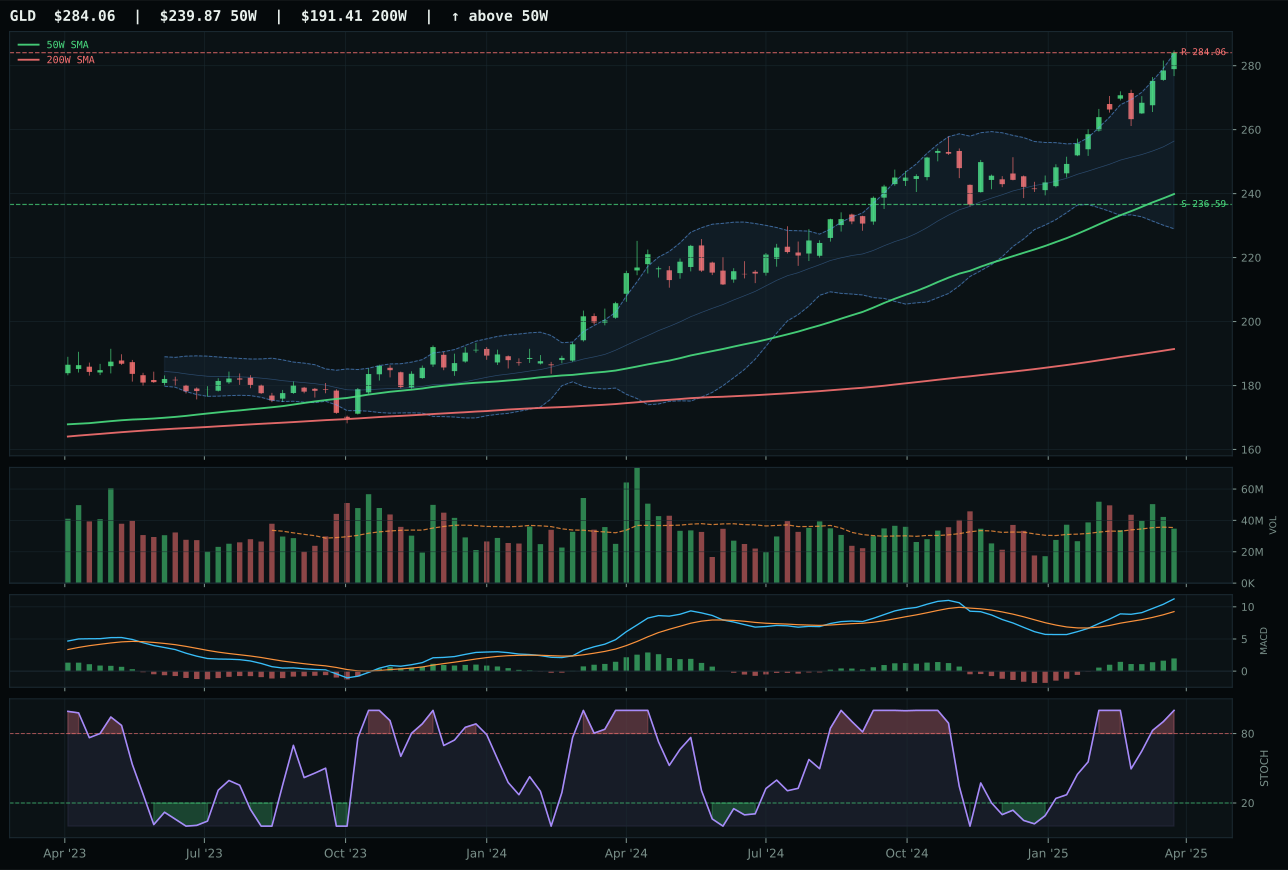
GLD has a vertical extension profile with 24.3% 13-week relative strength versus SPY.
A failed hold above support would weaken the setup.
Actionable but governed by invalidation levels.
SLV captures the category with 86.5 points and top-2 ranking by posting the cleanest structure (84.1 vs GDX's 80.5), highest volume confirmation (1.21x participation versus neutral), and the tightest extension from the 50W (11.5% versus GDX's stretched 20.3%). Both share bullish MACD and overbought stochastic RSI momentum, but SLV's 15.8% 13W return and 22.5% SPY relative strength reflect steady accumulation into higher prices, whereas GDX's 33.0% 13W return represents a pure extension that arrived on 39.6% SPY relative strength—late and unconfirmed by participation. The timing score separation (59 versus 37) reveals that SLV sits in a high-probability zone near the 52W high with room to extend, while GDX has already overrun its structural support levels and now faces gravity from above.
Precious Metals earned 10% top-2 allocation with a category score of 86.5, the second-highest in this week's portfolio. The macro fit of 85.0/100 tells the story: monetary hedge bid is active at +14, defensive rotation at +7, disinflation helps at +8, and disinflation pressure adds +6—a perfect storm of conditions that push hard assets into favor when risk appetite breaks and real yields compress. SLV's neutral structure and steady above-average volume participation (versus GDX's vertical extension on thin participation) make it the safer of the two monetary plays. The category's 62% technical weighting and 38% macro weighting produced a score where macro context dominates; in a disinflation regime with defensive rotation active and a monetary hedge bid, precious metals represent one of the portfolio's two highest-conviction opportunities alongside utilities infrastructure.
Utilities & Infrastructure — IGF
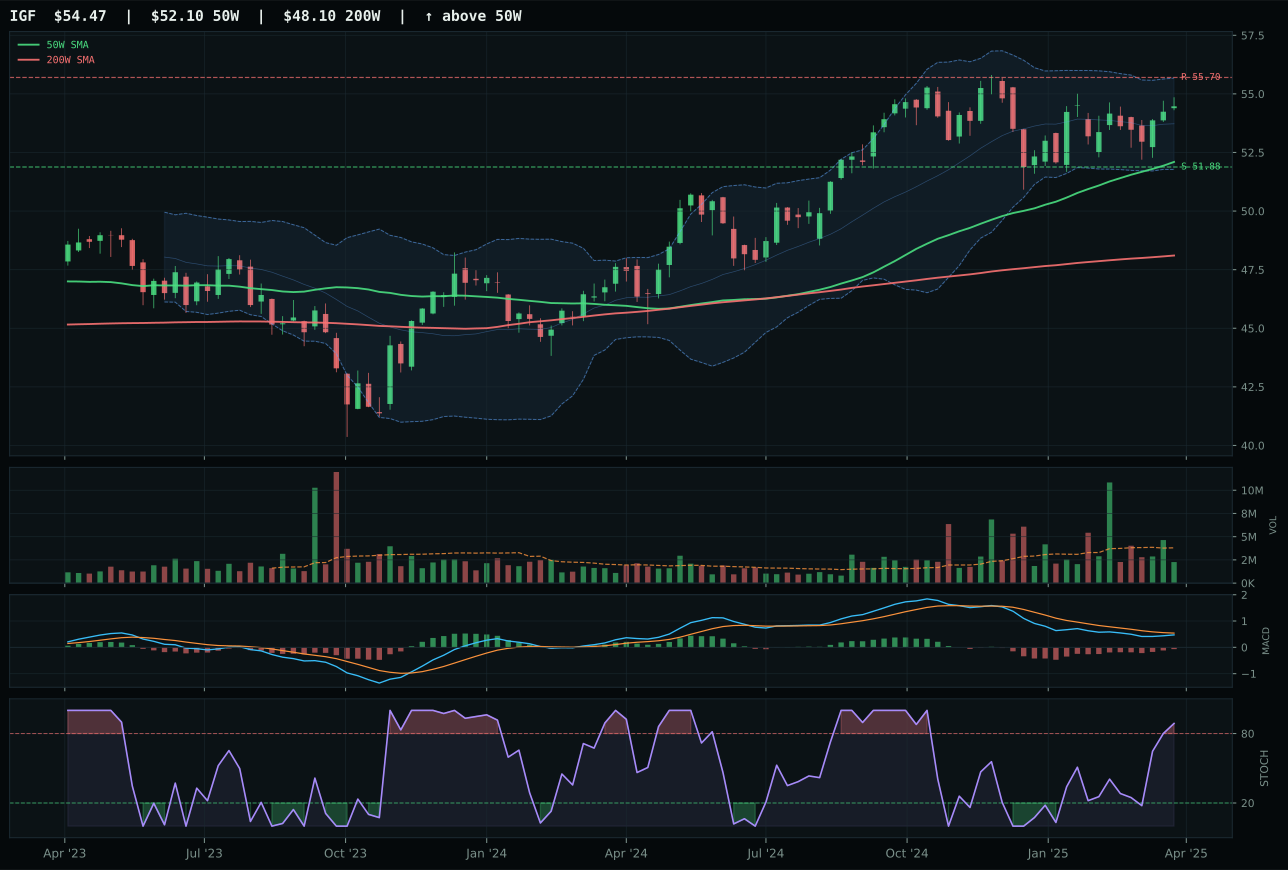
IGF has a pullback into support profile with 10.7% 13-week relative strength versus SPY.
A failed hold above support would weaken the setup.
Actionable but governed by invalidation levels.
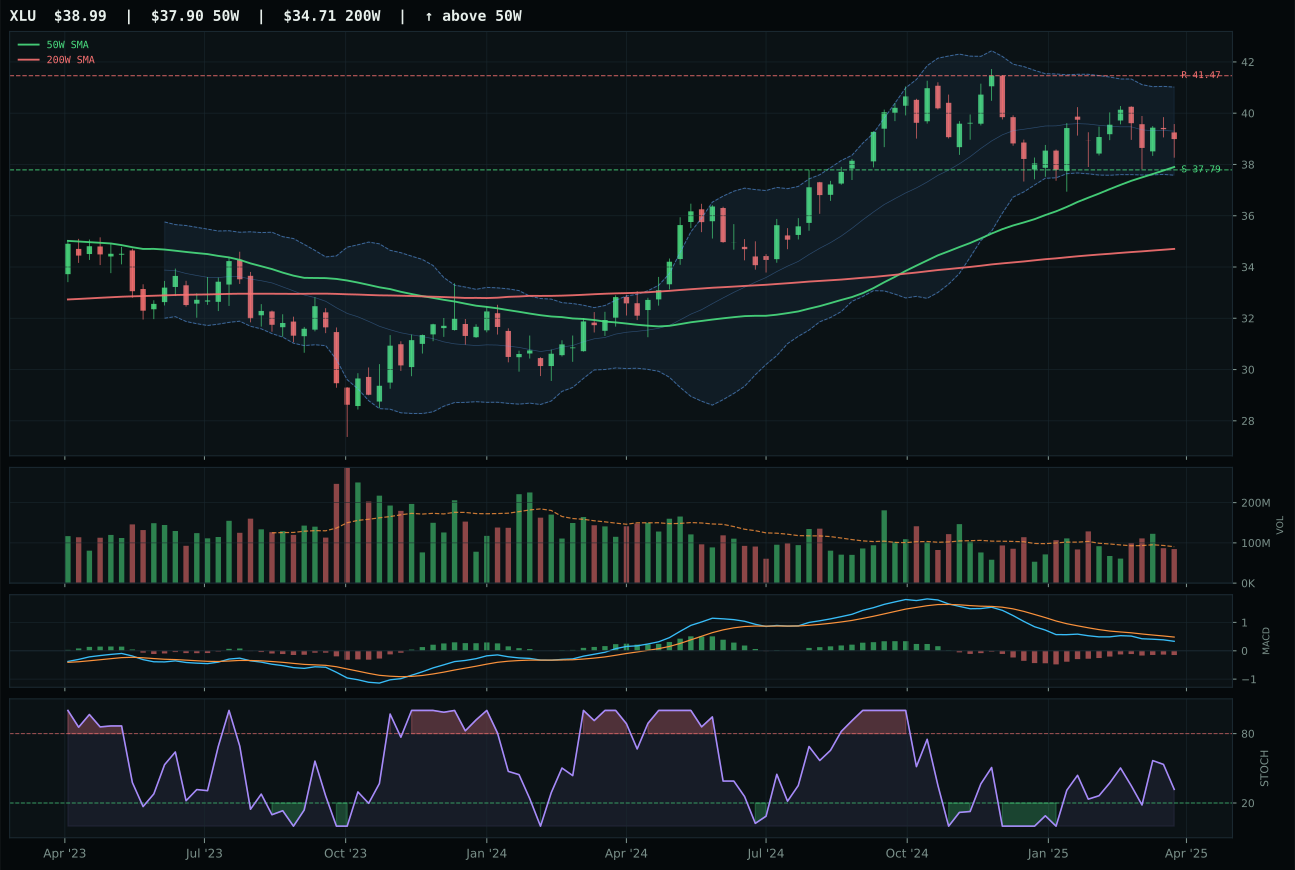
XLU has a pullback into support profile with 9.1% 13-week relative strength versus SPY.
A failed hold above support would weaken the setup.
Actionable but governed by invalidation levels.
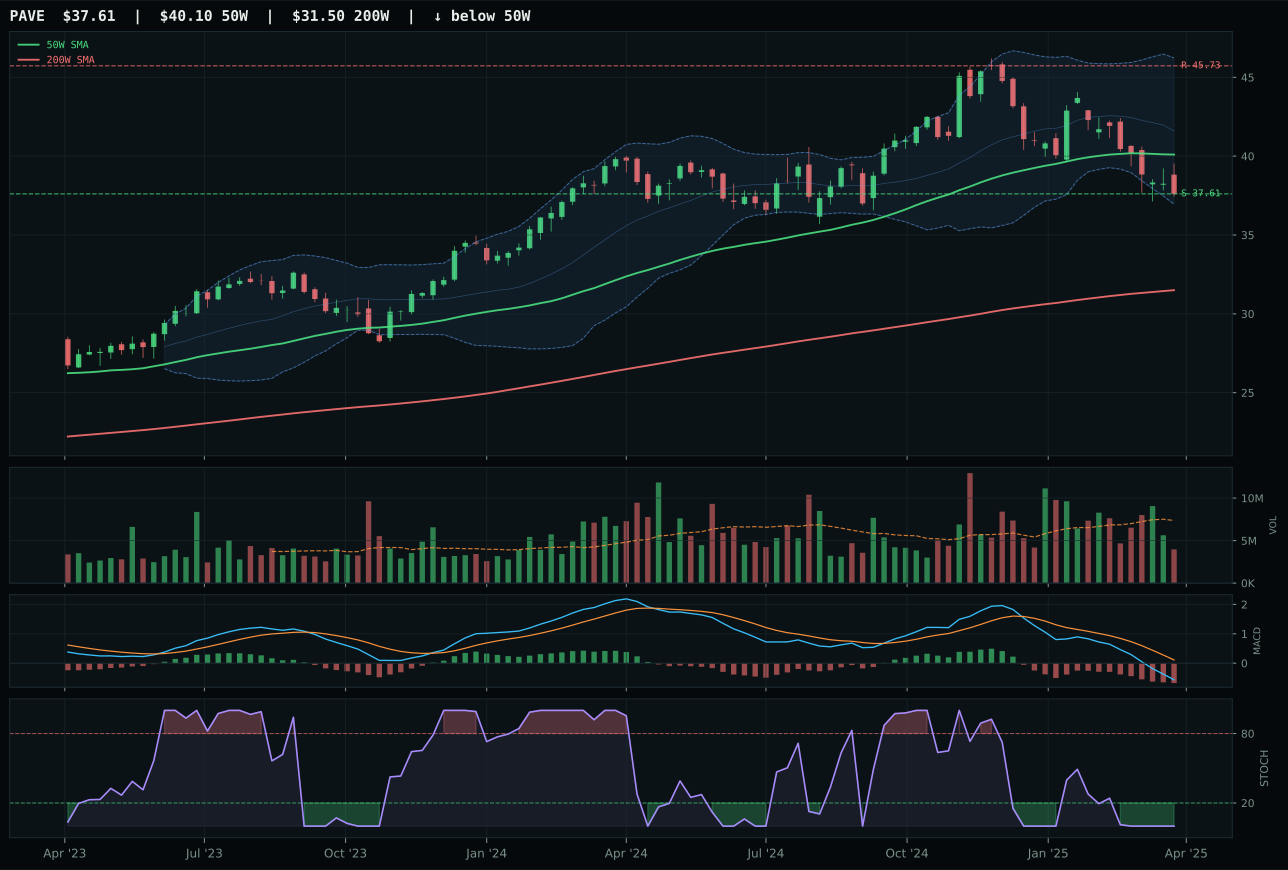
PAVE has a pullback into support profile with -1.6% 13-week relative strength versus SPY.
A failed hold above support would weaken the setup.
Actionable but governed by invalidation levels.
IGF secures top-2 ranking and 10% allocation by winning the category at 58.9 with perfect trend (100/100) and timing (100/100) scores, maintaining price above both the 50W and 200W with only 4.6% extension—a textbook non-extended leader. The structure sits at 74.0 with compression 87.6, and although volume is thin (0.60x), MACD bearish but improving and stochastic RSI overbought momentum at 0.89 signal a mature but still-accumulating setup. Category-relative strength of 1.6% versus XLU's 0.0% captures subtle sponsorship; XLU's 92 trend and 100 timing tie IGF on macro, yet structural cleanliness and relative momentum carry the decision when both sit in similar pullback-into-support formations.
Utilities & Infrastructure earned top-2 overweight allocation at 10% with a 58.9 category score, reflecting perfect technical setup (100/100 trend and timing) combined with exceptional macro fit of 80.0/100. Defensive rotation is active at +12, disinflation helps at +7, and disinflation pressure adds +6; the category sits at the intersection of macro regime support and clean technical entry. IGF's global infrastructure income mandate captures both the defensive nature of utility assets and the inflation-hedge properties of inflation-linked infrastructure contracts—a sweet spot in a disinflation regime where nominal growth is challenged but cash flows are stable. The thin volume (0.60x) reflects the quiet accumulation typical of institutions building core positions; the 53.0 risk/reward (2.2% upside, 5.0% downside to support) and 74.6% momentum confirmation validate that IGF offers tight entry risk with defined support. This category's joint top-2 ranking alongside precious metals reflects the portfolio's shift toward asset classes offering fixed income, stability, and defensive rotation benefits.
Defense & Aerospace — ITA
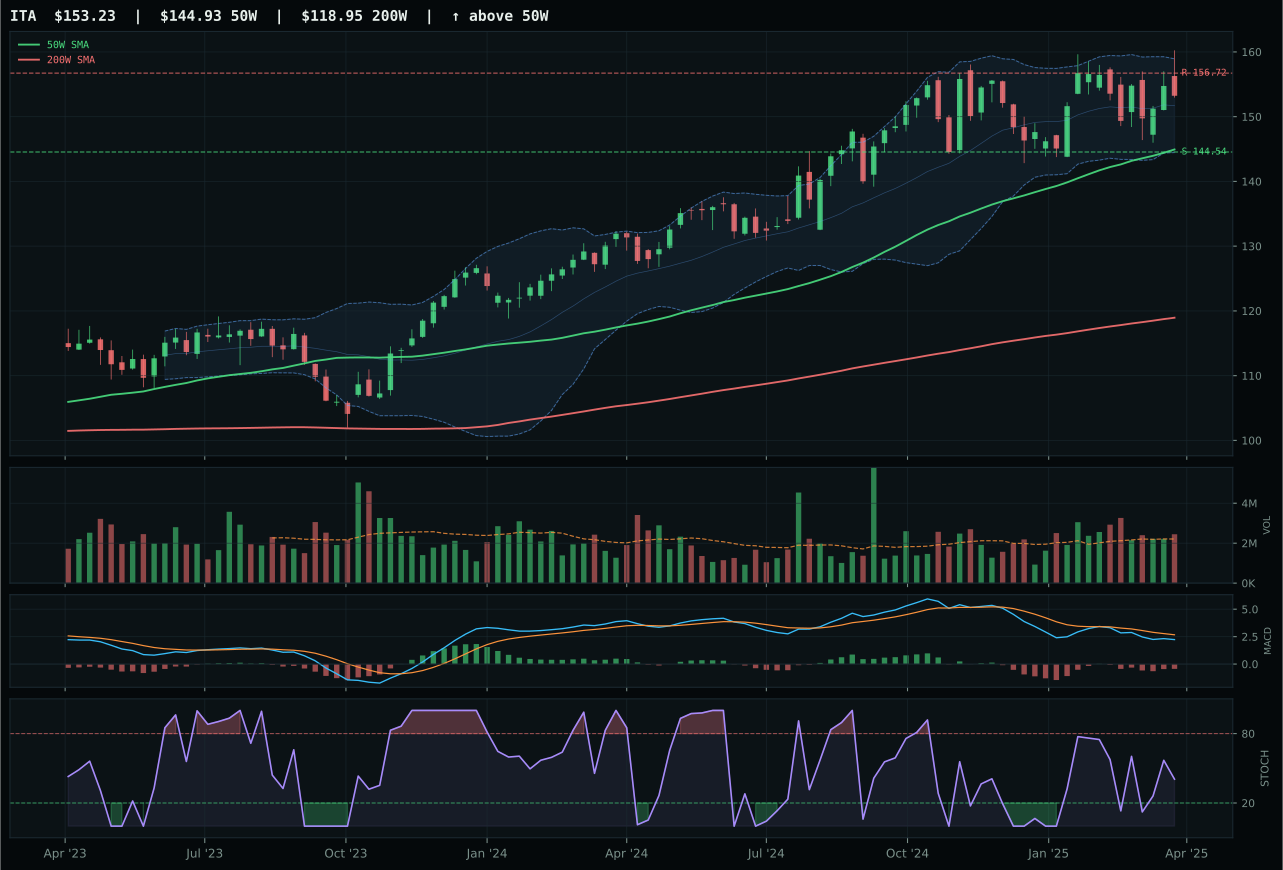
ITA has a neutral structure profile with 10.4% 13-week relative strength versus SPY.
A failed hold above support would weaken the setup.
Actionable but governed by invalidation levels.
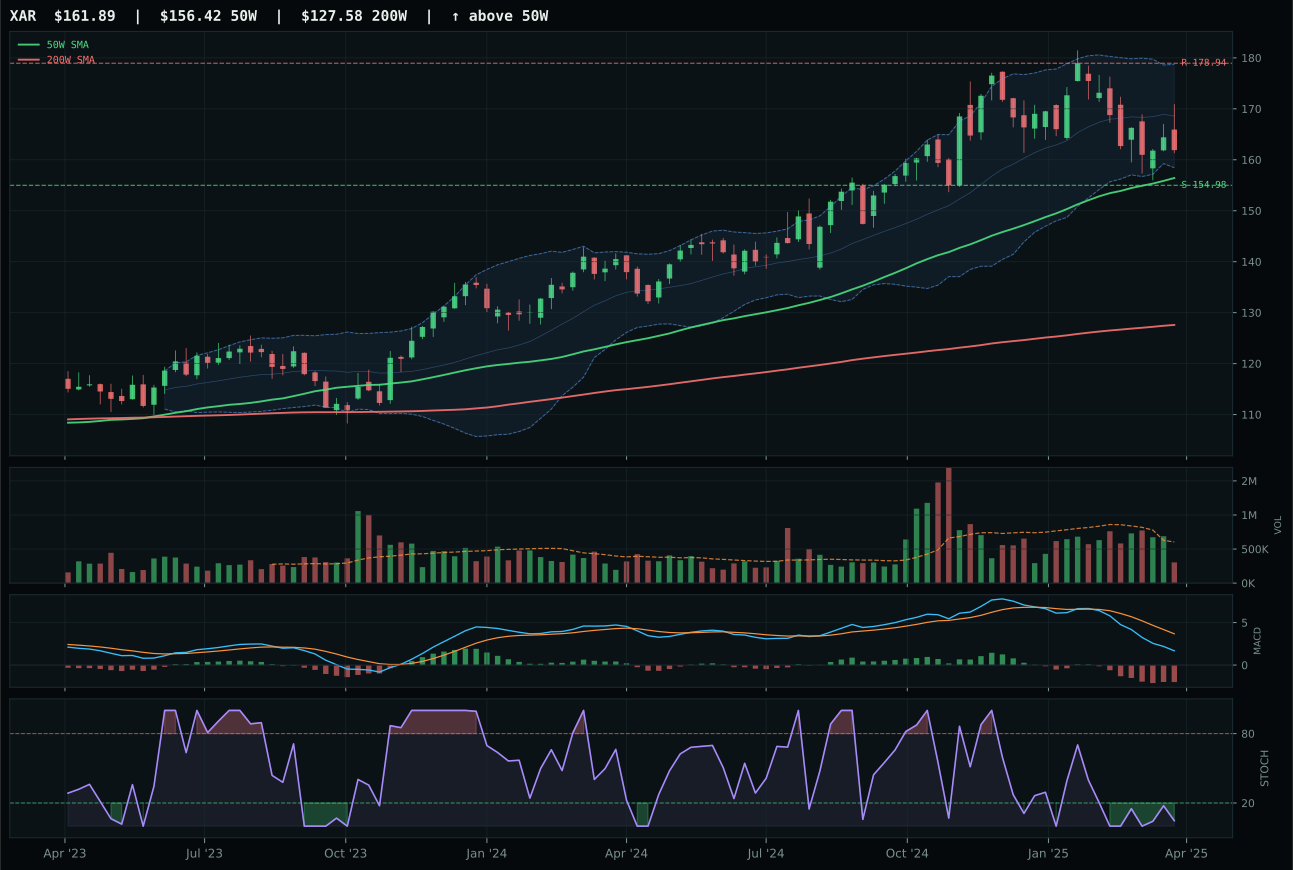
XAR has a pullback into support profile with 2.4% 13-week relative strength versus SPY.
A failed hold above support would weaken the setup.
Actionable but governed by invalidation levels.
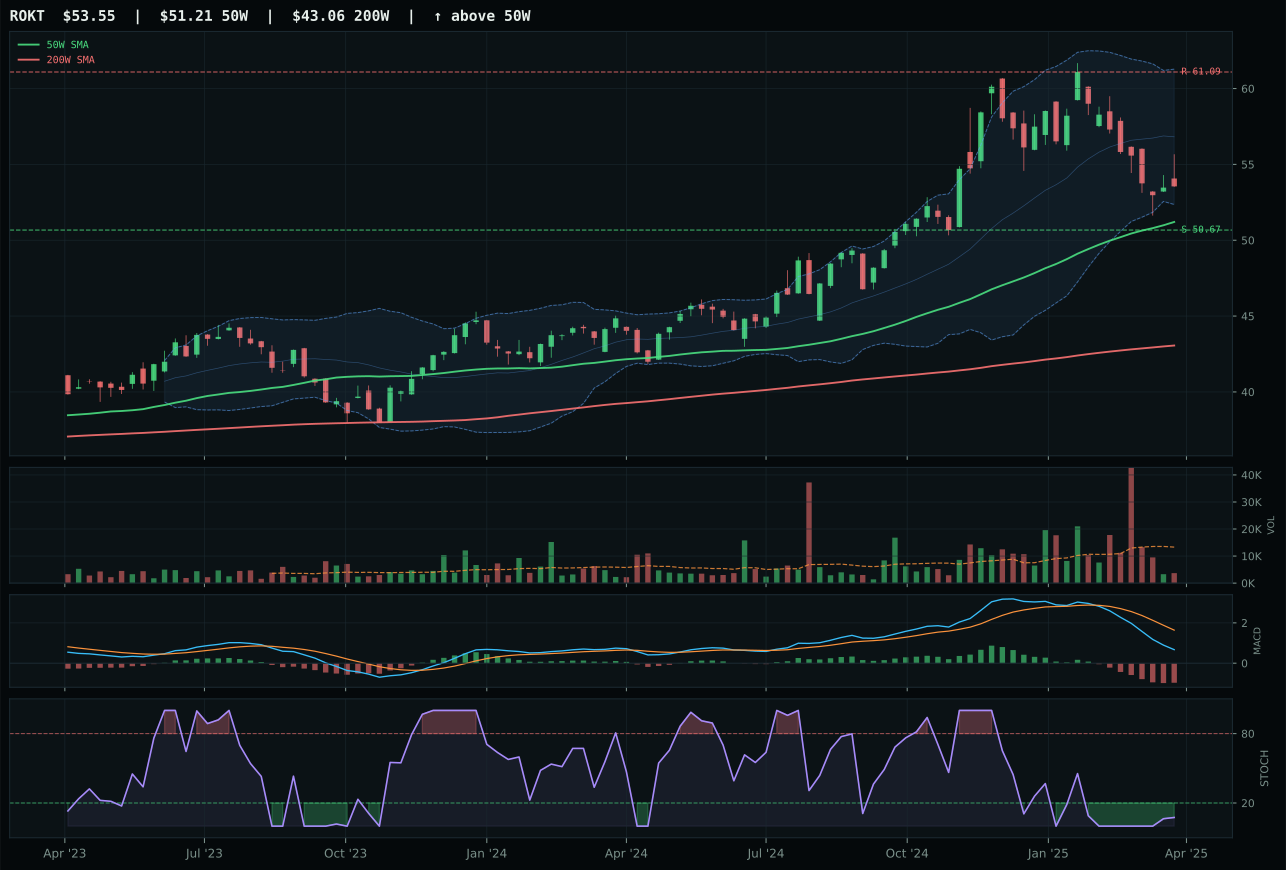
ROKT has a neutral structure profile with -0.2% 13-week relative strength versus SPY.
A failed hold above support would weaken the setup.
Tracked, but not top-2 eligible because: .
ITA advances as category representative over XAR by virtue of superior structure (71.9 vs 66.5) and category-relative strength (8.0% vs 0.0%), though the 46.0 final score arrived through harder differentiation than the raw metrics suggest. Price sits 5.7% above the 50W with neutral structure intact, MACD bearish but stochastic RSI rising into mid-zone at 0.41, and volume at 1.11x 20W average shows quiet accumulation rather than capitulation. The 3.8% 13W return and 10.4% SPY relative strength mark ITA as a beneficiary of defensive rotation and broad market bear signals, both active. XAR stumbled because its oversold stochastic RSI turn-up looked sharper on the chart but arrived with only thin volume participation and 0.0% category relative strength, making the setup feel like a reflex bounce rather than conviction buying.
Defense & Aerospace holds 5% allocation as tier-2, supported by a 46.0 category score and 61.0 macro fit that reflects strong defensive-rotation and broad-market-bear signals (+8 and +6 respectively). The category reasoner weighted technical evidence at 62% but macro context at 38%, and the defensive rotation descriptor hitting +8 carries outsized importance in a disinflation regime where growth equities face headwinds. ITA's 10.4% SPY relative strength stands out in a risk-off environment, yet the category's 51.7 risk/reward component reveals why it remains tier-2: the move from support 144.54 to resistance 156.72 offers only 2.2% upside breathing room against 6.0% downside to support. Liquidity stress active at -3 and risk appetite broken at -2 prevent this sector from reaching top-2 status despite strong narrative fit; the technical risk/reward and stretched entry point matter.
Technology — CIBR
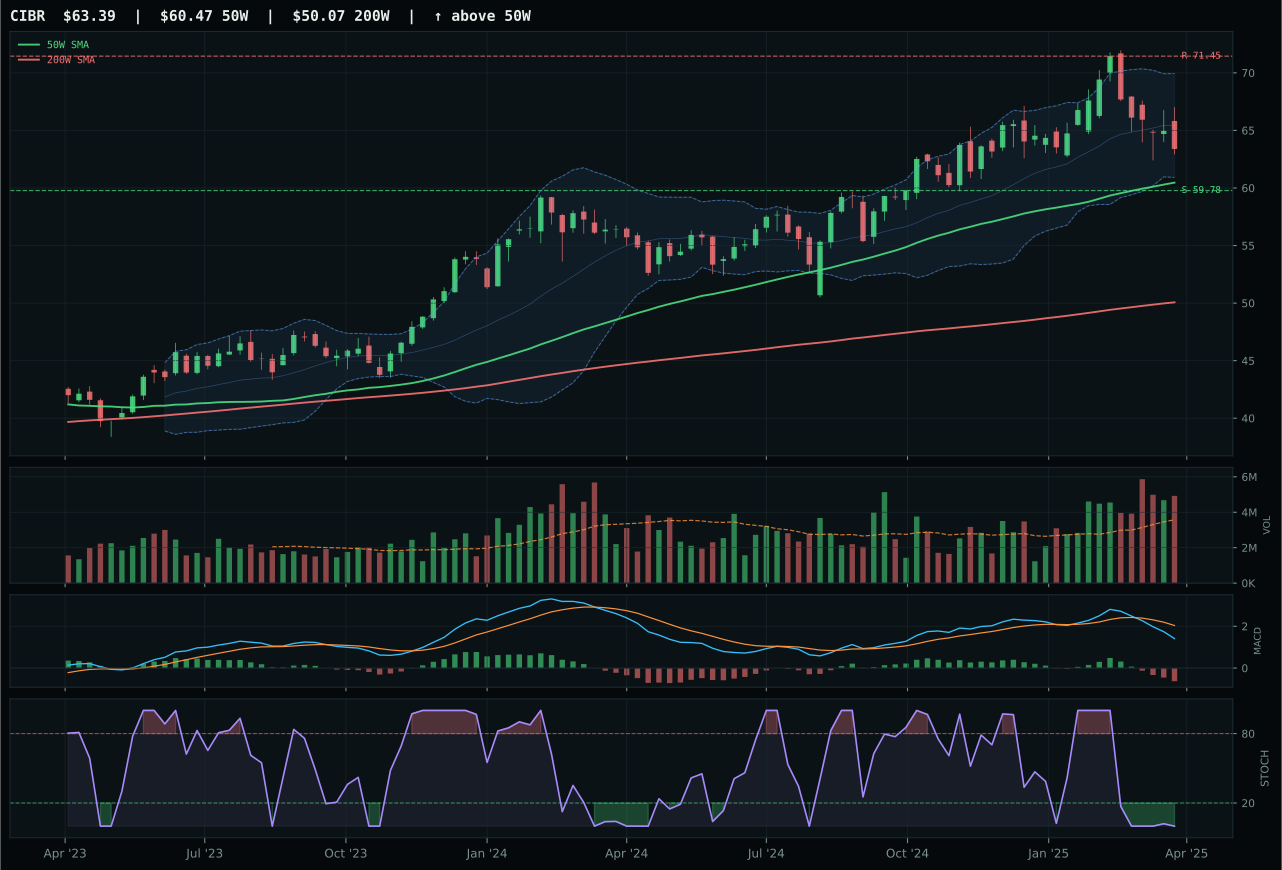
CIBR has a neutral structure profile with 4.8% 13-week relative strength versus SPY.
A failed hold above support would weaken the setup.
Actionable but governed by invalidation levels.
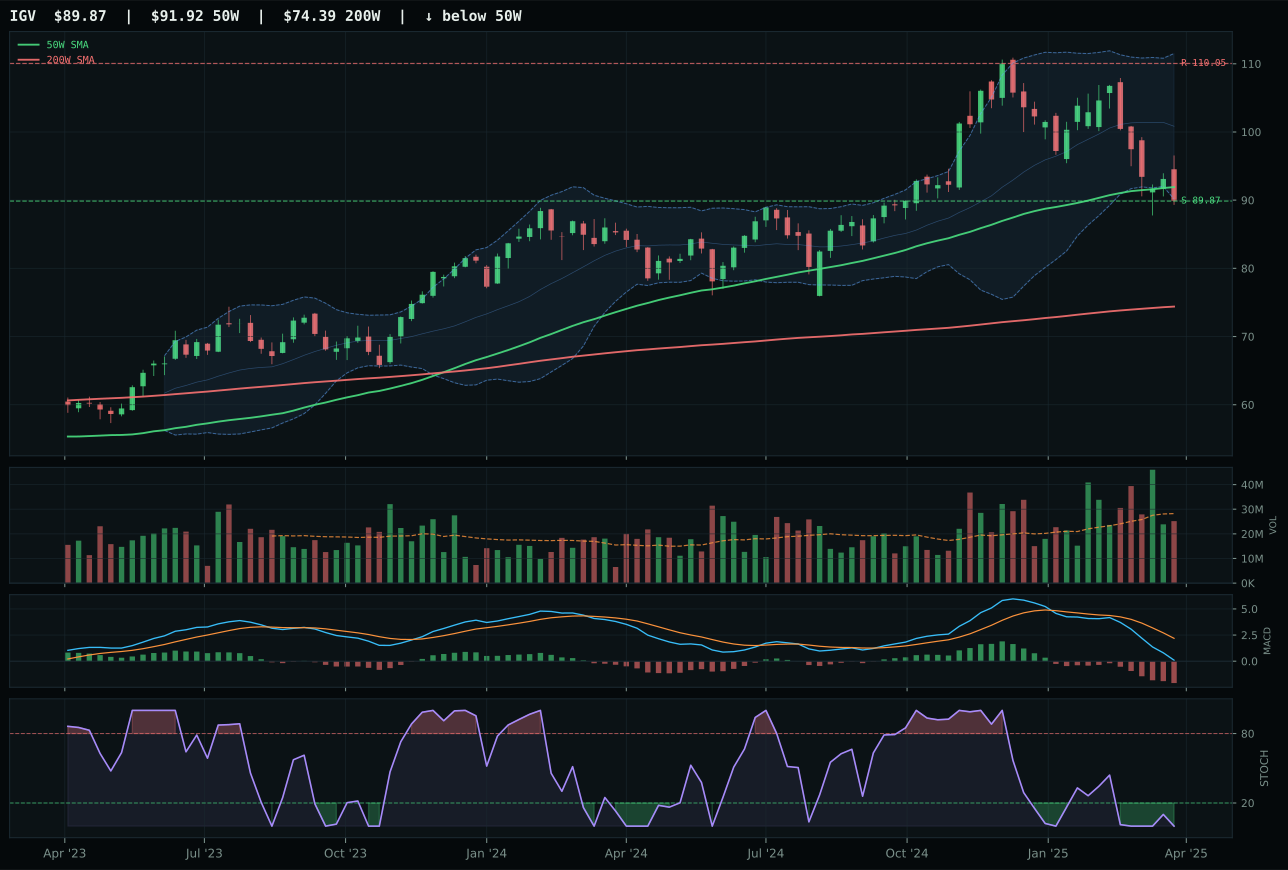
IGV has a pullback into support profile with -5.5% 13-week relative strength versus SPY.
A failed hold above support would weaken the setup.
Actionable but governed by invalidation levels.
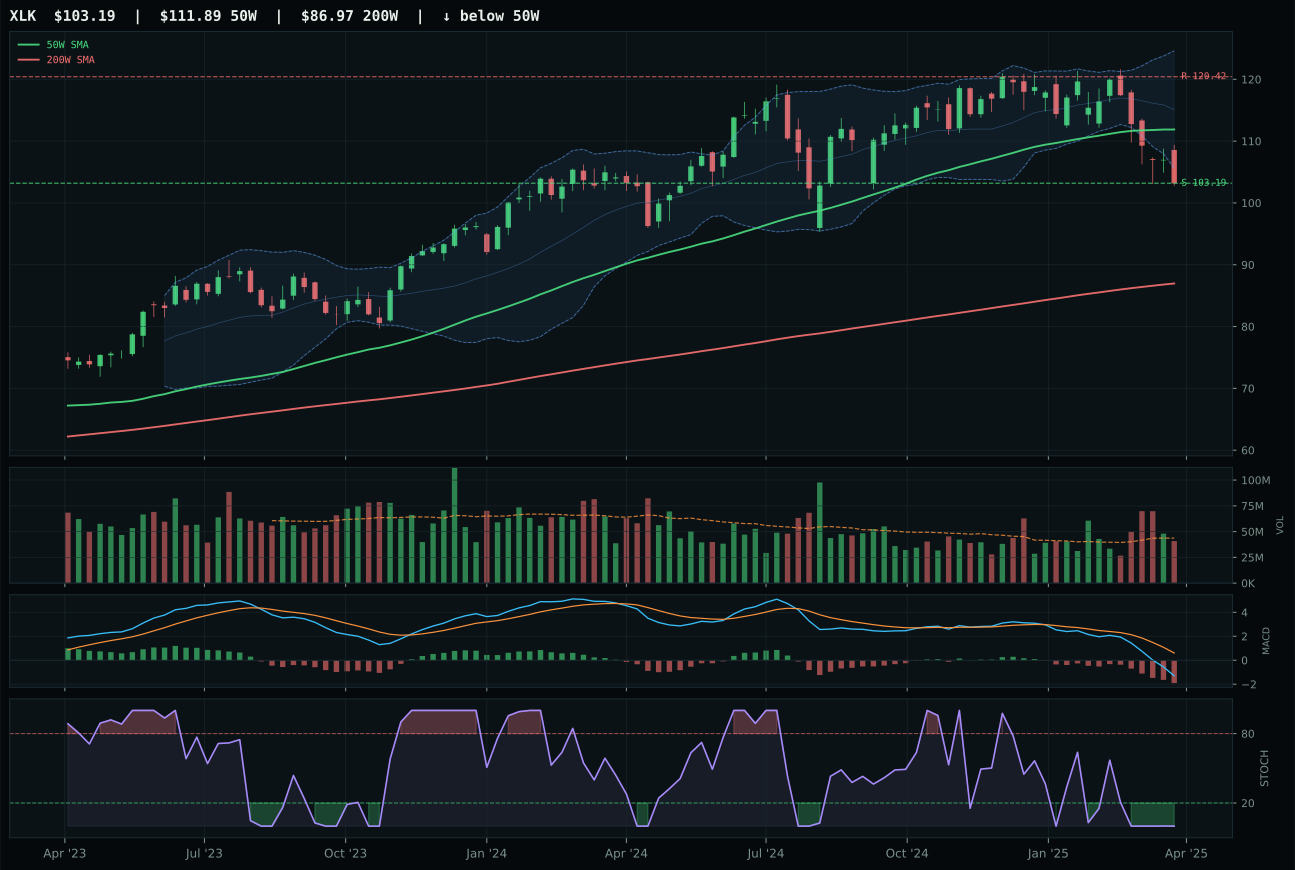
XLK has a pullback into support profile with -6.5% 13-week relative strength versus SPY.
A failed hold above support would weaken the setup.
Actionable but governed by invalidation levels.
CIBR clinches the category with a 22.3-point lead over IGV by maintaining price above both the 50W and 200W moving averages while delivering 10.4% relative strength within its basket—a signal that cybersecurity buyers are active when the broader tech sector is rolling over. The setup sits neutral with MACD bearish but volume at 1.38x the 20W average confirms participation above mere bouncing; stochastic RSI at 0.00 oversold combined with 4.8% RS versus SPY creates a classic mean-reversion coil where new money can accumulate without chasing extension. IGV failed to keep pace because its -12.1% 13W return, -5.5% SPY relative strength, and neutral volume participation painted a picture of pure gravity without sponsorship—a pullback into support that needed structural cleanliness CIBR already held.
Technology earned 5% allocation as a tier-2 category, ranking third through eighth in the portfolio session. The category's 43.2 score reflects a technical setup (61.7/100 ETF evidence) that survives despite macro headwinds: disinflation pressure and liquidity stress both active, yet defensive rotation and broad market bear flags push defensive equity names into favor. Structural cleanliness issues across all three candidates—CIBR, IGV, and XLK—prevent this category from climbing higher. What would matter most now is volume confirmation broadening into IGV or fresh sponsorship for semiconductor exposure; until then, cybersecurity's relative narrowness and steady defensive positioning keep it ranked below precious metals and utilities but ahead of the 0% categories.
Nuclear Energy — NLR
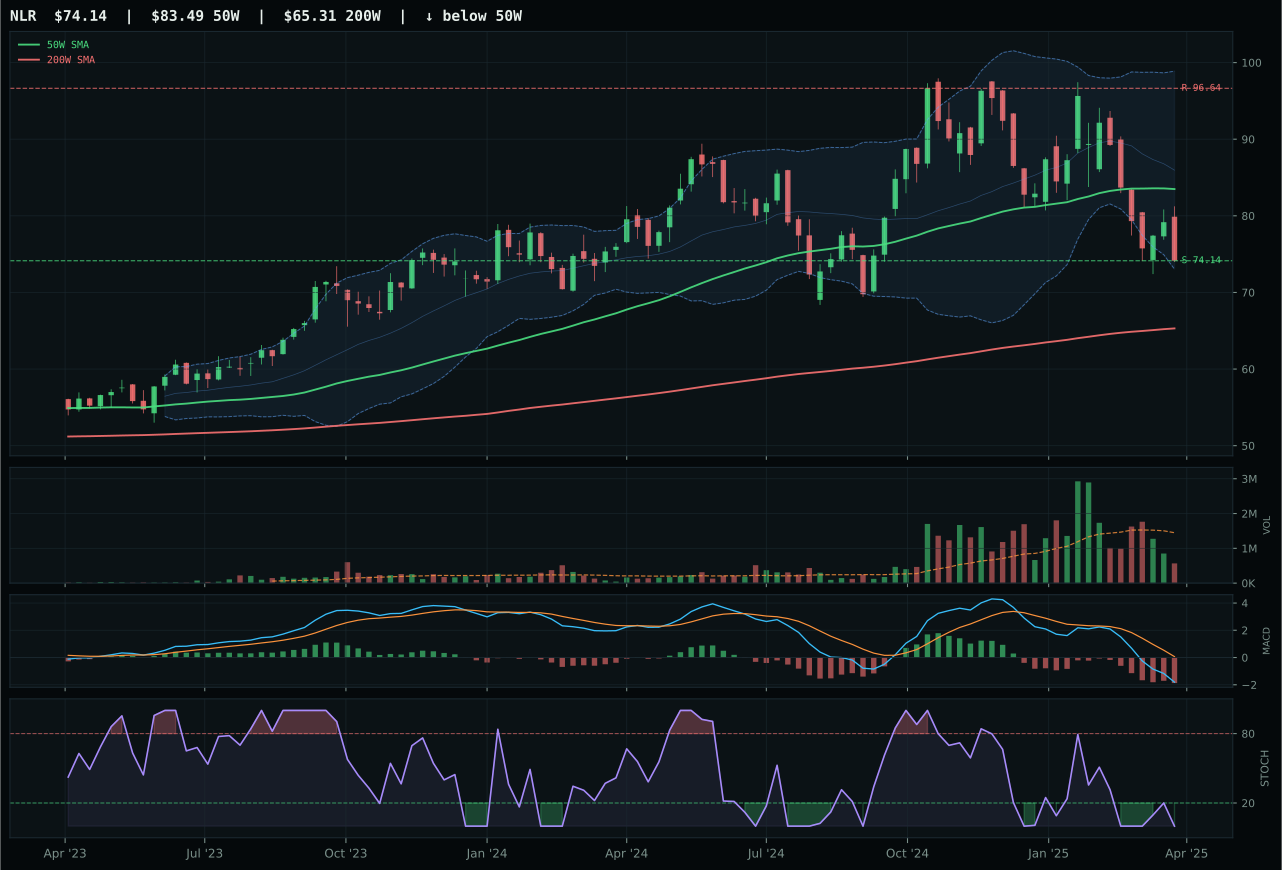
NLR has a pullback into support profile with -3.9% 13-week relative strength versus SPY.
A failed hold above support would weaken the setup.
Actionable but governed by invalidation levels.
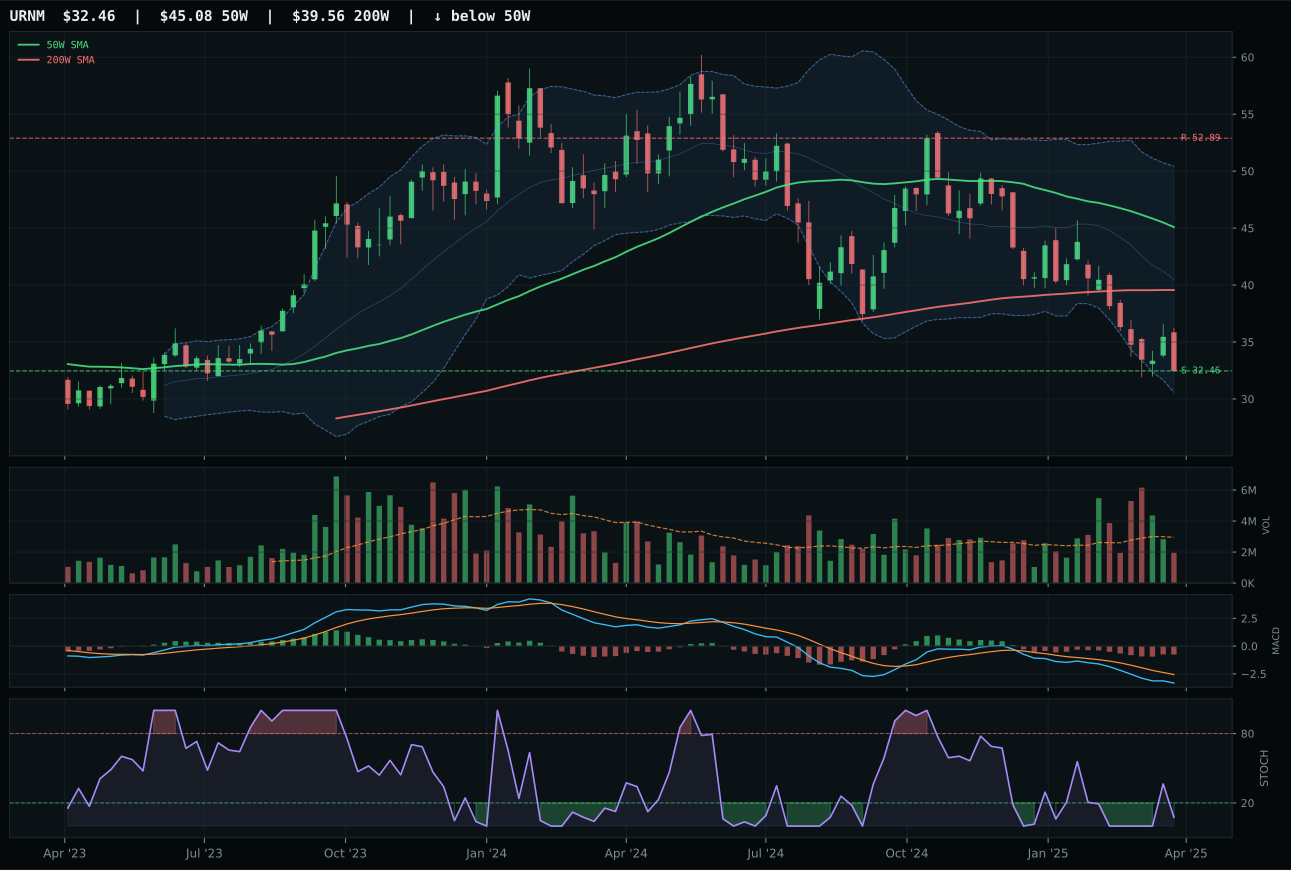
URNM has a pullback into support profile with -13.6% 13-week relative strength versus SPY.
A failed hold above support would weaken the setup.
Actionable but governed by invalidation levels.
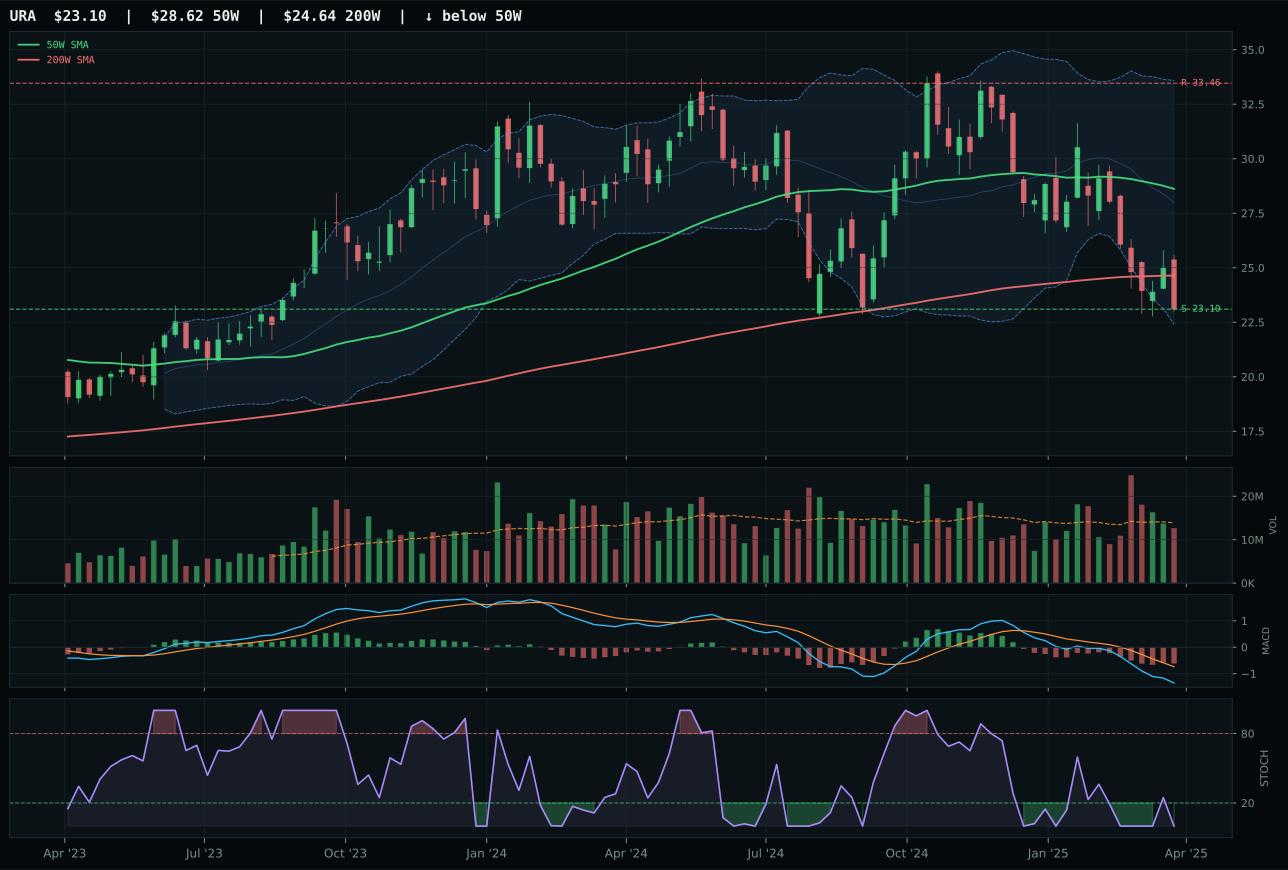
URA has a pullback into support profile with -11.2% 13-week relative strength versus SPY.
A failed hold above support would weaken the setup.
Actionable but governed by invalidation levels.
NLR advances as category representative by 6.1 points over URNM despite poor absolute scores across both, winning on the basis of category-relative strength (7.2% versus -2.4%) and less-deteriorated structure (61.8 versus 55.9). The setup is pullback into support at 74.14, sitting 11.2% below the 50W with MACD bearish/weakening and stochastic RSI oversold at 0.00—classically weak technical conditions. Yet energy scarcity active at +9 in macro and nuclear utilities' defensive positioning support holding a position that might otherwise warrant 5% allocation. NLR's thin participation (0.39x) and -10.6% 13W return signal liquidation rather than accumulation, but the support level is clean and the category relative strength edge over peers matters when all candidates are broken.
Nuclear Energy holds 5% tier-2 allocation as a defensive-rotation beneficiary despite a weak 35.7 category score and technical evidence of just 30.2/100. The macro fit of 65.0/100 reflects energy scarcity at +9, defensive rotation at +6, and broad market bear at +3, offsetting liquidity stress at -7 and risk appetite broken at -4. In a disinflation regime with stocks under pressure, nuclear utilities offer steady utility-like cash flows backed by energy-security mandates. NLR's 13W return of -10.6% represents cascade selling, yet the pullback into support at 74.14 provides defined risk for mean-reversion trades; the thin participation (0.39x) also suggests institutional positioning has largely cleared. This category occupies the allocation only because macro regime supports defensive plays; any reacceleration in growth or inflation would likely flush this holding immediately.
Traditional Energy — XLE
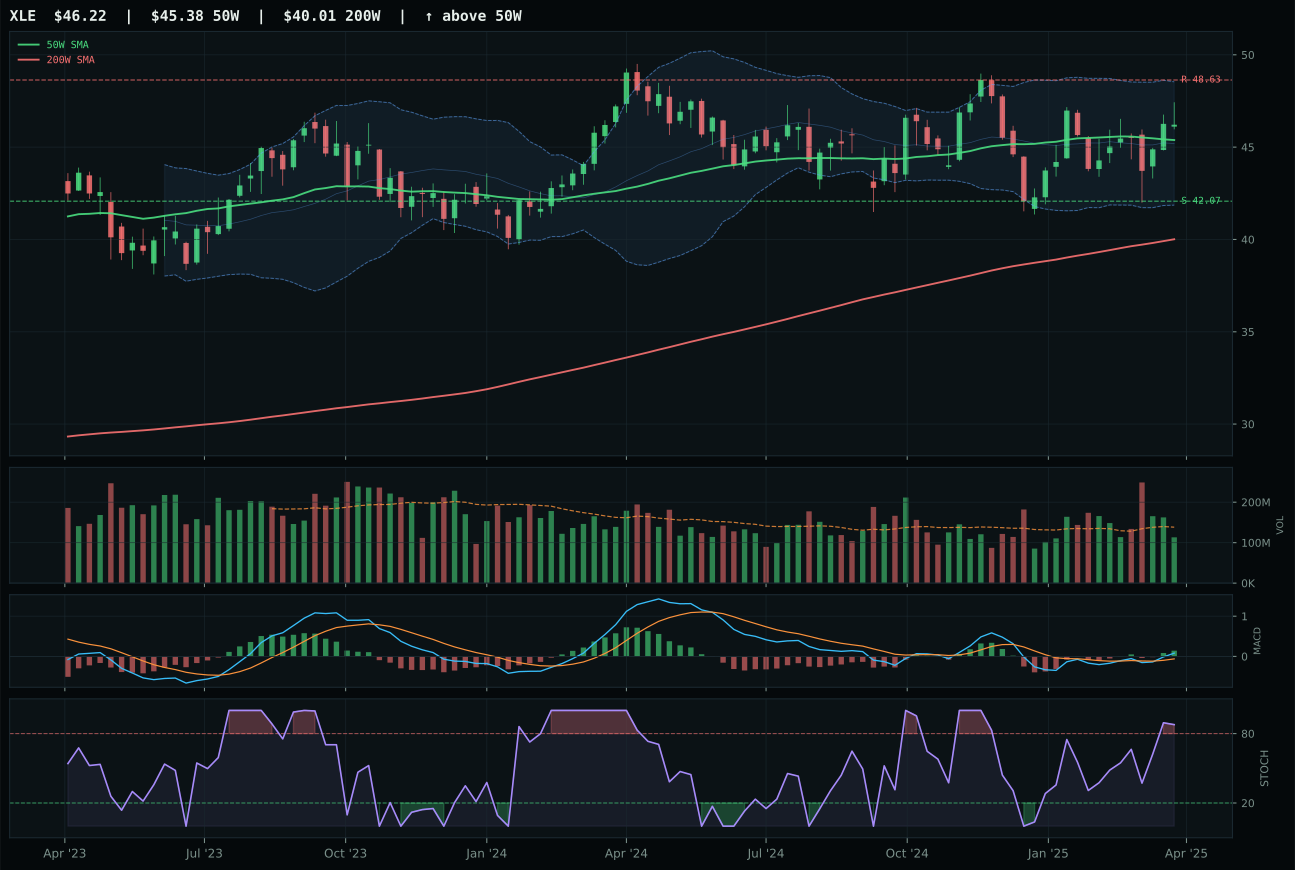
XLE has a compression near 50W profile with 15.9% 13-week relative strength versus SPY.
A failed hold above support would weaken the setup.
Actionable but governed by invalidation levels.
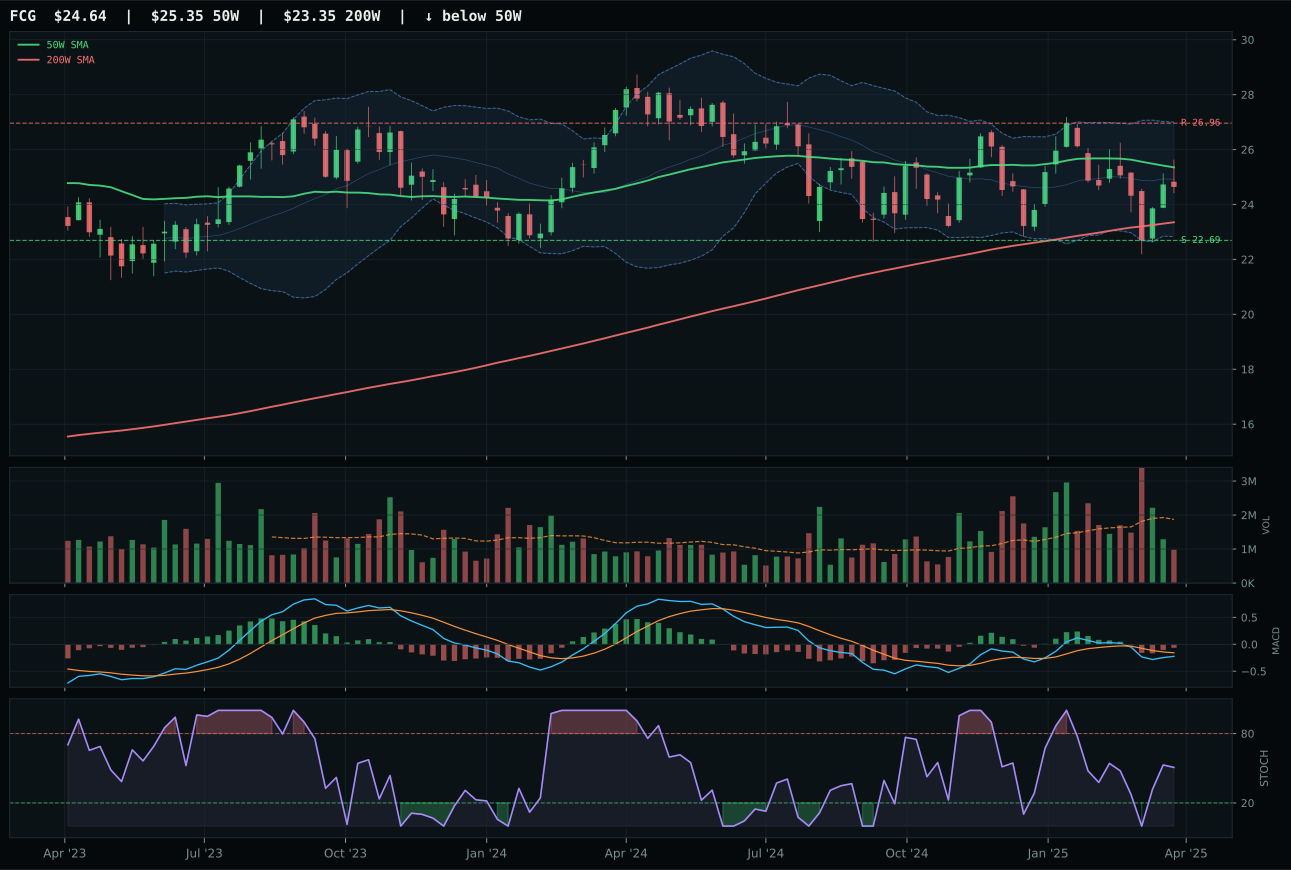
FCG has a compression near 50W profile with 10.1% 13-week relative strength versus SPY.
A failed hold above support would weaken the setup.
Actionable but governed by invalidation levels.
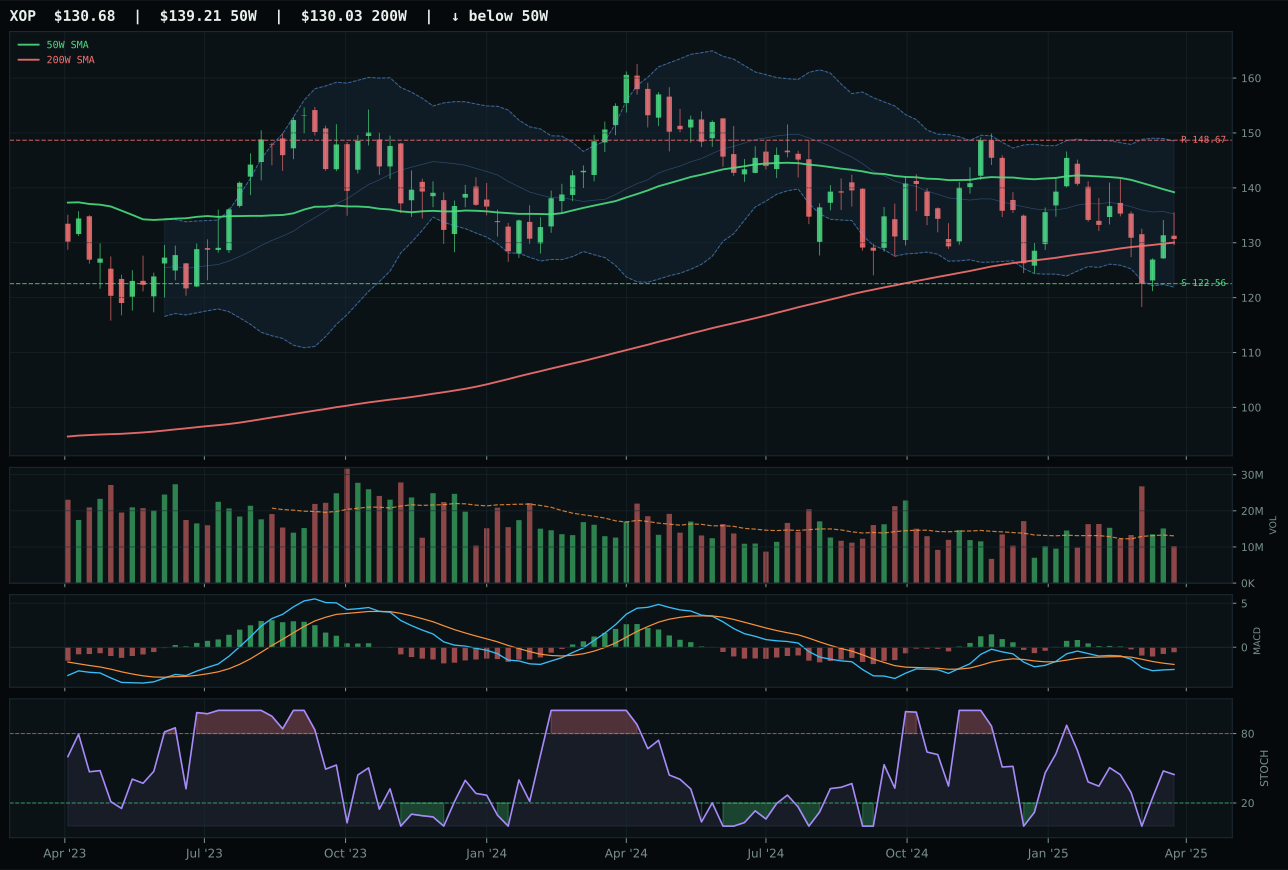
XOP has a neutral structure profile with 8.3% 13-week relative strength versus SPY.
A failed hold above support would weaken the setup.
Actionable but governed by invalidation levels.
XLE crushes FCG across every meaningful dimension: trend 100 versus 57, timing 100 versus 100 (tie), momentum 100 versus 54, and crucially, MACD bullish and improving versus FCG's bearish/weakening. Price compressed 1.9% above the 50W with neutral volume (0.82x participation), permitting accumulation without extension; stochastic RSI overbought momentum at 0.87 arrived at a middle-retracement zone where buyers can build positions into what was deep weakness. FCG's thin participation, bearish MACD, and 10.1% SPY relative strength versus XLE's 15.9% show energy cash-flow defense outpacing natural gas exposure when risk appetite breaks. The setup is tight, the confirmation is strong, and the category-relative strength spread (5.8% versus 0.0%) seals the decision.
Traditional Energy holds 5% tier-2 allocation despite a final category score of only 27.5, reflecting the portfolio's mechanical tier structure where rank positions receive fixed percentages. The category's technical evidence scored 95.7/100 via XLE's bullish confirmation, yet macro fit of 56.0/100 reveals tension: energy scarcity is active at +16 (supporting allocation), but disinflation pressure penalizes at -10, and the macro regime itself hurts commodities by -10 net. XLE's 100/100 timing and momentum scores prove the chart setup is pristine—compression near the 50W with bullish MACD and overbought stochastic RSI signals accumulation, not capitulation. The 5% slot acknowledges strong technical evidence in a sector where structural energy scarcity supports long-term holding, but the low 54.1 risk/reward component (only 5% upside to 48.63 resistance) and overall category ranking below precious metals and utilities reflect macro's pull toward deflation rather than inflation trades.
Emerging Markets — INDA
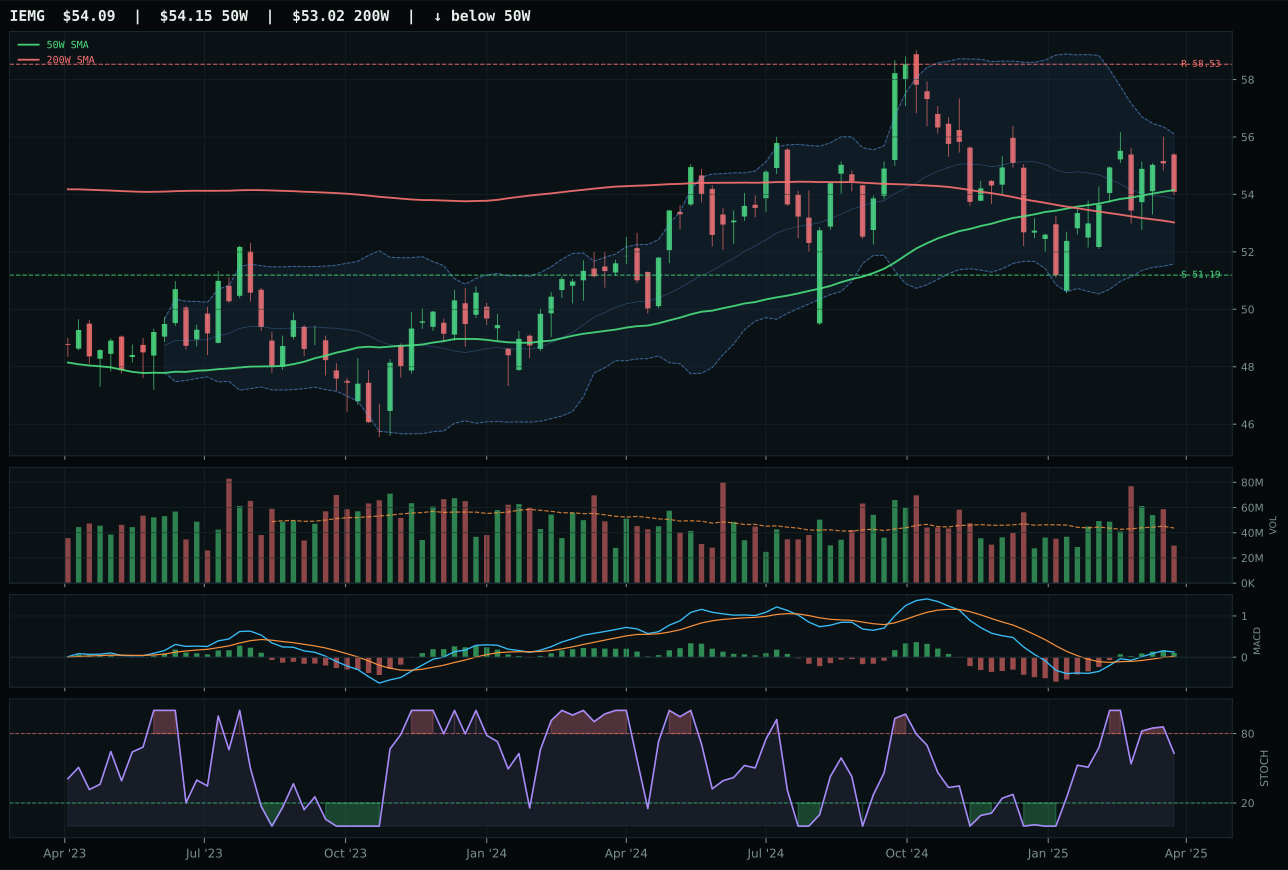
IEMG has a compression near 50W profile with 9.2% 13-week relative strength versus SPY.
A failed hold above support would weaken the setup.
Actionable but governed by invalidation levels.
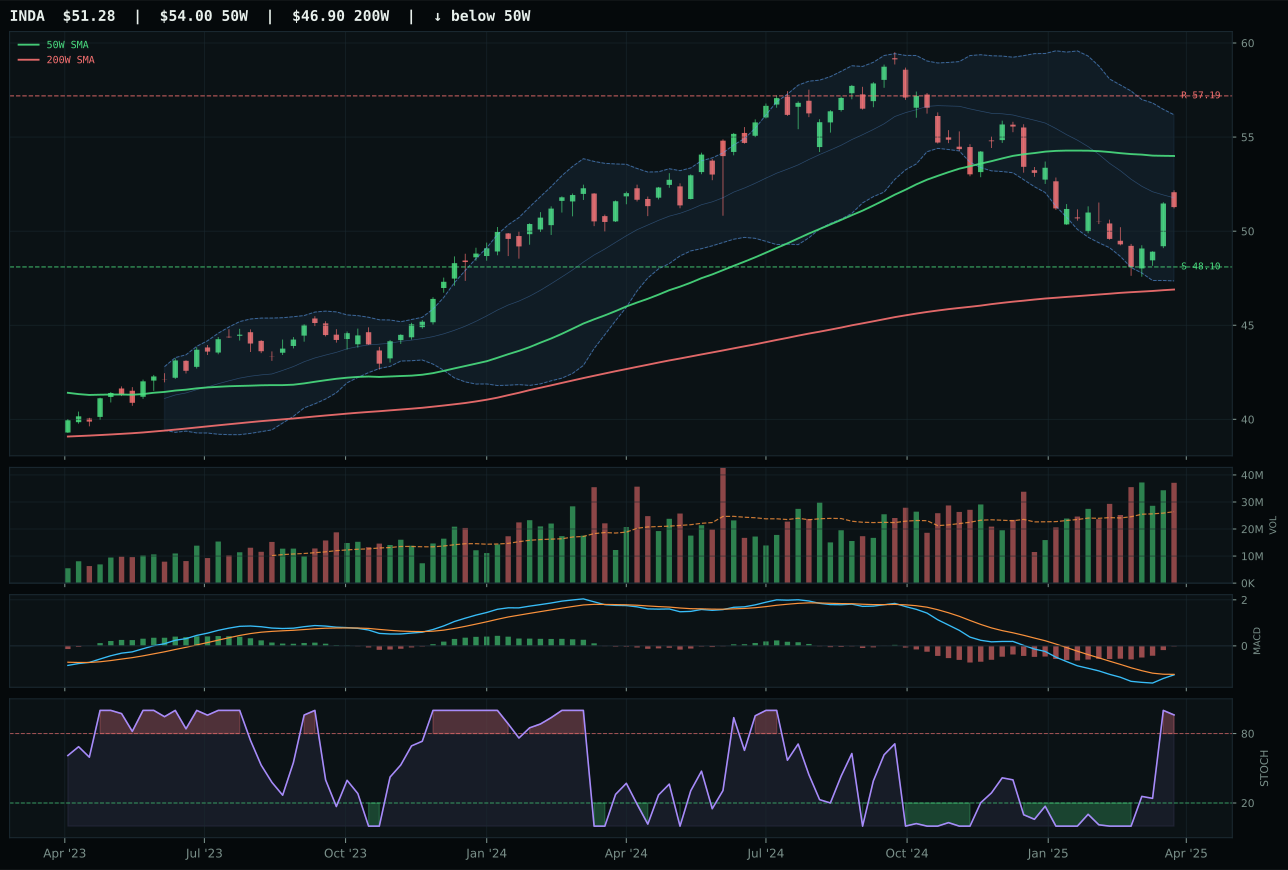
INDA has a neutral structure profile with 3.2% 13-week relative strength versus SPY.
A failed hold above support would weaken the setup.
Actionable but governed by invalidation levels.
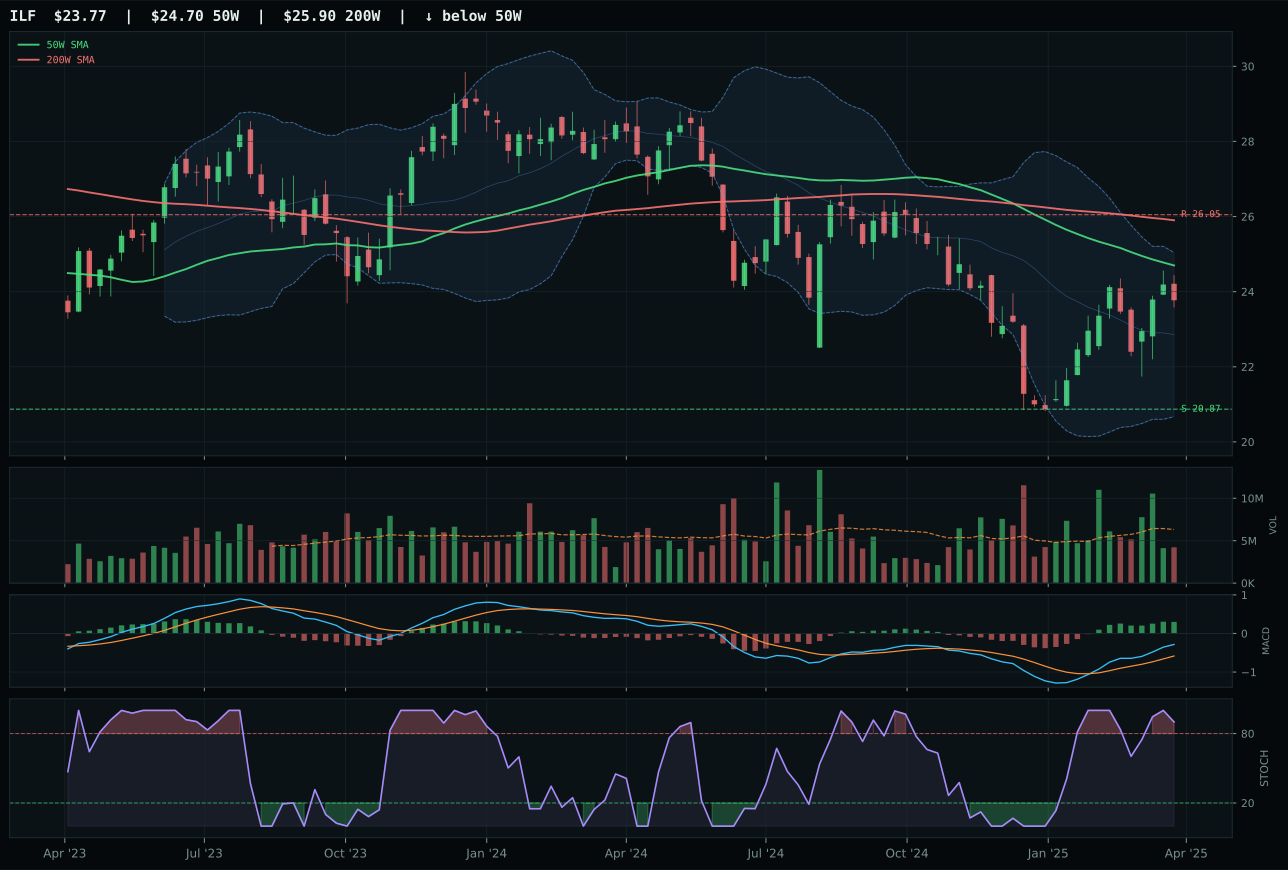
ILF has a neutral structure profile with 19.8% 13-week relative strength versus SPY.
Extension and support failure are the main tactical risks.
Tracked, but not top-2 eligible because: structurally broken.
INDA wins the category representative slot over IEMG by securing above-average volume participation (1.40x versus IEMG's thin 0.60x) and better risk/reward positioning (81.1 versus 77.1), offsetting IEMG's superior technical setup and MACD confirmation. INDA sits in neutral structure 5.0% below the 50W with MACD bearish but improving—a quieter, less stretched entry than IEMG's compression near the 50W where buyers have already lined up. The 3.2% RS versus SPY is weak, but the -6.0% category relative strength versus IEMG's 0.0% reveals INDA offers relative value among poor choices. Stochastic RSI at 0.96 overbought momentum combined with thin participation in IEMG suggests the broad EM play has already been boughten; INDA's pullback offers a later, safer entry for a category macro has thoroughly punished.
Emerging Markets holds 5% tier-2 allocation despite a low 21.4 category score, supporting a position that macro has actively rejected: liquidity stress active at -10 points, broad market bear at -9, and neither defensive rotation nor monetary hedge bid providing support. INDA's 45.5 technical evidence and 45.0 macro fit combine to produce only a 43.1 reasoned proof order, while IEMG (66.6 proof order) actually ranked higher technically but lost the representative battle on volume participation and structural setup. This category remains in the portfolio purely through tier-2 mechanical allocation; the 5% acknowledges that emerging markets still offer some quality exposure (India's growth profile in INDA, broad diversification in IEMG), yet the lack of macro tailwinds and active liquidity stress keep this category firmly below defensive trades. Any improvement in risk appetite or reduction in liquidity stress would strengthen the case; absent that, this is defensive proximity to global growth without the conviction.
Agriculture & Livestock — VEGI
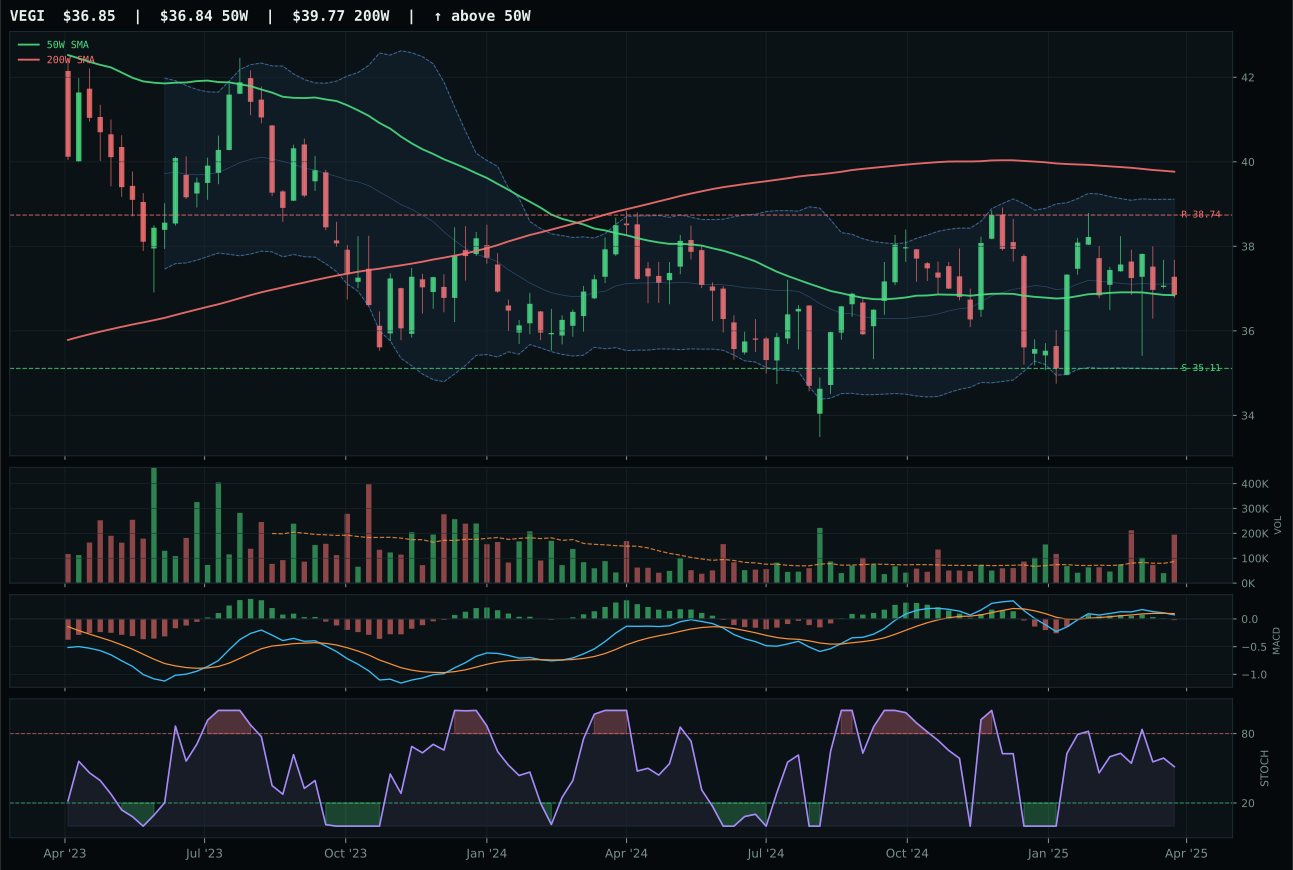
VEGI has a pullback into support profile with 10.2% 13-week relative strength versus SPY.
A failed hold above support would weaken the setup.
Tracked, but not top-2 eligible because: .
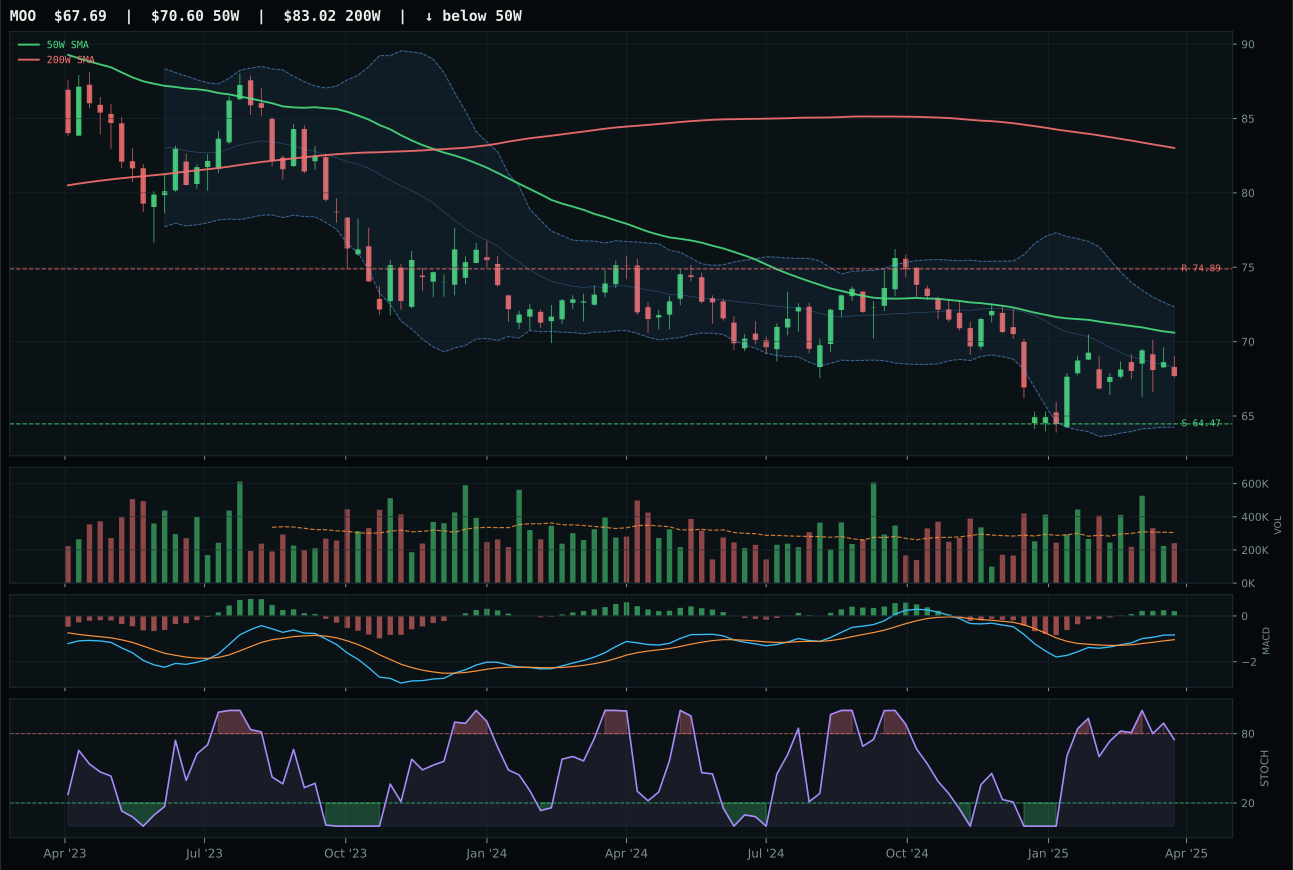
MOO has a pullback into support profile with 10.9% 13-week relative strength versus SPY.
Extension and support failure are the main tactical risks.
Tracked, but not top-2 eligible because: structurally broken.
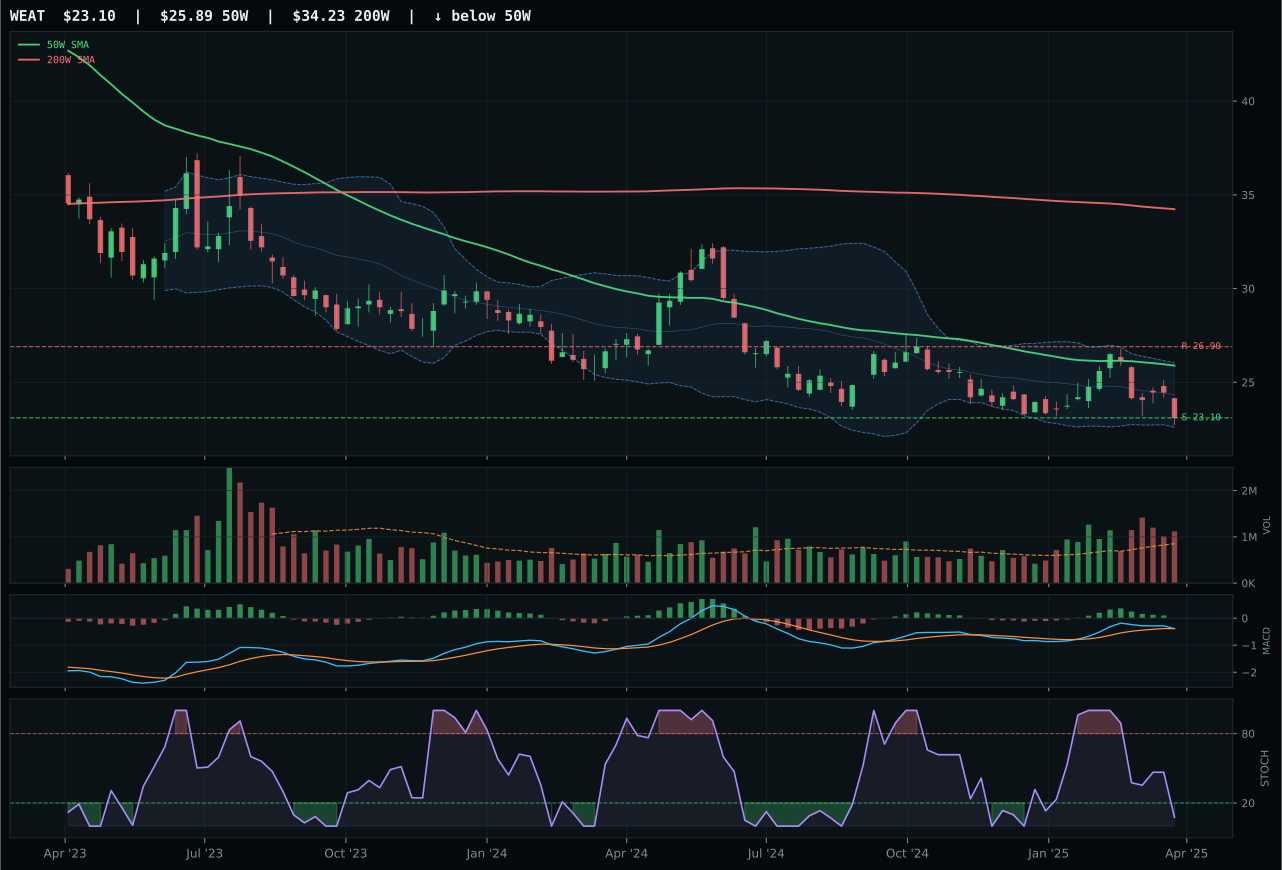
WEAT has a pullback into support profile with 3.1% 13-week relative strength versus SPY.
Extension and support failure are the main tactical risks.
Tracked, but not top-2 eligible because: structurally broken.
VEGI edges MOO by just 0.3 points despite the latter holding superior MACD (bullish and improving versus bearish/weakening) and 84/100 momentum score, because MOO triggered hard filters marking it structurally broken—the category reasoner rejected it entirely. VEGI's 10.2% RS versus SPY and 3.6% 13W return provide enough sponsorship to win a category where both candidates are weak, though the real story is timing: stochastic RSI falling/neutral at 0.51 and distribution pressure (2.25x volume) suggest late institutional unloading rather than accumulation. The pullback into support at 35.11 gives VEGI a defined invalidation, but the 42.7% momentum confirmation score and 0.0% category relative strength expose how hollow the entire category has become.
Agriculture & Livestock achieved 5% allocation only through mechanical tier assignment, despite a final category score of 0.0 that marked VEGI as ineligible. The reasoning layer rejected the category entirely because macro fit collapsed to 32.0/100: disinflation hurts commodities by -6 points, disinflation pressure is active at -8, and liquidity stress adds another -4. Even MOO's superior 40.8 reasoned proof order could not save it because hard structural filters caught a broken chart pattern. The portfolio system allocated tier-2 capital to this category despite eligibility failure, meaning the 5% represents forced diversification against a regime that actively penalizes food-commodity speculation. Nothing short of a break above MOO's 200W, a pivot in the disinflation narrative, or explicit monetary inflation signals would permit this category to earn a legitimate allocation slot.
AI — AIQ
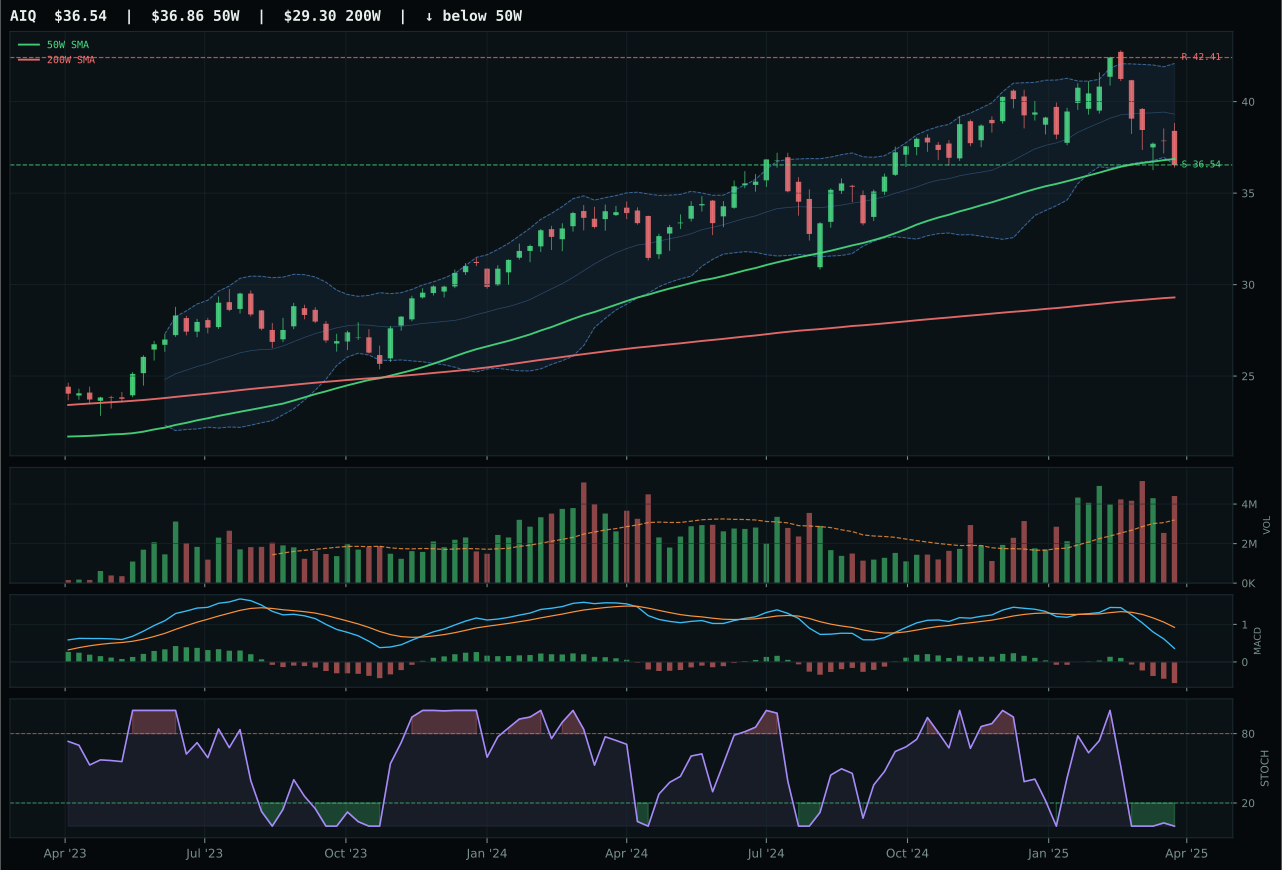
AIQ has a pullback into support profile with -0.7% 13-week relative strength versus SPY.
A failed hold above support would weaken the setup.
Actionable but governed by invalidation levels.
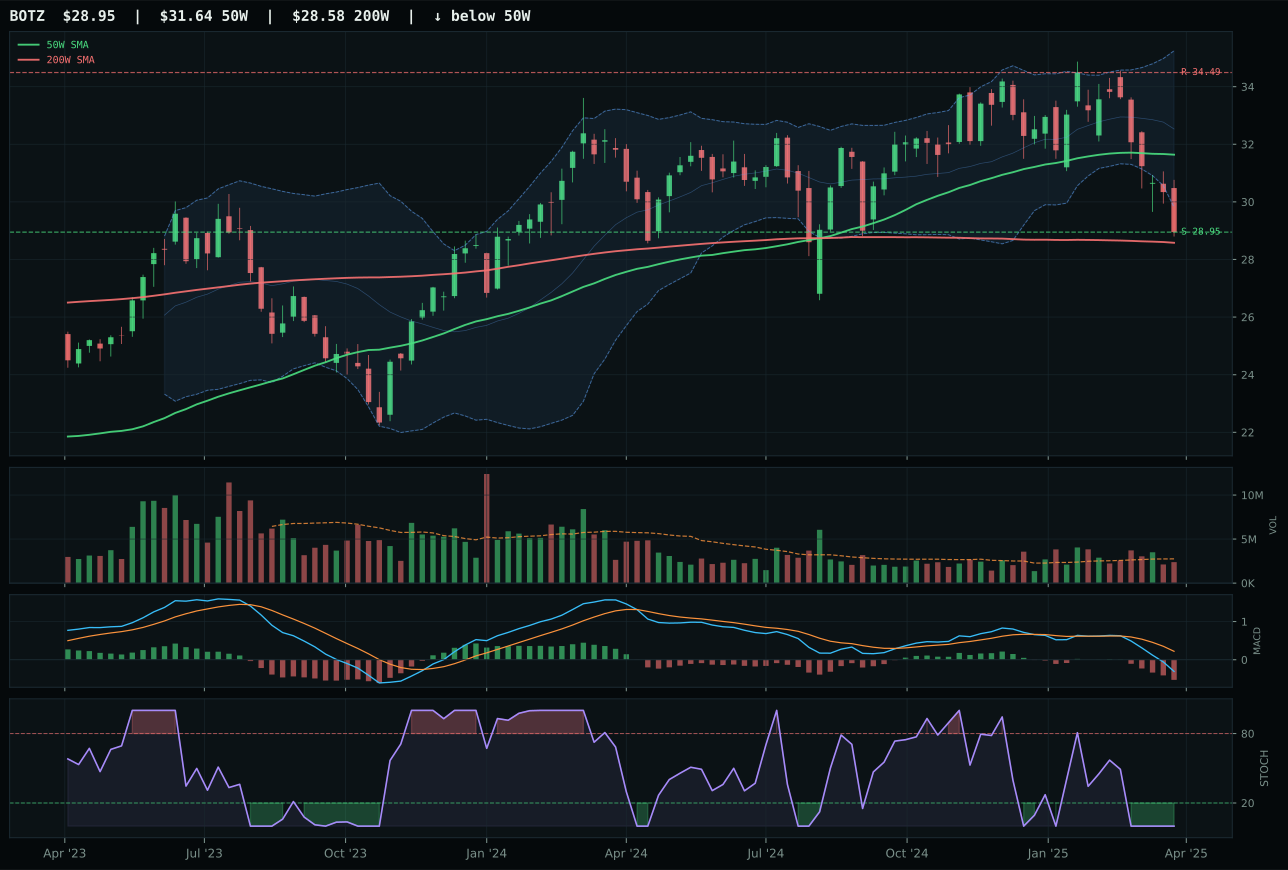
BOTZ has a pullback into support profile with -4.4% 13-week relative strength versus SPY.
A failed hold above support would weaken the setup.
Actionable but governed by invalidation levels.
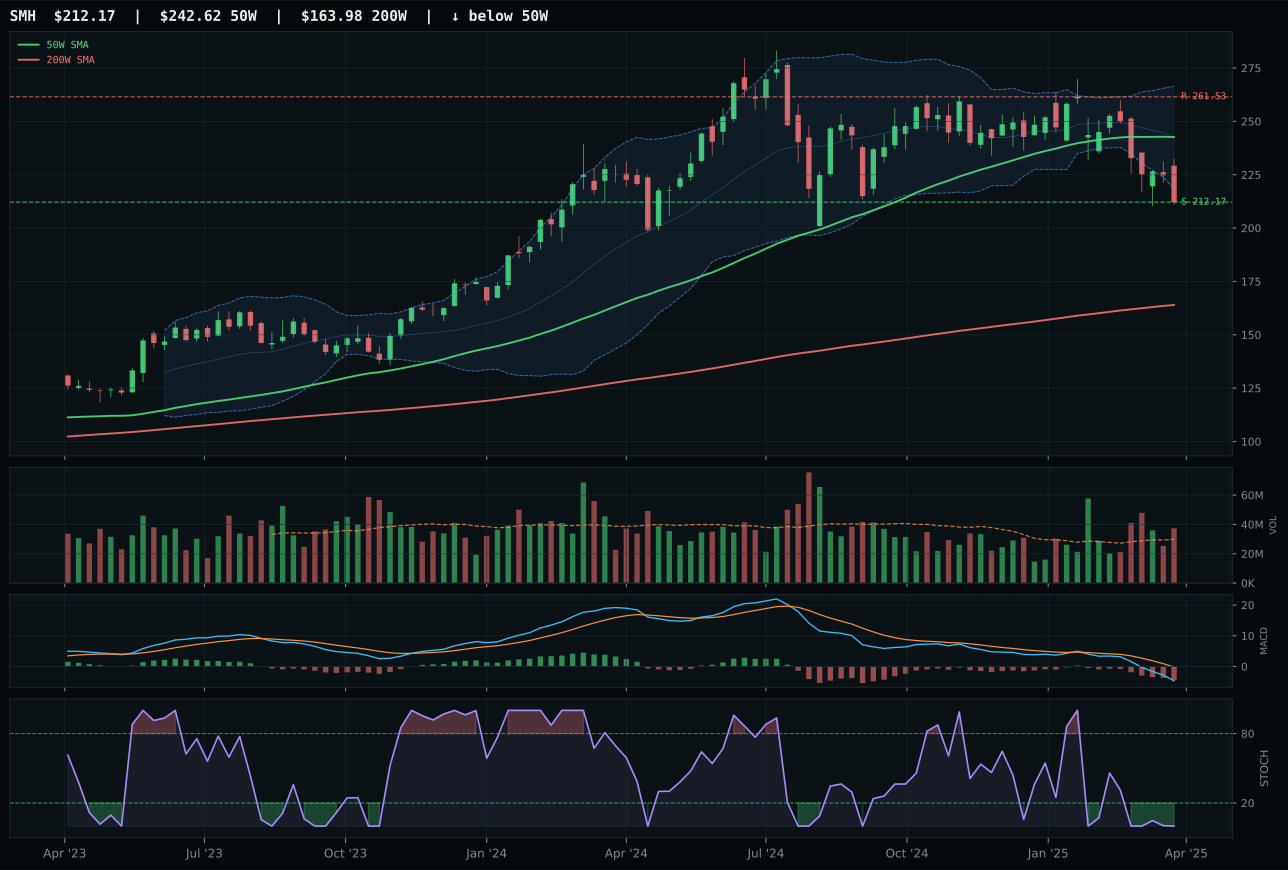
SMH has a pullback into support profile with -8.0% 13-week relative strength versus SPY.
A failed hold above support would weaken the setup.
Actionable but governed by invalidation levels.
AIQ wins the category on a 17.6-point margin over BOTZ by capturing the only above-average volume participation (1.38x) while sitting in a pullback setup just 0.9% below the 50W—a tighter, more defined entry than BOTZ's deeper decay. Although AIQ's 13W return of -7.3% and -0.7% RS versus SPY are both weak, the timing score of 100/100 reflects oversold stochastic RSI and middle-zone Fibonacci placement that offers a concrete invalidation level at support 36.54; BOTZ's timing was 87 and its 30 trend composite versus AIQ's 66 shows the robotics play has fallen further without the volume confirmation to suggest accumulation. The 3.7% category relative strength advantage matters when momentum scores are uniformly weak across all three candidates.
AI received 0% allocation this week, ranked 9th or 10th, reflecting a category-level score of just 21.0 following severe macro and technical deterioration. Liquidity stress is active at -12 points and broad market bear adds another -8; even disinflation's mild +5 boost cannot offset the damage. BOTZ's -11.0% 13W return and -4.4% SPY relative strength represent absolute capitulation, while SMH at -14.6% 13W shows zero institutional sponsorship for any AI subcategory right now. The reasoning layer weighted technical evidence at 62% but all three ETFs (AIQ 42.0, BOTZ 26.4, SMH barely 10.2) scored below 45 on technical grounds alone, making the category ineligible before macro even entered the calculation. Recovery would require either volume confirmation into support or a regime shift away from the current liquidity-and-risk-appetite decay.
Industrial Metals — COPX
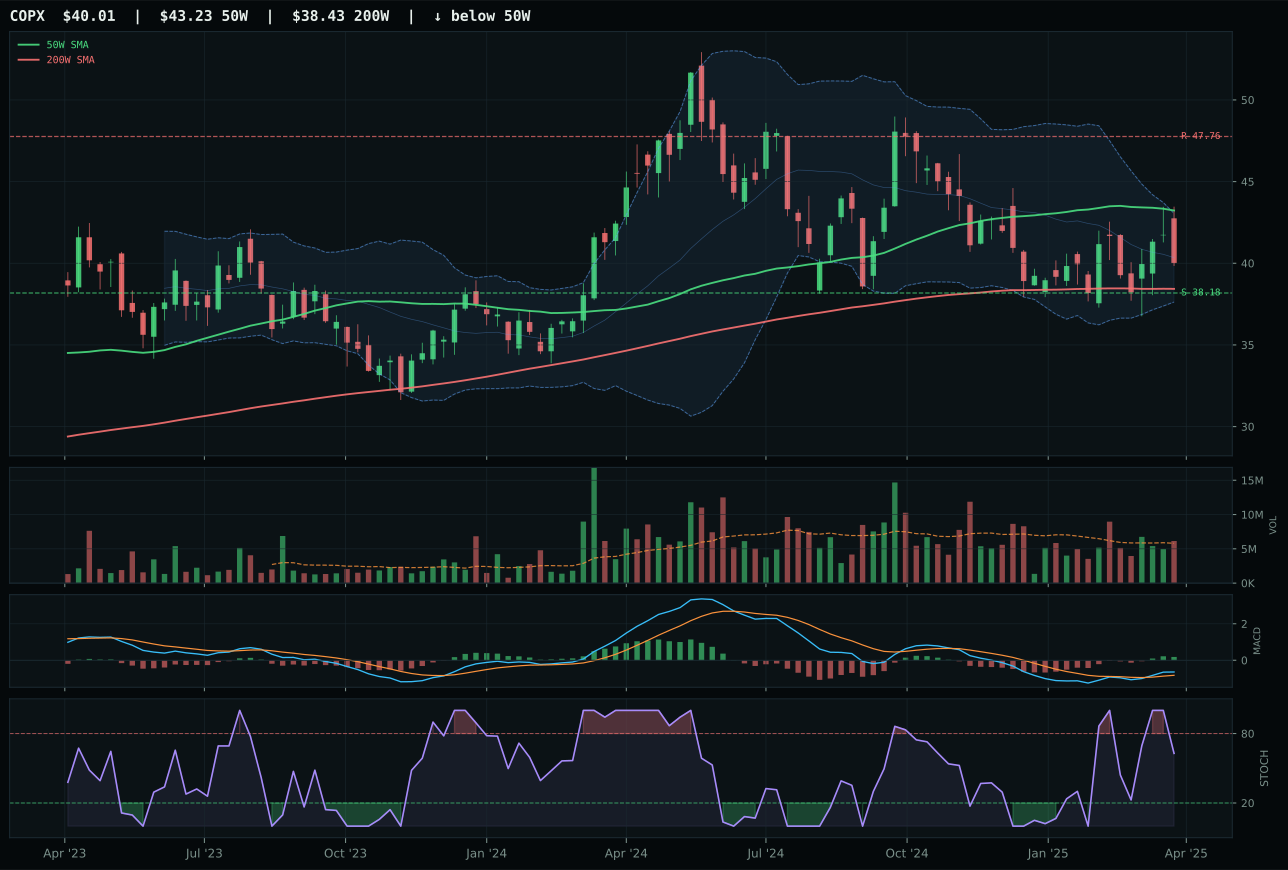
COPX has a pullback into support profile with 8.6% 13-week relative strength versus SPY.
A failed hold above support would weaken the setup.
Actionable but governed by invalidation levels.
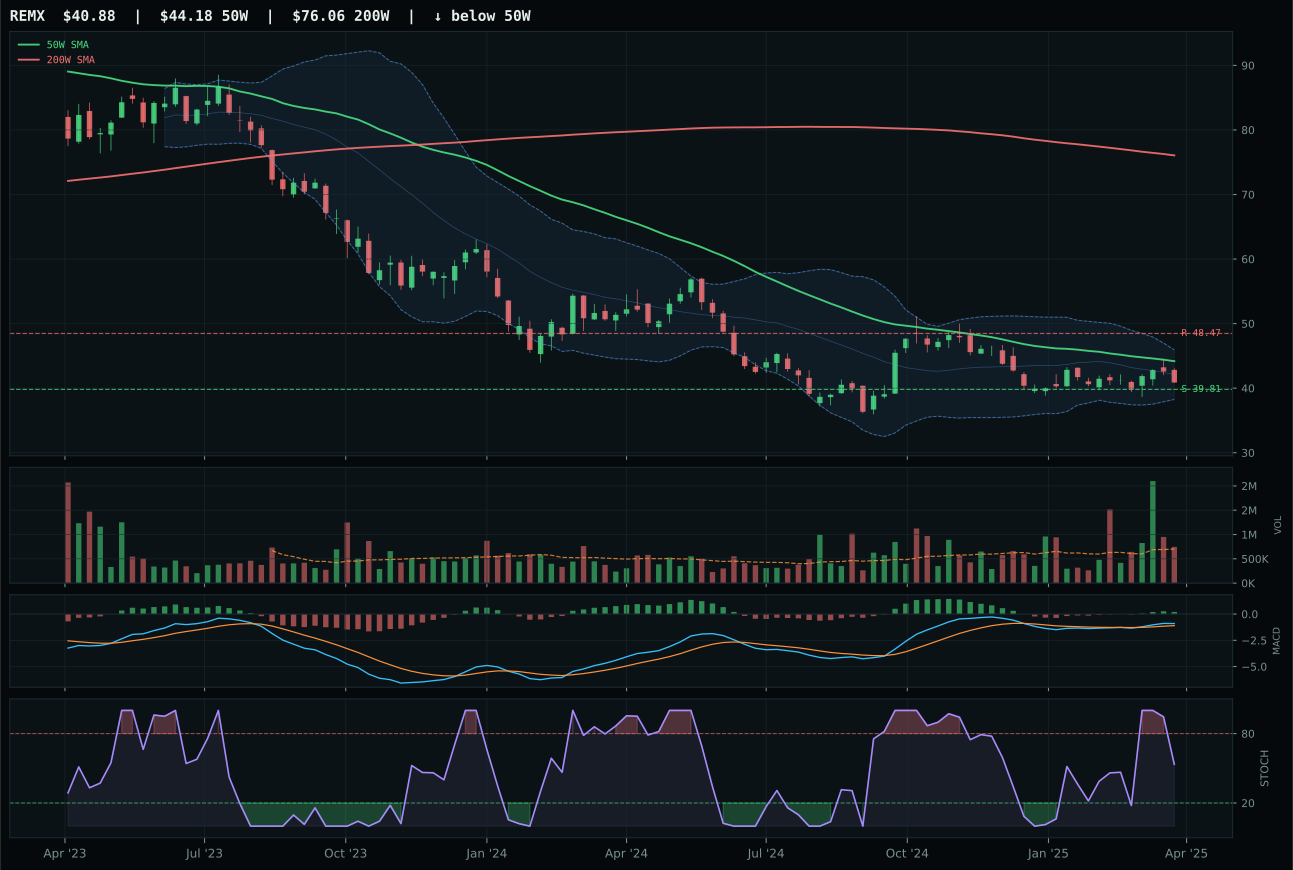
REMX has a pullback into support profile with 9.0% 13-week relative strength versus SPY.
Extension and support failure are the main tactical risks.
Tracked, but not top-2 eligible because: structurally broken.
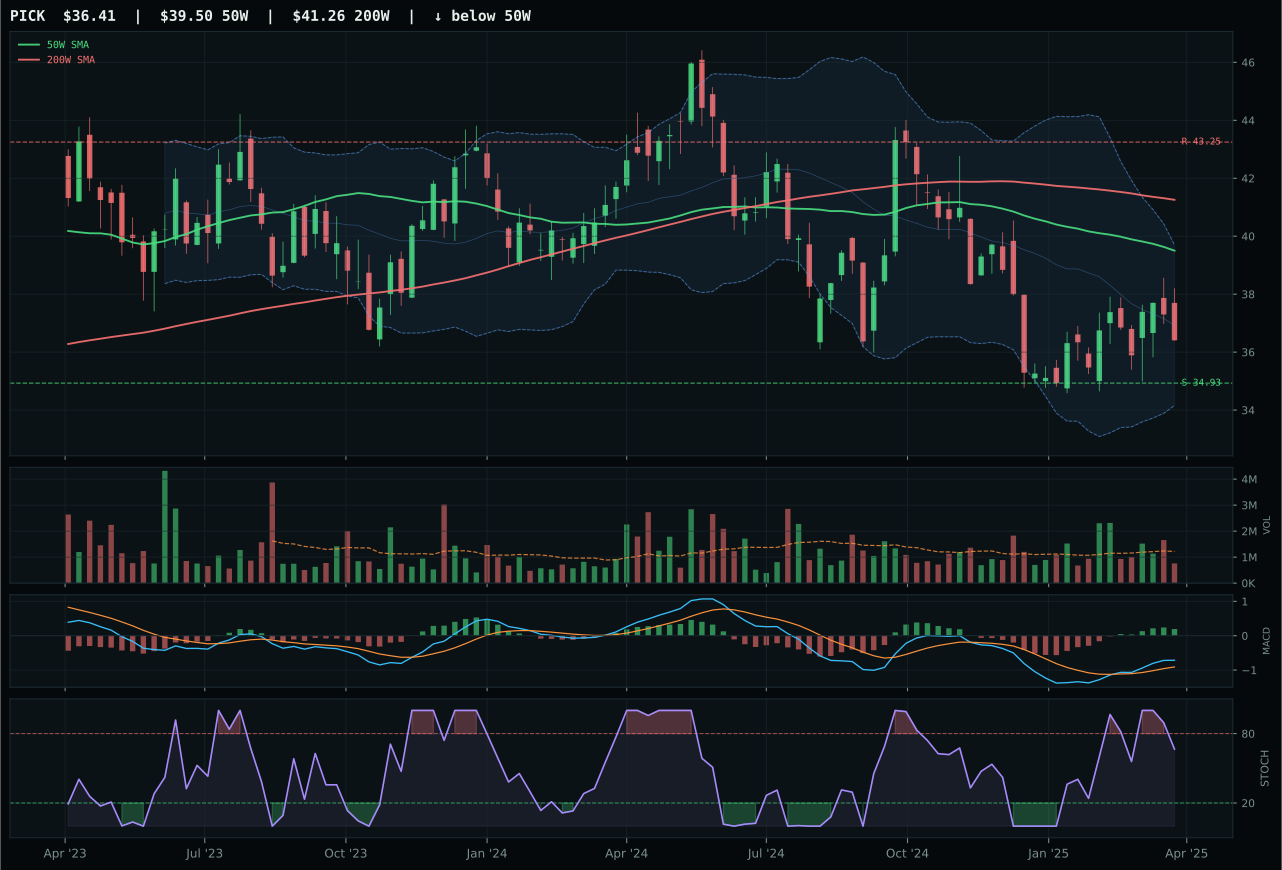
PICK has a pullback into support profile with 9.9% 13-week relative strength versus SPY.
Extension and support failure are the main tactical risks.
Tracked, but not top-2 eligible because: structurally broken.
COPX wins by 25.1 points over REMX because structure holds clean at 74.1 versus REMX's broken 40.6, and COPX delivers 8.6% SPY relative strength with -0.4% category relative strength that signals neutral peer leadership rather than capitulation. The pullback into support at 38.18 sits just 7.4% below the 50W with MACD bullish and improving—a setup that permits entry without chasing; stochastic RSI falling/neutral at 0.63 avoids the oversold whipsaw that dogs REMX and PICK. Although COPX's 2.0% 13W return is weak, the 90.0 risk/reward score reflects 4.8% downside to support versus 16.2% upside to resistance, making this a defined mean-reversion coil for a category that macro has punished severely.
Industrial Metals received 0% allocation, ranked outside the tier system entirely, because the category score collapsed to 20.6 following structural failures in two of three candidates and overwhelming macro headwinds. Liquidity stress is active at -8 points, hitting industrial metals harder than precious metals because copper and rare earths carry real industrial-demand risk in a recessionary disinflation. COPX's technical evidence scored 74.7/100 and macro fit only 43.0/100, producing a weighted 65.0 reasoned proof order—strong on charts but weak on narrative. The 3/2/1 weighted basket started at 53.3 but final category score of 20.6 reflects the reasoner's hard tests against leadership, persistence, and regime fit; REMX's structural break disqualified it, leaving only COPX to anchor a category that macro has simply shut down. Recovery requires either a pivot in the disinflation narrative or explicit supply-chain disruption fears.