
2025-03-21
Informational purposes only. The content in this report, including allocations, analysis, and commentary, is provided solely for informational and educational purposes. It does not constitute financial advice, investment advice, trading advice, or any other type of advice. Past performance does not guarantee future results. Always conduct your own research and consult a qualified financial professional before making investment decisions.
Weekly Allocation
| Ticker | Category | Weight | Role |
|---|---|---|---|
| FBTC | 50% | Overlay | |
| GLD | Precious Metals | 10% | Top-2 (10%) |
| IGF | Utilities & Infrastructure | 10% | Top-2 (10%) |
| XLE | Traditional Energy | 5% | Tier-2 (5%) |
| ITA | Defense & Aerospace | 5% | Tier-2 (5%) |
| URNM | Nuclear Energy | 5% | Tier-2 (5%) |
| CIBR | Technology | 5% | Tier-2 (5%) |
| AIQ | AI | 5% | Tier-2 (5%) |
| COPX | Industrial Metals | 5% | Tier-2 (5%) |
Trade Instructions — Monday Open
Sell the tranche from 2025-02-21 (completing its 4-week hold). Buy the new tranche. Instructions show net portfolio changes — same-asset positions cancel, weight changes show the delta.
| Action | Ticker | Instruction |
|---|---|---|
| SELL | XLU | Sell 33% of XLU position (reduce 7.50% → 5.00%) |
| SELL | NLR | Sell 50% of NLR position (reduce 2.50% → 1.25%) |
| SELL | WEAT | Sell entire WEAT position (1.25% of portfolio) |
| SELL | IEMG | Sell 33% of IEMG position (reduce 3.75% → 2.50%) |
| BUY | XLE | Buy XLE — 20.00% of freed cash (adds 1.25% to portfolio) |
| BUY | IGF | Buy IGF — 40.00% of freed cash (adds 2.50% to portfolio) |
| BUY | URNM | Buy URNM — 20.00% of freed cash (adds 1.25% to portfolio) |
| BUY | COPX | Buy COPX — 20.00% of freed cash (adds 1.25% to portfolio) |
Current Portfolio After Trade
Combined holdings across all 4 active tranches. Each tranche is 25% of the portfolio.
| Ticker | % of Portfolio | Weight Bar |
|---|---|---|
| FBTC | 50.00% | |
| GLD | 10.00% | |
| XLU | 5.00% | |
| ITA | 5.00% | |
| IGF | 5.00% | |
| CIBR | 3.75% | |
| IEMG | 2.50% | |
| AIQ | 2.50% | |
| XLE | 2.50% | |
| VEGI | 2.50% | |
| BOTZ | 2.50% | |
| URNM | 2.50% | |
| COPX | 2.50% | |
| NLR | 1.25% | |
| XLK | 1.25% | |
| FCG | 1.25% |
Macro Regime — Transition / Mixed
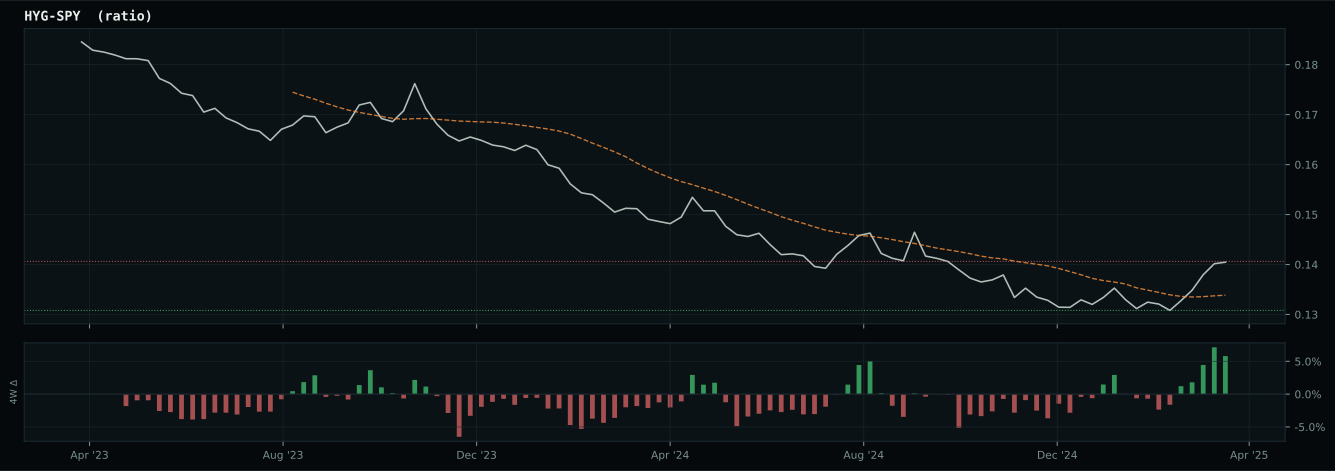
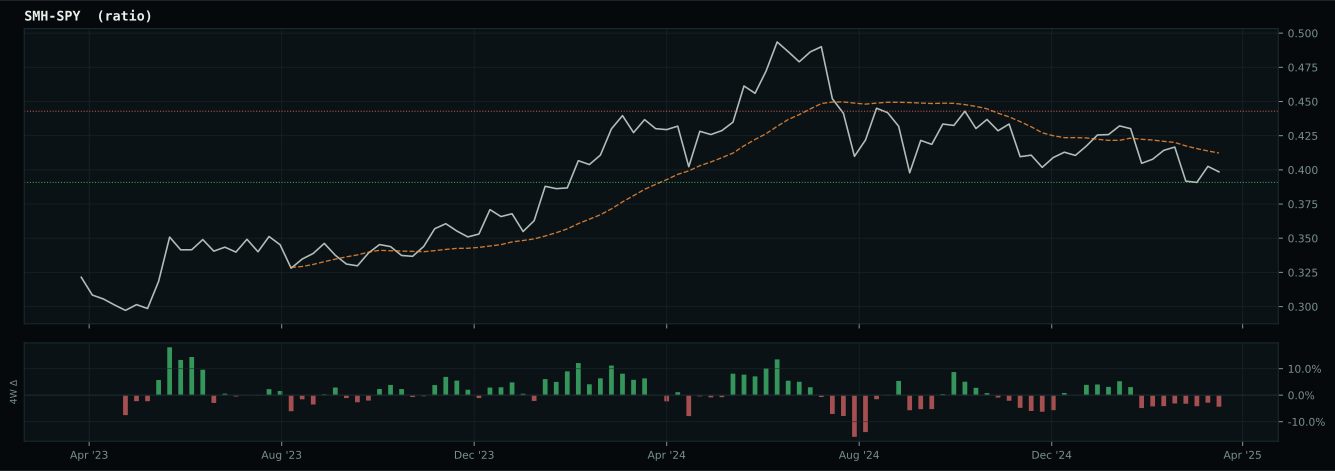
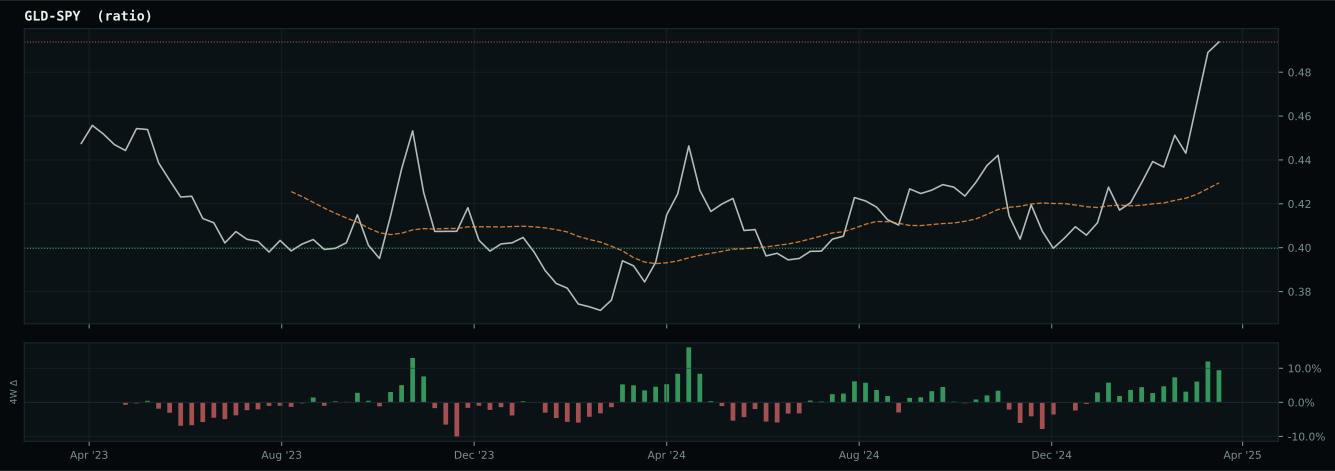
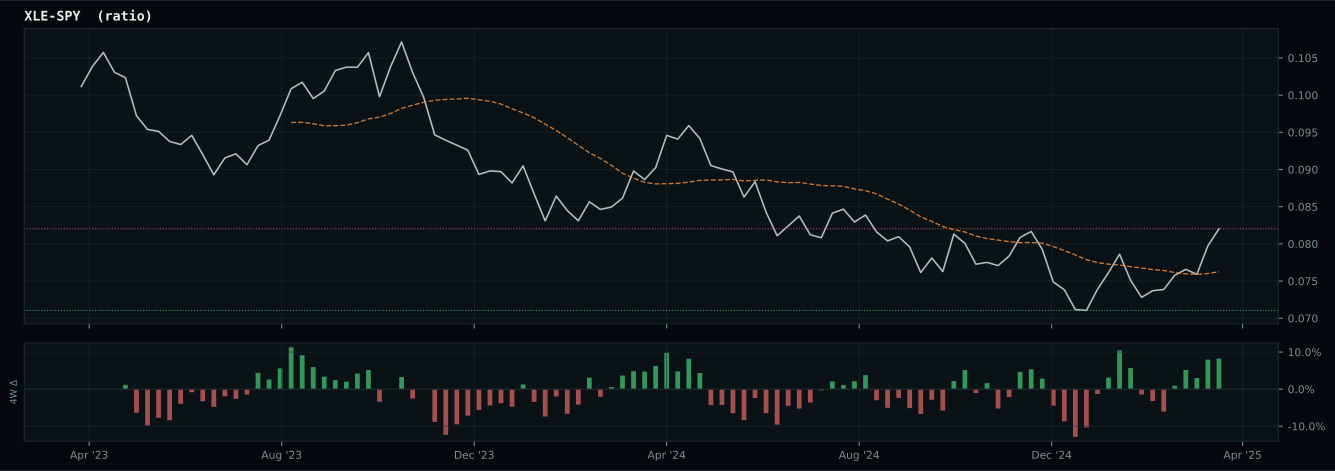
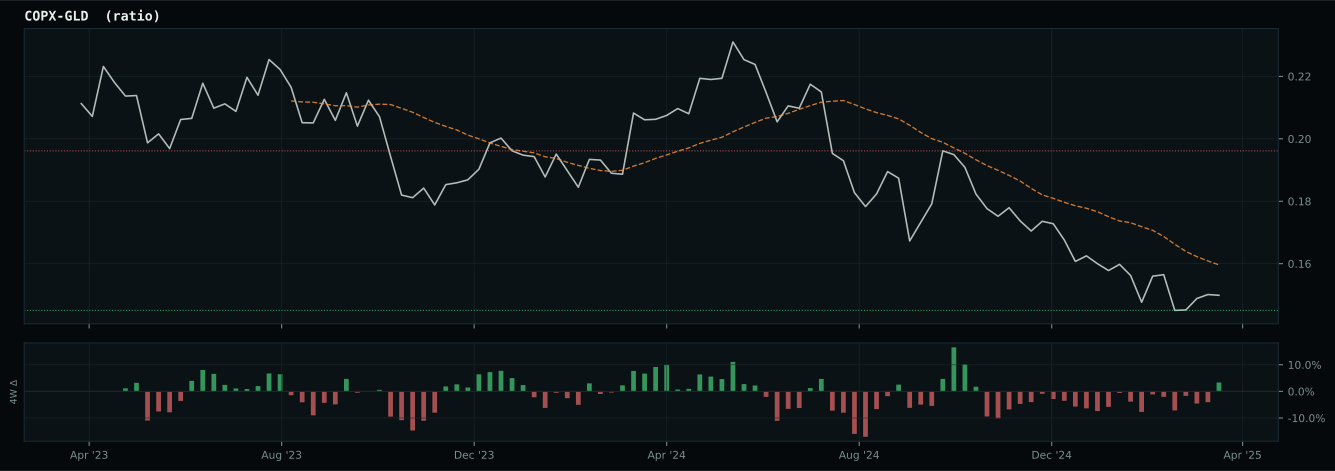
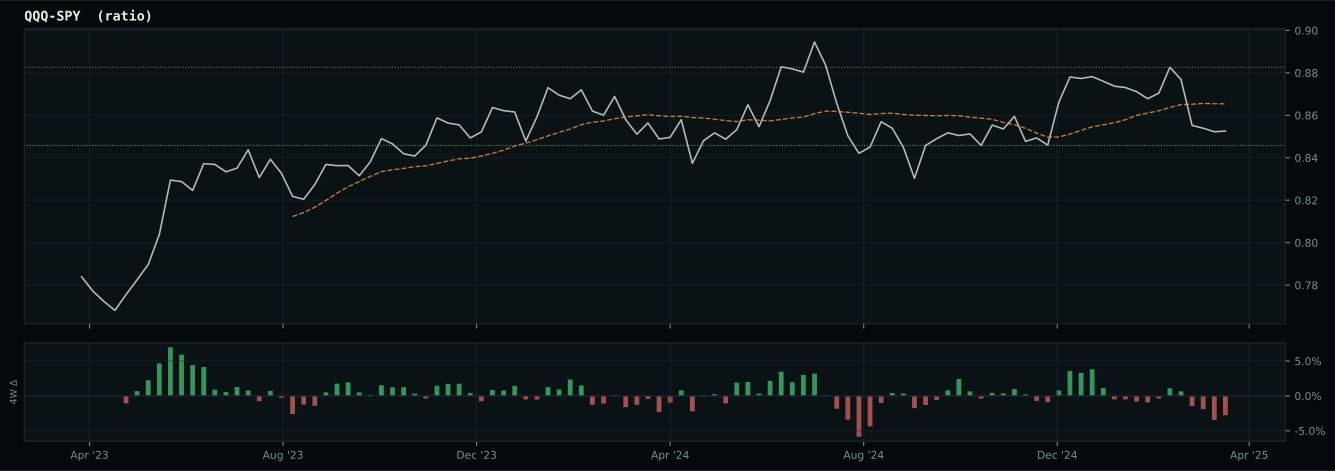
growth data is not confirming the weak market-implied risk appetite signal
Macro Evidence Charts
Market-implied signals behind the macro regime scores. Each ratio compares two assets; the direction and slope of the ratio is what the macro engine reads.
Crypto Regime — TrendBTC
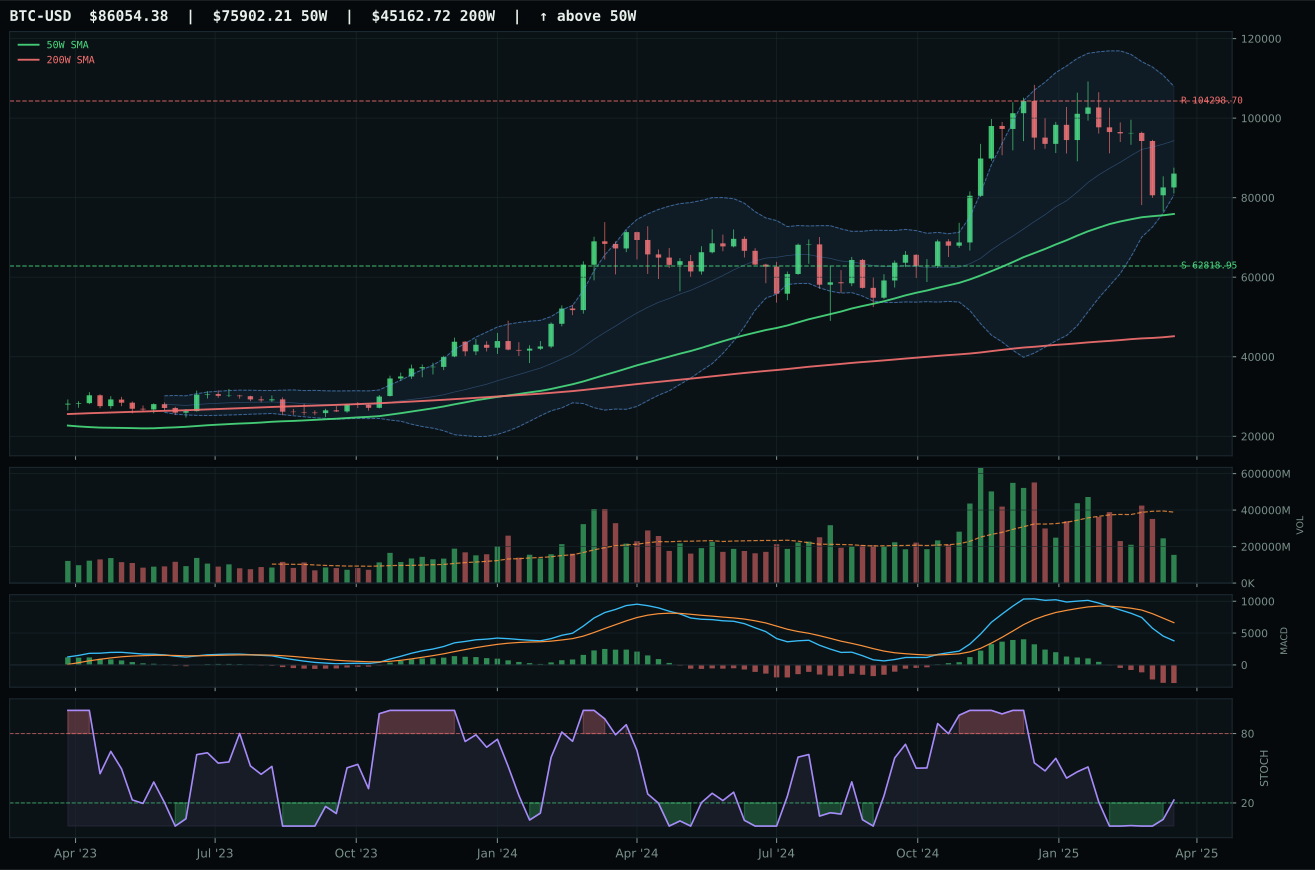
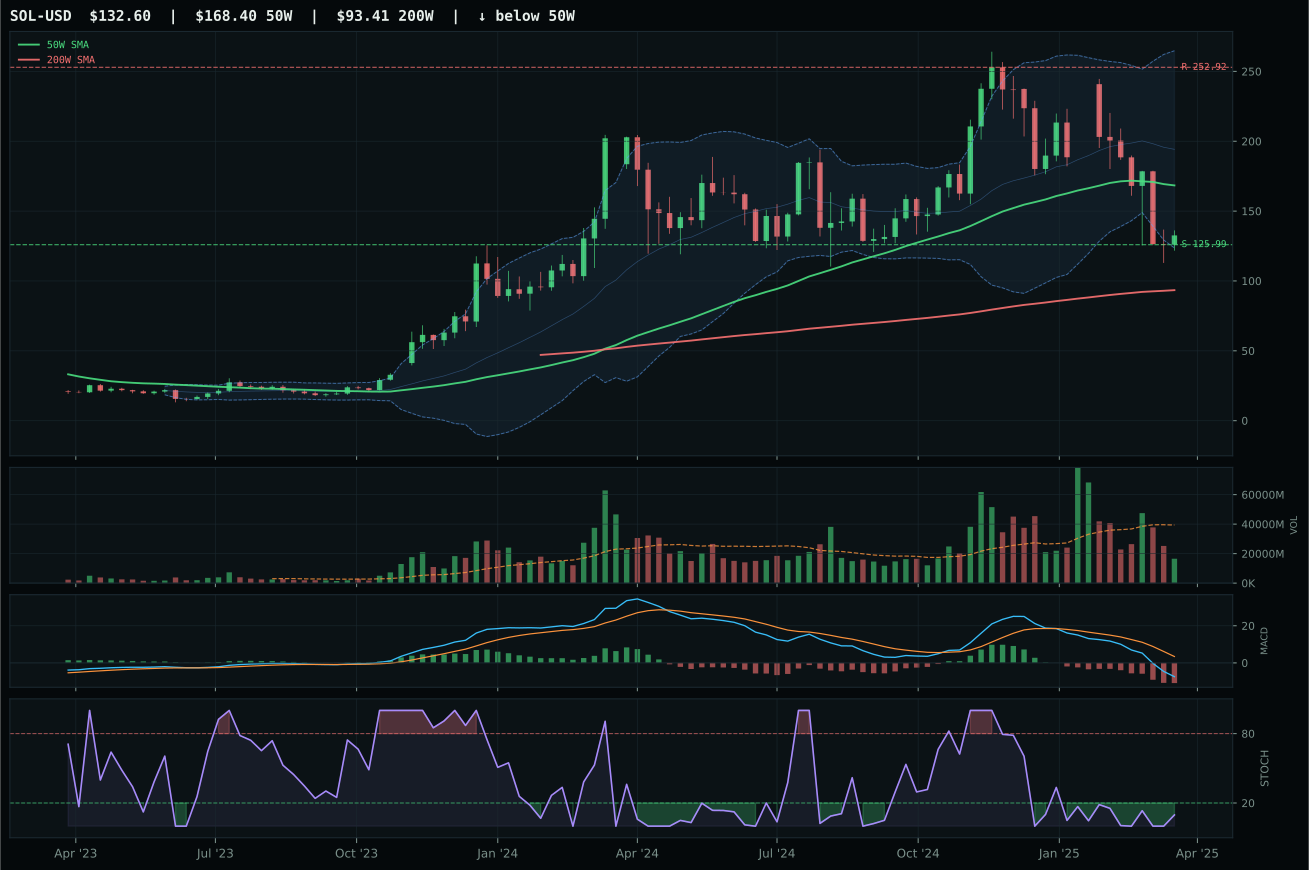
ValueBTC not armed: BTC has not made the first post-breakdown touch of the 200W buy zone after losing the 50W
TrendBTC confirmed: 2 consecutive closes above rising/flat 50W SMA
one or more available conditions failed
Category Rankings
| Rank | Category | Winner | Score | Alloc | 4W Ret | Peers (4W) |
|---|---|---|---|---|---|---|
| 1 | Precious Metals | GLD | 80.7 | 20% | +12.95% | GDX +18.2% · SLV -0.6% |
| 2 | Utilities & Infrastructure | IGF | 53.2 | 20% | +2.08% | XLU -1.4% · PAVE -7.4% |
| 3 | Traditional Energy | XLE | 49.3 | 10% | -13.02% | FCG -15.2% · XOP -16.3% |
| 4 | Defense & Aerospace | ITA | 46.4 | 10% | -5.09% | XAR -2.6% · ROKT -7.3% |
| 5 | Nuclear Energy | URNM | 39.0 | 10% | -11.85% | NLR -6.9% · URA -9.6% |
| 6 | Technology | CIBR | 31.3 | 10% | -6.78% | IGV -9.8% · XLK -12.6% |
| 7 | AI | AIQ | 22.6 | 10% | -12.50% | SMH -17.6% · BOTZ -13.2% |
| 8 | Industrial Metals | COPX | 20.6 | 10% | -14.22% | REMX -11.7% · PICK -9.8% |
| 9 | Emerging Markets | IEMG | 19.8 | 0% | -5.92% | INDA +1.9% · ILF -2.7% |
| 10 | Agriculture & Livestock | VEGI | 16.2 | 0% | -2.41% | MOO -3.5% · WEAT -0.6% |
Precious Metals — GLD
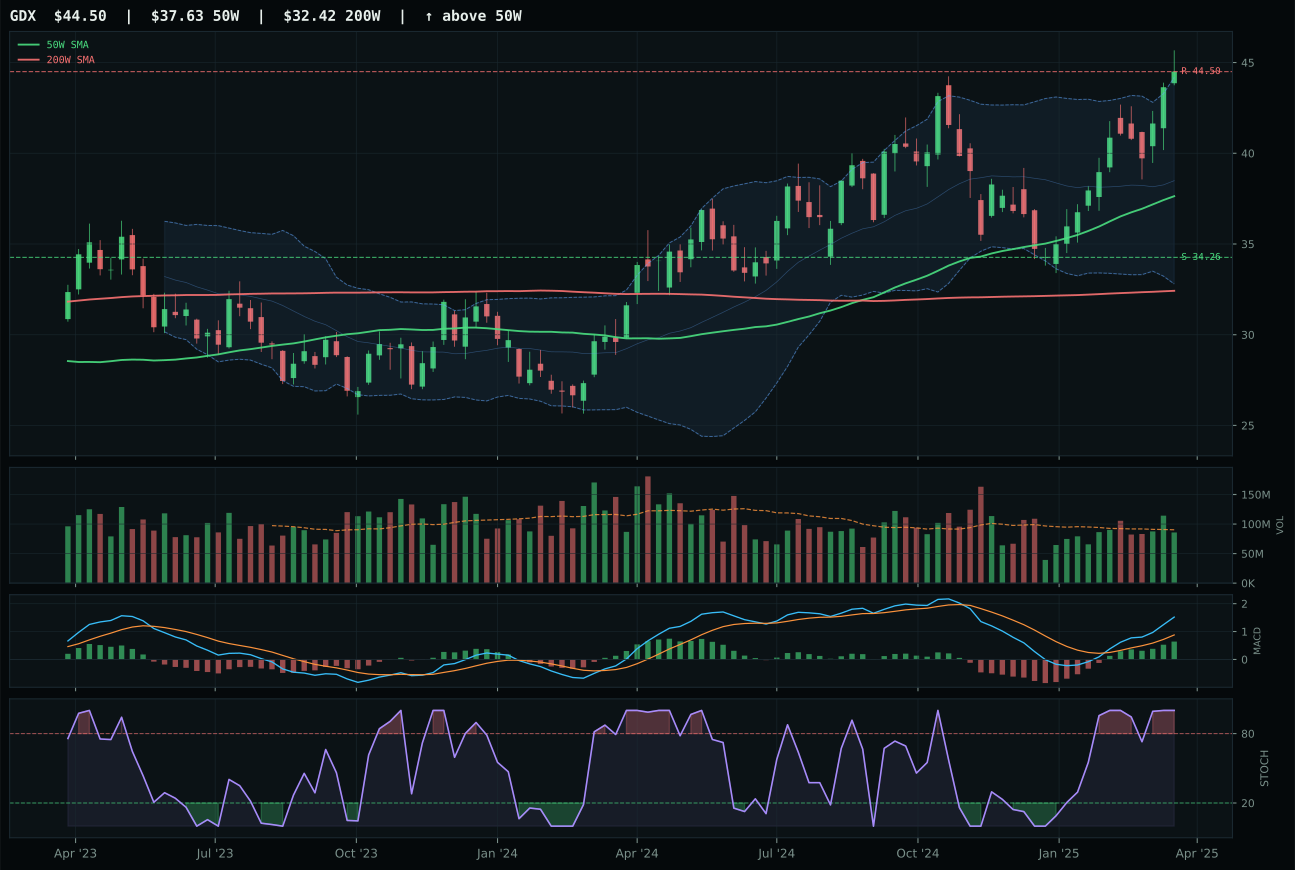
GDX has a vertical extension profile with 32.7% 13-week relative strength versus SPY.
A failed hold above support would weaken the setup.
Actionable but governed by invalidation levels.
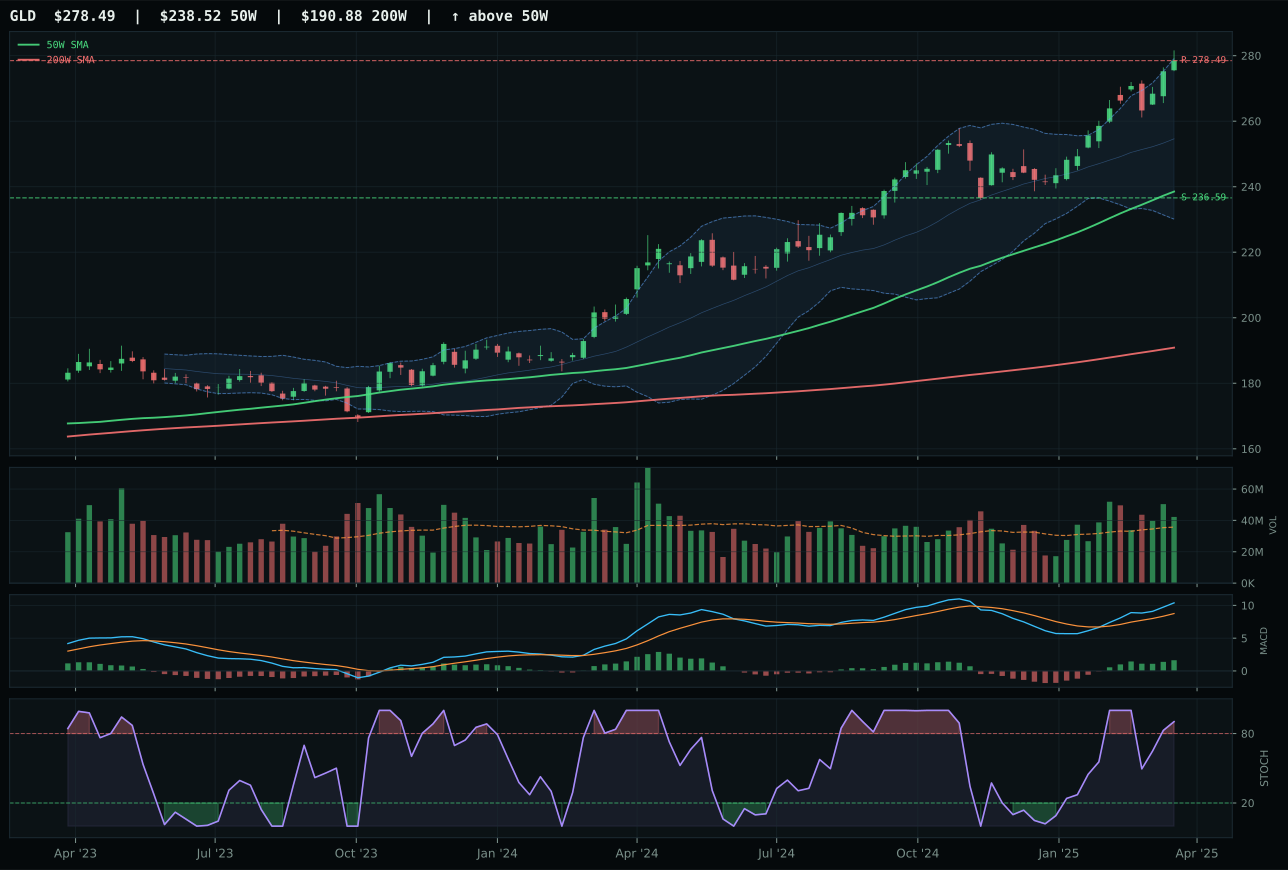
GLD has a vertical extension profile with 19.6% 13-week relative strength versus SPY.
A failed hold above support would weaken the setup.
Actionable but governed by invalidation levels.
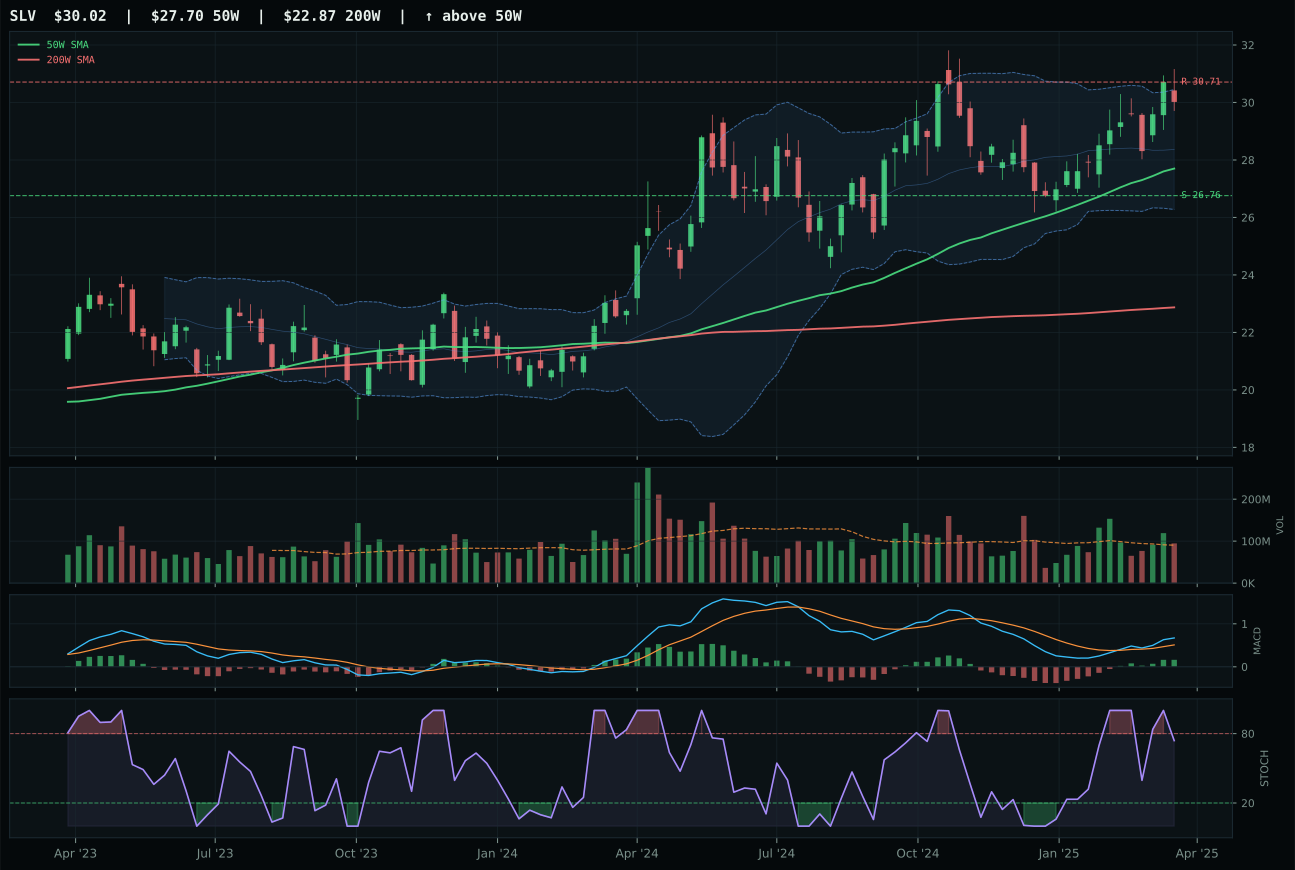
SLV has a neutral structure profile with 16.1% 13-week relative strength versus SPY.
A failed hold above support would weaken the setup.
Actionable but governed by invalidation levels.
GLD dominates this category with a commanding 80.7 score and a 1.9-point lead over GDX because it pairs perfect trend confirmation (100.0) and flawless momentum (100.0) with prudent risk management: 45.1 risk-reward versus GDX's 41.8, achieved through 16.8% extension from the 50W versus GDX's aggressive further leverage. GLD's 1.18x above-average volume and 19.6% SPY-relative strength prove institutional accumulation in a monetary hedge environment. Structure cleanliness at 91.7 is pristine—vertical extension with clean compression and zero ambiguity in support/resistance bands. GDX's superior 32.7% relative strength looks appealing until you realize it reflects speculative leverage, not fundamental accumulation; its 80.4 structure score and neutral volume (below GLD's 1.18x participation) expose miners as a liquidity risk in a stress regime. Both carry overbought stochastics at 0.90, but GLD's cleaner structure and volume sponsorship justify carrying risk to resistance.
Precious Metals earned 10% as a top-2 overweight allocation with a commanding 80.7 final score, the second-highest category rank this week. The 71.0 macro fit reflects the active monetary hedge bid (+14) and defensive rotation (+7) that are the portfolio's dominant tailwind; in a Transition/Mixed regime where liquidity is tightening and risk appetite is fragile, gold's properties as a non-correlated store of value are proving indispensable. GLD's 100.0 trend score and 100.0 momentum confirmation, paired with 88.8 technical evidence, make this the highest-conviction entry across the portfolio. The 10% allocation (halved to 10% from a nominal 20% due to the 50% crypto overlay) represents the second-largest capital commitment after FBTC; the one risk is extension at 16.8% above the 50-week, which limits upside to 0.0% to the 278.49 resistance. Any pullback to test the 236.59 support would be a buying opportunity to add, but current positioning reflects the reality that monetary hedge is the portfolio's dominant macro driver.
Utilities & Infrastructure — IGF
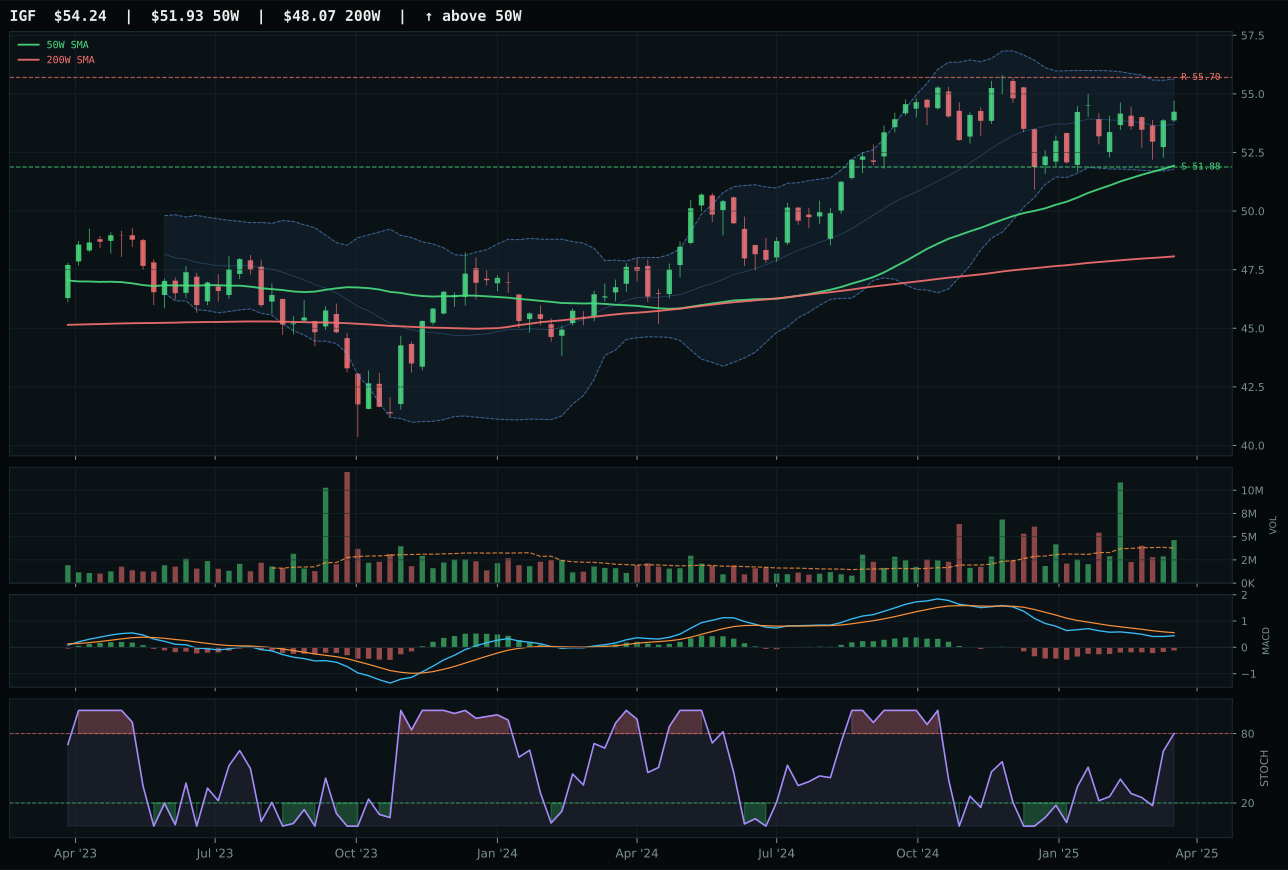
IGF has a pullback into support profile with 9.1% 13-week relative strength versus SPY.
A failed hold above support would weaken the setup.
Actionable but governed by invalidation levels.
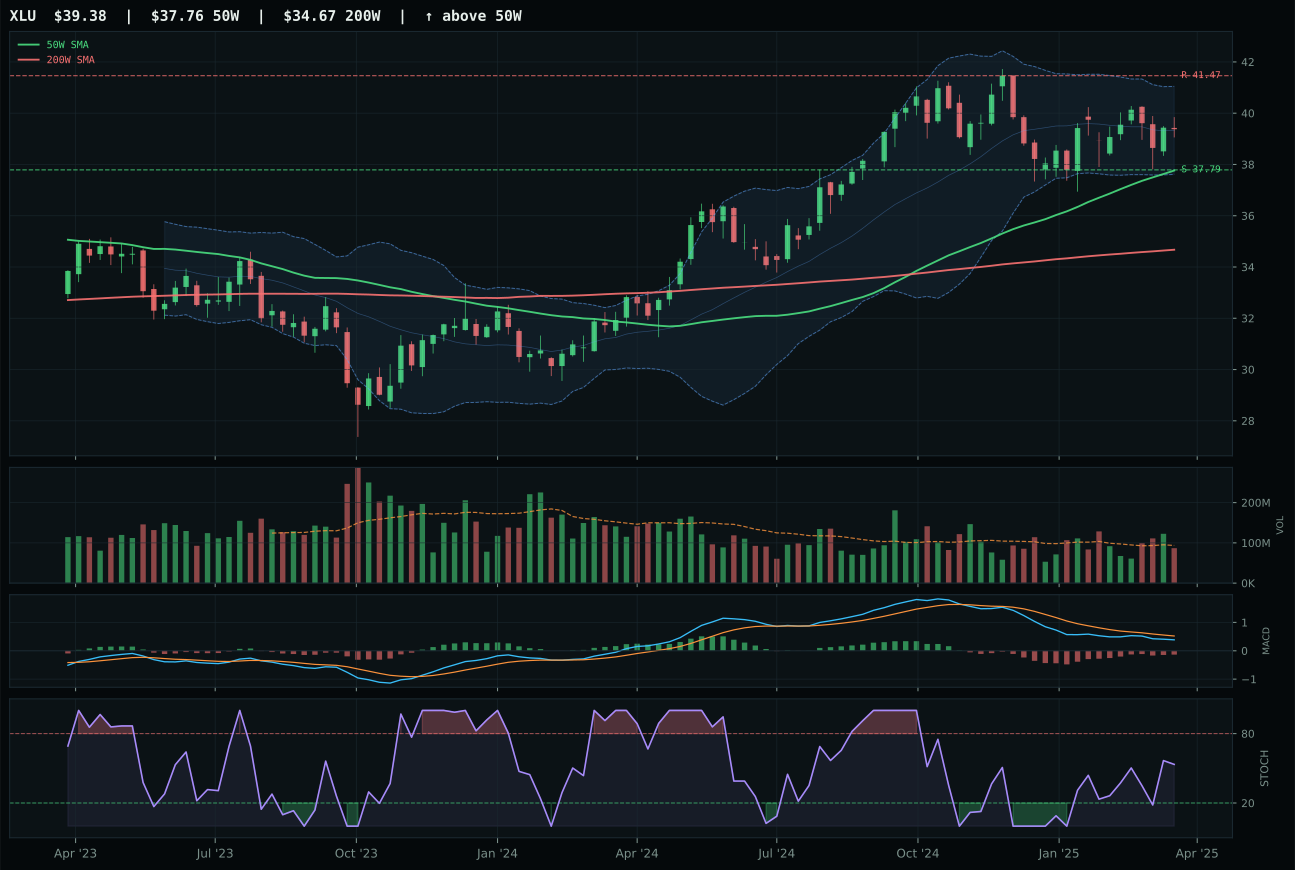
XLU has a pullback into support profile with 7.6% 13-week relative strength versus SPY.
A failed hold above support would weaken the setup.
Actionable but governed by invalidation levels.
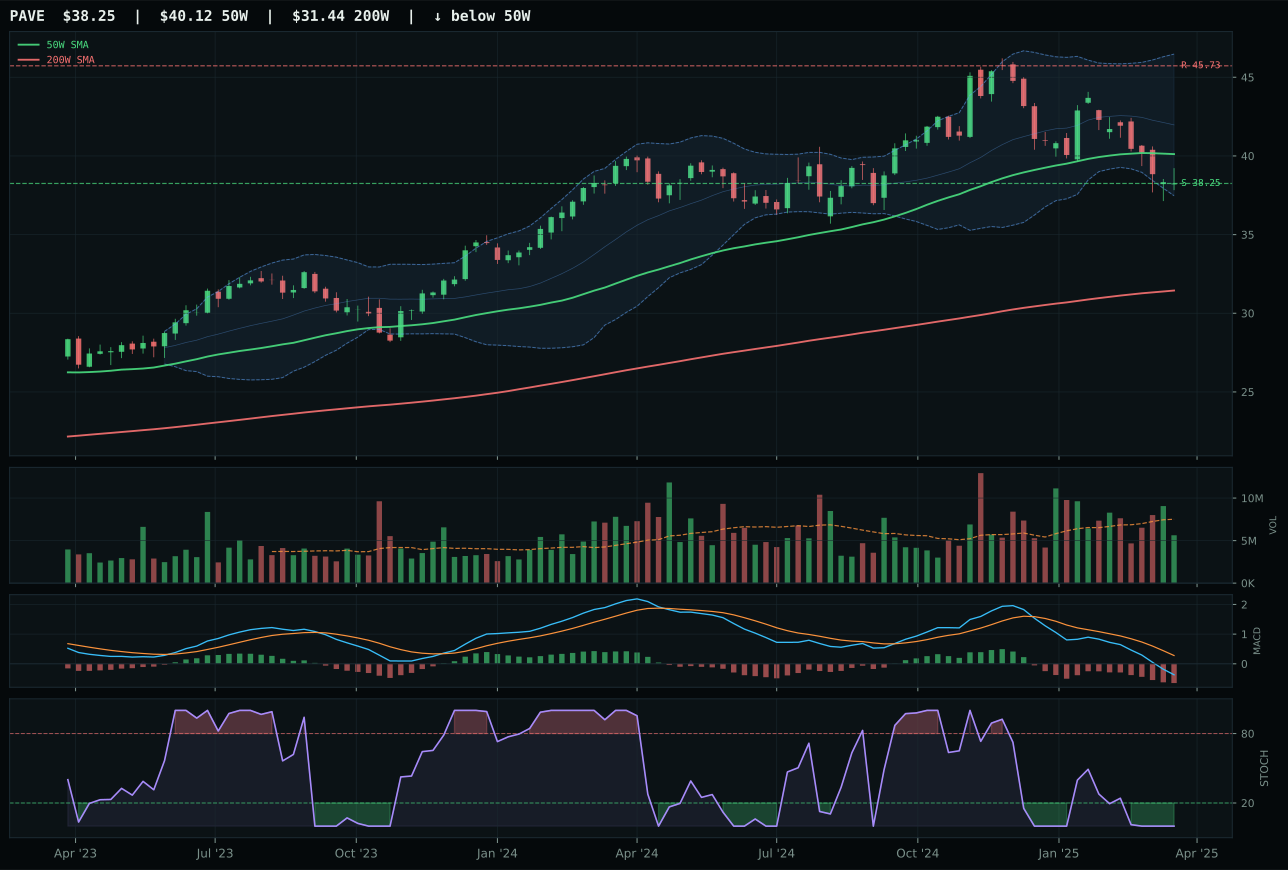
PAVE has a pullback into support profile with -2.3% 13-week relative strength versus SPY.
A failed hold above support would weaken the setup.
Actionable but governed by invalidation levels.
IGF clinches the Utilities & Infrastructure category with perfect 100.0 trend and 100.0 timing scores by sitting just 4.4% above the 50W with a pullback-into-support setup (support 51.88) that offers maximum entry confidence. 9.1% SPY-relative strength and 1.5% category-relative edge over XLU prove infrastructure accumulation is real despite bearish-but-improving MACD. Volume at 1.23x above-average participation confirms institutions are building positions. IGF's 78.2 structure score versus XLU's 74.8 reflects cleaner compression (86.2 vs lower levels) and superior volume sponsorship. XLU's 7.6% SPY-relative looks comparable until you note its neutral volume and bearish/weakening MACD signal deterioration rather than stabilization. Both offer 80% momentum confirmation, but IGF's persistence at 63.8 and volume-price confirmation at 74.5 prove the move is accumulating; XLU's are weaker.
Utilities & Infrastructure earned 10% as a top-2 overweight allocation with a 53.2 final score, ranking second only to FBTC (the crypto overlay anchor) in capital commitment. The category macro fit of 67.0 is the portfolio's second-highest after Precious Metals, driven by active defensive rotation (+12), which is the dominant portfolio theme; broad market bear (+4) and the Transition/Mixed regime (+4) further support allocation to steady-income names. IGF's 82.7 technical evidence (the highest in its basket) combined with 100.0 trend and timing scores established it as a core defensive holding alongside GLD. The 10% allocation (halved from 20% nominal due to the 50% crypto overlay) positions Utilities & Infrastructure as the portfolio's second-largest capital slot, reflecting conviction that dividend-yielding, rate-sensitive durables will outperform growth and discretionary equity as risk appetite remains fragile. Any pullback to test the 51.88 support would present a meaningful add opportunity; current positioning assumes IGF will trend toward the 55.70 resistance as defensive flows continue to accumulate.
Traditional Energy — XLE
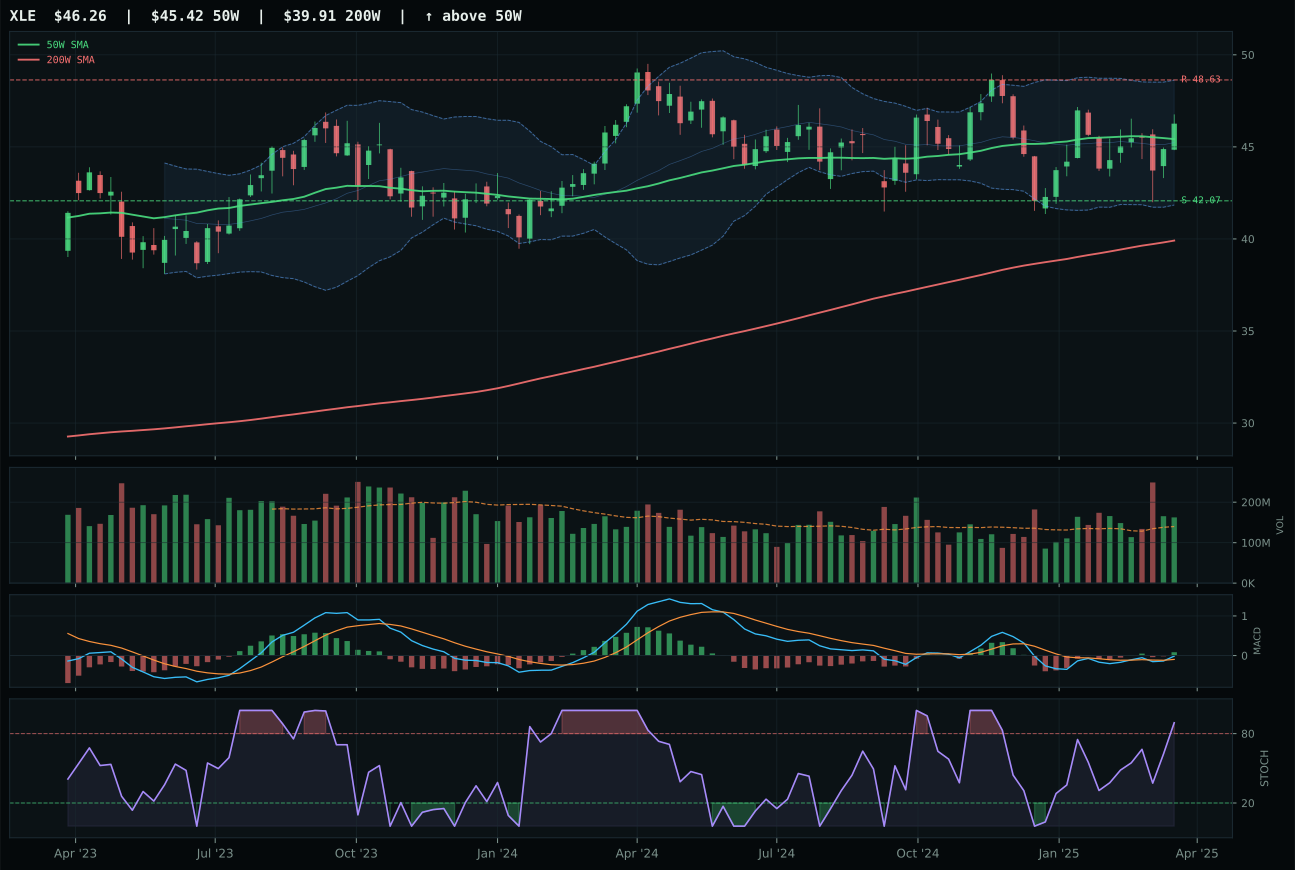
XLE has a compression near 50W profile with 14.6% 13-week relative strength versus SPY.
A failed hold above support would weaken the setup.
Actionable but governed by invalidation levels.
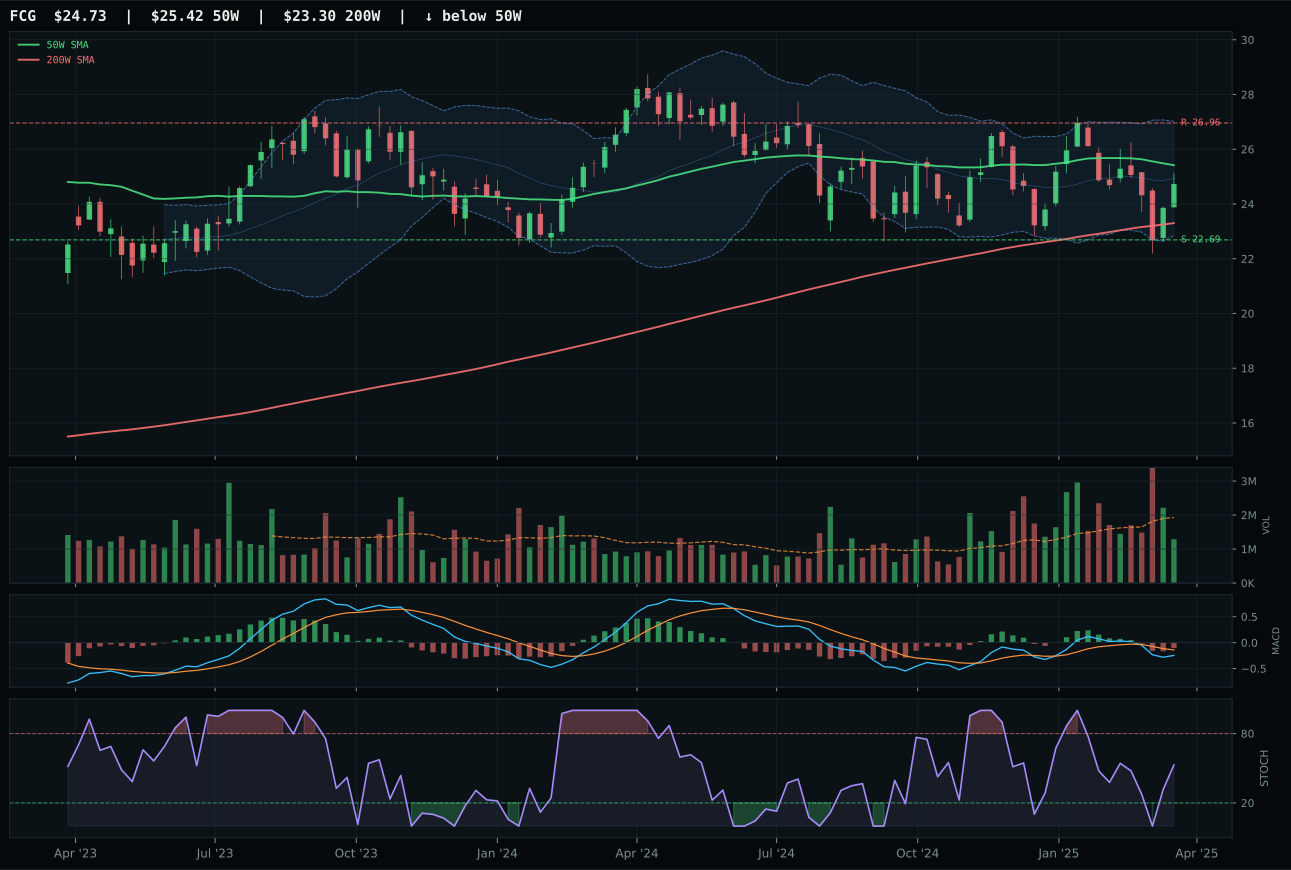
FCG has a compression near 50W profile with 11.1% 13-week relative strength versus SPY.
A failed hold above support would weaken the setup.
Actionable but governed by invalidation levels.
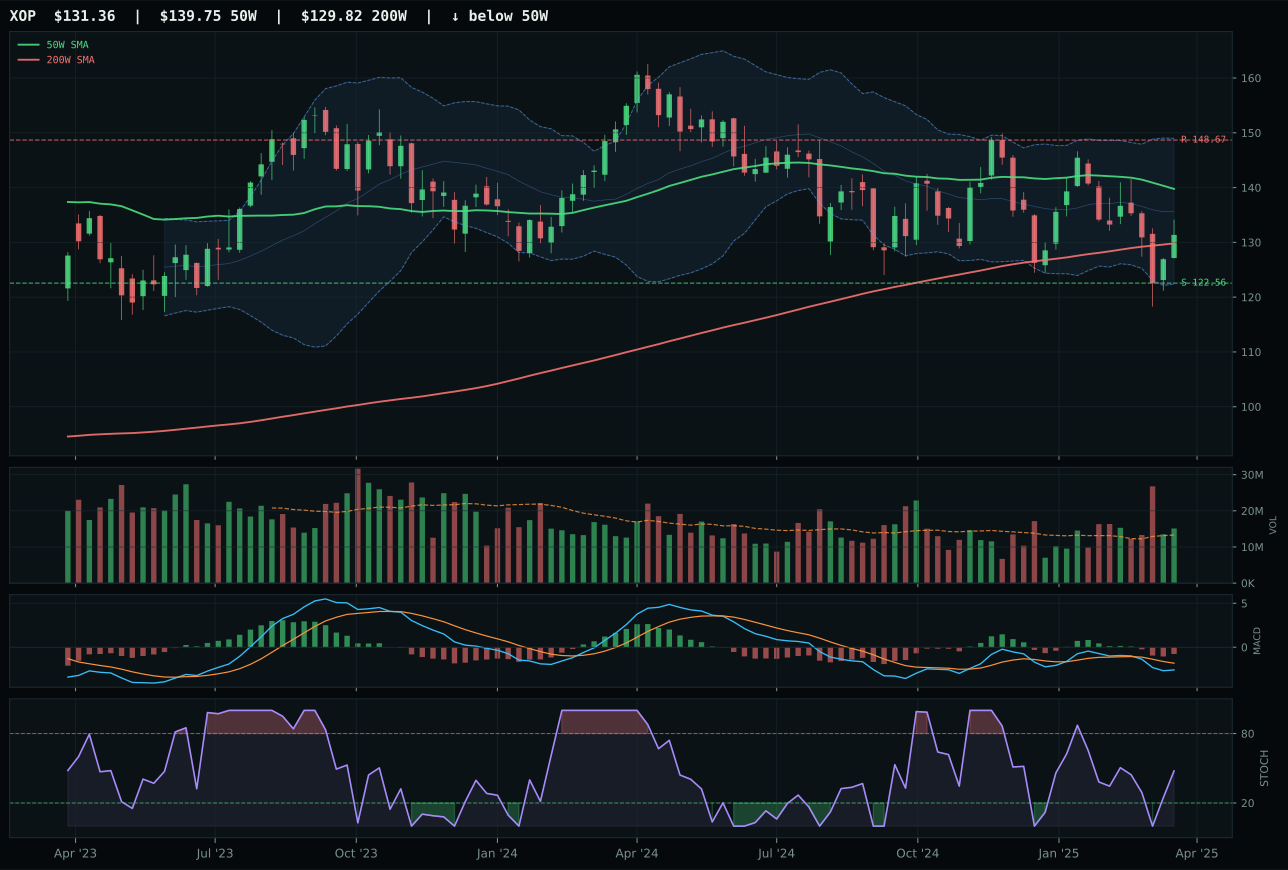
XOP has a neutral structure profile with 8.6% 13-week relative strength versus SPY.
A failed hold above support would weaken the setup.
Actionable but governed by invalidation levels.
XLE crushes its peers with a 91 composite score because it delivers perfect 100.0 trend, 100.0 timing, and 100.0 momentum confirmation—the only category representative to sweep all three pillars. Price sits 1.9% above the 50W in compression near the 50W, with 14.6% SPY-relative strength and bullish-improving MACD paired with overbought 0.89 stochastic RSI. This is institutional accumulation in real time: 1.16x above-average volume confirms buyers aren't relenting. Compression cleanliness at 75.0 and 78.0 compression score show the structure is coiling, not breaking down. FCG's 29.3-point gap exposes gas as a broken setup: bearish/weakening MACD, thin 0.50x volume, and neutral 11.1% SPY-relative strength contrast sharply with XLE's bullish MACD and above-average participation. Energy scarcity is the macro tailwind (+14 to macro fit), and XLE is capturing it; FCG is lagging.
Traditional Energy earned 5% as a tier-2 allocation with a 49.3 final score, securing a position below the top-2 overweights. The category macro fit of 59.0 is supported by an active energy scarcity descriptor (+16), which reflects geopolitical uncertainty and supply-chain dynamics; however, liquidity stress (-7) and the Transition/Mixed regime create headwinds that prevent Energy from competing with GLD or IGF for overweight status. XLE's 95.5 technical evidence and perfect timing/momentum/trend scores make it the portfolio's cleanest near-term entry, with a defined 42.07 support that provides a clear invalidation level. The 5% allocation (5% of the nominal 10% due to the 50% crypto overlay) reflects a tactical holding pending a breakdown test or breakout confirmation; energy prices are supported by supply concerns and cash-flow sustainability, but the macro regime is rotating capital toward defensive durables and monetary hedges rather than cyclical energy names.
Defense & Aerospace — ITA
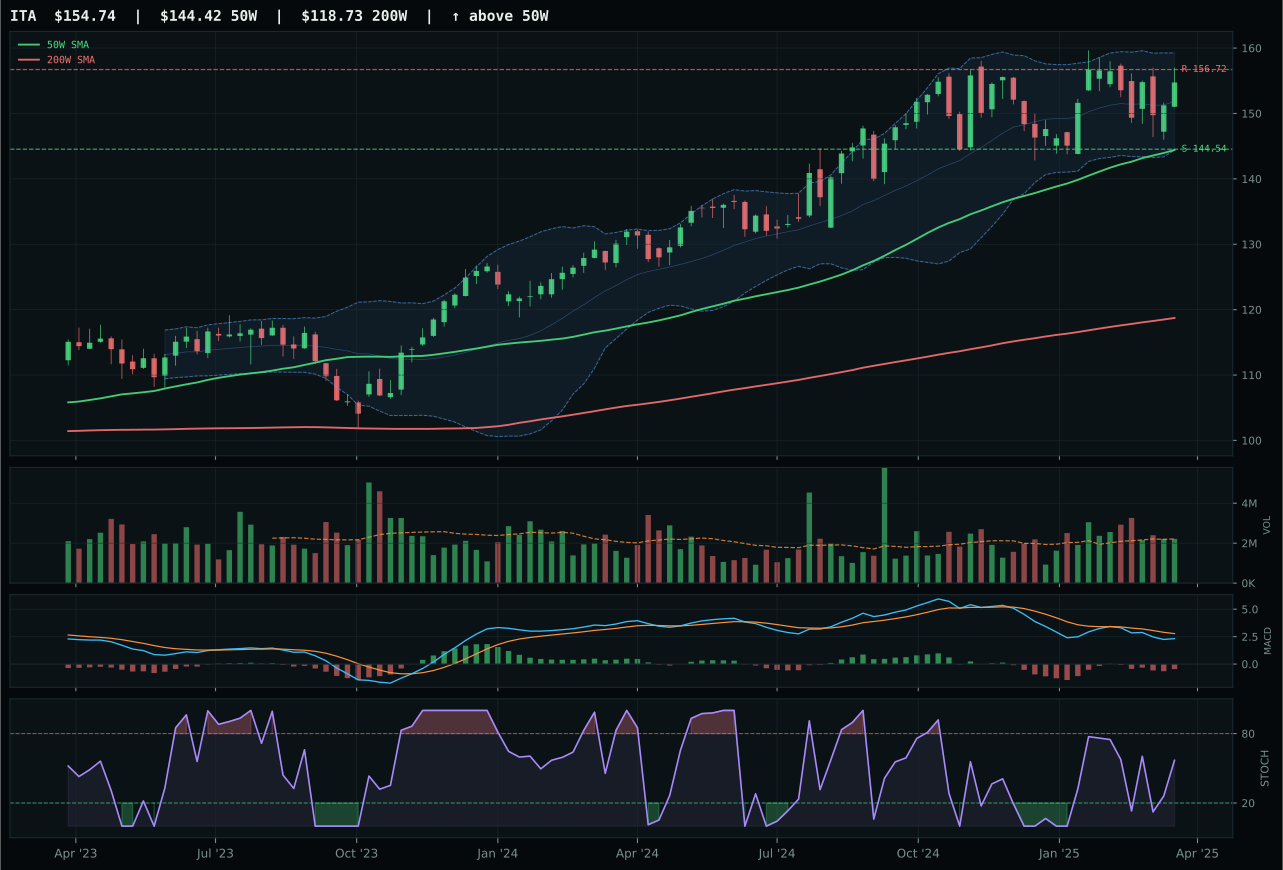
ITA has a neutral structure profile with 10.4% 13-week relative strength versus SPY.
A failed hold above support would weaken the setup.
Actionable but governed by invalidation levels.
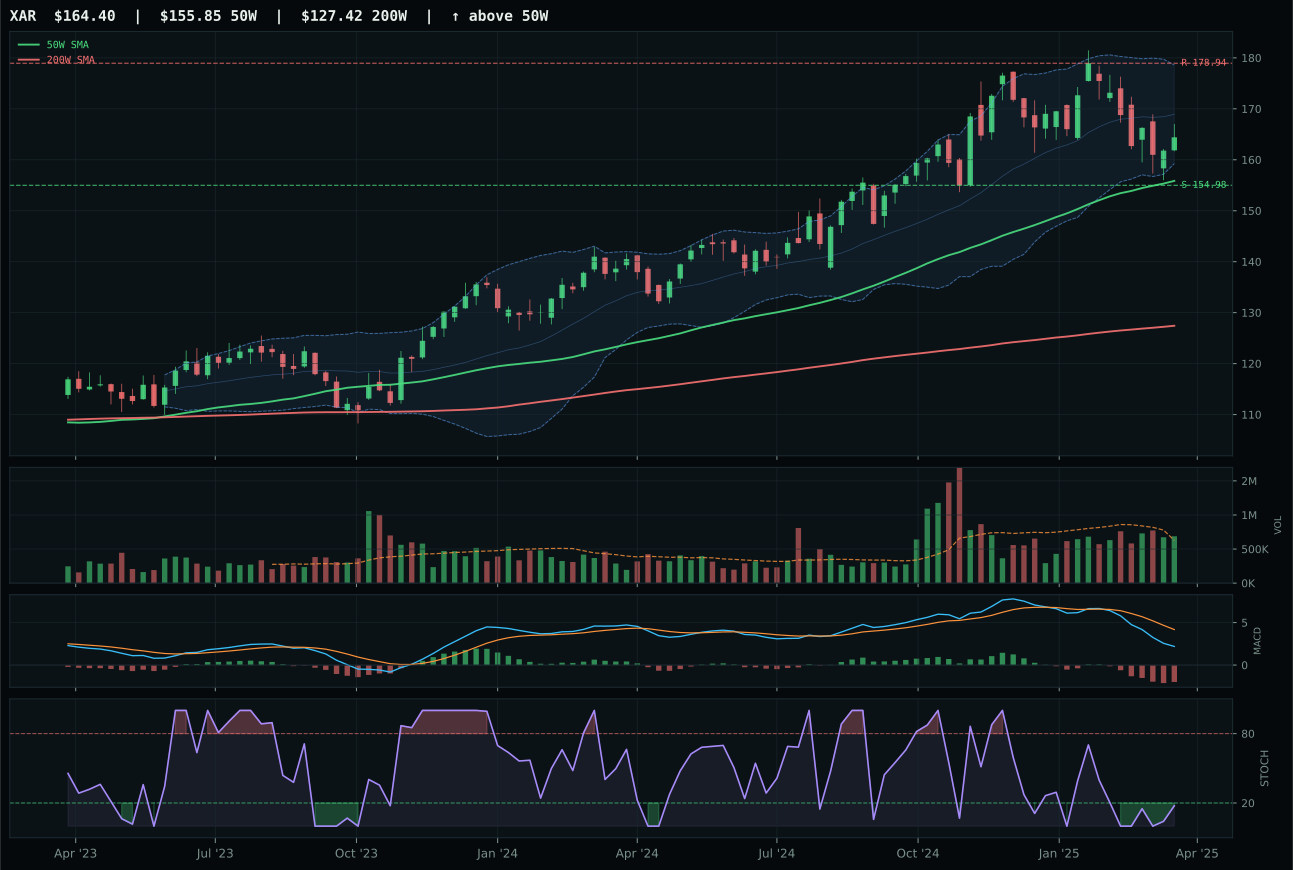
XAR has a neutral structure profile with 3.4% 13-week relative strength versus SPY.
A failed hold above support would weaken the setup.
Actionable but governed by invalidation levels.
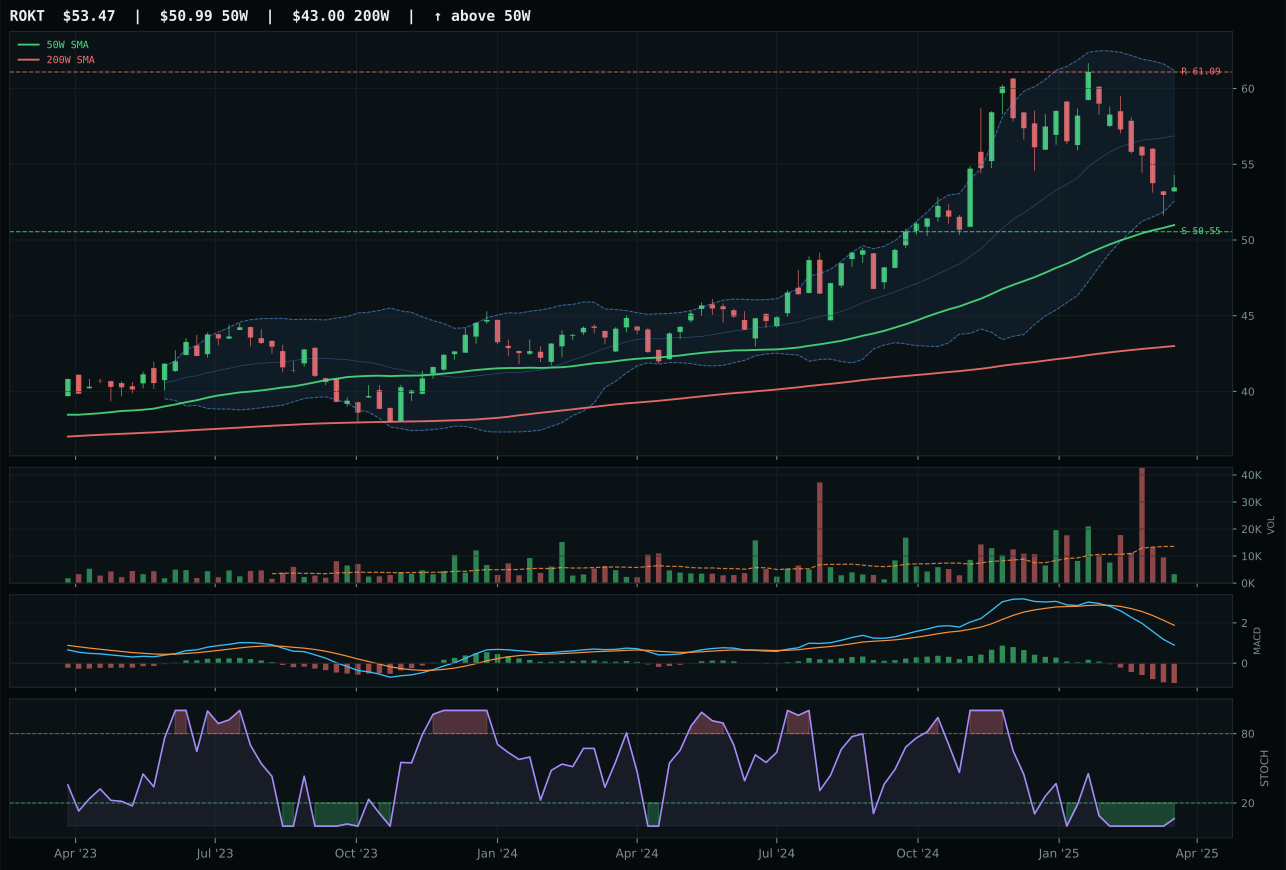
ROKT has a neutral structure profile with -0.1% 13-week relative strength versus SPY.
A failed hold above support would weaken the setup.
Tracked, but not top-2 eligible because: .
ITA edges out XAR by a razor-thin 0.2 points because category-relative strength delivers 6.9% advantage versus the peer median, where XAR's 0.0% lagged despite 13-week momentum of 5.8%. Both names are neutral-structure plays with compressed support/resistance bands, but ITA's 10.4% relative strength versus SPY and 75.7% momentum confirmation (driven by 13W return 5.8% and MACD bearish/weakening) prove accumulation; XAR's 3.4% SPY-relative and 48% momentum score expose it as a technical pullback into support rather than a trend. ITA sits 7.1% above the 50W in the upper retracement zone—expensive relative to the 50W but rewarded for trending correctly in a defensive-rotation environment. Volume is neutral across both, but ITA's persistence score (56.2 vs lower for XAR) confirms the move isn't one-day noise.
Defense & Aerospace earned 5% as a tier-2 allocation with a 46.4 final score, securing its ranking below the top-2 pair (GLD and IGF) but above the zero-allocation tier. The category benefits from a 61.0 macro fit score, where defensive rotation (+8) and broad market bear (+6) actively favor defensive durability plays; the Transition/Mixed regime contributes +3, recognizing that geopolitical uncertainty and reallocation toward steady cash flows lift this sector. Liquidity stress (-4) remains a headwind, but it is offset by the category's structural advantage in defensive flows. The 5% allocation reflects a conviction that primes like ITA will outperform broad-based cyclical rotation; any widening of the SPY-relative spread or a deepening of the pullback to test the 144.54 support would open the door to top-2 consideration, but current momentum persistence and macro drivers are not yet strong enough to displace GLD or IGF from the overweight tier.
Nuclear Energy — URNM
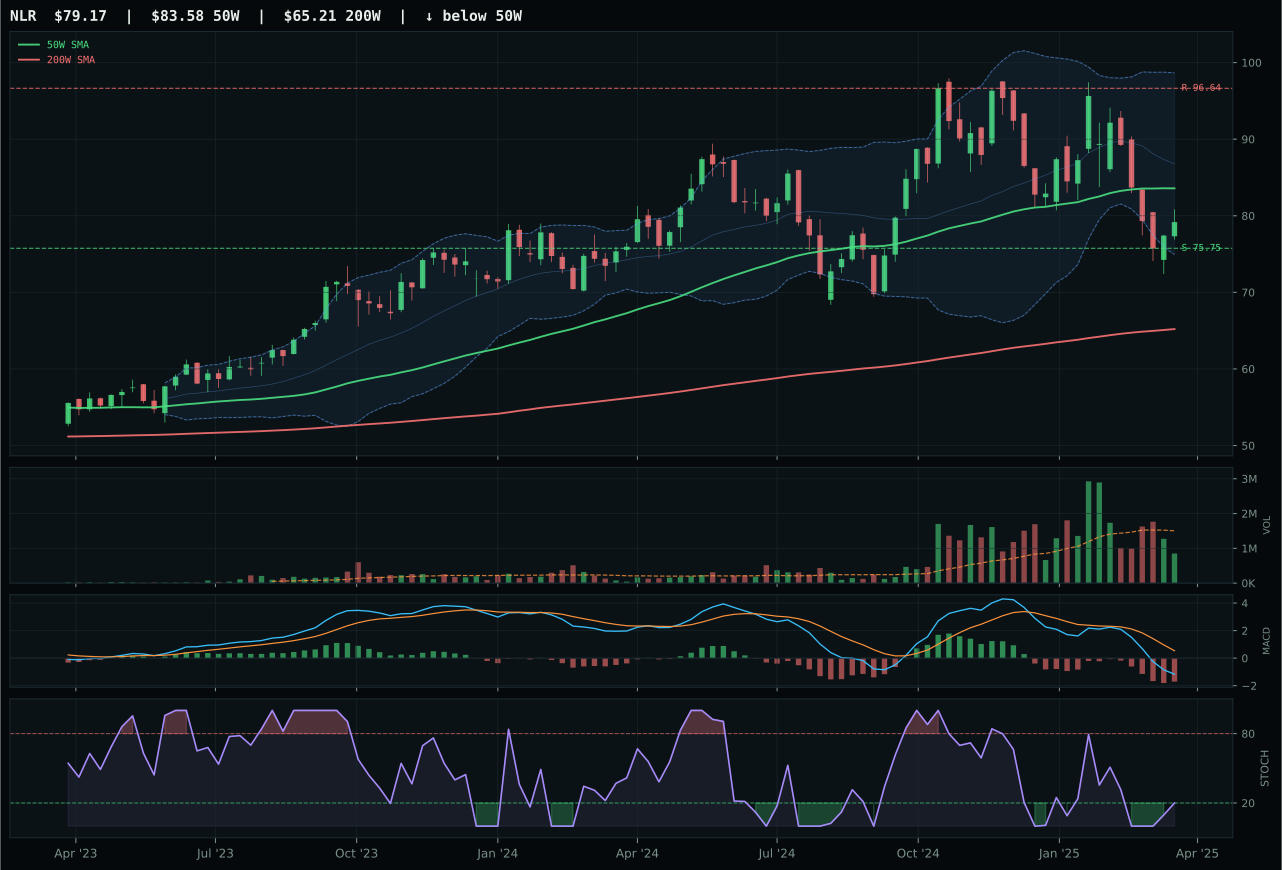
NLR has a pullback into support profile with 0.3% 13-week relative strength versus SPY.
A failed hold above support would weaken the setup.
Actionable but governed by invalidation levels.
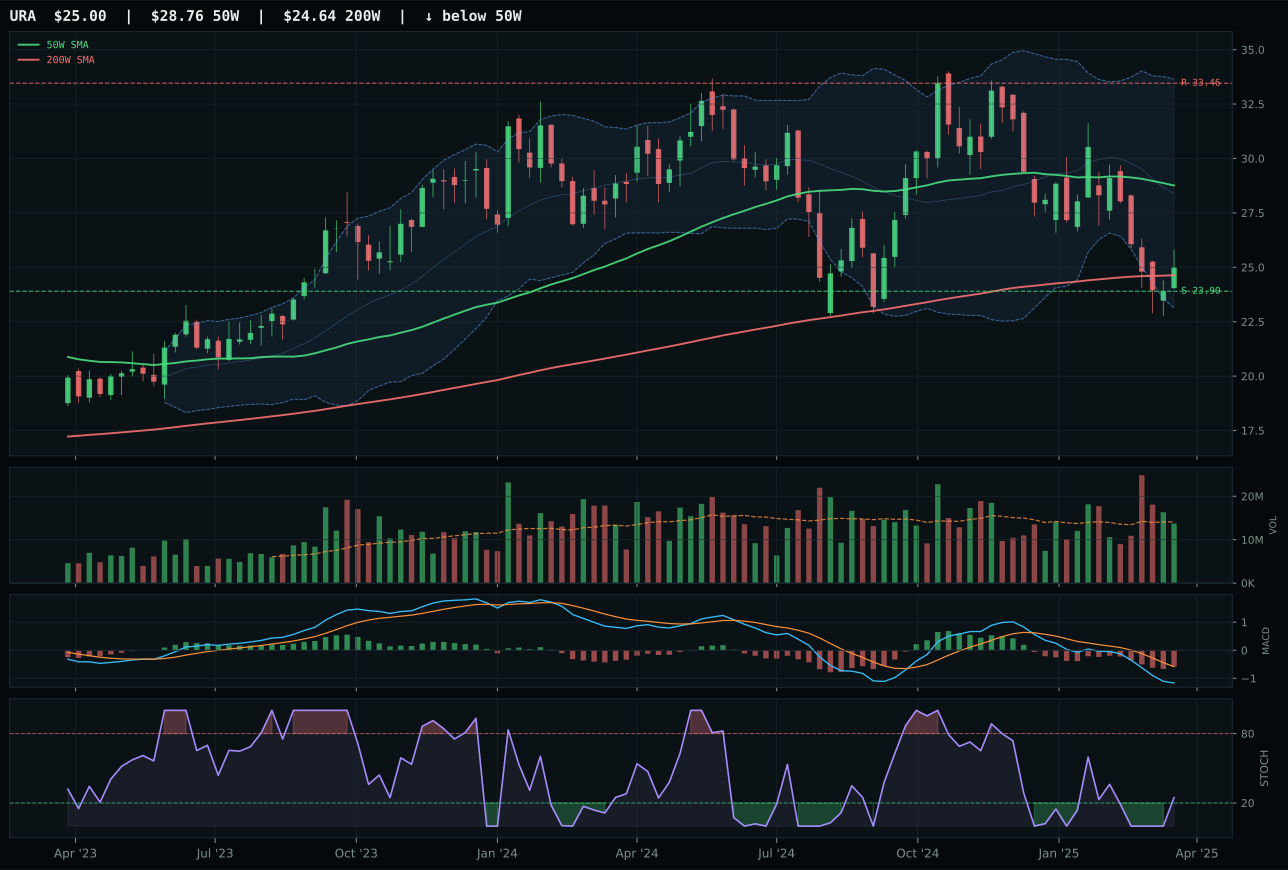
URA has a pullback into support profile with -6.0% 13-week relative strength versus SPY.
A failed hold above support would weaken the setup.
Actionable but governed by invalidation levels.
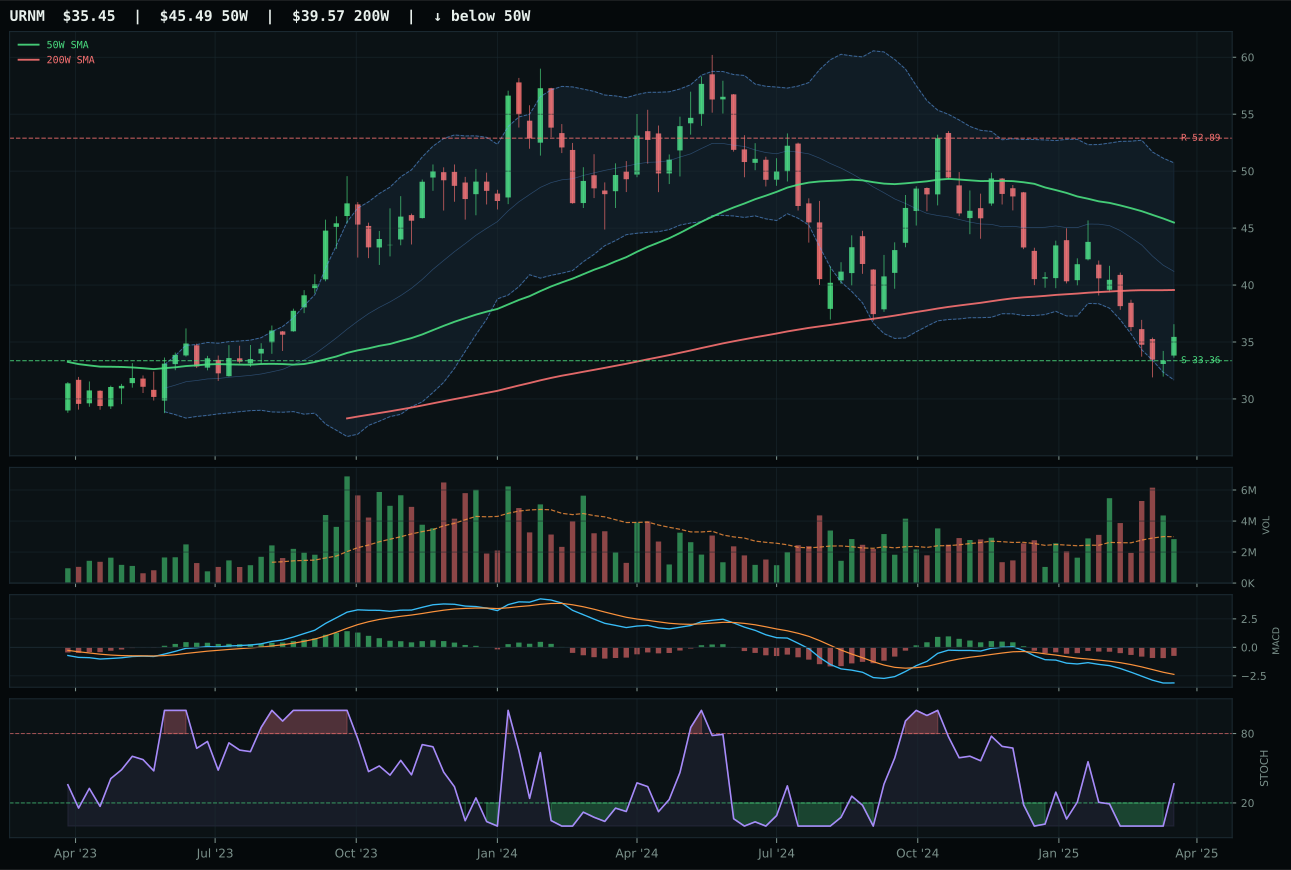
URNM has a neutral structure profile with -7.9% 13-week relative strength versus SPY.
A failed hold above support would weaken the setup.
Actionable but governed by invalidation levels.
URNM wins the Nuclear Energy category despite a disastrous 22 composite score and -12.5% 13-week return—the category itself is broken—because NLR's thin participation (0.50x below 20W average) fails to confirm accumulation at higher prices. URNM's neutral 0.95x volume and better absolute timing (58.0 vs NLR's 95.0, though both are marginal) reflect the reality that uranium miners need institutional support that neither name possesses. URNM's position at -22.1% below the 50W in the near-52W low/repair zone scores 75.0 risk-reward (upside -33% to resistance, downside only 6.3% to support), making it the least bad entry. Its 4.2% momentum confirmation (destroyed by -12.5% 13W return and -7.9% SPY-relative) is nearly worthless, but NLR's 27% momentum score offers no better evidence of recovery. Both trade on energy scarcity bid (+8 to macro), but liquidity stress (-8) and risk appetite broken (-4 to category) mean this is borrowed time.
Nuclear Energy received 5% as a tier-2 allocation despite technical and momentum scores that rank among the portfolio's weakest, reflecting a pure macro conviction play. The category macro fit of 48.0 benefits from active energy scarcity (+9) and defensive rotation signals, but these are overwhelmed by liquidity stress (-7) and risk appetite broken (-4). URNM's -12.5% 13-week return and sub-200W positioning make this a capitulation trade—buyers are punished for holding, yet the 5% allocation stakes a claim on the energy-security narrative and regulatory support for nuclear capacity expansion. The allocation is defensive hedge rather than tactical opportunity; it is held in case a macro shock reverses the current liquidation, not because momentum or breadth support a rebound. Any break below the 33.36 support would likely result in allocation reduction, whereas confirmation above 52.89 resistance would be required to earn top-2 consideration, neither of which is likely given current tape and macro conditions.
Technology — CIBR
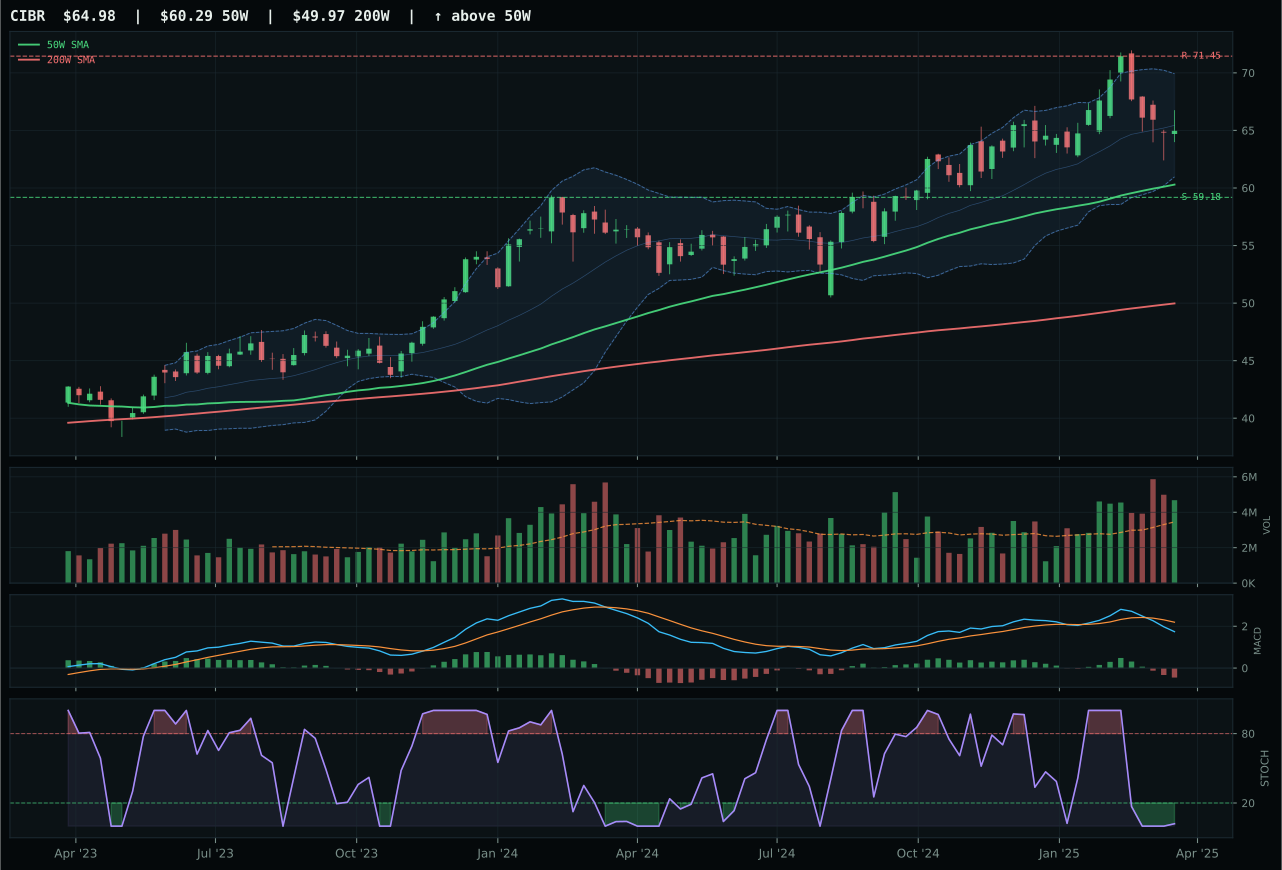
CIBR has a neutral structure profile with 6.1% 13-week relative strength versus SPY.
A failed hold above support would weaken the setup.
Actionable but governed by invalidation levels.
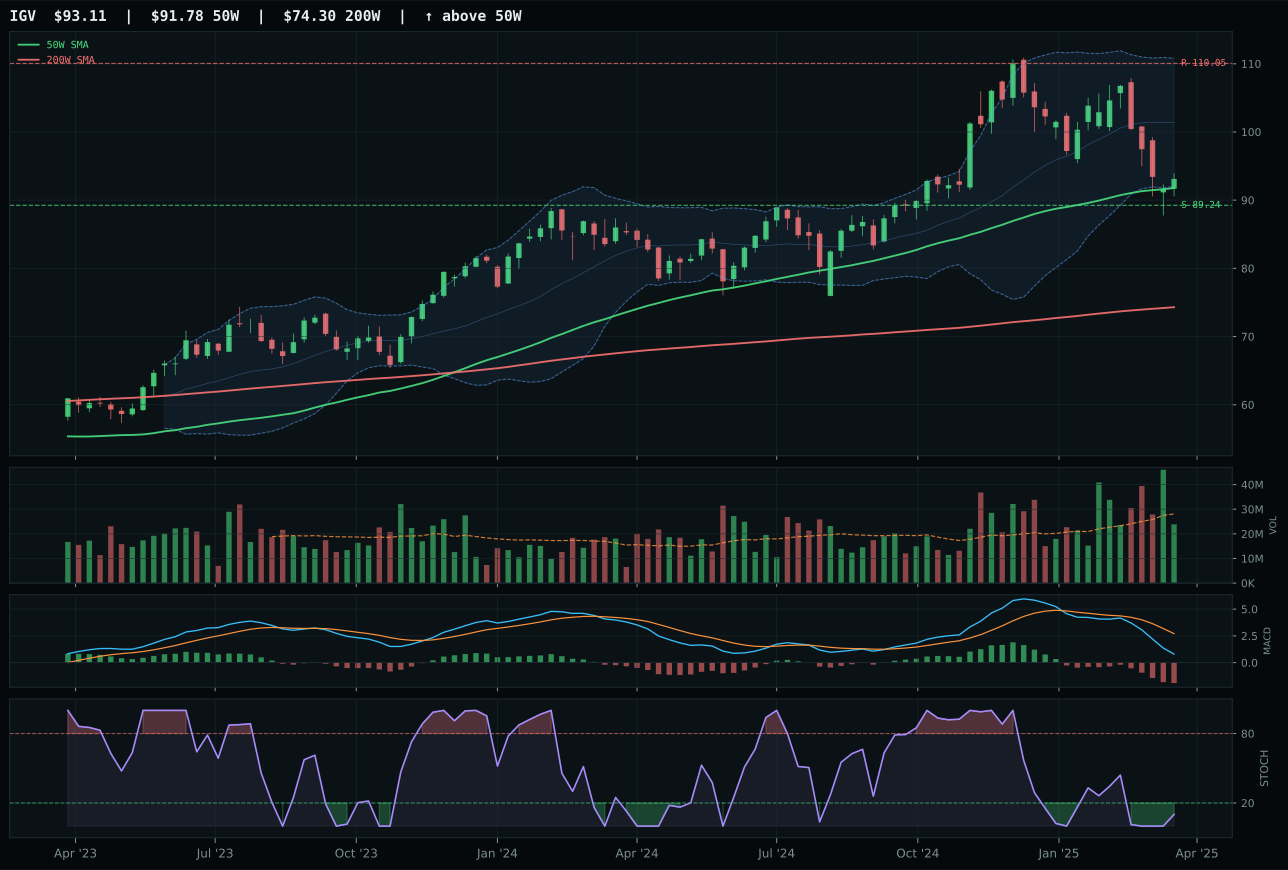
IGV has a pullback into support profile with -5.5% 13-week relative strength versus SPY.
A failed hold above support would weaken the setup.
Actionable but governed by invalidation levels.
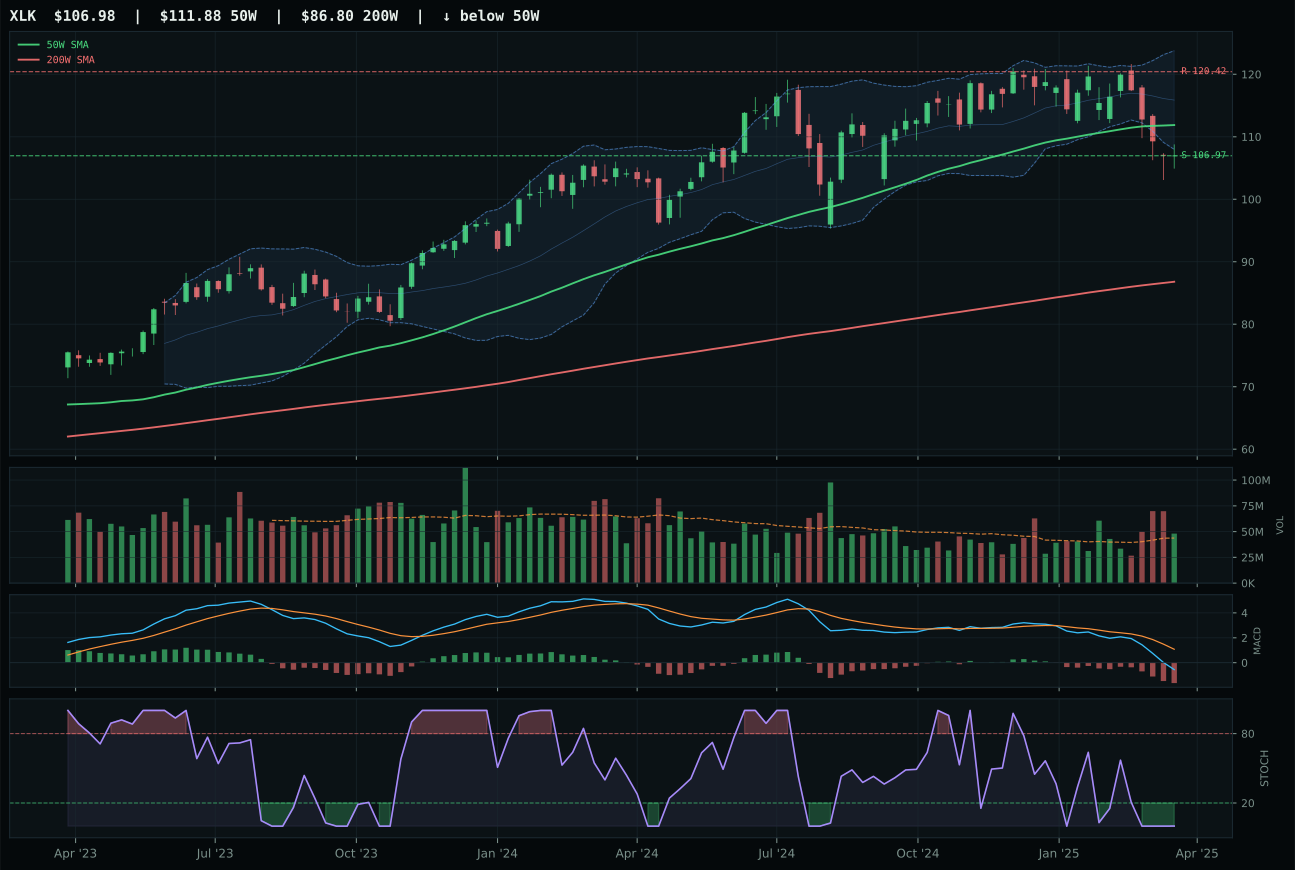
XLK has a pullback into support profile with -4.7% 13-week relative strength versus SPY.
A failed hold above support would weaken the setup.
Actionable but governed by invalidation levels.
CIBR wins by capturing cybersecurity's steadier technical posture within a deteriorating Tech category. The 10.8% relative strength versus its three-ETF median and 6.1% outperformance of SPY signal that this niche is retaining buyer interest where broader Tech is not; MACD is bearish but the stochastic RSI at 0.02 sits in oversold turn-up territory, creating a defined short-term inflection point. Price sits 7.8% above the 50-week moving average with neutral structure and above-average 1.35x volume participation, establishing the preconditions for a test of the 71.45 resistance without the extension penalties that plague extended names. IGV lost the decision despite a perfect 100 timing score because its enterprise software positioning generated -5.5% SPY relative strength and -0.8% category-relative strength; neutral volume and a cleaner deterioration in structure (67.1 vs CIBR's 73.5) meant the MACD bearish signal was less offset by accumulation evidence.
Technology earned 5% allocation as a tier-2 holding despite a final score of 31.3—well below the top-2 threshold. The category's rank among all ten reflects the macro tension between defensiveness (which favors cyclicals shifting lower) and the current Transition/Mixed regime, where liquidity stress active flag penalizes growth-sensitive software and hardware. Category-level macro fit sits at 40.0, dragged down primarily by active liquidity stress (-10), which creates friction for the capital-intensive, duration-sensitive bets that dominate Tech. The 5% allocation preserves exposure to CIBR's relative strength without overcommitting to a category losing conviction week-over-week; any sustained improvement in breadth or volume participation from the broader three-ETF basket would be required to push Technology into tier-1 contention.
AI — AIQ
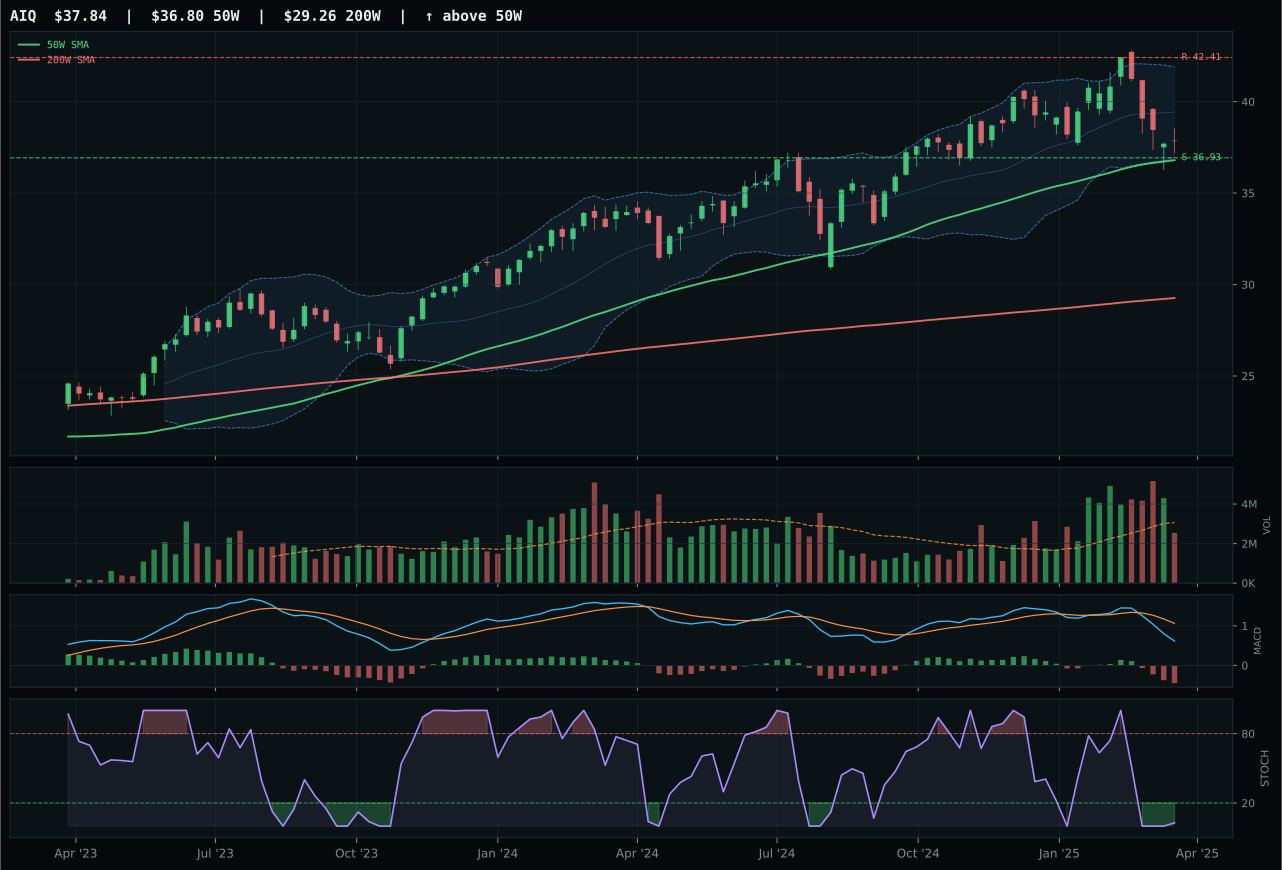
AIQ has a pullback into support profile with 1.0% 13-week relative strength versus SPY.
A failed hold above support would weaken the setup.
Actionable but governed by invalidation levels.
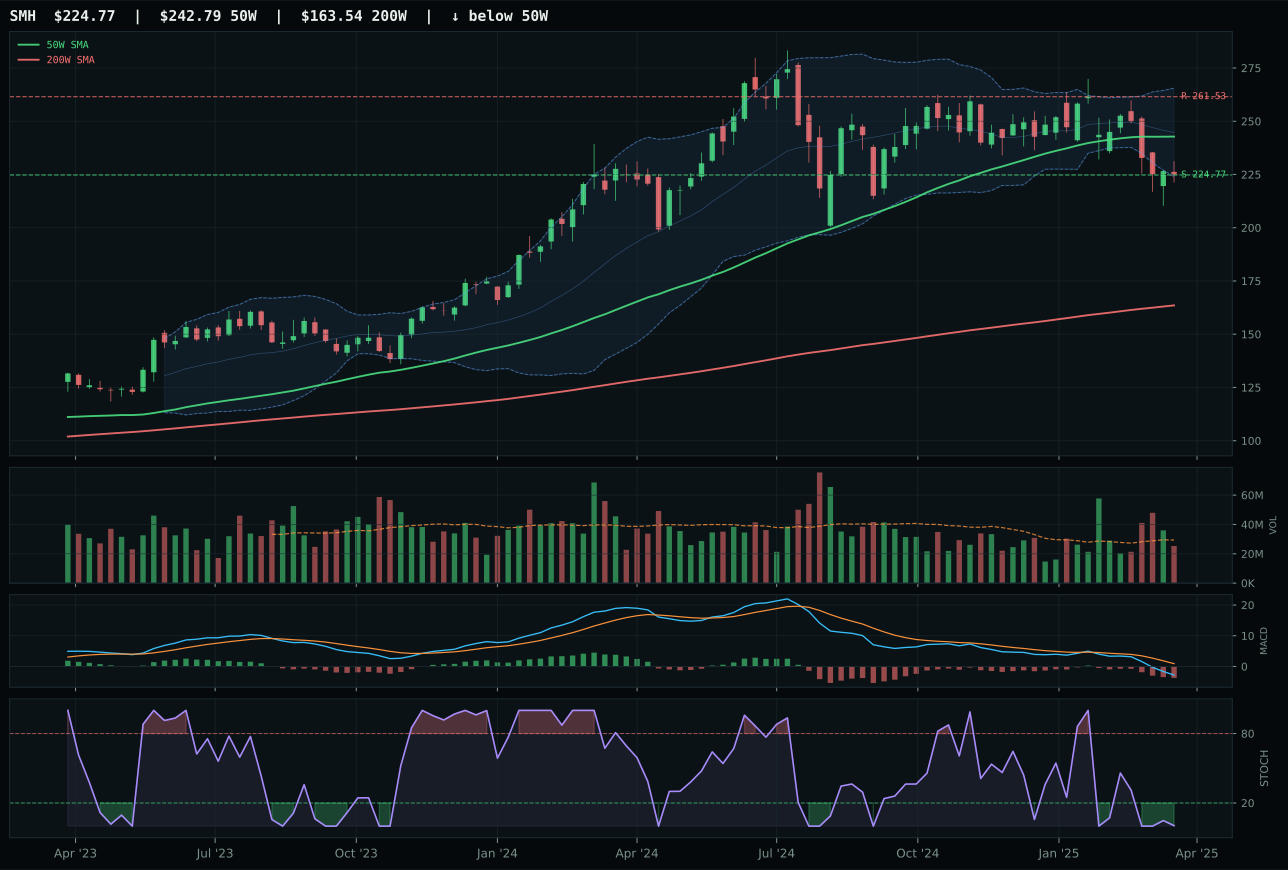
SMH has a pullback into support profile with -2.8% 13-week relative strength versus SPY.
A failed hold above support would weaken the setup.
Actionable but governed by invalidation levels.
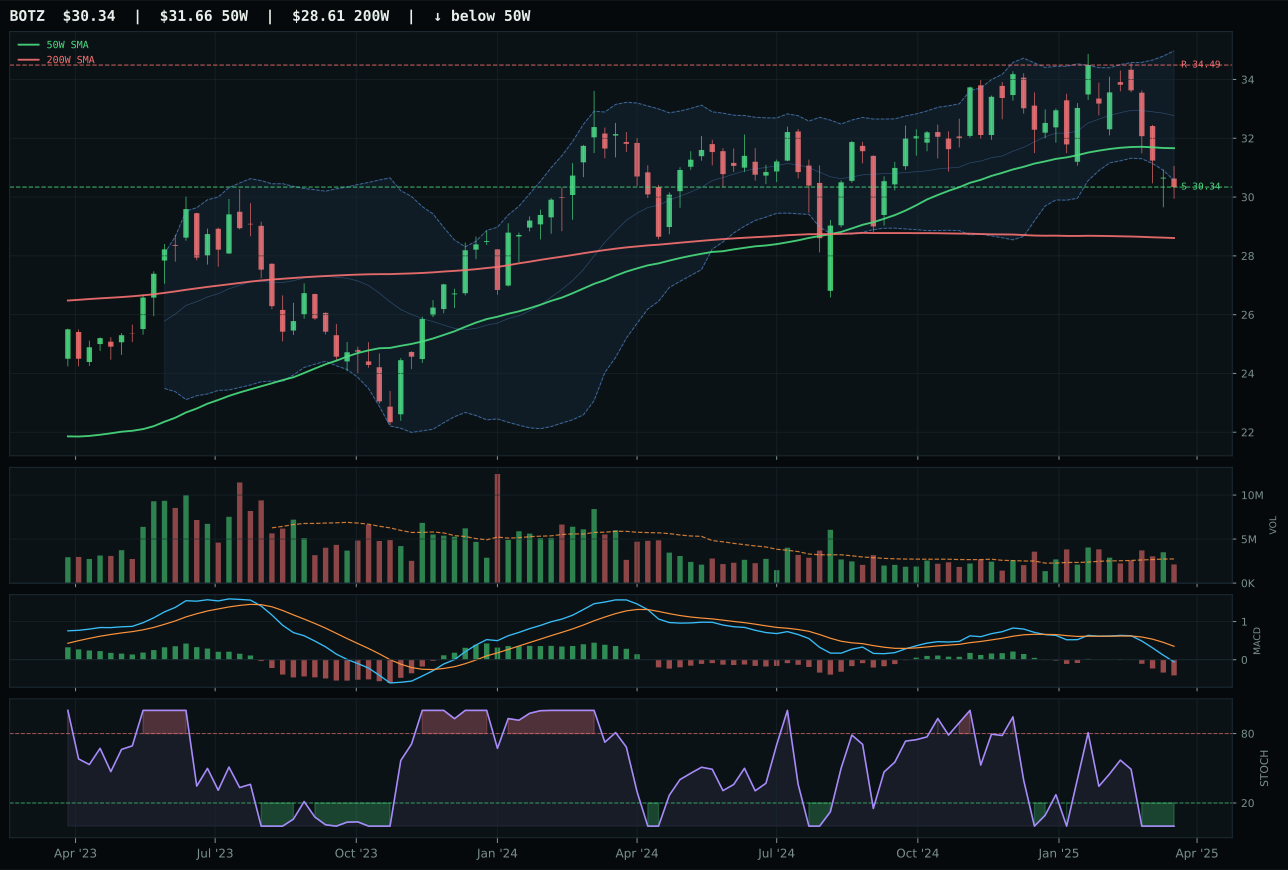
BOTZ has a pullback into support profile with -1.4% 13-week relative strength versus SPY.
A failed hold above support would weaken the setup.
Actionable but governed by invalidation levels.
AIQ wins by offering the most defensible mean-reversion setup in a category under heavy macro pressure. The chart is pulling into the 36.93 support level with only 2.8% distance to the 50-week average, creating a low-risk invalidation area; stochastic RSI sits at 0.03 in oversold turn-up while MACD remains bearish/weakening, establishing timing synchronization despite the -3.6% 13-week return. The 2.4% category-relative strength and 1.0% SPY relative strength are modest but defensible given the 98.0 risk/reward score—AIQ offers 2.5% downside to support and -10.8% upside to the 42.41 resistance, a 4:1 asymmetry in favor of buyers near these levels. SMH failed to close because its -2.8% SPY relative strength and -1.4% category lagging, combined with weaker 84.6 risk/reward and deeper 0.618 Fibonacci positioning, signaled that semiconductor leadership had already deteriorated into the value zone without the breadth to anchor a meaningful rebound.
AI drew 5% allocation as a tier-2 category with a final score of 22.6, ranking below the top-2 cutoff due to twin headwinds: technical evidence of only 48.1/100 (driven by collapsing momentum confirmation at 28.3 and thin volume-price sponsorship) and category-level macro fit of just 30.0/100. Active liquidity stress (-12) and broad market bear (-8) combine to make AI a growth play that fights the current macro regime; risk appetite broken (-7 at the SMH level) further reinforces that this category is being sold into weakness rather than accumulated. The 5% reflects a holding pattern—enough exposure to participate if mean reversion accelerates, but not so much capital that the allocator is betting against the active macro headwinds. For AI to earn top-2 status, volume participation would need to shift from neutral to above-average participation and category-relative strength would need to close above the median; neither signal is present this week.
Industrial Metals — COPX
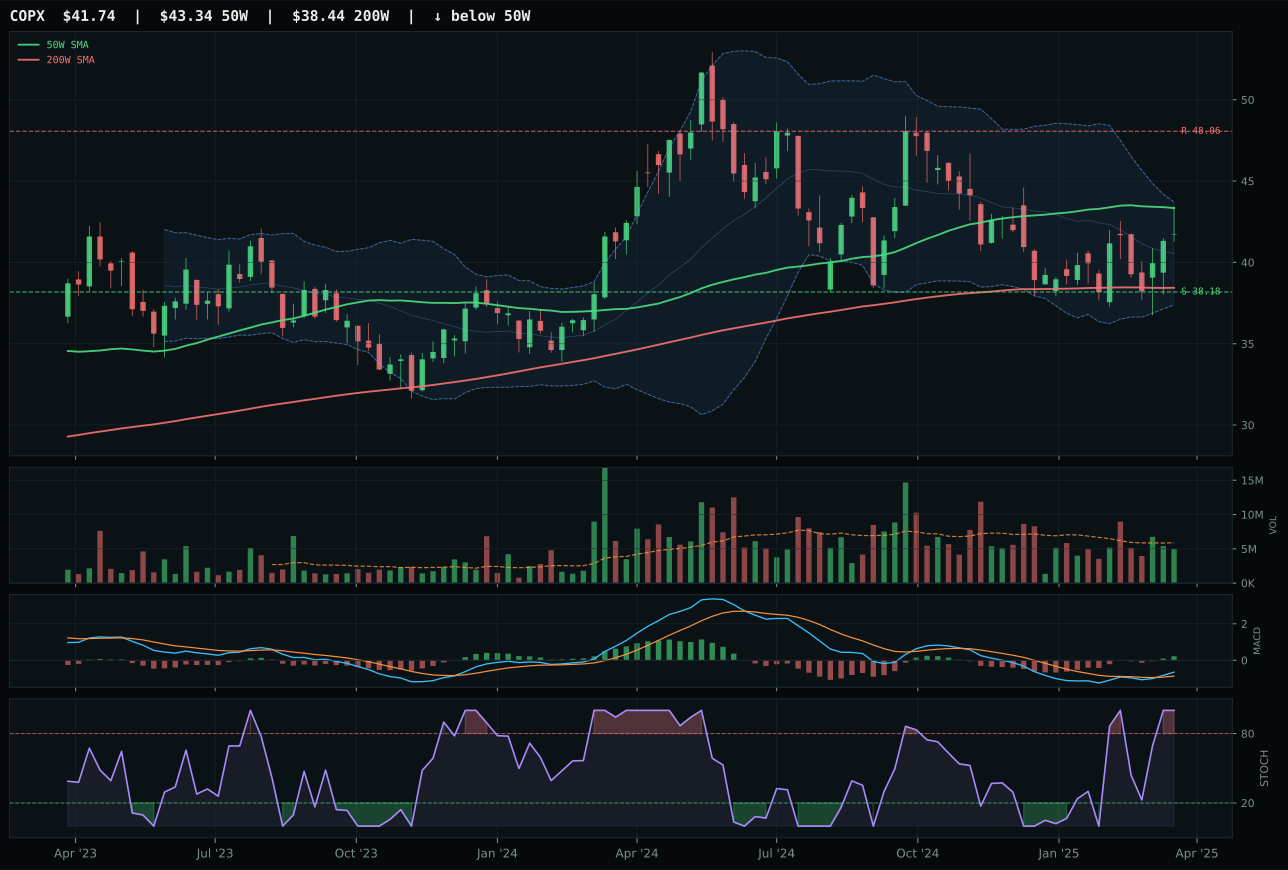
COPX has a neutral structure profile with 11.9% 13-week relative strength versus SPY.
A failed hold above support would weaken the setup.
Actionable but governed by invalidation levels.
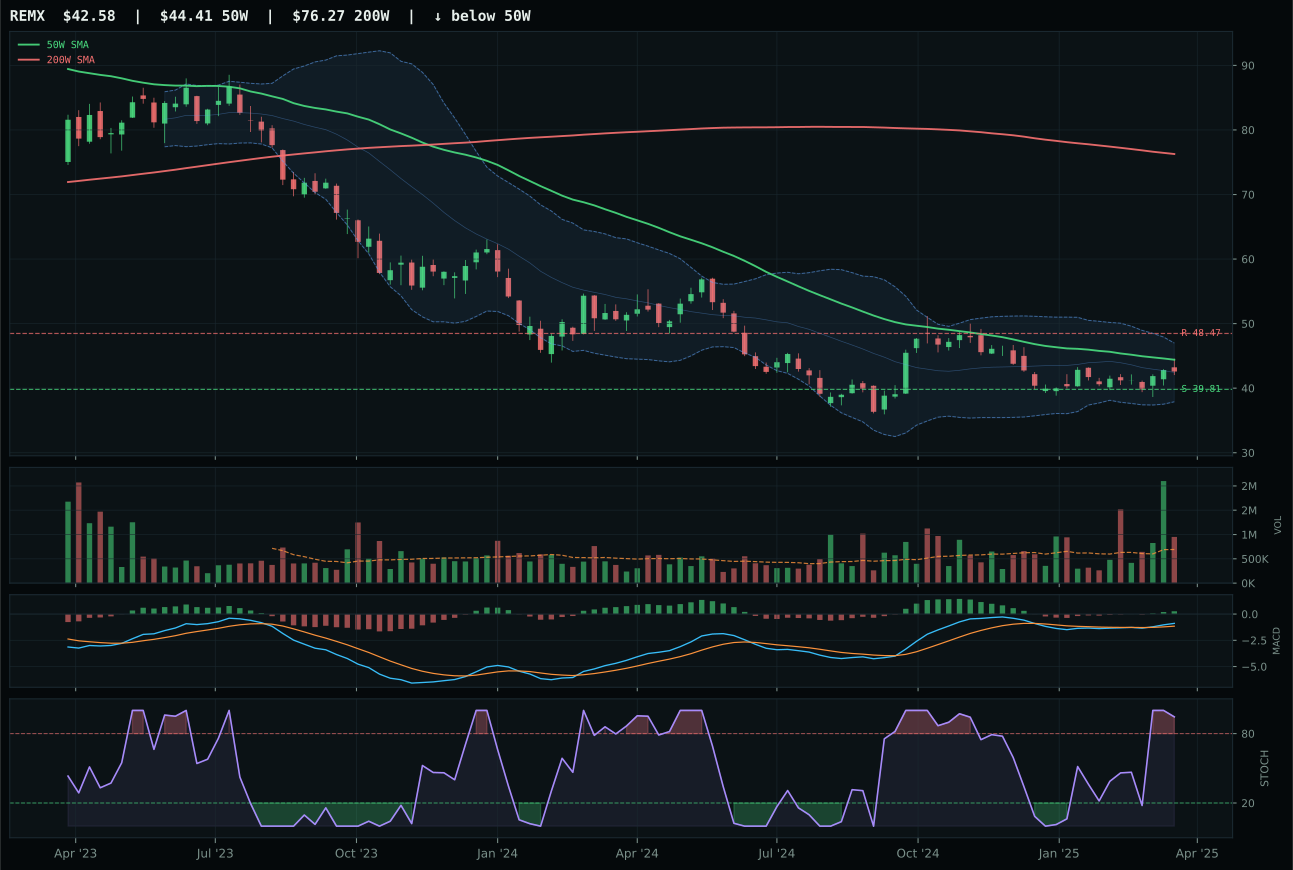
REMX has a neutral structure profile with 10.0% 13-week relative strength versus SPY.
Extension and support failure are the main tactical risks.
Tracked, but not top-2 eligible because: structurally broken.
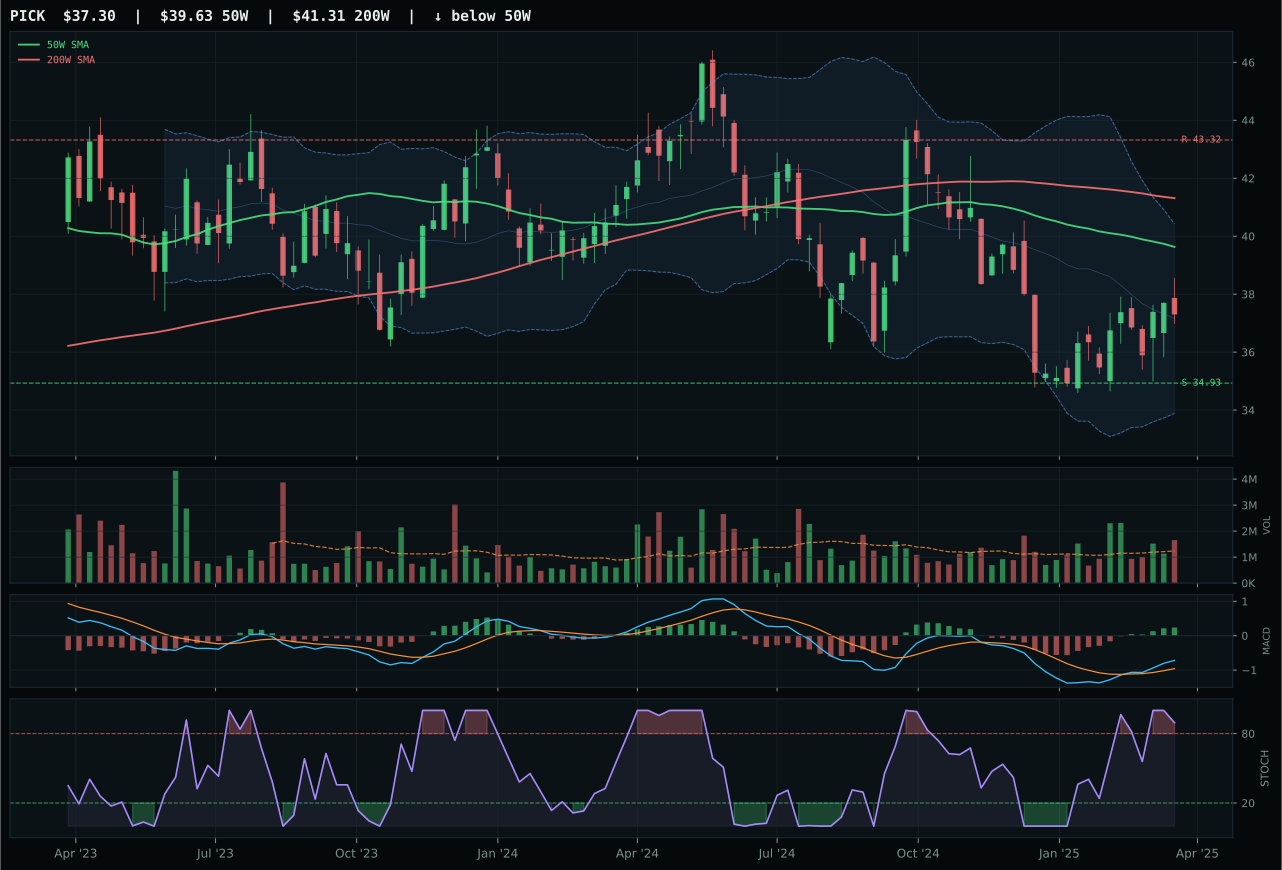
PICK has a neutral structure profile with 10.3% 13-week relative strength versus SPY.
Extension and support failure are the main tactical risks.
Tracked, but not top-2 eligible because: structurally broken.
COPX wins Industrial Metals with a 72.7 reasoned ETF score because its 11.9% SPY-relative strength and 1.6% category-relative edge prove copper exposure is accumulating despite price sitting 3.7% below the 50W. This pullback setup is exactly what a recovery trade requires: buyers defending a slightly lower level without capitulating. COPX's 97.0 timing score (the highest in its category) reflects positioning in the deep retracement/value zone near Fib 0.618 at 42.94, where downside to support is 9.3% and upside to resistance is 13.2%—favorable asymmetry for entry. MACD bullish and improving with stochastic RSI at 1.00 (overbought momentum) confirms buyers are returning. REMX's 52.1-point gap reveals miners are structurally broken (hard filter triggered) with neutral volume despite 10.0% SPY-relative strength, exposing it as a short-lived bounce without institutional follow-through.
Industrial Metals received 5% as a tier-2 allocation with a final score of 20.6, ranking well below the top-2 pair but securing a modest exposure slot. The category macro fit of 42.0 reflects active liquidity stress (-8), which penalizes mining and commodity leverage; however, COPX's 85.7 technical evidence (the strongest in its three-ETF basket) and 97.0 timing score provide enough tactical merit to justify holding. The sector is not outrunning defensives or monetary hedges, and risk appetite broken is active elsewhere, but copper's supply scarcity narrative and COPX's clean pullback structure offer a tactical rebalancing point if support holds. The 5% is a position-sizer's allocation—enough to participate in the mean-reversion setup without betting heavily on metals outperforming the current macro regime. For Industrial Metals to earn top-2 status, the sector would require COPX to break above the 48.06 resistance on volume expansion with SPY relative strength widening above 15%; neither condition exists this week.
Emerging Markets — IEMG
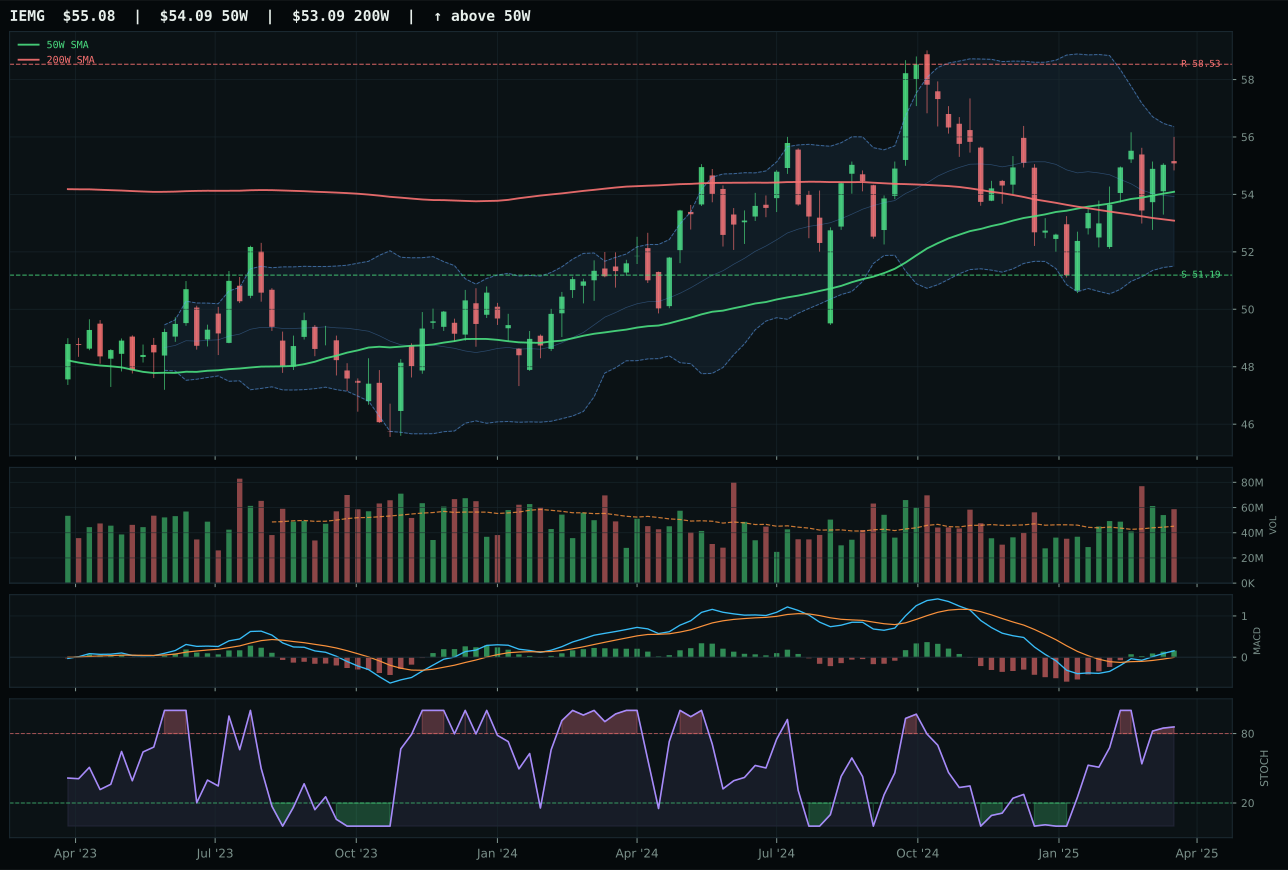
IEMG has a compression near 50W profile with 9.2% 13-week relative strength versus SPY.
A failed hold above support would weaken the setup.
Actionable but governed by invalidation levels.
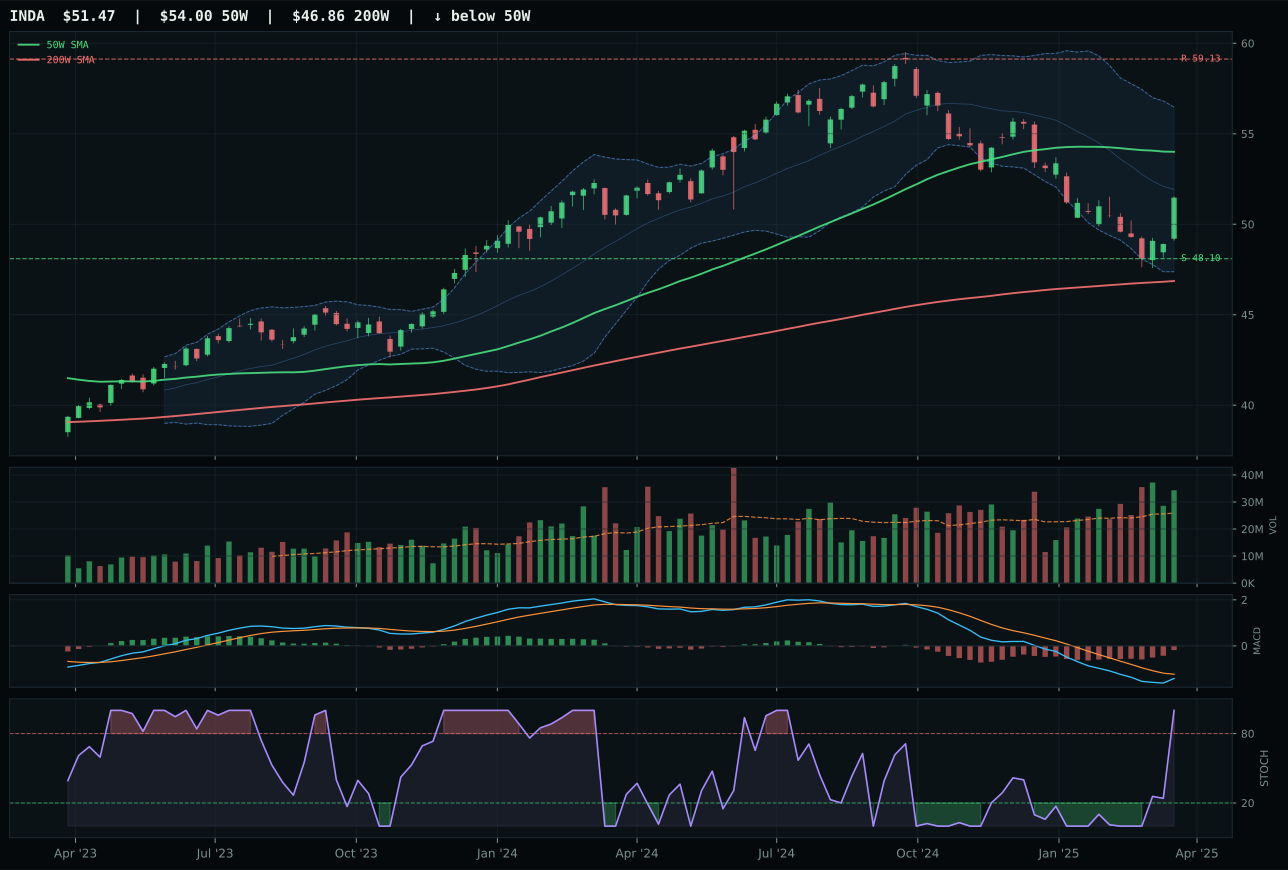
INDA has a neutral structure profile with 0.9% 13-week relative strength versus SPY.
A failed hold above support would weaken the setup.
Actionable but governed by invalidation levels.
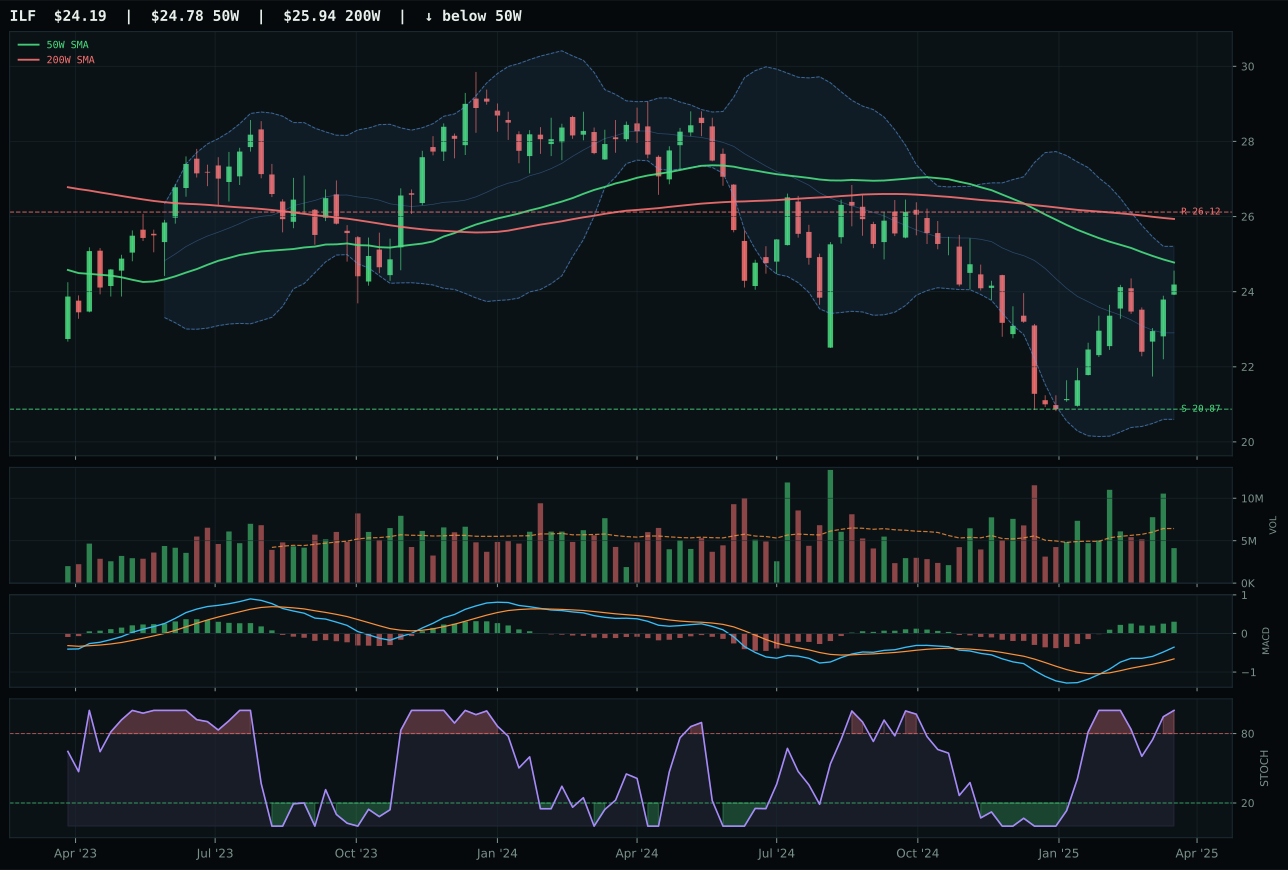
ILF has a compression near 50W profile with 18.3% 13-week relative strength versus SPY.
Extension and support failure are the main tactical risks.
Tracked, but not top-2 eligible because: structurally broken.
IEMG captures Emerging Markets with an 84.0 technical evidence score and 92 composite because compression near the 50W (just 1.8% away) combined with bullish-improving MACD and 1.30x above-average volume proves institutional buyers are defending this level in a regime where most risk assets are melting. 9.2% SPY-relative strength and 100.0 timing score reflect perfect entry geometry. INDA's 29.3-point composite gap reveals why it lost: MACD is bearish but improving (weaker than IEMG's bullish improvement), structure is less clean (70.8 vs IEMG's 80.3), and category-relative strength collapsed to -8.2% versus IEMG's 0.0%. INDA's -3.7% 13-week return signals underperformance even within a weak category. IEMG's compression setup with overbought stochastic 0.86 and above-average volume suggests a springloaded bounce, not a squeeze flush; if support 51.19 holds, resistance 58.53 is achievable.
Emerging Markets received 0% allocation and ranks 9th or 10th, excluded entirely despite IEMG's portfolio-leading 84.0 technical evidence score. The category macro fit of 31.0 is crushed by active liquidity stress (-10) and broad market bear (-9), which are powerful enough to override even perfect chart technicals; the Transition/Mixed regime offers no tailwind to growth-sensitive equities. While IEMG's compression near the 50-week and bullish MACD present a textbook mean-reversion setup, the macro environment is rotating capital away from emerging-market beta toward defensive durables, monetary hedges, and domestic value. For Emerging Markets to earn even a 5% allocation, the category would require a sustained reversal in the liquidity stress and broad market bear descriptors—a shift that would require deterioration in risk appetite or a policy pivot that is not evident in the current tape. IEMG remains a watch-list name for tactical rotation into, but the portfolio's macro regime does not support capital allocation to this category this week.
Agriculture & Livestock — VEGI
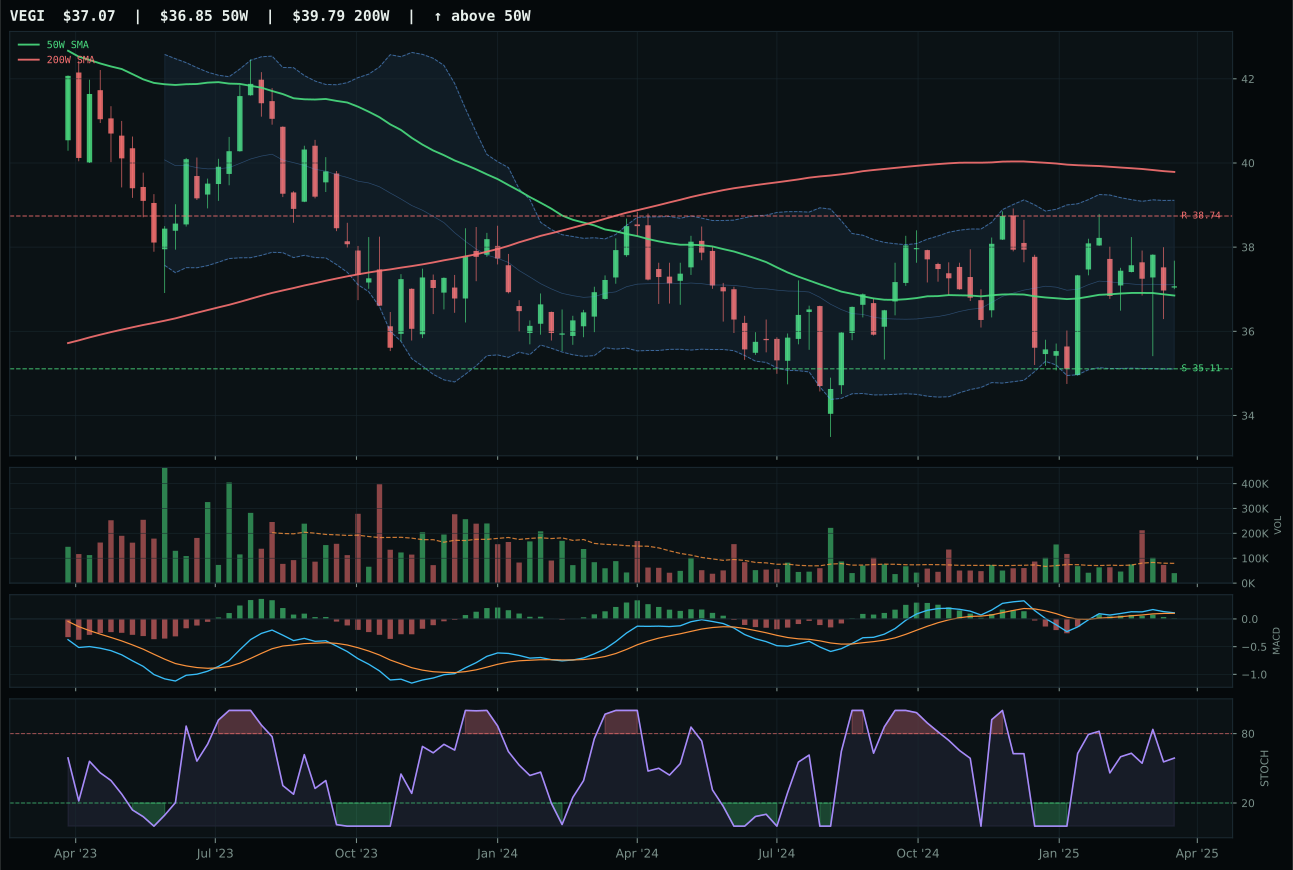
VEGI has a compression near 50W profile with 8.7% 13-week relative strength versus SPY.
A failed hold above support would weaken the setup.
Tracked, but not top-2 eligible because: .
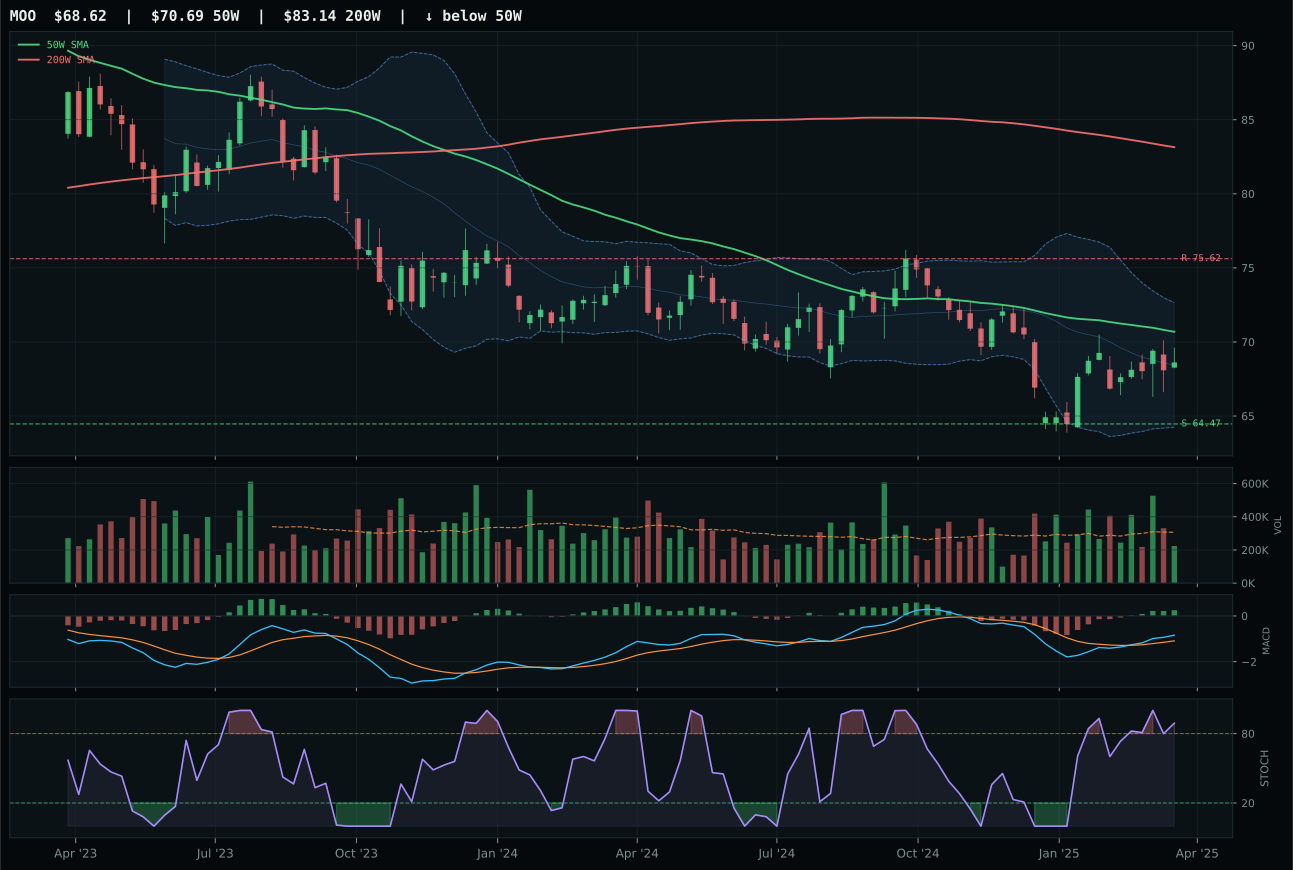
MOO has a compression near 50W profile with 7.1% 13-week relative strength versus SPY.
Extension and support failure are the main tactical risks.
Tracked, but not top-2 eligible because: structurally broken.
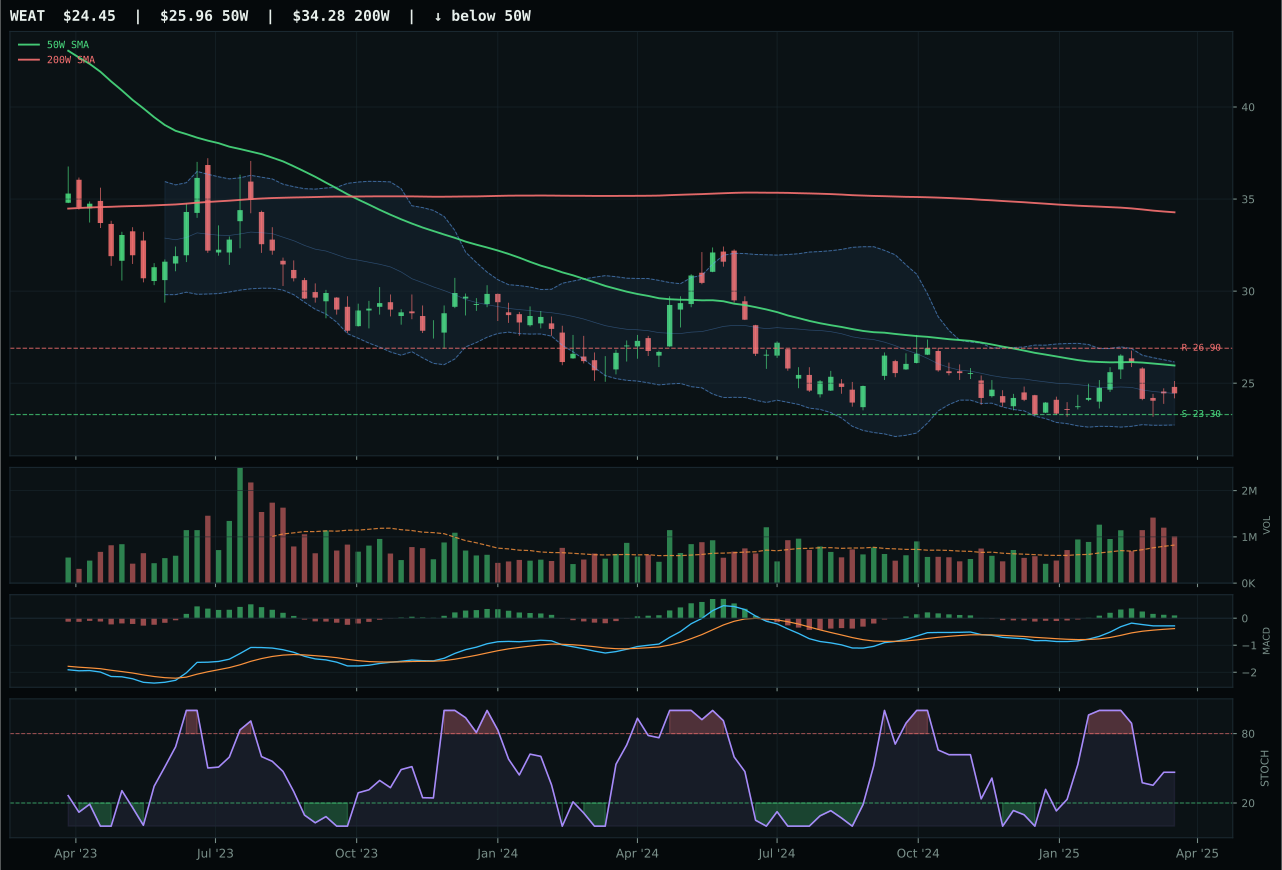
WEAT has a pullback into support profile with 9.5% 13-week relative strength versus SPY.
Extension and support failure are the main tactical risks.
Tracked, but not top-2 eligible because: structurally broken.
VEGI claims the Agriculture category despite a meager 16.2 final score because MOO's structure scored 45.6 versus VEGI's 72.8—a 27-point chasm driven by stochastic RSI overbought momentum (problematic for continuation) and weaker MACD confirmation. VEGI's bullish-but-flattening MACD and rising mid-zone stochastic at 0.59 suggest a deceleration into compression rather than a momentum flush. Price sits just 0.6% above the 50W in maximum compression (82.4 compression score), which means both upside expansion and downside penetration are equally likely; MACD flattening removes upside bias. MOO's overbought stochastic and stronger MACD improvement look appealing until you note the structure hard filter flagged the setup as structurally broken—a disqualifying signal. VEGI's 100.0 timing score rewards proximity to the 50W, but the setup is a coin flip without volume sponsorship; participation sits at thin 0.50x levels.
Agriculture & Livestock received 0% allocation and ranks 9th or 10th among the ten categories, excluded entirely from the portfolio this week. The final score of 16.2 reflects a category that failed eligibility filters, likely due to the combination of weak technical evidence (45.0) and poor macro fit (47.0). Active liquidity stress (-4) penalizes an already-illiquid sector, and the Transition/Mixed regime offers no tailwind; broader market bear and defensive rotation are active elsewhere, leaving Ag without a structural bid. The thin volume participation (VEGI at 0.50x) confirms that the sector is not attracting new capital. For Agriculture to earn even a 5% tier-2 slot, the category would require VEGI or MOO to break above the 50-week moving average with volume expansion above 1.20x participation, paired with a rotation away from liquidity-stress conditions—neither is likely given current macro conditions. The sector is simply outside the allocation envelope this week.