
2025-03-14
Informational purposes only. The content in this report, including allocations, analysis, and commentary, is provided solely for informational and educational purposes. It does not constitute financial advice, investment advice, trading advice, or any other type of advice. Past performance does not guarantee future results. Always conduct your own research and consult a qualified financial professional before making investment decisions.
Weekly Allocation
| Ticker | Category | Weight | Role |
|---|---|---|---|
| FBTC | 50% | Overlay | |
| GLD | Precious Metals | 10% | Top-2 (10%) |
| XLU | Utilities & Infrastructure | 10% | Top-2 (10%) |
| ITA | Defense & Aerospace | 5% | Tier-2 (5%) |
| CIBR | Technology | 5% | Tier-2 (5%) |
| URNM | Nuclear Energy | 5% | Tier-2 (5%) |
| BOTZ | AI | 5% | Tier-2 (5%) |
| COPX | Industrial Metals | 5% | Tier-2 (5%) |
| IEMG | Emerging Markets | 5% | Tier-2 (5%) |
Trade Instructions — Monday Open
Sell the tranche from 2025-02-14 (completing its 4-week hold). Buy the new tranche. Instructions show net portfolio changes — same-asset positions cancel, weight changes show the delta.
| Action | Ticker | Instruction |
|---|---|---|
| SELL | AIQ | Sell 33% of AIQ position (reduce 3.75% → 2.50%) |
| SELL | NLR | Sell 33% of NLR position (reduce 3.75% → 2.50%) |
| BUY | BOTZ | Buy BOTZ — 50.00% of freed cash (adds 1.25% to portfolio) |
| BUY | URNM | Buy URNM — 50.00% of freed cash (adds 1.25% to portfolio) |
Current Portfolio After Trade
Combined holdings across all 4 active tranches. Each tranche is 25% of the portfolio.
| Ticker | % of Portfolio | Weight Bar |
|---|---|---|
| FBTC | 50.00% | |
| GLD | 10.00% | |
| XLU | 7.50% | |
| ITA | 5.00% | |
| CIBR | 3.75% | |
| IEMG | 3.75% | |
| AIQ | 2.50% | |
| NLR | 2.50% | |
| VEGI | 2.50% | |
| BOTZ | 2.50% | |
| IGF | 2.50% | |
| WEAT | 1.25% | |
| XLE | 1.25% | |
| XLK | 1.25% | |
| FCG | 1.25% | |
| URNM | 1.25% | |
| COPX | 1.25% |
Macro Regime — Disinflation
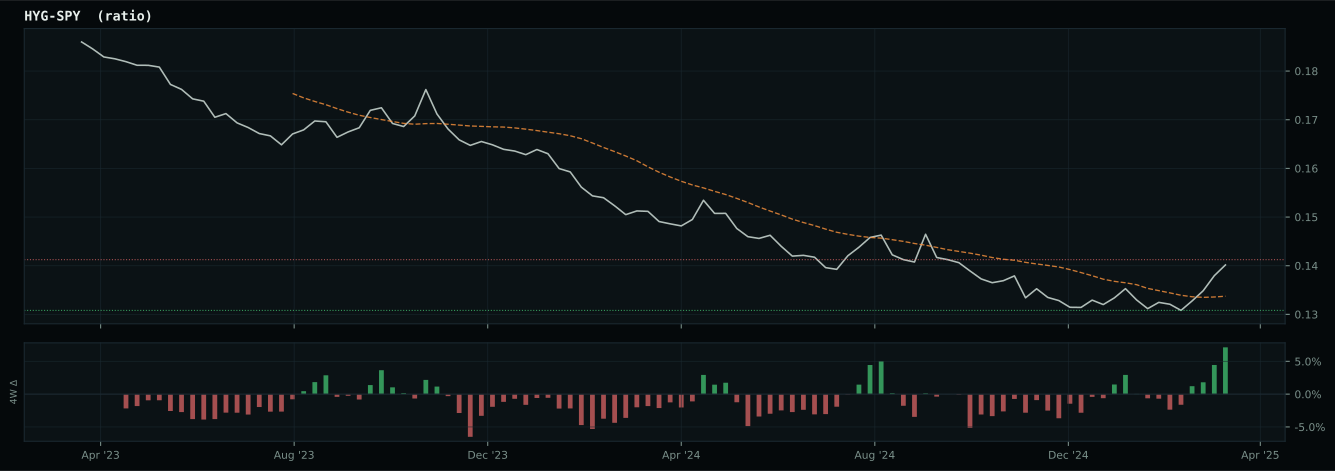
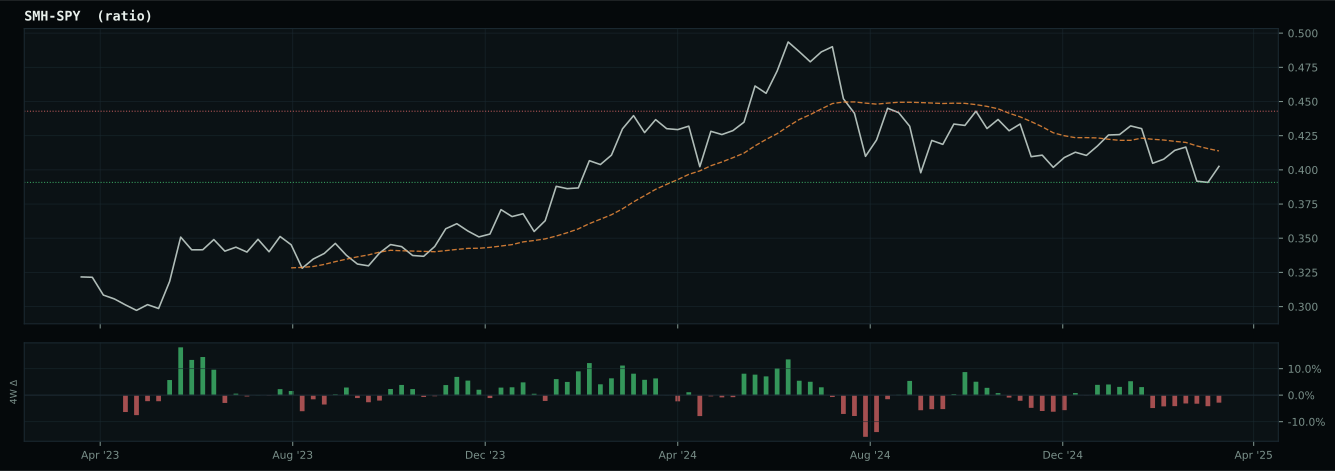
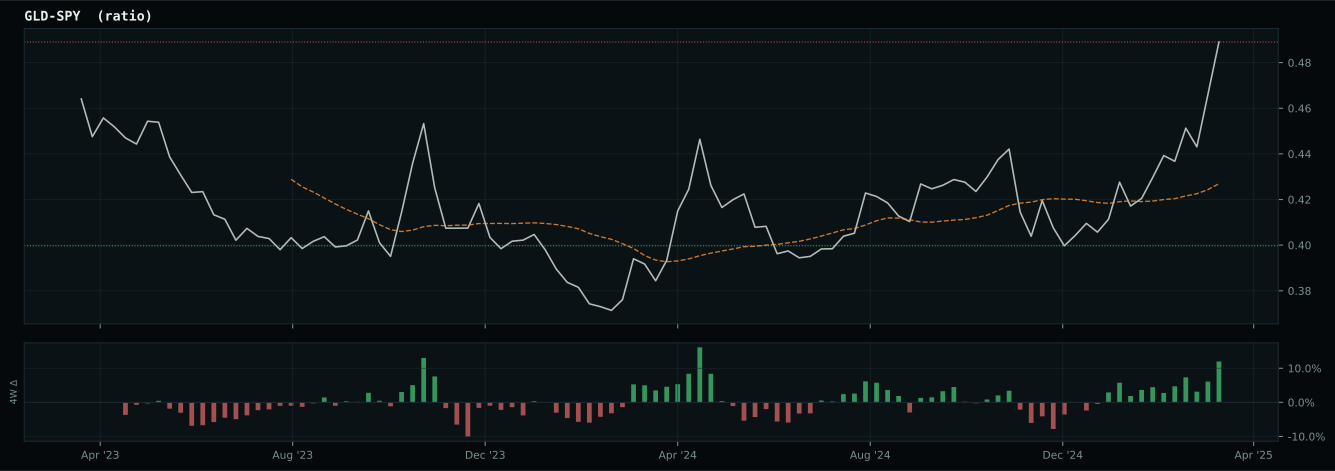
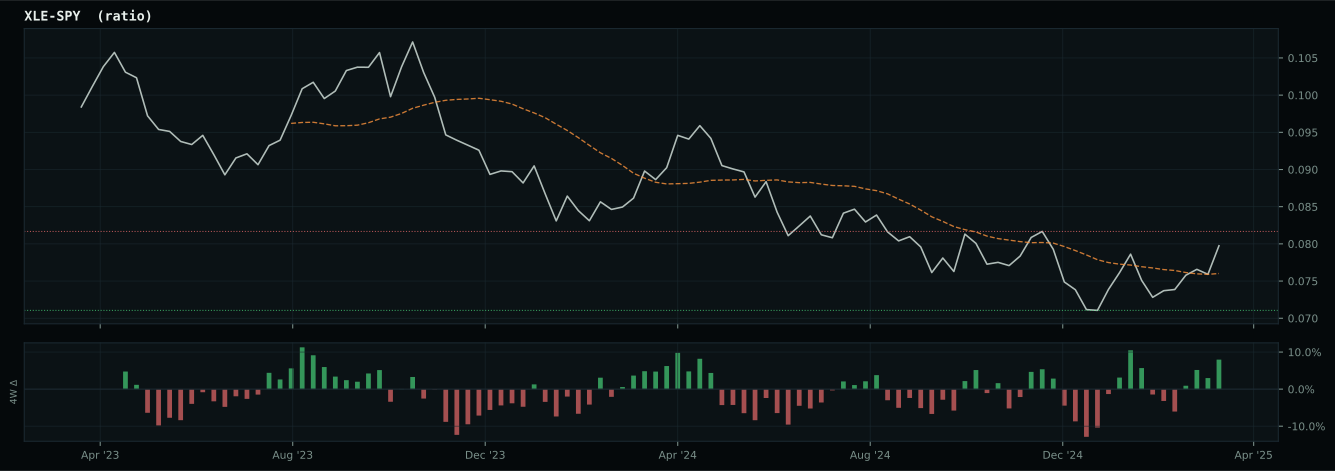
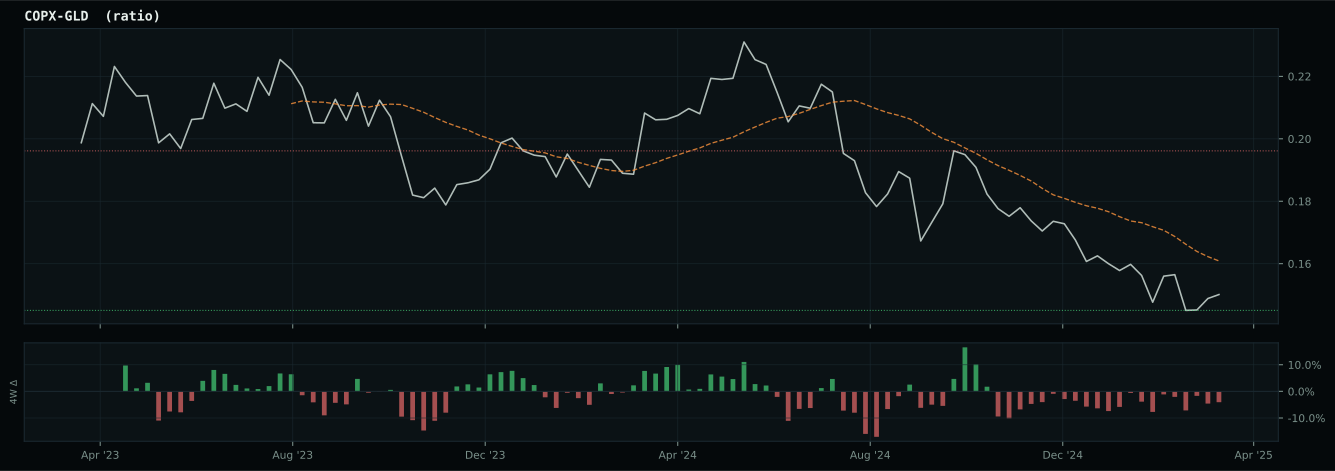
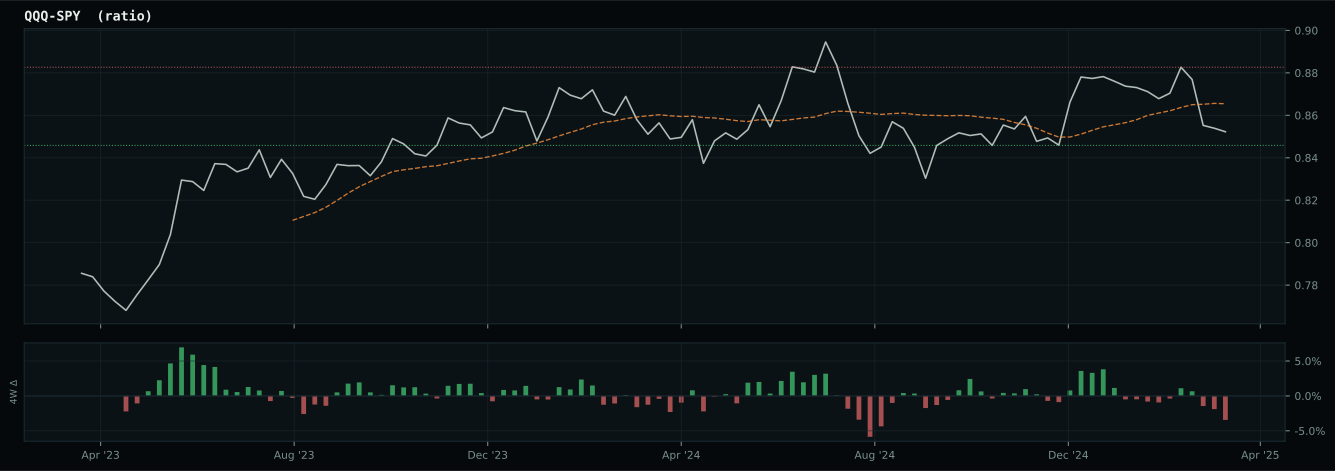
growth data is not confirming the weak market-implied risk appetite signal
Macro Evidence Charts
Market-implied signals behind the macro regime scores. Each ratio compares two assets; the direction and slope of the ratio is what the macro engine reads.
Crypto Regime — TrendBTC
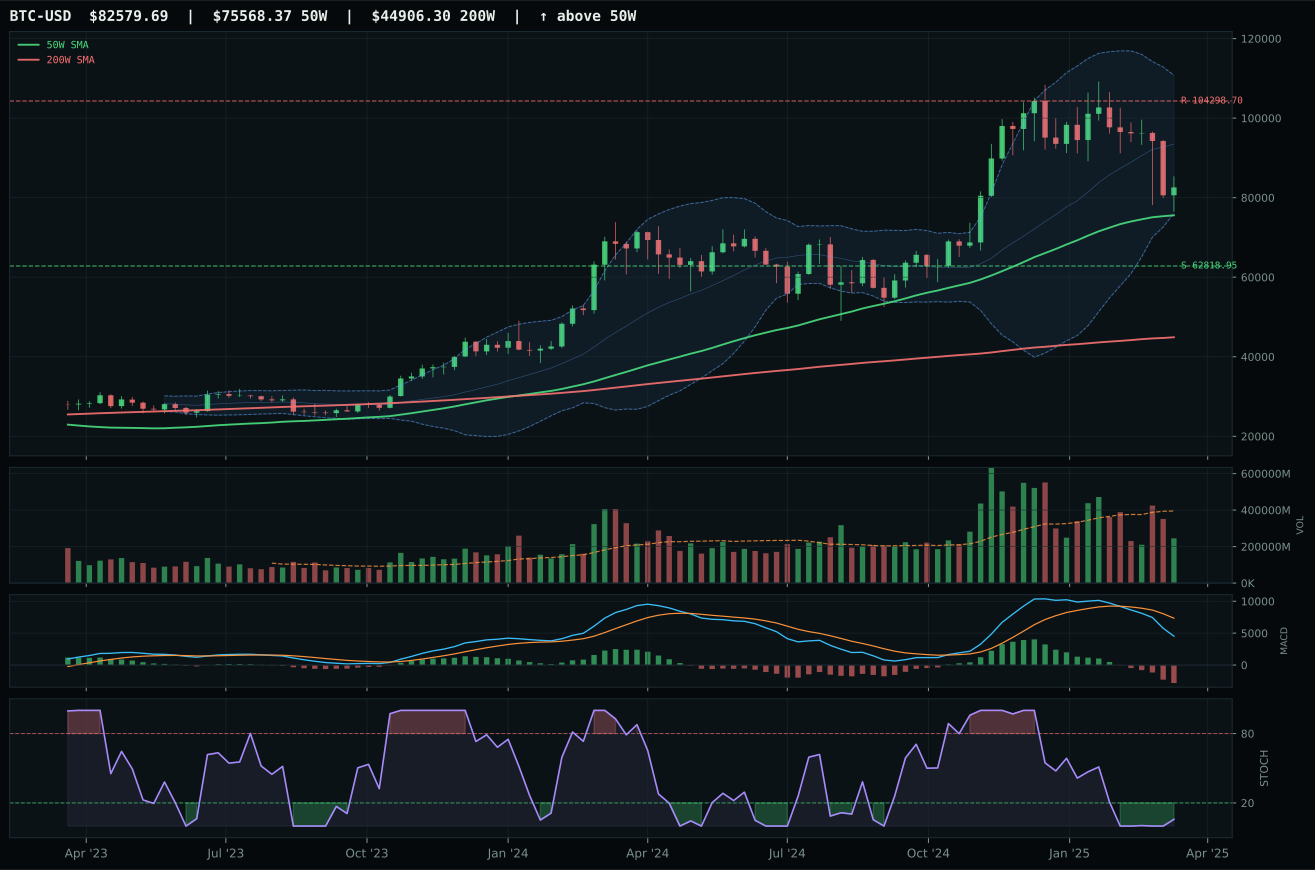
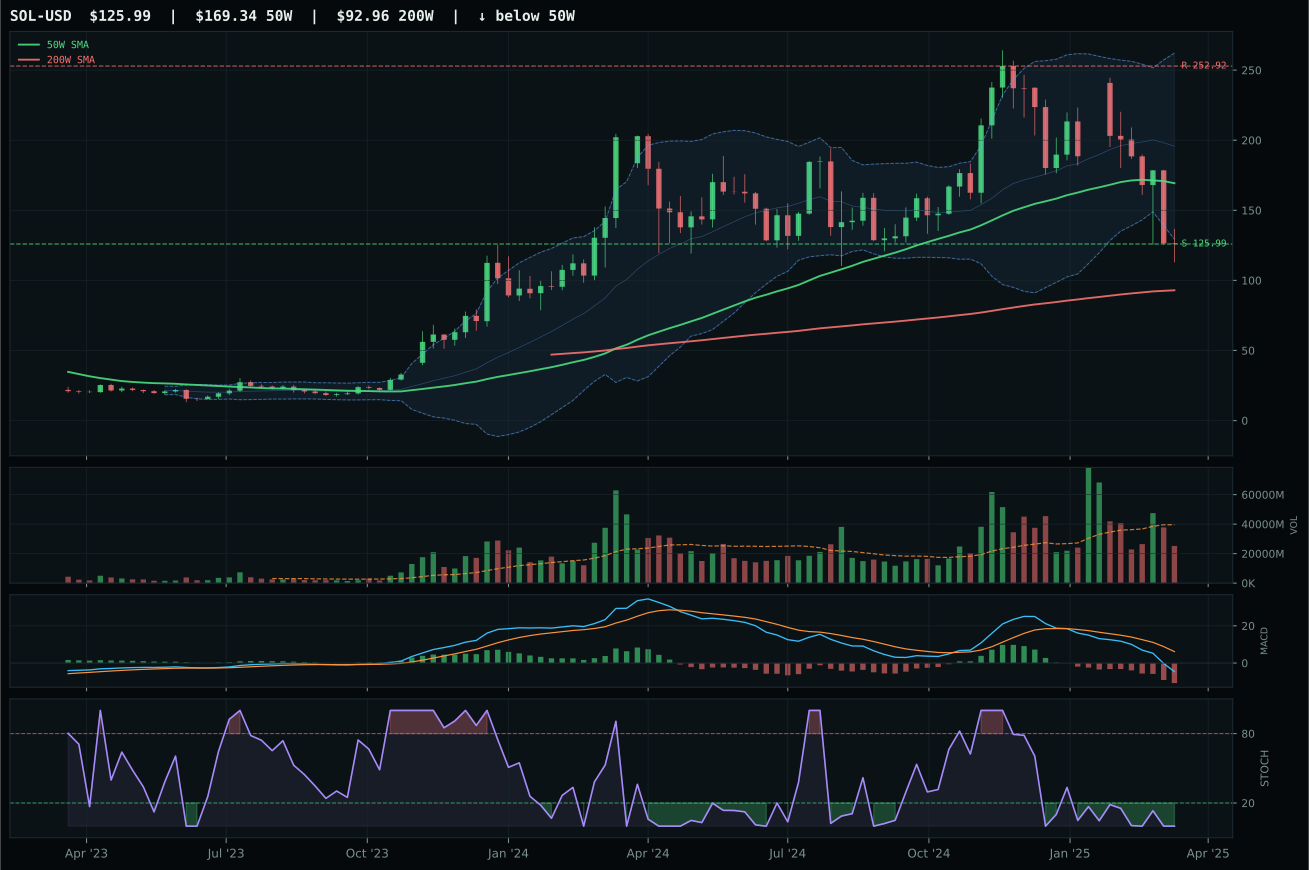
ValueBTC not armed: BTC has not made the first post-breakdown touch of the 200W buy zone after losing the 50W
TrendBTC confirmed: 2 consecutive closes above rising/flat 50W SMA
one or more available conditions failed
Category Rankings
| Rank | Category | Winner | Score | Alloc | 4W Ret | Peers (4W) |
|---|---|---|---|---|---|---|
| 1 | Precious Metals | GLD | 87.0 | 20% | +7.26% | GDX +11.6% · SLV -4.3% |
| 2 | Utilities & Infrastructure | XLU | 60.0 | 20% | -2.45% | IGF +0.5% · PAVE -3.6% |
| 3 | Defense & Aerospace | ITA | 45.3 | 10% | -0.09% | XAR +1.8% · ROKT -2.7% |
| 4 | Technology | CIBR | 35.6 | 10% | -1.61% | XLK -4.3% · IGV -2.4% |
| 5 | Nuclear Energy | URNM | 34.9 | 10% | -5.38% | NLR -2.4% · URA -4.3% |
| 6 | AI | BOTZ | 24.6 | 10% | -10.45% | AIQ -6.7% · SMH -8.7% |
| 7 | Industrial Metals | COPX | 20.5 | 10% | -13.86% | REMX -14.7% · PICK -10.3% |
| 8 | Emerging Markets | IEMG | 18.5 | 10% | -5.60% | INDA +4.4% · ILF -4.3% |
| 9 | Traditional Energy | XLE | 13.1 | 0% | -9.96% | FCG -12.1% · XOP -13.3% |
| 10 | Agriculture & Livestock | VEGI | 0.2 | 0% | -1.27% | MOO -3.7% · WEAT -3.4% |
Precious Metals — GLD
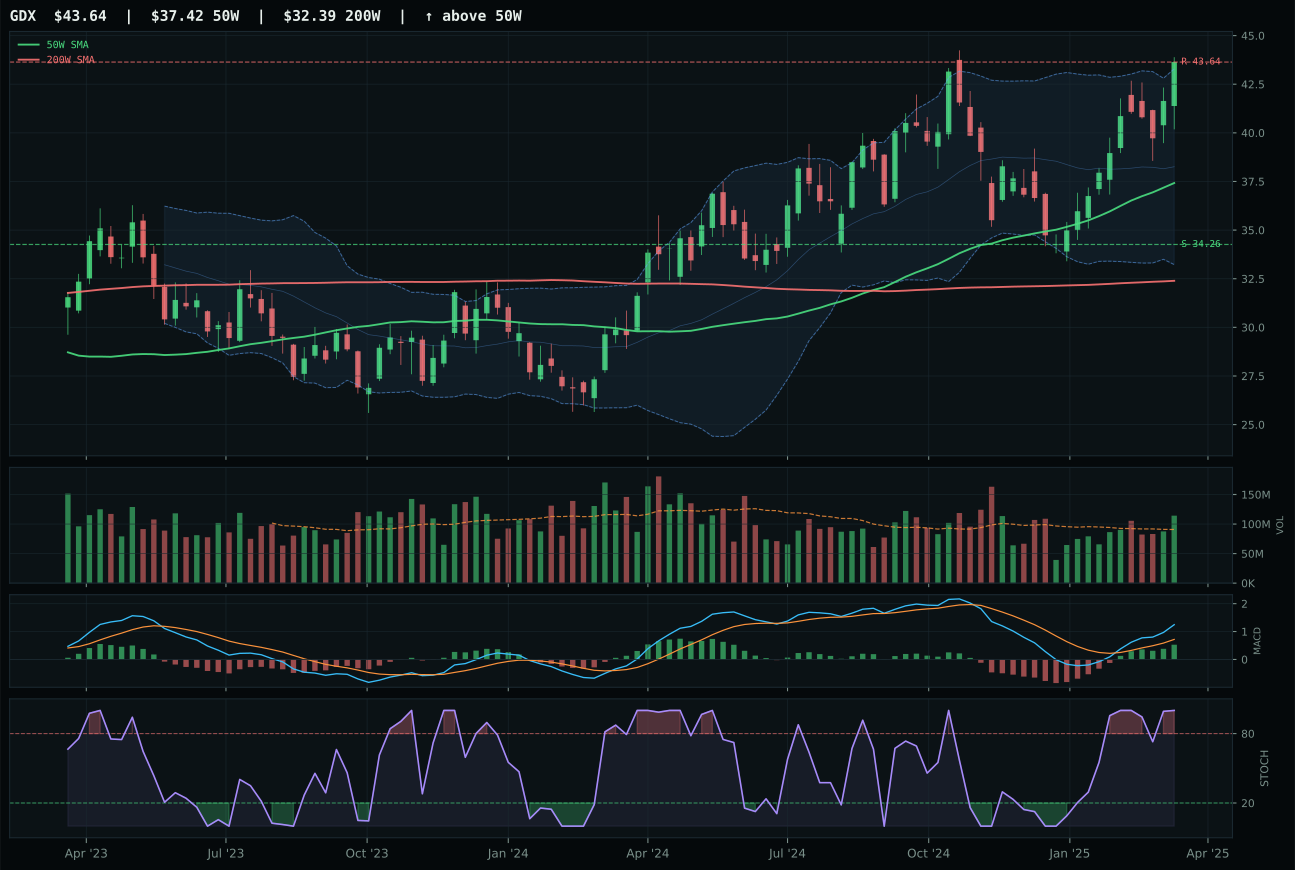
GDX has a vertical extension profile with 25.9% 13-week relative strength versus SPY.
A failed hold above support would weaken the setup.
Actionable but governed by invalidation levels.
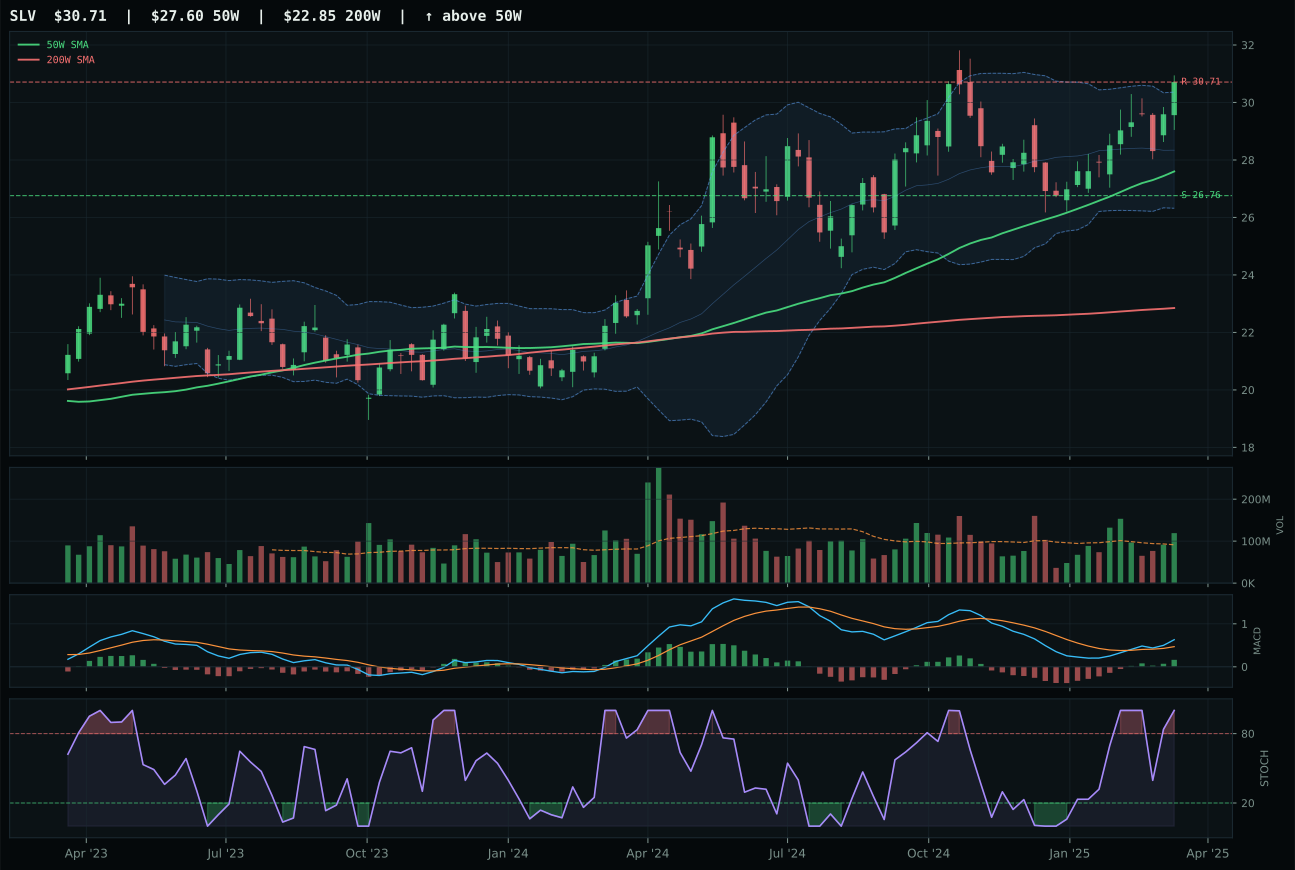
SLV has a neutral structure profile with 17.5% 13-week relative strength versus SPY.
A failed hold above support would weaken the setup.
Actionable but governed by invalidation levels.
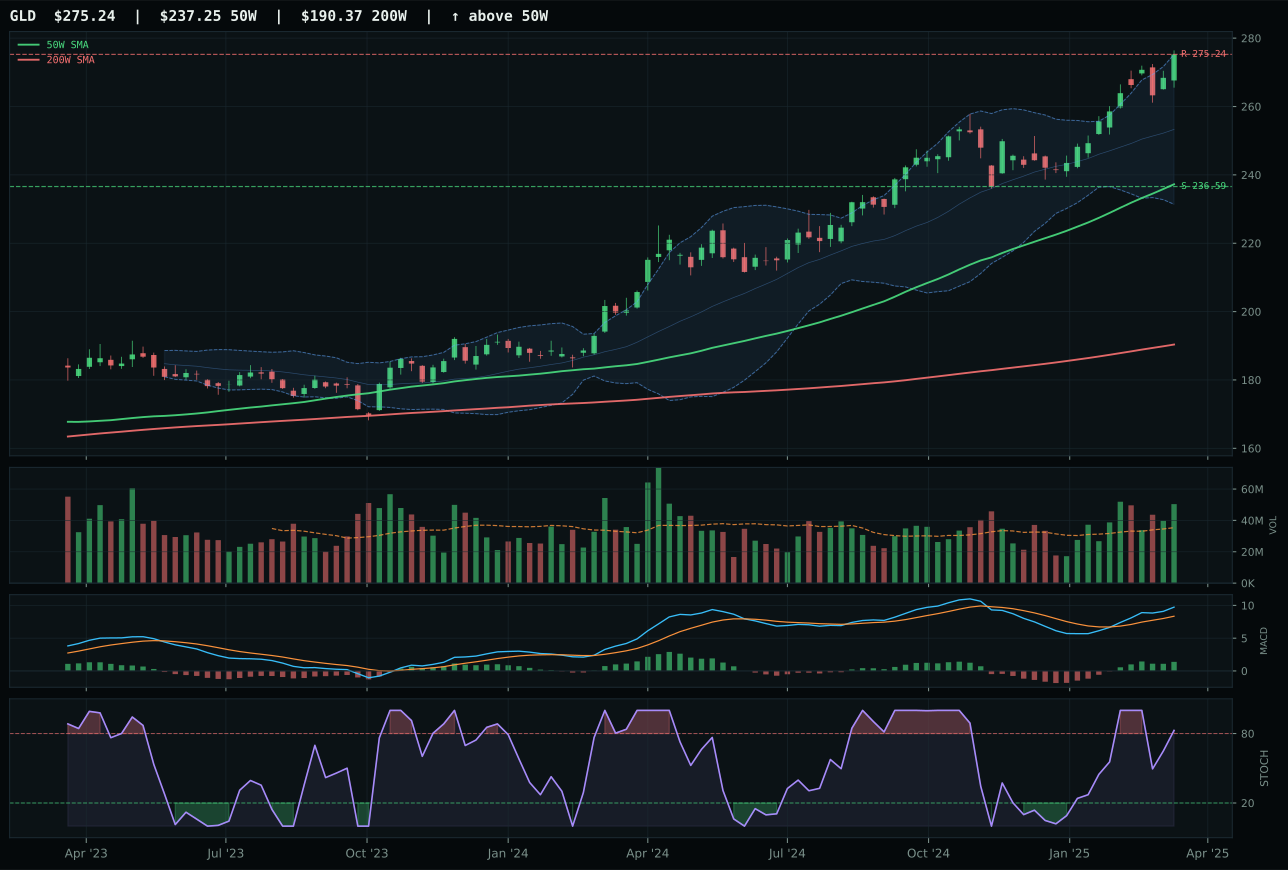
GLD has a vertical extension profile with 19.5% 13-week relative strength versus SPY.
A failed hold above support would weaken the setup.
Actionable but governed by invalidation levels.
GLD wins Precious Metals decisively despite SLV and GDX scoring higher on pure technicals, because its structure cleanness of 85.8/100 and superior risk/reward setup at 45.8/100 overcome the consensus momentum leadership. SLV and GDX both post 100/100 trend scores and overbought stochastic readings, but GLD's stochastic at 0.83 is rolling over—a sign of early exhaustion—while GDX's overbought momentum at 100 has nowhere to go but down. GLD sits 16.0% extended from the 50-week average, which normally signals late-entry risk, but the category's 100.0/100 momentum confirmation and 78.2/100 persistence scores prove this is not a climax move; it is an extended leader with room to run. Vertical extension structure at 85.8 versus GDX's 80.3 and SLV's neutral setup at unknown score reflects GLD's role as the clean monetary hedge—institutions buying it for duration and safety, not leverage. Volume participation at 1.42x the 20-week average is sponsorship, not distribution.
Utilities & Infrastructure — XLU
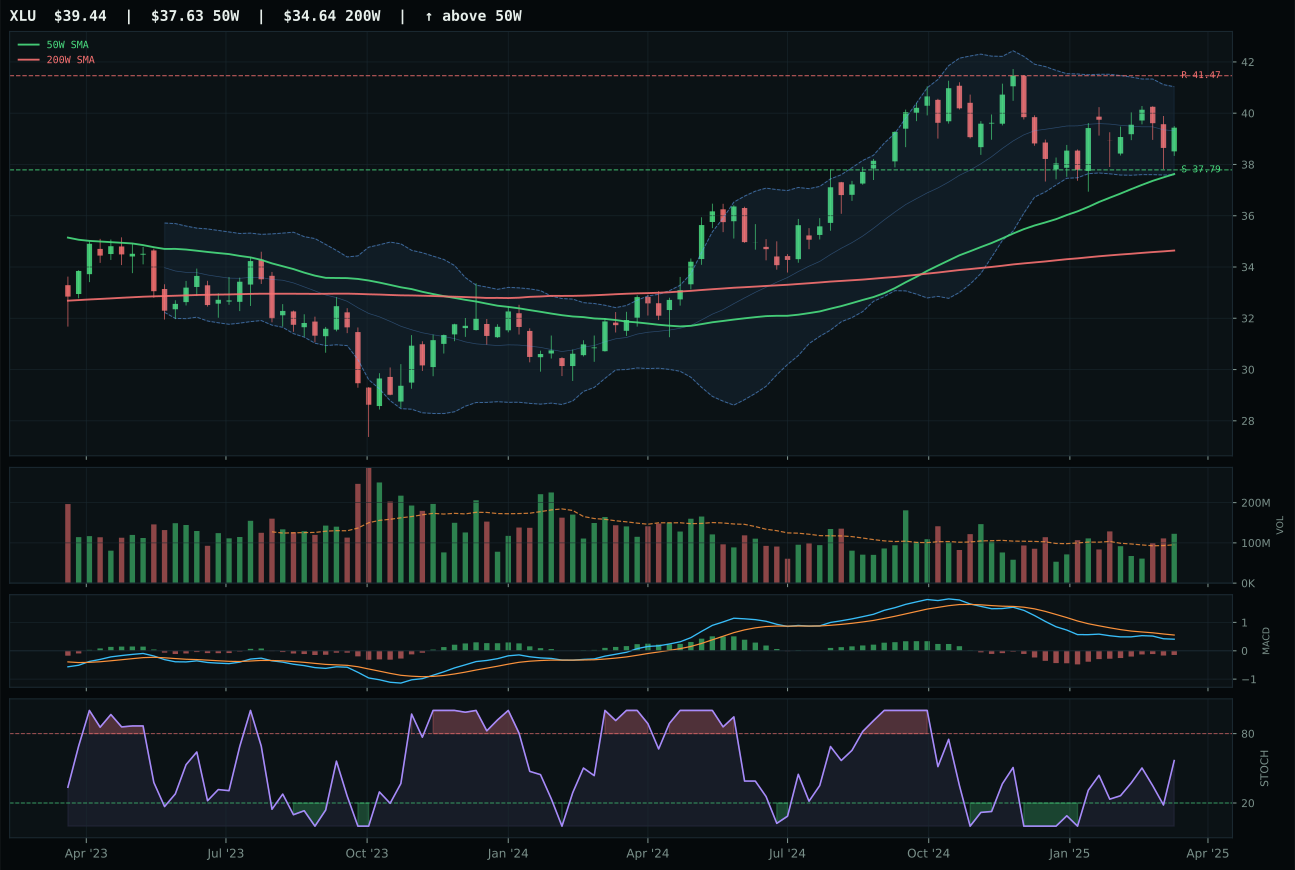
XLU has a pullback into support profile with 8.4% 13-week relative strength versus SPY.
A failed hold above support would weaken the setup.
Actionable but governed by invalidation levels.
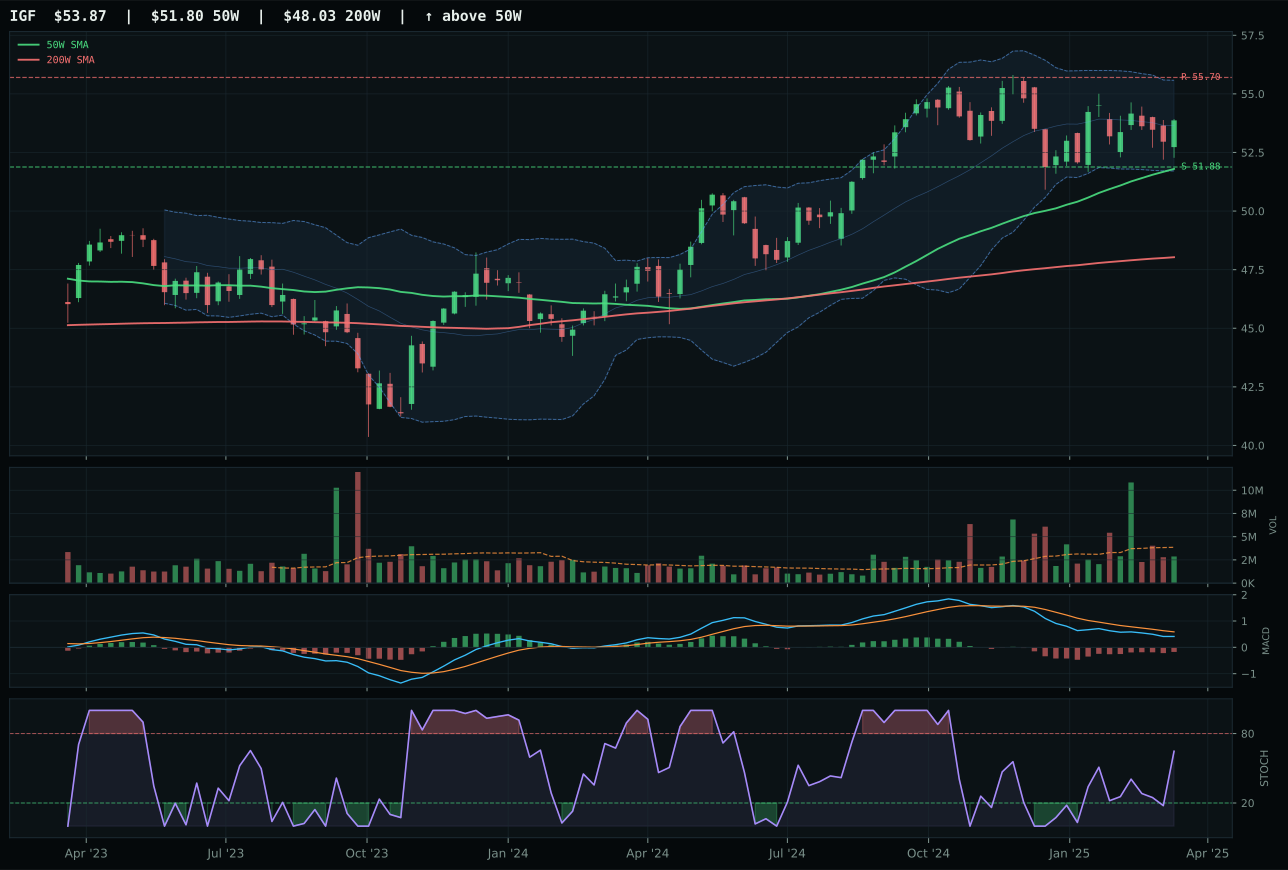
IGF has a pullback into support profile with 7.5% 13-week relative strength versus SPY.
A failed hold above support would weaken the setup.
Actionable but governed by invalidation levels.
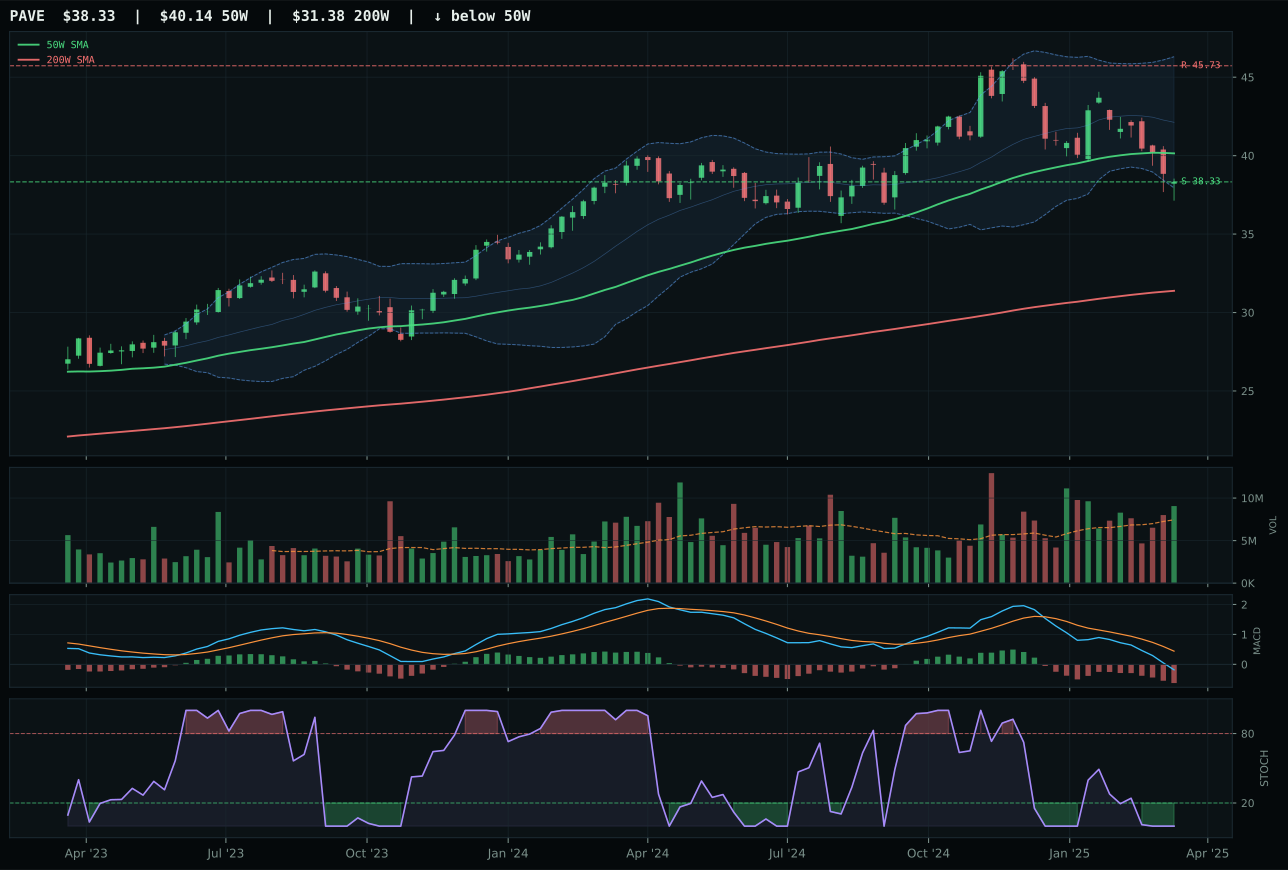
PAVE has a pullback into support profile with -4.4% 13-week relative strength versus SPY.
A failed hold above support would weaken the setup.
Actionable but governed by invalidation levels.
XLU claims Utilities & Infrastructure as a clear first-place representative on the strength of identical 100/100 trend and timing scores that match IGF, combined with superior momentum confirmation at 72.6/100 versus IGF's 59/100. The deciding factors: XLU's 0.9% category-relative strength versus IGF's flat 0.0%, and XLU's 1.29x volume participation (above-average) versus IGF's thin participation. Both charts sit in pullback-into-support setups with rising-mid-zone stochastic RSI and bearish-but-improving MACD, but XLU's 1.6% 13-week return versus IGF's 0.7% signals accumulated institutional sponsorship for the regulated utility narrative over global infrastructure income. Risk/reward slightly favors XLU at 65.2/100 versus 60.4, though both offer reasonable asymmetry. Structure cleanness at 77.4 for XLU edges IGF at 73.5, reflecting tighter compression and less chart noise. Volume confirmation at 63.7/100 for XLU proves buyers are defending support; this is accumulation into the 37.79 support level.
Defense & Aerospace — ITA
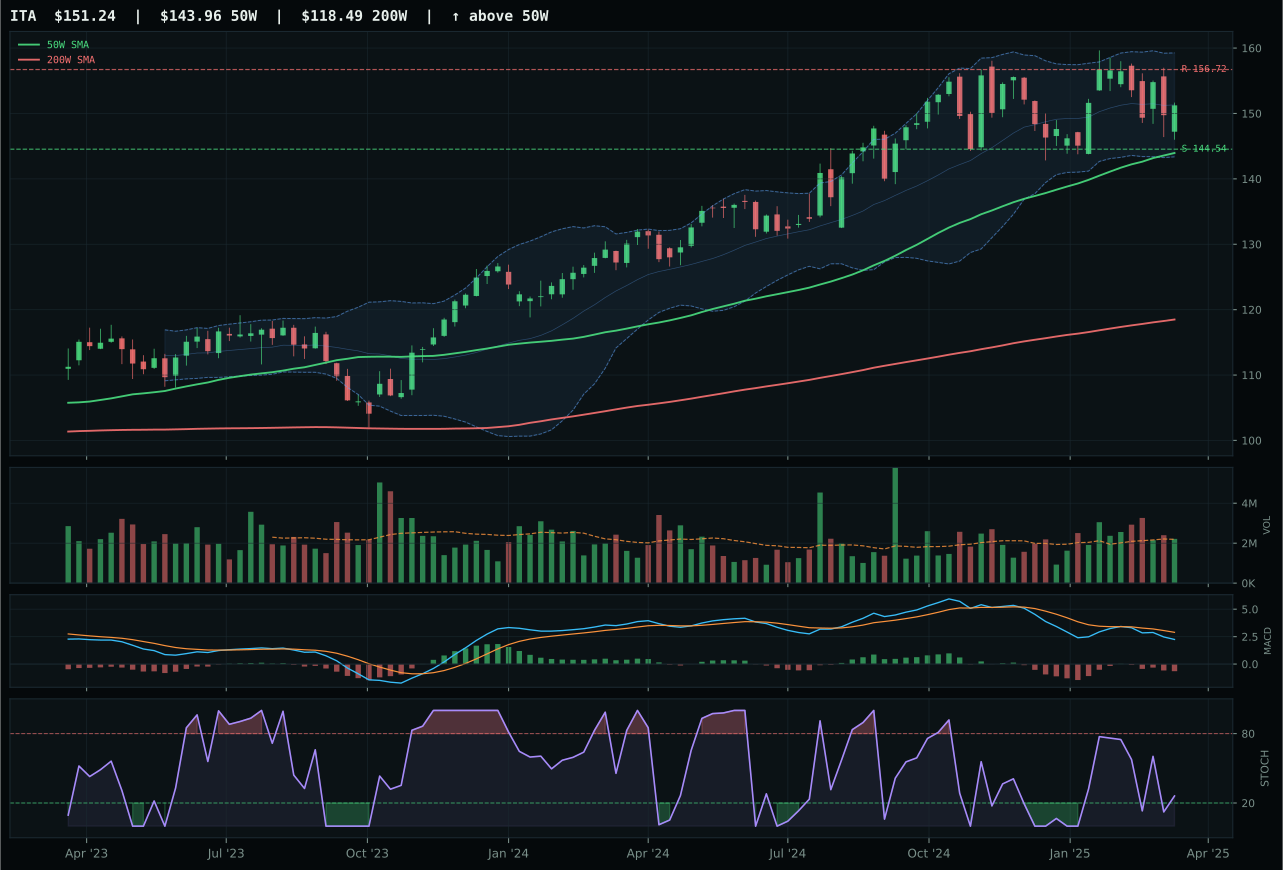
ITA has a pullback into support profile with 8.8% 13-week relative strength versus SPY.
A failed hold above support would weaken the setup.
Actionable but governed by invalidation levels.
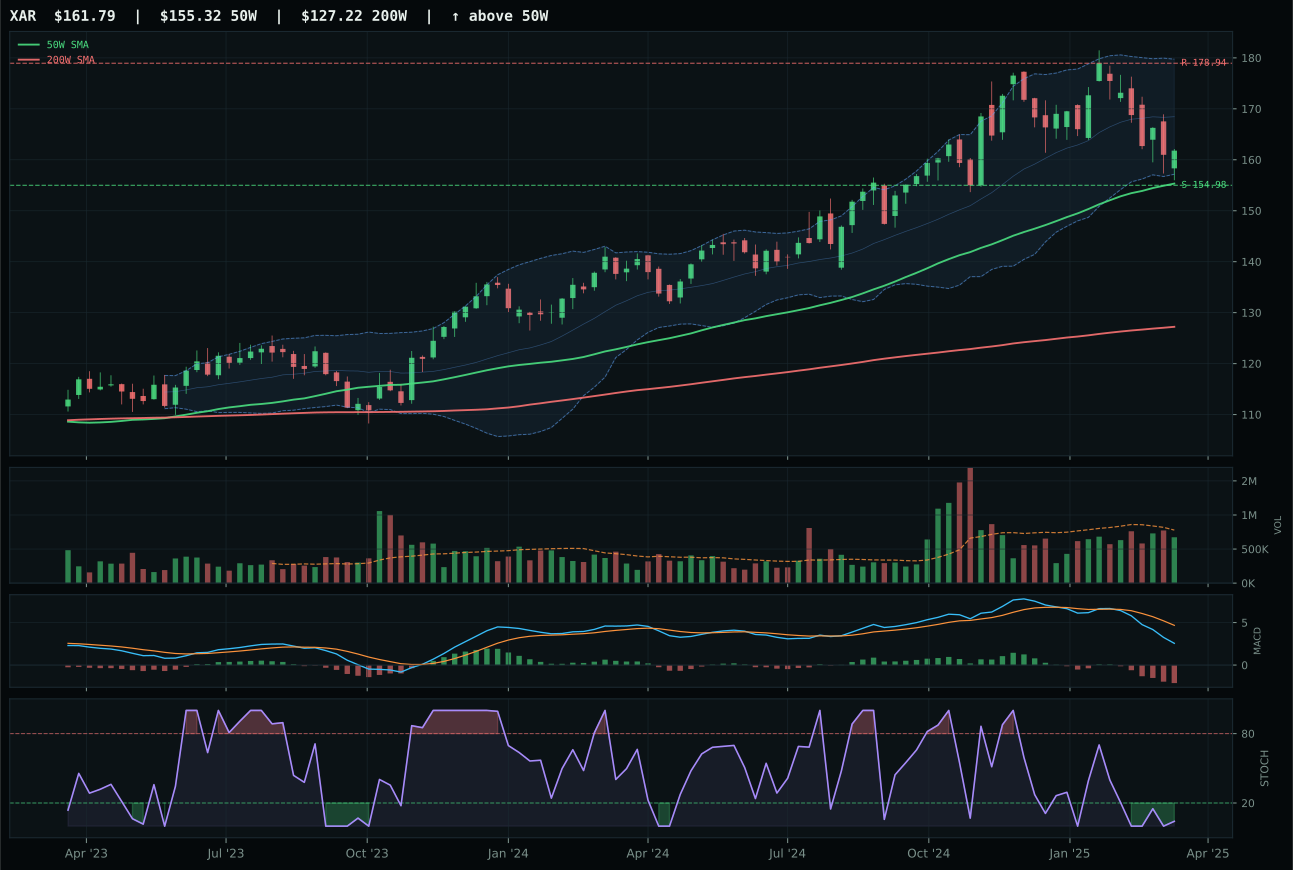
XAR has a pullback into support profile with 3.0% 13-week relative strength versus SPY.
A failed hold above support would weaken the setup.
Actionable but governed by invalidation levels.
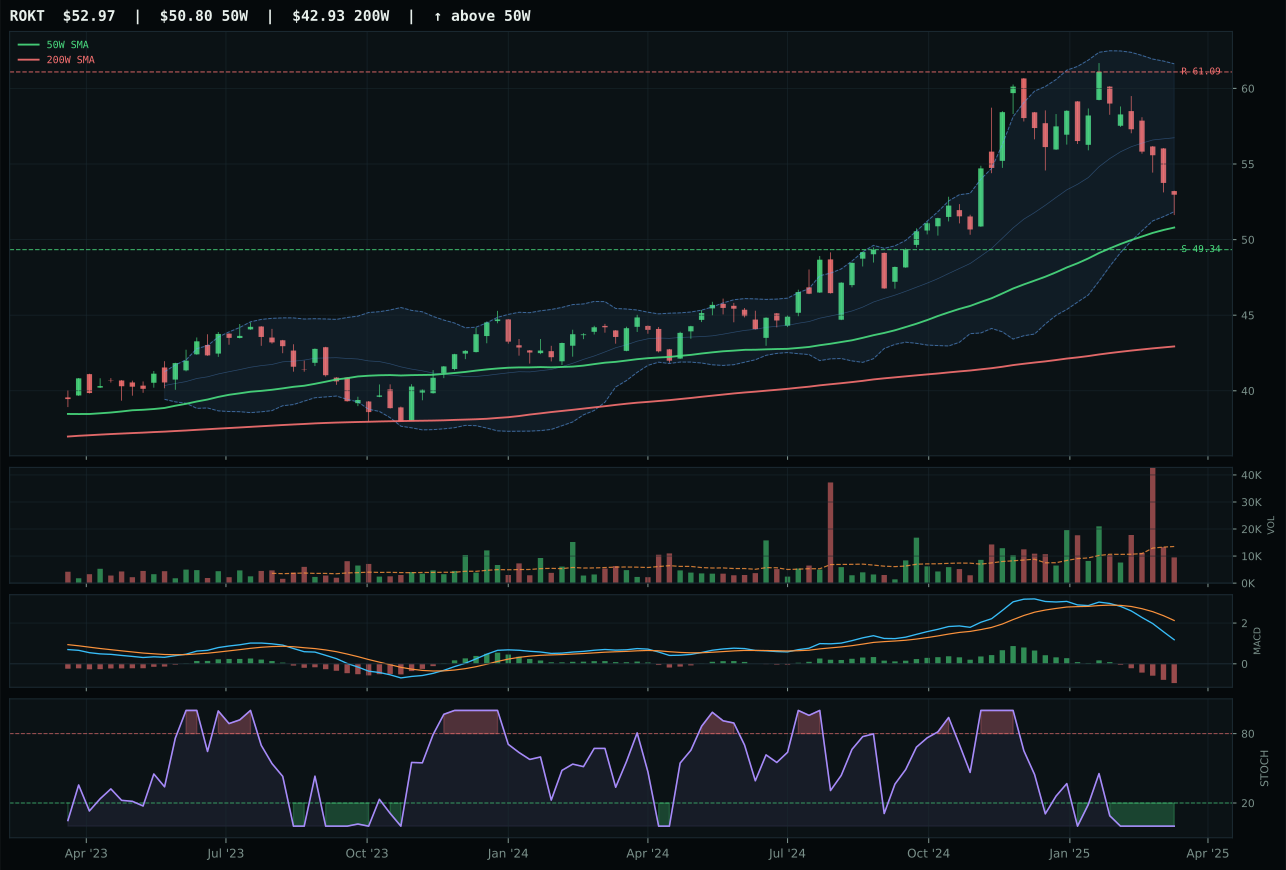
ROKT has a neutral structure profile with -0.8% 13-week relative strength versus SPY.
A failed hold above support would weaken the setup.
Tracked, but not top-2 eligible because: .
ITA takes the Defense category on the strength of better stochastic RSI timing and genuine category-relative outperformance versus XAR, despite posting lower composite technical scores. ITA's stochastic at 0.26 (rising mid-zone) beats XAR's oversold-turn-up at the inflection, a subtle but consequential difference when both charts are compressing into support. More importantly, ITA's 5.8% edge in category-relative strength versus XAR's flat 0.0% demonstrates accumulated institutional sponsorship for the defense-prime durability narrative over aerospace cyclicality. Trend scores are nearly identical at 92 versus 86, but ITA's momentum confirmation of 58.7/100 dwarfs XAR's 35/100, signaling that the recent 1.9% 13-week gain is being accumulated rather than sold into. Neutral volume at 1.01x the 20-week average provides a clean entry with no distribution pressure; this is accumulation without climax.
Technology — CIBR
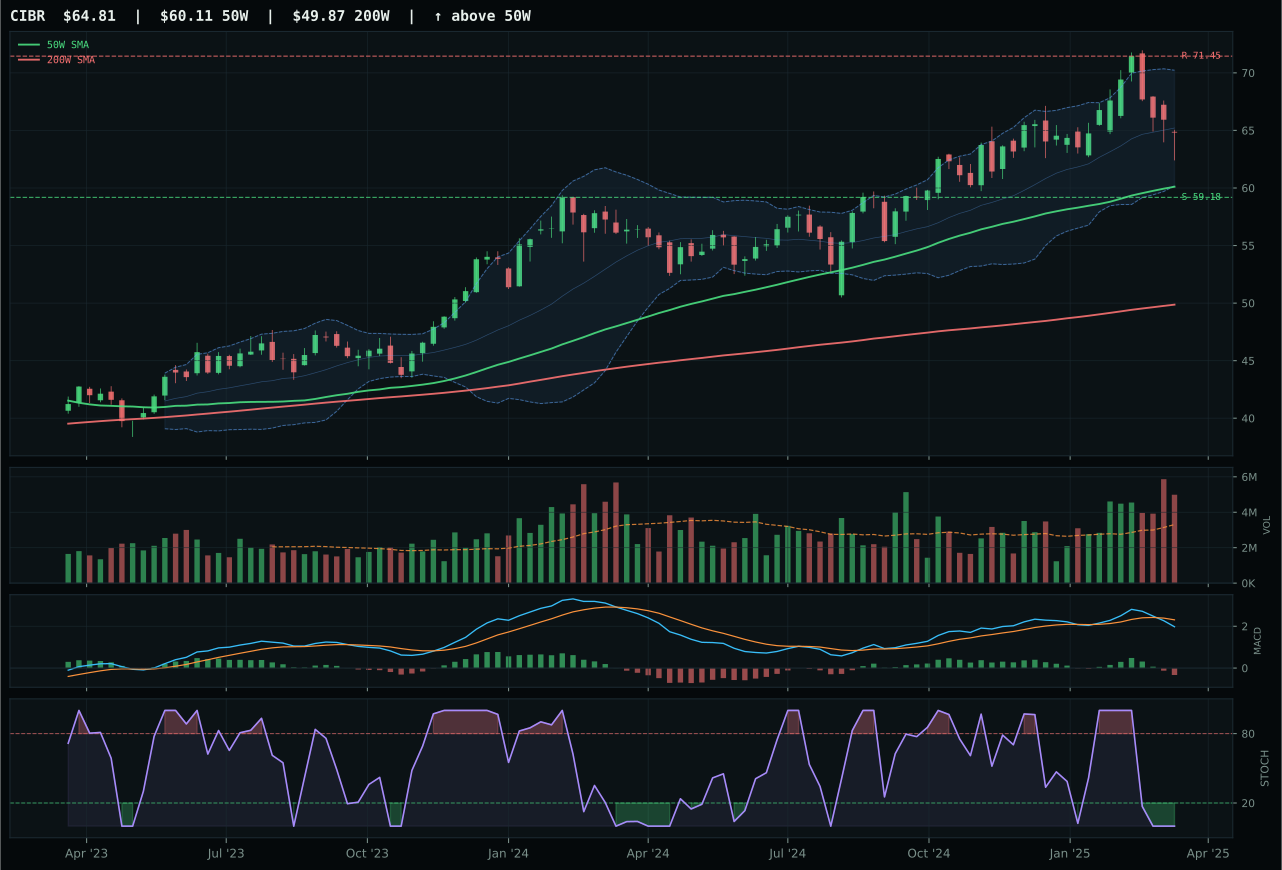
CIBR has a neutral structure profile with 5.7% 13-week relative strength versus SPY.
A failed hold above support would weaken the setup.
Actionable but governed by invalidation levels.
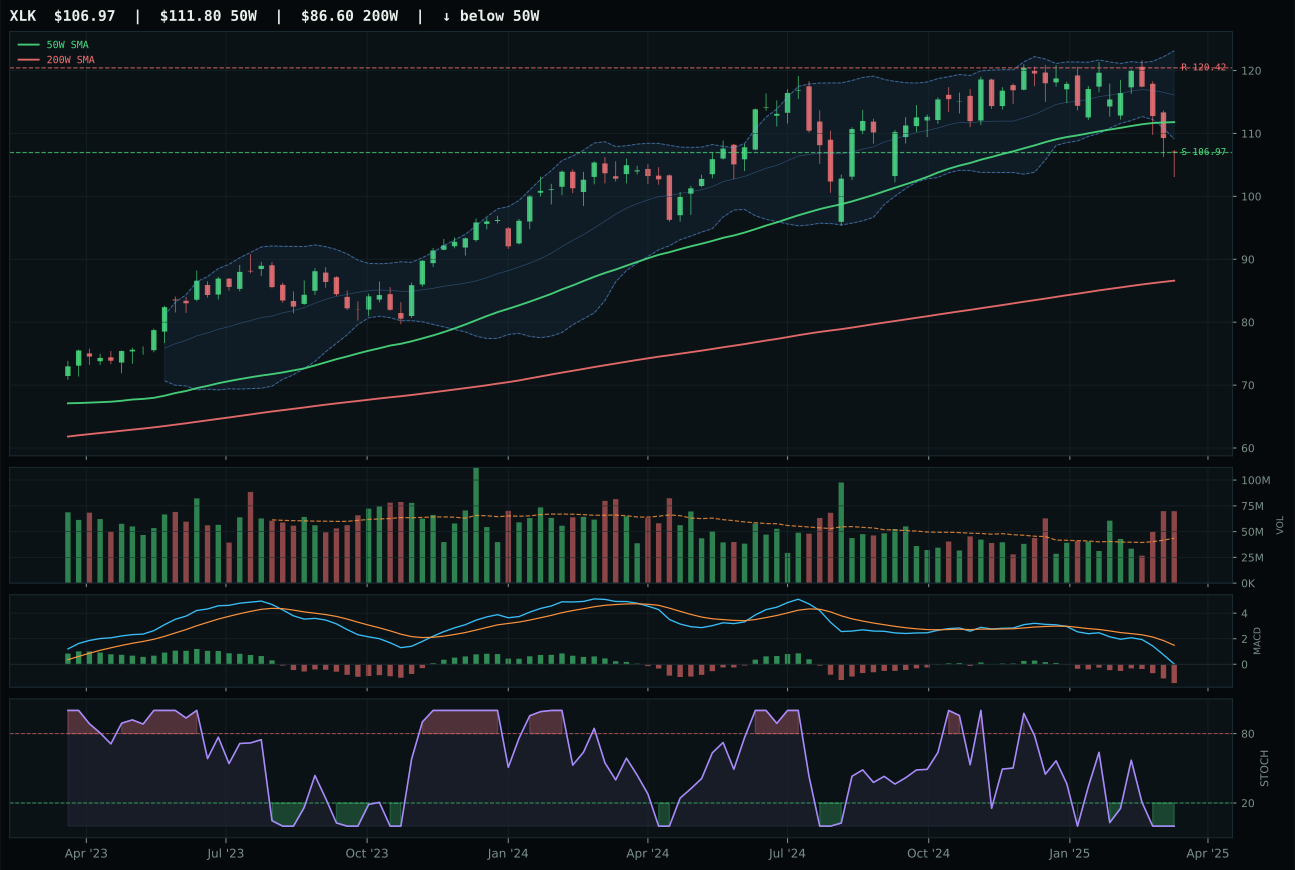
XLK has a pullback into support profile with -3.7% 13-week relative strength versus SPY.
A failed hold above support would weaken the setup.
Actionable but governed by invalidation levels.
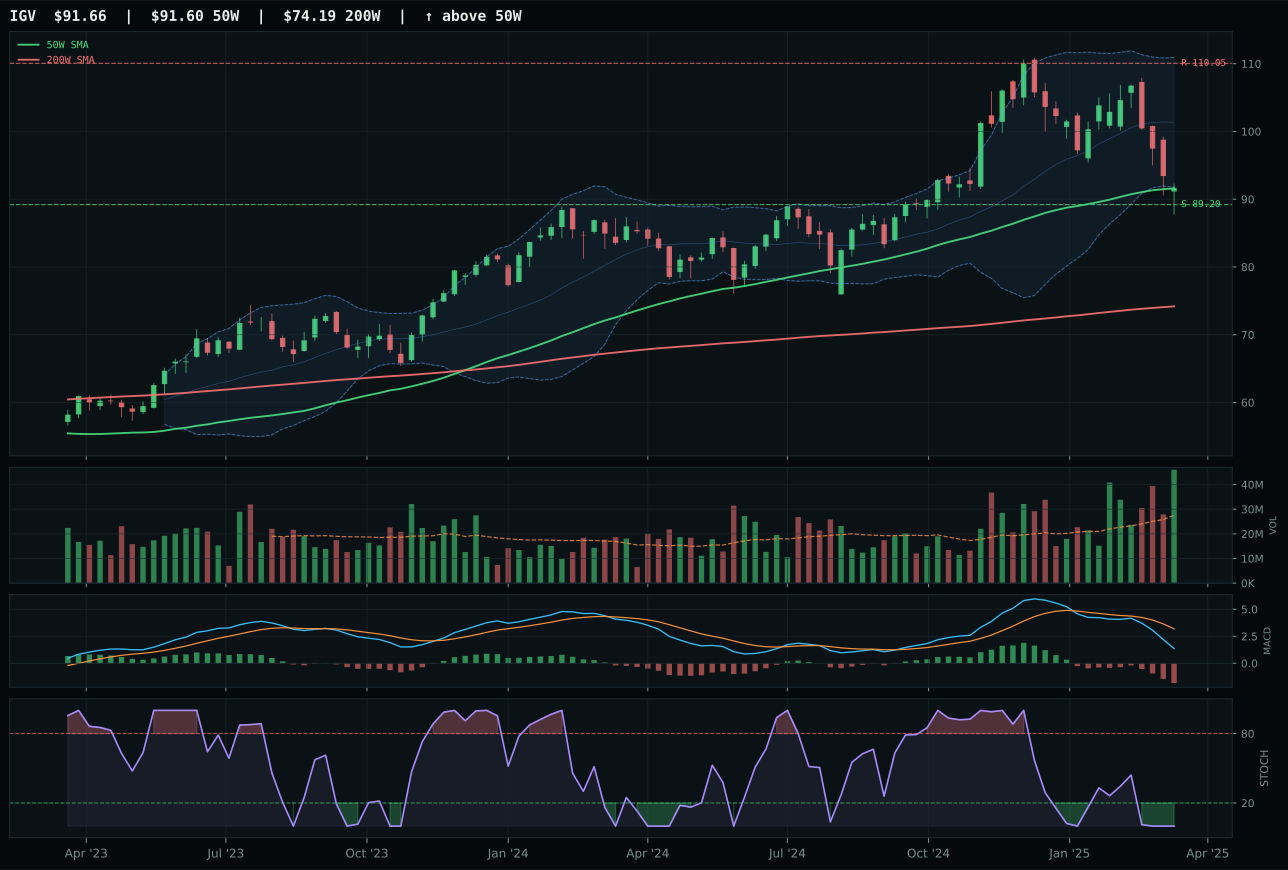
IGV has a pullback into support profile with -6.5% 13-week relative strength versus SPY.
A failed hold above support would weaken the setup.
Actionable but governed by invalidation levels.
CIBR wins the category by combining positive relative strength inside its three-ETF basket with a technically cleaner setup than XLK. The cybersecurity specialist sits 7.8% above its 50-week moving average with a 9.4% edge in category-relative strength versus XLK's flat 0.0%, while both face bearish MACD and oversold stochastic RSI readings. CIBR's neutral structure scored 68.1/100 against XLK's pullback-into-support at 65.3/100, a meaningful gap when entry timing is ambiguous and new money has already paid up for the trend. The 5.7% outperformance versus SPY over 13 weeks signals selective buying into defensive technology, exactly what a disinflation regime rewards—steady profitability over growth chasing. Volume distribution pressure at 1.51x the 20-week average confirms this is not late-stage accumulation; buyers are present but cautious.
Technology earned 5% allocation as a tier-2 holding this week, reflecting its rank outside the top-2 eligible categories. A 35.6 final score sits below both Precious Metals and Utilities, weighed down by the macro headwinds of liquidity stress (-10 points) that outpace the modest disinflation support (+7 points). CIBR's technical evidence of 30.9/100 reasoned proof is solid—trend, relative strength, and volume-price sponsorship all present—but the category-level macro fit of 52.0/100 penalizes broad technology exposure in a regime where defensive sectors and monetary hedges command the capital flow. For Technology to graduate to top-2 status, the liquidity stress descriptor would need to flip off entirely, or category-relative strength would need to accelerate beyond the current single-digit percentages that mark this as a consolidation rather than a breakout.
Nuclear Energy — URNM
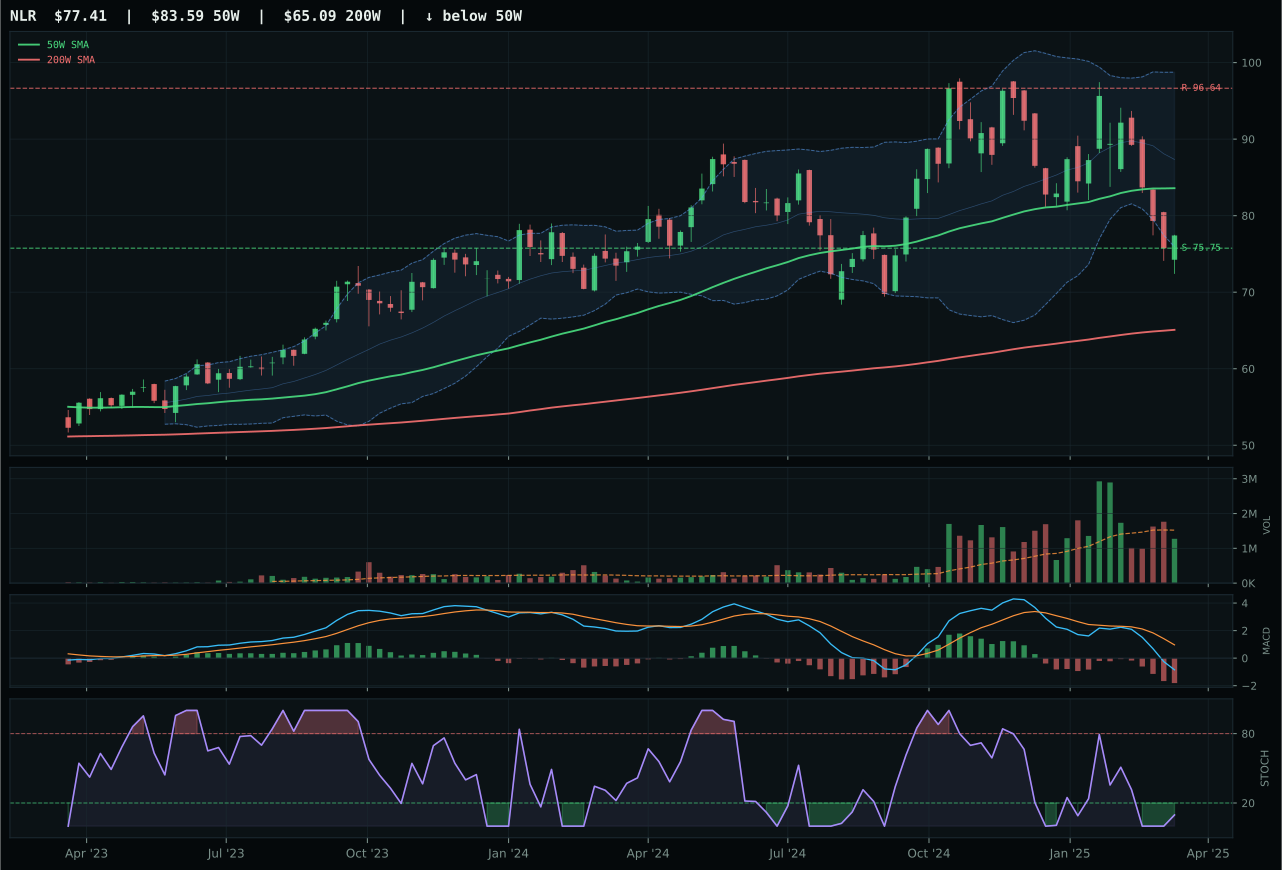
NLR has a pullback into support profile with -3.7% 13-week relative strength versus SPY.
A failed hold above support would weaken the setup.
Actionable but governed by invalidation levels.
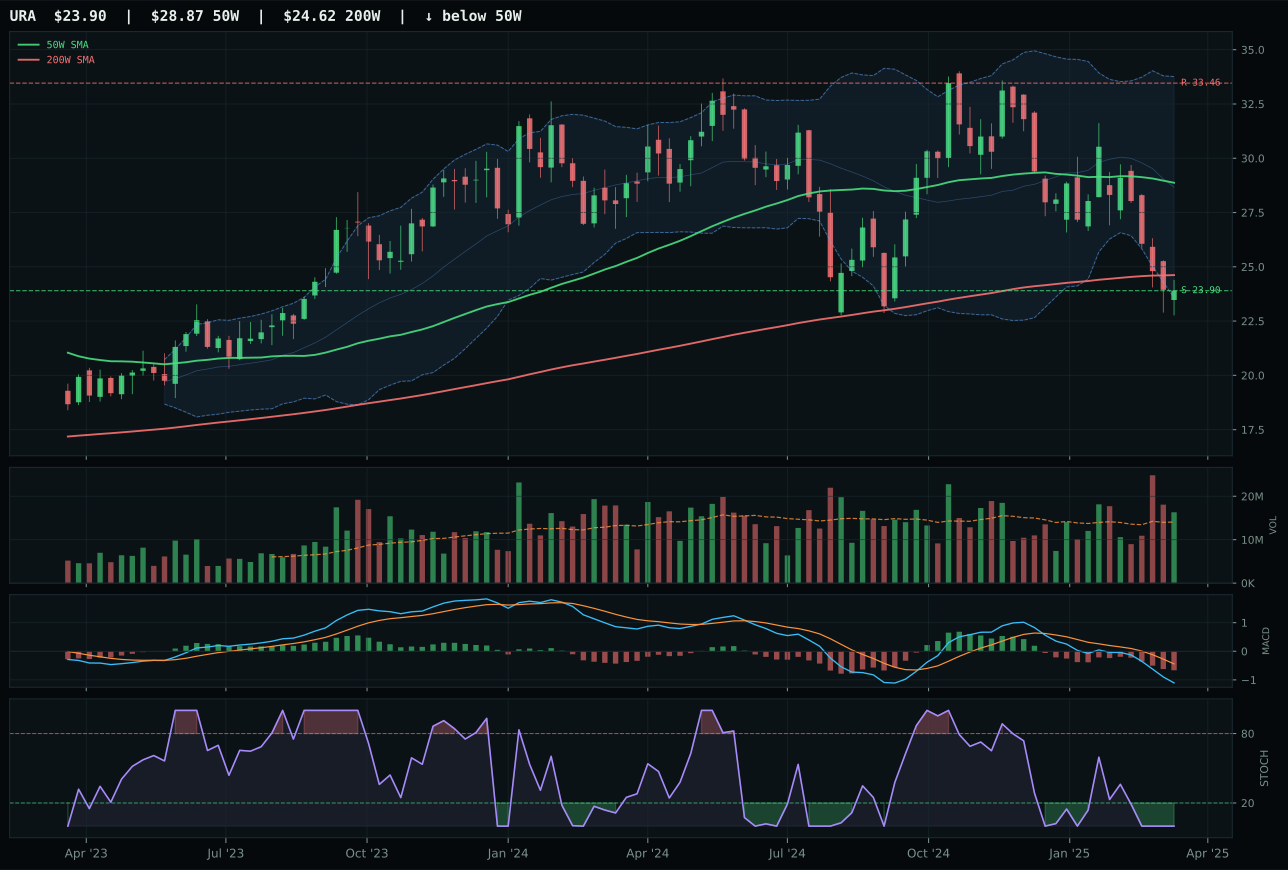
URA has a pullback into support profile with -11.8% 13-week relative strength versus SPY.
A failed hold above support would weaken the setup.
Actionable but governed by invalidation levels.
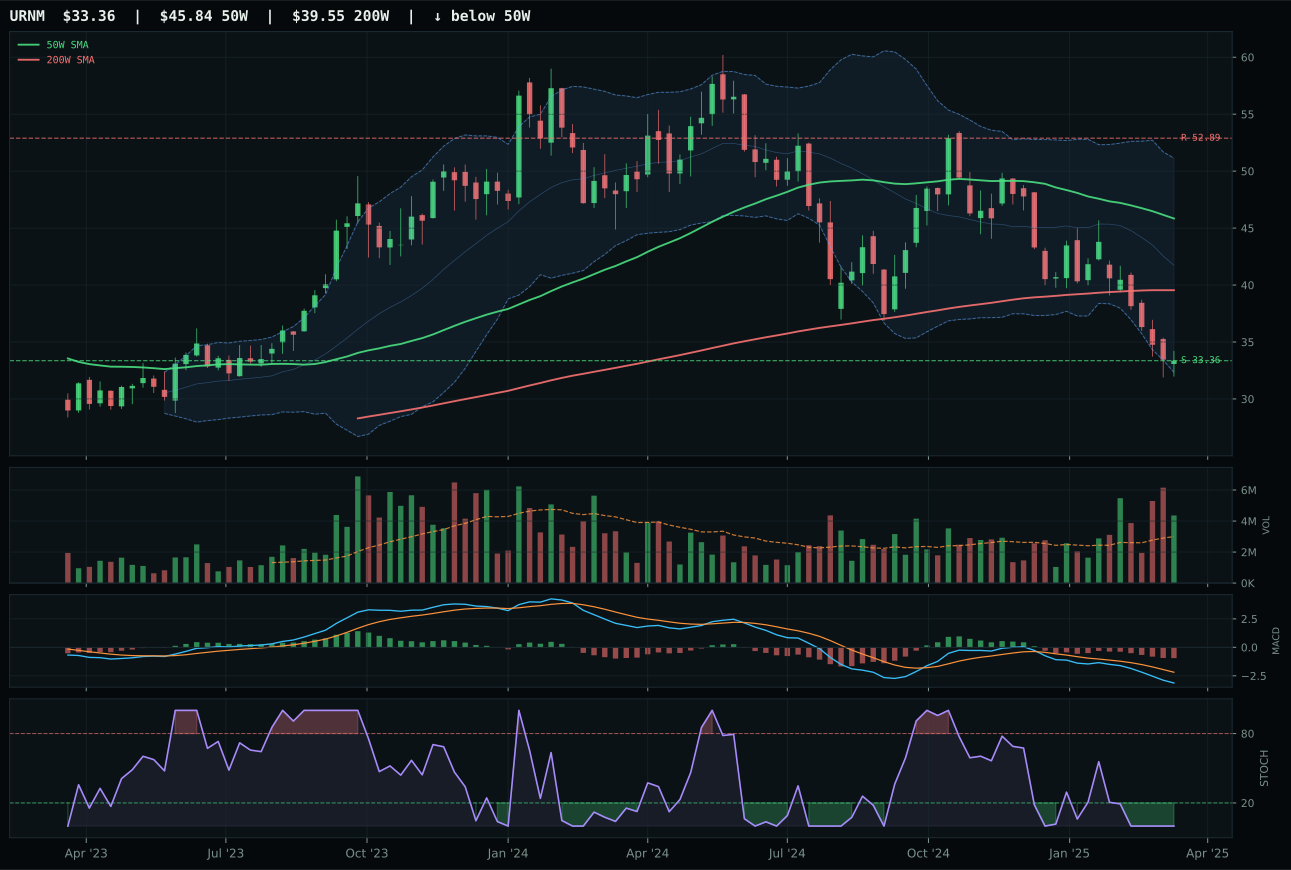
URNM has a pullback into support profile with -16.1% 13-week relative strength versus SPY.
A failed hold above support would weaken the setup.
Actionable but governed by invalidation levels.
URNM wins Nuclear Energy despite posting a composite score of just 25/100 and technical evidence of 0.0/100, winning solely because NLR and URA are worse on the margin of volume confirmation and extended positioning. This is a category where all three options are broken; URNM's pullback-into-support setup at 62.9/100 structure edges NLR's margin, with the deciding factor being URNM's 1.46x volume participation versus NLR's neutral volume—the only sign of institutional conviction in a sector where every chart shows -23.0% 13-week returns and oversold stochastic RSI. Stochastic RSI at 0.00 is a hard-floor read, leaving no room for deterioration, while NLR's oversold-turn-up at least signals early reversal indigestion. URNM's -27.2% distance to the 50-week moving average is extreme, but so is the 75.0/100 risk/reward score that shows 0.0% downside to support—a mathematical floor that eliminates gap risk. This is a damaged sector where the least-broken option wins by attrition.
AI — BOTZ
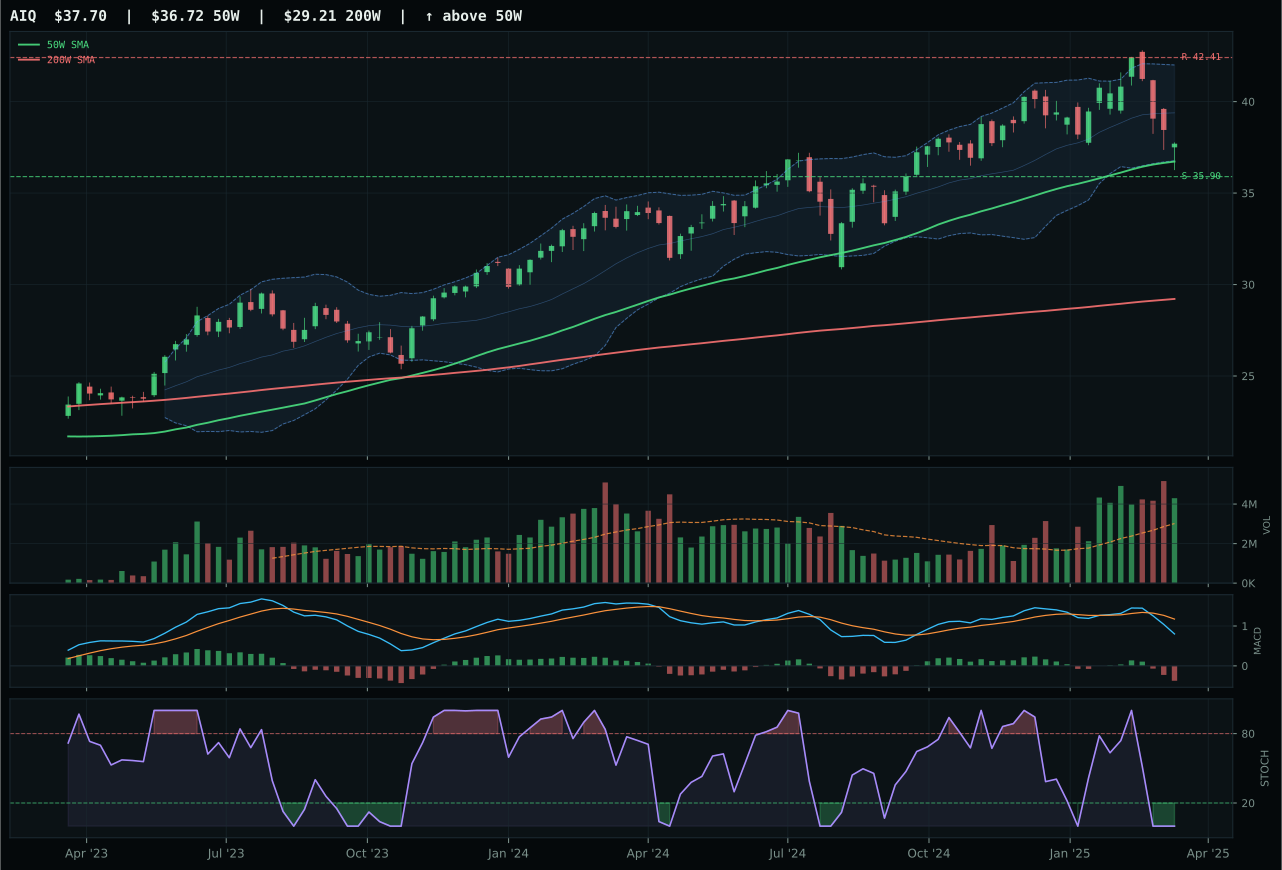
AIQ has a compression near 50W profile with 0.8% 13-week relative strength versus SPY.
A failed hold above support would weaken the setup.
Actionable but governed by invalidation levels.
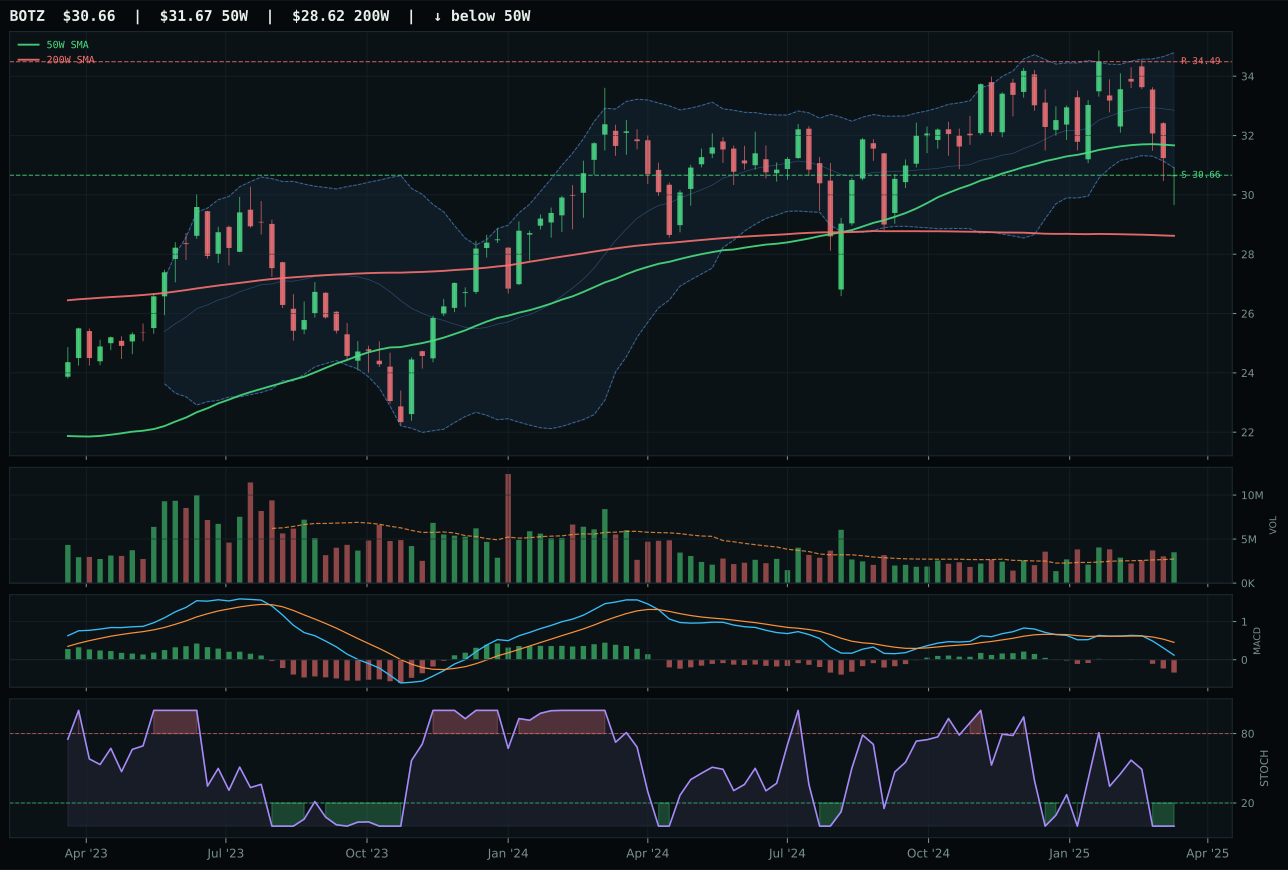
BOTZ has a pullback into support profile with -0.3% 13-week relative strength versus SPY.
A failed hold above support would weaken the setup.
Actionable but governed by invalidation levels.
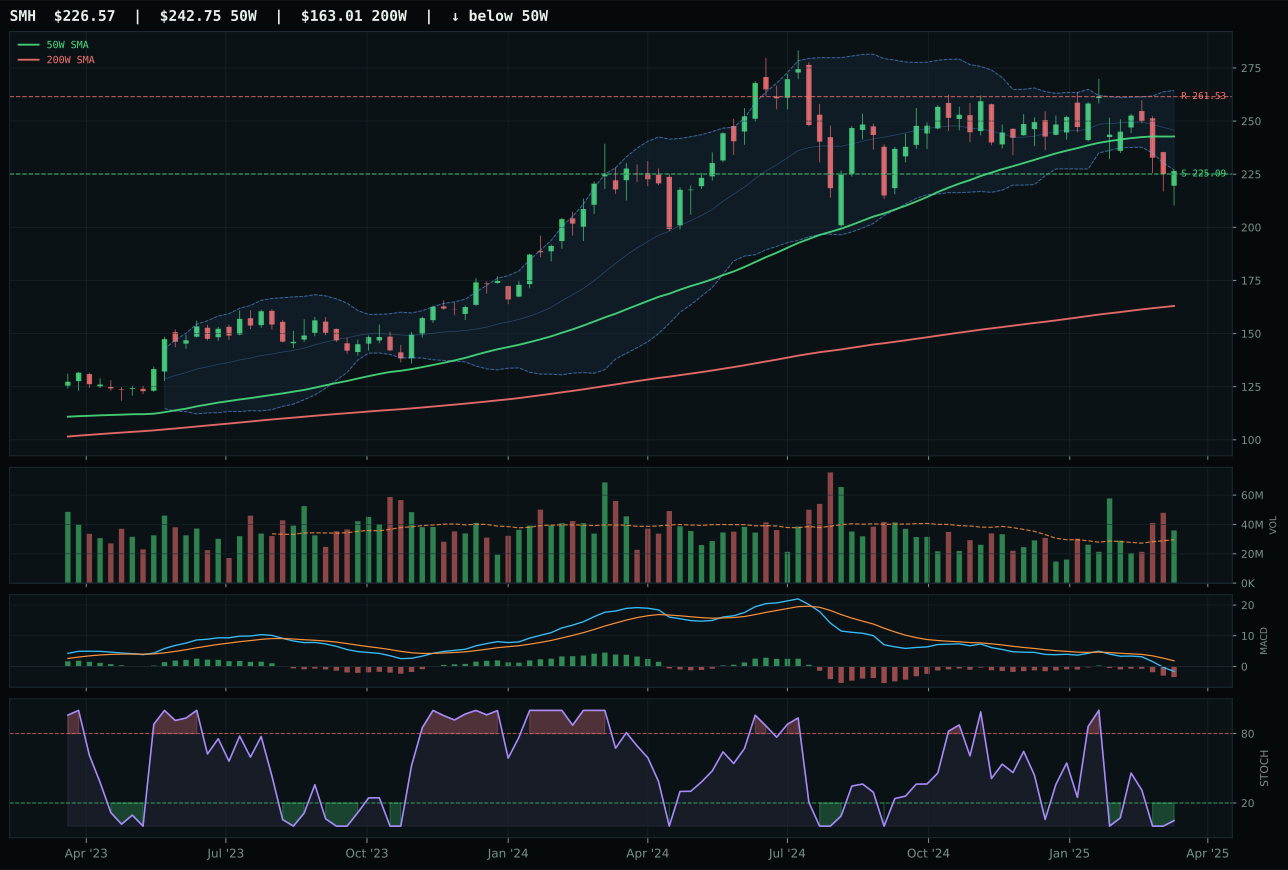
SMH has a pullback into support profile with -2.3% 13-week relative strength versus SPY.
A failed hold above support would weaken the setup.
Actionable but governed by invalidation levels.
BOTZ edges AIQ on the margin of chart structure and positioning despite scoring lower on absolute technical merit. AIQ posted a composite 78 versus BOTZ's 54, yet BOTZ's pullback-into-support setup at 73.0/100 structure cleanliness narrowly beats AIQ's compression-near-50W at 70.9/100. The deciding factor: BOTZ sits -3.2% from its 50-week average while AIQ sits 2.7% above it, placing BOTZ in a more defined mean-reversion zone with Fibonacci 0.500 as a decision point. Timing scores are identical at 100 for both, but risk/reward slightly favors BOTZ at 78.0 versus 93.0, a paradox explained by AIQ's superior upside-to-resistance ratio making it too far along to chase cleanly. BOTZ's -0.3% SPY relative strength and -7.1% 13-week return mean this is a consolidation candidate rather than a trend follower—exactly the setup that rewards patience in a liquidity-constrained environment.
AI received 5% as tier-2 despite a final category score of only 24.6, ranking below Defense, Metals, and Utilities in a portfolio tilted toward defensive rotation. Liquidity stress (-12 points) and broad market bear (-8 points) are crushing this category, while disinflation offers only +5 points of support. The reasoning layer's 3/2/1 basket started at 37.5 before macro headwinds knocked it to 24.6—a 35% haircut that reflects the current regime's complete indifference to AI software and robotics acceleration. Technical evidence of 34.2/100 for BOTZ and 49.5/100 for AIQ both qualify as actionable, but macro/narrative fit at 37.0 and 41.0 respectively ensures that superior chart structure alone cannot overcome the structural headwind of broken risk appetite. Allocation will remain at 5% until either liquidity stress signals inversion or AI exhibit a 13-week momentum recovery with positive category-relative strength.
Industrial Metals — COPX
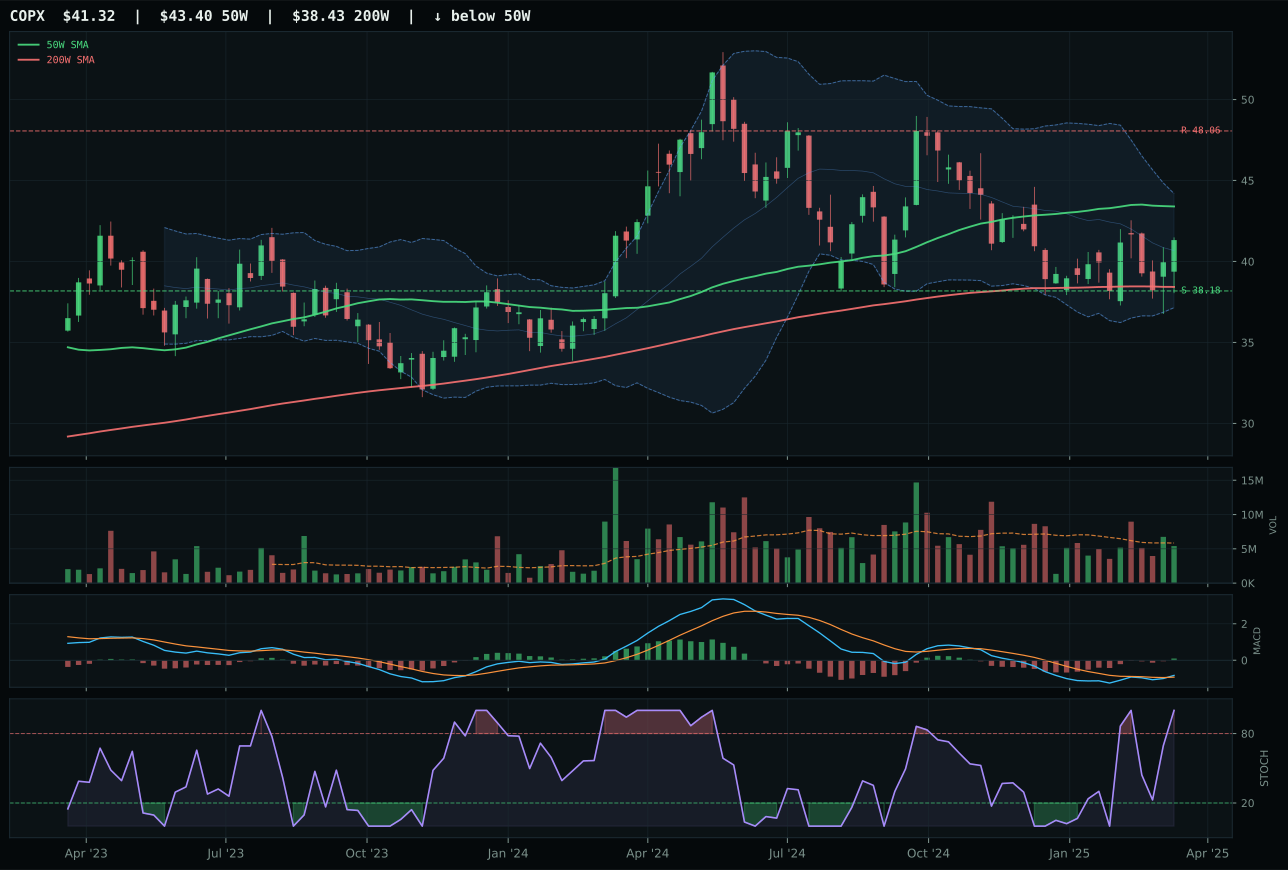
COPX has a neutral structure profile with 7.8% 13-week relative strength versus SPY.
A failed hold above support would weaken the setup.
Actionable but governed by invalidation levels.
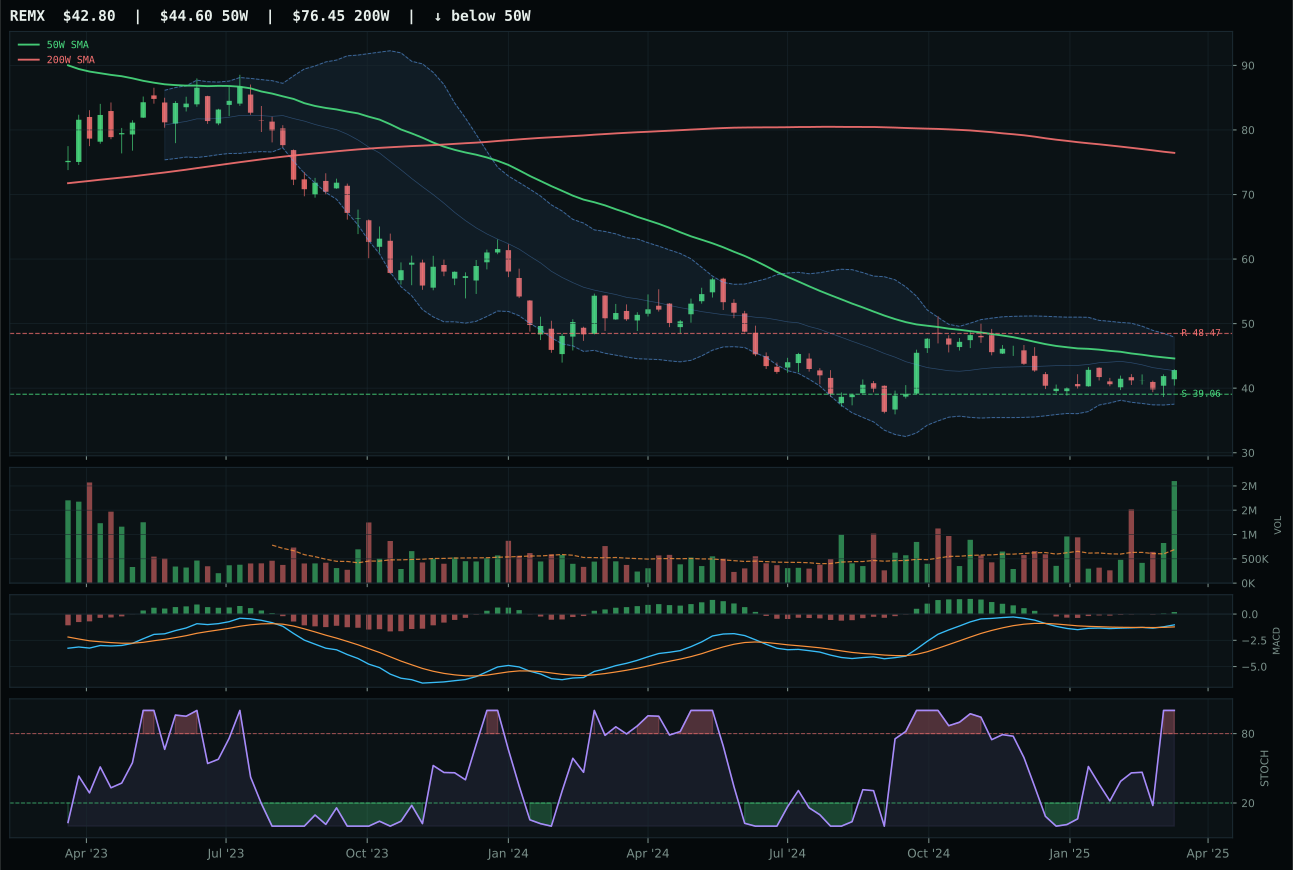
REMX has a neutral structure profile with 7.0% 13-week relative strength versus SPY.
Extension and support failure are the main tactical risks.
Tracked, but not top-2 eligible because: structurally broken.
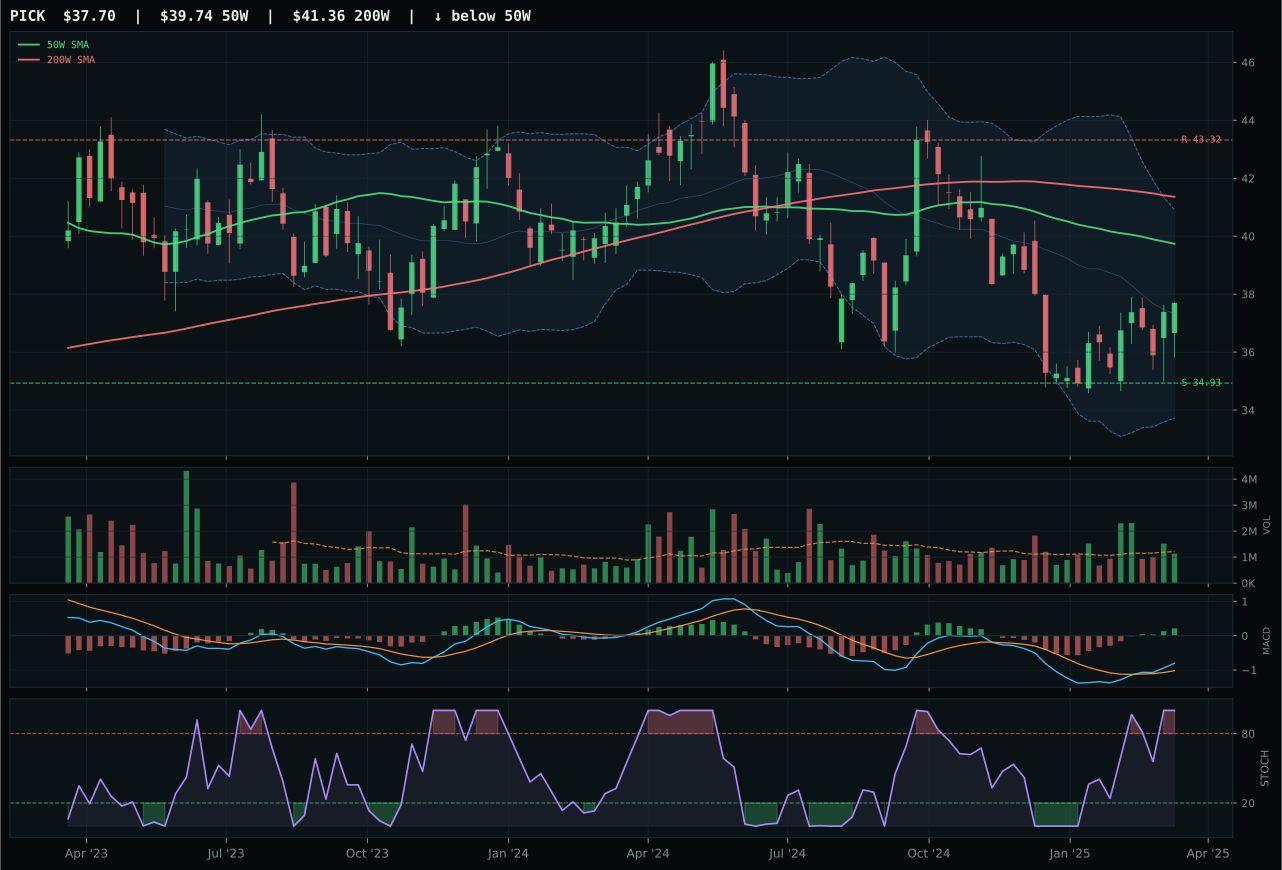
PICK has a neutral structure profile with 6.1% 13-week relative strength versus SPY.
Extension and support failure are the main tactical risks.
Tracked, but not top-2 eligible because: structurally broken.
COPX wins Industrial Metals on the combination of superior timing (97.0/100 versus REMX's 90.0) and cleaner structure (74.1/100 versus REMX's 49.3), despite sitting below the 50-week moving average at -4.8%. The timing edge comes from COPX's deep-retracement Fibonacci placement at 0.786, combined with bullish-and-improving MACD and overbought-momentum stochastic RSI, all of which signal a coiled setup rather than a broken one. REMX's structure failure—rated at 49.3—disqualifies it despite higher momentum confirmation, as the reasoner applies hard filters that mark it structurally broken. Risk/reward at 83.7 versus 80.0 slightly favors COPX, but the decisive factor is category-relative strength: COPX posts 0.8% versus REMX's flat 0.0%, proving that copper-focused scarcity is outperforming rare-earth supply-chain stress. Volume is neutral for COPX at 0.92x the 20-week average, appropriate for a reset setup where buyers have not yet committed heavily but MACD shows greenfield accumulation potential.
Emerging Markets — IEMG
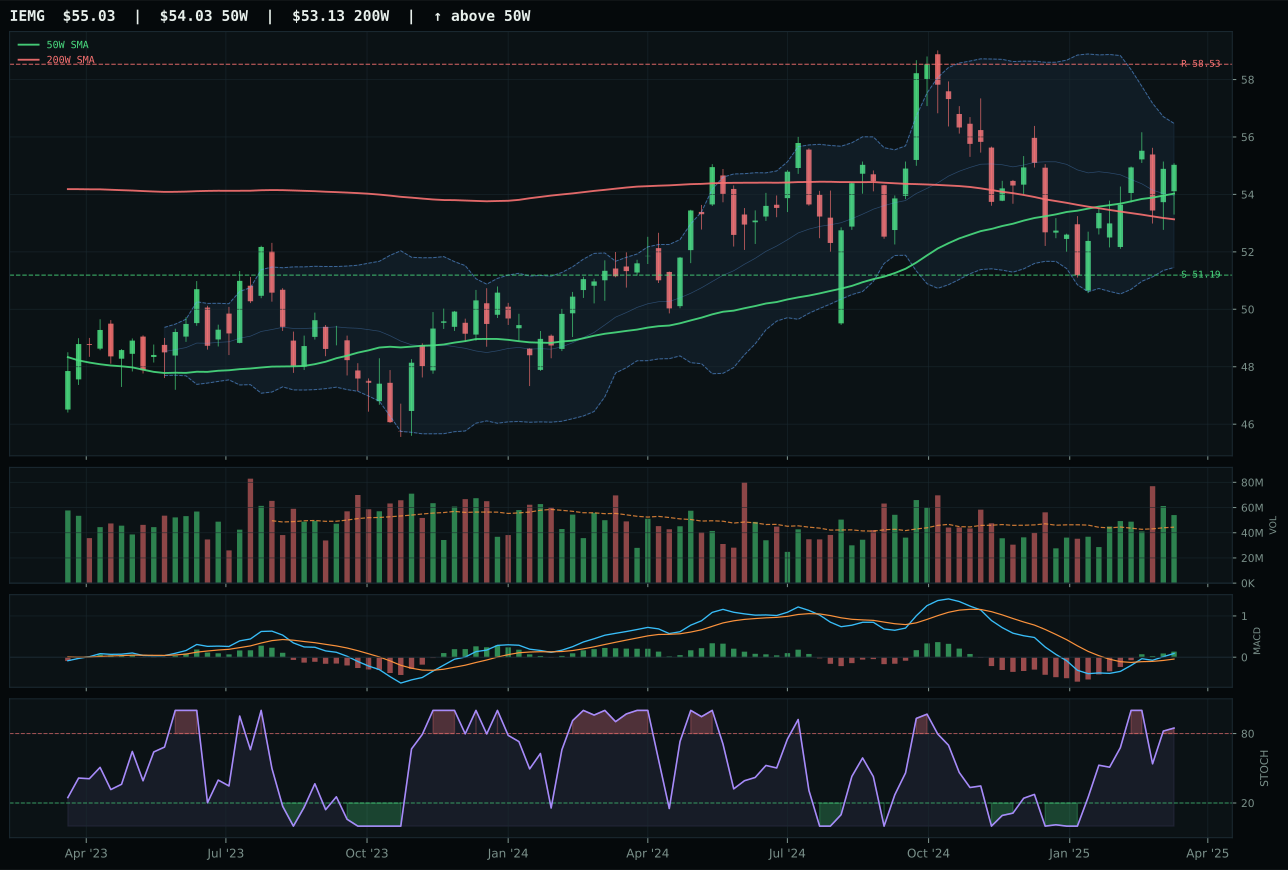
IEMG has a compression near 50W profile with 6.7% 13-week relative strength versus SPY.
A failed hold above support would weaken the setup.
Actionable but governed by invalidation levels.
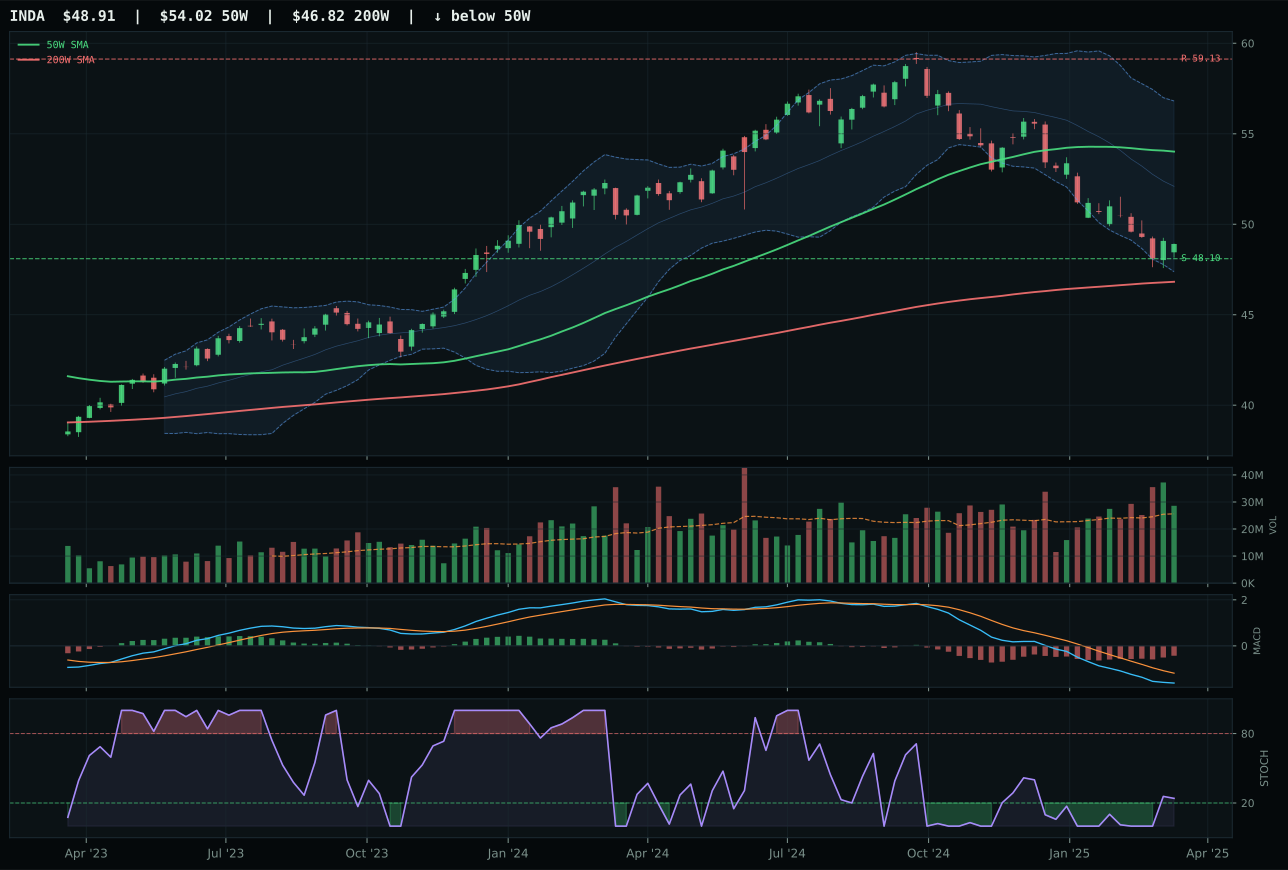
INDA has a pullback into support profile with -5.1% 13-week relative strength versus SPY.
A failed hold above support would weaken the setup.
Actionable but governed by invalidation levels.
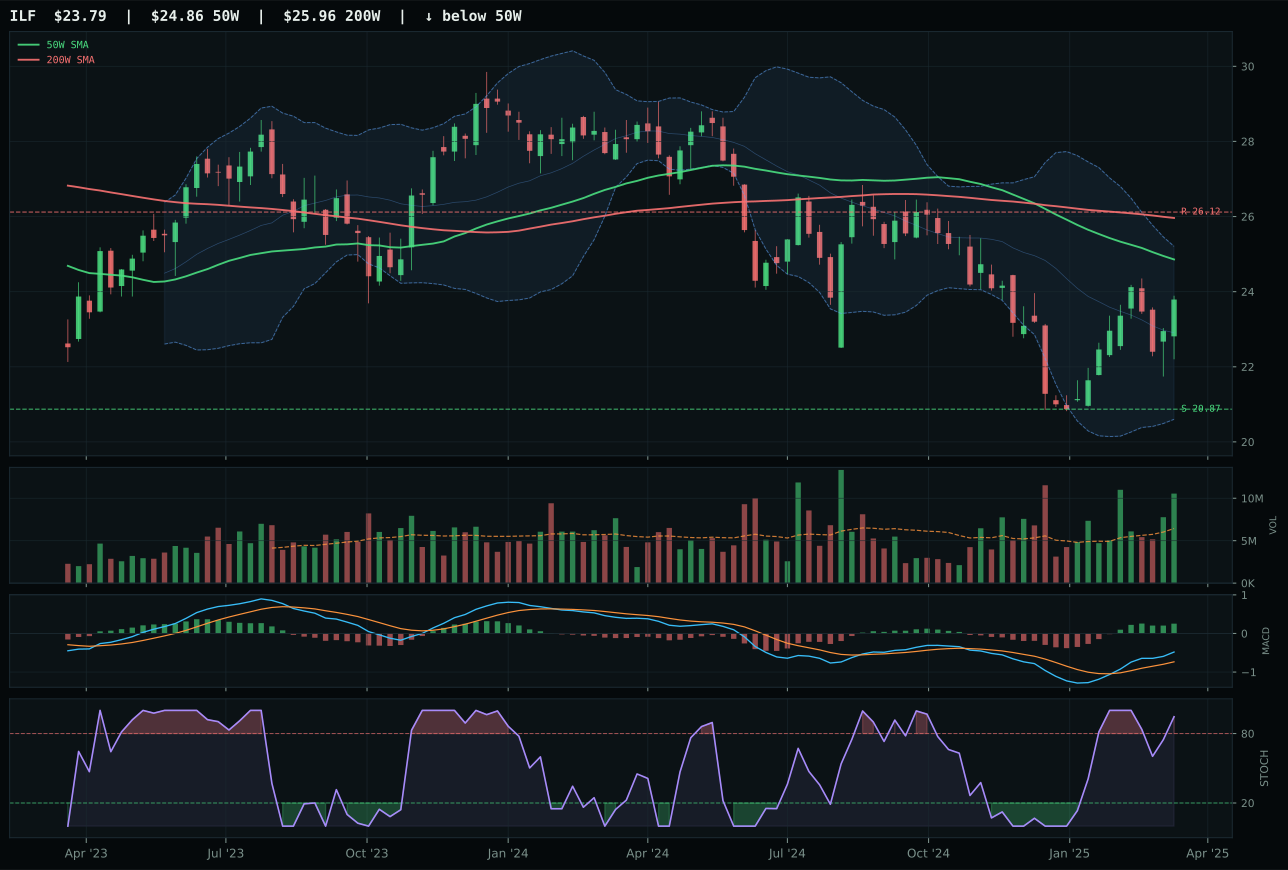
ILF has a neutral structure profile with 9.4% 13-week relative strength versus SPY.
Extension and support failure are the main tactical risks.
Tracked, but not top-2 eligible because: structurally broken.
IEMG dominates the Emerging Markets category on the strength of superior trend confirmation, better MACD alignment, and a cleaner compression-near-50W structure that beats both INDA's pullback-into-support and ILF's neutral setup. IEMG's 100/100 trend score, bullish-and-improving MACD, and 80.3/100 structure cleanness create a three-factor convergence that INDA cannot match; INDA's bearish-but-improving MACD and -5.1% SPY relative strength disqualify it despite solid risk/reward at 90. ILF's overbought-momentum stochastic RSI and accumulation-level volume paint a picture of climax, while IEMG's overbought-rolling-over stochastic shows a leadership signal that has room to extend. The 1.9% distance to IEMG's 50-week average is tight enough to signal strength without excessive extension; compression near the 50W offers expansion potential with defined support at 51.19. Category-relative strength of 0.0% is neutral on paper, but INDA's -11.8% lagging proves IEMG is the true representative of broad emerging-market beta in this regime.
Traditional Energy — XLE
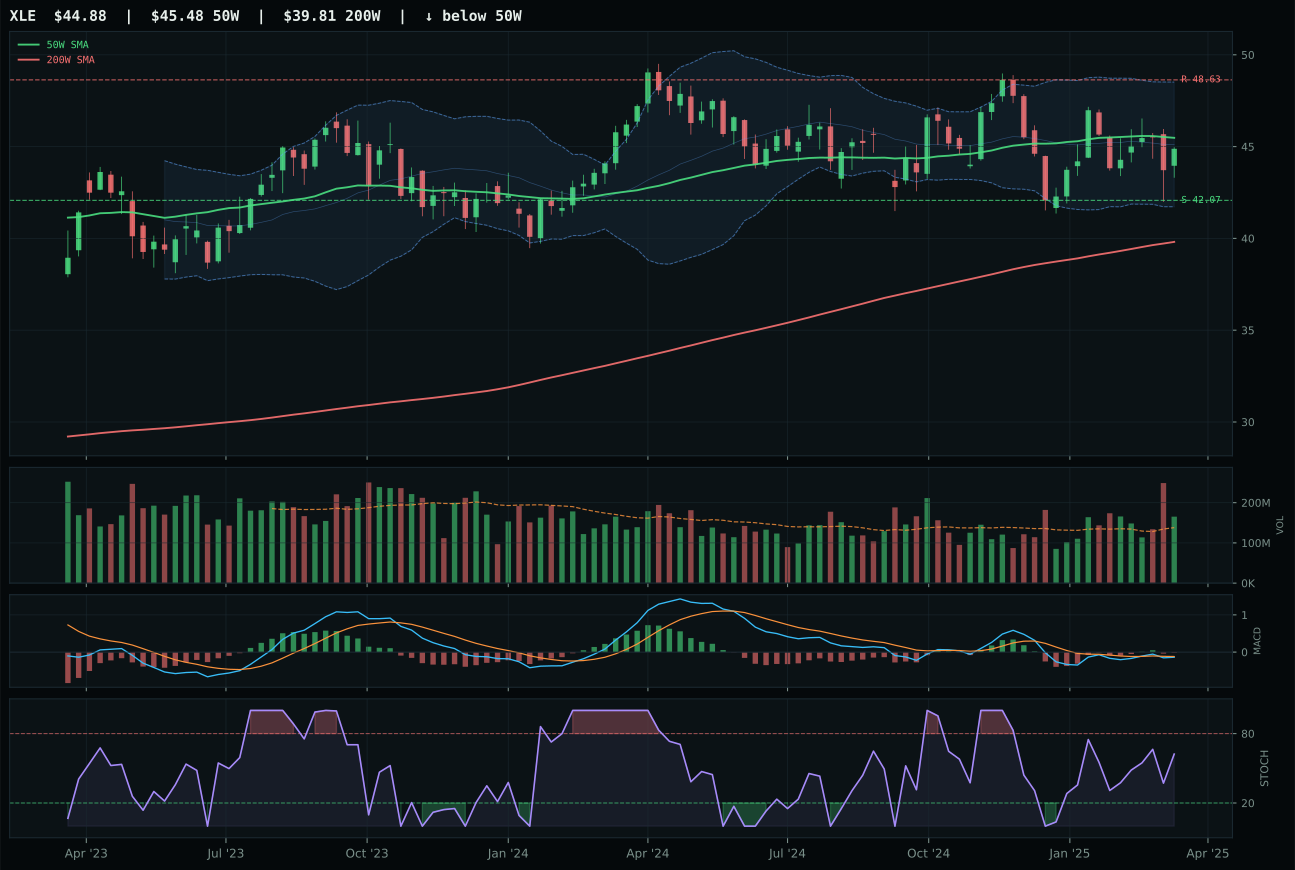
XLE has a compression near 50W profile with 7.5% 13-week relative strength versus SPY.
A failed hold above support would weaken the setup.
Actionable but governed by invalidation levels.
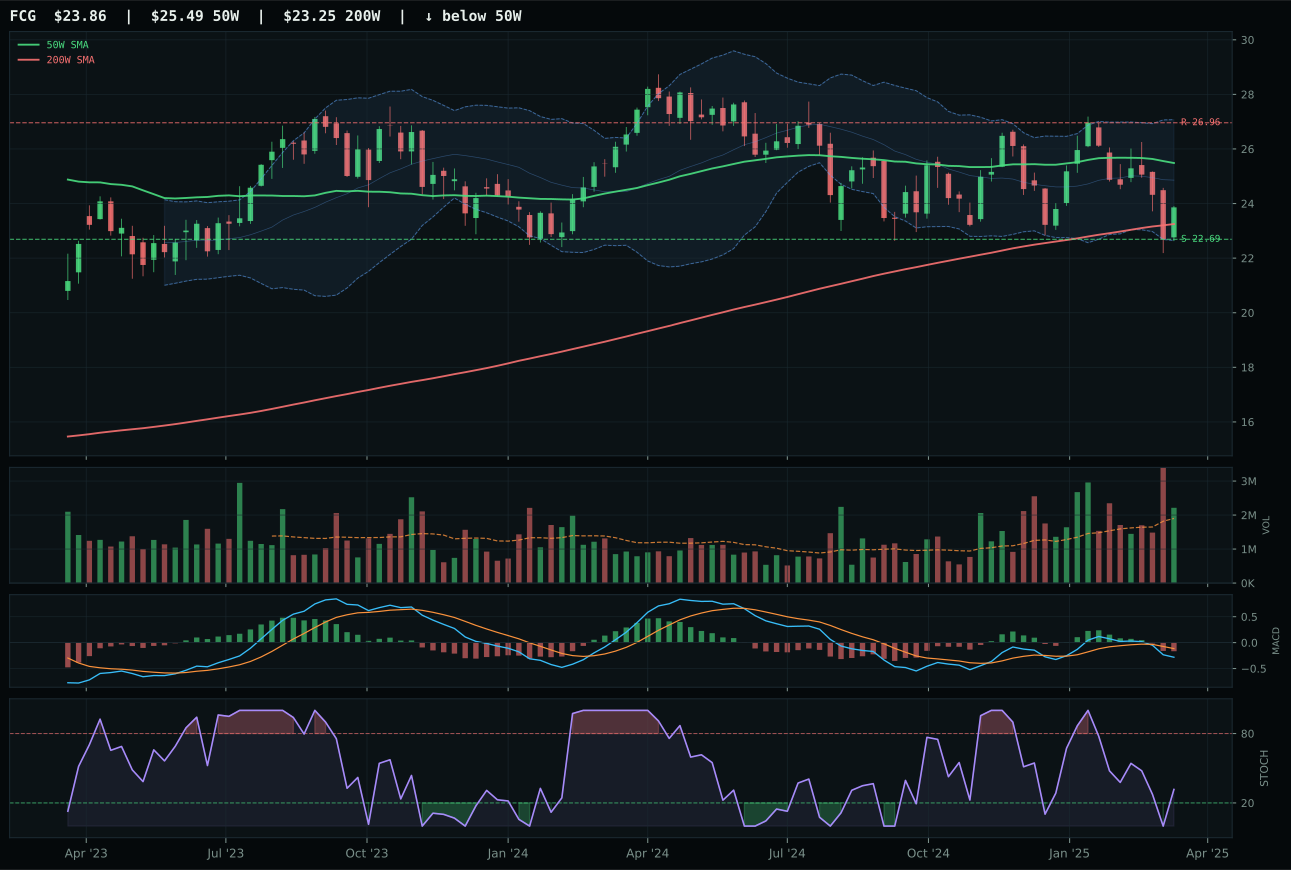
FCG has a neutral structure profile with 3.6% 13-week relative strength versus SPY.
A failed hold above support would weaken the setup.
Actionable but governed by invalidation levels.
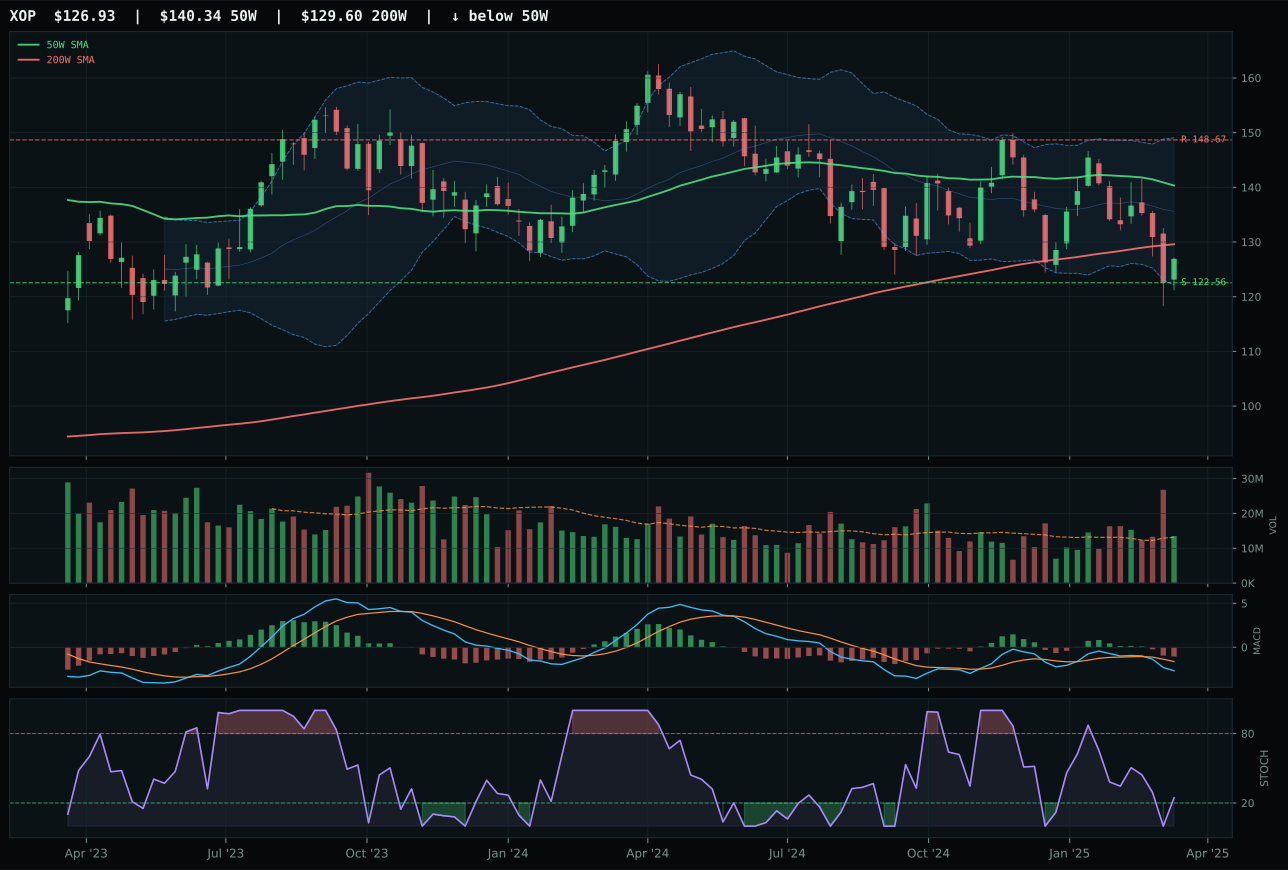
XOP has a pullback into support profile with 0.2% 13-week relative strength versus SPY.
A failed hold above support would weaken the setup.
Actionable but governed by invalidation levels.
XLE wins Traditional Energy with a perfect 100.0/100 timing score—the highest across any ETF in the category—driven by its compression-near-50W setup, rising-mid-zone stochastic RSI at 0.62, and bearish-but-improving MACD that signals early reversal potential. Sitting -1.2% from the 50-week moving average places XLE in a decision zone where support at 42.07 is near at hand, making this a defined mean-reversion trade with high-probability risk management. FCG's timing of 77.0 and XOP's 80.0 both lag significantly, with FCG's stochastic falling/neutral and both failing to capture the early-stage momentum flip that MACD improvement represents. Structure at 81.3 for XLE edges FCG's 72.7, reflecting cleaner compression versus FCG's neutral structure. The 3.8% category-relative strength confirms that integrated energy is outperforming pure-play oil and gas majors; institutions are rotating into cash-flow defensibility over commodity beta. Above-average volume at 1.20x the 20-week average is participation, not distribution—accumulation into support.
Agriculture & Livestock — VEGI
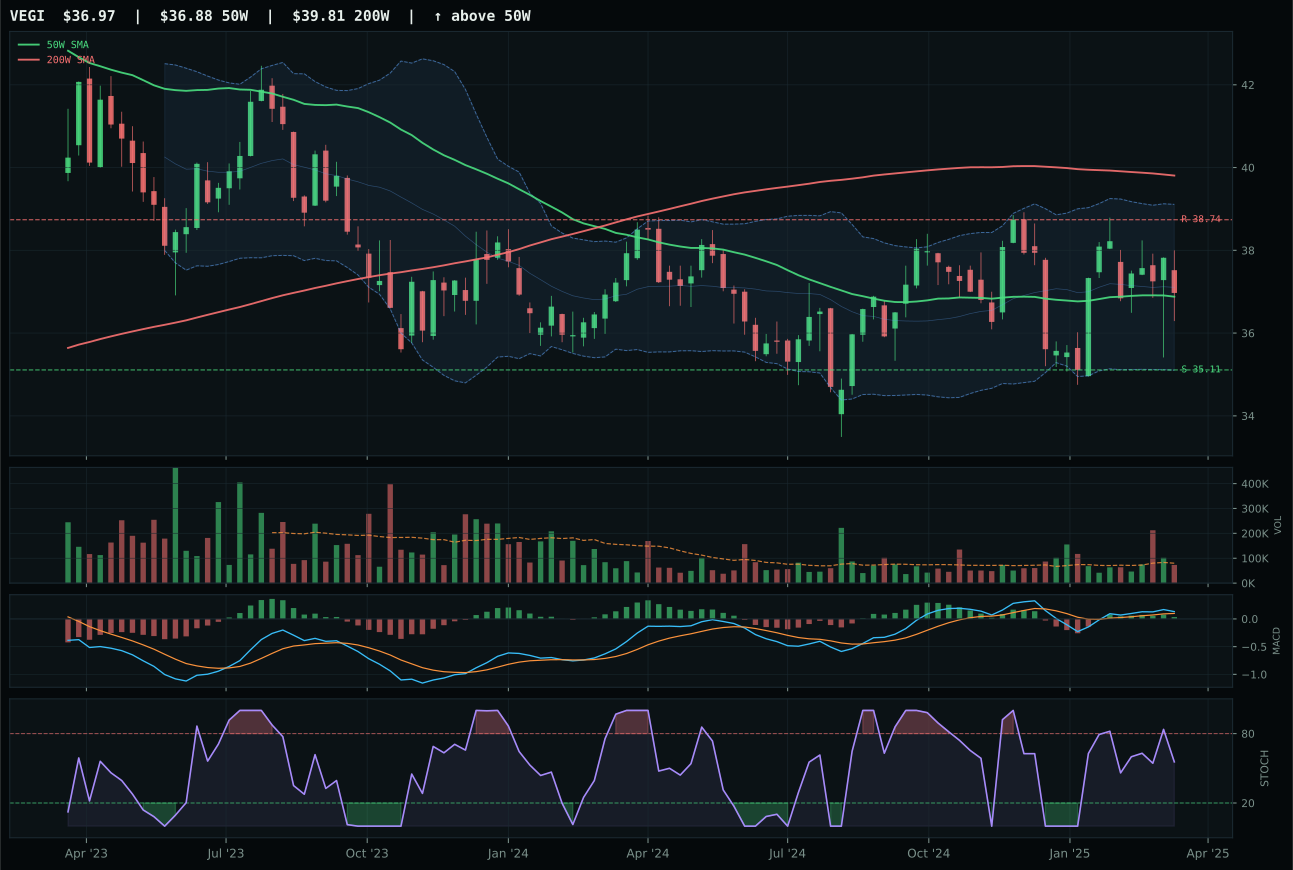
VEGI has a compression near 50W profile with 4.3% 13-week relative strength versus SPY.
A failed hold above support would weaken the setup.
Tracked, but not top-2 eligible because: .
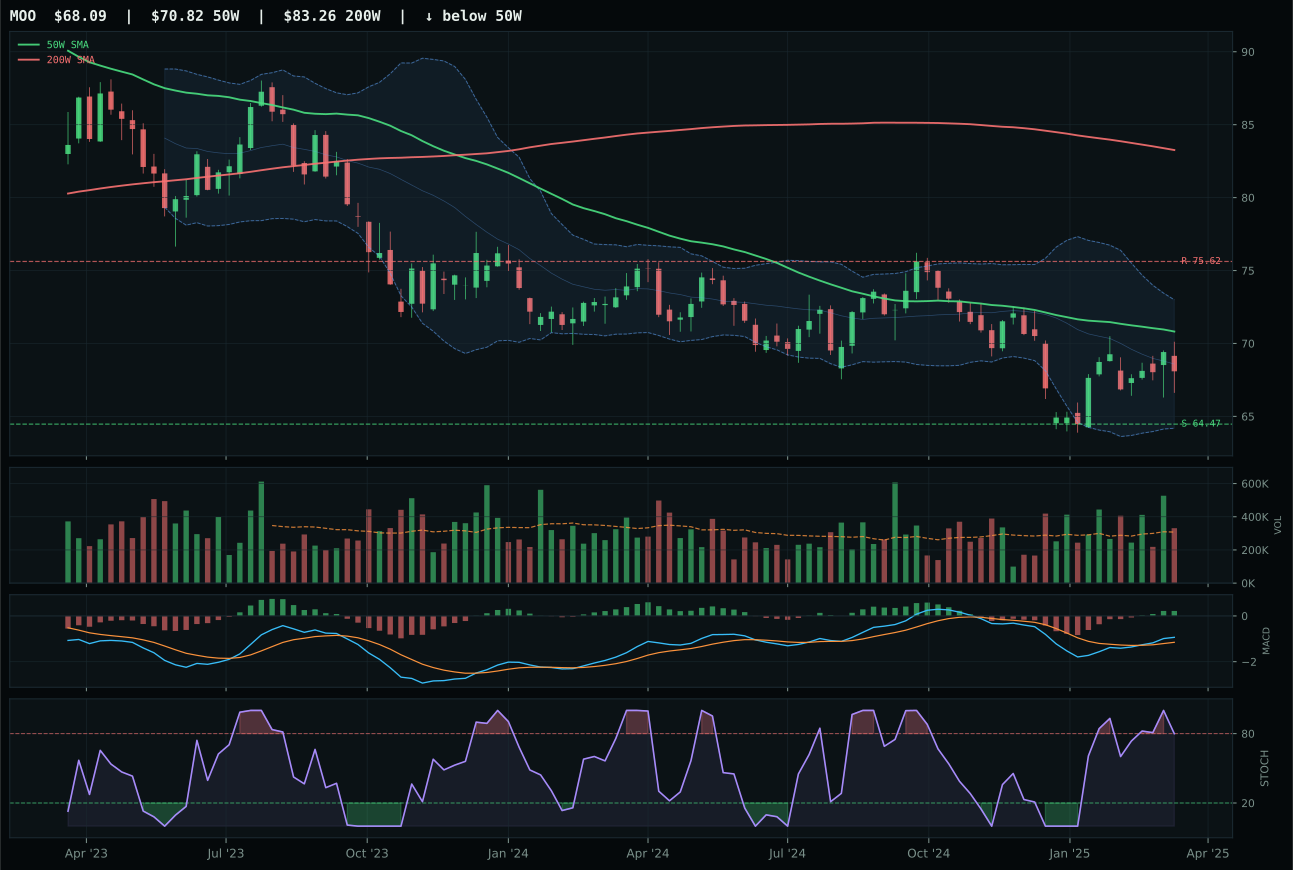
MOO has a neutral structure profile with 3.4% 13-week relative strength versus SPY.
Extension and support failure are the main tactical risks.
Tracked, but not top-2 eligible because: structurally broken.
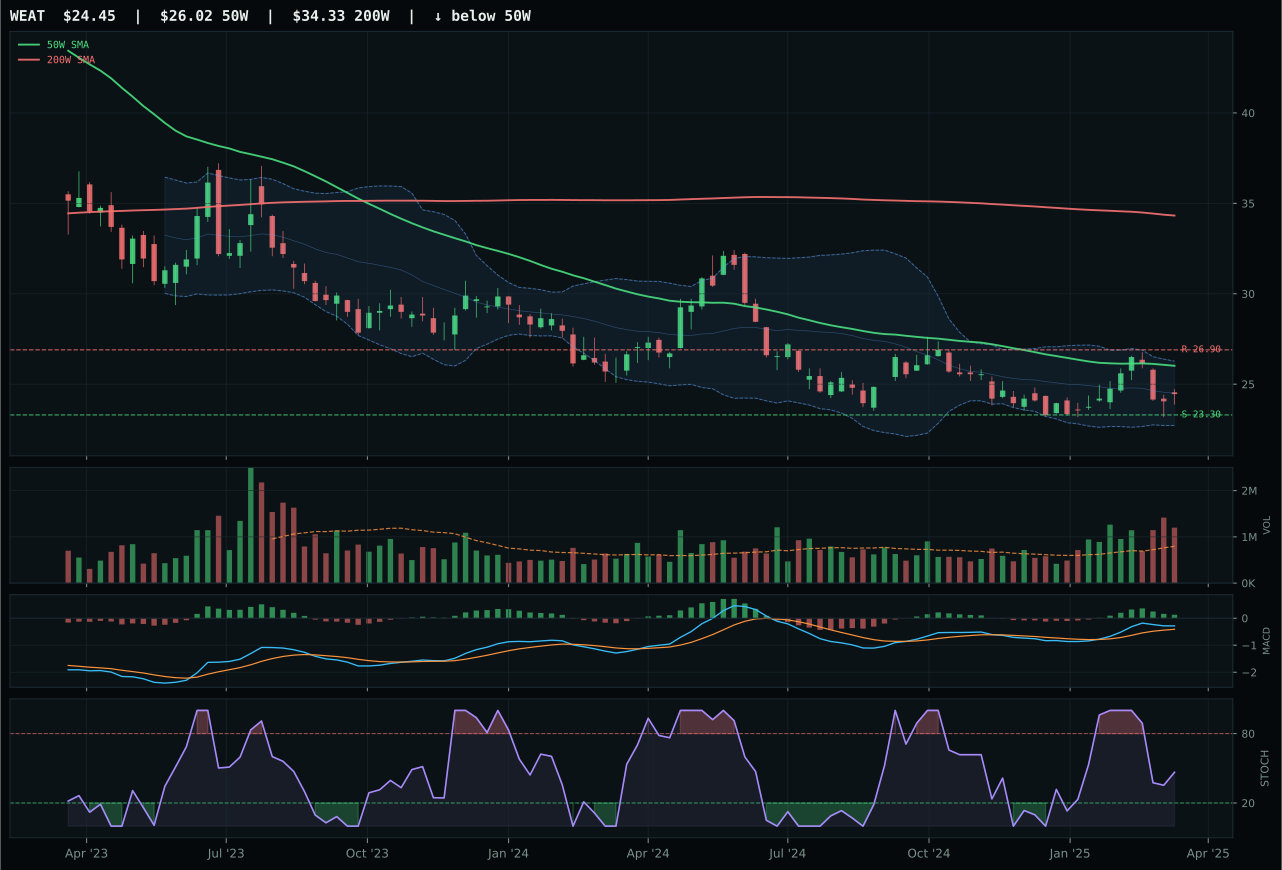
WEAT has a pullback into support profile with 8.3% 13-week relative strength versus SPY.
Extension and support failure are the main tactical risks.
Tracked, but not top-2 eligible because: structurally broken.
VEGI edges MOO and WEAT despite a deceptively weak absolute setup, winning primarily on the margin of timing and structure cleanliness in a category where all three names face serious macro headwinds. VEGI's 95.0/100 timing score—driven by its razor-thin 0.2% distance to the 50-week moving average, bullish-but-flattening MACD, and Fibonacci upper retracement placement—beats MOO's 90.0 by enough to matter when structure scores are separated by 27.3 points (72.1 vs. 44.8). The compression-near-50W setup offers expansion potential if support holds, whereas MOO's neutral structure is mechanically broken by the reasoner's hard filters. Volume is neutral across both at 0.91x and 1.0x their 20-week averages, eliminating any liquidity advantage. This is a choice between two weak hands; VEGI simply has a tighter setup and fewer structural red flags, though both remain farm-sector bargains waiting for a macro catalyst that has not yet materialized.