
2025-03-07
Informational purposes only. The content in this report, including allocations, analysis, and commentary, is provided solely for informational and educational purposes. It does not constitute financial advice, investment advice, trading advice, or any other type of advice. Past performance does not guarantee future results. Always conduct your own research and consult a qualified financial professional before making investment decisions.
Weekly Allocation
| Ticker | Category | Weight | Role |
|---|---|---|---|
| FBTC | 50% | Overlay | |
| GLD | Precious Metals | 10% | Top-2 (10%) |
| IGF | Utilities & Infrastructure | 10% | Top-2 (10%) |
| ITA | Defense & Aerospace | 5% | Tier-2 (5%) |
| VEGI | Agriculture & Livestock | 5% | Tier-2 (5%) |
| CIBR | Technology | 5% | Tier-2 (5%) |
| AIQ | AI | 5% | Tier-2 (5%) |
| FCG | Traditional Energy | 5% | Tier-2 (5%) |
| IEMG | Emerging Markets | 5% | Tier-2 (5%) |
Trade Instructions — Monday Open
Sell the tranche from 2025-02-07 (completing its 4-week hold). Buy the new tranche. Instructions show net portfolio changes — same-asset positions cancel, weight changes show the delta.
| Action | Ticker | Instruction |
|---|---|---|
| SELL | PAVE | Sell entire PAVE position (2.50% of portfolio) |
| SELL | WEAT | Sell 50% of WEAT position (reduce 2.50% → 1.25%) |
| SELL | NLR | Sell 25% of NLR position (reduce 5.00% → 3.75%) |
| SELL | XLE | Sell 50% of XLE position (reduce 2.50% → 1.25%) |
| BUY | IEMG | Buy IEMG — 20.00% of freed cash (adds 1.25% to portfolio) |
| BUY | VEGI | Buy VEGI — 20.00% of freed cash (adds 1.25% to portfolio) |
| BUY | IGF | Buy IGF — 40.00% of freed cash (adds 2.50% to portfolio) |
| BUY | FCG | Buy FCG — 20.00% of freed cash (adds 1.25% to portfolio) |
Current Portfolio After Trade
Combined holdings across all 4 active tranches. Each tranche is 25% of the portfolio.
| Ticker | % of Portfolio | Weight Bar |
|---|---|---|
| FBTC | 50.00% | |
| GLD | 10.00% | |
| XLU | 7.50% | |
| ITA | 5.00% | |
| AIQ | 3.75% | |
| CIBR | 3.75% | |
| NLR | 3.75% | |
| IEMG | 3.75% | |
| VEGI | 2.50% | |
| IGF | 2.50% | |
| WEAT | 1.25% | |
| XLE | 1.25% | |
| COPX | 1.25% | |
| XLK | 1.25% | |
| BOTZ | 1.25% | |
| FCG | 1.25% |
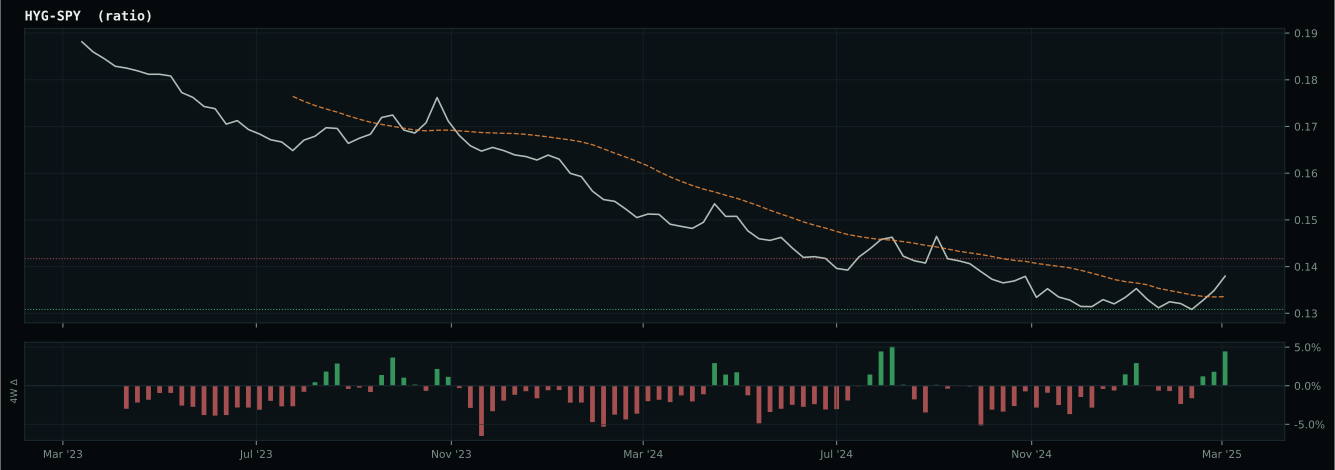
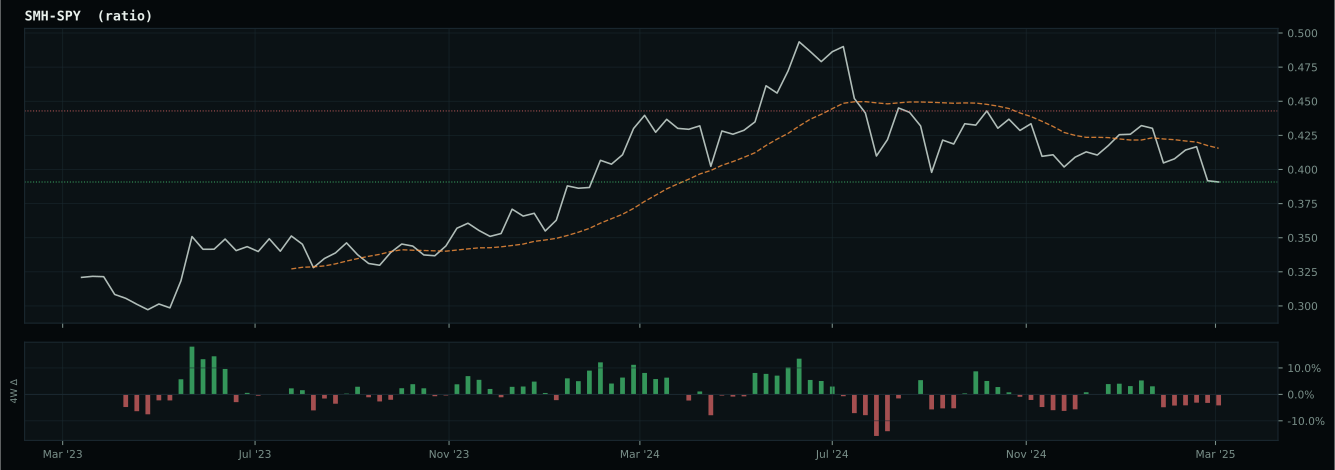
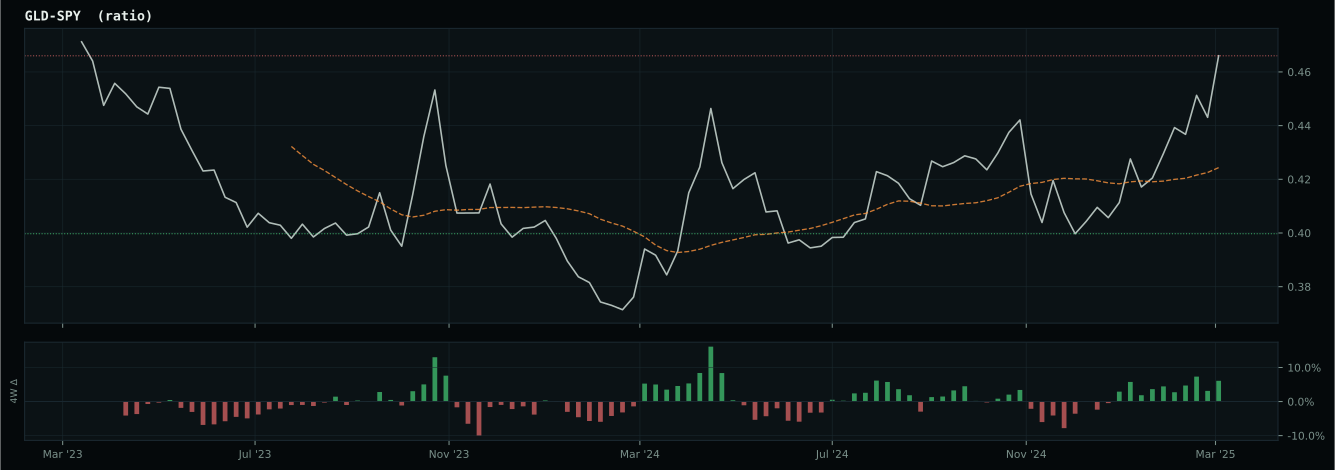
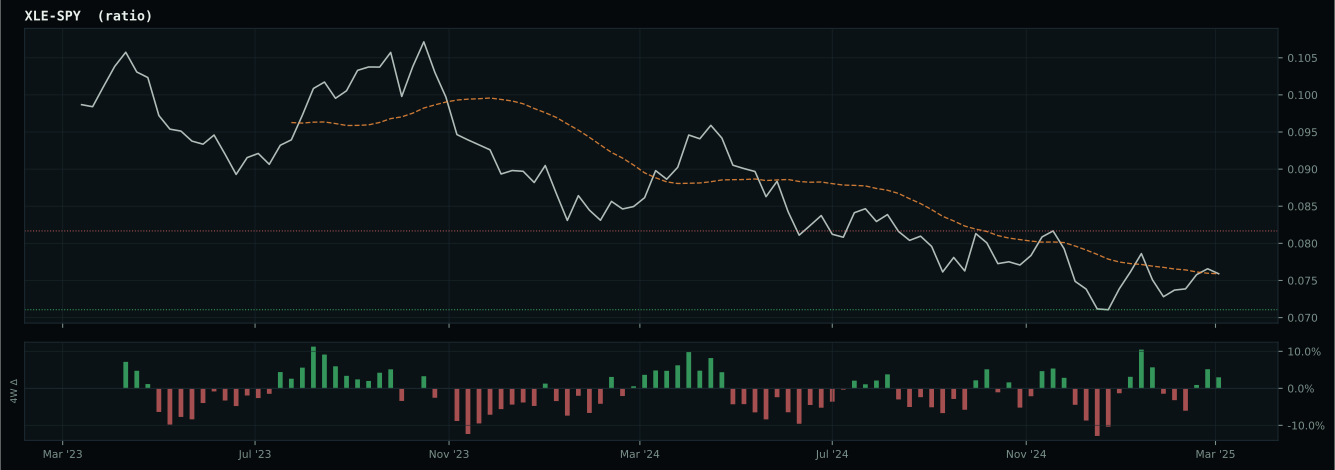
Macro Regime — Disinflation
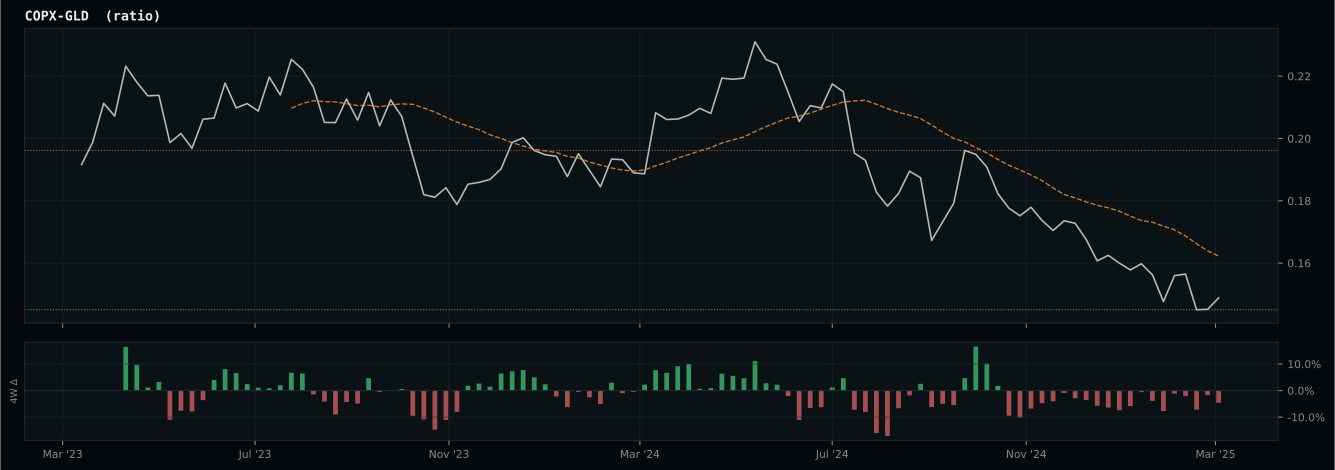
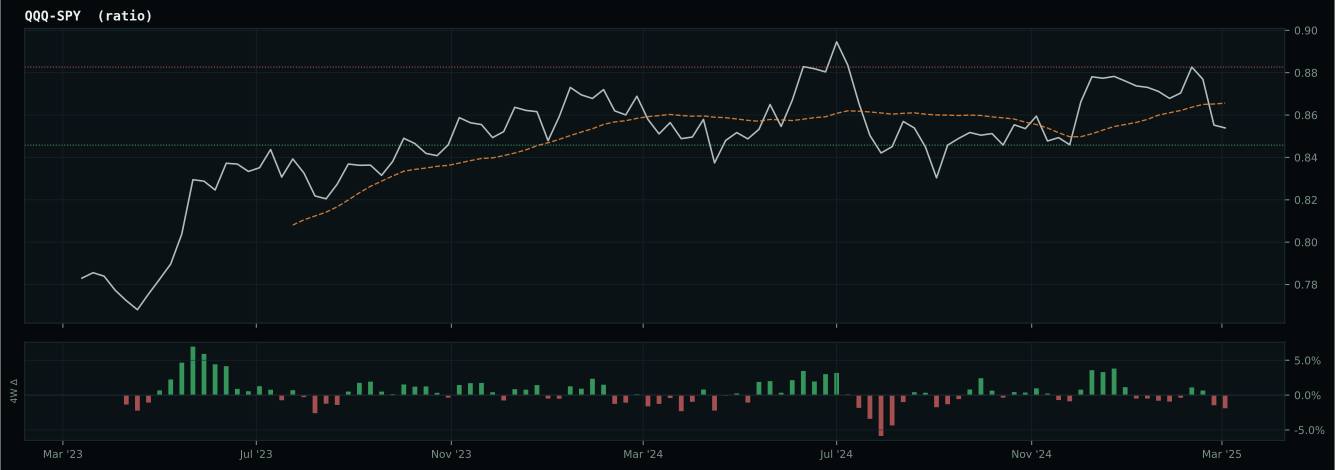
growth data is not confirming the weak market-implied risk appetite signal
Macro Evidence Charts
Market-implied signals behind the macro regime scores. Each ratio compares two assets; the direction and slope of the ratio is what the macro engine reads.
Crypto Regime — TrendBTC
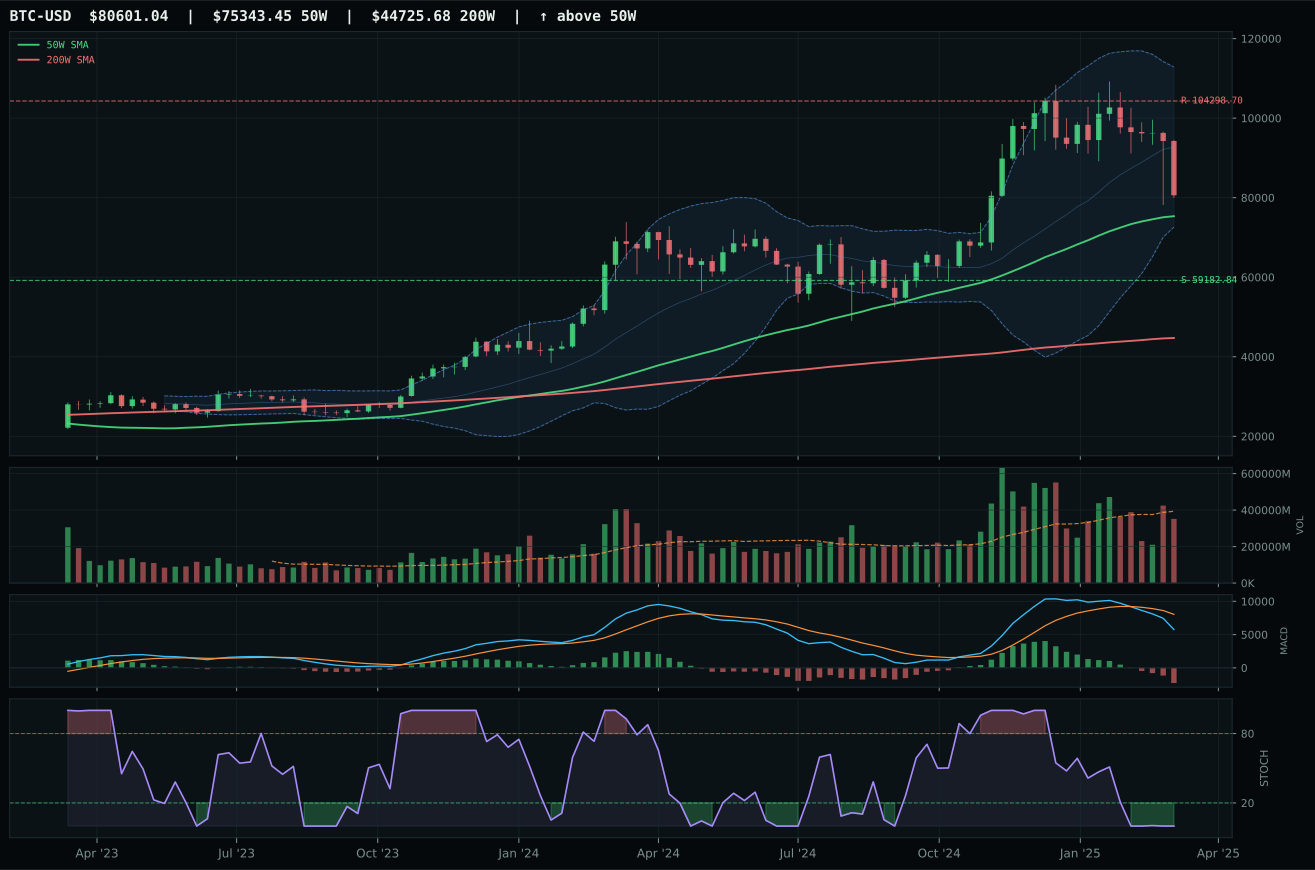
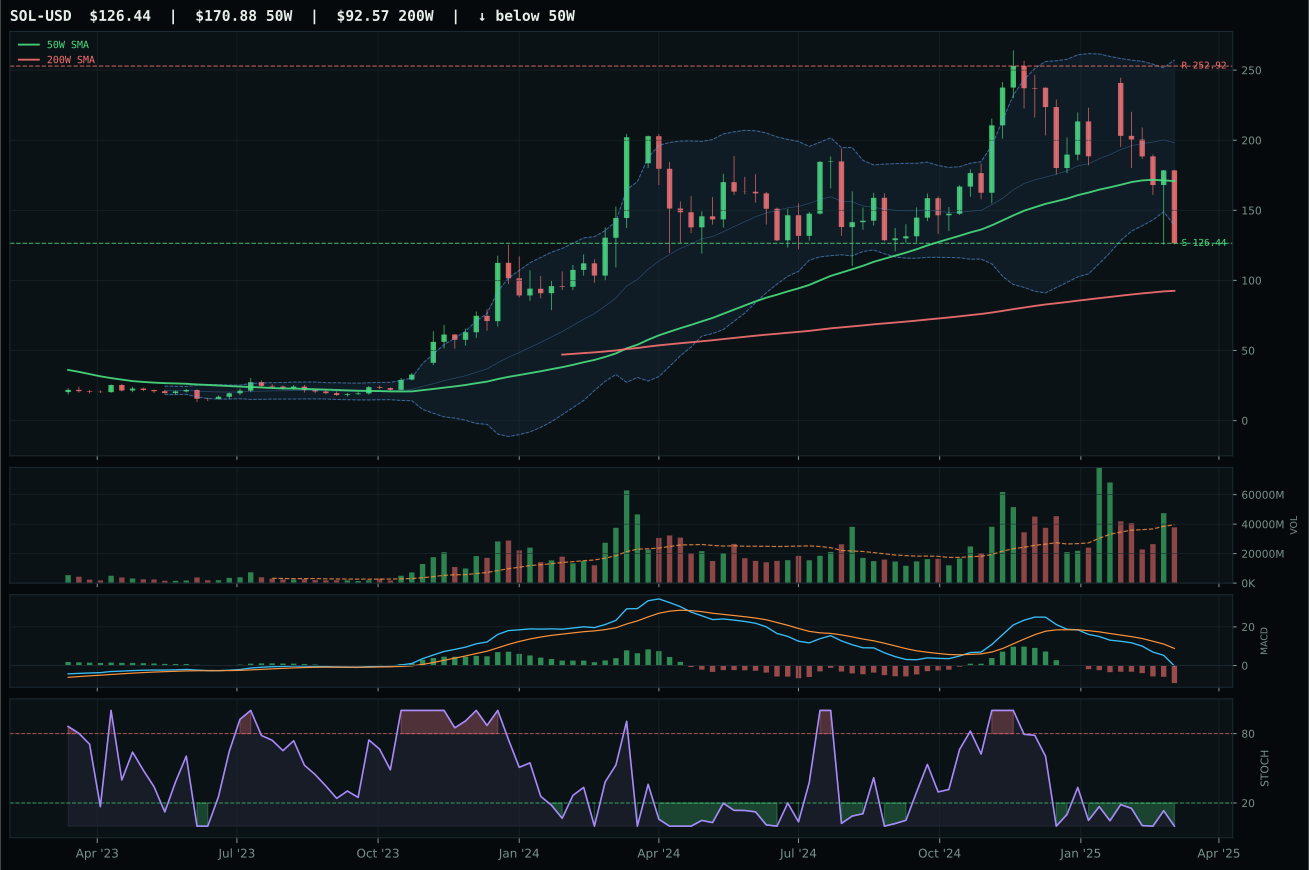
ValueBTC not armed: BTC has not made the first post-breakdown touch of the 200W buy zone after losing the 50W
TrendBTC confirmed: 2 consecutive closes above rising/flat 50W SMA
one or more available conditions failed
Category Rankings
| Rank | Category | Winner | Score | Alloc | 4W Ret | Peers (4W) |
|---|---|---|---|---|---|---|
| 1 | Precious Metals | GLD | 82.0 | 20% | +4.20% | GDX -1.6% · SLV -7.6% |
| 2 | Utilities & Infrastructure | IGF | 60.0 | 20% | -4.23% | XLU -4.7% · PAVE -12.8% |
| 3 | Defense & Aerospace | ITA | 44.6 | 10% | -11.07% | XAR -12.0% · ROKT -13.6% |
| 4 | Technology | CIBR | 39.1 | 10% | -13.98% | XLK -18.3% · IGV -15.0% |
| 5 | AI | AIQ | 32.8 | 10% | -17.52% | BOTZ -21.6% · SMH -21.0% |
| 6 | Emerging Markets | IEMG | 19.6 | 10% | -11.18% | INDA +1.1% · ILF -4.9% |
| 7 | Nuclear Energy | URA | 18.4 | 10% | -13.93% | NLR -12.1% · URNM -15.5% |
| 8 | Industrial Metals | COPX | 13.6 | 10% | -20.42% | PICK -17.3% · REMX -18.9% |
| 9 | Agriculture & Livestock | VEGI | — | 0% | -9.94% | MOO -12.4% · WEAT -4.9% |
| 10 | Traditional Energy | FCG | — | 0% | -13.84% | XLE -13.3% · XOP -16.6% |
Precious Metals — GLD
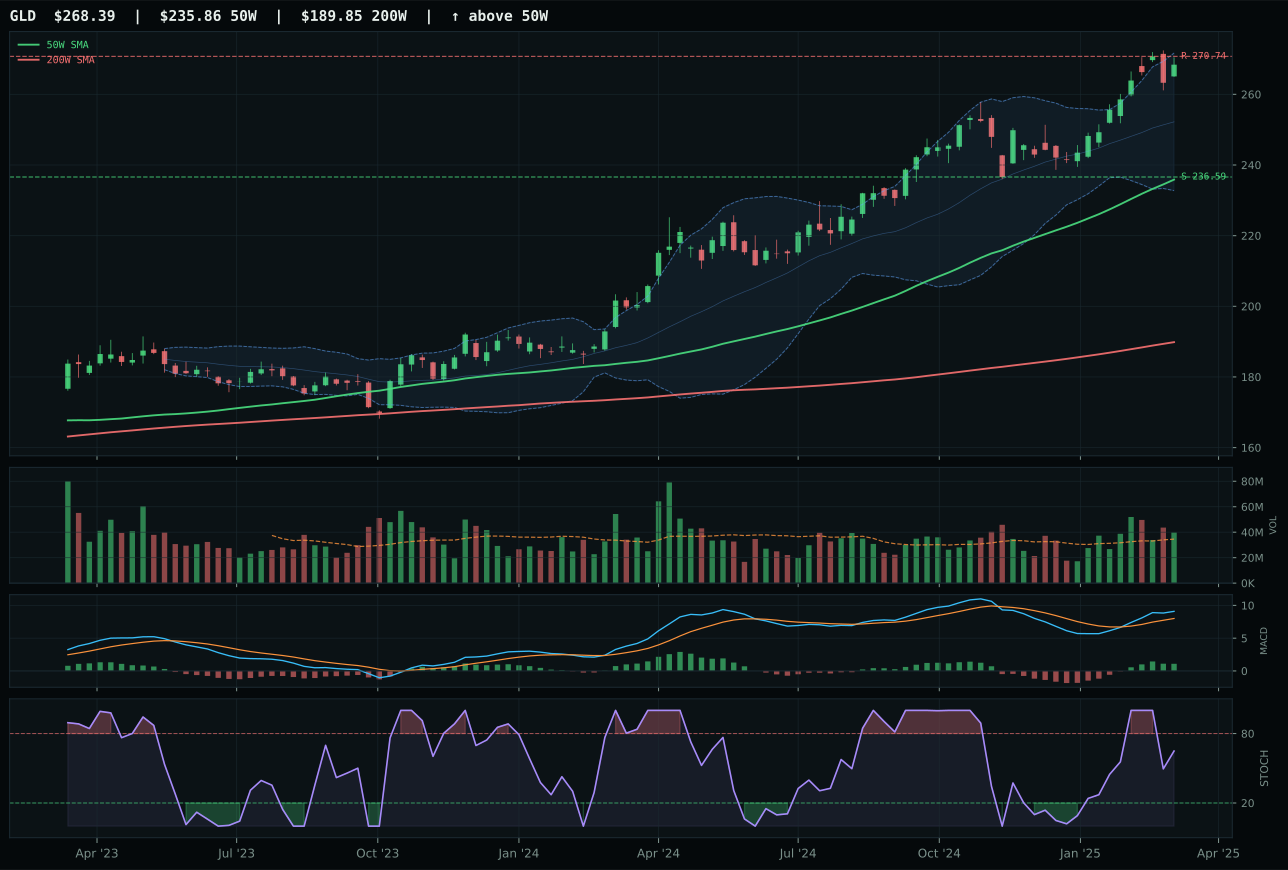
GLD has a neutral structure profile with 15.7% 13-week relative strength versus SPY.
A failed hold above support would weaken the setup.
Actionable but governed by invalidation levels.
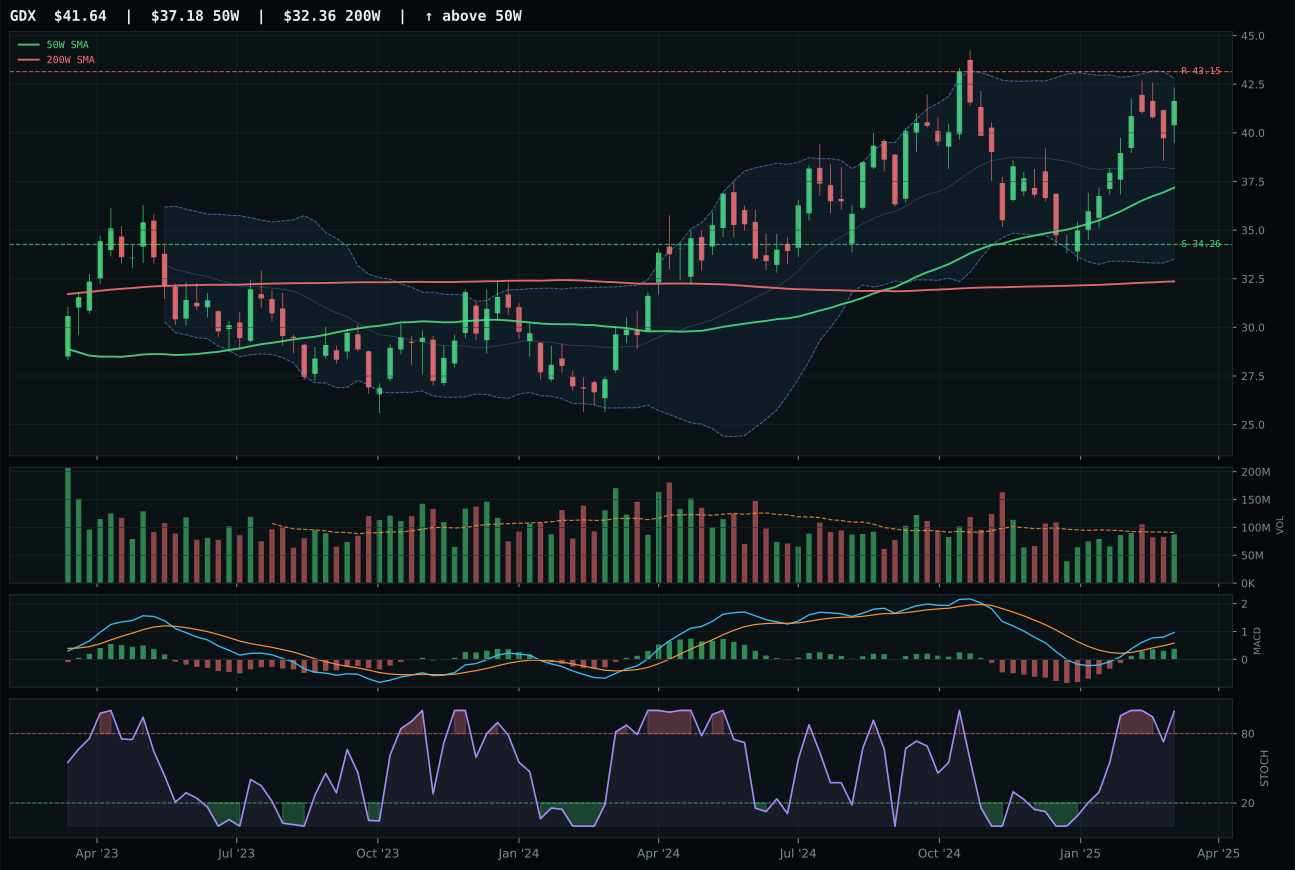
GDX has a neutral structure profile with 18.3% 13-week relative strength versus SPY.
A failed hold above support would weaken the setup.
Actionable but governed by invalidation levels.
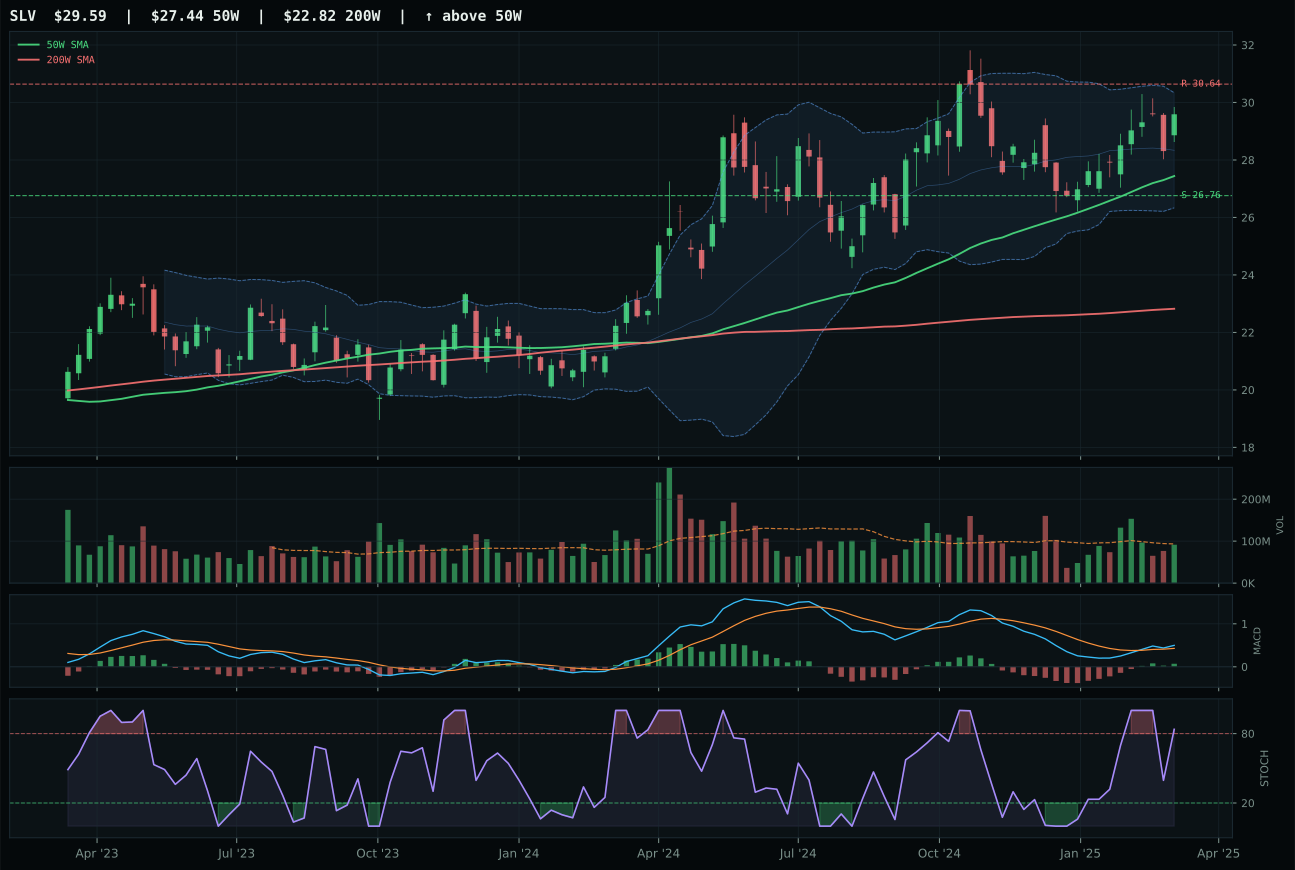
SLV has a neutral structure profile with 10.0% 13-week relative strength versus SPY.
A failed hold above support would weaken the setup.
Actionable but governed by invalidation levels.
GLD seized the Precious Metals top-2 slot through dominant trend execution and macro alignment that made it the portfolio's cleanest bullish expression. Price sits 13.8% above the 50W with a 0.6% slope still intact, RS of 15.7% versus SPY and 0% within category placed GLD at leadership—not extended beyond reason but clear. The critical differentiator against GDX: GLD's timing score (67.0) bested GDX's (57.0) because stochastic RSI remained in falling/neutral zone (0.65) rather than rolling over overbought, signaling sustainable upside rather than exhaustion. Volume confirmation at 1.15x 20W above-average meant institutional buyers were supporting the level. GLD's MACD bullish/improving on top of the 10.5% 13W return created a setup where the backup is strong but acceleration remains possible if monetary hedge bid +14 descriptor continues.
Precious Metals scores 82.0 and claims a top-2 slot because monetary hedge bid is the single strongest category-level tailwind in the system (+14), and disinflation as the macro regime delivers a +8 boost on top of that. Category-level macro fit of 85 is exceptional, and technical evidence of 86.5 for the representative (GLD) matches that strength. The 3/2/1 weighted basket of GLD, GDX, and SLV starts at 77.9, and the category reasoner's test confirms no hard filters are active and persistence is solid at 76.3. In a disinflation environment where monetary policy becomes a stabilizer and risk assets face structural headwinds, gold as both portfolio insurance and macro bet earns its 10% allocation as the second-highest-conviction category. The combination of technical trend strength (100), momentum confirmation (100), and tailored macro narrative makes this a core defensive holding, not a speculative hedge.
Utilities & Infrastructure — IGF
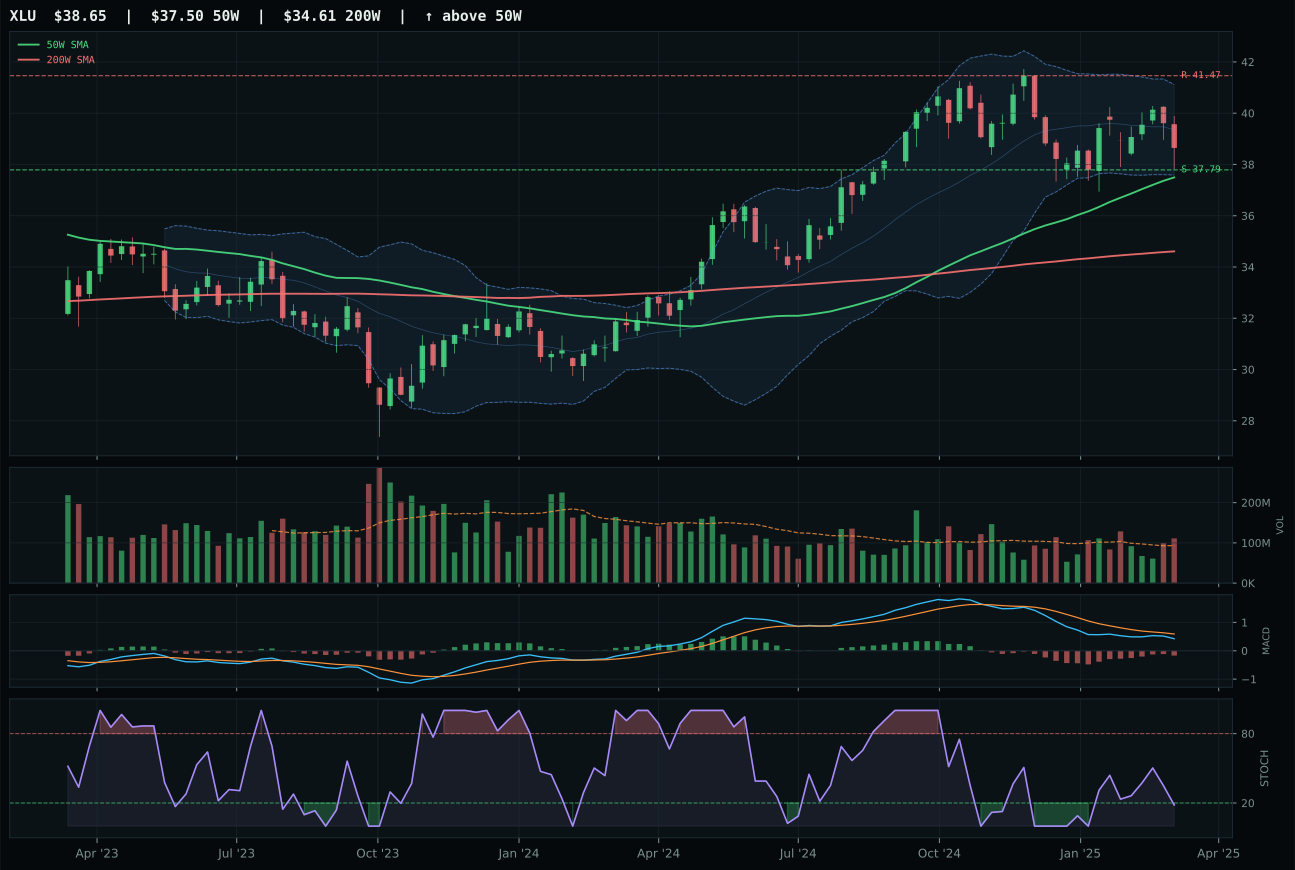
XLU has a pullback into support profile with 2.2% 13-week relative strength versus SPY.
A failed hold above support would weaken the setup.
Actionable but governed by invalidation levels.
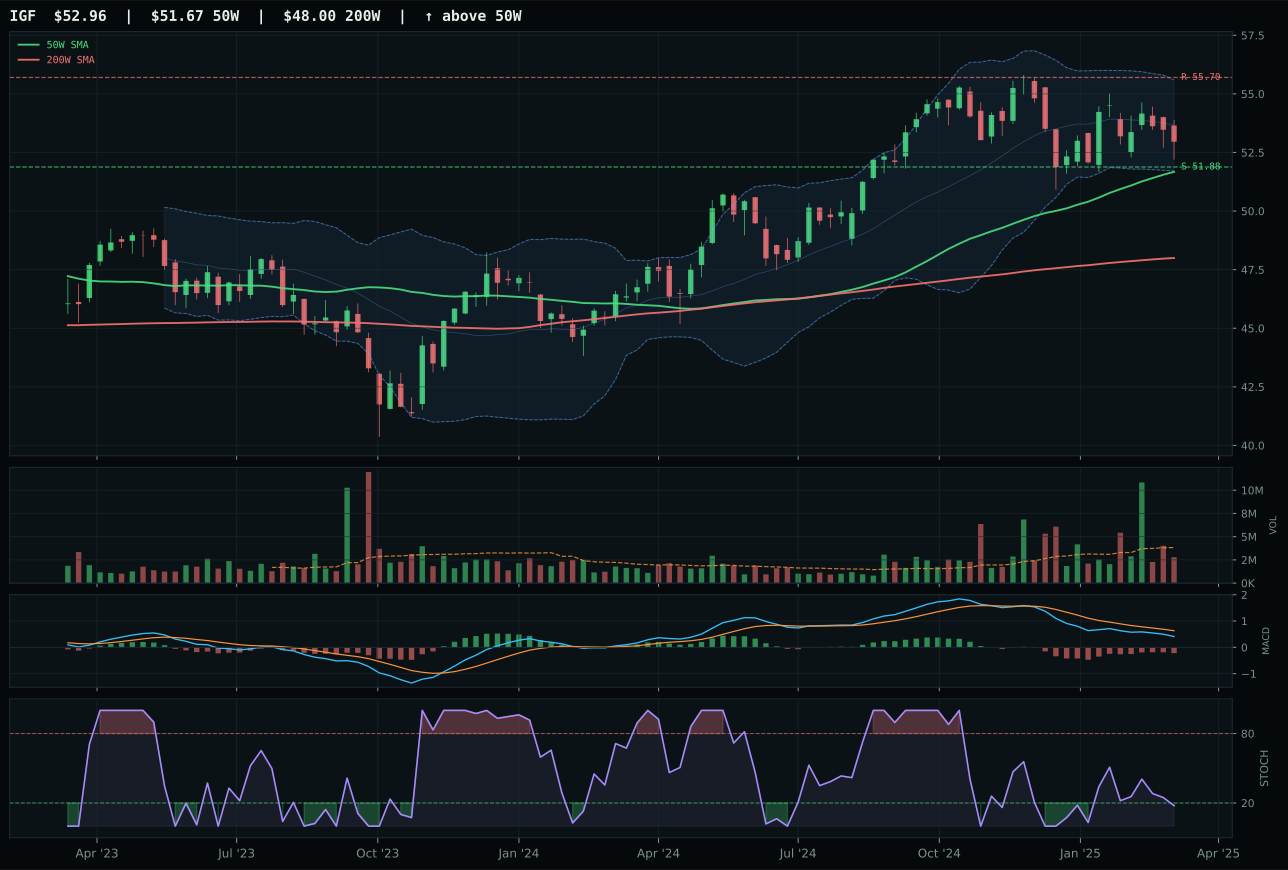
IGF has a pullback into support profile with 1.9% 13-week relative strength versus SPY.
A failed hold above support would weaken the setup.
Actionable but governed by invalidation levels.
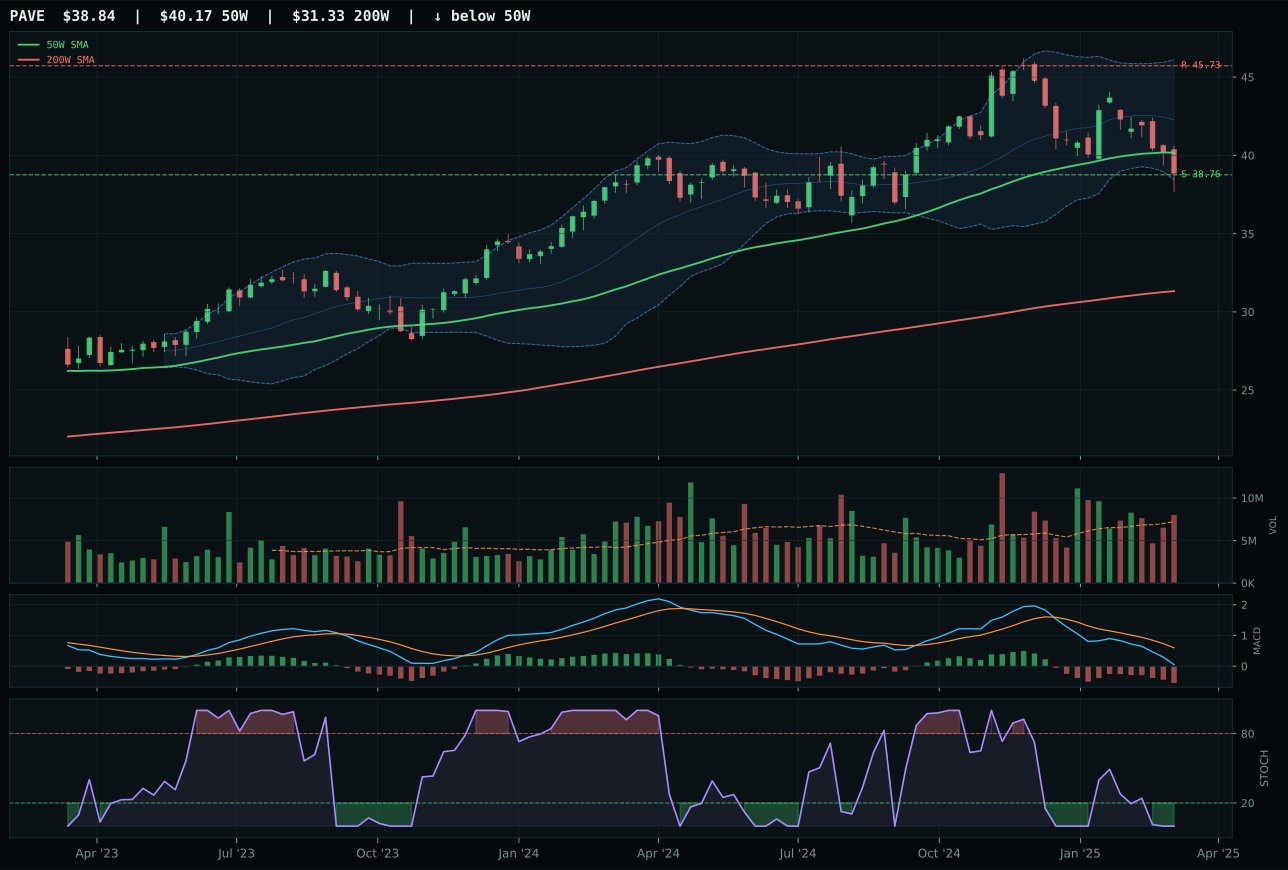
PAVE has a pullback into support profile with -8.0% 13-week relative strength versus SPY.
A failed hold above support would weaken the setup.
Actionable but governed by invalidation levels.
IGF claimed the Utilities & Infrastructure top-2 slot by executing a cleaner pullback-into-support setup than XLU despite a narrower margin in overall technical evidence. IGF's 95.8% trend score tied XLU's excellence, yet the differentiator came from timing (100.0/100 for both) combined with support structure at 51.88 only 2.5% away from the 50W, providing a defined invalidation zone. XLU carried better macro alignment (+12 defensive rotation vs +5 for IGF) but settled for runner-up status because IGF's compression efficiency (85.6) and Fib positioning at 0.236 (53.29) created the tighter setup. Volume divergence mattered: IGF's thin participation (0.73x) versus XLU's above-average (1.15x) shifted narrative from institutional commitment to stealth accumulation—a bullish timing indicator when support holds.
Utilities & Infrastructure scores 60.0 and claims the second 10% allocation slot because defensive rotation is active at +12 and disinflation pressure is active at +6, creating tailored macro support. Category-level macro fit of 76 is exceptional, and technical evidence of 73.6 for the representative (IGF) is rock-solid. The 3/2/1 weighted basket of XLU, IGF, and PAVE begins at 64.7 (the highest non-precious-metals starting point), and the reasoner confirms no hard filters are active. IGF's timing of 100 combined with pullback-into-support structure at 51.88 creates a defined invalidation level that defensive rotations respect, and the category's macro profile aligns perfectly with disinflation regime assumptions: income-yielding defensive assets that provide both yield stability and capital preservation. This 10% allocation is strategic rather than tactical because macro tailwind is structural, technical execution is sound, and the category ranks second only to Precious Metals in both technical evidence and macro narrative fit.
Defense & Aerospace — ITA
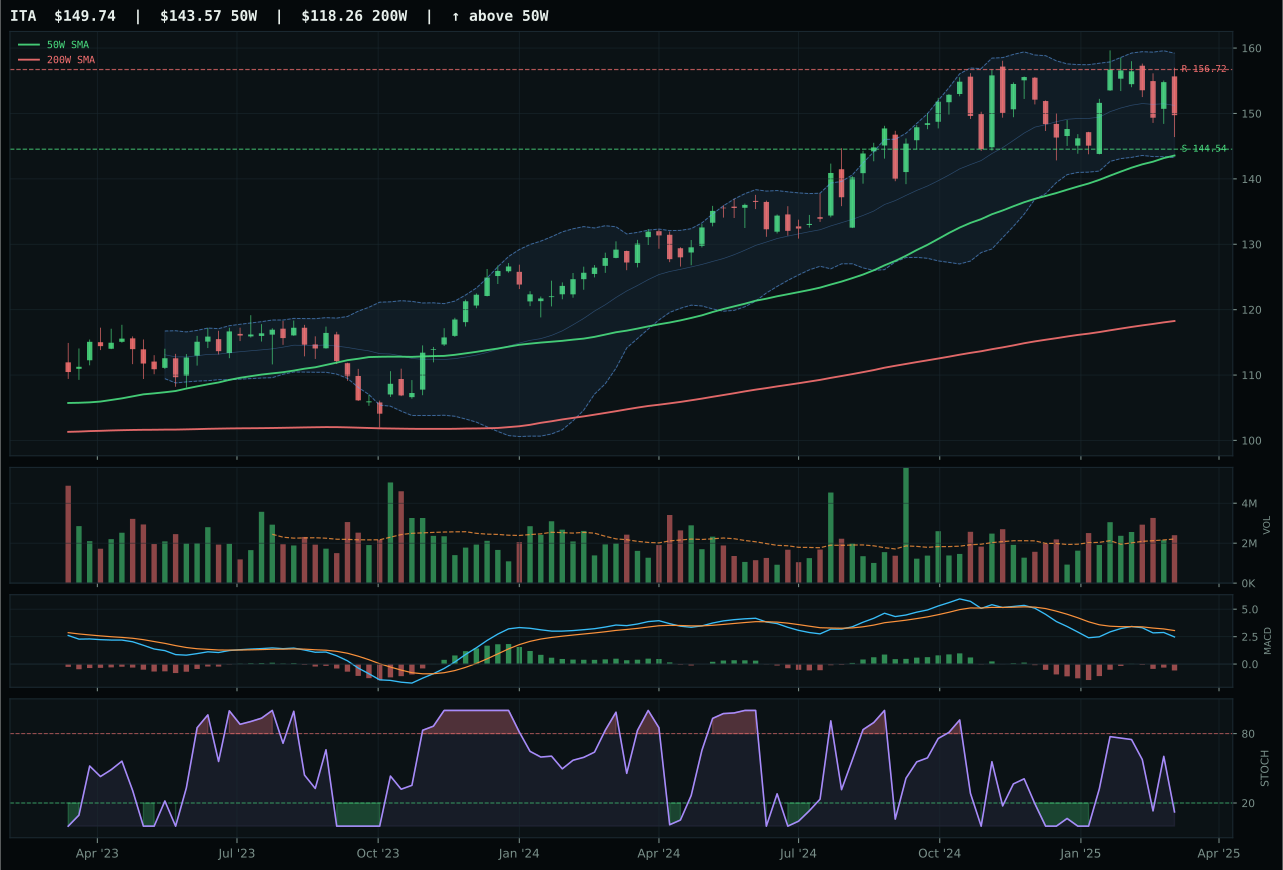
ITA has a pullback into support profile with 3.7% 13-week relative strength versus SPY.
A failed hold above support would weaken the setup.
Actionable but governed by invalidation levels.
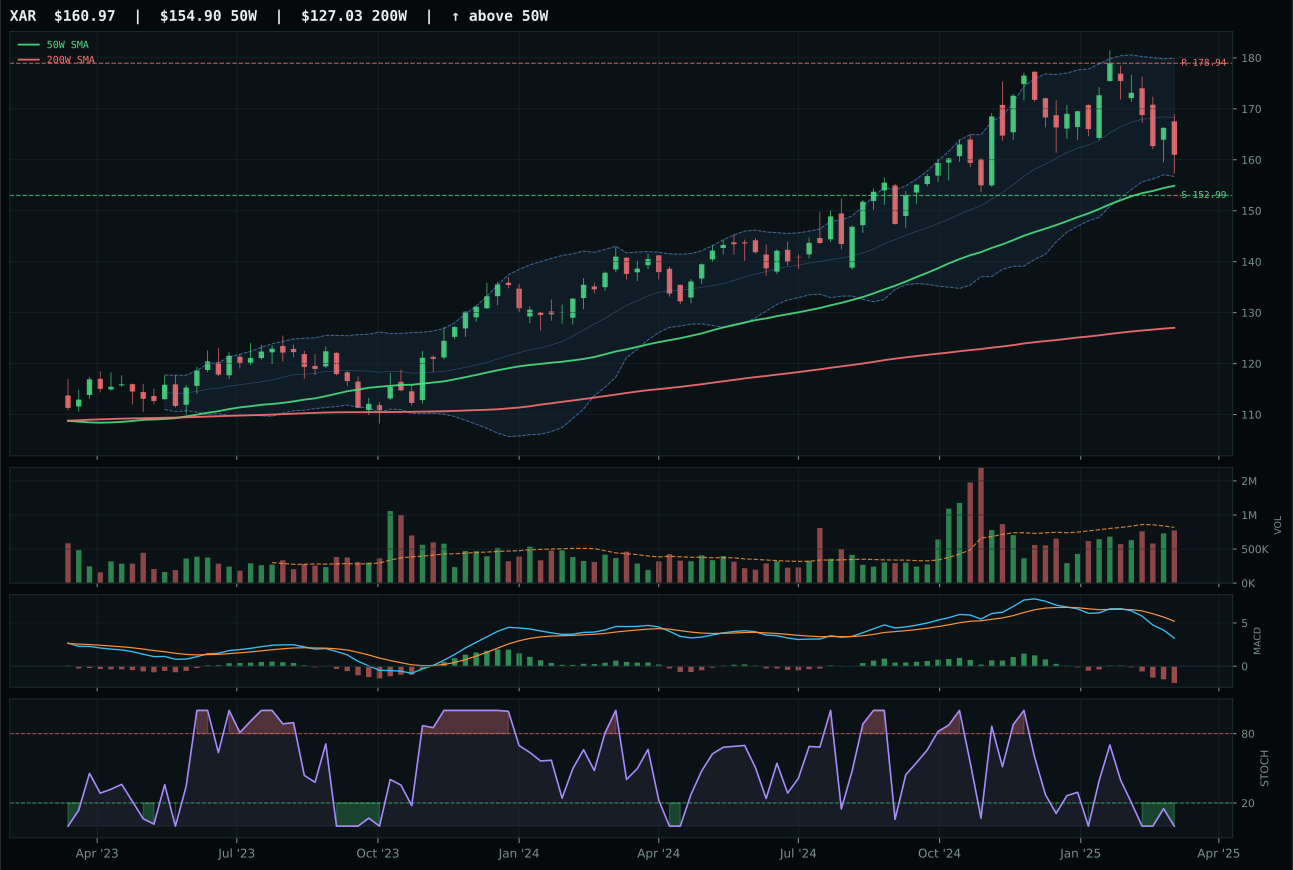
XAR has a neutral structure profile with -1.0% 13-week relative strength versus SPY.
A failed hold above support would weaken the setup.
Actionable but governed by invalidation levels.
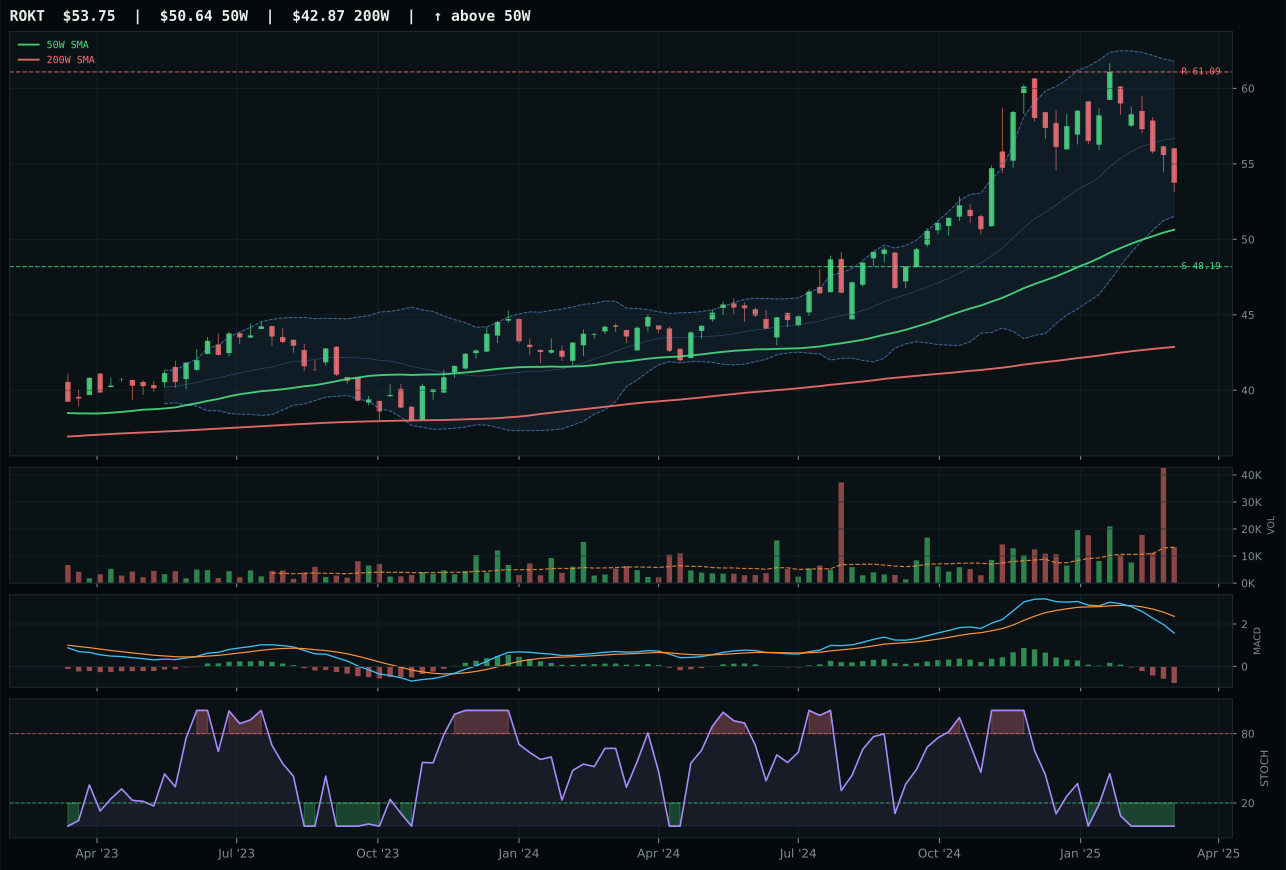
ROKT has a neutral structure profile with -2.1% 13-week relative strength versus SPY.
A failed hold above support would weaken the setup.
Tracked, but not top-2 eligible because: .
ITA secured the Defense & Aerospace win by exploiting the cleanest pullback into support while maintaining category-relative strength advantage that kept it ahead of XAR and ROKT throughout the correction. Price action showed a textbook setup: 4.3% above support at 144.54, only 4.3% from the 50W, MACD bearish/weakening but stochastic at 0.12 gave room for reversal. ITA's 4.7% category-relative strength stood out when XAR lagged at 0% and ROKT deteriorated deeper. The timing score (95.0/100) reflected that proximity to key levels—both the 50W and Fibonacci 0.236 at 151.68—created a defined entry zone with clear invalidation. Volume at 1.09x neutral signaled patience rather than panic, fitting a defensive rotation narrative where buyers await but do not yet commit.
Defense earns 5% as a rotation play into defensive names during disinflation, justified by defensive rotation active at +8 (one of the strongest category-level tailwinds) and macro fit at 55. However, the category score of 44.6 ranks it outside the top two because technical evidence of 49.9 is solid but not exceptional, and the ETF proof order shows ITA at 51.3, XAR at 45.3, and ROKT at 37.5—suggesting broad support for the thesis but no compelling leader. ITA's momentum confirmation of 40.2 shows actual conviction is limited despite the macro narrative. Liquidity stress (-3) and risk appetite broken (-2) both chip away at the setup, so while this category rides a real thematic tailwind, the technical execution remains tentative, warranting tactical rather than strategic allocation.
Technology — CIBR
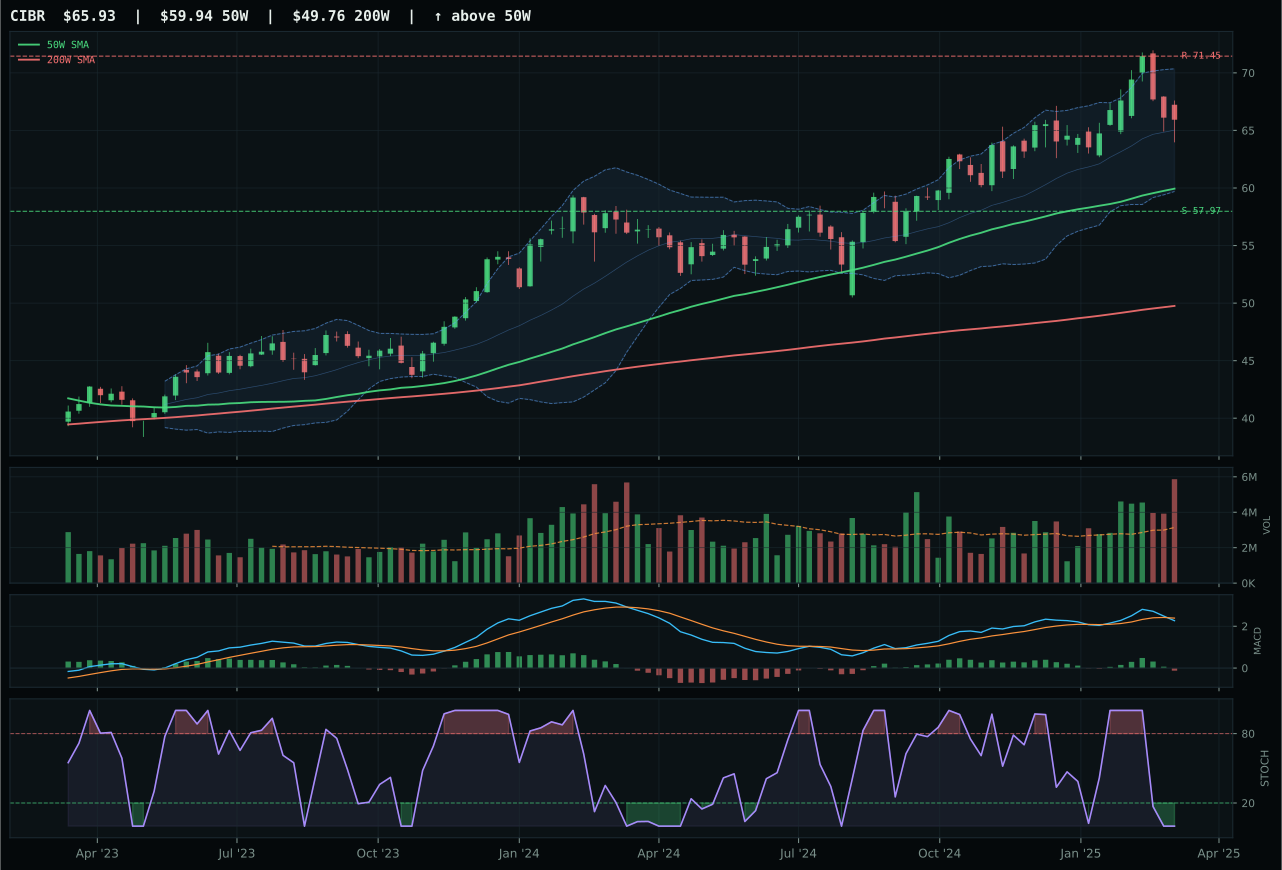
CIBR has a neutral structure profile with 6.0% 13-week relative strength versus SPY.
A failed hold above support would weaken the setup.
Actionable but governed by invalidation levels.
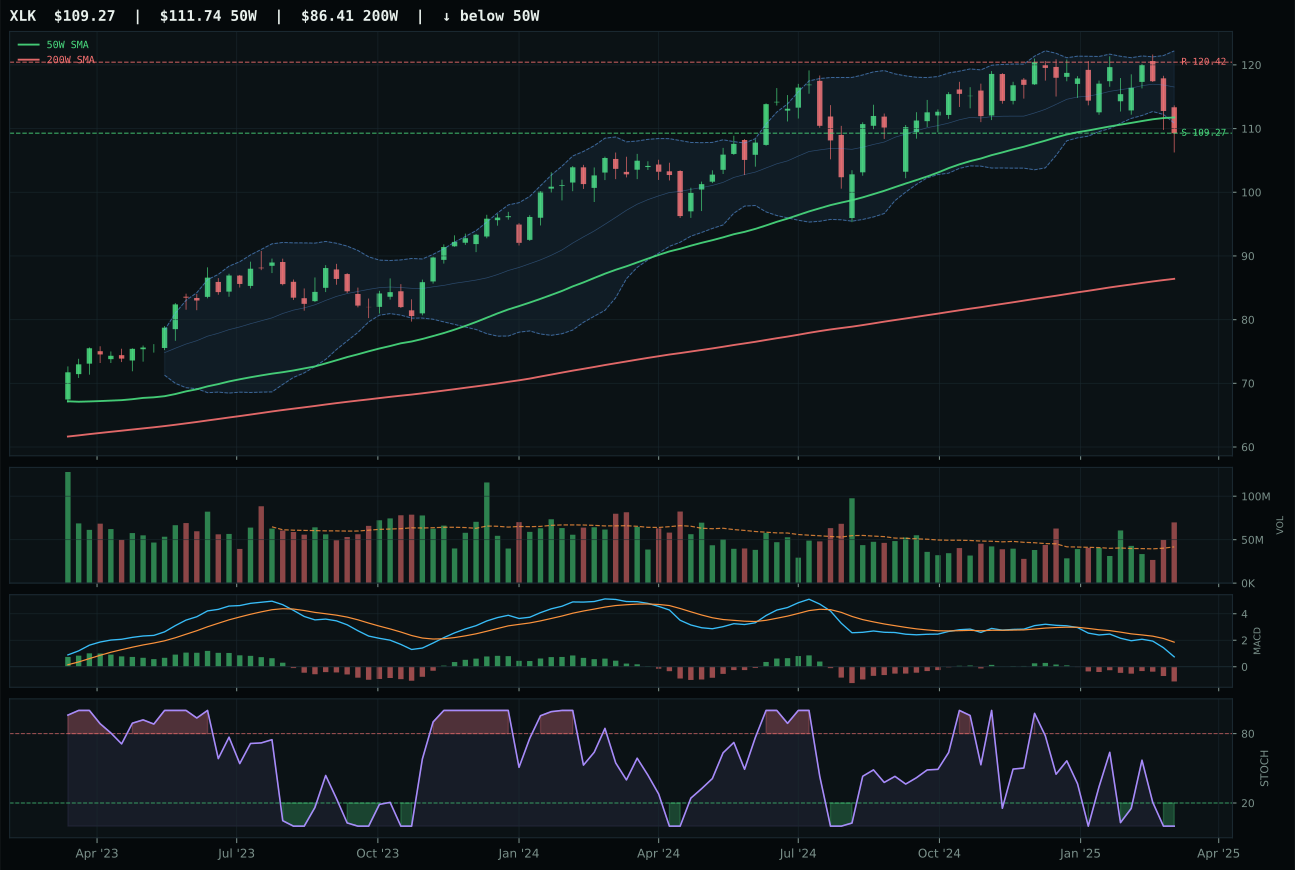
XLK has a pullback into support profile with -4.0% 13-week relative strength versus SPY.
A failed hold above support would weaken the setup.
Actionable but governed by invalidation levels.
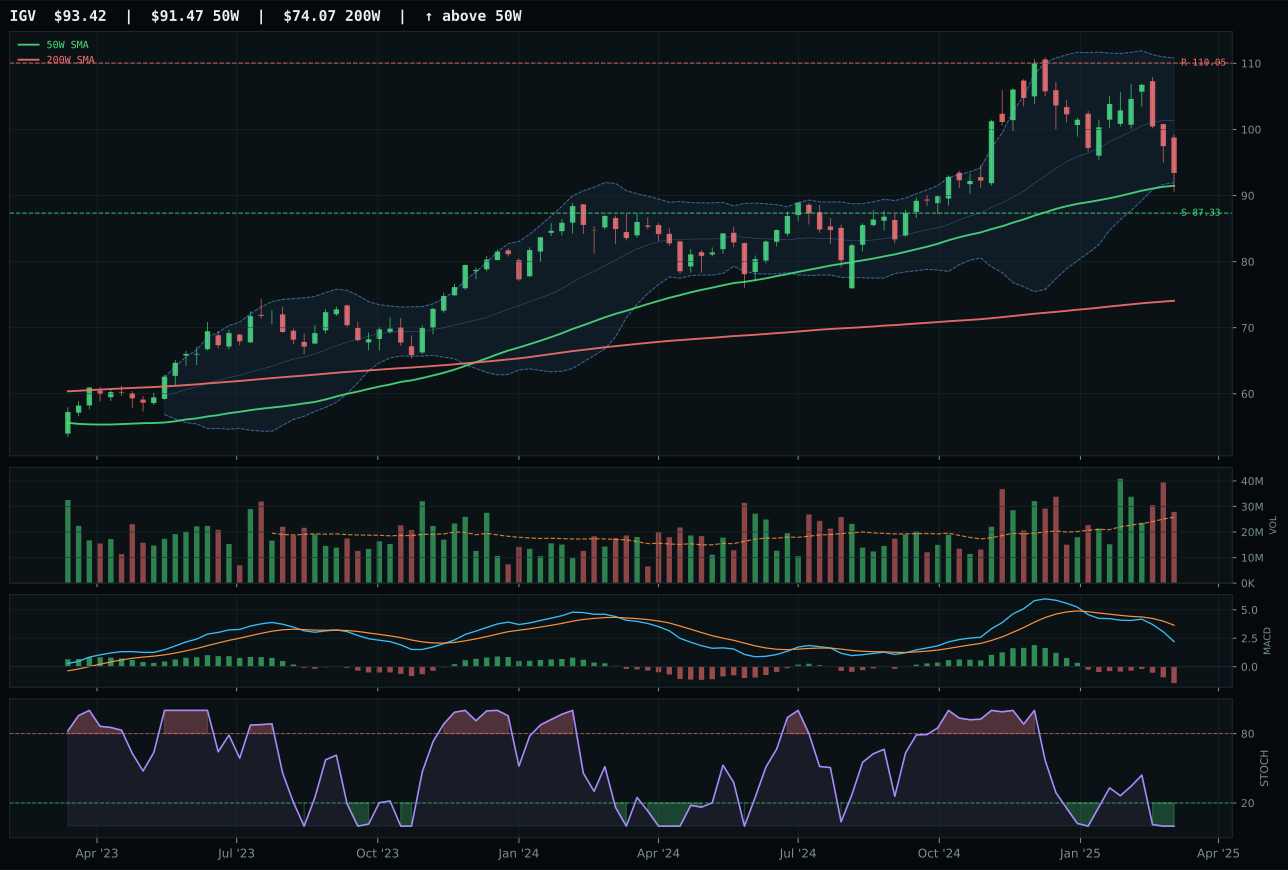
IGV has a compression near 50W profile with -9.9% 13-week relative strength versus SPY.
A failed hold above support would weaken the setup.
Actionable but governed by invalidation levels.
CIBR claimed the Technology category by combining defensive positioning with the only positive relative strength in a field marked by uniform weakness. Cybersecurity's 10% RS edge over the category median and 6% strength versus SPY provided genuine conviction when XLK lagged at -4% SPY-relative and IGV deteriorated to -9.9%. The setup itself was neutral—price 10% above the 50W, MACD bearish/weakening, stochastic oversold—but that restraint mattered more than momentum in a disinflation regime where chasing leaders backfires. CIBR's distribution pressure at 1.87x 20W volume suggested accumulation despite the extended valuation, a signal that institutional buyers were rotating into the subsector for reasons beyond price action.
Technology ranks fifth among the ten categories at 39.2 and holds its 5% slot because defensive rotation and disinflation both carry small positive weights (+7 and +5), but liquidity stress carries a -10 penalty that keeps macro fit at only 52. The setup is not broken—CIBR's trend at 91 and timing at 70 anchor the technical case—but the category cannot climb into top-2 territory when precious metals, utilities, and industrial rotation command higher macro-regime payoffs in a disinflation environment. Momentum confirmation at 40.7 and volume-price confirmation at 38.2 signal that recent strength is not being confirmed by market participation, and that hesitation is enough to keep this category tactical-only at 5% rather than strategic at 10% or 20%.
AI — AIQ
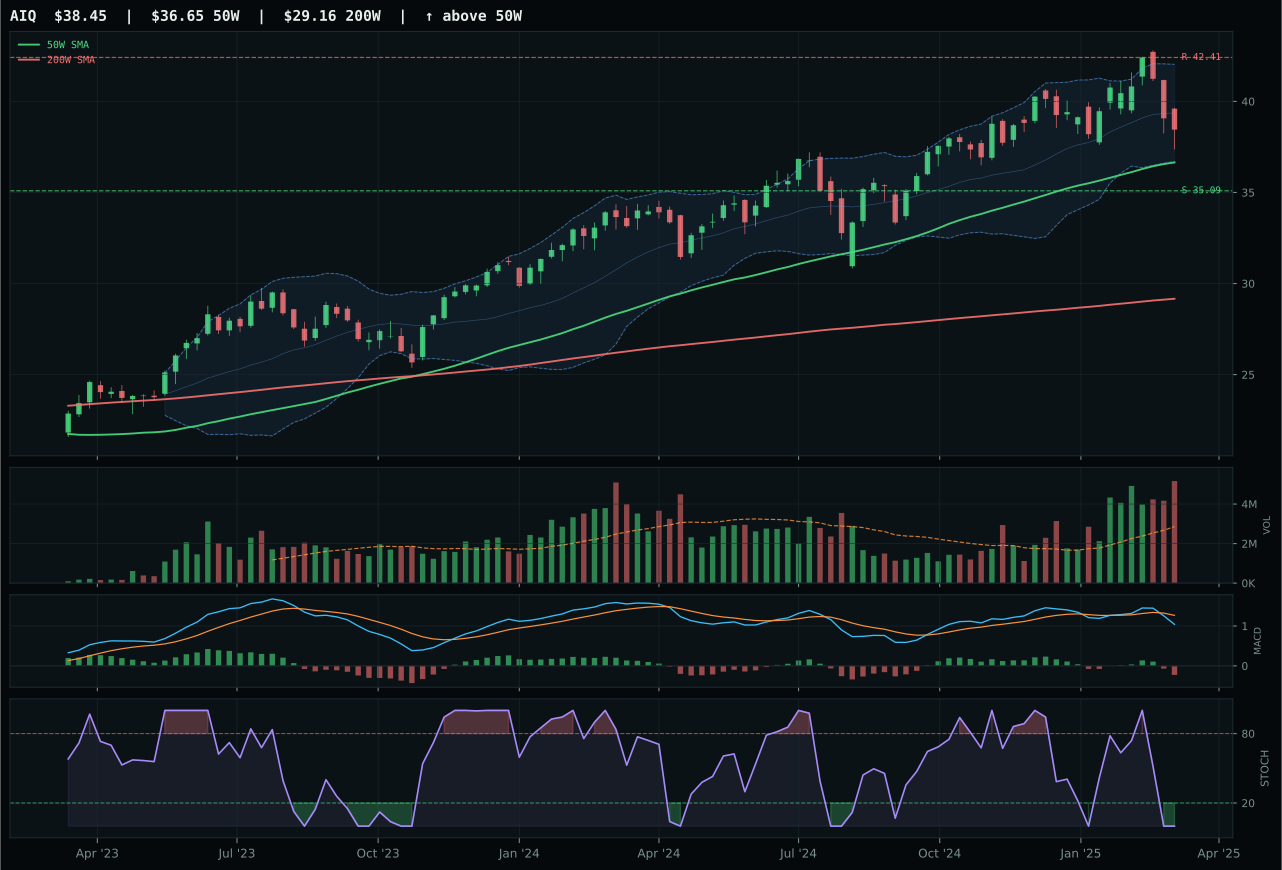
AIQ has a neutral structure profile with 0.8% 13-week relative strength versus SPY.
A failed hold above support would weaken the setup.
Actionable but governed by invalidation levels.
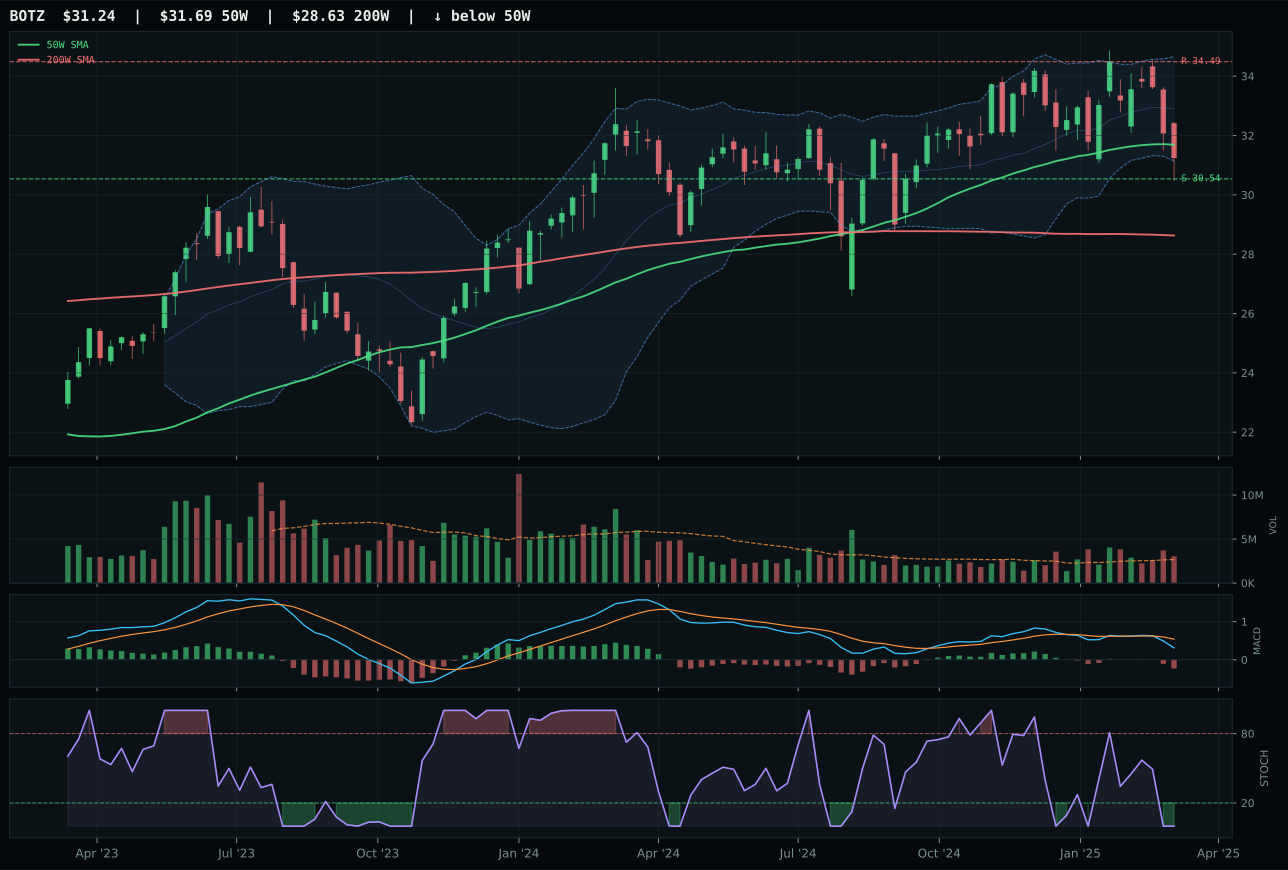
BOTZ has a pullback into support profile with -3.4% 13-week relative strength versus SPY.
A failed hold above support would weaken the setup.
Actionable but governed by invalidation levels.
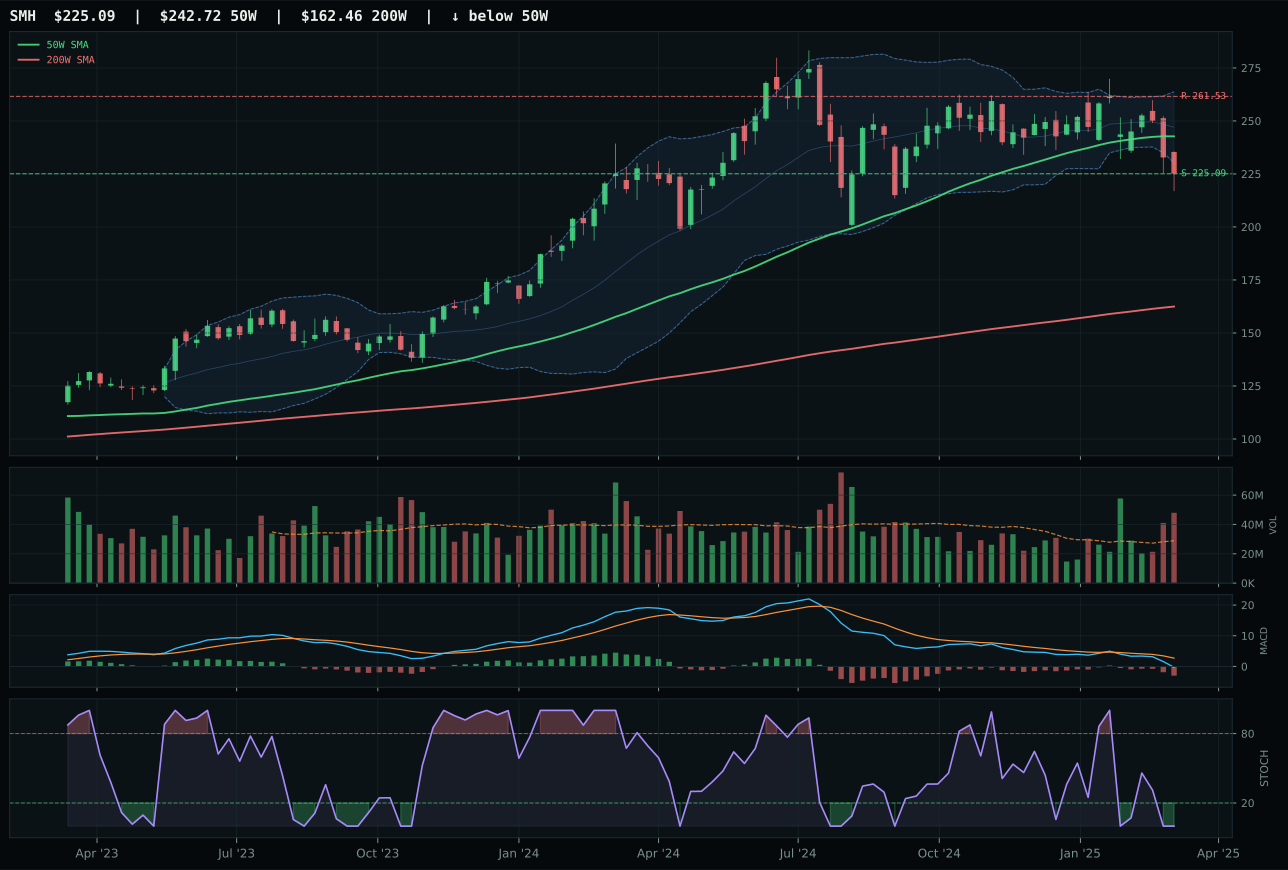
SMH has a pullback into support profile with -4.2% 13-week relative strength versus SPY.
A failed hold above support would weaken the setup.
Actionable but governed by invalidation levels.
AIQ edged BOTZ by a 2.2-point margin using superior timing and category-relative breadth as its differentiator in a sector where momentum had evaporated. Both carried 13W returns in the -4% to -8% range, both sat oversold with bearish MACD, yet AIQ's 4.1% category-relative strength versus BOTZ's 0% indicated software application breadth was holding better than robotics cyclicality. Distance to the 50W (4.9% for AIQ vs deeper pullback for BOTZ) and Fibonacci positioning in the upper retracement zone gave AIQ a tighter, more defined setup where support/resistance ratio (9.6% down / -9.3% up) offered better asymmetry. The deciding factor: volume distribution pressure at 1.81x 20W for AIQ meant smart money was still present despite headline weakness.
AI scores 32.8 and earns a 5% tactical allocation because the category itself is inside a reset, not a breakout, and macro headwinds remain acute. Liquidity stress is active and penalizes this category by -12, and despite disinflation bringing a +5 boost, the category-level macro fit of 43 and technical evidence of only 14.8 keep the entire basket depressed. The 3/2/1 weighted reasoned ETF proof order shows BOTZ at 35.8, AIQ at 23.0, and SMH at 11.6—a wide spread indicating no consensus, which itself disqualifies the category from strategic weight. Risk appetite broken is active against BOTZ specifically (-5), and the two-week composite setup is pullback-into-support mode across all three names, meaning any allocation is a defensive trade waiting for support to hold, not a call on AI momentum.
Emerging Markets — IEMG
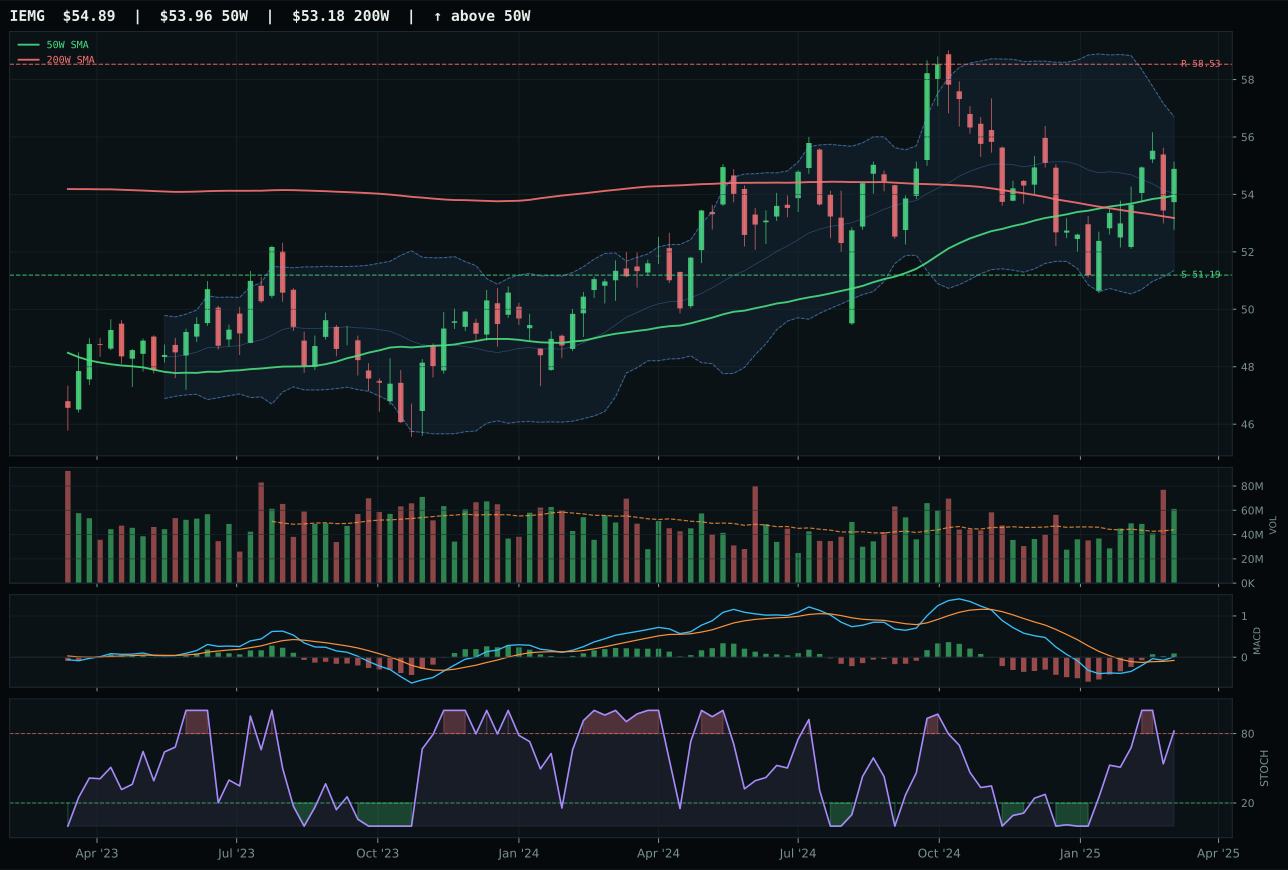
IEMG has a compression near 50W profile with 5.2% 13-week relative strength versus SPY.
A failed hold above support would weaken the setup.
Actionable but governed by invalidation levels.
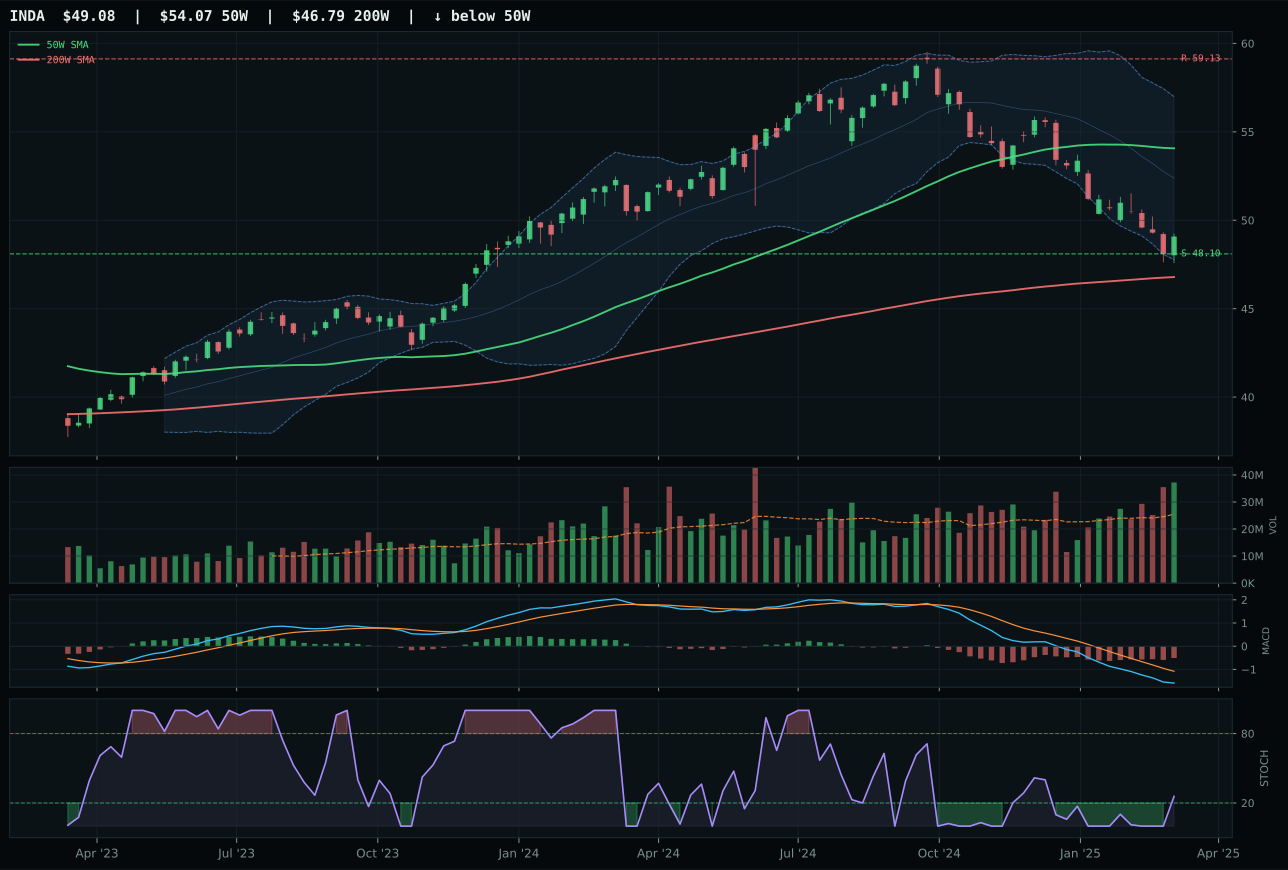
INDA has a pullback into support profile with -6.6% 13-week relative strength versus SPY.
A failed hold above support would weaken the setup.
Actionable but governed by invalidation levels.
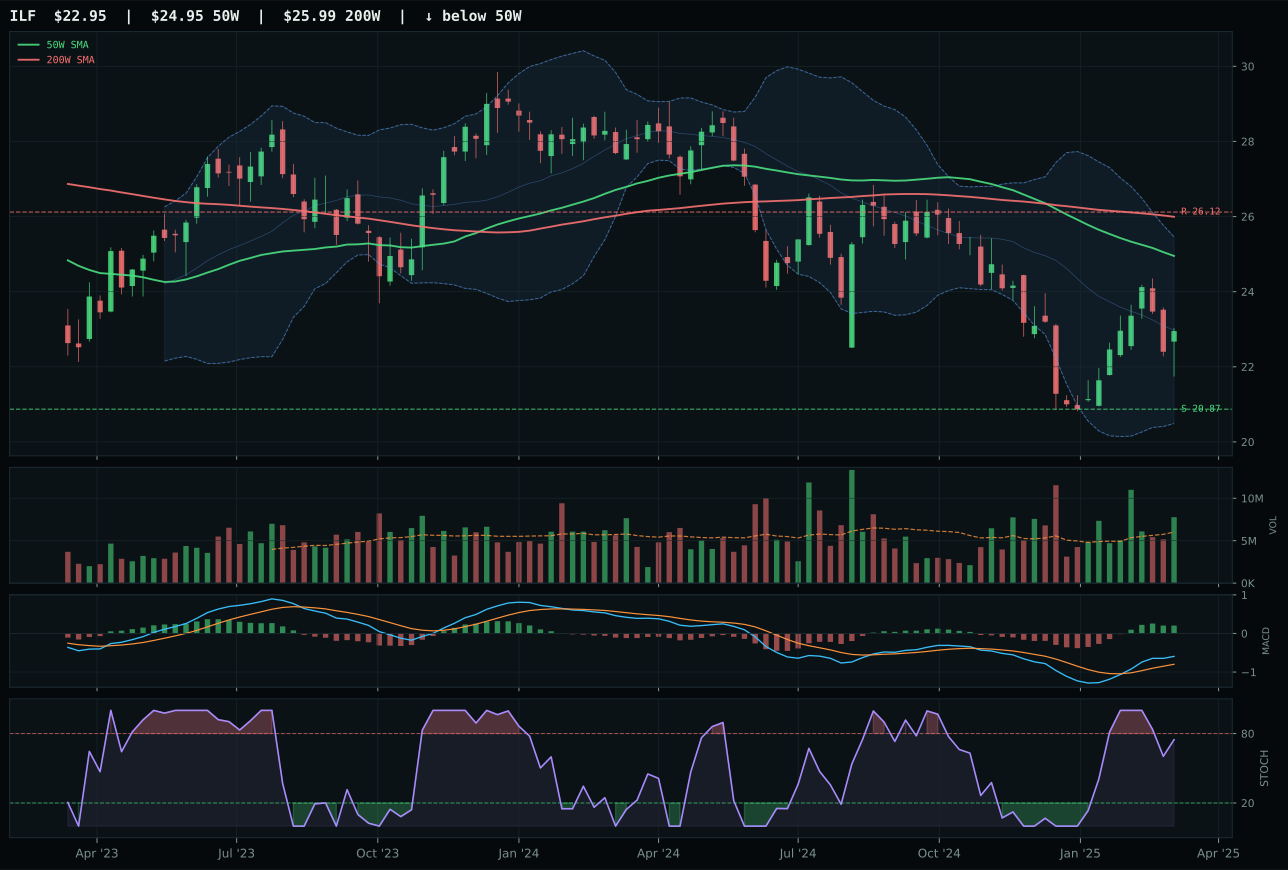
ILF has a neutral structure profile with 4.6% 13-week relative strength versus SPY.
Extension and support failure are the main tactical risks.
Tracked, but not top-2 eligible because: structurally broken.
IEMG captured Emerging Markets despite a 19.6 category score by delivering the only bullish technical picture in a complex hurt by liquidity stress and weak macro. Price sits above both the 50W and 200W with compression near the 50W (only 1.7% distance), MACD bullish/improving, stochastic overbought rolling over (0.82) suggested momentum exhaustion but not reversal. Category-relative strength of 0.5% versus INDA's -11.2% deterioration made the choice clear; INDA's pullback into repair zone and bearish-but-improving MACD created a bounce setup but lacked the conviction of IEMG's neutral compression. IEMG's 77.8/100 structure score reflected superior cleanliness (58.3) and 84.7% compression efficiency, while 89.0 timing score positioned it as the least risky entry into a beaten-down complex.
Emerging Markets scores 19.6 and holds a 5% tactical slot because IEMG's technical strength (78.5) and trend at 98 justify exposure despite macro fit of only 42. Liquidity stress is active at -10 against the entire category, which keeps category-level macro fit at 40 and prevents upside from 5%. The reasoned ETF proof order shows IEMG at 67.2, ILF at 41.8, and INDA at 31.4, and IEMG's 20-point technical lead over ILF demonstrates clear leadership. However, IEMG's momentum confirmation of 71.7 is not momentum—it's positioning confirmation—and the real conviction is in precious metals and utilities, not emerging markets. This 5% slot is held because IEMG's compression setup with bullish MACD and above-average volume gives a coil that could expand, providing portfolio diversification and currency hedge into a regime where EM volatility has reset lower. Without IEMG's particular clean setup, Emerging Markets would score lower and lose its slot entirely to a lower-rank category.
Agriculture & Livestock — VEGI
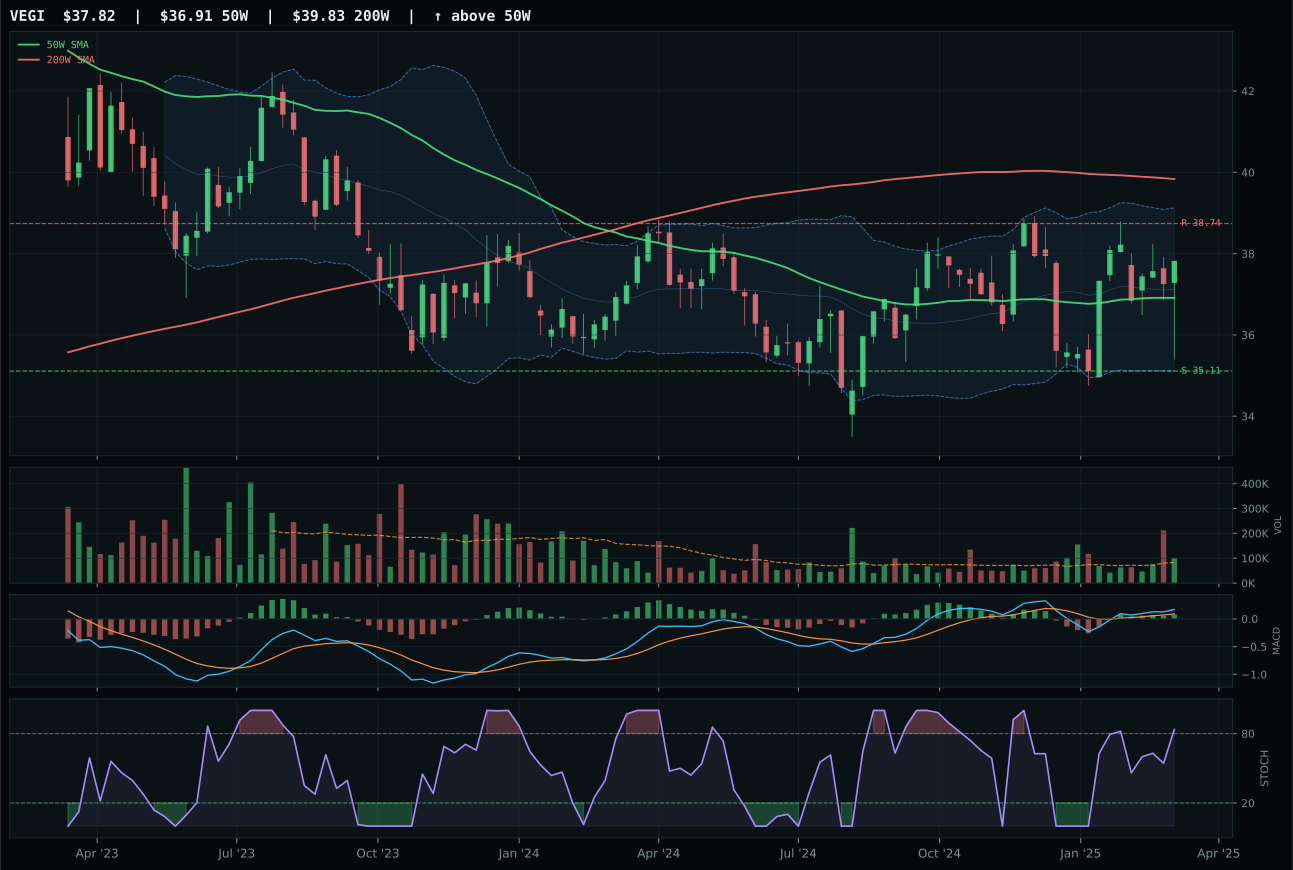
VEGI has a compression near 50W profile with 4.9% 13-week relative strength versus SPY.
A failed hold above support would weaken the setup.
Tracked, but not top-2 eligible because: .
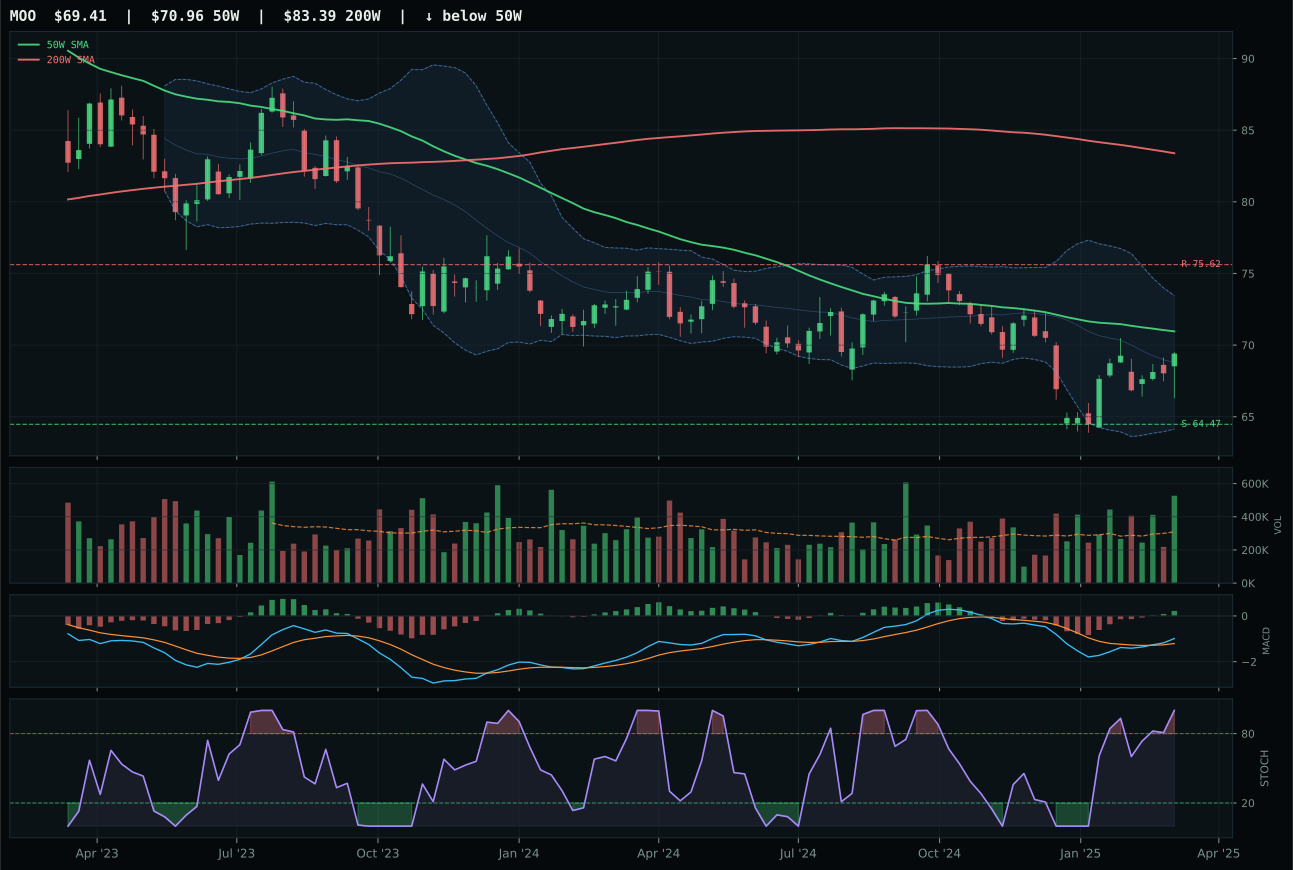
MOO has a compression near 50W profile with 3.5% 13-week relative strength versus SPY.
Extension and support failure are the main tactical risks.
Tracked, but not top-2 eligible because: structurally broken.
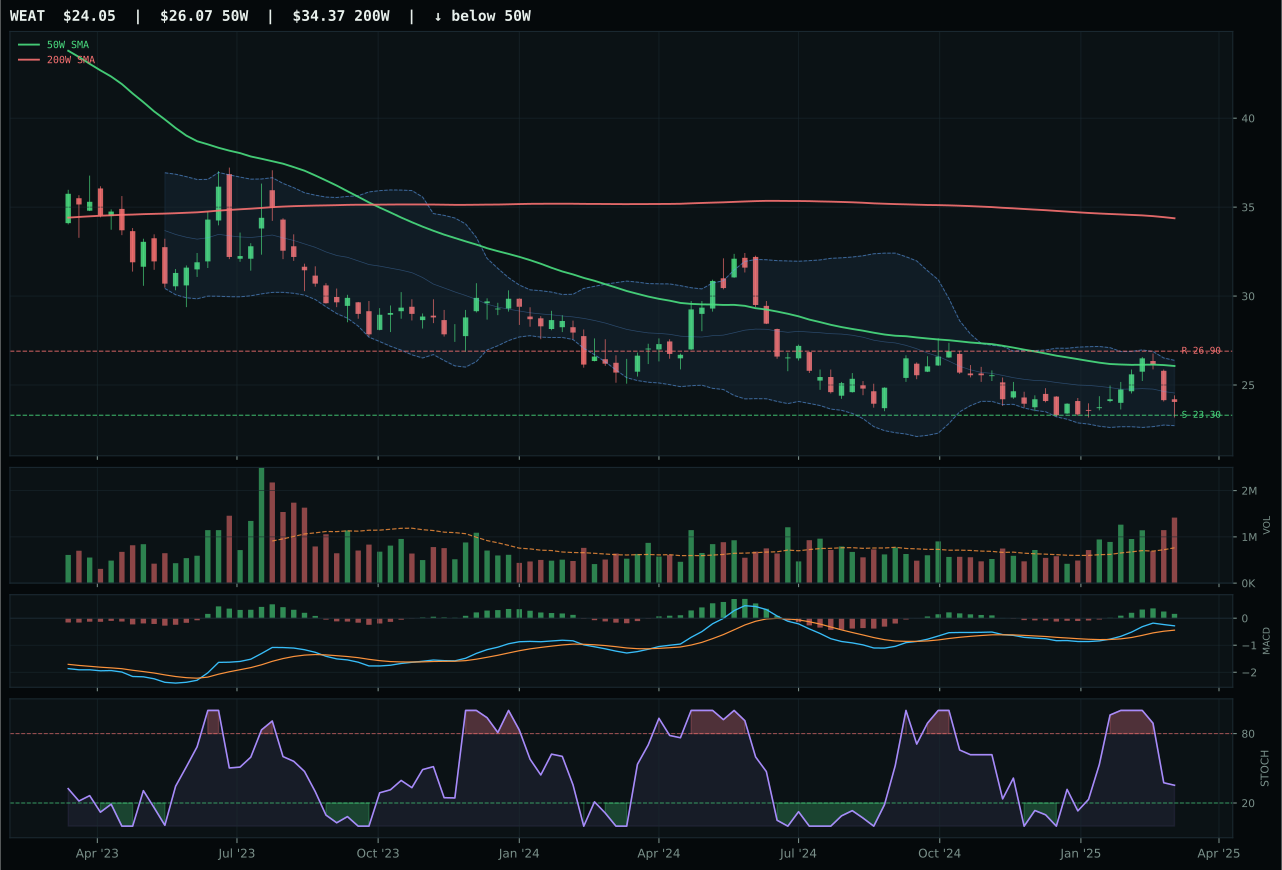
WEAT has a pullback into support profile with 4.6% 13-week relative strength versus SPY.
Extension and support failure are the main tactical risks.
Tracked, but not top-2 eligible because: structurally broken.
VEGI won the Agriculture & Livestock category by default after both VEGI and MOO failed hard filters during category eligibility testing, resulting in a final 0.0 category score that disqualified the entire complex. VEGI carried superior structure (75.0/100 vs MOO's 51.3/100) and maintained compression near the 50W with overbought stochastic momentum (0.84) and bullish/improving MACD—the chart's only green signal in a sector drowning in disinflation pressure. MOO's structural damage (compression near 50W but categorically below standard cleanliness thresholds) and -1.1% category-relative weakness versus VEGI's neutral standing meant the winner was predetermined to lose the portfolio contest. Even VEGI's perfect timing score (100.0/100) could not override the macro headwind: disinflation hurts agriculture (-6 category modifier) and disinflation pressure active (-8).
Agriculture & Livestock scores 0.0 and receives zero allocation because hard eligibility filters marked this category ineligible despite VEGI's clean technical setup. Disinflation hurts this exposure by -6, and the active descriptor 'disinflation pressure' carries an additional -8 penalty—a 14-point macro headwind that no amount of technical excellence can overcome in this regime. The category-level macro fit is only 32, and liquidity stress is active (-4), creating a hostile macro environment for commodity-sensitive names even when the chart looks coiled. VEGI's 45 technical evidence score and VEGI's solid 45 macro-narrative fit cannot rescue a category that is structurally penalized by the current macro regime, and the system correctly excludes it entirely rather than allocate into headwinds.
Traditional Energy — FCG
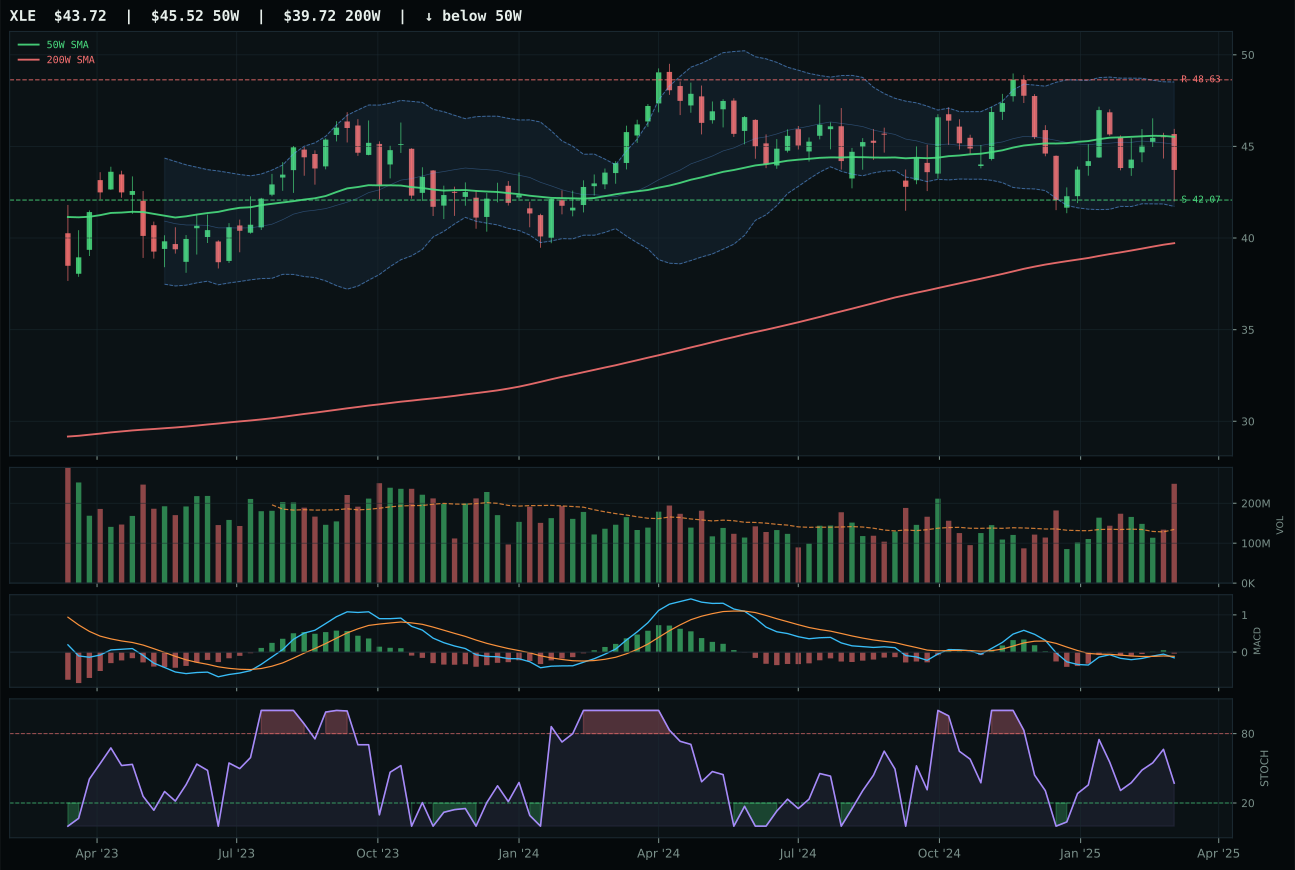
XLE has a pullback into support profile with 1.3% 13-week relative strength versus SPY.
A failed hold above support would weaken the setup.
Actionable but governed by invalidation levels.
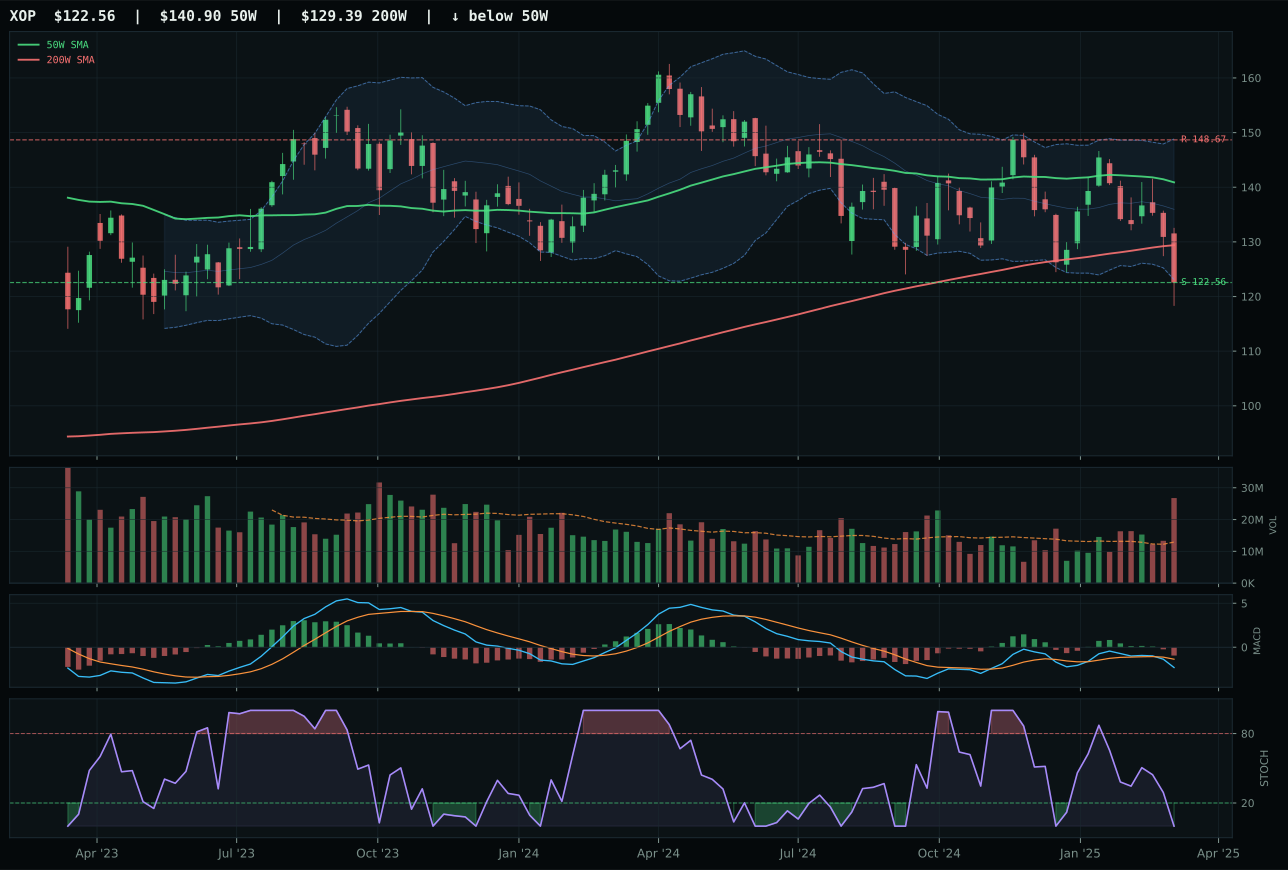
XOP has a pullback into support profile with -4.5% 13-week relative strength versus SPY.
A failed hold above support would weaken the setup.
Actionable but governed by invalidation levels.
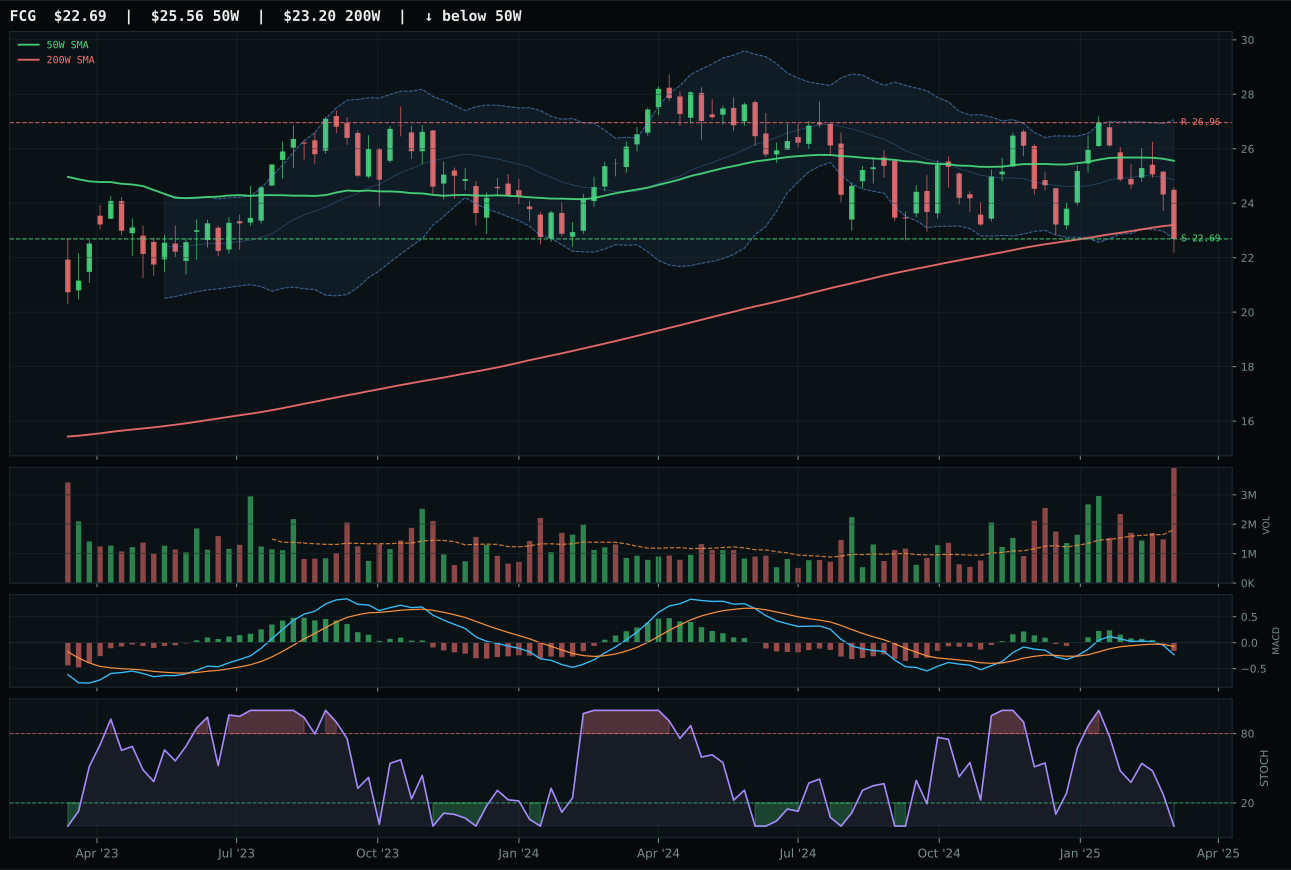
FCG has a pullback into support profile with -2.3% 13-week relative strength versus SPY.
A failed hold above support would weaken the setup.
Actionable but governed by invalidation levels.
FCG claimed the Traditional Energy category through elimination rather than excellence, winning a contest where all three ETFs failed hard eligibility filters and the entire sector scored 0.0 category-wide. FCG's momentum confirmation (0.0/100) and volume-price confirmation (8.2/100) were catastrophic—price fell 7.5% over 13W, RS versus SPY was -2.3%, and stochastic RSI sat oversold at 0.00 with distribution pressure at 2.21x. The 'win' was purely that XLE and XOP were worse: XLE scored 32.9/100 technical evidence versus FCG's 10.5/100, placing FCG deeper underwater. Timing and risk/reward offered the only conceivable argument: FCG sat -11.2% from the 50W with support/resistance at 22.69/26.96, giving FCG the deepest repair zone (Fib 0.786 at 23.60). This was not a buy signal but rather the least offensive short cover into support.
Traditional Energy scores 0.0 and receives zero allocation because disinflation hurts this exposure by -10, and the active descriptor 'disinflation pressure' carries an additional -10 penalty that is mechanically prohibitive. Category-level macro fit of 23 is the worst in the portfolio, and technical evidence of 0.0 for the representative (FCG) confirms that no amount of support-level setup can overcome a category that is structurally hostile in a disinflation regime. The 3/2/1 weighted basket begins at 21.7 but collapses to 0.0 after the reasoner tests against persistence, volume-price confirmation, and macro regime alignment. Energy is entirely excluded from the portfolio this week—not tactical at 5%, not out at 0%—because liquidity stress (-7) and disinflation pressure (-10) combine to make any energy allocation a bet against the current regime rather than a bet with it. This is a hard macro filter, not a technical rejection.
Nuclear Energy — URA
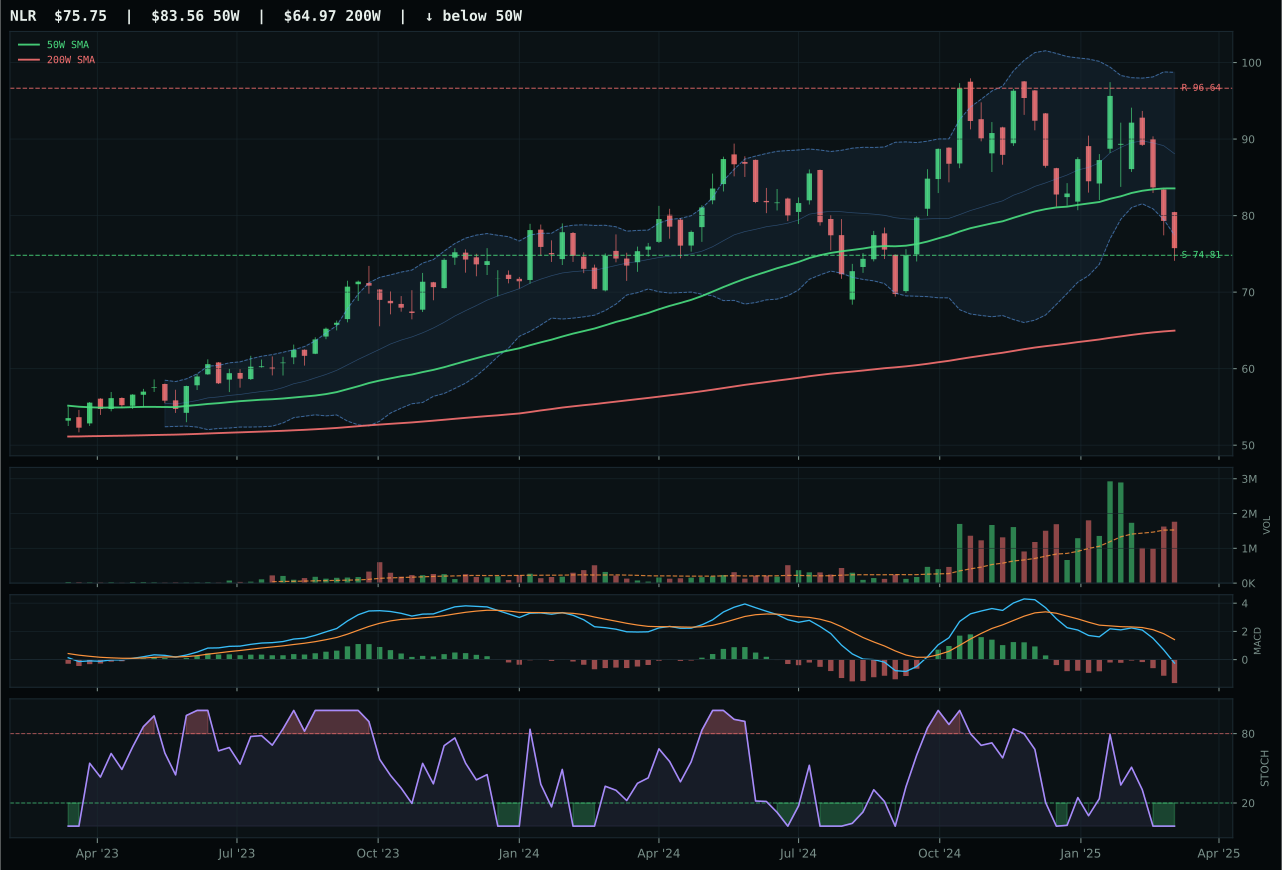
NLR has a pullback into support profile with -12.8% 13-week relative strength versus SPY.
A failed hold above support would weaken the setup.
Actionable but governed by invalidation levels.
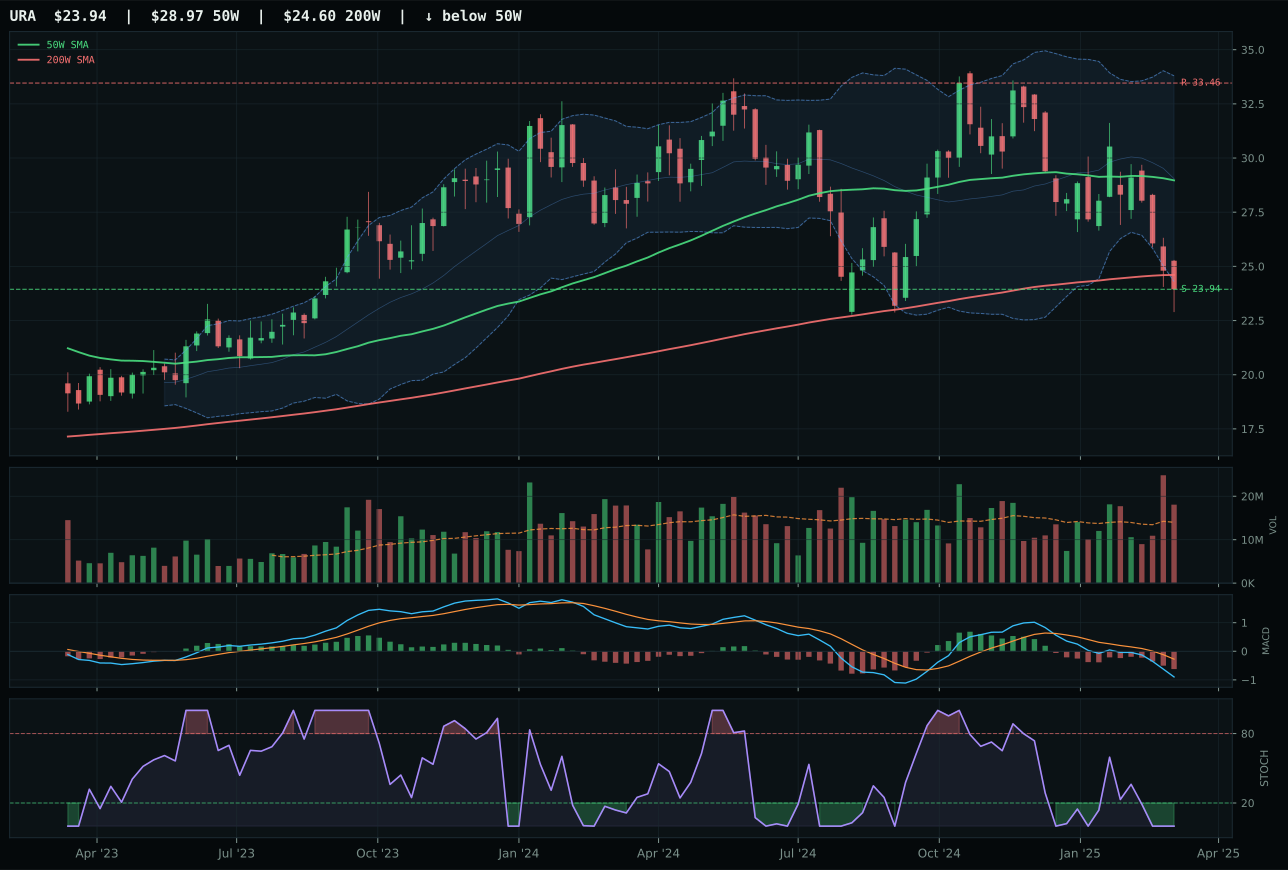
URA has a pullback into support profile with -19.5% 13-week relative strength versus SPY.
A failed hold above support would weaken the setup.
Actionable but governed by invalidation levels.
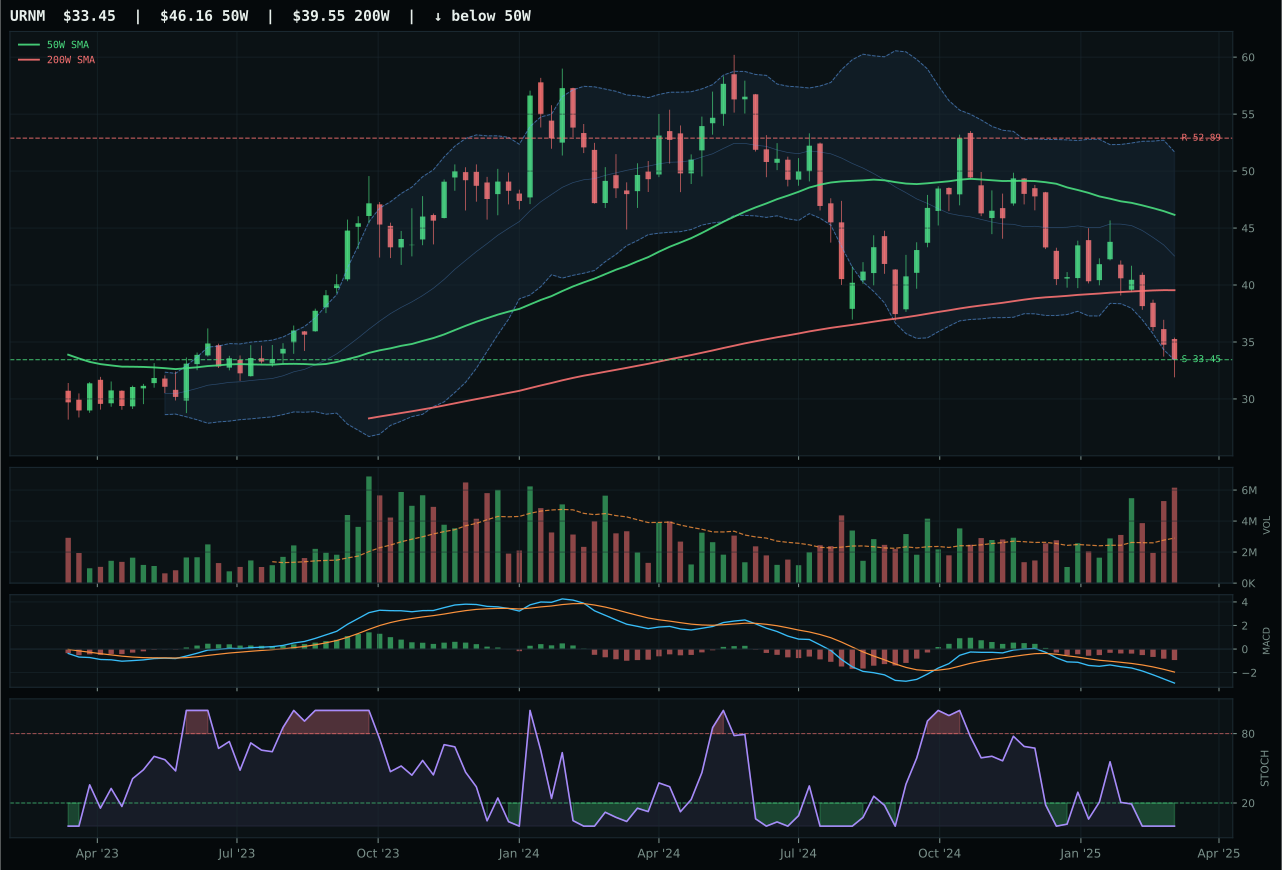
URNM has a pullback into support profile with -24.7% 13-week relative strength versus SPY.
A failed hold above support would weaken the setup.
Actionable but governed by invalidation levels.
URA won the Nuclear Energy category by virtue of being the least damaged name in a sector that collapsed under liquidity stress and broken risk appetite. URA's -24.7% 13W return and -19.5% SPY-relative weakness were brutal, yet the category's defined support structure at 23.94 and Fib 0.786 repair zone positioned it as a potential accumulation target if sentiment shifted. Runner-up NLR (35.8/100 technical evidence) actually carried better scores across trend (52) and timing (87) but fell victim to being stretched further from its 50W (-9.3%), making it less attractive as a defined-risk entry. URA's 16.4 technical evidence score was journal-entry-level weak, but the category-level macro fit of 39.0/100 offered zero tailwinds anyway—liquidity stress (-7) and risk appetite broken (-4) applied equally across all three ETFs.
Nuclear Energy scores 18.4 and earns zero allocation because technical evidence for the representative (URA) is only 16.4, and macro fit is neutral at 50 given that no category-specific descriptor profile exists for nuclear. Liquidity stress is active (-7) and risk appetite broken is active (-4), creating macro headwinds, and the reasoned ETF proof order shows NLR at 35.8, URA at 24.7, and URNM at 12.1—indicating NLR is technically superior but both are too weak to carry a category. The 3/2/1 weighted basket begins at 28.2, and after the reasoner tests persistence at 16.1 and volume-price confirmation at 13.0, the final score remains at 18.4 but fails eligibility filters. This category ranks tenth or near-tenth in the allocation hierarchy because nuclear sits in a technical repair zone with no macro tailwind, and the market's capitulation in this name (down 24.7% in 13 weeks) signals that fundamental demand assumptions have shifted, making recovery speculative rather than tactical.
Industrial Metals — COPX
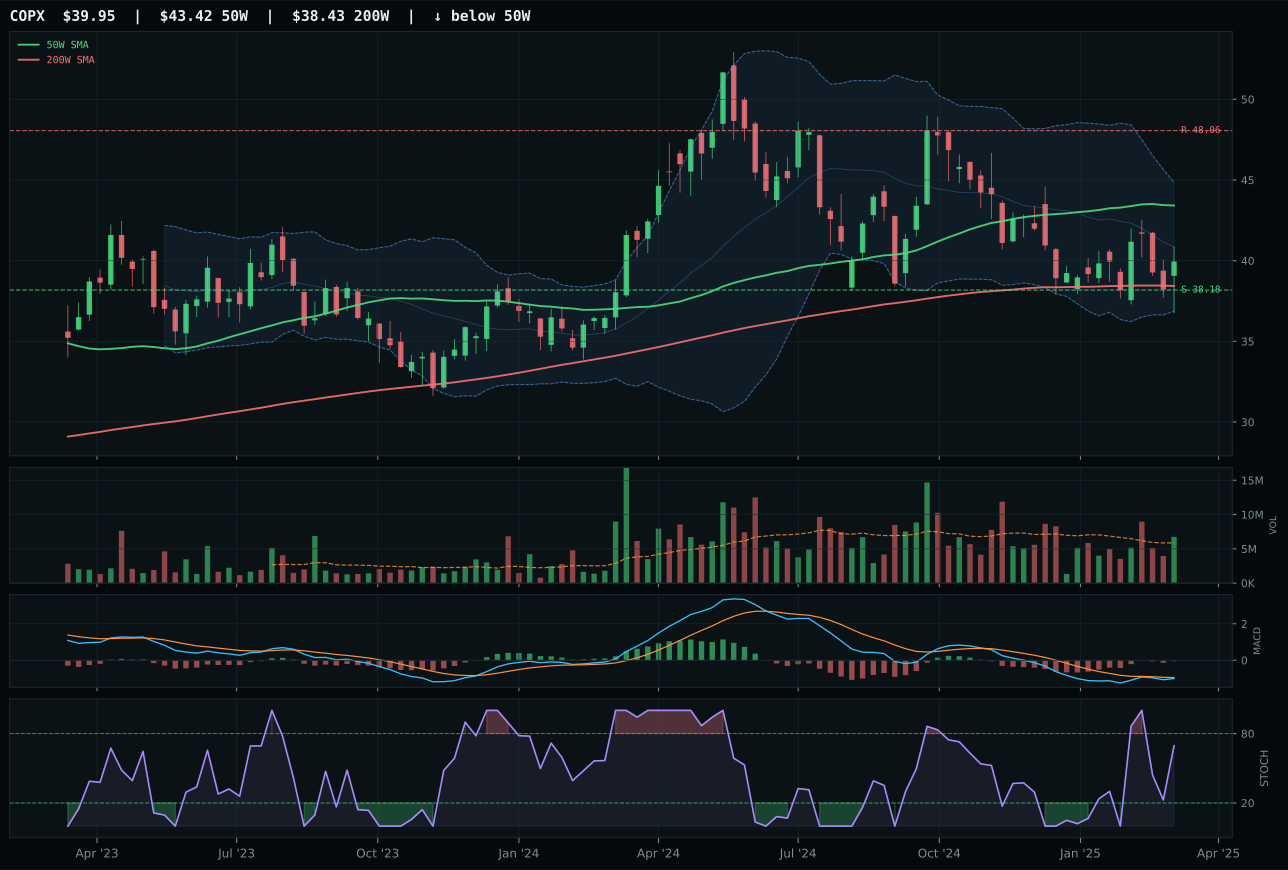
COPX has a pullback into support profile with 0.4% 13-week relative strength versus SPY.
A failed hold above support would weaken the setup.
Actionable but governed by invalidation levels.
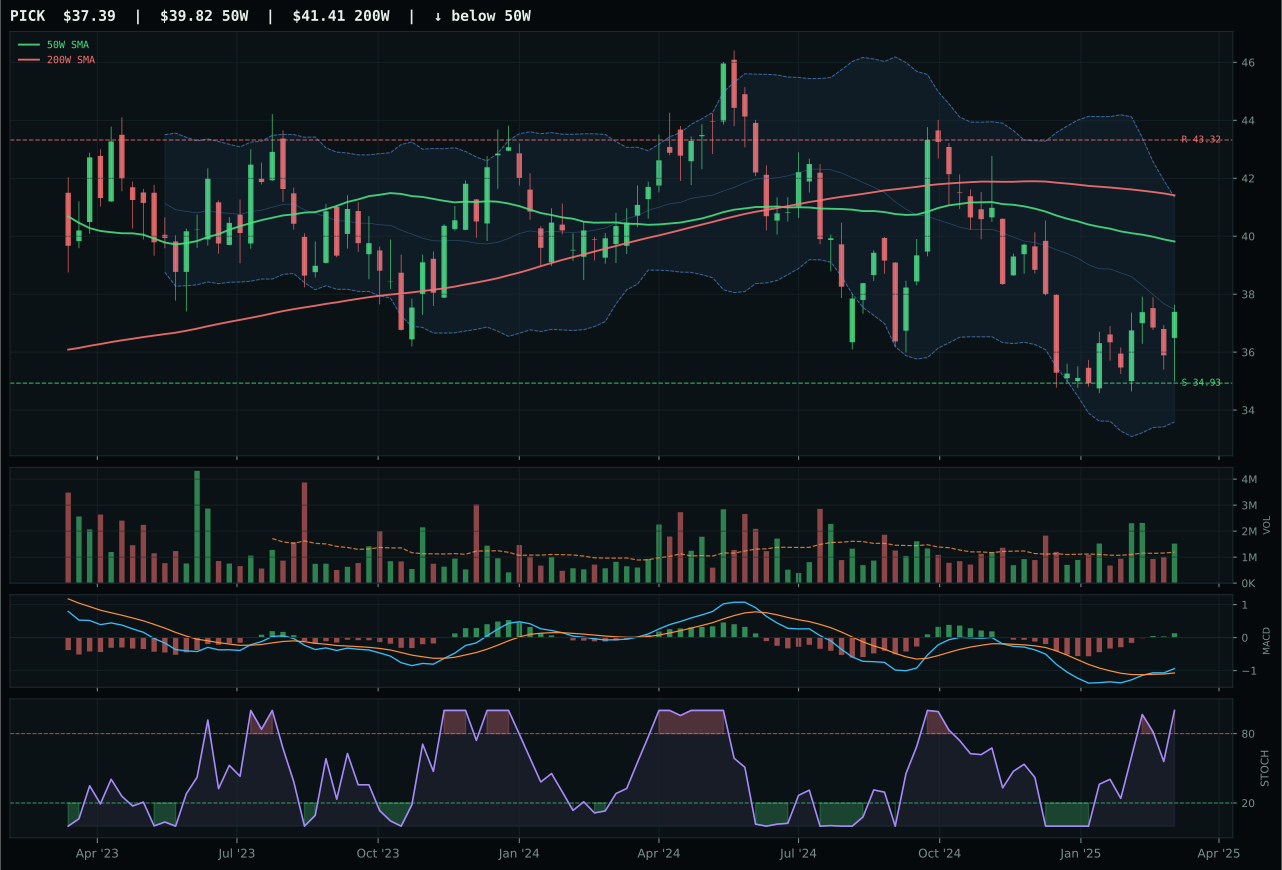
PICK has a neutral structure profile with 1.5% 13-week relative strength versus SPY.
Extension and support failure are the main tactical risks.
Tracked, but not top-2 eligible because: structurally broken.
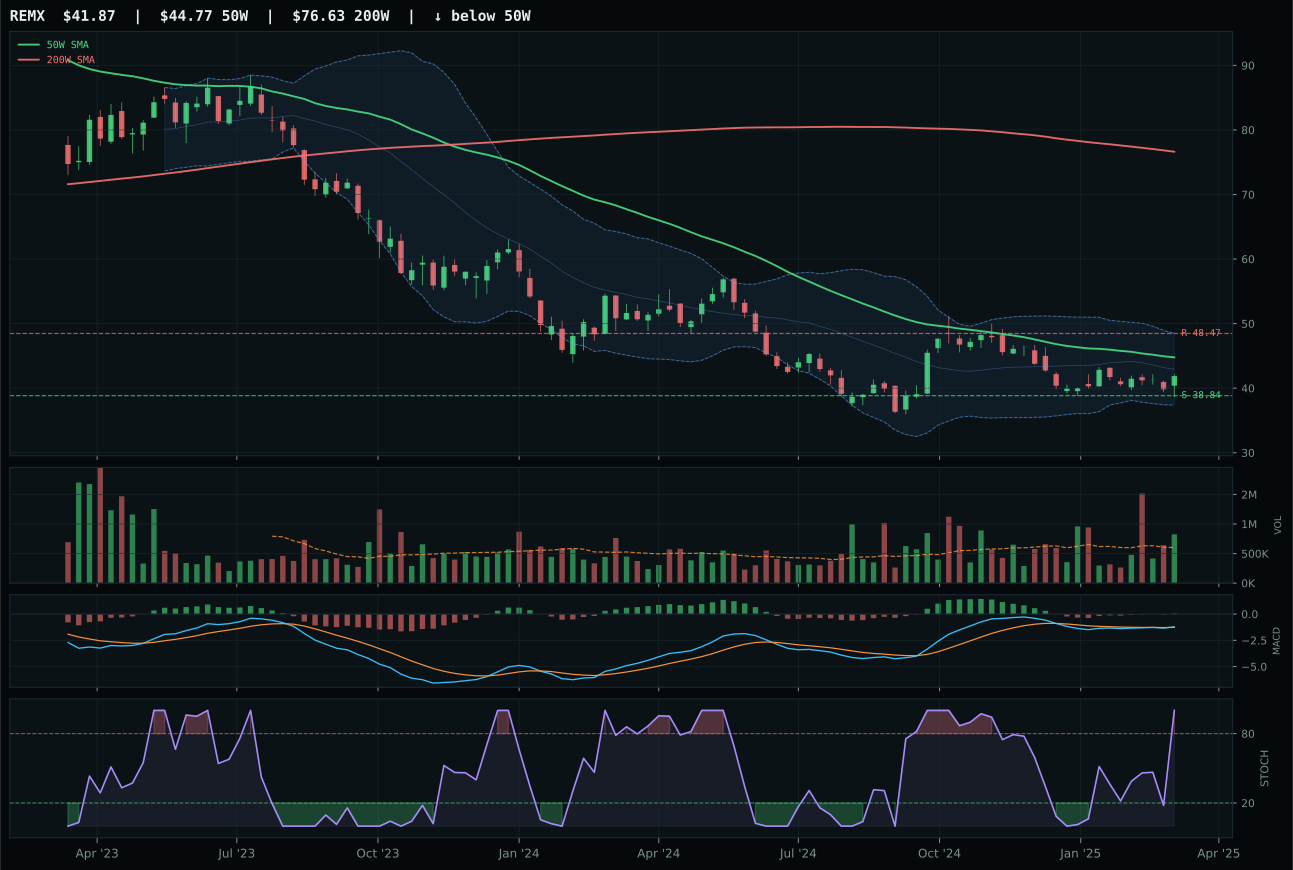
REMX has a neutral structure profile with 0.9% 13-week relative strength versus SPY.
Extension and support failure are the main tactical risks.
Tracked, but not top-2 eligible because: structurally broken.
COPX won the Industrial Metals category through superior setup definition despite holding a weaker overall trend score than category-ranked leader PICK. COPX's pullback into support structure (74.5/100) outpaced PICK's broken neutral structure (41.3/100), and the timing alignment to support at 38.18 with stochastic RSI in falling/neutral (0.69) provided a clearer bounce candidate than PICK's overbought rolling-over momentum. Risk/reward heavily favored COPX: 90.0/100 on a 4.6% downside to support and -16.9% upside to resistance, positioning the ETF as a defined-risk fade play rather than a breakout. PICK's technical evidence (42.0/100) exceeded COPX's (36.1/100) only because category-level macro fit was so negative (-8 liquidity stress) that even the technical leader couldn't escape relegation from competitive allocation.
Industrial Metals scores 13.6 and earns zero allocation because liquidity stress is active at -8, and the category shows no macro tailwind to offset that headwind. Technical evidence of 36.1 for the representative (COPX) is too weak to carry a category into a portfolio when macro fit is only 43, and the reasoned ETF proof order shows PICK at 42.0, REMX at 41.0, and COPX at 38.0—a near-tie indicating no conviction and suggesting the category itself is contested between rising-rate fears and scarcity narratives. The 3/2/1 weighted basket begins at 41.0, but after the category reasoner tests against persistence (49.8), volume-price confirmation (32.7), and the macro headwind of liquidity stress, the final score collapses to 13.6. This category is ninth or tenth in the allocation order because industrial metals lack both clear technical leadership and macro tailwind in a disinflation regime where demand destruction fears outweigh scarcity optimism.