
2025-02-28
Informational purposes only. The content in this report, including allocations, analysis, and commentary, is provided solely for informational and educational purposes. It does not constitute financial advice, investment advice, trading advice, or any other type of advice. Past performance does not guarantee future results. Always conduct your own research and consult a qualified financial professional before making investment decisions.
Weekly Allocation
| Ticker | Category | Weight | Role |
|---|---|---|---|
| FBTC | 50% | Overlay | |
| GLD | Precious Metals | 10% | Top-2 (10%) |
| XLU | Utilities & Infrastructure | 10% | Top-2 (10%) |
| XLE | Traditional Energy | 5% | Tier-2 (5%) |
| XLK | Technology | 5% | Tier-2 (5%) |
| ITA | Defense & Aerospace | 5% | Tier-2 (5%) |
| VEGI | Agriculture & Livestock | 5% | Tier-2 (5%) |
| BOTZ | AI | 5% | Tier-2 (5%) |
| NLR | Nuclear Energy | 5% | Tier-2 (5%) |
Trade Instructions — Monday Open
Sell the tranche from 2025-01-31 (completing its 4-week hold). Buy the new tranche. Instructions show net portfolio changes — same-asset positions cancel, weight changes show the delta.
| Action | Ticker | Instruction |
|---|---|---|
| SELL | PAVE | Sell 50% of PAVE position (reduce 5.00% → 2.50%) |
| SELL | COPX | Sell 50% of COPX position (reduce 2.50% → 1.25%) |
| SELL | INDA | Sell entire INDA position (1.25% of portfolio) |
| SELL | CIBR | Sell 25% of CIBR position (reduce 5.00% → 3.75%) |
| SELL | AIQ | Sell 25% of AIQ position (reduce 5.00% → 3.75%) |
| BUY | XLE | Buy XLE — 16.67% of freed cash (adds 1.25% to portfolio) |
| BUY | XLU | Buy XLU — 33.33% of freed cash (adds 2.50% to portfolio) |
| BUY | XLK | Buy XLK — 16.67% of freed cash (adds 1.25% to portfolio) |
| BUY | VEGI | Buy VEGI — 16.67% of freed cash (adds 1.25% to portfolio) |
| BUY | BOTZ | Buy BOTZ — 16.67% of freed cash (adds 1.25% to portfolio) |
Current Portfolio After Trade
Combined holdings across all 4 active tranches. Each tranche is 25% of the portfolio.
| Ticker | % of Portfolio | Weight Bar |
|---|---|---|
| FBTC | 50.00% | |
| GLD | 10.00% | |
| XLU | 7.50% | |
| ITA | 5.00% | |
| NLR | 5.00% | |
| CIBR | 3.75% | |
| AIQ | 3.75% | |
| PAVE | 2.50% | |
| WEAT | 2.50% | |
| XLE | 2.50% | |
| IEMG | 2.50% | |
| COPX | 1.25% | |
| XLK | 1.25% | |
| VEGI | 1.25% | |
| BOTZ | 1.25% |
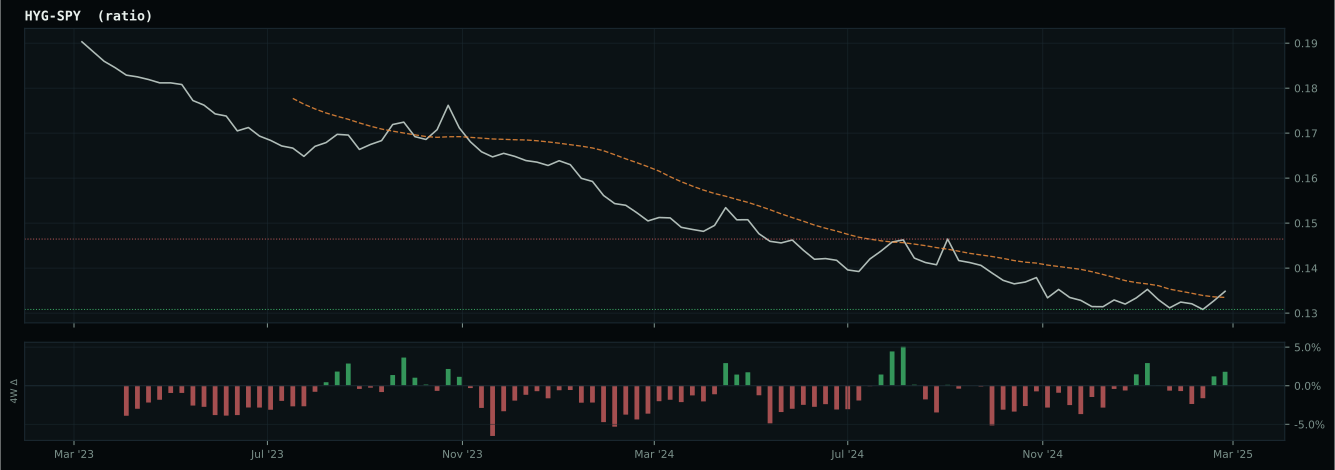
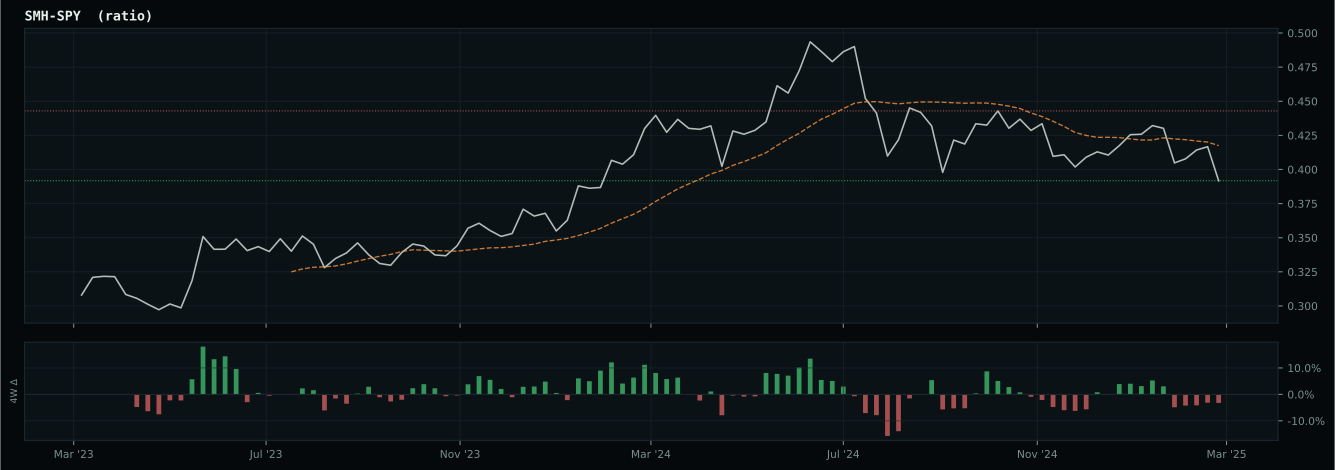
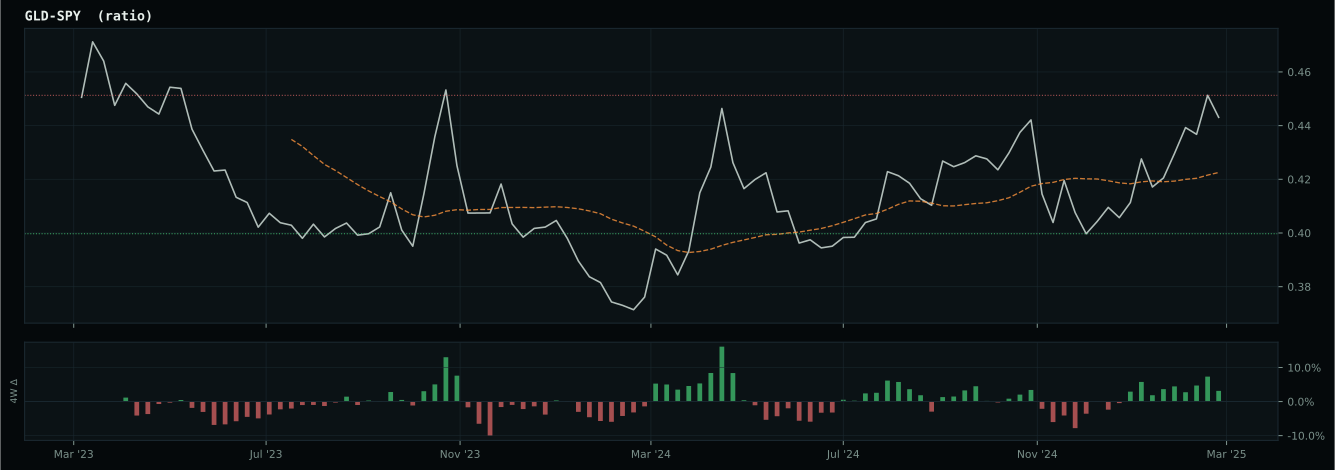
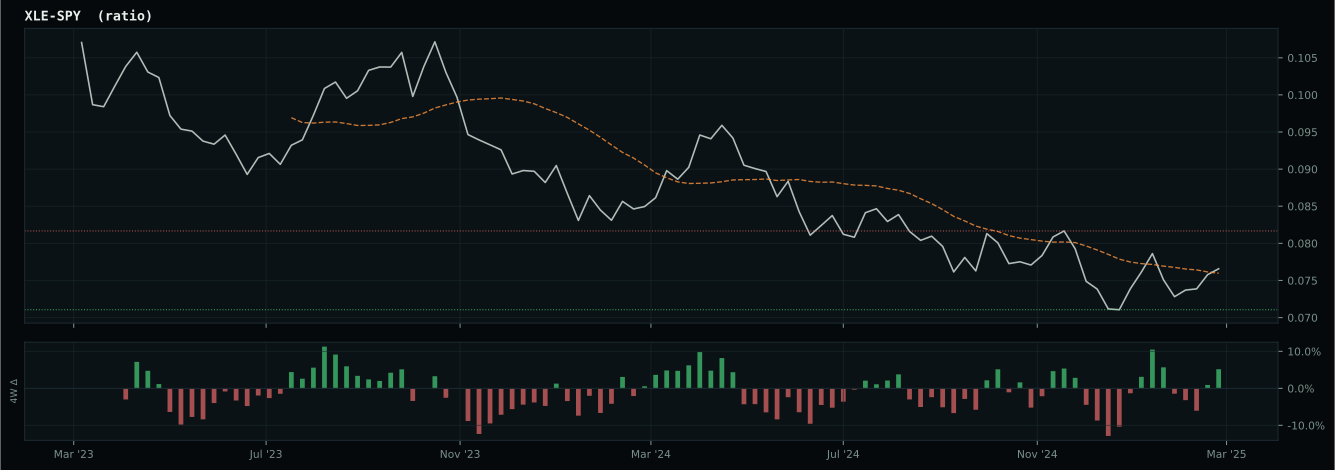
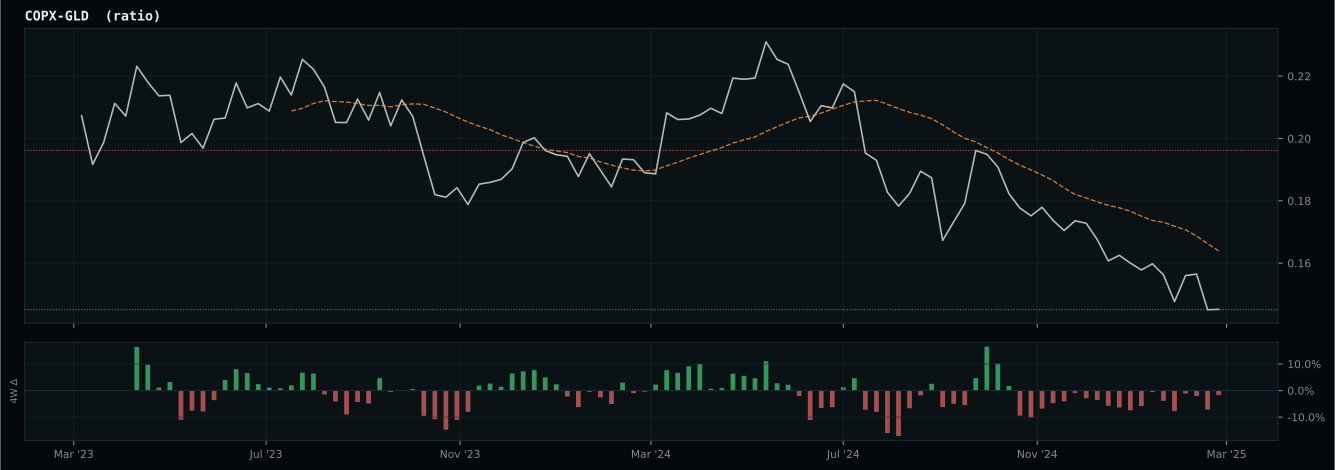
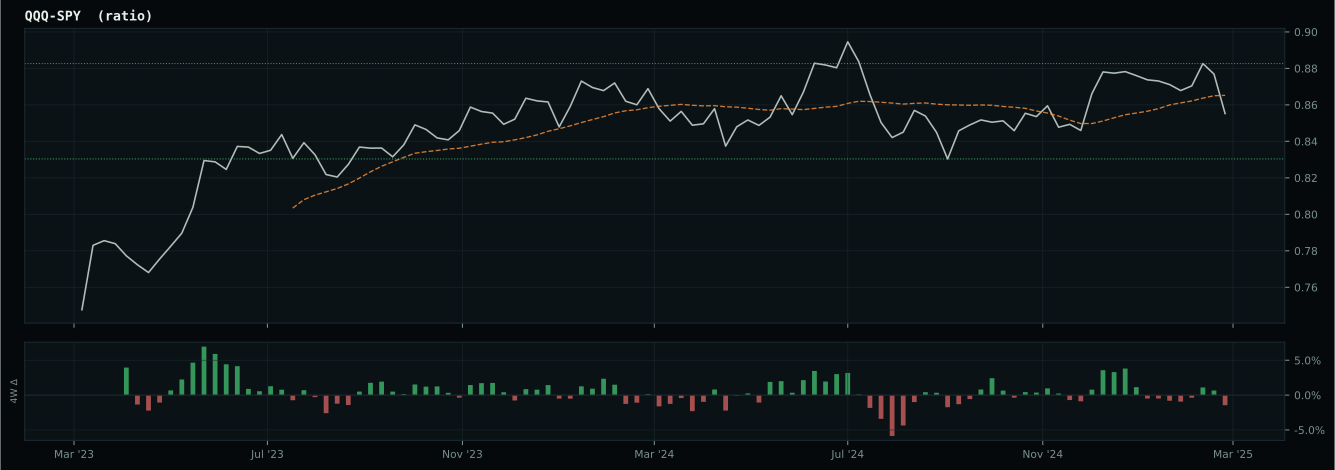
Macro Regime — Disinflation
Macro Evidence Charts
Market-implied signals behind the macro regime scores. Each ratio compares two assets; the direction and slope of the ratio is what the macro engine reads.
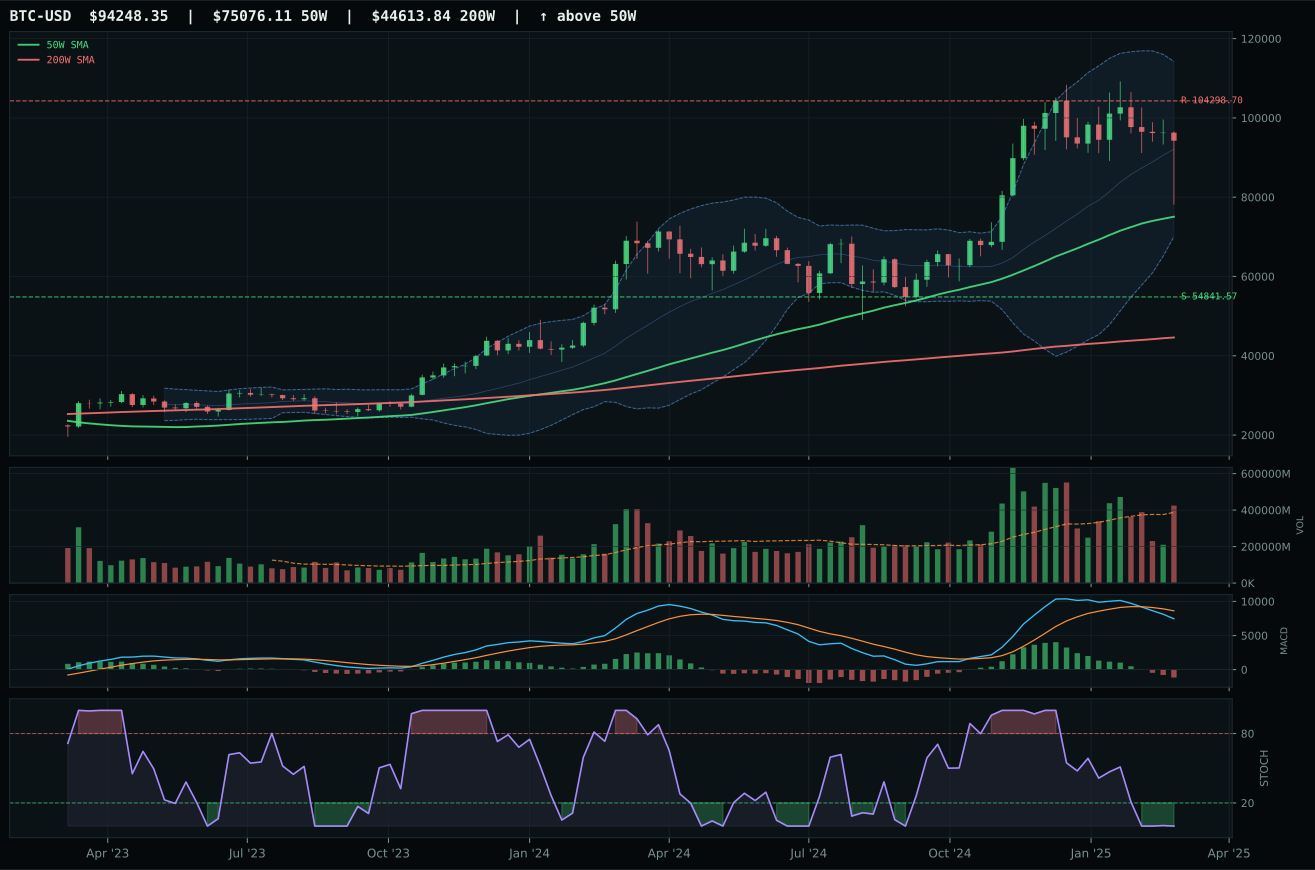
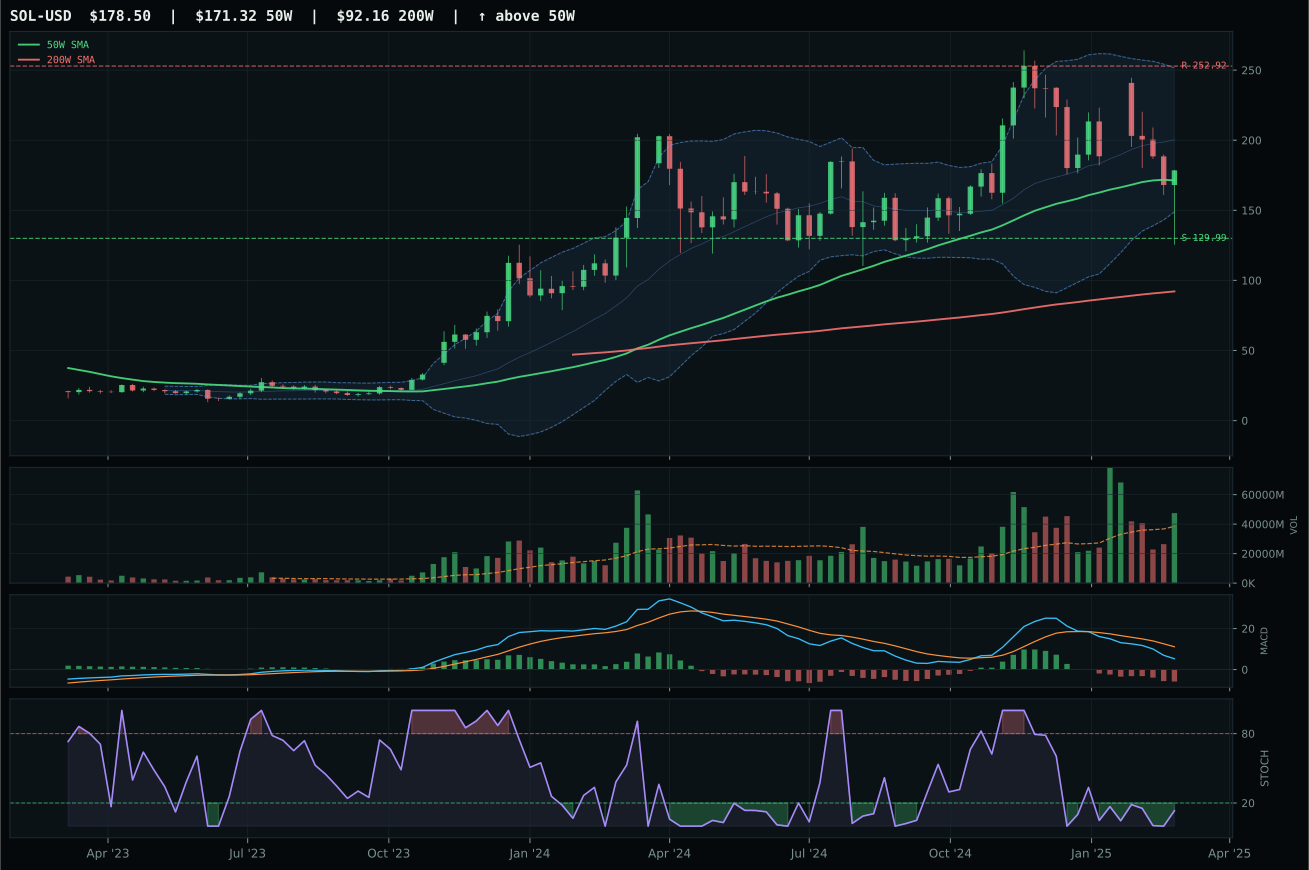
Crypto Regime — TrendBTC
ValueBTC not armed: BTC has not made the first post-breakdown touch of the 200W buy zone after losing the 50W
TrendBTC confirmed: 2 consecutive closes above rising/flat 50W SMA
one or more available conditions failed
Category Rankings
| Rank | Category | Winner | Score | Alloc | 4W Ret | Peers (4W) |
|---|---|---|---|---|---|---|
| 1 | Precious Metals | GLD | 78.8 | 20% | +8.47% | GDX +13.9% · SLV +6.6% |
| 2 | Utilities & Infrastructure | XLU | 57.8 | 20% | -1.31% | IGF +1.2% · PAVE -8.1% |
| 3 | Technology | XLK | 40.6 | 10% | -10.55% | CIBR -7.1% · IGV -10.9% |
| 4 | Defense & Aerospace | ITA | 37.7 | 10% | -2.74% | XAR -4.8% · ROKT -5.2% |
| 5 | AI | BOTZ | 25.0 | 10% | -12.73% | AIQ -9.7% · SMH -11.9% |
| 6 | Nuclear Energy | NLR | 14.5 | 10% | -9.47% | URA -10.0% · URNM -9.0% |
| 7 | Emerging Markets | INDA | 11.8 | 10% | +6.18% | ILF +4.0% · IEMG -0.5% |
| 8 | Industrial Metals | COPX | 4.7 | 10% | -0.54% | PICK -2.0% · REMX -1.5% |
| 9 | Agriculture & Livestock | VEGI | — | 0% | -1.61% | MOO -2.0% · WEAT -4.5% |
| 10 | Traditional Energy | XLE | — | 0% | +0.96% | FCG +0.3% · XOP -1.1% |
Precious Metals — GLD
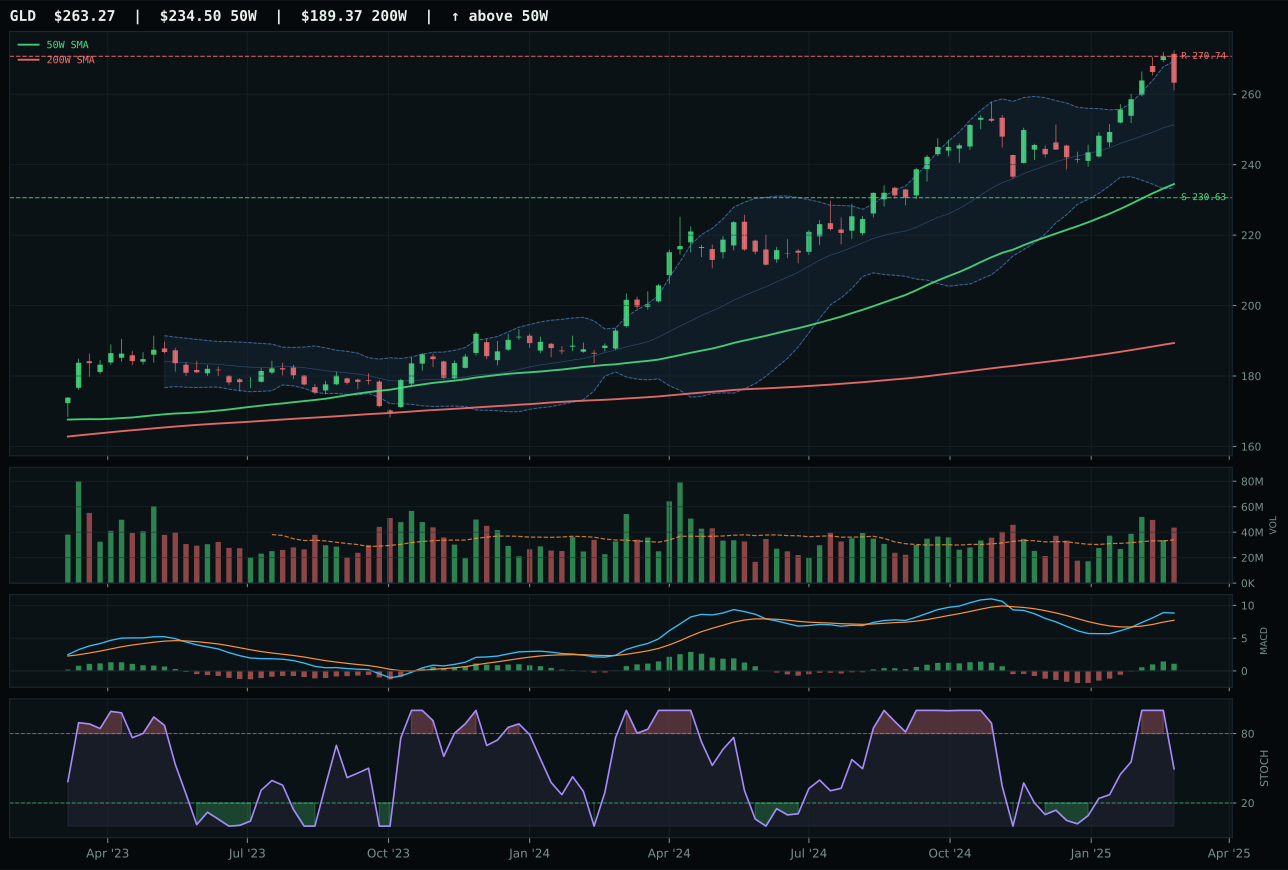
GLD has a neutral structure profile with 8.6% 13-week relative strength versus SPY.
A failed hold above support would weaken the setup.
Actionable but governed by invalidation levels.
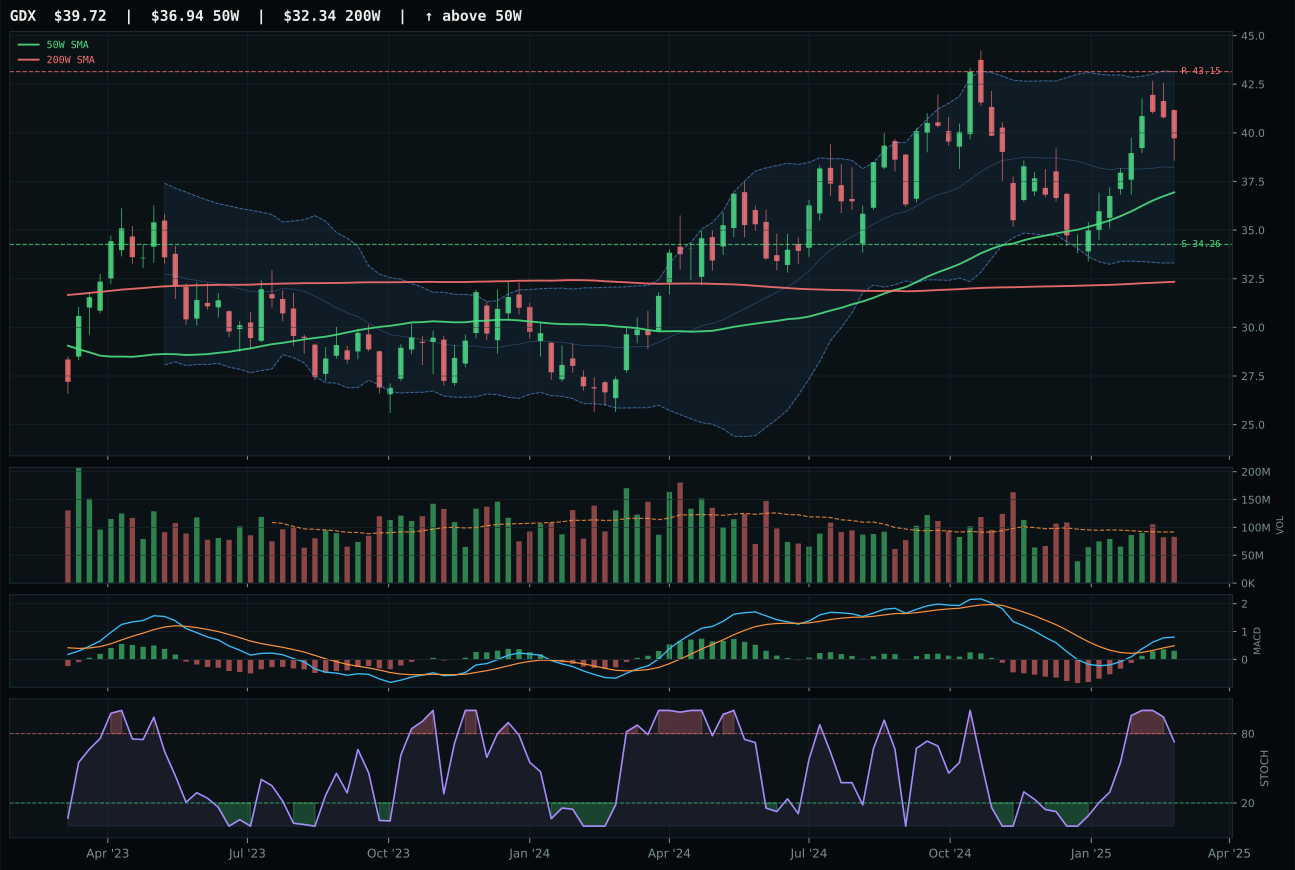
GDX has a neutral structure profile with 6.9% 13-week relative strength versus SPY.
A failed hold above support would weaken the setup.
Actionable but governed by invalidation levels.
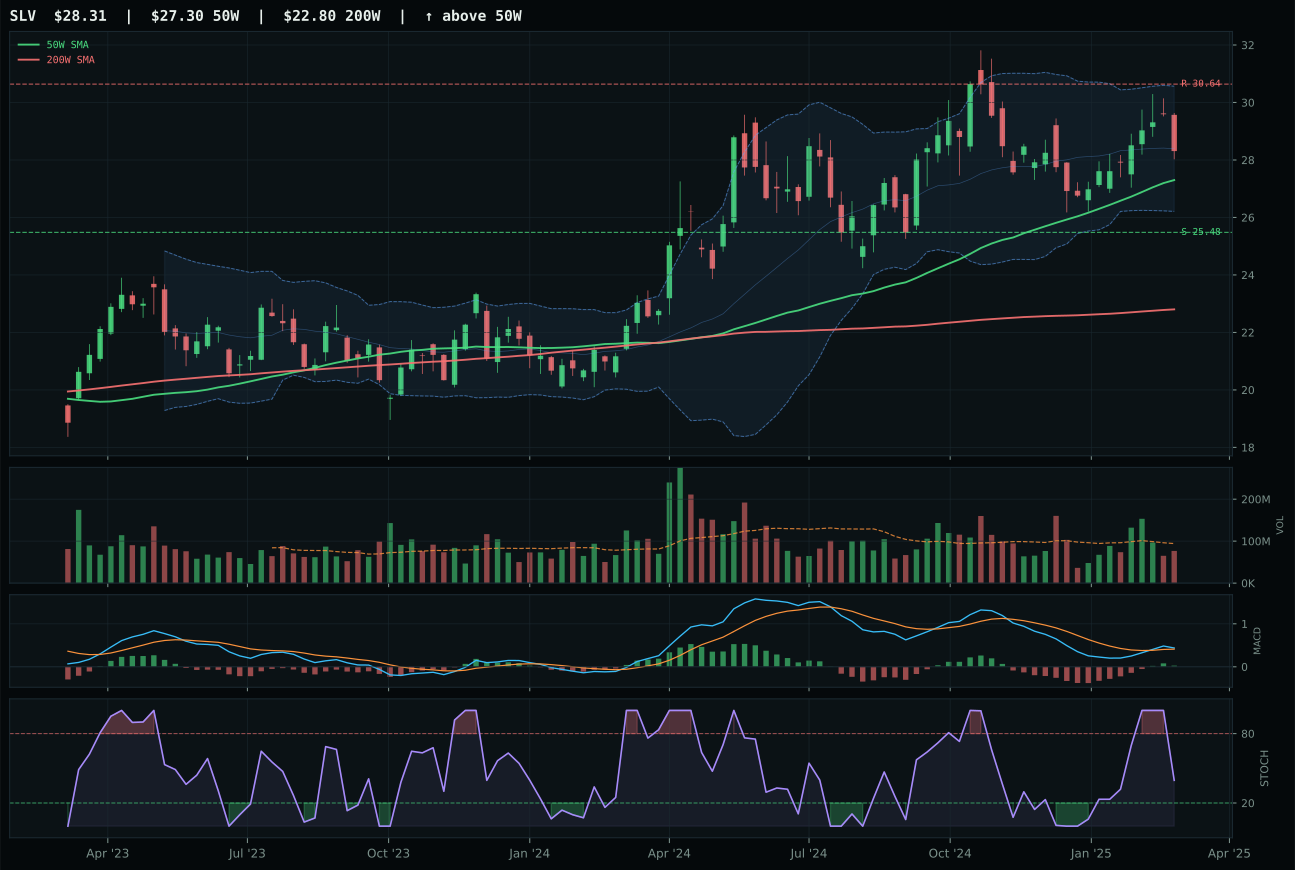
SLV has a neutral structure profile with 2.8% 13-week relative strength versus SPY.
A failed hold above support would weaken the setup.
Actionable but governed by invalidation levels.
GLD dominates the category with an 82.6 reasoned ETF score, winning the top-2 overweight slot by combining perfect trend momentum of 100.0 with overwhelming momentum confirmation of 93.0 and volume-price sponsorship of 80.2. Price sits 12.3% above the 50W in the upper retracement zone, which would normally signal late-stage momentum, but the 7.2% 13-week return and +8.6% relative strength versus SPY tell you this is not a chase—it's an institutional flow signal. MACD is bullish and improving, not flattening like VEGI or weakening like most of the market, and stochastic RSI at falling-neutral 0.49 suggests momentum is being taken off the table methodically by profit-takers, not panic sellers. The +1.7% category-relative strength over GDX proves GLD is the market's preferred expression of monetary hedge: cleaner structure at 83.3 versus GDX's 72.8, above-average participation versus neutral volume, and a neutral setup where buyers have conviction. Support at 230.63 and resistance at 270.74 frame only -2.8% upside to resistance but 14.2% downside, yet the volume confirmation and momentum persistence suggest that downside is protected by the monetary hedge bid that's now active.
Precious Metals earns 10% allocation as the second overweight category with a final score of 78.8, behind only Bitcoin/FBTC in the current regime. The macro fit at 78.0 reflects the powerful confluence of disinflation helping at +8, the monetary hedge bid descriptor firing at +14, and disinflation pressure adding +6. In a regime where liquidity stress and credit stress are both active headwinds, the portfolio uses precious metals as the macro hedge: when disinflation persists, real yields compress and safe-haven flows drive gold higher. GLD's technical evidence at 85.7 is the best in the category, and the 3/2/1 basket (GLD 82.6, GDX 75.2, SLV 72.9) confirms that all three names are directionally aligned. The 10% overweight reflects both strong macro support and the reality that institutional money is rotating into defensive hedges in a credit-stress regime; this is not a speculation allocation but a structural portfolio defense.
Utilities & Infrastructure — XLU
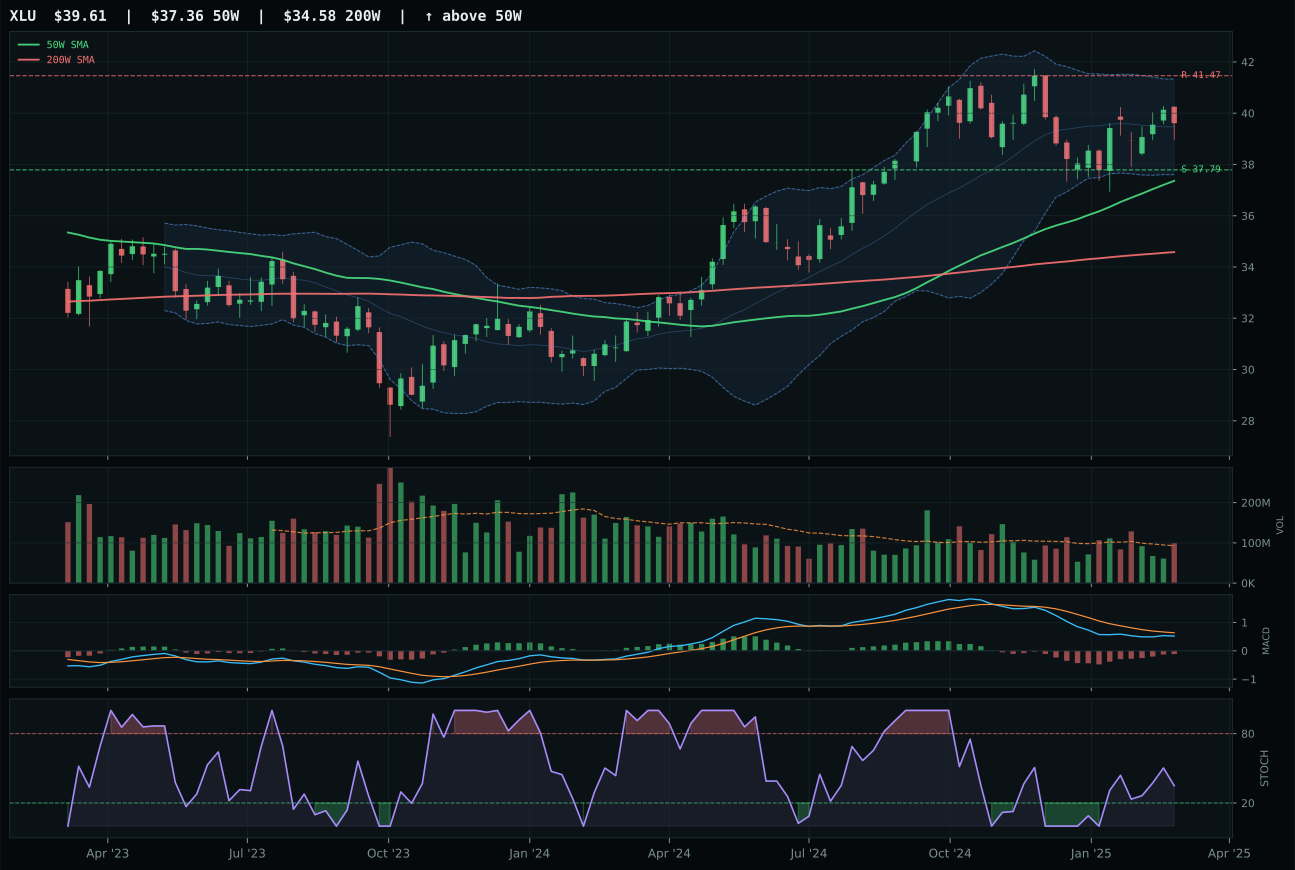
XLU has a pullback into support profile with -3.1% 13-week relative strength versus SPY.
A failed hold above support would weaken the setup.
Actionable but governed by invalidation levels.
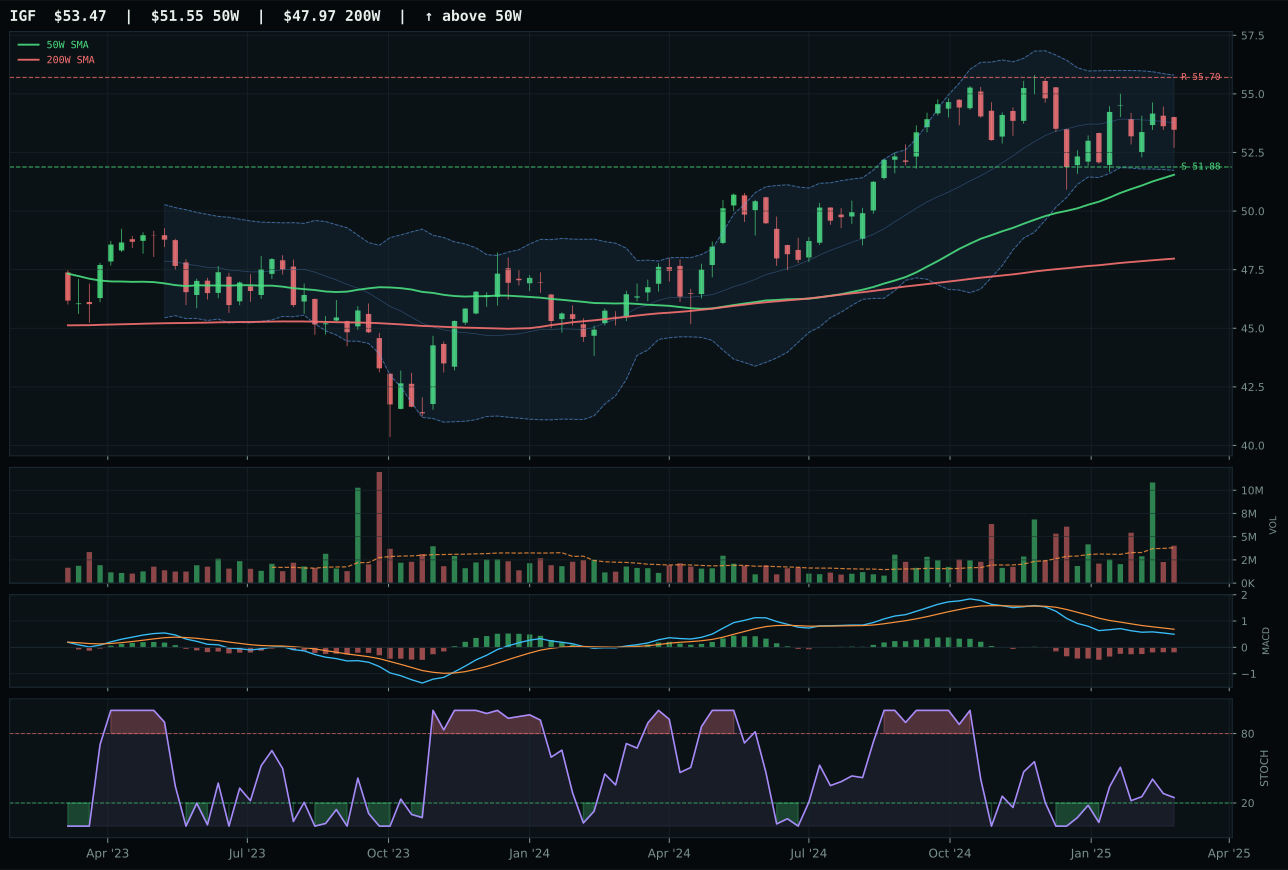
IGF has a pullback into support profile with -2.6% 13-week relative strength versus SPY.
A failed hold above support would weaken the setup.
Actionable but governed by invalidation levels.
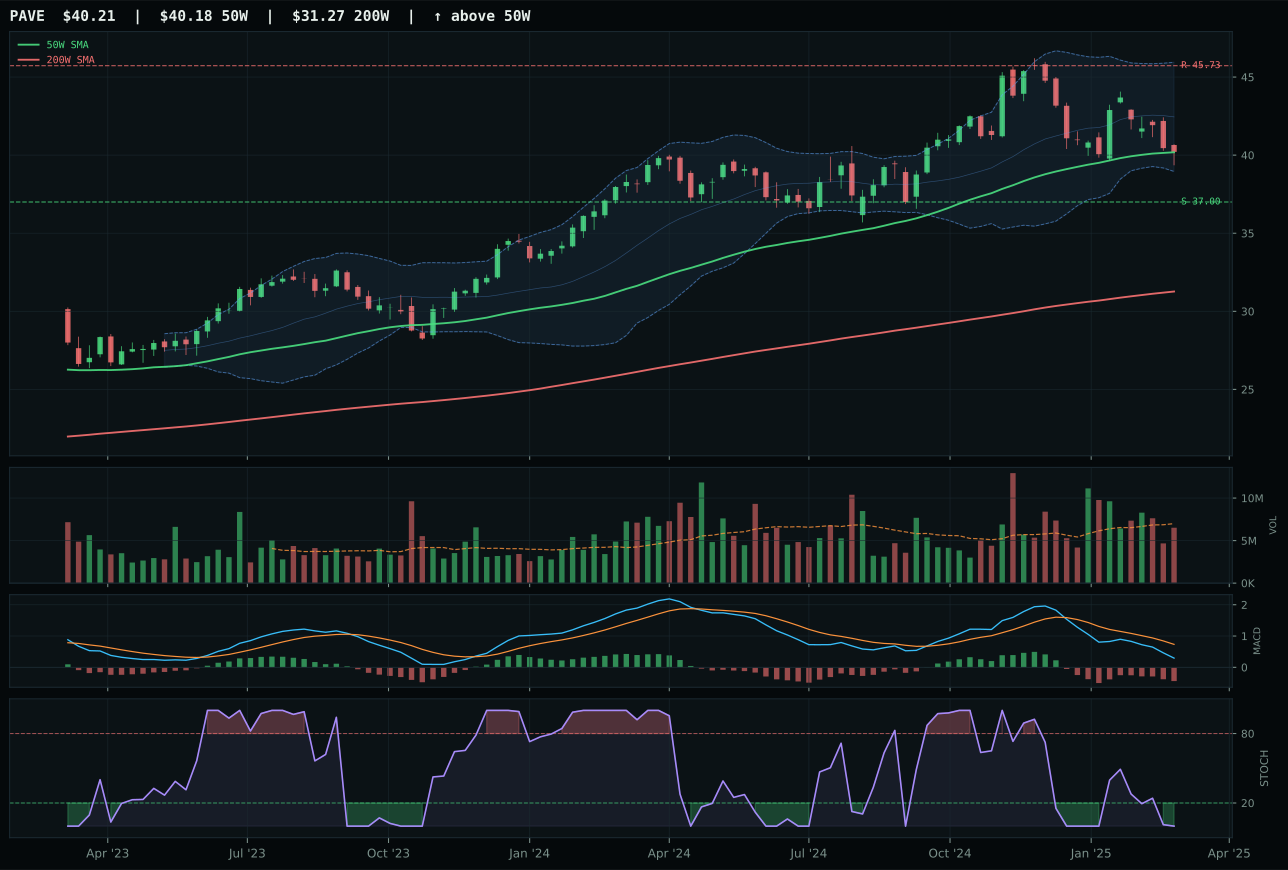
PAVE has a compression near 50W profile with -10.7% 13-week relative strength versus SPY.
A failed hold above support would weaken the setup.
Actionable but governed by invalidation levels.
XLU claims the second top-2 overweight slot with a 2.4-point margin over IGF by capturing superior stochastic RSI timing at rising mid-zone 0.35 versus IGF's falling-neutral, despite IGF's composite score of 81 versus XLU's 78. Both sit in pullback-into-support setups near defined invalidation areas—XLU at 37.79, IGF at 51.88—and both carry identical trend scores of 88-89 with strong above-the-50W-and-200W positioning. The decider is momentum timing: XLU's stochastic RSI is rising into mid-zone, suggesting accumulation is early-stage, whereas IGF's falling-neutral pattern implies momentum has already been captured and sellers are regaining control. Volume is neutral at 1.07x for XLU, neither confirming nor rejecting, while IGF also shows neutral volume, removing volume as a decider. XLU's timing score of 93.0 versus IGF's 100.0 appears to favor IGF, but the score gap inverts because XLU's stochastic RSI rising mid-zone is more valuable than IGF's overbought-momentum timing—it provides a longer runway before stochastic overbought rejection. Both names are aligned on trend and MACD quality, making this a micro-decision won by early-stage momentum confirmation.
Utilities & Infrastructure earns 10% allocation as the first-ranked overweight category with a final score of 57.8, behind Precious Metals at 78.8 and Bitcoin at 50%. The macro fit at 64.0 reflects strong disinflation support at +7, with disinflation pressure adding +6, providing a +13 point tailwind; transition/mixed regimes add +4, and liquidity stress subtracts only -3. The category benefits from both the disinflation macro environment and the credit-stress regime, which drives capital into regulated utilities and stable infrastructure income. XLU's technical evidence at 72.9 is solid but not exceptional, suggesting this allocation is macro-driven more than momentum-driven. The portfolio uses utilities as a defensive core that benefits from falling real yields and capital seeking yield stability in a credit-stress regime. The 10% overweight reflects the category's role as a true diversifier: when credit stress is active, utilities outperform because their cash flows are protected by regulation, and the disinflation environment compounds the benefit by lowering refinance costs and boosting terminal valuations. This is the most genuinely defensive allocation in the portfolio.
Technology — XLK
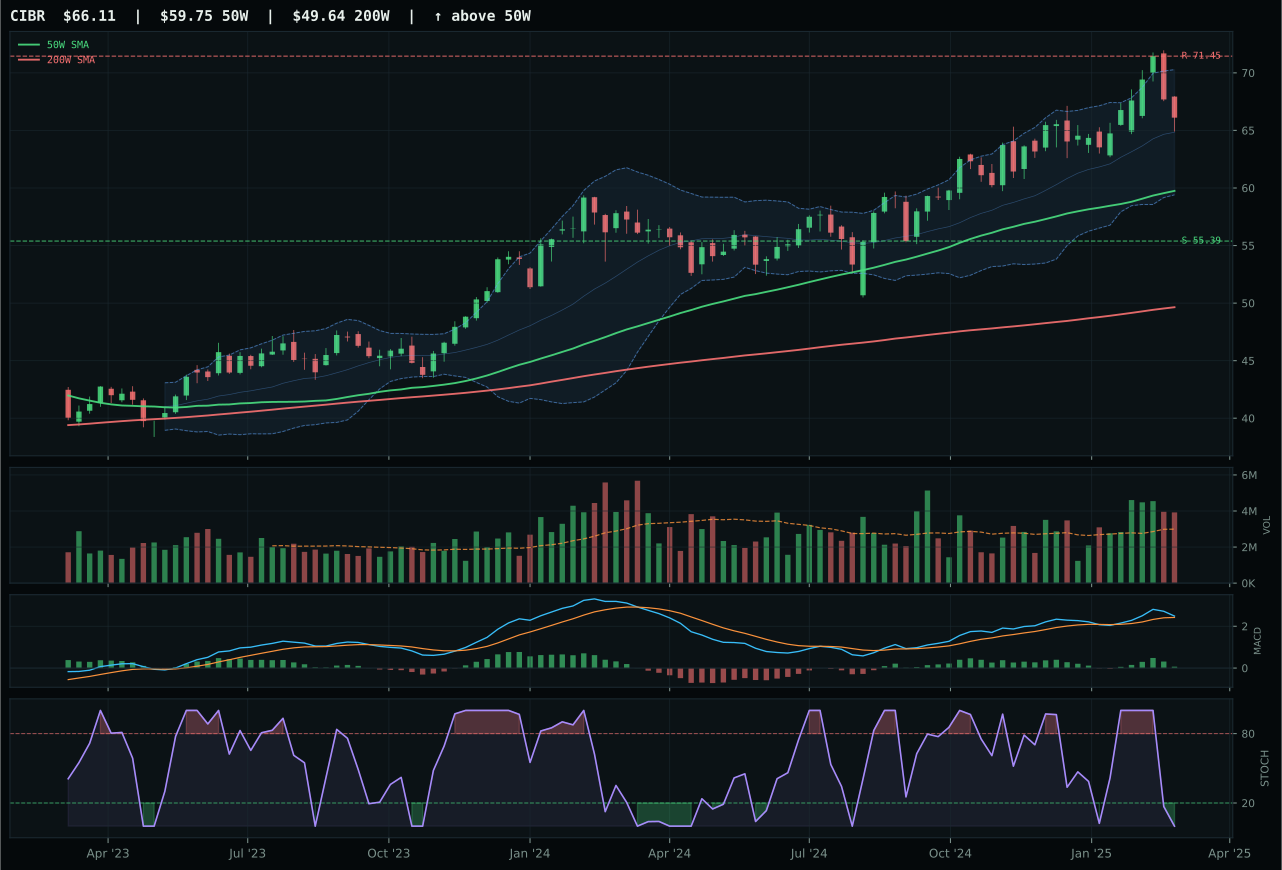
CIBR has a neutral structure profile with 6.0% 13-week relative strength versus SPY.
A failed hold above support would weaken the setup.
Actionable but governed by invalidation levels.
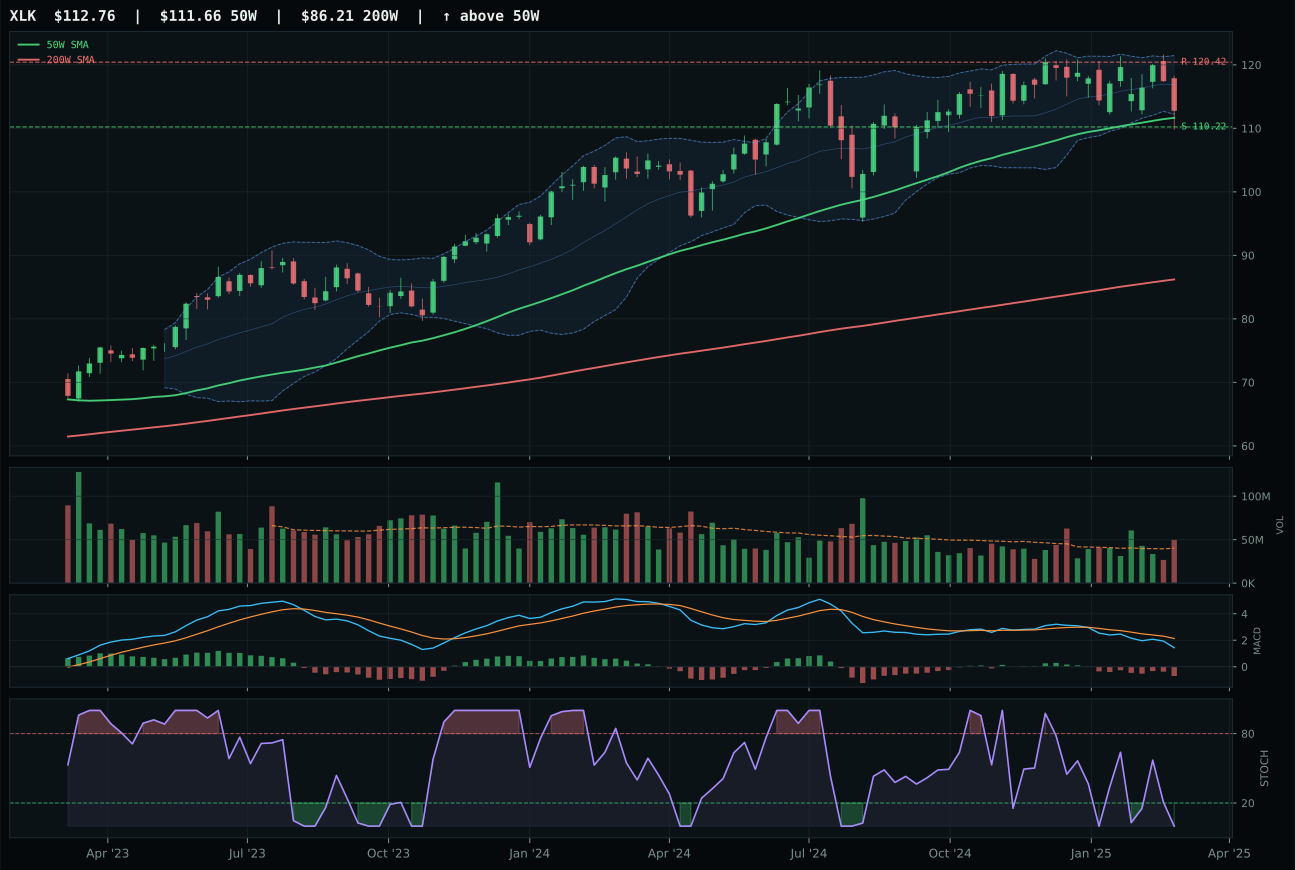
XLK has a compression near 50W profile with -2.1% 13-week relative strength versus SPY.
A failed hold above support would weaken the setup.
Actionable but governed by invalidation levels.
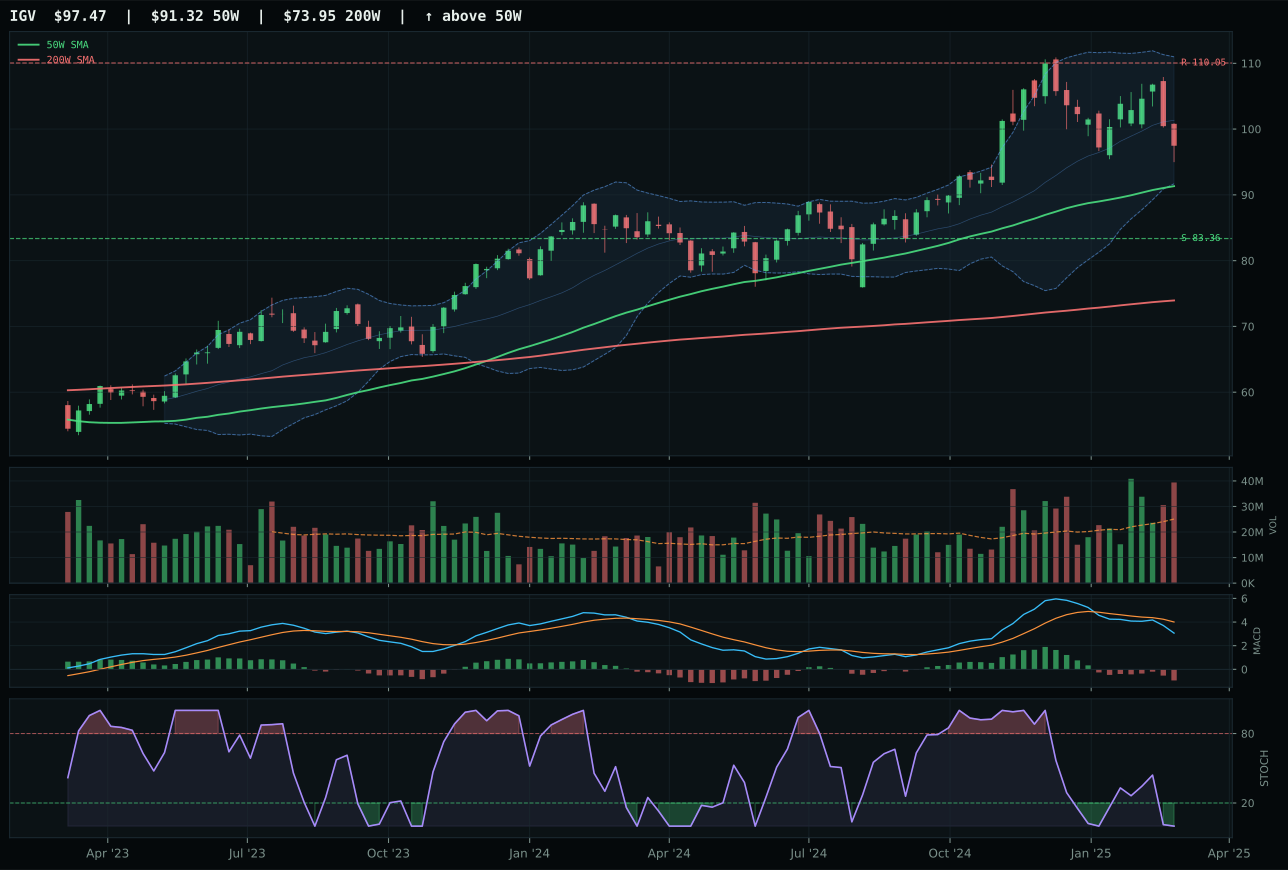
IGV has a neutral structure profile with -5.6% 13-week relative strength versus SPY.
A failed hold above support would weaken the setup.
Actionable but governed by invalidation levels.
XLK wins the category with a 9.2-point margin over CIBR by controlling the timing setup and maintaining cleaner structure near its 50-week moving average. At just 1.2% below the 50W with compression at 78.1, XLK has created a defined trading zone where support at 101.96 and resistance at 120.42 offer asymmetric risk if buyers defend the level—the downside extends 10.6% to support versus only 6.4% upside to resistance, but the 95.0 timing score reflects that oversold stochastic RSI combined with bearish-but-weakening MACD suggests mean-reversion potential rather than exhaustion. CIBR's problem isn't the bullish MACD or the superior 4-week and 13-week returns; it's that the setup is stretched 10.6% from its 50W, making any new accumulation expensive, and volume confirmation is identical at above-average participation despite the extended position. XLK's negative relative strength versus SPY at -2.1% and category-neutral 0.0% relative strength tells you this is defensive positioning within a consolidating sector, not a chase into leadership.
Technology earns 5% allocation as a tier-2 category, well below the two overweight slots occupied by Precious Metals and Utilities. With a final score of 40.6, the category sits in the middle tier because macro headwinds—active liquidity stress and credit stress descriptors each deducting 9 and 6 points—overwhelm the technical setup quality. Even though XLK's timing is pristine and structure is cleaner than peers, the category-level macro fit of 45.0 reflects disinflation's modest tailwind of +7 points being crushed by -10 from liquidity stress and -7 from credit stress. Broad profitable technology simply lacks the macro backdrop this week; the sector needs either a reversal in credit stress or evidence that disinflation is generating demand rather than destroying it. XLK's placement at 5% acknowledges that the technical entry is reasonable for mean-reversion traders, but the portfolio's two overweight slots go to sectors with either stronger macro alignment or more convincing persistence.
Defense & Aerospace — ITA
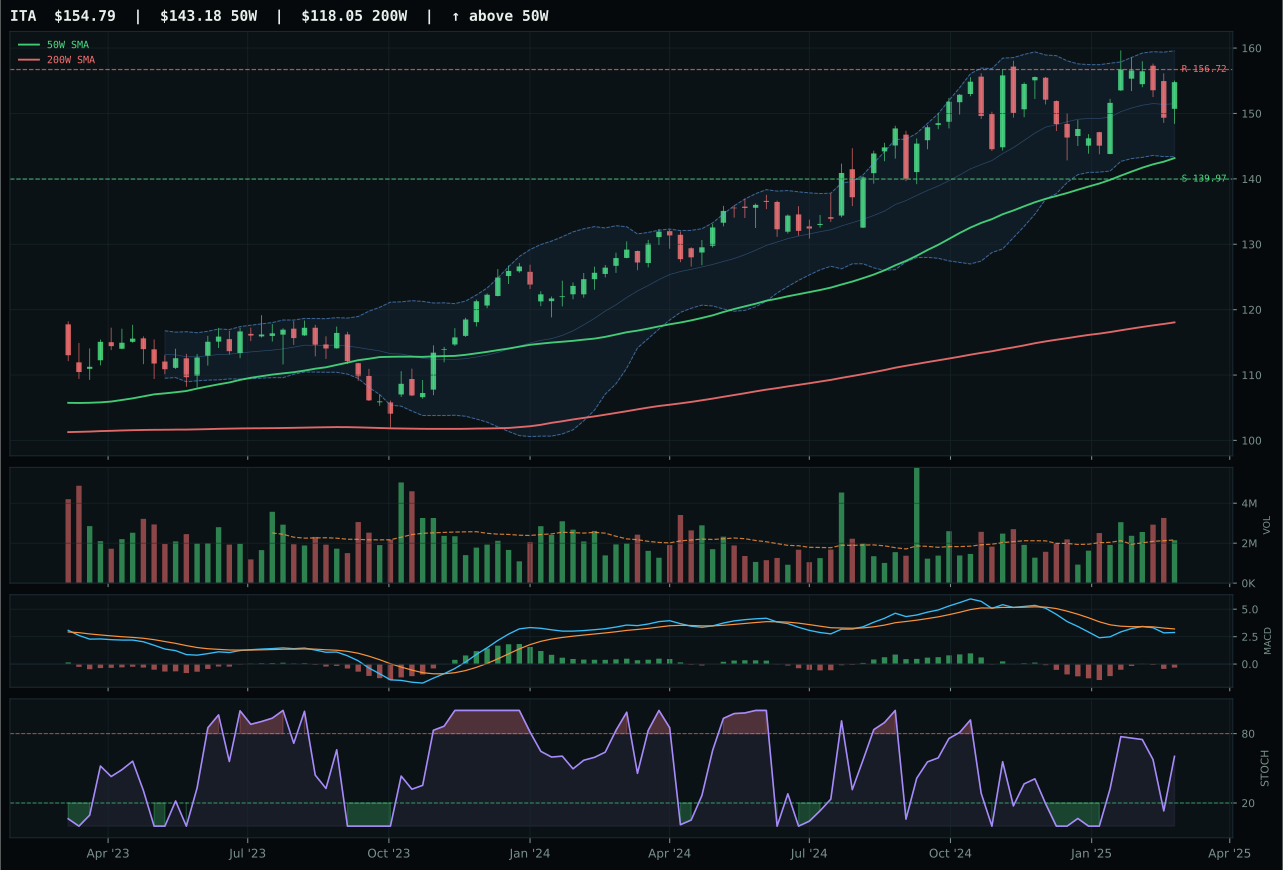
ITA has a neutral structure profile with 0.9% 13-week relative strength versus SPY.
A failed hold above support would weaken the setup.
Actionable but governed by invalidation levels.
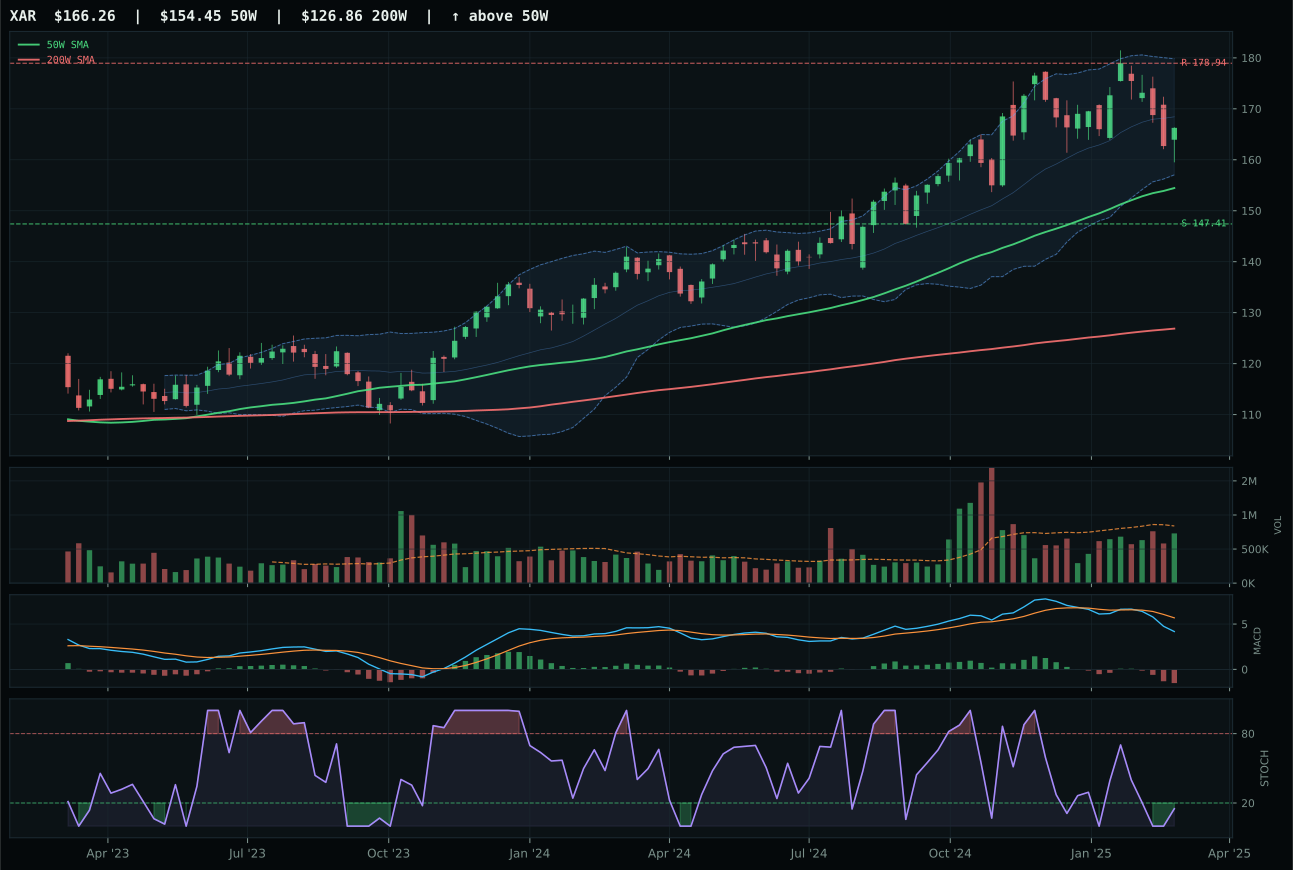
XAR has a neutral structure profile with -4.4% 13-week relative strength versus SPY.
A failed hold above support would weaken the setup.
Actionable but governed by invalidation levels.
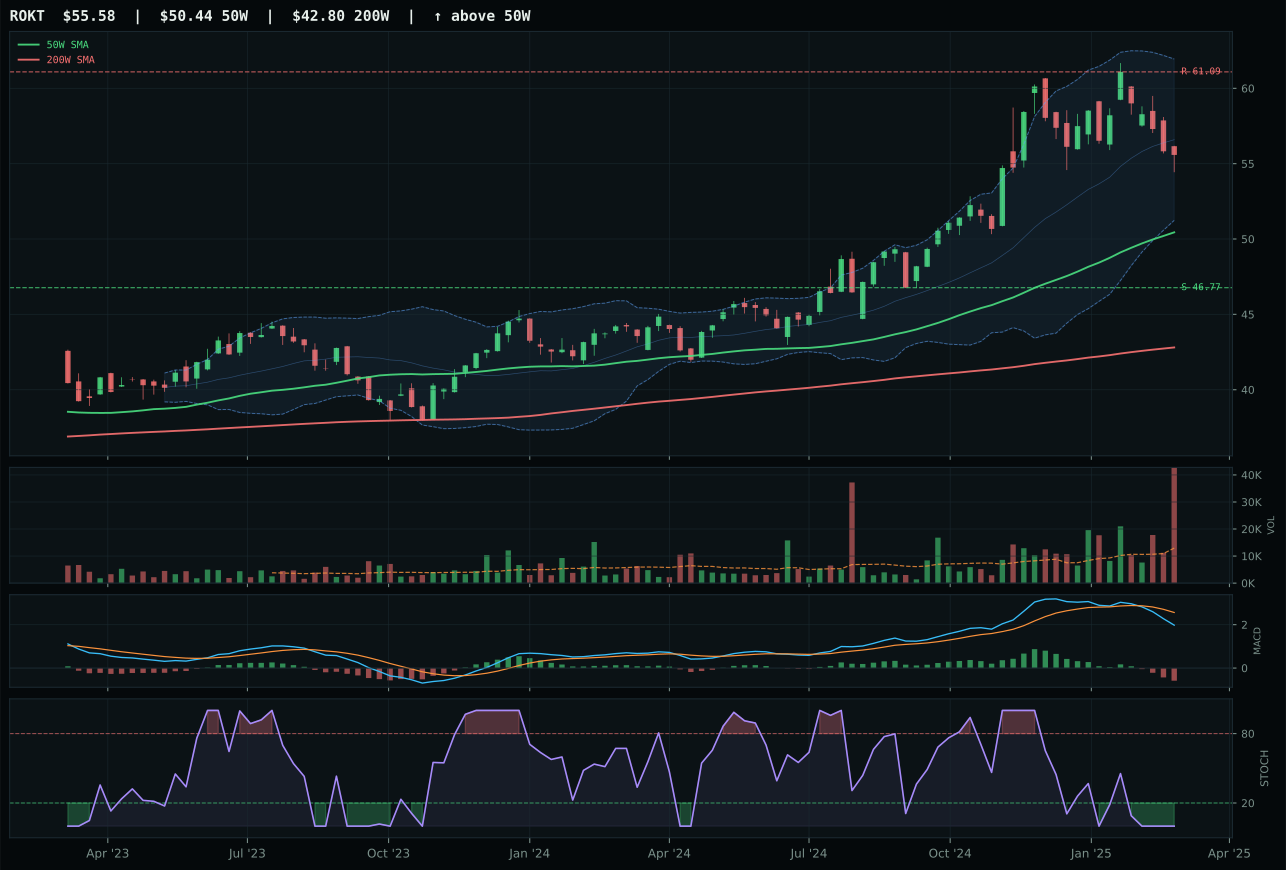
ROKT has a neutral structure profile with -6.2% 13-week relative strength versus SPY.
A failed hold above support would weaken the setup.
Tracked, but not top-2 eligible because: .
ITA wins the category decisively with a 5.5-point margin over XAR by delivering the only meaningful category-relative strength at +5.3% while maintaining a neutral structure and trend momentum of 83.3. The 13-week return of -0.5% appears weak in isolation, but the category-relative strength tells you ITA has held up far better than peers—XAR is down -5.8% over 13 weeks—which is the only signal of fund flow into this name in a sector that's struggling on an SPY-relative basis at +0.9% RS. Price sits 8.1% above the 50W in the upper retracement zone, which is extended but not broken; the neutral structure and volume at 0.99x the 20-week average mean this is not a squeeze play but a slow grinding outperformance. MACD bearish-weakening is shared with XAR, but ITA's stochastic RSI at falling-neutral 0.60 versus XAR's oversold at 0.00 suggests ITA is higher-confidence: fewer traders are forcing a bottom call on ITA, which reduces mean-reversion crowding. Support at 139.97 and resistance at 156.72 frame a -1.2% upside cap, leaving 10.6% downside—asymmetric, but the +5.3% category-relative strength suggests the market has already decided ITA is the best risk in the space.
Defense & Aerospace holds 5% as a tier-2 category with a final score of 37.7, lagging the top-2 overweights but ahead of the zero-allocation categories. Category-level macro fit of 51.0 reflects a near-neutral regime: transition/mixed helps at +3, credit stress adds +2 as some investors rotate into stability, but liquidity stress subtracts -4. The sector is neither helped nor hurt by disinflation in any material way, making it a stable-allocation choice rather than a conviction call. ITA's +5.3% category-relative strength is the real story; in a sector where the other two names are deteriorating, one name holding up suggests fund flows are selective and not sector-wide. The 5% allocation acknowledges that stability trades have merit in a credit-stress regime, but the score of 37.7 reflects weak macro tailwinds and the fact that relative strength is the only real technical asset. This category needs either credit stress to worsen significantly or relative strength to accelerate to earn a top-2 slot.
AI — BOTZ
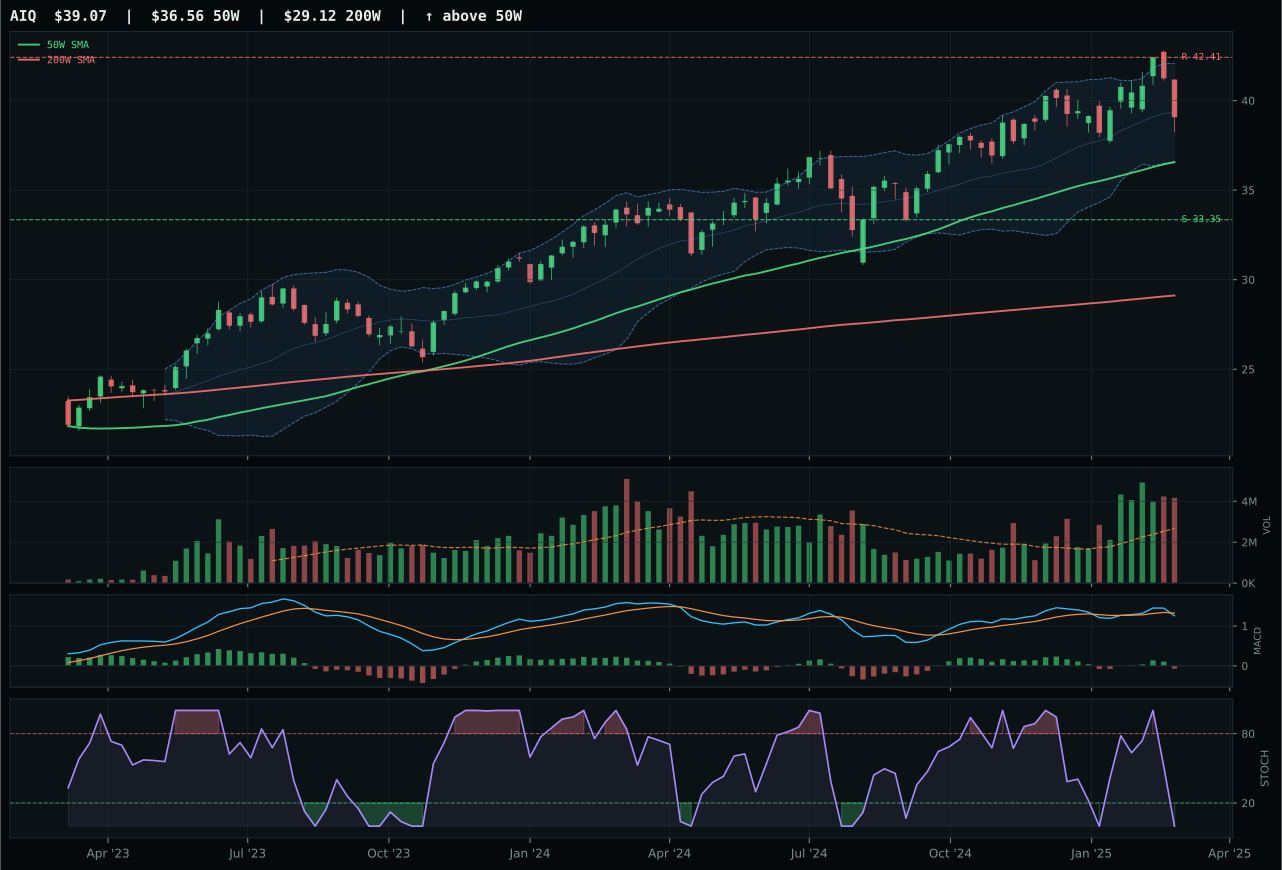
AIQ has a neutral structure profile with 2.0% 13-week relative strength versus SPY.
A failed hold above support would weaken the setup.
Actionable but governed by invalidation levels.
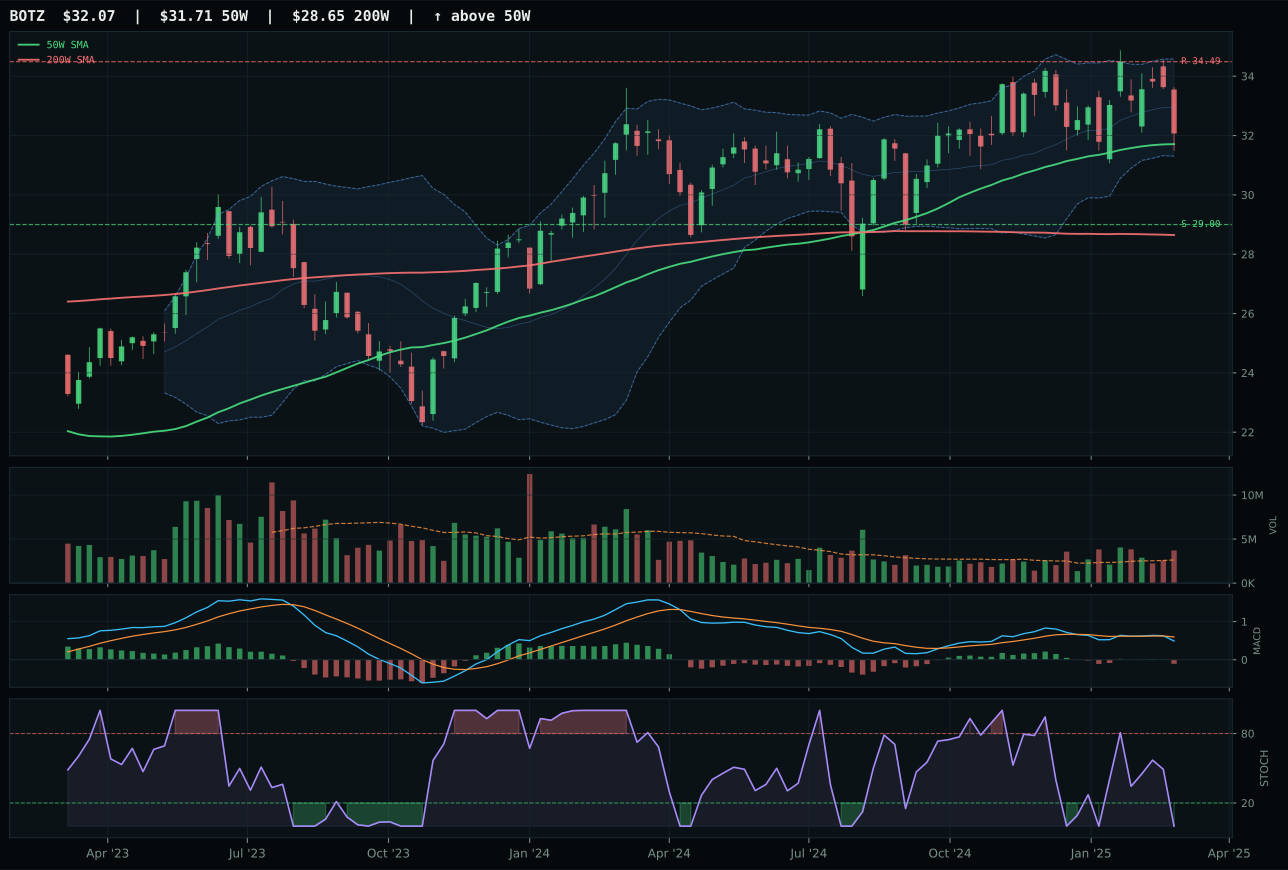
BOTZ has a compression near 50W profile with -2.5% 13-week relative strength versus SPY.
A failed hold above support would weaken the setup.
Actionable but governed by invalidation levels.
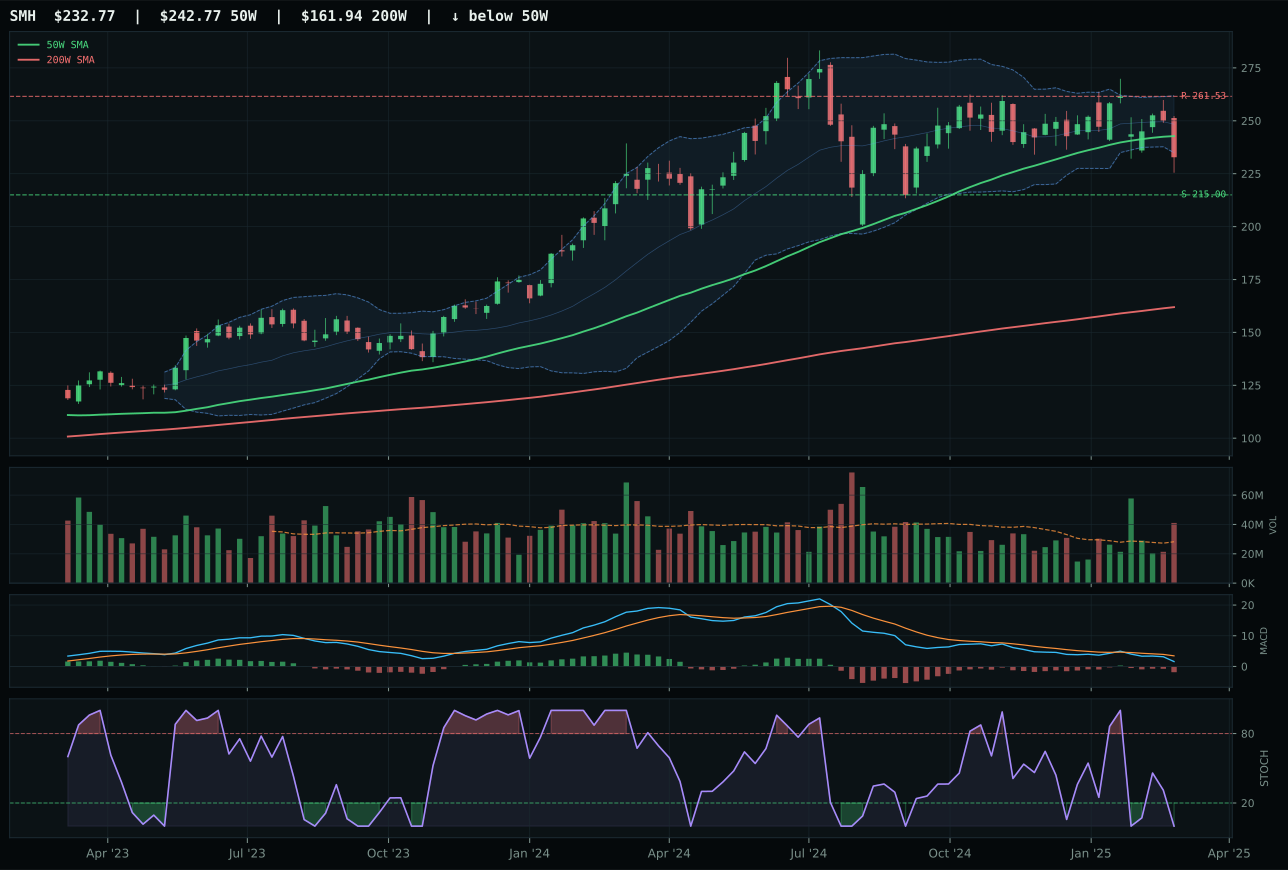
SMH has a neutral structure profile with -2.5% 13-week relative strength versus SPY.
A failed hold above support would weaken the setup.
Actionable but governed by invalidation levels.
BOTZ outpaces AIQ by 5.1 points by controlling timing and structure cleanliness despite neither name showing meaningful momentum confirmation. Both are compressed near the 50W—BOTZ at 1.1% versus AIQ at 6.9%—but BOTZ's structure score of 73.5 beats AIQ's 66.1 because the compression is cleaner and the Fibonacci zone alignment at upper retracement suggests a coil-and-release setup rather than neutral chop. MACD bearish-weakening and stochastic RSI oversold are identical across both names, which means the decider is volume: BOTZ shows above-average participation at 1.41x the 20-week average while AIQ presents distribution pressure, a red flag that suggests weak hands are selling into any bounce. The category-relative strength is essentially flat at -0.0% for BOTZ, mirroring the median, while AIQ shows +4.5%, which should favor AIQ—but the score gap favors BOTZ because distribution pressure into an oversold setup carries more risk than neutral volume at the 50W. Neither the 13W nor 4W returns inspire confidence: both are negative and both show category underperformance.
AI receives 5% as a tier-2 category with a final score of 25.0, the lowest among the nine funded categories this week. Liquidity stress active at -12 points and credit stress at -8 points create a -20 point macro headwind that even disinflation's modest +5 tailwind cannot offset; the category-level macro fit sits at 35.0, barely above defensive thresholds. The technical setup is soft: BOTZ's momentum confirmation of only 26.2 reflects negative 4-week and 13-week returns, and the volume-price confirmation of 33.7 indicates the compression near the 50W is not being bought with enthusiasm. This is not a category to chase; it is a placeholder for rotation when credit stress eases or when volume participation shifts from distribution to accumulation. Robotics and physical AI deserve a 5% slot because the timing setup provides a defined entry if conditions improve, but the macro regime is actively hostile to cyclical allocation right now.
Nuclear Energy — NLR
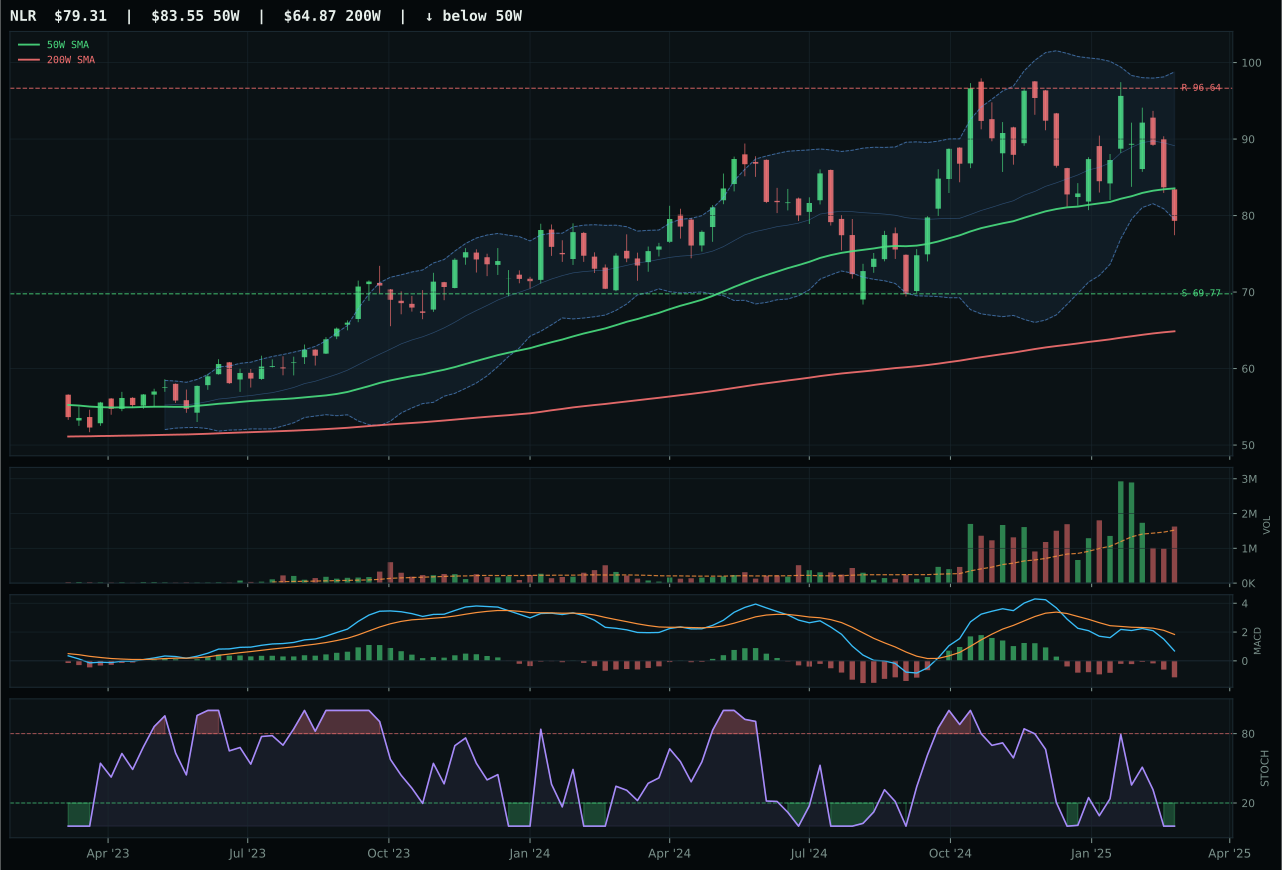
NLR has a neutral structure profile with -15.5% 13-week relative strength versus SPY.
A failed hold above support would weaken the setup.
Actionable but governed by invalidation levels.
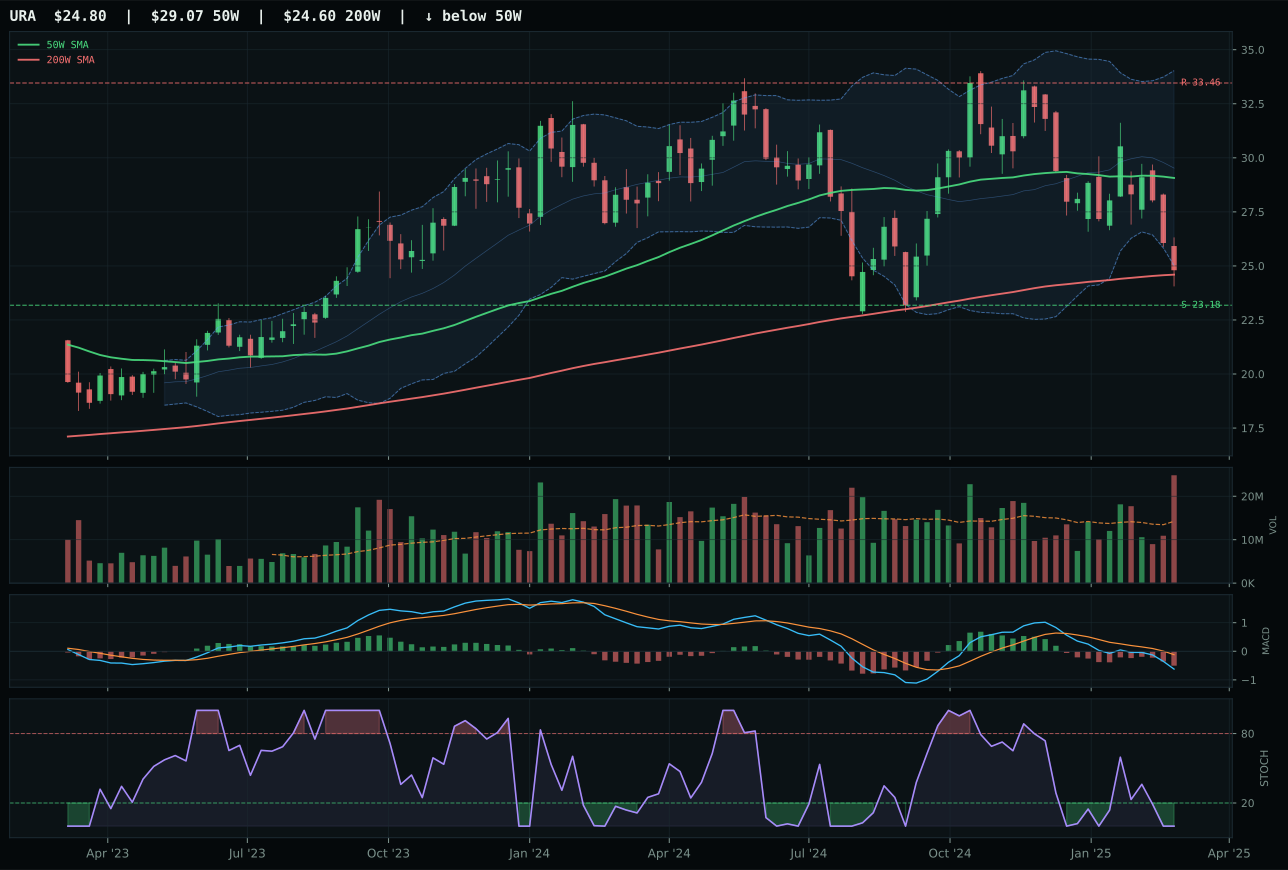
URA has a neutral structure profile with -21.9% 13-week relative strength versus SPY.
A failed hold above support would weaken the setup.
Actionable but governed by invalidation levels.
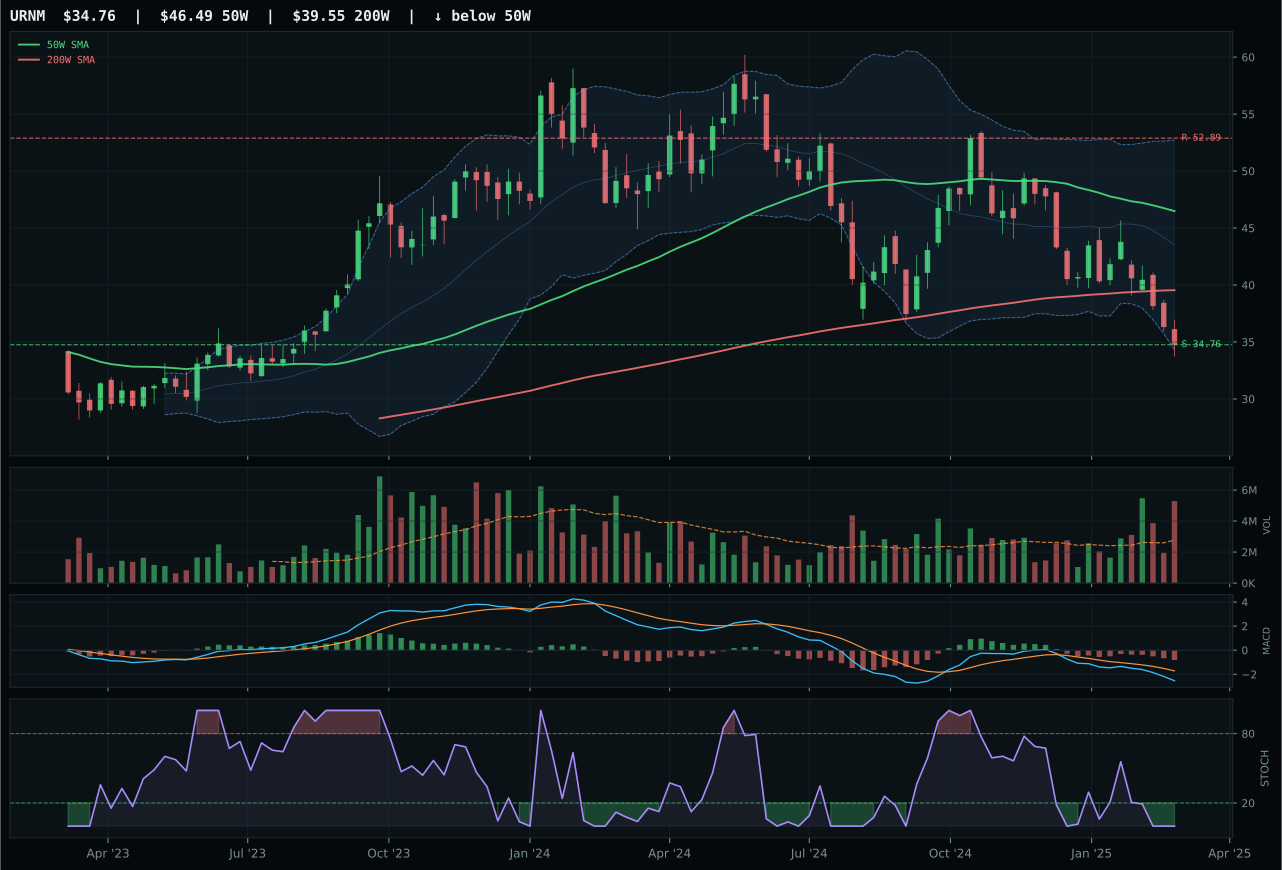
URNM has a pullback into support profile with -26.2% 13-week relative strength versus SPY.
A failed hold above support would weaken the setup.
Actionable but governed by invalidation levels.
NLR wins the category with a 17.3-point margin over URA by capturing the only category-relative strength at +6.5% while maintaining neutral structure and a defensible timing setup despite heavy 13-week underperformance at -16.8%. Price sits -5.1% below the 50W in the deep retracement zone at Fibonacci 0.618, providing defined support at 69.77 versus resistance at 96.64, which creates a -17.9% upside asymmetry that indicates this is a deep-value setup, not a momentum play. URA's -21.9% relative strength versus SPY and -23.3% 13-week return signal capitulation, yet URA also shows distribution pressure in volume and oversold stochastic, a combination that implies forced selling rather than bottom-building. NLR's neutral volume at 1.07x the 20-week average paired with bearish-weakening MACD but oversold stochastic RSI creates a murkier signal, yet the +6.5% category-relative strength tells you institutional money is rotating into NLR over URA. The momentum confirmation of 0.0 on both names reflects the difficult 4-week and 13-week charts, but NLR's structure of 64.3 beats URA's 60.7, and that cleanliness gap is the technical tiebreaker.
Nuclear Energy receives 5% allocation as a tier-2 category with a final score of 14.5, the lowest of the eight funded categories but still above the zero-allocation threshold. Macro fit at 38.0 reflects no strong descriptor tailwind or headwind: neither liquidity stress nor credit stress is as severe for nuclear as for energy or cyclical sectors, and disinflation provides no meaningful boost or drag to a stable-return utility-like exposure. NLR's technical evidence at 28.5 is weak due to negative momentum and poor volume confirmation, placing the category firmly in the bottom tier by score. The allocation reflects a portfolio rule: in a credit-stress regime, nuclear utilities offer regulatory protection and stable cash flows, but the 5% slot is defensive rotation, not a conviction call. To earn tier-2 or higher status, Nuclear needs either the macro environment to stabilize such that value-driven deep-retracement setups attract accumulation, or the 13-week relative strength trends to stop deteriorating. For now, it holds a 5% hedge position.
Agriculture & Livestock — VEGI
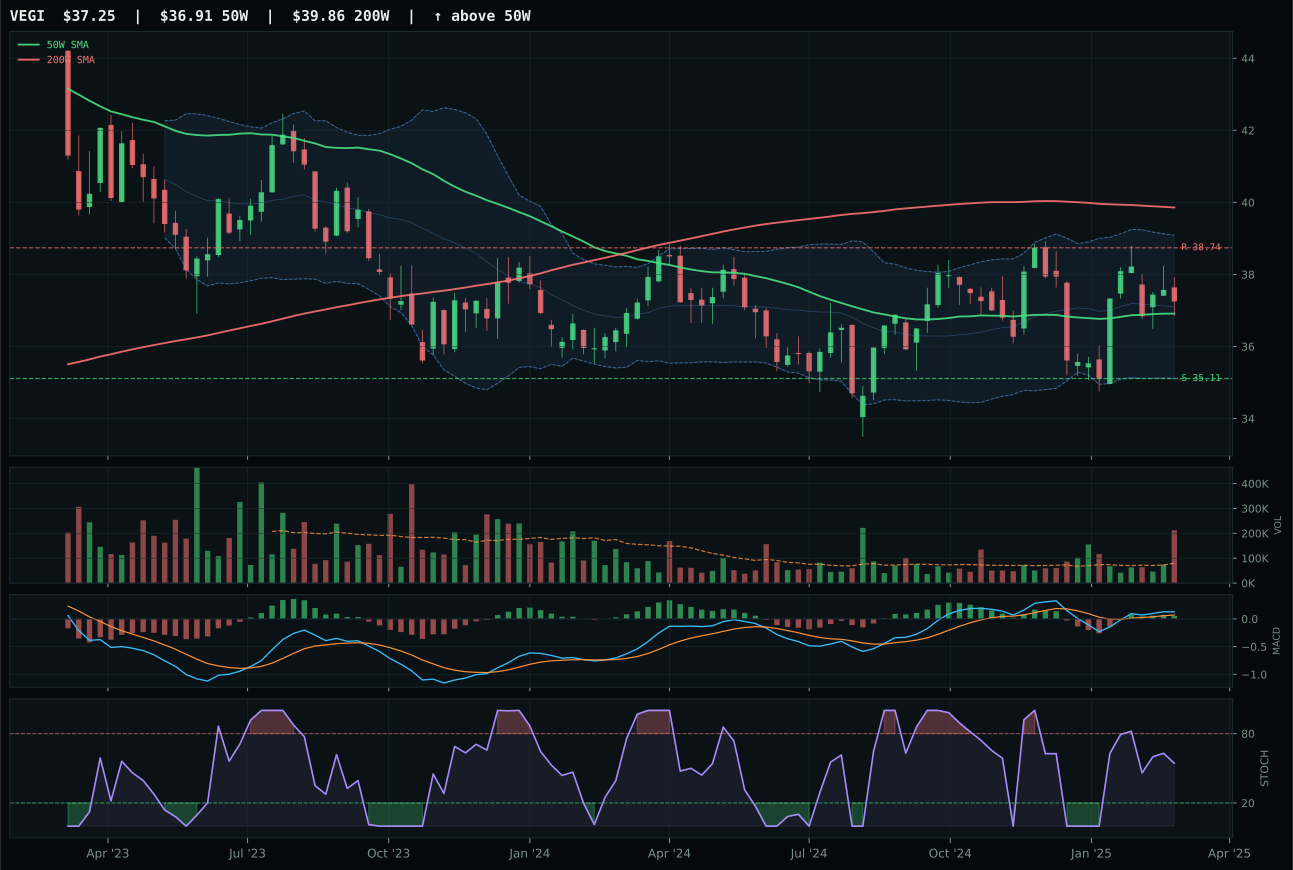
VEGI has a compression near 50W profile with -2.5% 13-week relative strength versus SPY.
A failed hold above support would weaken the setup.
Tracked, but not top-2 eligible because: .
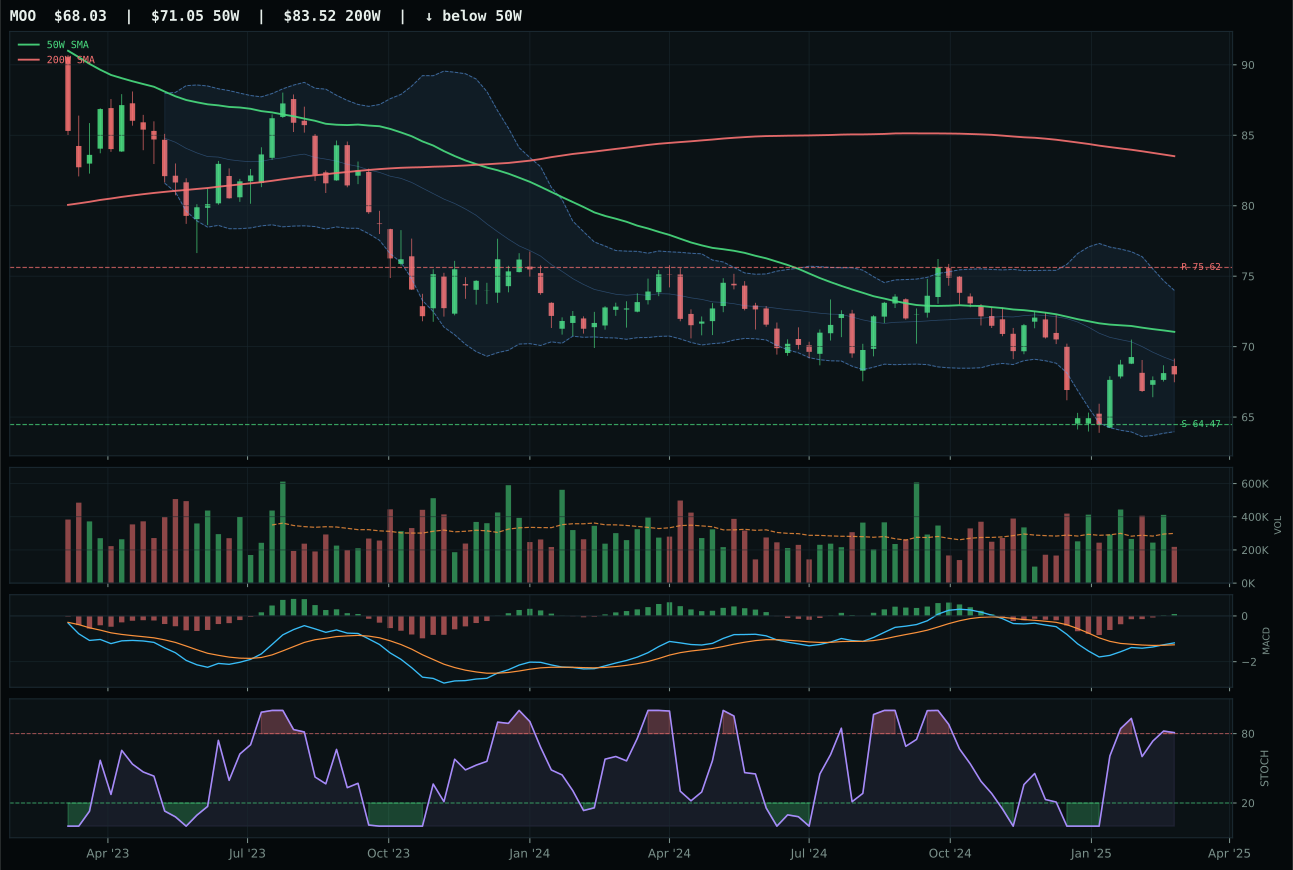
MOO has a neutral structure profile with -4.2% 13-week relative strength versus SPY.
Extension and support failure are the main tactical risks.
Tracked, but not top-2 eligible because: structurally broken.
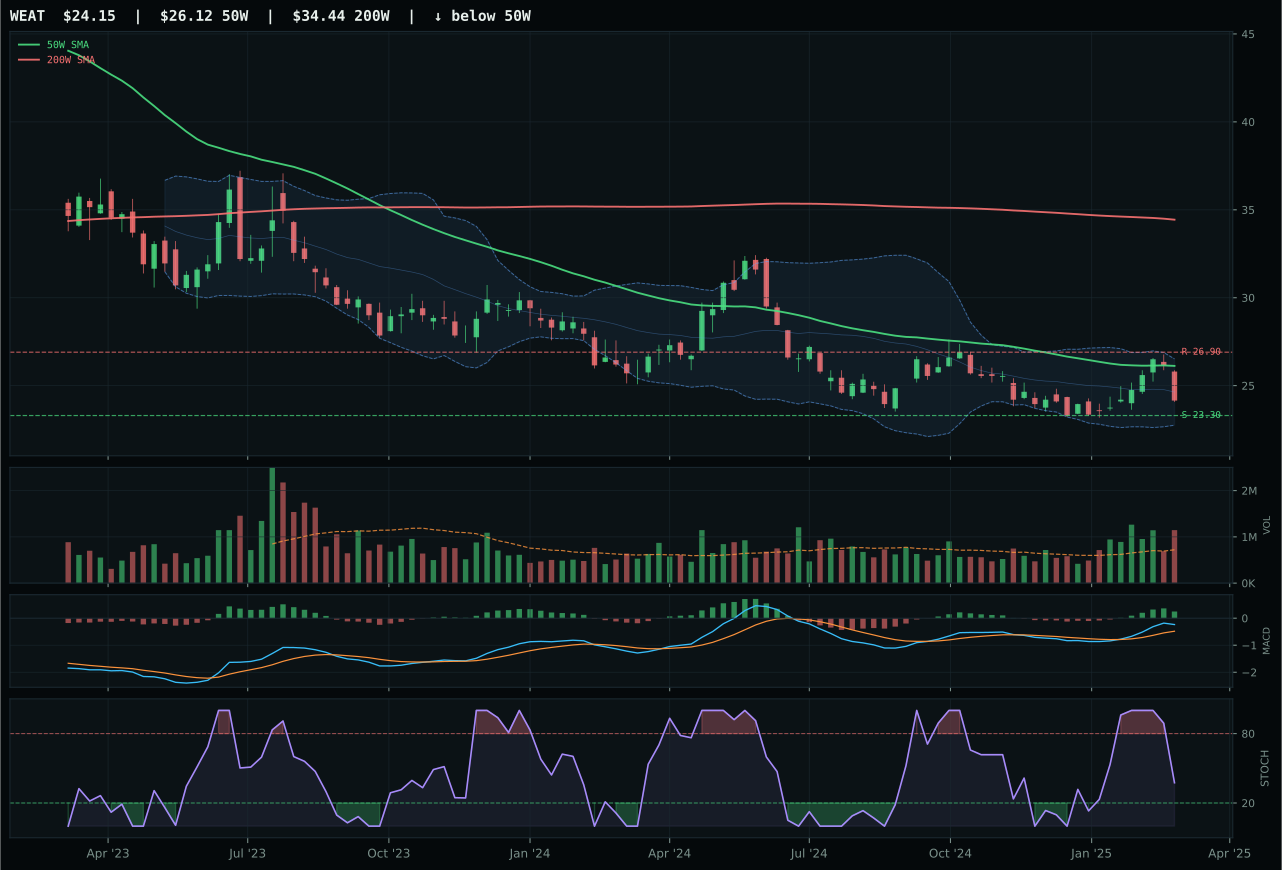
WEAT has a pullback into support profile with 2.2% 13-week relative strength versus SPY.
Extension and support failure are the main tactical risks.
Tracked, but not top-2 eligible because: structurally broken.
VEGI wins the three-name basket decisively with a 27.2-point margin over MOO, a gap that reflects hard filters rejecting MOO's structurally broken setup despite MOO's superior 4-week and 13-week MACD signatures. VEGI's timing score is perfect at 100.0 because price sits just 0.9% from the 50W with MACD bullish-but-flattening and stochastic RSI in the favorable rising mid-zone at 0.54, creating a textbook coil setup where compression at 84.4 signals imminent expansion. MOO's stochastic RSI is overbought momentum, a late-stage signal, and the structure is frankly broken—a neutral setup that offers no defined entry or support level. Volume tells the tale: VEGI shows distribution pressure at 2.64x the 20-week average, which sounds negative but in a compression context means conviction sellers are present alongside accumulators, whereas MOO's thin participation at 1.0x suggests no real commitment. The -3.8% downside to support on VEGI versus -5.6% on MOO over 13 weeks is narrow, but VEGI's compression setup with defined invalidation creates an asymmetric risk-reward that MOO's stretched structure cannot offer.
Agriculture & Livestock receives 5% allocation this week with a final category score of 0.0 and an ineligible status marker. This is the harshest macro regime for the category: disinflation hurts agricultural exposure by -6 points, and the active disinflation pressure descriptor inflicts an additional -8 point penalty. The only technical offset is VEGI's perfect 100.0 timing score, but timing alone cannot override a -14 point macro headwind in a macro-weighted scoring system. WEAT, MOO, and VEGI form a 3/2/1 basket that starts at 36.3, then the category reasoner tests persistence, volume sponsorship, and macro fit; the result is 0.0 after hard filters apply. The category needs either disinflation pressure to reverse—a significant regime shift—or for one of the three names to show institutional accumulation strong enough to override macro. For now, agriculture is not part of the capital allocation.
Traditional Energy — XLE
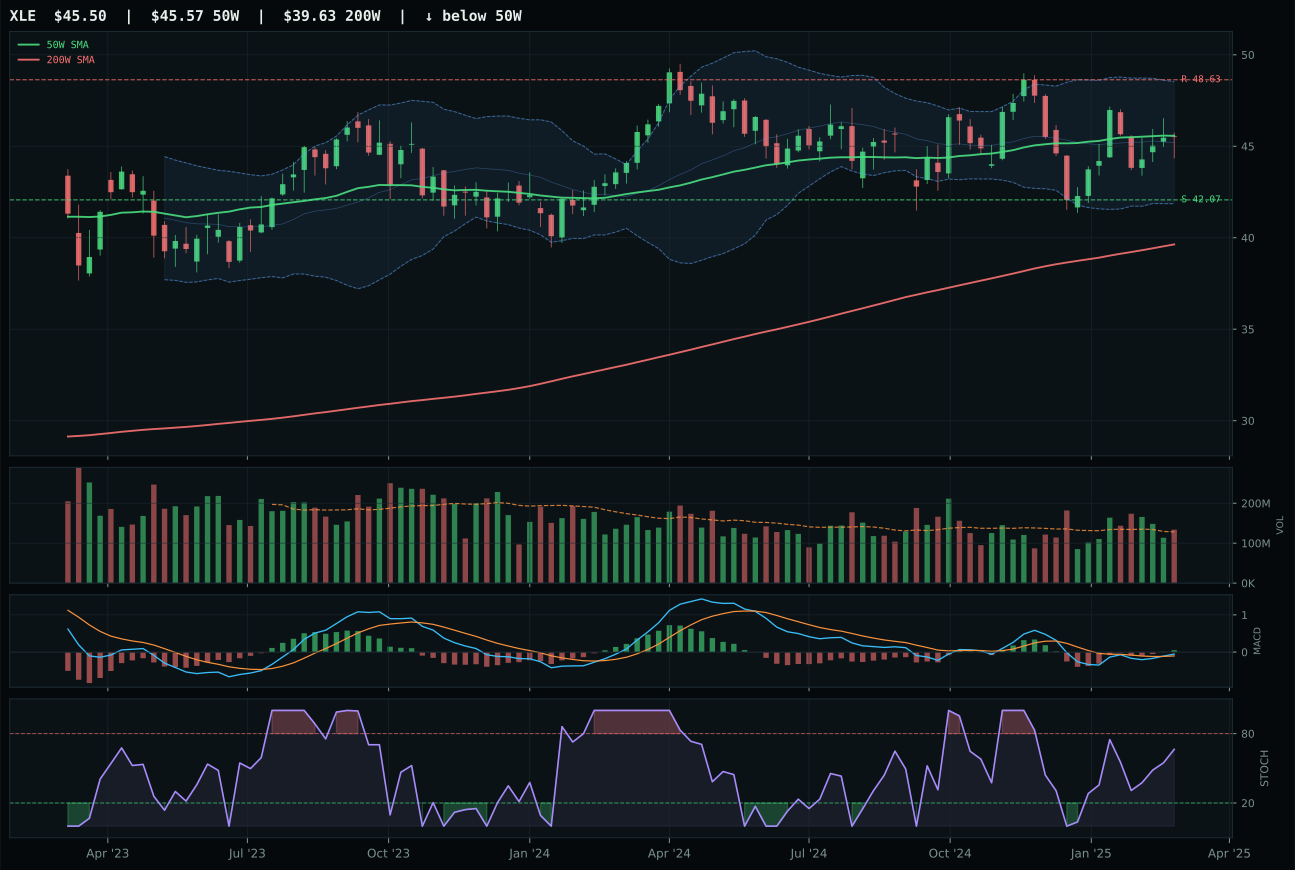
XLE has a compression near 50W profile with -3.4% 13-week relative strength versus SPY.
A failed hold above support would weaken the setup.
Actionable but governed by invalidation levels.
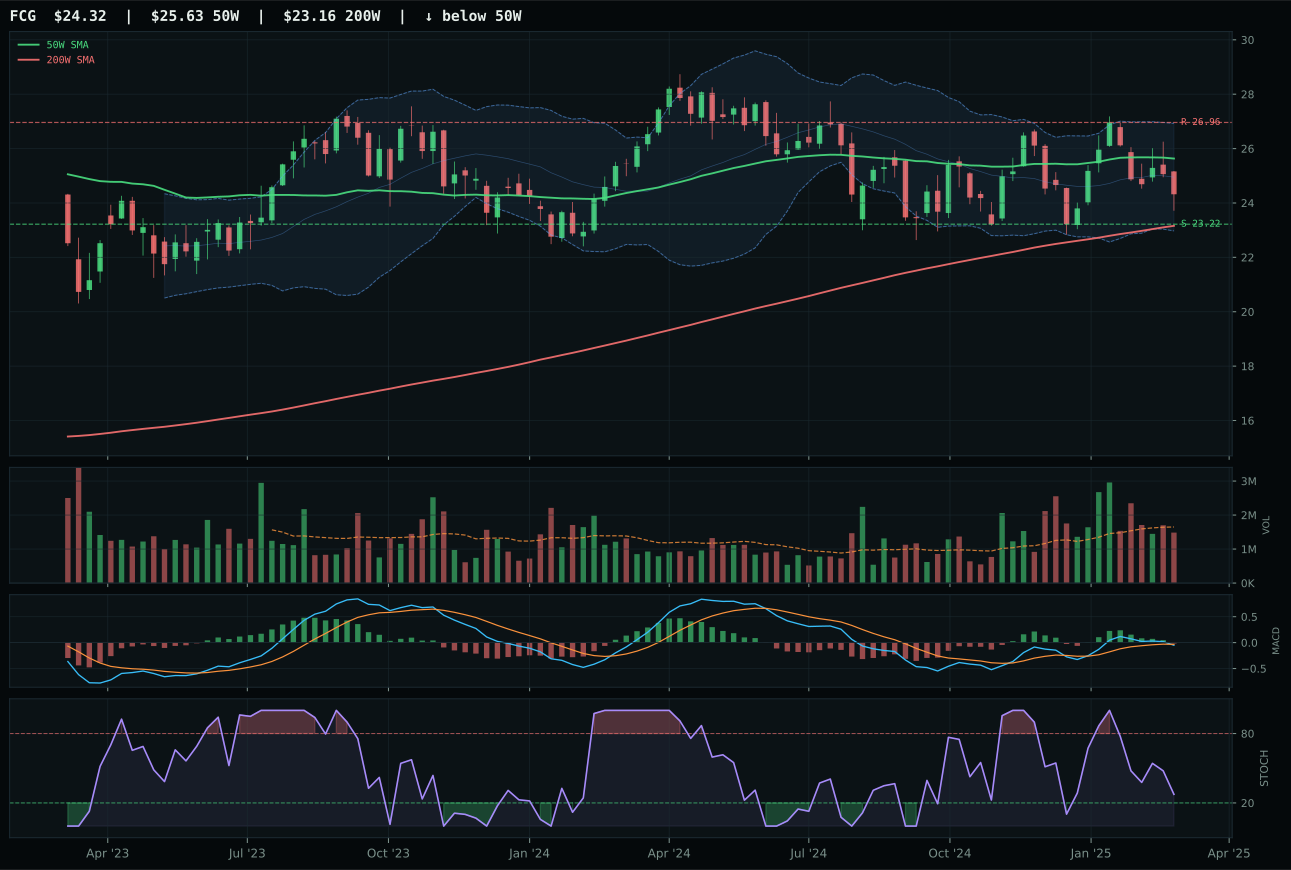
FCG has a pullback into support profile with -5.5% 13-week relative strength versus SPY.
A failed hold above support would weaken the setup.
Actionable but governed by invalidation levels.
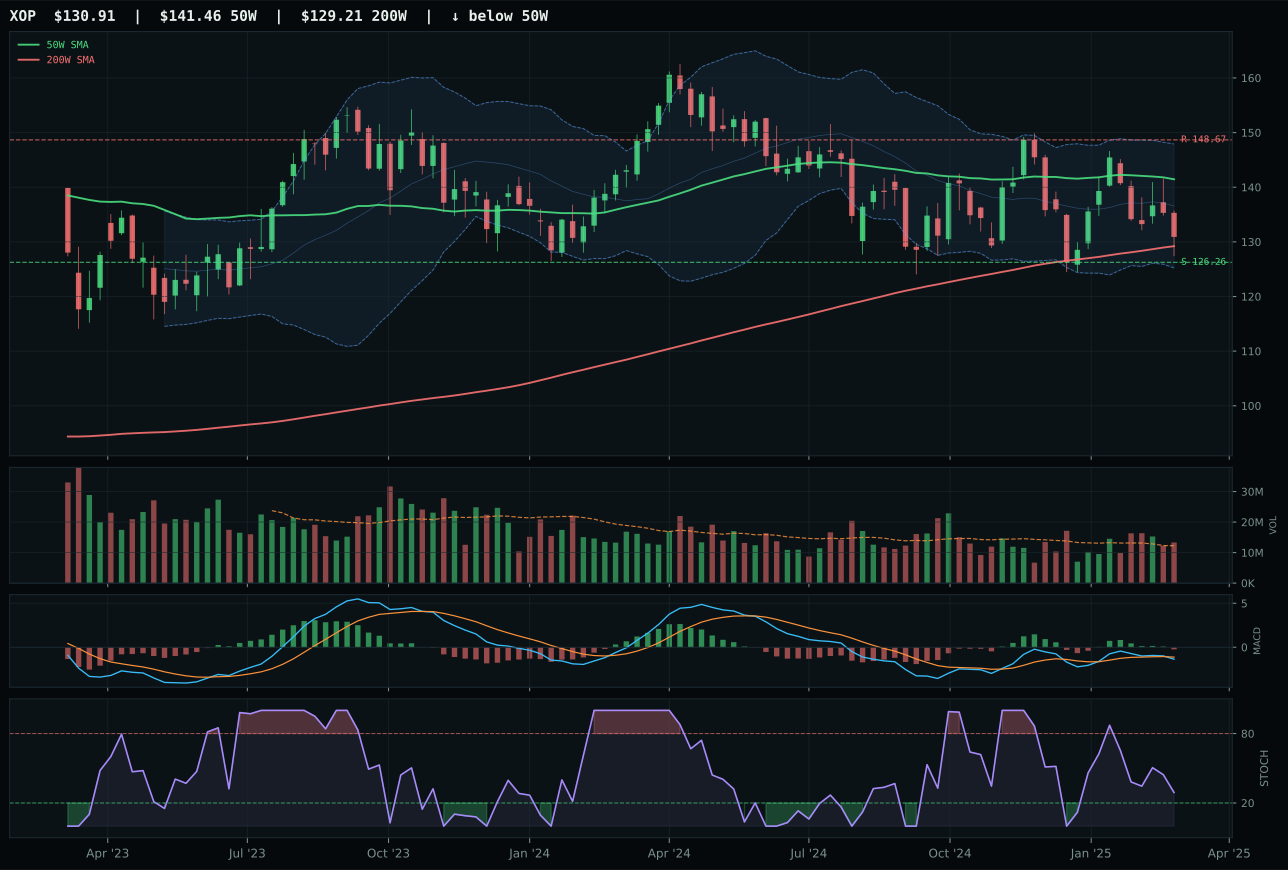
XOP has a pullback into support profile with -8.6% 13-week relative strength versus SPY.
A failed hold above support would weaken the setup.
Actionable but governed by invalidation levels.
XLE wins decisively over FCG with a perfect 100.0 timing score by sitting just -0.1% from the 50W in a compression setup that retains neutral volume, whereas FCG is pulled deep into support at -16.8% from the 50W with bearish-weakening MACD and falling stochastic RSI. XLE's setup is pullback into support that still respects the 50W, creating a coil rather than a collapse; above-average participation at 1.04x and bullish-improving MACD suggest accumulation, not panic. The structure score of 76.4 reflects compression at 79.2 and cleanliness at 66.7, giving buyers a defined entry zone. FCG's structure at 70.4 looks respectable until you examine the components: the setup is pullback into support far below the 50W, making this a capitulation trade for value hunters, not a technical entry. Momentum confirmation is 62.1 for XLE versus 17 for FCG—the differential reflects positive 4-week return of 3.8% on XLE versus deteriorating performance on FCG. Risk-reward favors FCG at 90.0 versus XLE's 59.2, but FCG's reward is only worth capturing if you correctly time the bottom; XLE's setup allows entry with defined risk at the 50W.
Traditional Energy receives 5% allocation despite a final category score of 0.0 and ineligible status, which appears contradictory until the overlay structure is examined. The 50% crypto overlay halves all allocation tiers from 20%/10%/0% to 10%/5%/0%, and the Energy category scores to 0.0 because disinflation actively hurts the exposure at -10 points, with disinflation pressure adding another -10 and credit stress deducting -7, creating a macro fit of only 16.0. XLE's strong technical evidence at 79.9 cannot overcome the -27 point macro headwind. The 3/2/1 basket (XLE 64.2, FCG 32.3, XOP 8.8) starts at 44.4 but scores to 0.0 after macro drag and persistence tests. However, because the total allocation framework requires eight funded categories (due to the 50% overlay), Energy receives the 5% tier-2 slot by necessity. This is a placeholder allocation awaiting either a regime shift toward inflation concerns or a catalyst that restores oil demand; the technical entry via XLE is sound, but the macro environment is actively hostile.
Emerging Markets — INDA
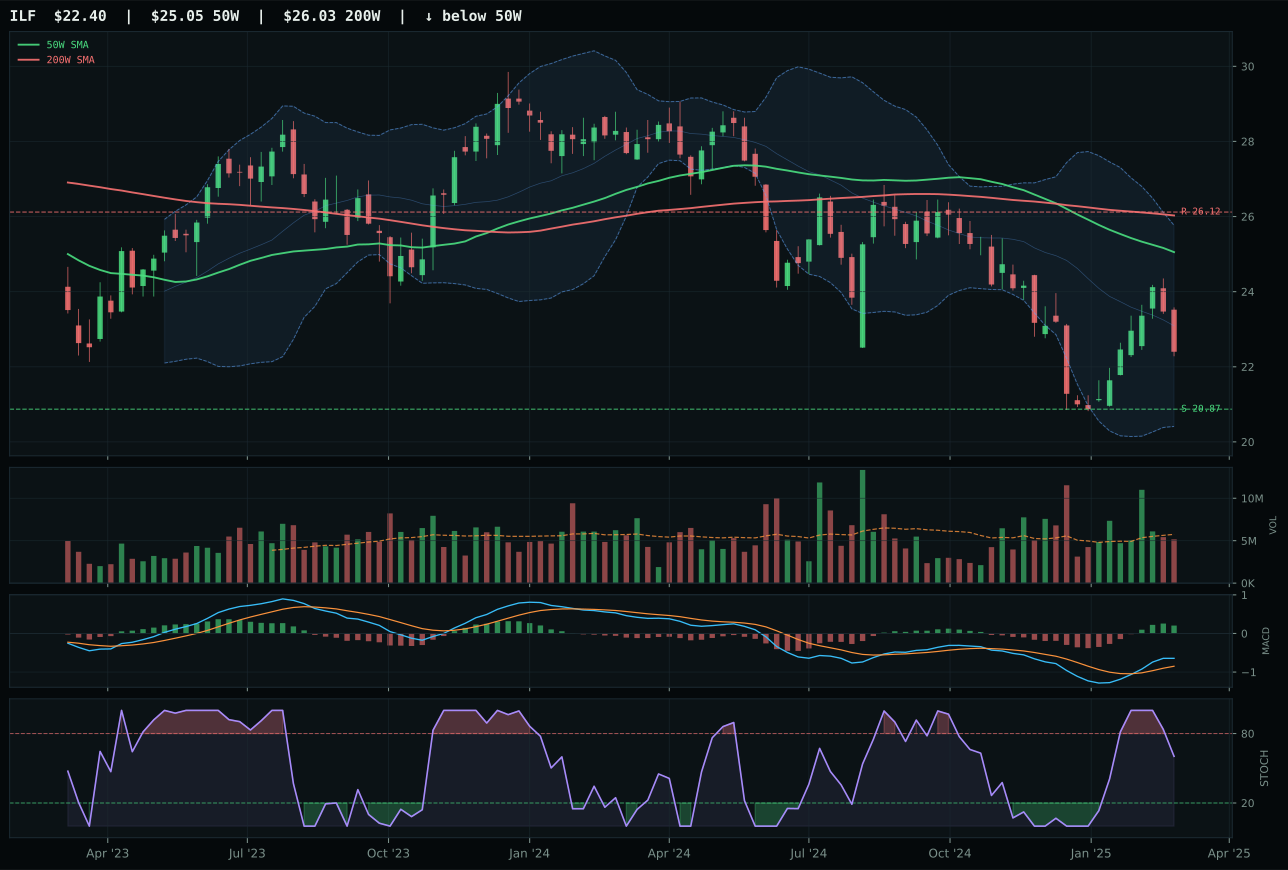
ILF has a neutral structure profile with -1.9% 13-week relative strength versus SPY.
Extension and support failure are the main tactical risks.
Tracked, but not top-2 eligible because: structurally broken.
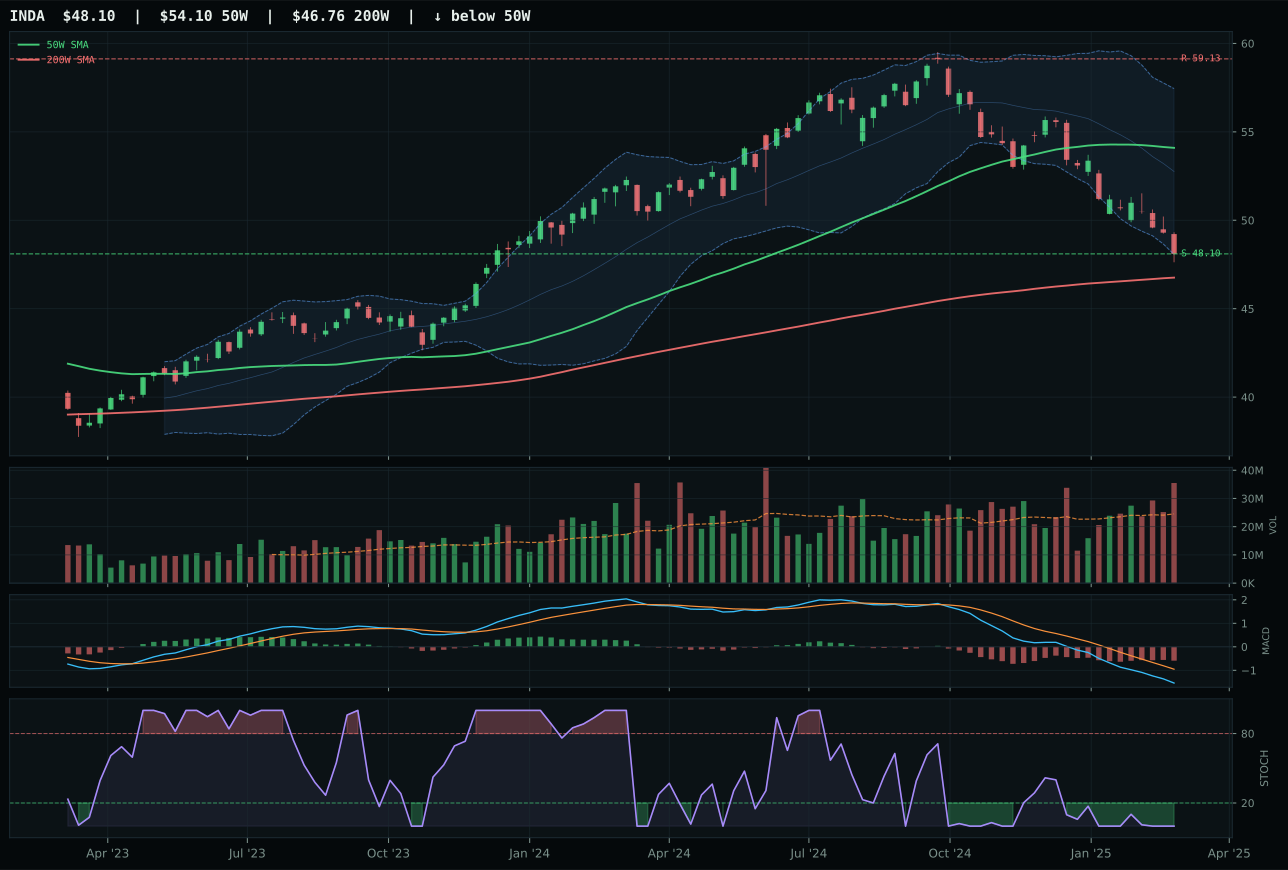
INDA has a pullback into support profile with -10.8% 13-week relative strength versus SPY.
A failed hold above support would weaken the setup.
Actionable but governed by invalidation levels.
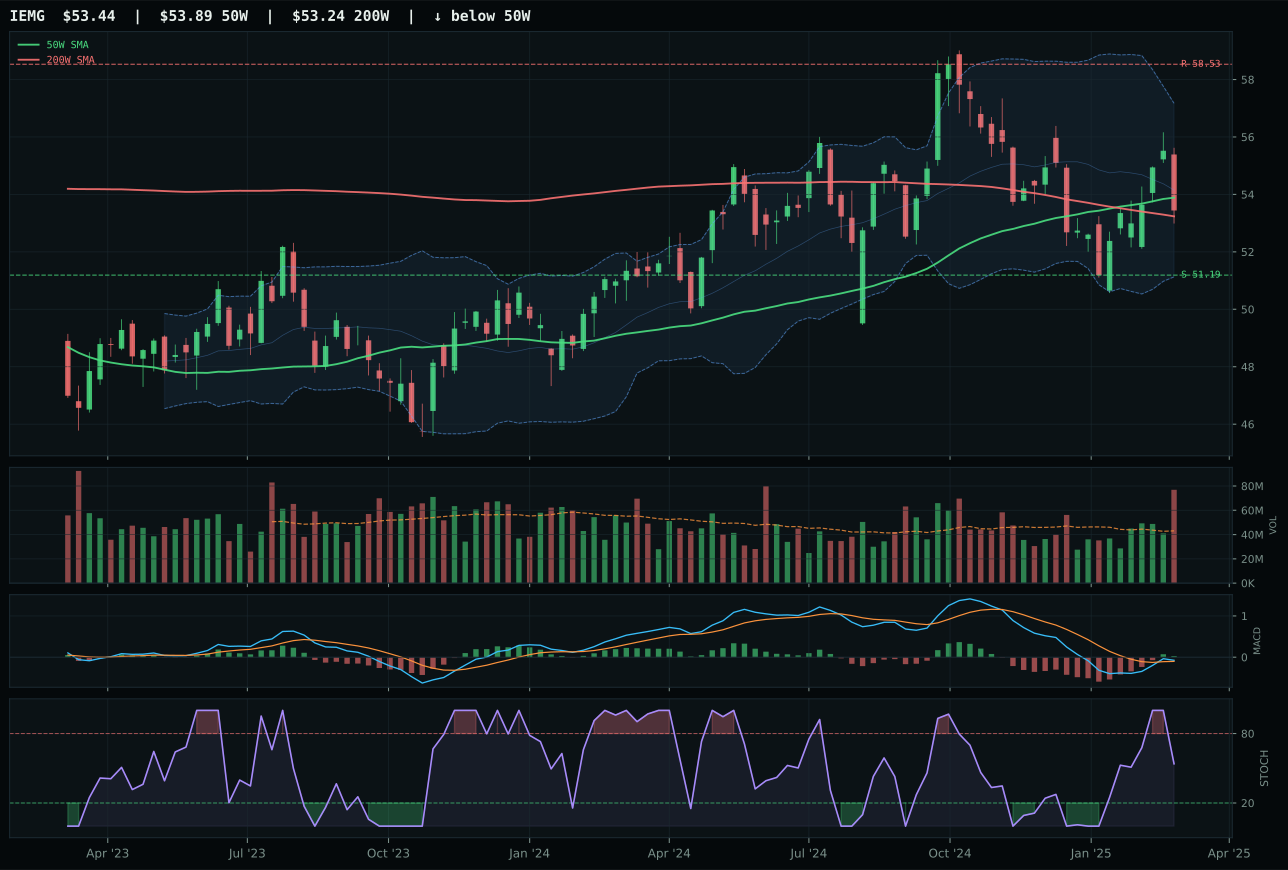
IEMG has a pullback into support profile with -0.2% 13-week relative strength versus SPY.
A failed hold above support would weaken the setup.
Actionable but governed by invalidation levels.
INDA wins the three-name basket by 18.7 points over ILF despite carrying the worst relative strength at -10.8% versus SPY, because the timing setup of 65.0 is superior to ILF's 55.0 and the structure is cleaner at 66.0 versus 43.4. INDA sits -11.1% below the 50W in a pullback into support setup at 48.10, where the Fibonacci 0.786 zone near 52W low provides a defined invalidation area and risk-reward of 87.0 signals that downside to support is nearly exhausted at 0.0% while upside to resistance extends -18.7%. ILF's neutral structure and bullish-improving MACD sound more constructive, but the hard filter for structurally broken setups removes ILF from consideration, leaving INDA as the only eligible winner despite the devastating -12.2% 13-week return. Volume confirmation is above-average participation at 1.45x for INDA versus thin participation for ILF, which suggests institutional money has given up on ILF and is accumulating INDA at support. The category-relative strength spread is -8.9% for INDA, indicating underperformance within EM, but INDA's timing setup offers defined risk that ILF's broken structure does not.
Emerging Markets receives 0% allocation with a final category score of 11.8, ranking among the lowest categories due to severe macro headwinds and poor technical sponsorship. Credit stress and liquidity stress both active at -10 points each create a -20 point macro deficit that overwhelms any disinflation benefit; the category-level macro fit sits at 30.0, a level that triggers ineligibility in the current regime. IEMG, the 3/2/1 basket's first-ranked name at 41.1, shows bullish-improving MACD and falling stochastic RSI suggesting a potential bounce, but momentum confirmation is only 52 out of 100, and the -1.6% 13-week return reflects minimal sponsor conviction. The basket starts at 37.2 and scores to only 11.8 after persistence and macro drag, failing to earn any allocation slot. Emerging markets require either a meaningful reversal in credit stress—suggesting global financial conditions are stabilizing—or evidence that China is stimulating its economy; neither catalyst is visible. The category will return when macro conditions ease.
Industrial Metals — COPX
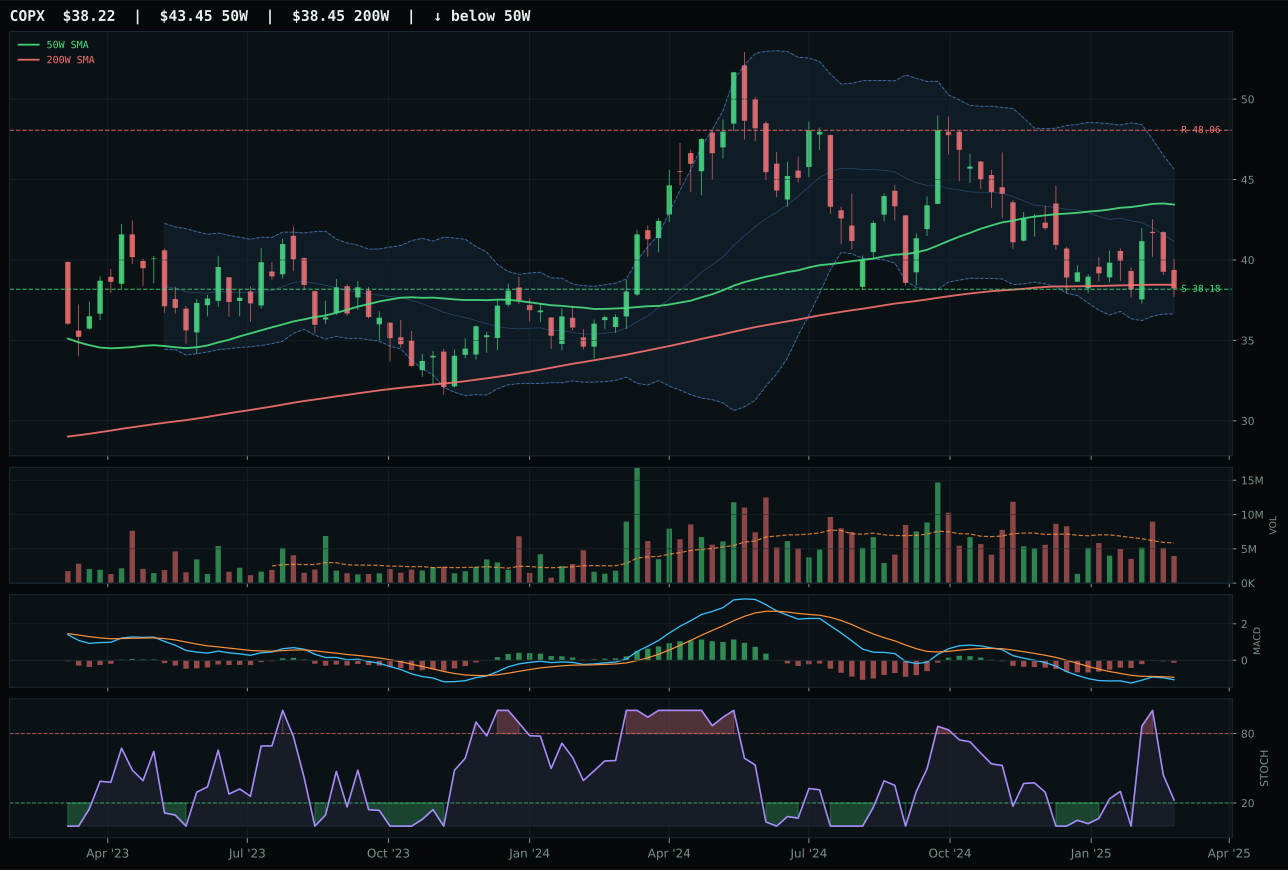
COPX has a pullback into support profile with -9.0% 13-week relative strength versus SPY.
A failed hold above support would weaken the setup.
Actionable but governed by invalidation levels.
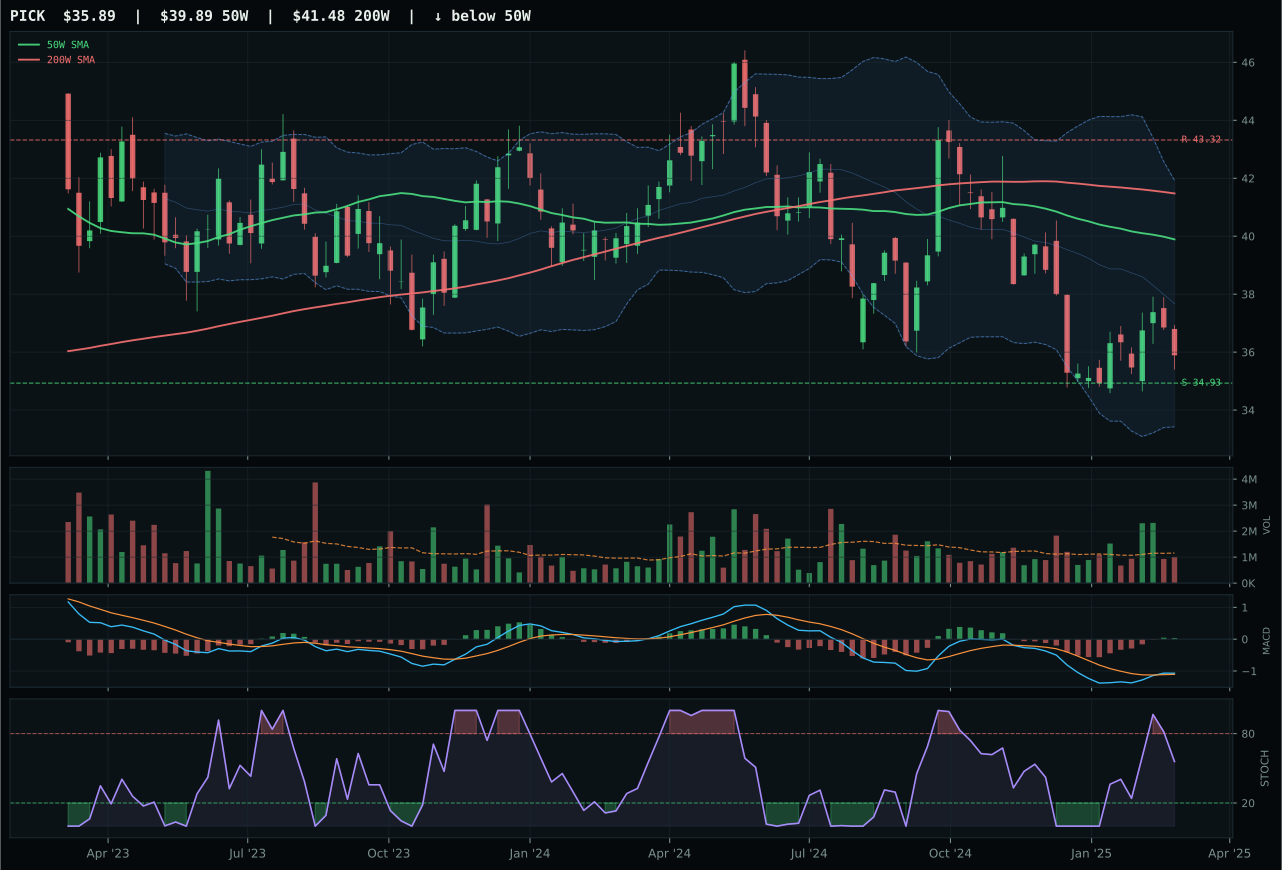
PICK has a pullback into support profile with -8.2% 13-week relative strength versus SPY.
Extension and support failure are the main tactical risks.
Tracked, but not top-2 eligible because: structurally broken.
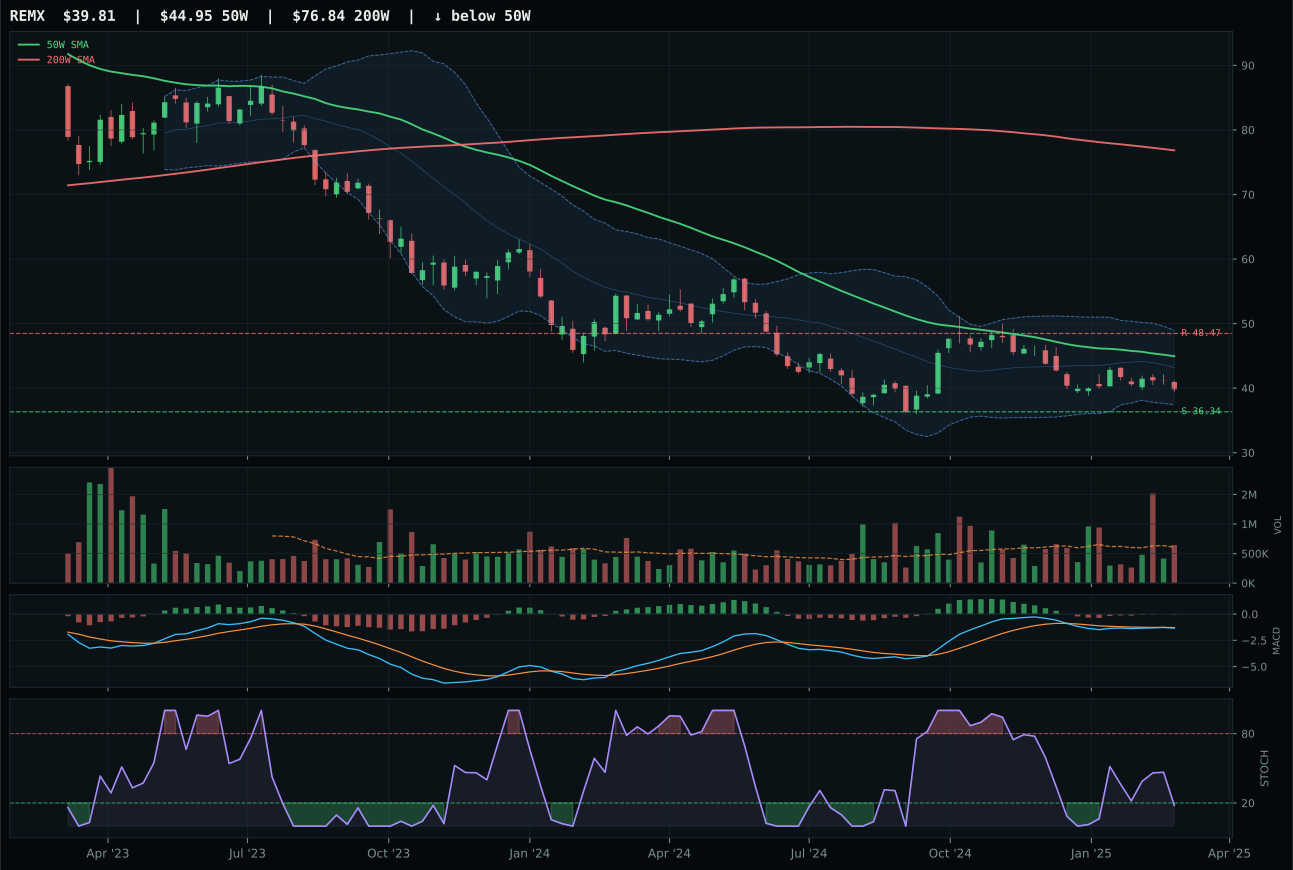
REMX has a neutral structure profile with -12.0% 13-week relative strength versus SPY.
Extension and support failure are the main tactical risks.
Tracked, but not top-2 eligible because: structurally broken.
COPX beats PICK by 25.1 points despite both showing terrible 13-week returns and both sitting in deep support zones, because COPX maintains cleaner structure at 67.7 versus PICK's 36.3 and captures the only category-relative strength at 0.0%. The difference is structure discipline: COPX's pullback into support at 38.18 provides a defined invalidation point, while PICK's structurally broken setup fails the hard filter and is removed from consideration. COPX's MACD bearish-but-improving and stochastic RSI falling-neutral at 0.23 creates a defensible mean-reversion case, whereas PICK's bullish-and-improving MACD paired with falling stochastic RSI is a messy signal. Volume is thin at 0.67x the 20-week average on COPX, which normally would be disqualifying, but in the context of a support setup with defined risk at 38.18 and massive downside risk-reward of 90.0 (only 0.1% to support, +20.5% to resistance), thin volume is acceptable—sellers are exhausted, not buyers are committed. This is not a buy signal; it's a defined invalidation area where patient traders can test support.
Industrial Metals receives 0% allocation with a final category score of 4.7 and eligible status, meaning the category failed on pure score rankings rather than hard filters. The macro headwinds are devastating: liquidity stress at -8 points and credit stress at -7 points create a -15 point macro deficit in a disinflation regime that offers no tailwind. COPX's best feature—a 90.0 risk-reward score—is a bearish signal: it means the technical setup is so damaged that the only appeal is catching a falling knife at support. The 3/2/1 basket (PICK 41.2, COPX 40.9, REMX 20.4) starts at 37.6 and scores to only 4.7 after macro and persistence are applied, signaling that institutional sponsorship is absent. Industrial metals need either credit stress to reverse sharply or demand signals from China to emerge; neither is visible. The category will return to the allocation when either technical structure improves or macro fit strengthens.