
2025-02-21
Informational purposes only. The content in this report, including allocations, analysis, and commentary, is provided solely for informational and educational purposes. It does not constitute financial advice, investment advice, trading advice, or any other type of advice. Past performance does not guarantee future results. Always conduct your own research and consult a qualified financial professional before making investment decisions.
Weekly Allocation
| Ticker | Category | Weight | Role |
|---|---|---|---|
| FBTC | 50% | Overlay | |
| GLD | Precious Metals | 10% | Top-2 (10%) |
| XLU | Utilities & Infrastructure | 10% | Top-2 (10%) |
| CIBR | Technology | 5% | Tier-2 (5%) |
| AIQ | AI | 5% | Tier-2 (5%) |
| ITA | Defense & Aerospace | 5% | Tier-2 (5%) |
| NLR | Nuclear Energy | 5% | Tier-2 (5%) |
| WEAT | Agriculture & Livestock | 5% | Tier-2 (5%) |
| IEMG | Emerging Markets | 5% | Tier-2 (5%) |
Trade Instructions — Monday Open
Sell the tranche from 2025-01-24 (completing its 4-week hold). Buy the new tranche. Instructions show net portfolio changes — same-asset positions cancel, weight changes show the delta.
| Action | Ticker | Instruction |
|---|---|---|
| SELL | ITA | Sell 20% of ITA position (reduce 6.25% → 5.00%) |
| SELL | BOTZ | Sell entire BOTZ position (1.25% of portfolio) |
| SELL | XLE | Sell 50% of XLE position (reduce 2.50% → 1.25%) |
| SELL | INDA | Sell 50% of INDA position (reduce 2.50% → 1.25%) |
| BUY | GLD | Buy GLD — 25.00% of freed cash (adds 1.25% to portfolio) |
| BUY | AIQ | Buy AIQ — 25.00% of freed cash (adds 1.25% to portfolio) |
| BUY | WEAT | Buy WEAT — 25.00% of freed cash (adds 1.25% to portfolio) |
| BUY | IEMG | Buy IEMG — 25.00% of freed cash (adds 1.25% to portfolio) |
Current Portfolio After Trade
Combined holdings across all 4 active tranches. Each tranche is 25% of the portfolio.
| Ticker | % of Portfolio | Weight Bar |
|---|---|---|
| FBTC | 50.00% | |
| GLD | 10.00% | |
| ITA | 5.00% | |
| XLU | 5.00% | |
| NLR | 5.00% | |
| CIBR | 5.00% | |
| PAVE | 5.00% | |
| AIQ | 5.00% | |
| COPX | 2.50% | |
| WEAT | 2.50% | |
| IEMG | 2.50% | |
| XLE | 1.25% | |
| INDA | 1.25% |
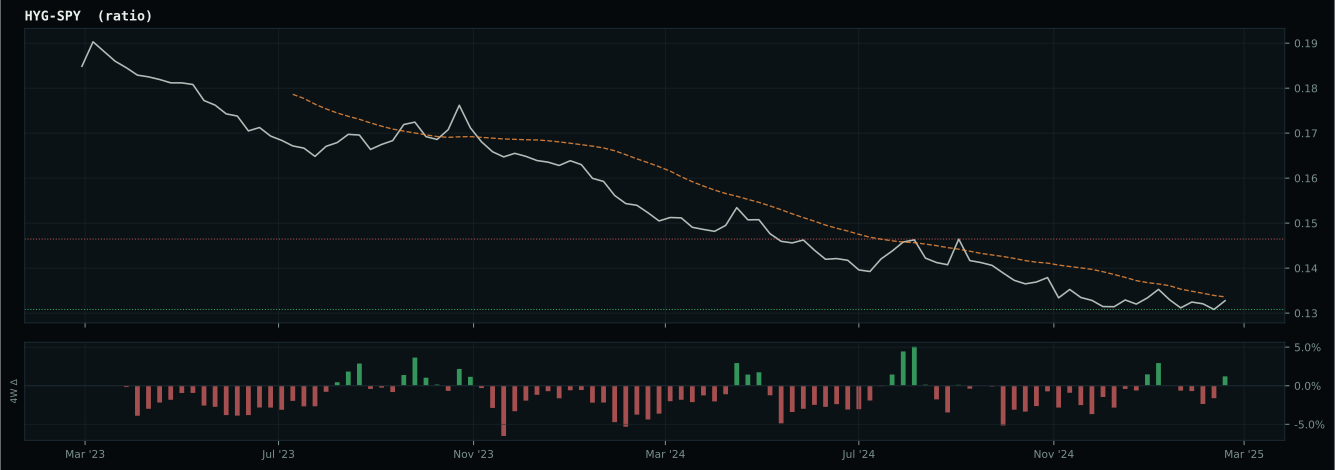
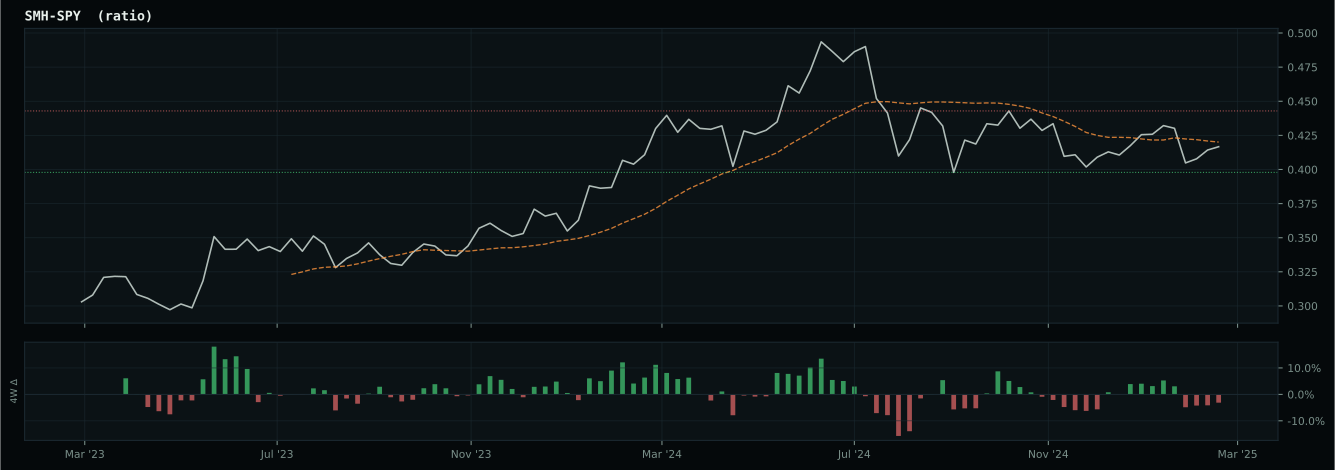
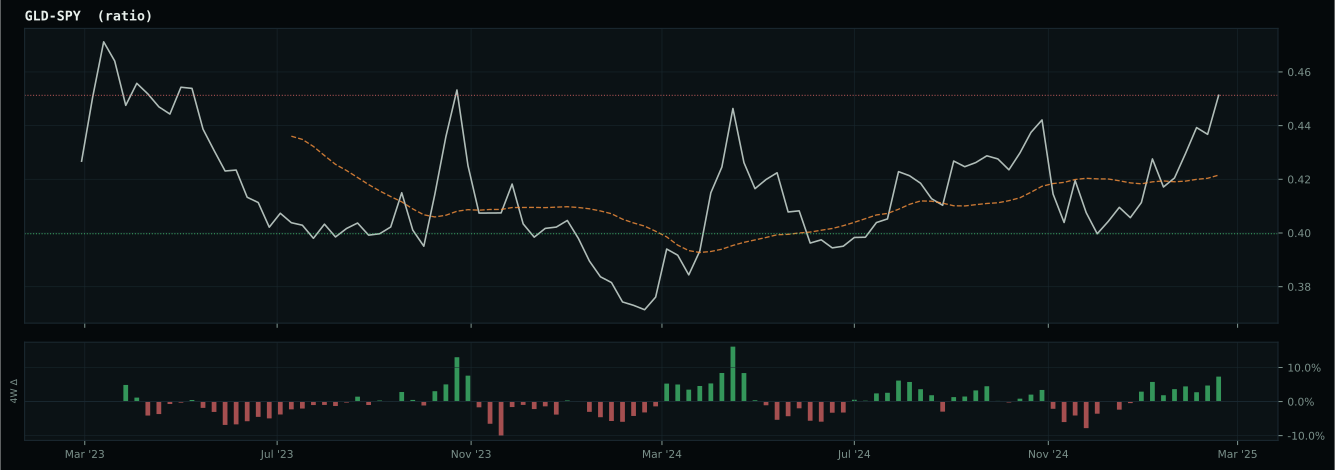
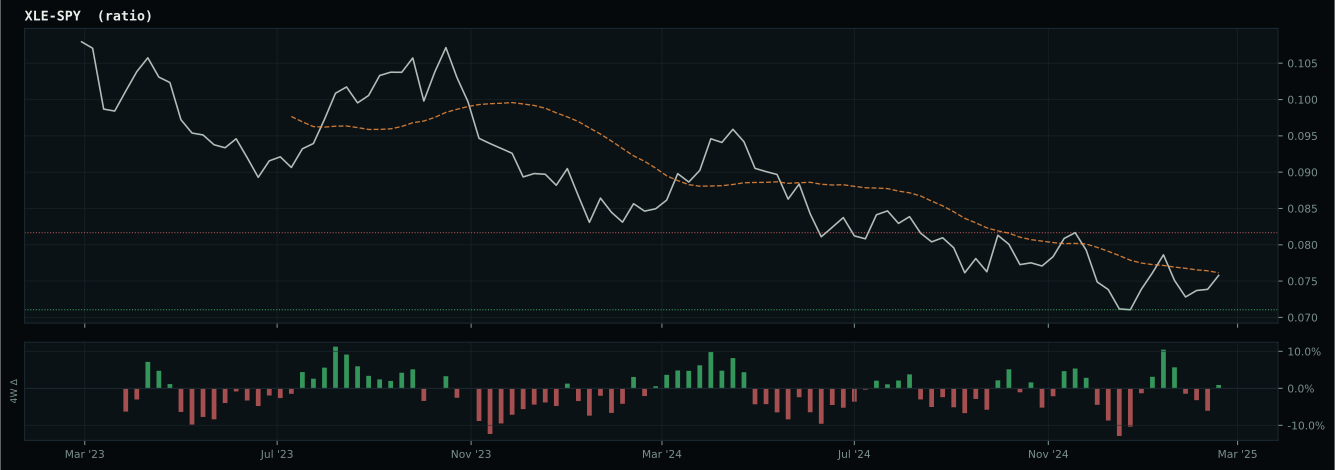
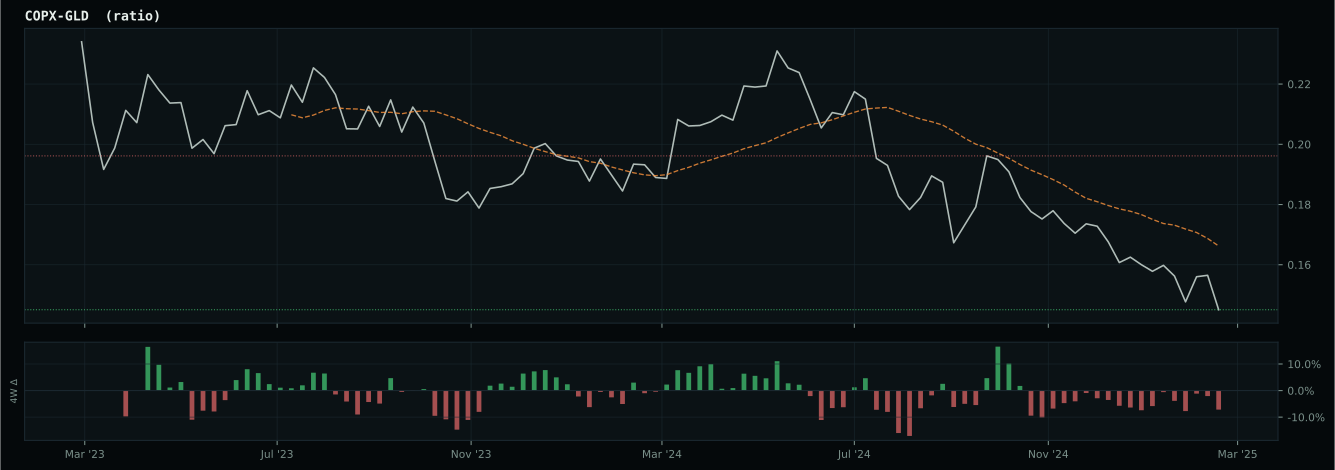
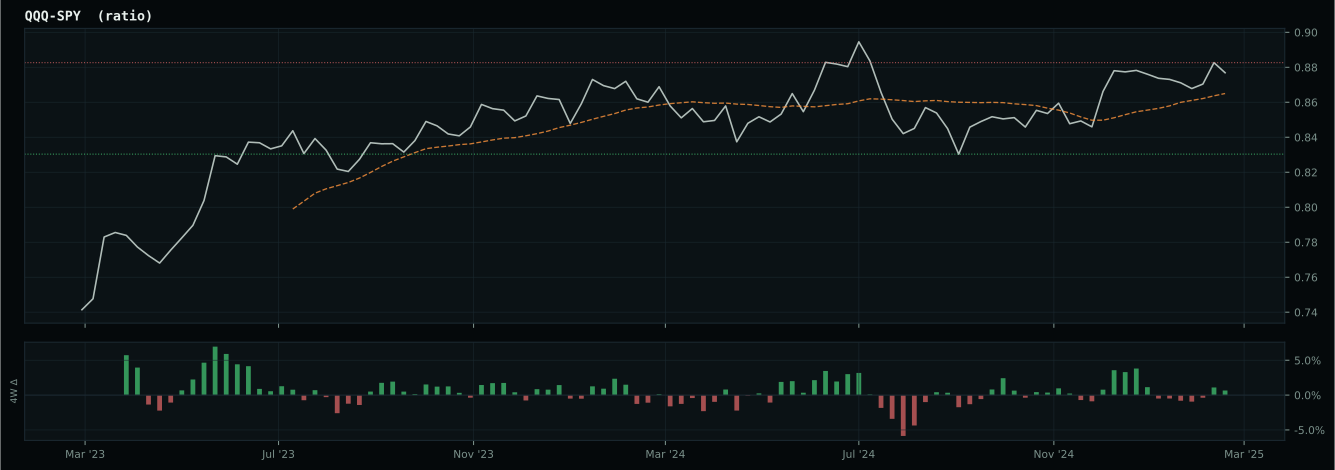
Macro Regime — Disinflation
Macro Evidence Charts
Market-implied signals behind the macro regime scores. Each ratio compares two assets; the direction and slope of the ratio is what the macro engine reads.
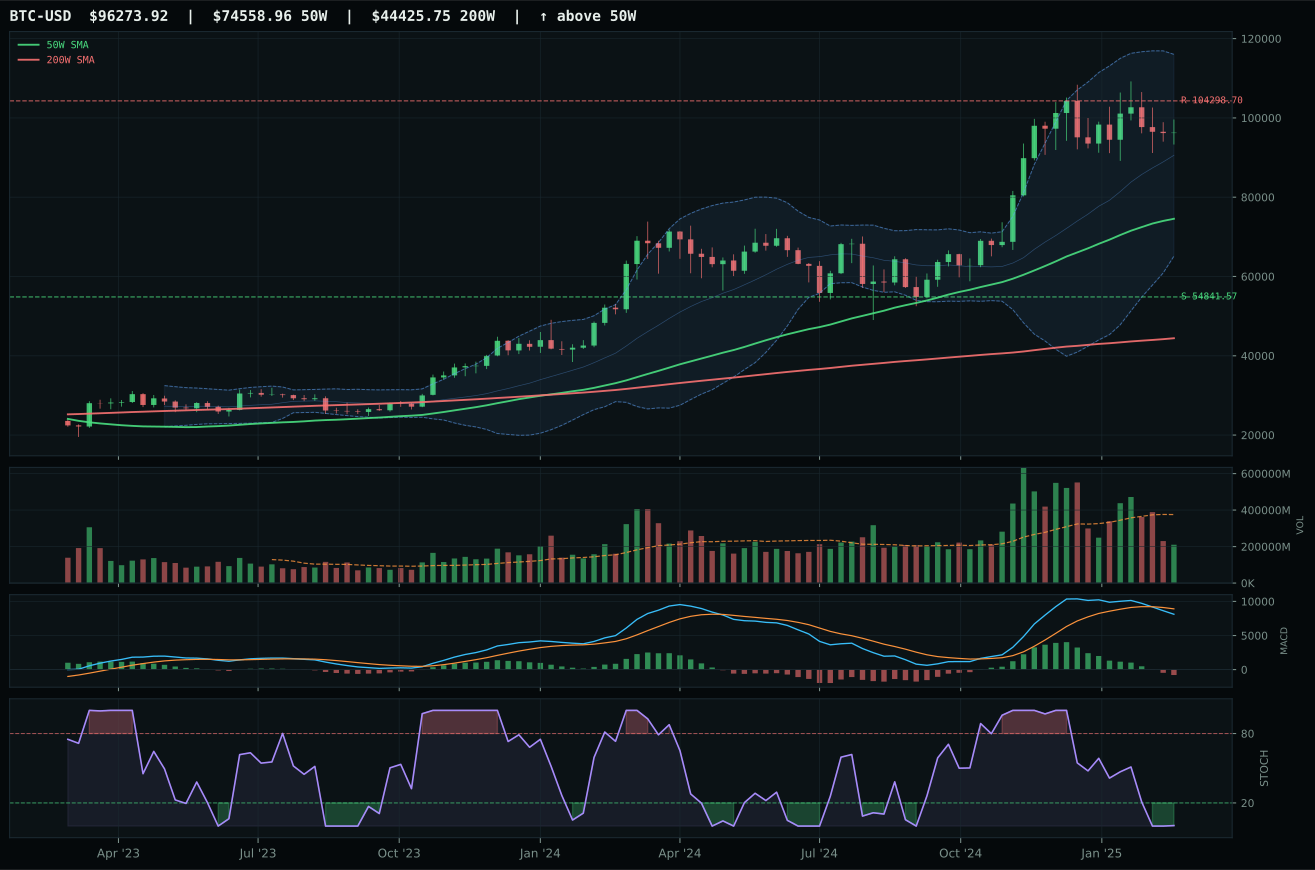
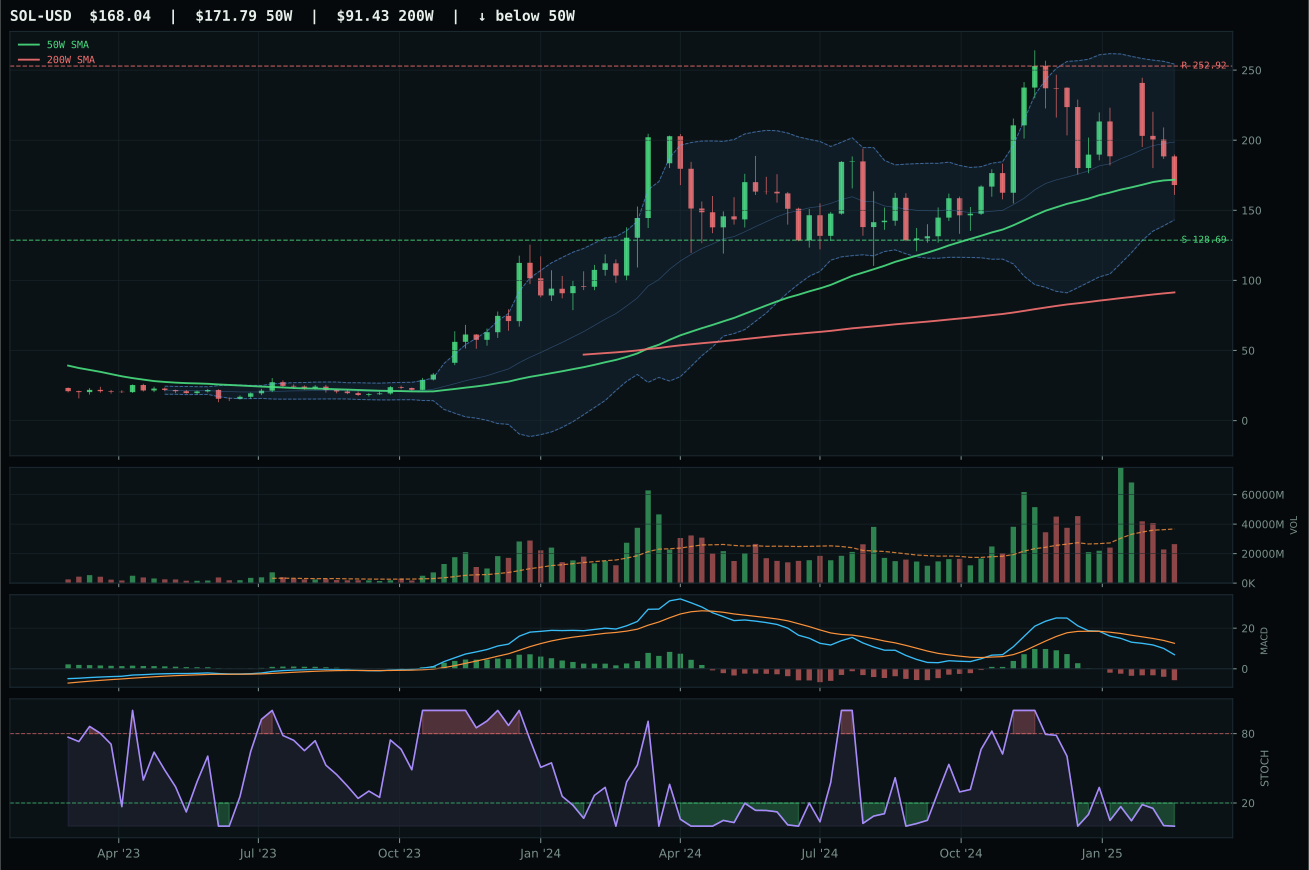
Crypto Regime — TrendBTC
ValueBTC not armed: BTC has not made the first post-breakdown touch of the 200W buy zone after losing the 50W
TrendBTC confirmed: 2 consecutive closes above rising/flat 50W SMA
one or more available conditions failed
Category Rankings
| Rank | Category | Winner | Score | Alloc | 4W Ret | Peers (4W) |
|---|---|---|---|---|---|---|
| 1 | Precious Metals | GLD | 72.0 | 20% | +2.75% | SLV +1.9% · GDX +8.2% |
| 2 | Utilities & Infrastructure | XLU | 51.4 | 20% | -2.48% | IGF +0.7% · PAVE -4.5% |
| 3 | Technology | CIBR | 43.5 | 10% | -3.12% | XLK -7.9% · IGV -6.2% |
| 4 | AI | AIQ | 34.8 | 10% | -6.73% | BOTZ -9.2% · SMH -8.8% |
| 5 | Defense & Aerospace | ITA | 33.6 | 10% | +3.70% | ROKT -3.7% · XAR +1.2% |
| 6 | Nuclear Energy | NLR | 19.0 | 10% | -4.23% | URA -2.1% · URNM -0.8% |
| 7 | Agriculture & Livestock | WEAT | 13.3 | 10% | -6.40% | VEGI -1.0% · MOO -0.5% |
| 8 | Emerging Markets | IEMG | 13.1 | 10% | +0.00% | INDA +5.8% · ILF +2.9% |
| 9 | Industrial Metals | COPX | 10.8 | 0% | +8.56% | PICK +2.4% · REMX +4.6% |
| 10 | Traditional Energy | XLE | 9.3 | 0% | +1.24% | FCG -1.3% · XOP -3.0% |
Precious Metals — GLD
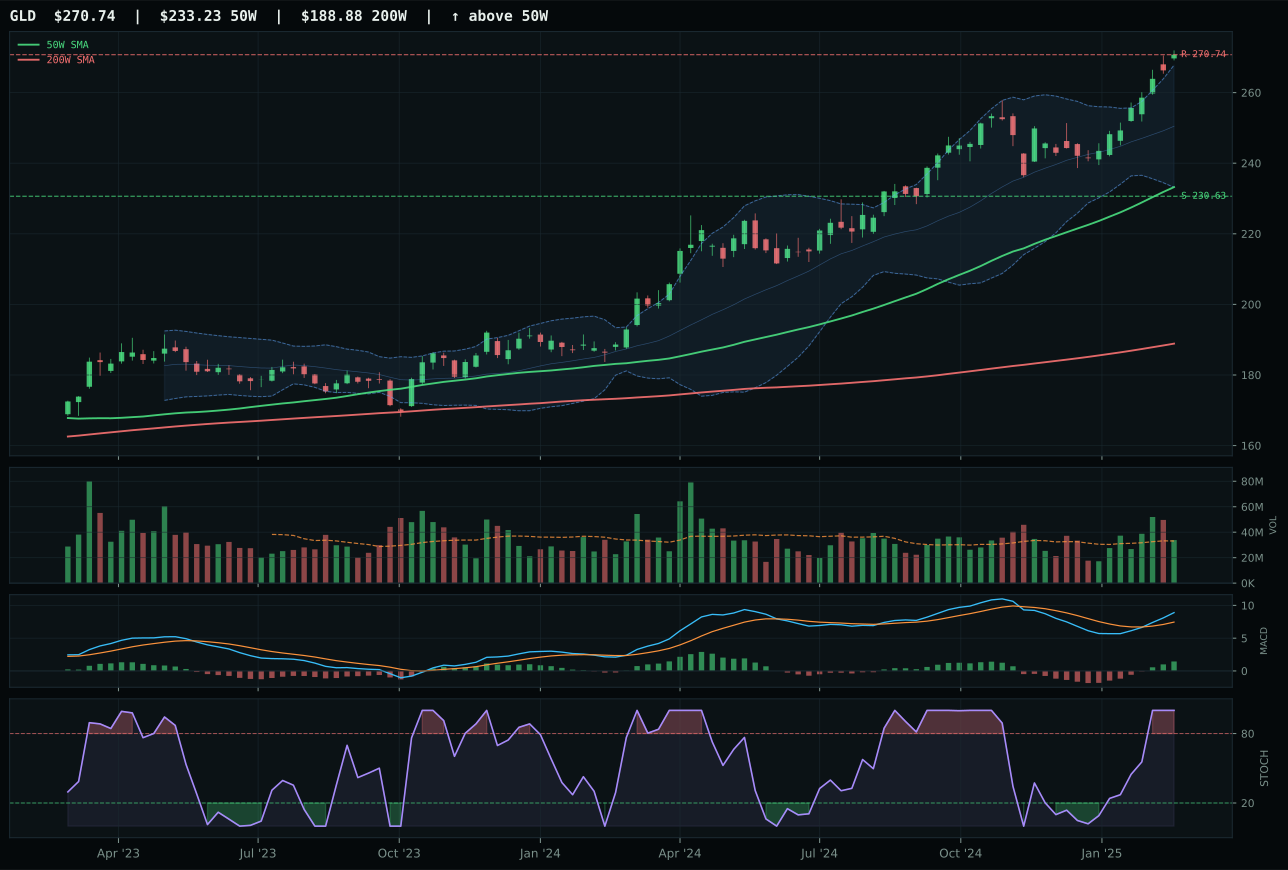
GLD has a vertical extension profile with 7.6% 13-week relative strength versus SPY.
A failed hold above support would weaken the setup.
Actionable but governed by invalidation levels.
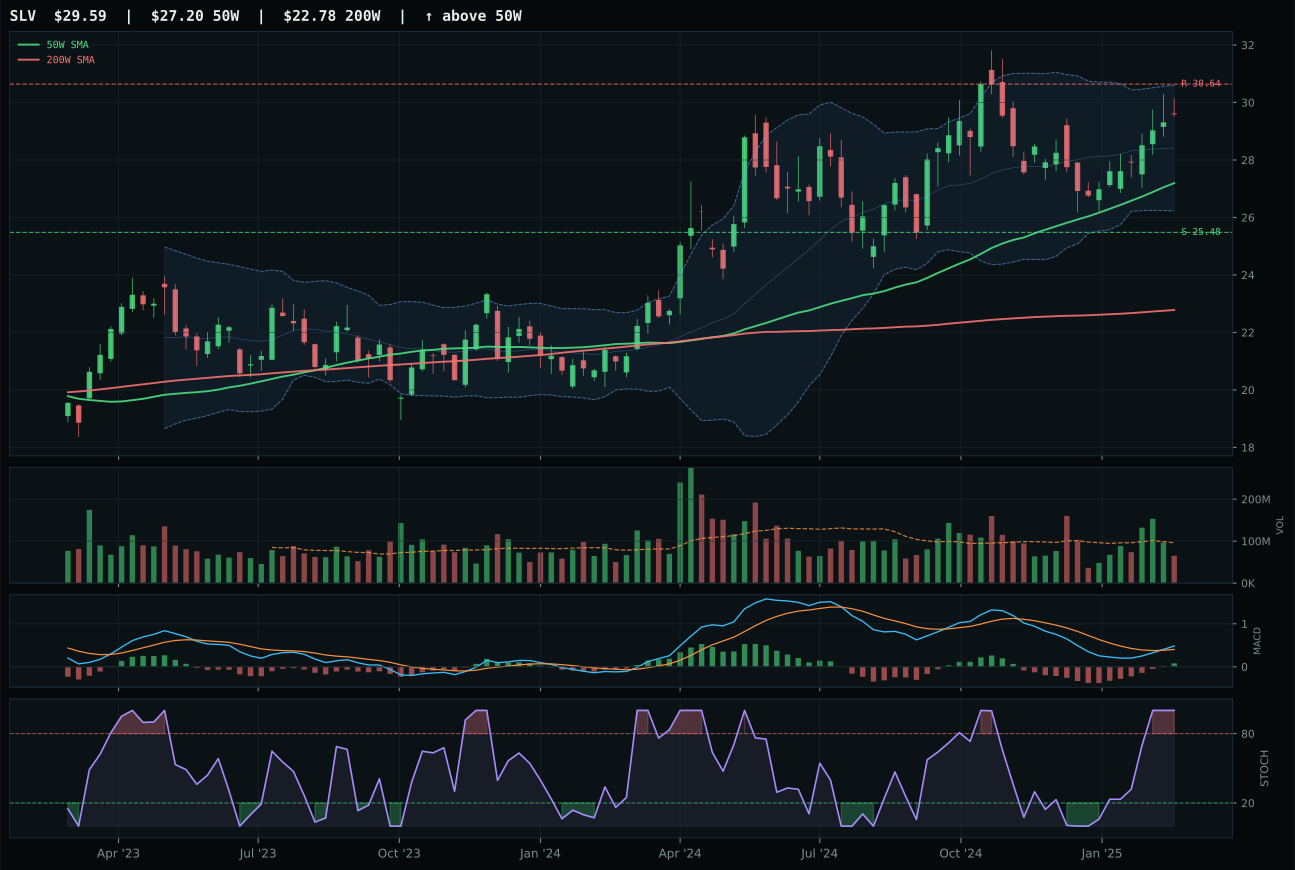
SLV has a neutral structure profile with 3.2% 13-week relative strength versus SPY.
A failed hold above support would weaken the setup.
Actionable but governed by invalidation levels.
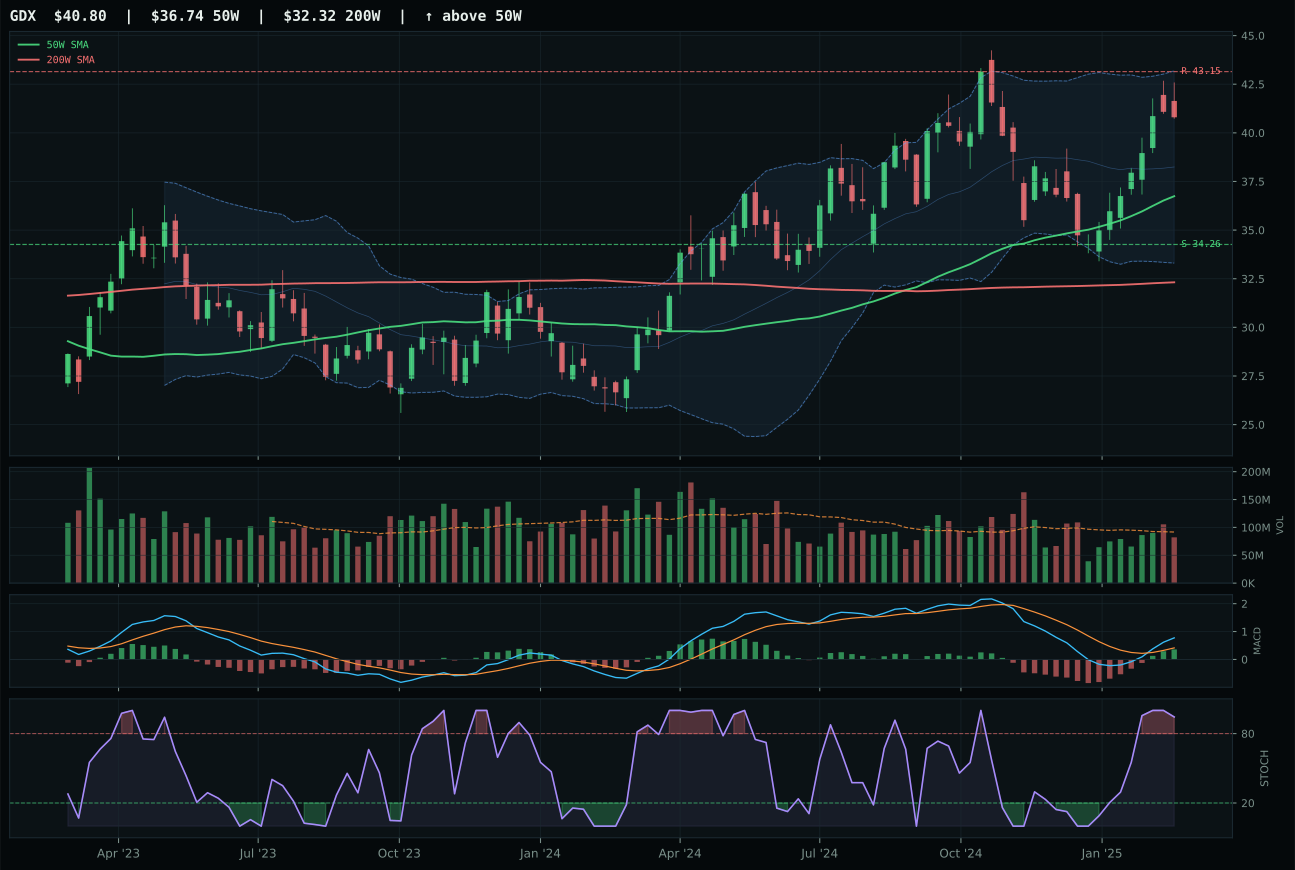
GDX has a neutral structure profile with 5.8% 13-week relative strength versus SPY.
A failed hold above support would weaken the setup.
Actionable but governed by invalidation levels.
GLD wins despite being extended 16.1% above its 50-week average because the extension is supported by clean structure, 7.6% SPY-relative strength, and—most critically—the monetary hedge bid descriptor firing at full strength. The gold ETF's MACD is bullish and improving and stochastic RSI sits at overbought momentum, typical of a currency hedge finding safe-haven bids. Structure score of 80.6 reflects vertical extension rather than rollover, and volume at neutral 1.02x maintains accumulation without panic. SLV loses on multiple fronts: thin participation suggests no fresh money entering silver's industrial beta, structure is less clean at 77.2, and category-relative strength of -2.6% reveals that gold is winning the precious-metals narrative decisively. The timing score of 37 on GLD—penalized for extension—is outweighed by the momentum and macro confirmation that a disinflation regime with monetary hedge demand active favors the purest play.
Precious Metals earns 10% as a top-2 overweight, reflecting the portfolio's conviction that gold is the highest-probability risk-adjusted opportunity in the current macro regime. The category scores 72.0 on a 78.0 macro fit—the best macro fit on the entire board—because both disinflation (+8) and monetary hedge bid (+14) are active descriptors, and disinflation pressure adds another +6. This is not a crowded trade; it is a structural alignment. GLD's technical evidence of 72.5 provides sufficient quality, and the 3/2/1 basket (70.1 opening, refined to 72.0) shows that even the runner-ups SLV and GDX register 67.2 and 66.0 reasoned scores. In a portfolio regime where liquidity stress is active and credit stress is present, the monetary hedge bid—active only in precious metals—becomes the portfolio's core convict ion. The 10% allocation signals that GLD can sustain 16% extension because the fundamental bid is real, not speculative.
Utilities & Infrastructure — XLU
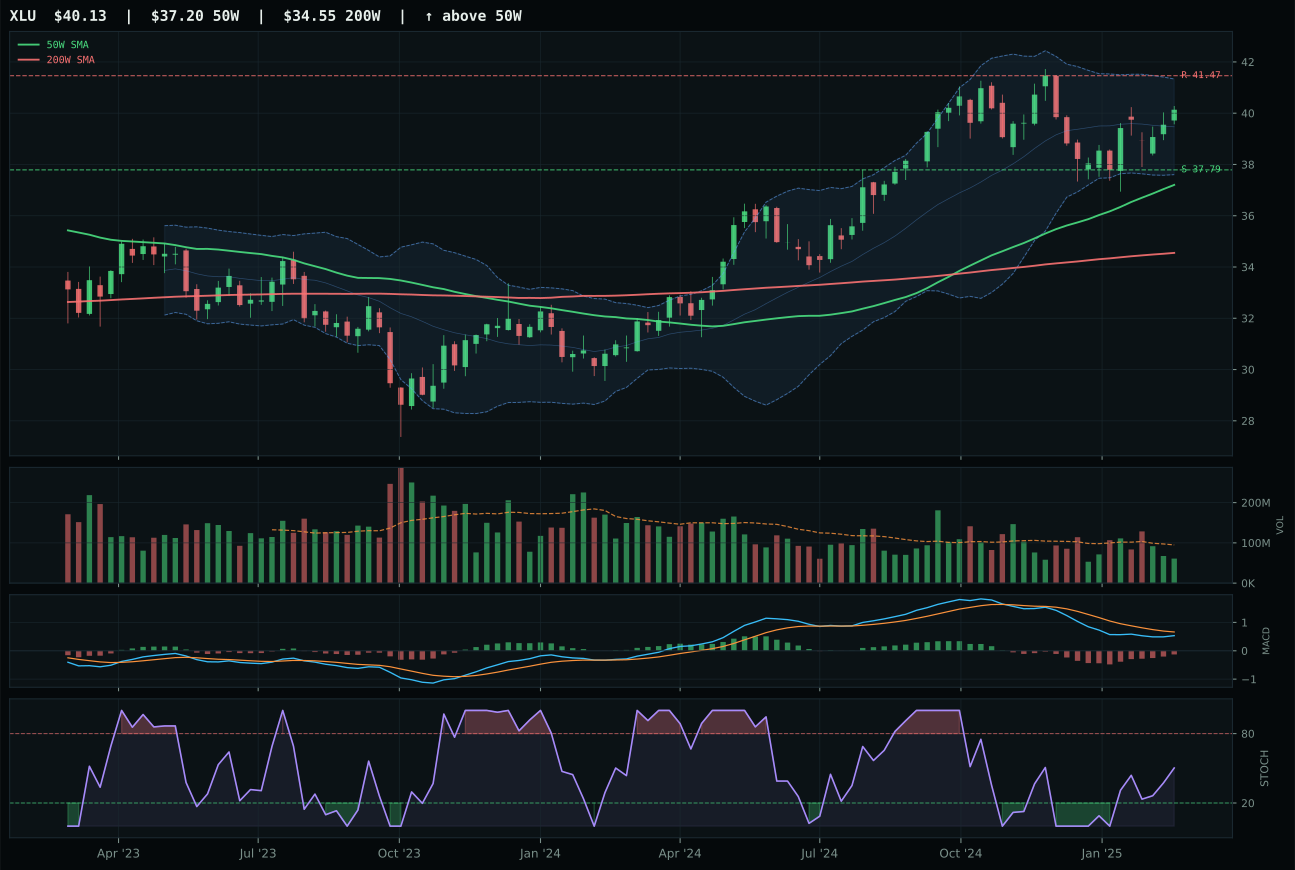
XLU has a neutral structure profile with -2.2% 13-week relative strength versus SPY.
A failed hold above support would weaken the setup.
Actionable but governed by invalidation levels.
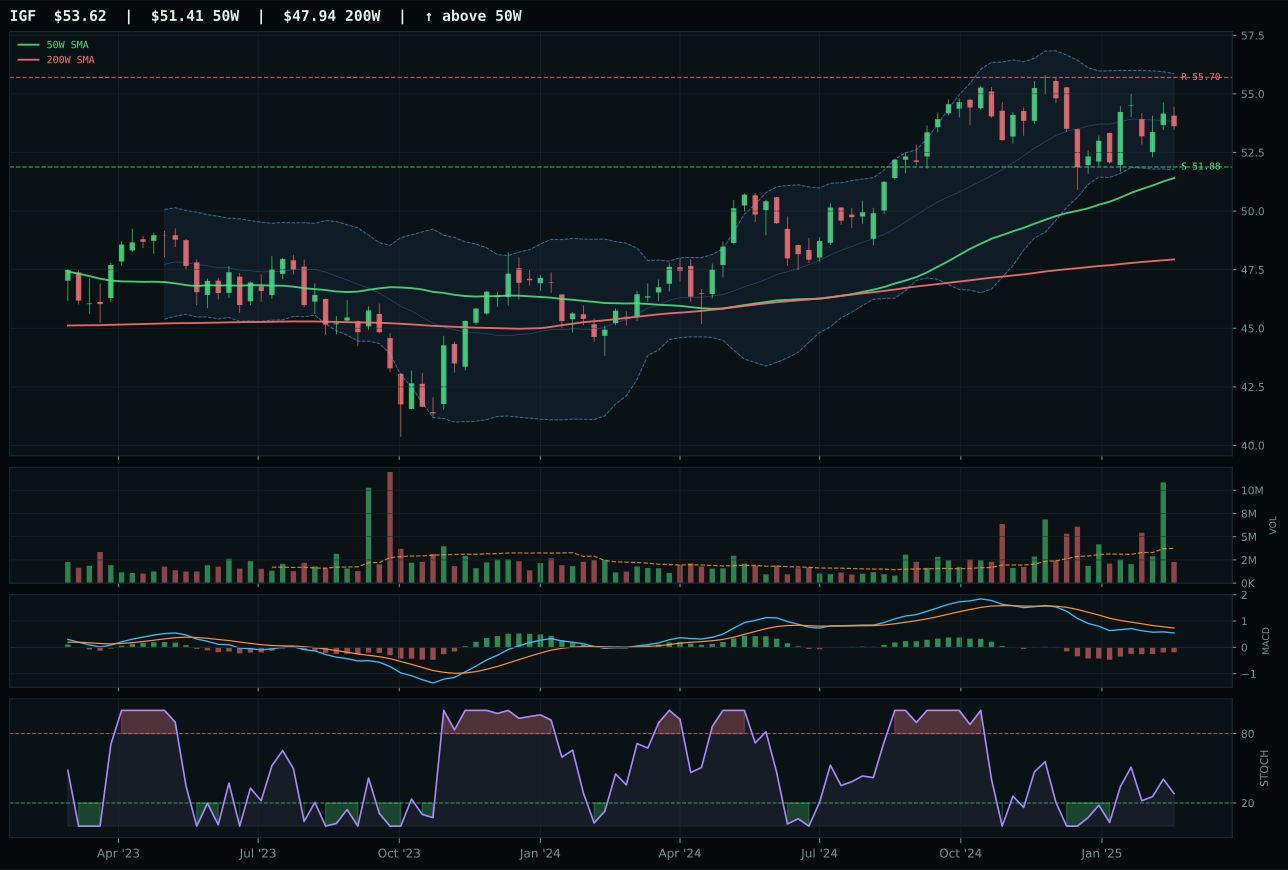
IGF has a pullback into support profile with -3.7% 13-week relative strength versus SPY.
A failed hold above support would weaken the setup.
Actionable but governed by invalidation levels.
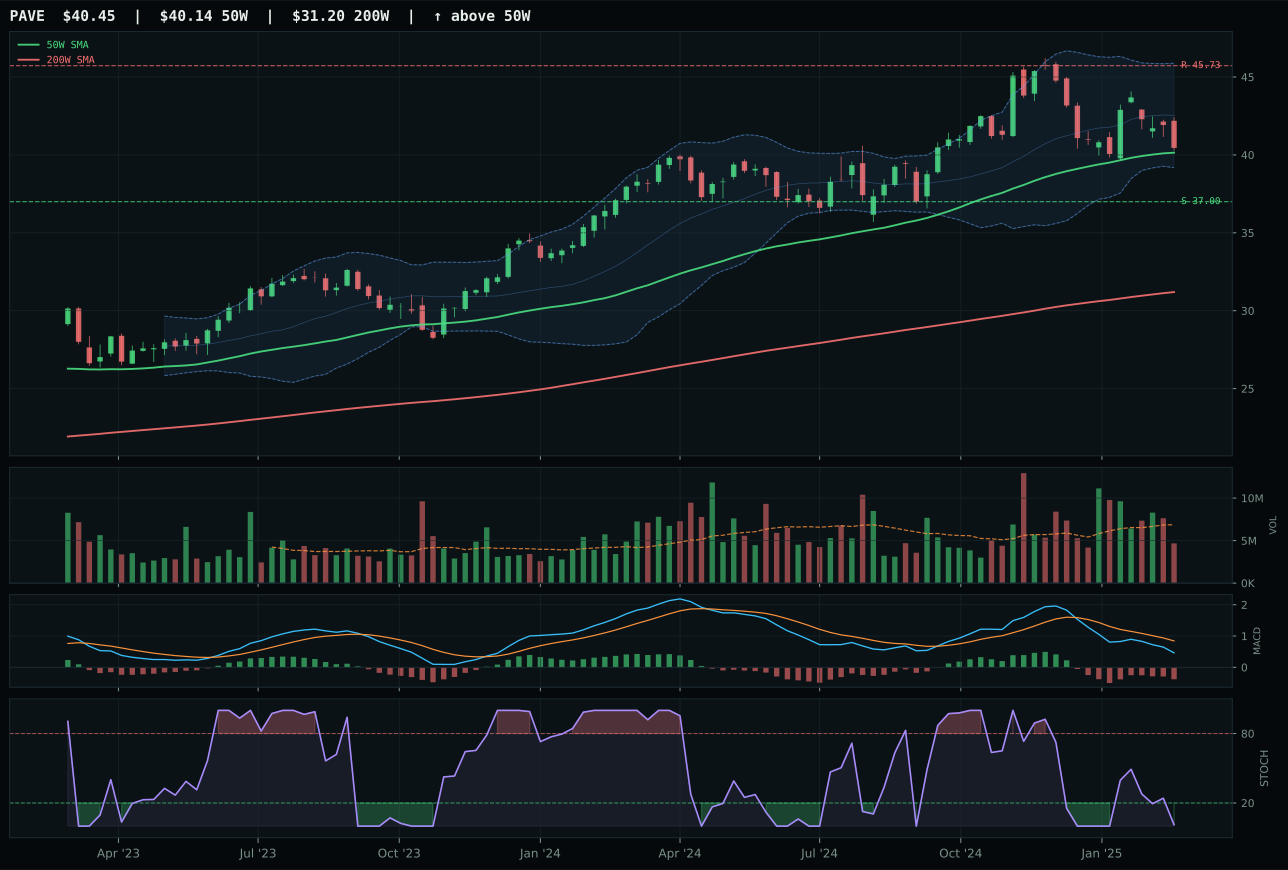
PAVE has a compression near 50W profile with -11.6% 13-week relative strength versus SPY.
A failed hold above support would weaken the setup.
Actionable but governed by invalidation levels.
XLU wins as the defensive category leader on trend strength and category-relative edge. The utilities ETF trades 8.0% above its 50W with MACD bearish but improving and stochastic RSI rising mid-zone, a setup that reflects stability rather than momentum excess. Structure score of 70.5 is clean for a defensive holding; trend of 89.7 benefits from the +0.4% 50W slope and -2.2% SPY underperformance (a positive for defensive exposure in disinflation). Category-relative strength of 1.5% beats IGF's flat 0.0%, signaling that buyers view regulated utilities as the safer infrastructure play versus global toll roads and ports. IGF loses despite superior technical evidence of 71.1 and timing of 100: it sits deeper into pullback structure from a higher level, and zero category-relative sponsorship reveals no preference for global infrastructure breadth. The competitive gap is narrow (-7.1 points) because both are genuinely strong defensive setups, but XLU's relative sponsorship is decisive.
Utilities & Infrastructure earns 10% as the second top-2 overweight on a 51.4 composite score and a 64.0 macro fit—strong support for defensive exposure. Disinflation helps this category (+7) and disinflation pressure is active (+6), creating the two strongest tailwinds for a sector that benefits from lower rates and reduced corporate refinance stress. Liquidity stress is only mildly active (-3), suggesting the market still functions for utility-grade credit. XLU's technical evidence of 66.4 is solid; paired with macro fit of 56.0, the blended score justifies top-2 status. This allocation is the portfolio's core defensive position: as macro tightens and equity breadth narrows, utilities and infrastructure—rated to support both rate-sensitive flows and income-seeking rotation—occupy the highest-confidence second sleeve. The 10% allocation is not a tactical fade but a strategic anchor. For XLU to lose this position, either MACD would need to flip bearish/weakening or disinflation pressure would need to reverse, neither likely in the near term.
Technology — CIBR
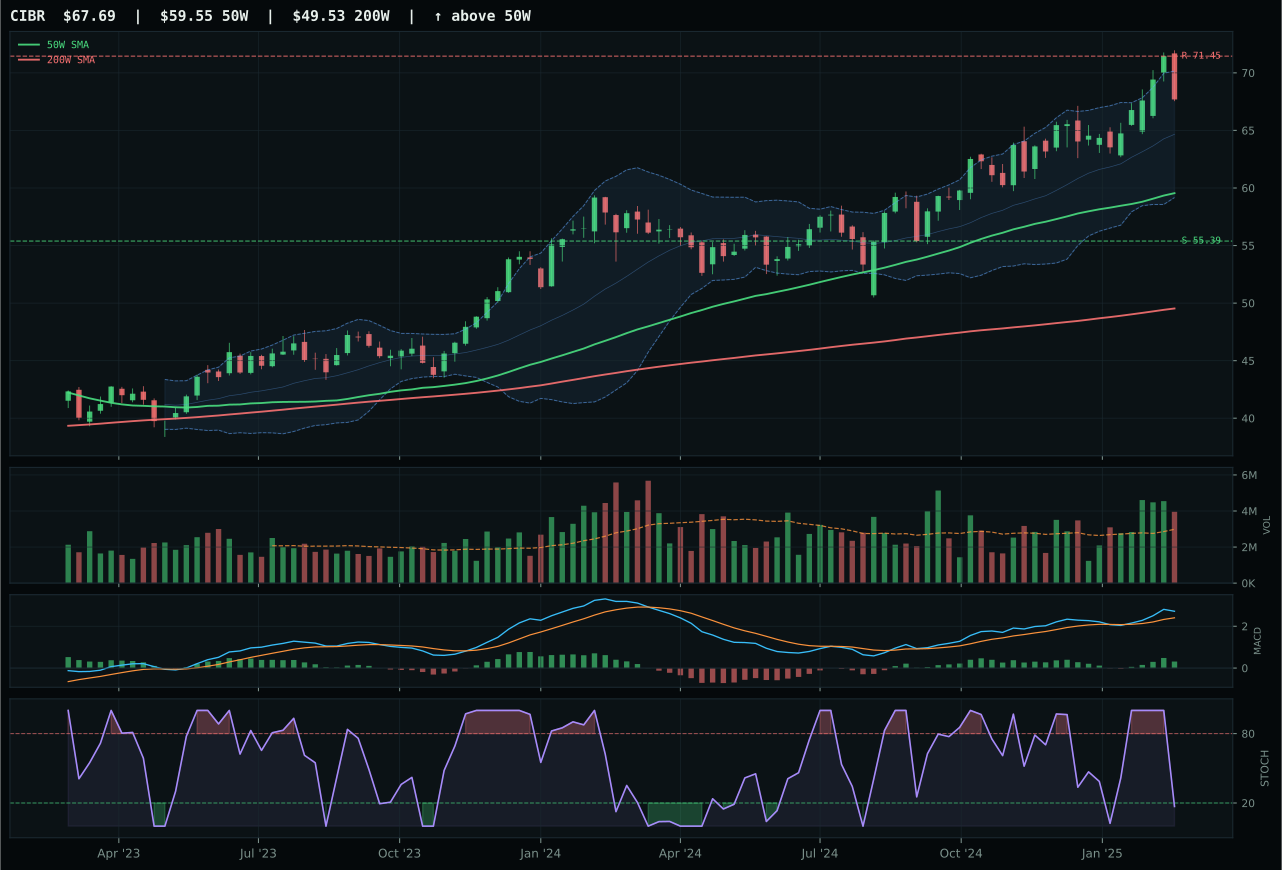
CIBR has a neutral structure profile with 5.7% 13-week relative strength versus SPY.
A failed hold above support would weaken the setup.
Actionable but governed by invalidation levels.
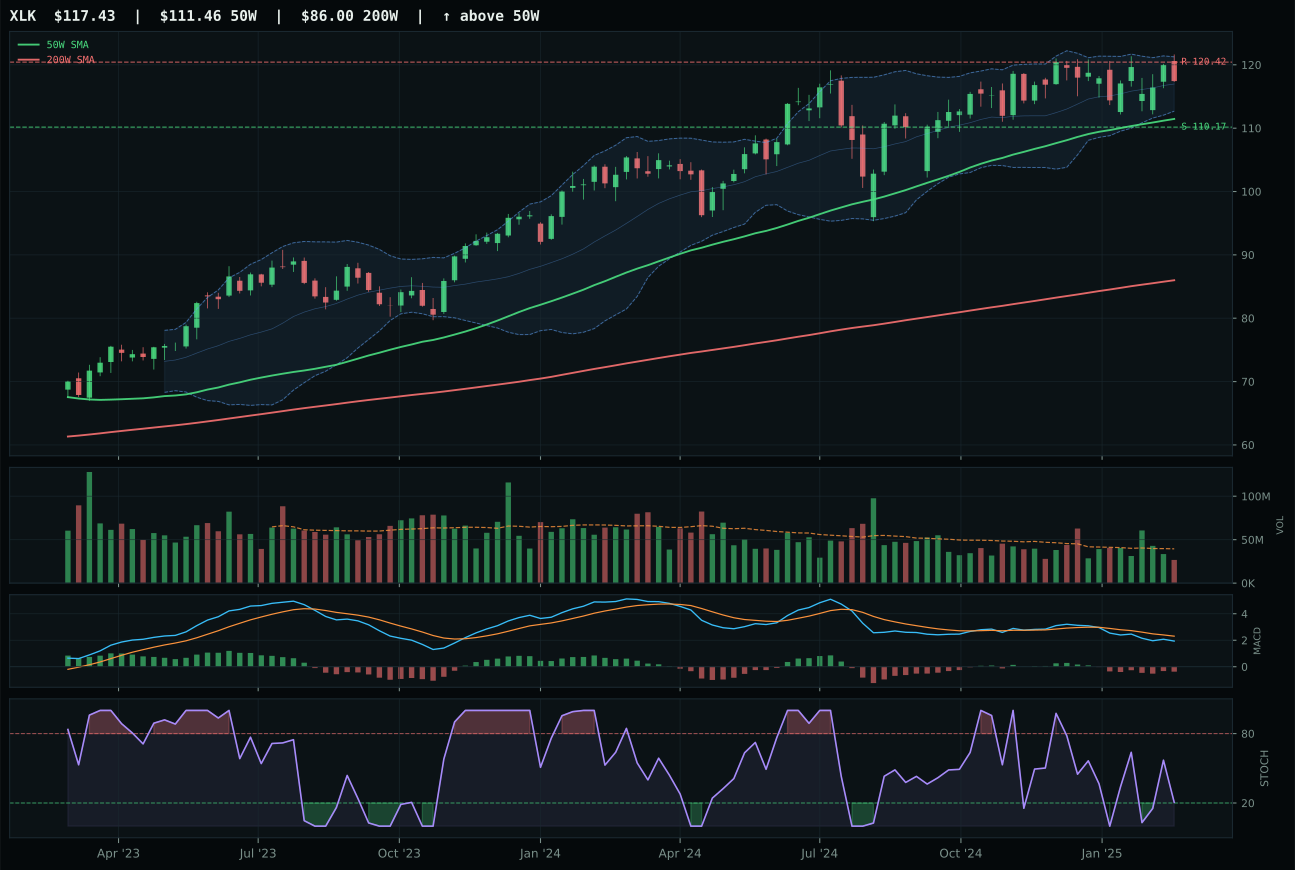
XLK has a neutral structure profile with -0.2% 13-week relative strength versus SPY.
A failed hold above support would weaken the setup.
Actionable but governed by invalidation levels.
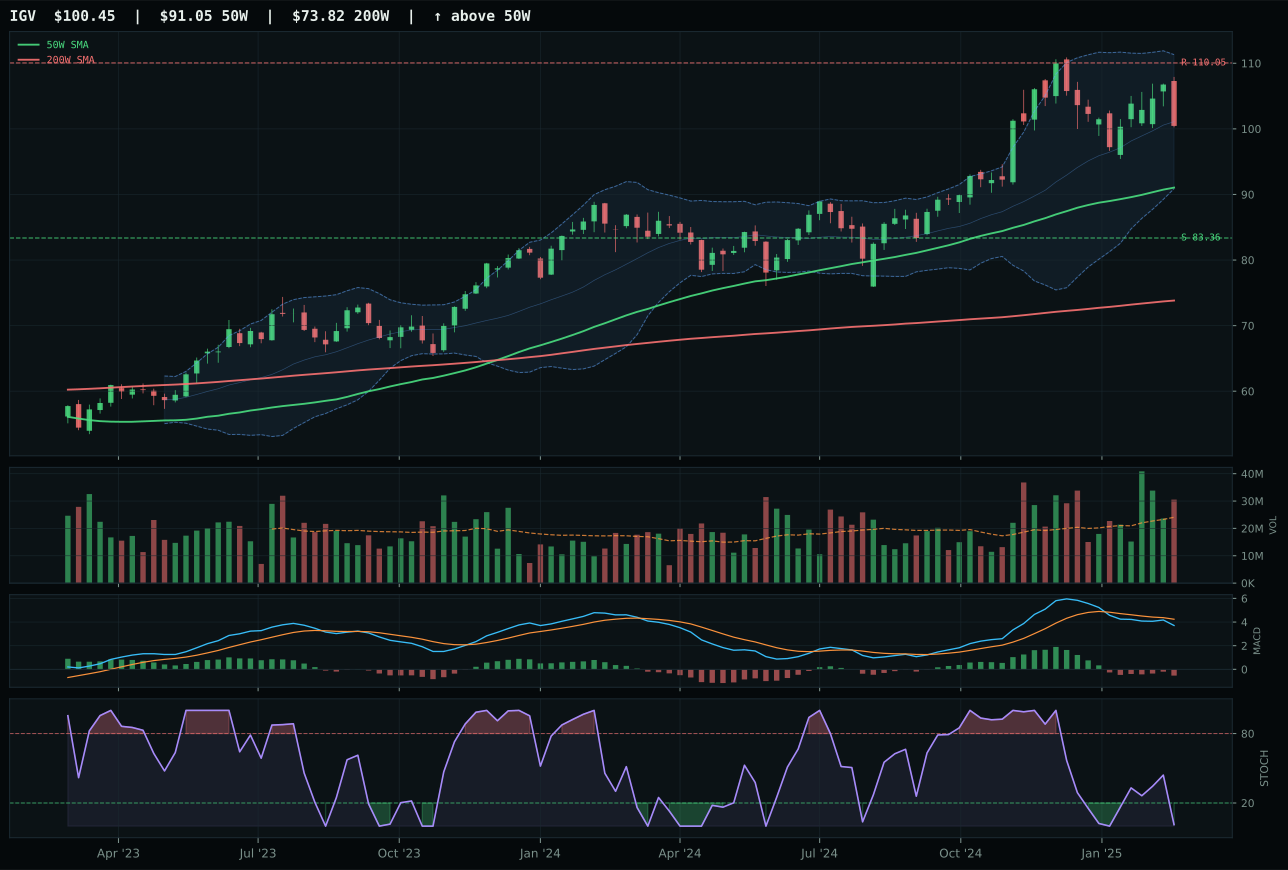
IGV has a neutral structure profile with -6.0% 13-week relative strength versus SPY.
A failed hold above support would weaken the setup.
Actionable but governed by invalidation levels.
CIBR wins on cleaner structure and superior relative strength confirmation. The cybersecurity ETF trades 13.7% above its 50-week moving average—extended, but backed by 5.9% outperformance versus its three-ETF basket and 5.7% strength versus SPY, signaling that institutional money is buying into the theme rather than chasing on fumes. MACD is bullish and improving with stochastic RSI oversold at 0.17, setting up a coil near resistance at 71.45; volume participates at 1.33x the 20-week average, confirming accumulation. XLK loses on momentum divergence: its MACD is bearish and weakening, volume participation dries up, and category-relative strength sits flat at 0.0%, meaning the broad profitable tech basket is leaking relative to its peers. The score delta of 19.7 points is decisive because it reflects not just price momentum but the actual quality of sponsorship behind the move.
Technology earns 5% as a tier-3 category this week, sitting below the two strongest macro-adjusted setups but retaining a position on technical merit. Cybersecurity's neutral structure and 100-point trend score anchor a 43.5 composite despite headwinds from active liquidity stress (-10 basis points at the category level) and credit stress (-7). Disinflation itself helps tech slightly (+7), and the disinflation pressure descriptor adds another +5, but those gains lose power when liquidity tightens. The allocation reflects a portfolio stance that says: we have better risk-adjusted opportunities in metals and utilities right now, but tech's base-case trend remains sound enough to maintain exposure. For CIBR to earn a top-2 slot, either XLK or IGV would need to reverse their momentum divergences or category-level credit stress would need to ease materially.
AI — AIQ
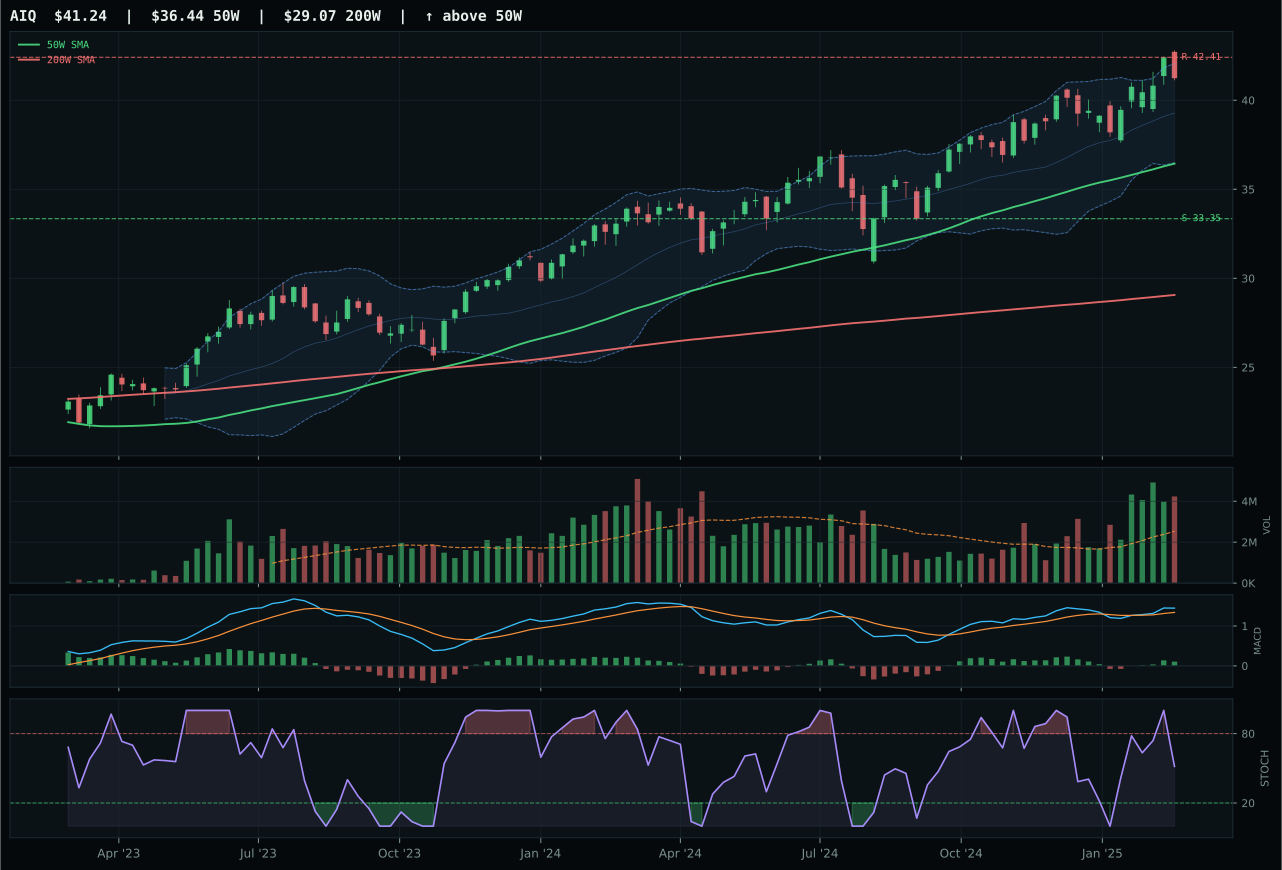
AIQ has a neutral structure profile with 5.8% 13-week relative strength versus SPY.
A failed hold above support would weaken the setup.
Actionable but governed by invalidation levels.
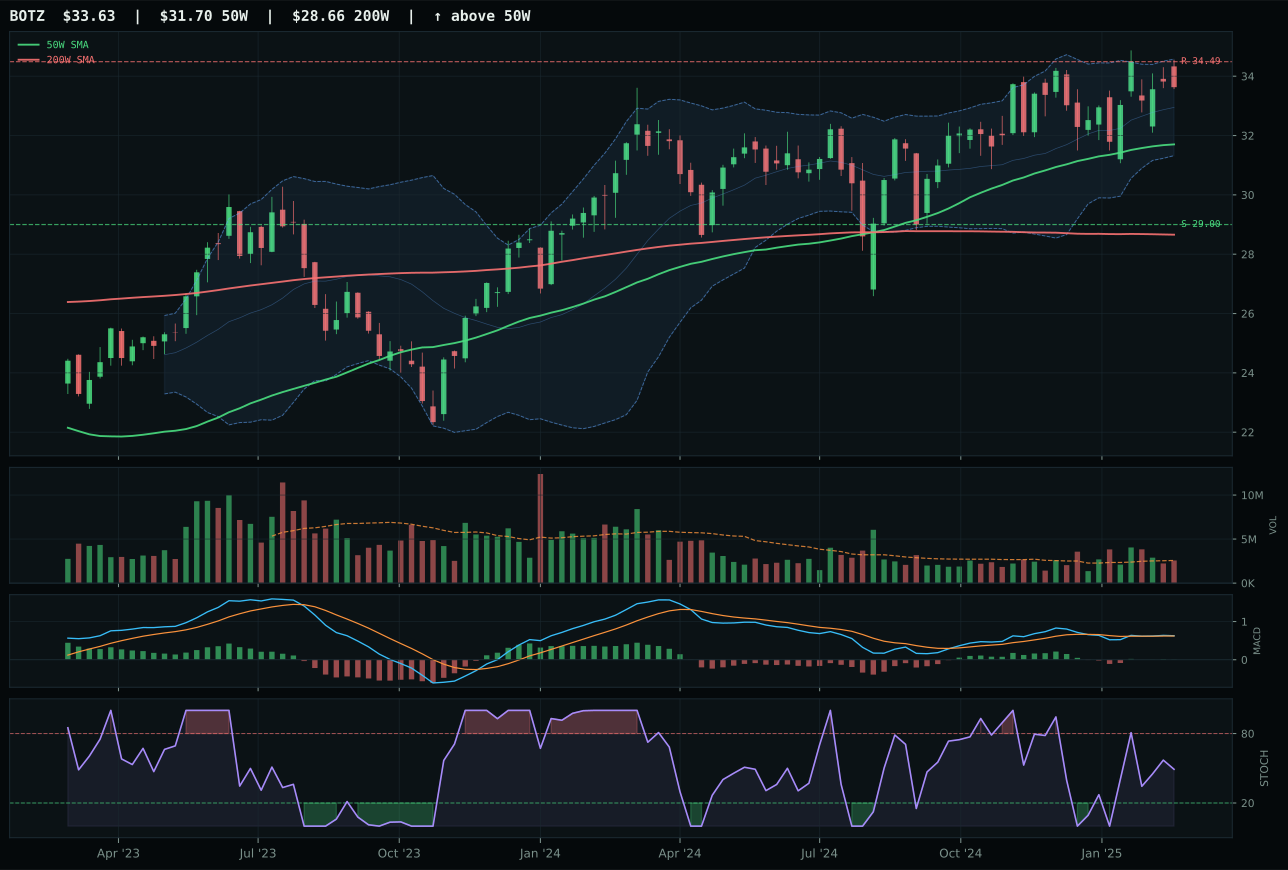
BOTZ has a neutral structure profile with -0.1% 13-week relative strength versus SPY.
A failed hold above support would weaken the setup.
Actionable but governed by invalidation levels.
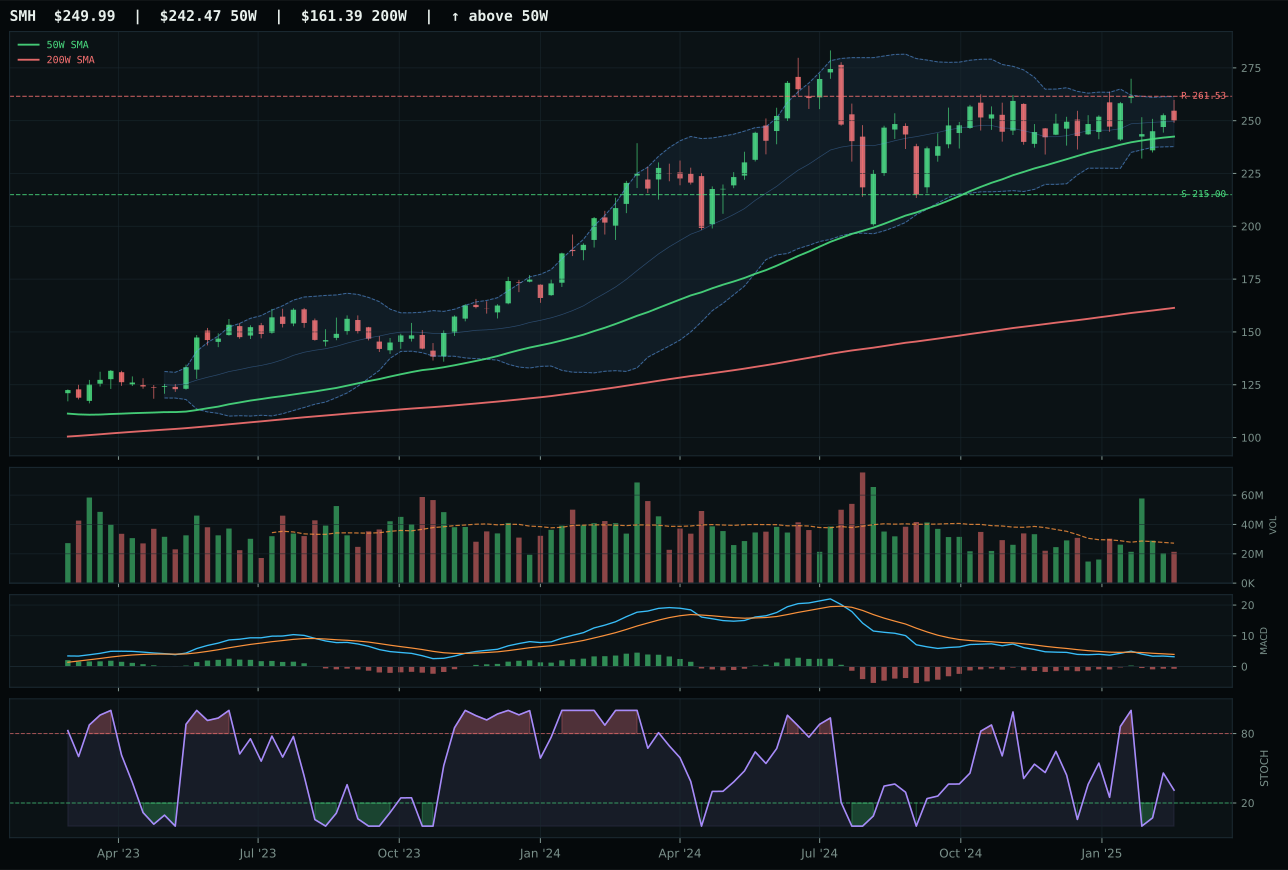
SMH has a neutral structure profile with 1.5% 13-week relative strength versus SPY.
A failed hold above support would weaken the setup.
Actionable but governed by invalidation levels.
AIQ wins despite distribution pressure at 1.67x volume because its 100-point trend score and 5.8% SPY-relative strength outweigh the structural weakness. The AI software ETF sits 13.2% above its 50-week average with MACD bullish and improving and stochastic RSI falling back into neutral territory—a cleaner pullback-and-retest setup than the overbought momentum exhaustion seen in BOTZ. Category-relative strength of 4.4% versus a flat 1.5% for BOTZ proves AIQ is the preferred vehicle; even though both show compression in structure, AIQ's cleanliness score of 50.0 beats BOTZ's implicit weakness in the details. The score gap of 8.3 points is narrow enough to signal caution, but AIQ's 74.6 momentum confirmation and improving MACD make it the only defensible choice in a category hampered by liquidity and credit stress.
AI receives 5% allocation as a tier-3 holding, well below the two favored categories but earning its place on a 34.8 composite score underpinned by technical resilience rather than macro support. Active liquidity stress cuts -12 basis points at the category level, and credit stress adds another -8, creating a structural headwind that overpowers the +5 benefit from disinflation. AIQ's technical evidence scores 53.1 (healthy), but macro fit lands at just 34.0, reflecting the portfolio's read that AI exposure lacks macro tailwind this week. Disinflation helps growth-software narratives only modestly in a regime where liquidity is the binding constraint. AI remains eligible and funded at 5% because its momentum confirmation and relative strength prove the money is still flowing into the names, but the category's low macro score means it will cede allocation slots if technical deterioration widens BOTZ's or SMH's advantage.
Defense & Aerospace — ITA
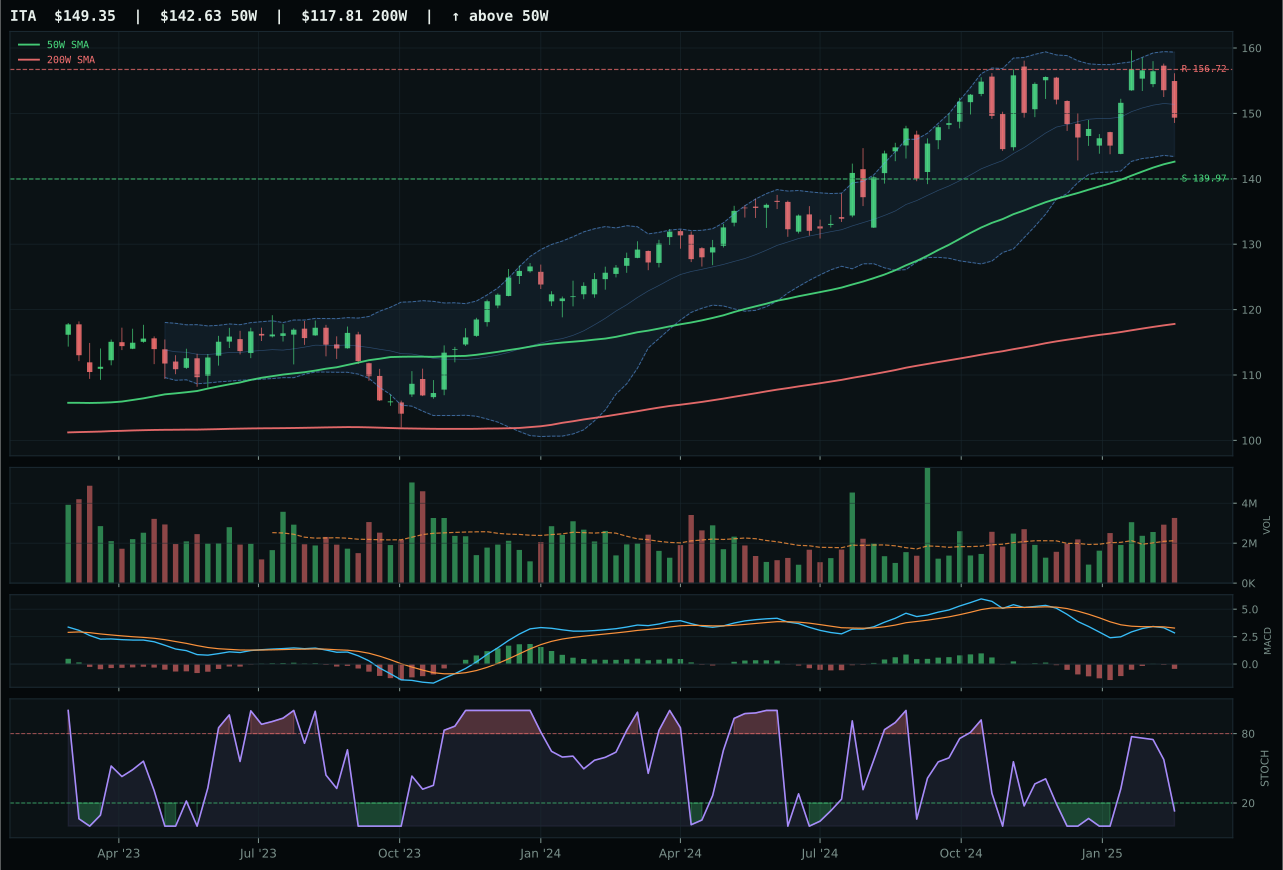
ITA has a neutral structure profile with -4.1% 13-week relative strength versus SPY.
A failed hold above support would weaken the setup.
Actionable but governed by invalidation levels.
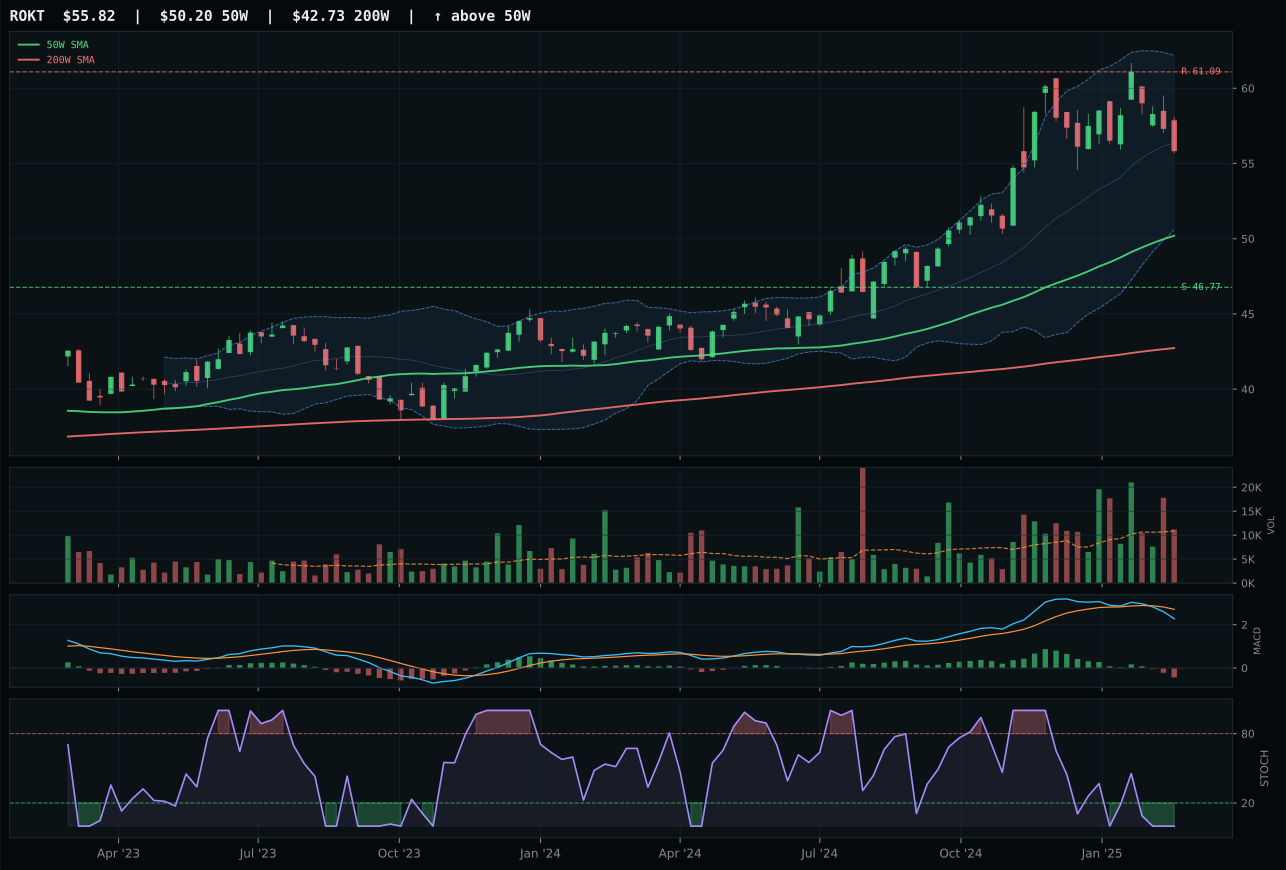
ROKT has a neutral structure profile with -5.2% 13-week relative strength versus SPY.
A failed hold above support would weaken the setup.
Tracked, but not top-2 eligible because: .
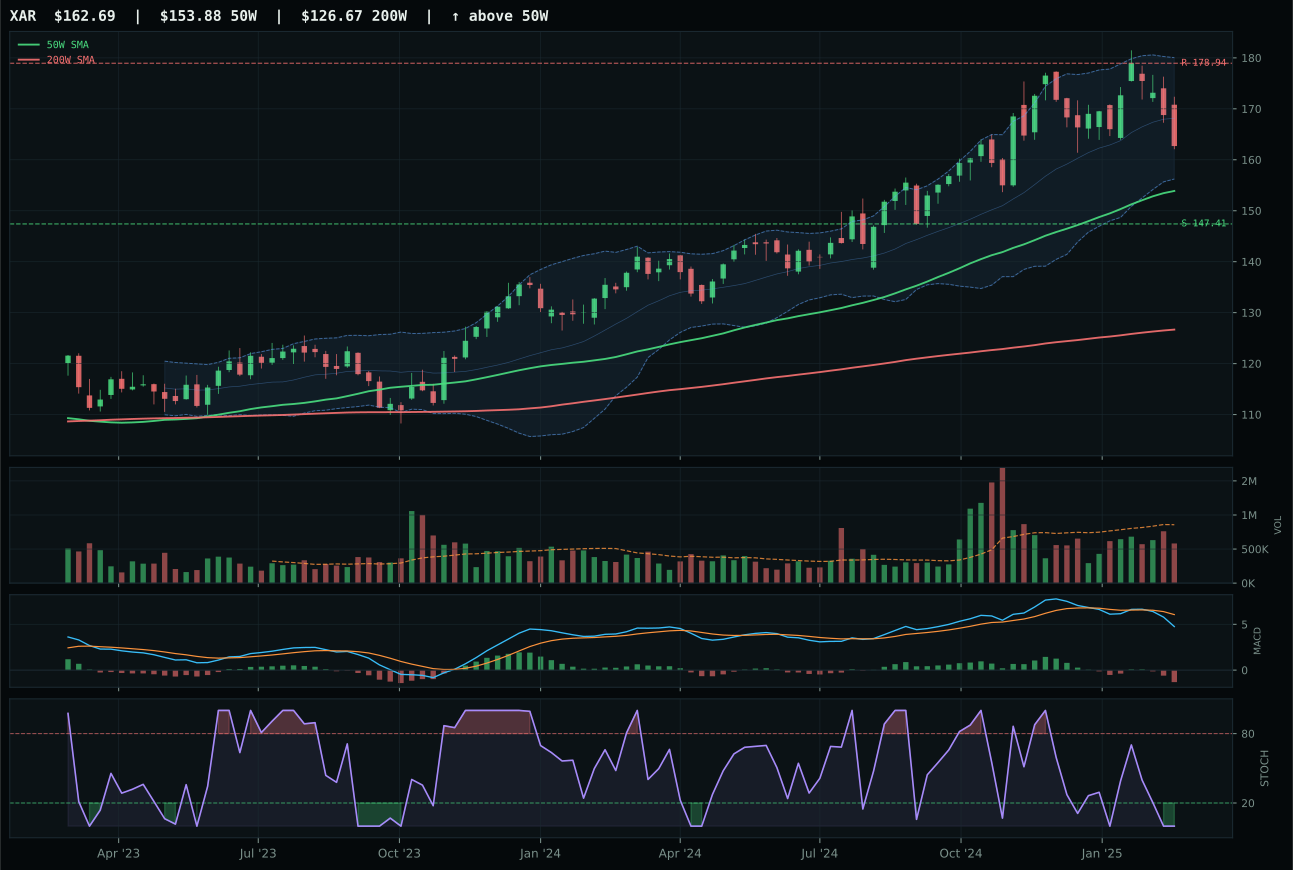
XAR has a neutral structure profile with -6.5% 13-week relative strength versus SPY.
A failed hold above support would weaken the setup.
Actionable but governed by invalidation levels.
ITA wins on superior timing despite negative 13-week returns of -3.3%, because price sits just 4.7% below its 50-week average with MACD bearish but improving and stochastic RSI deeply oversold at 0.13. The setup is a classic near-50W pullback into support at 139.97, where defensive buyers have room to accumulate before invalidation. Timing score of 90 reflects this proximity and the stochastic setup; ROKT trades 11.2% away from its 50W with bearish and weakening MACD and no such clean support zone, forcing a timing score of only 70. ITA's 1.1% category-relative strength, modest as it is, beats ROKT's flat 0.0%, suggesting the defense-prime durability thesis is attracting the marginal dollar. The 21.2-point gap is wide because neither ETF offers conviction here, but ITA's chart setup provides better asymmetry for a patient entry.
Defense & Aerospace earns 5% despite a 33.6 category score because the setup quality justifies a defensive portfolio position in disinflation. The category-level macro fit registers 51.0—actually the strongest macro support among the tier-3 allocations—because liquidity stress is only mildly active (-4) and credit stress flips to slightly positive (+2), suggesting defense spending remains stable even as broad equities tighten. Technical evidence scores just 28.8 for ITA due to negative momentum and distribution pressure at 1.54x volume, but timing of 90 and risk/reward of 49.6 upside-to-resistance create a coiled setup. This allocation is not about chasing returns; it is about positioning where mean-reverting support could pay during a market reset. If liquidity stress deepens or credit stress accelerates, this 5% will be the first to trim.
Nuclear Energy — NLR
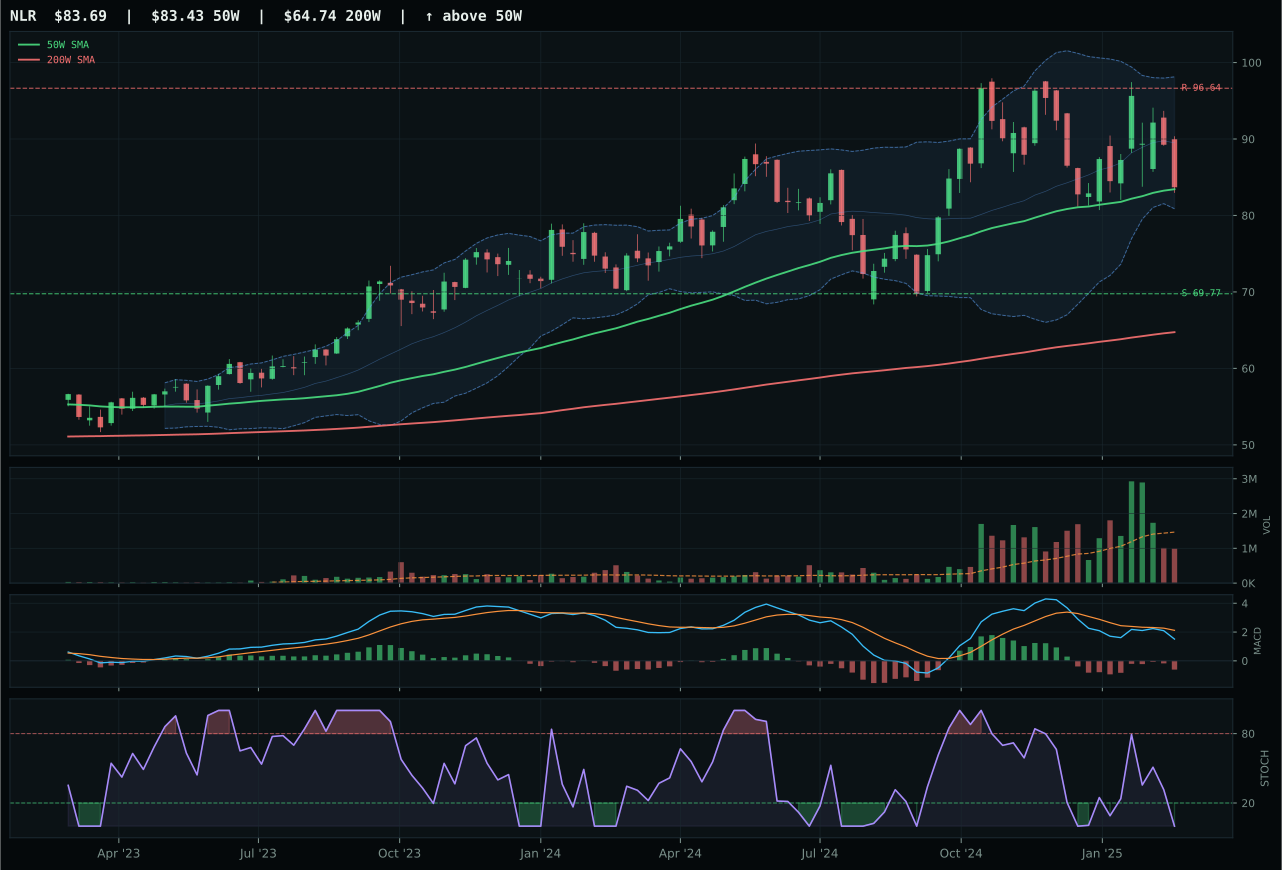
NLR has a compression near 50W profile with -13.9% 13-week relative strength versus SPY.
A failed hold above support would weaken the setup.
Actionable but governed by invalidation levels.
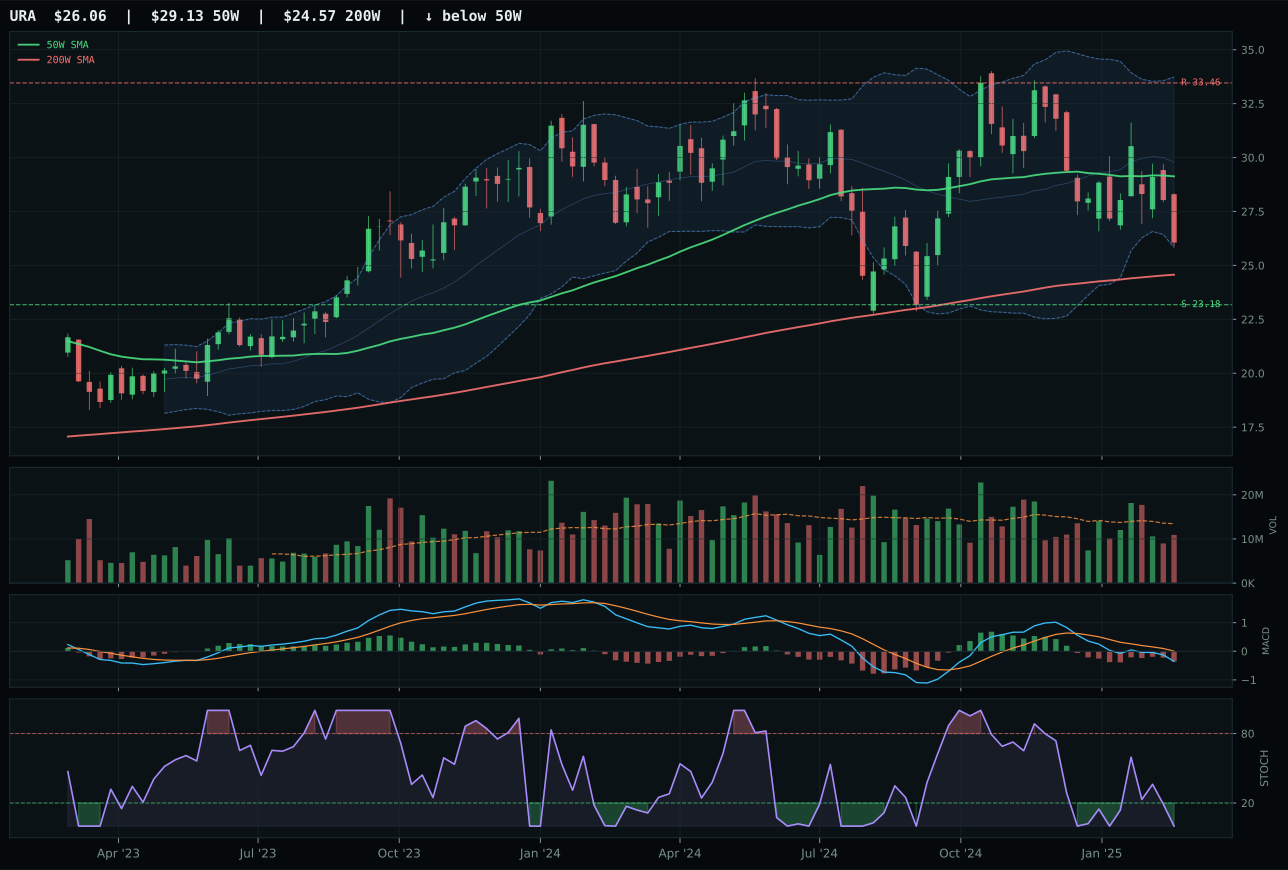
URA has a neutral structure profile with -22.1% 13-week relative strength versus SPY.
A failed hold above support would weaken the setup.
Actionable but governed by invalidation levels.
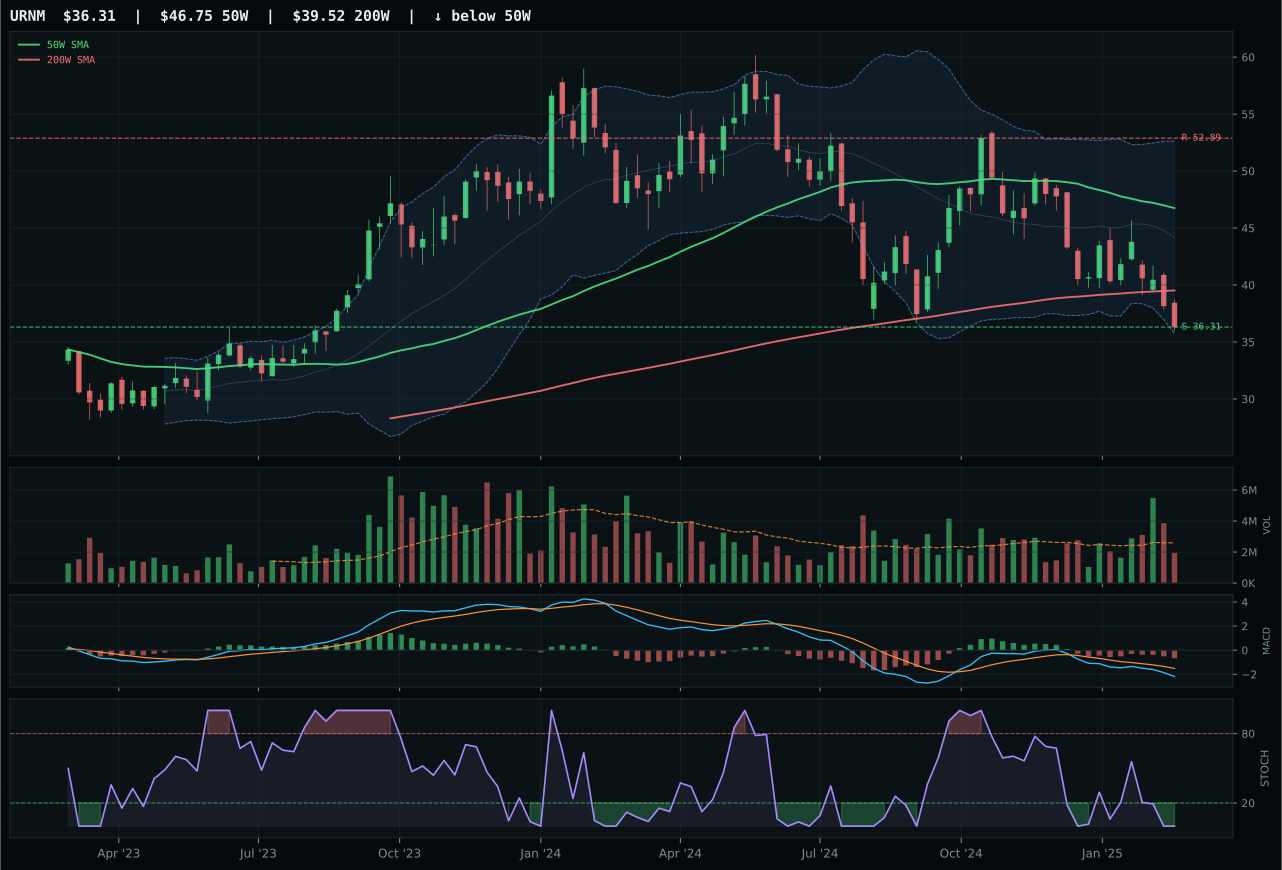
URNM has a pullback into support profile with -27.2% 13-week relative strength versus SPY.
A failed hold above support would weaken the setup.
Actionable but governed by invalidation levels.
NLR wins on timing superiority despite catastrophic momentum of 0.0 and 13W returns of -13.1%, because price trades 0.3% from its 50W with MACD bearish/weakening but stochastic RSI deeply oversold at 0.00. The perfect 100 timing score reflects this near-50W placement and the oversold condition in middle Fibonacci retracement zone, a setup where capitulation has room to reverse. Category-relative strength of 8.2% is the only positive data point and signals that some specialists see value in the nuclear narrative relative to uranium (URA) and uranium miners (URNM). URA loses decisively: -22.1% SPY-relative weakness, timing score of only 57, and deep retracement placing it -22.1% SPY-relative, leaving no defined support level. The 23-point gap is explained entirely by NLR's chart configuration; neither fund offers conviction on fundamentals, but NLR's near-50W coil beats URA's extended selloff.
Nuclear Energy earns 5% as a tier-3 holding on a 19.0 category score, funded primarily on timing setup rather than macro alignment or momentum. Technical evidence of 38.6 is weak (reflecting -13.1% returns and thin volume at 0.68x), and macro fit of 50.0 is neutral because no category-specific descriptor strongly favors or penalizes nuclear. Liquidity stress is active (-7) and credit stress is active (-5), but neither causes hard rejection. The allocation reflects the portfolio's read that NLR's near-50W compression with oversold stochastic RSI offers asymmetric mean-reversion value for one week, despite the category's lack of tailwind. This is the lowest-conviction 5% slot in the portfolio; NLR keeps it only because its timing score of 100 edges out the tier-4 categories and because nuclear has non-zero exposure to disinflation themes (fixed rates help regulated utilities). Any further deterioration in the chart invalidates this allocation immediately.
Agriculture & Livestock — WEAT
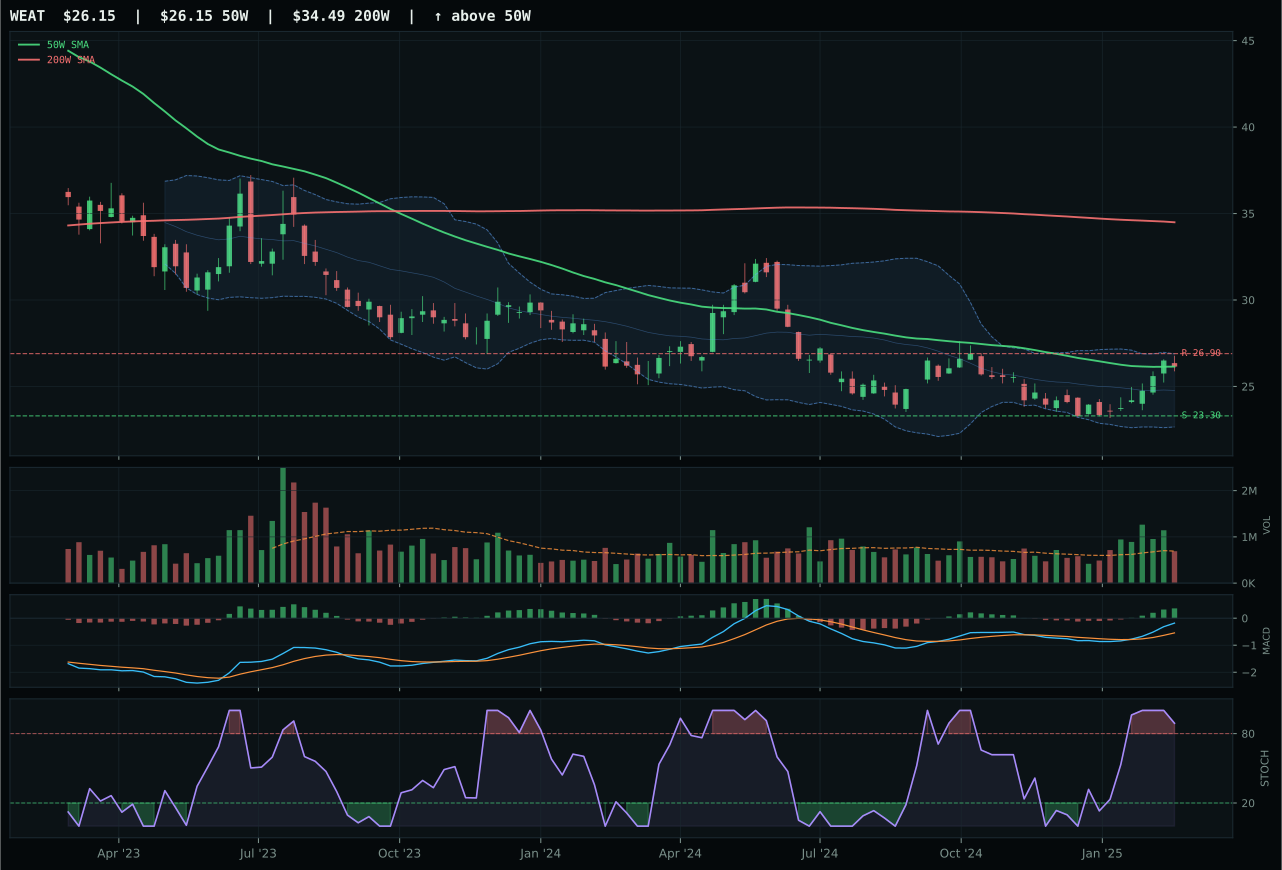
WEAT has a compression near 50W profile with 5.3% 13-week relative strength versus SPY.
A failed hold above support would weaken the setup.
Actionable but governed by invalidation levels.
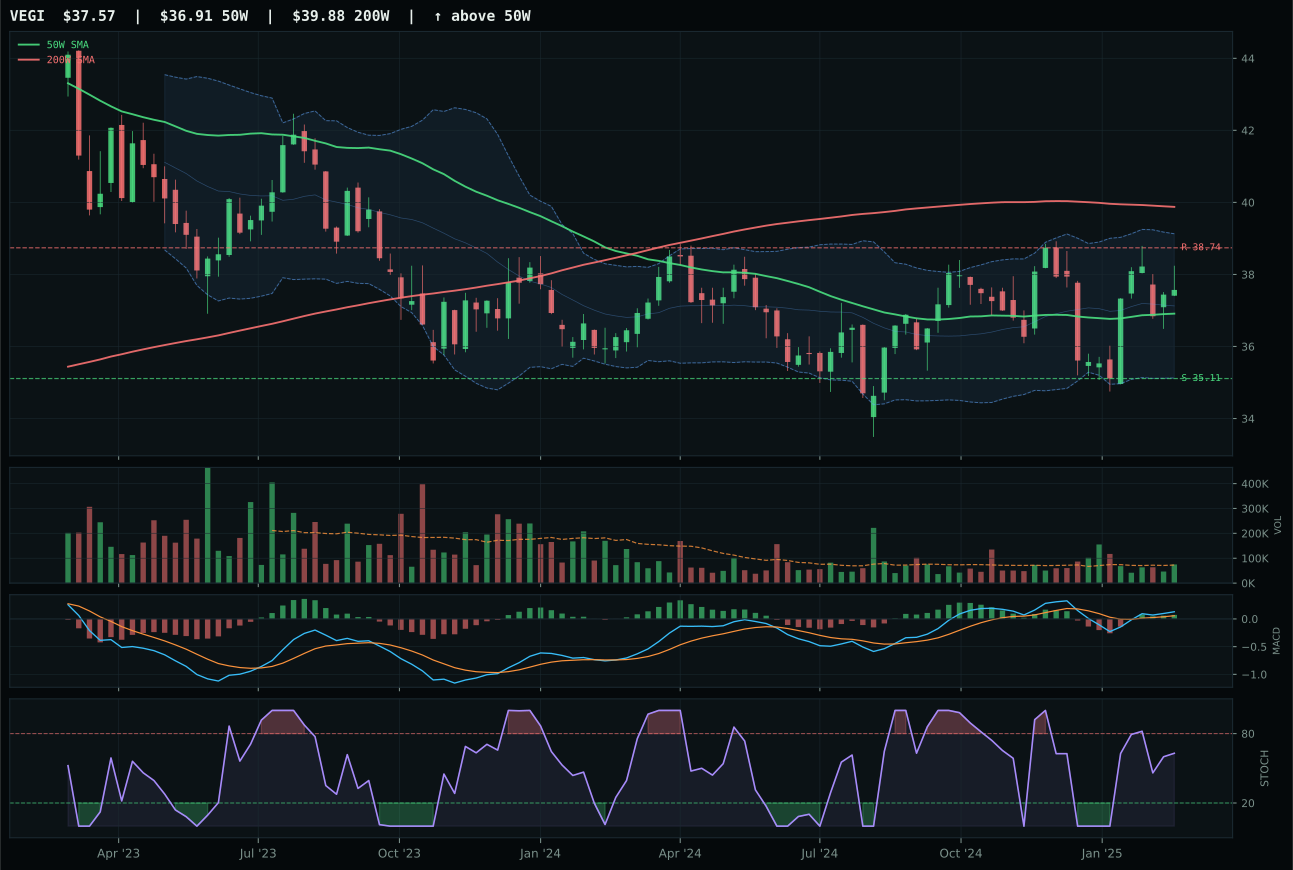
VEGI has a compression near 50W profile with -2.1% 13-week relative strength versus SPY.
A failed hold above support would weaken the setup.
Tracked, but not top-2 eligible because: .
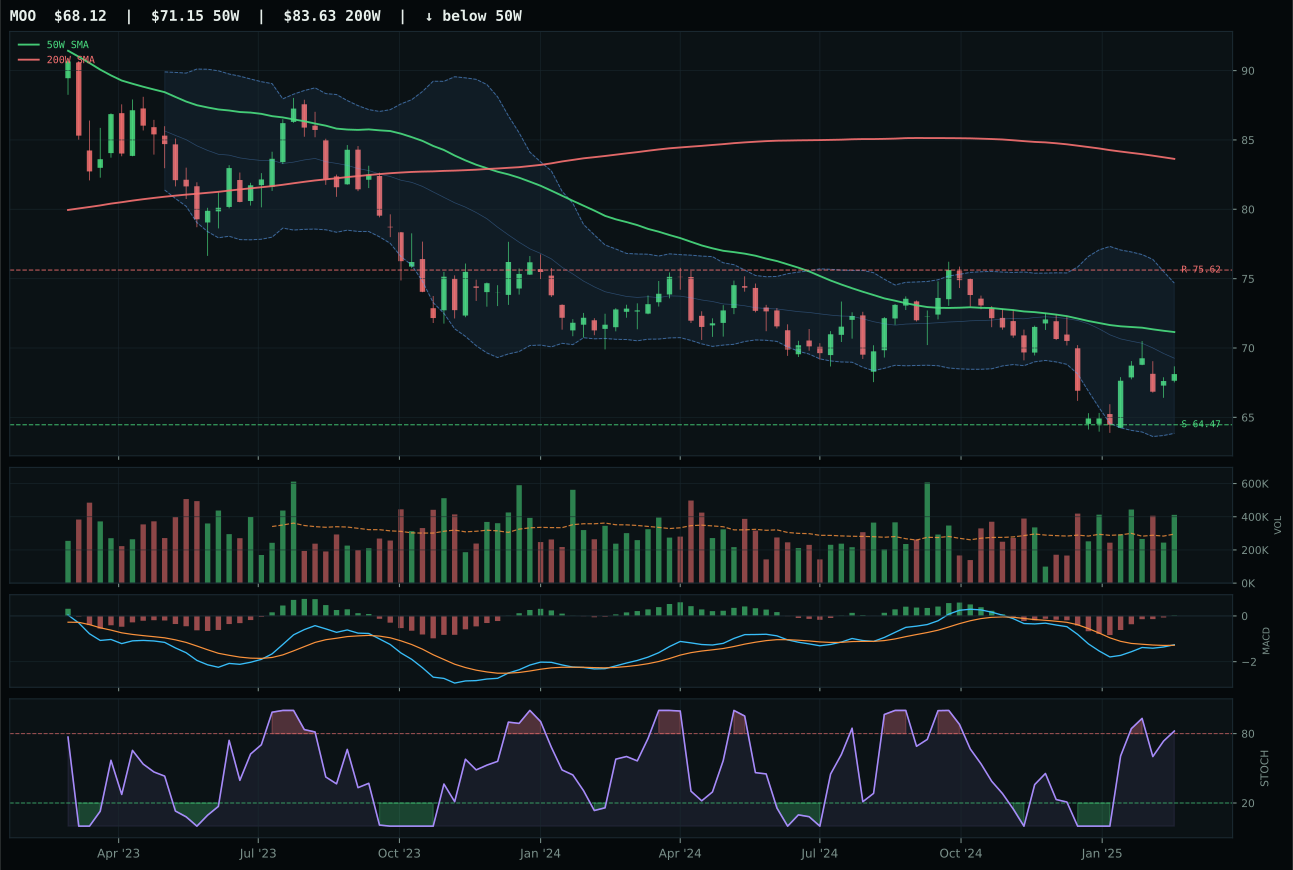
MOO has a neutral structure profile with -5.5% 13-week relative strength versus SPY.
Extension and support failure are the main tactical risks.
Tracked, but not top-2 eligible because: structurally broken.
WEAT wins on explosive category-relative strength of 7.4% paired with neutral volume and a near-perfect 50-week placement. The wheat ETF trades precisely on its 50W with MACD bullish and improving and stochastic RSI overbought but rolling over—textbook compression setup with expansion potential rather than stretched chase. The 13W return of 6.1% and 4W return of 8.1% deliver the momentum confirmation at 94.2 despite a modest score of 49.1 on risk/reward due to the tight range. VEGI collapses on category-relative strength of 0.0% despite a cleaner 72.4 structure score; it simply has no relative sponsorship inside its basket. The 27.0-point gap is massive because WEAT's momentum and relative strength create actual optionality, whereas VEGI is a dead-weight hold in a sector that macro is actively penalizing.
Agriculture earns 5% despite scoring only 13.3 at the category level because it represents the portfolio's tactical read on a short-term setup, not a strategic conviction. Disinflation actively hurts this exposure (-6 at category level) and the disinflation pressure descriptor compounds the drag (-8), making this the second-worst macro category on the board. WEAT's technical evidence of 75.1 is sharp and its momentum confirmation stands at 94.2, but when placed against macro fit of 50.0 (neutral due to lack of category-specific descriptors) and a 62/38 technical-to-macro weighting, the category barely earns its slot. The allocation is tactical: WEAT's compression near 50W and overbought stochastic rolling over offer a mean-reversion candidate for a one-week trade or hedge. If wheat breaks its 23.30 support or if the macro winds shift, this 5% becomes candidate for reallocation to higher-conviction setups.
Emerging Markets — IEMG
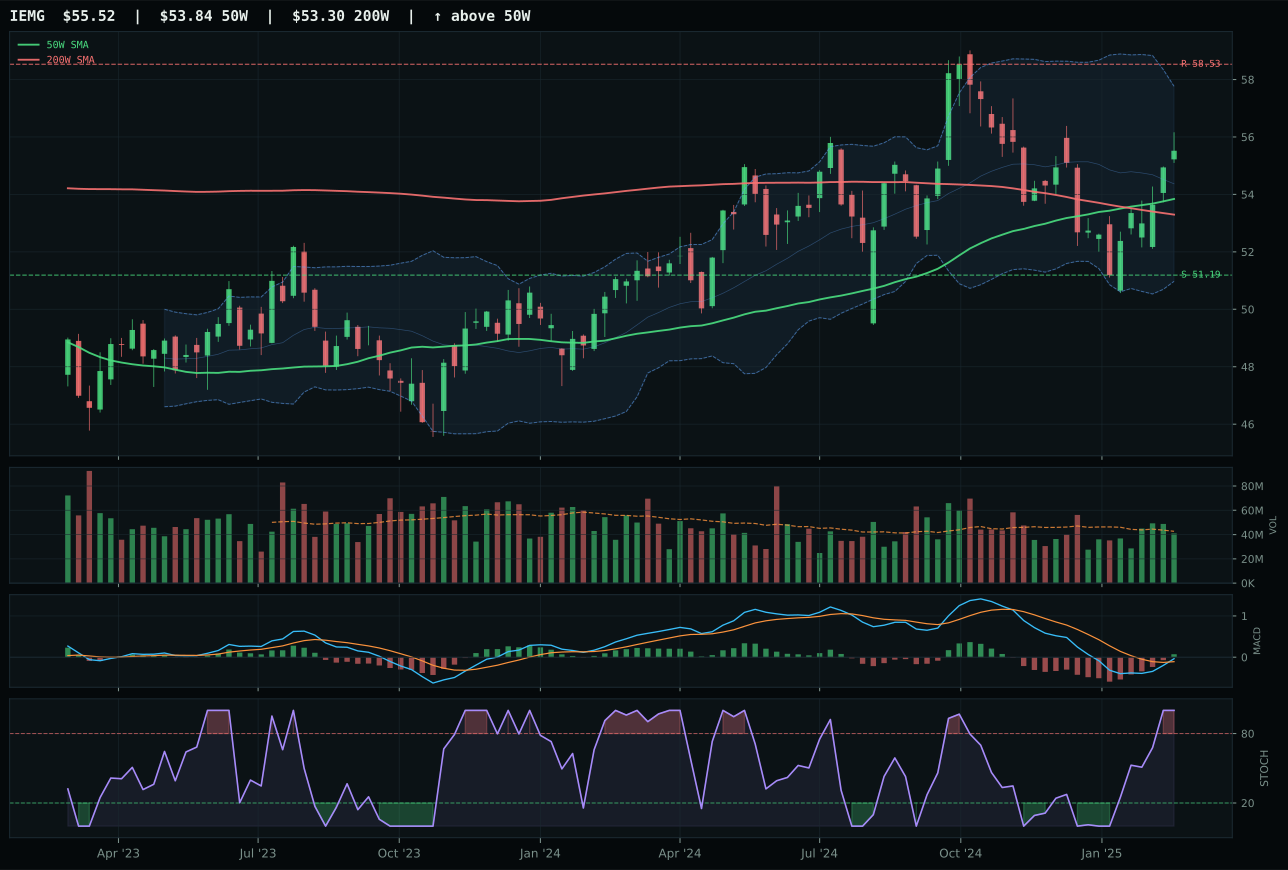
IEMG has a neutral structure profile with 1.7% 13-week relative strength versus SPY.
A failed hold above support would weaken the setup.
Actionable but governed by invalidation levels.
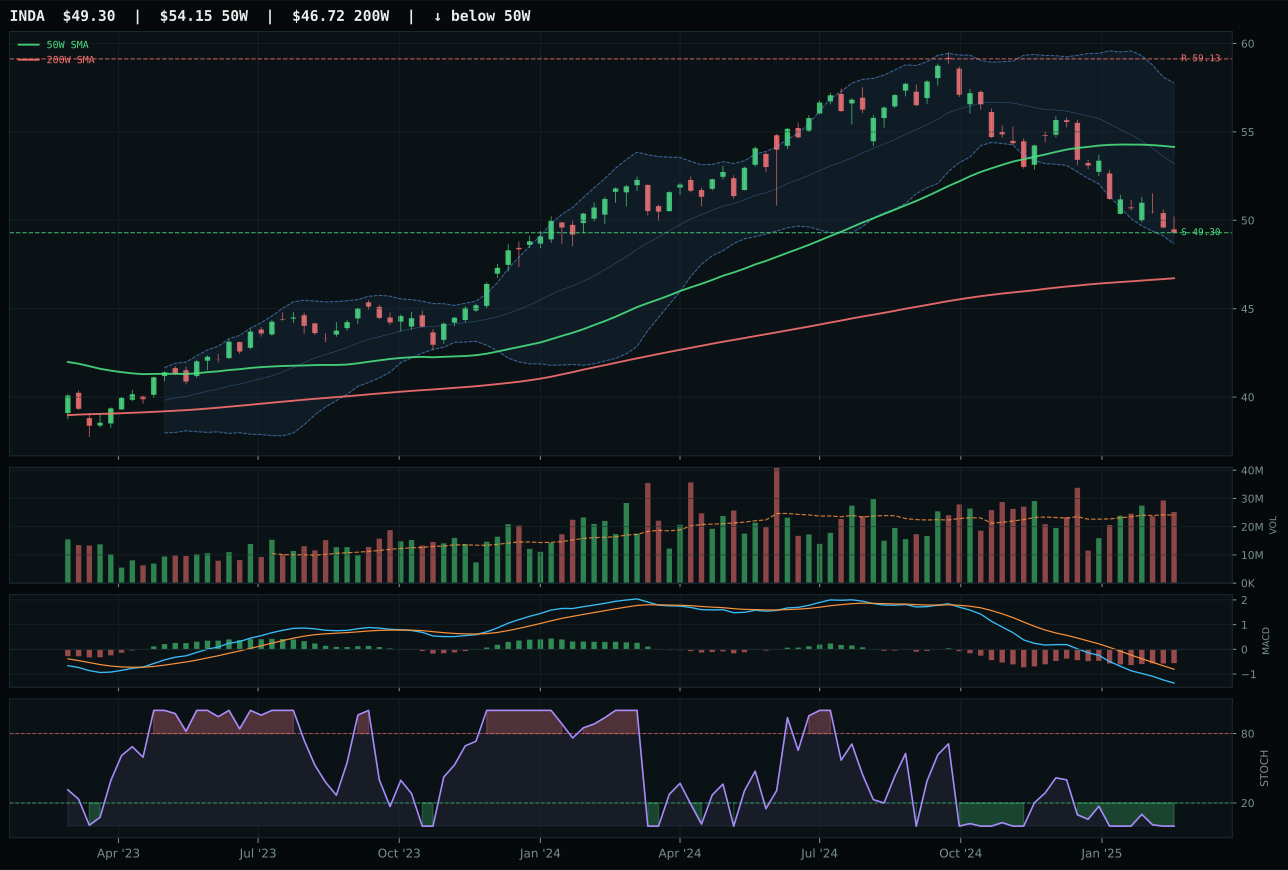
INDA has a pullback into support profile with -9.8% 13-week relative strength versus SPY.
A failed hold above support would weaken the setup.
Actionable but governed by invalidation levels.
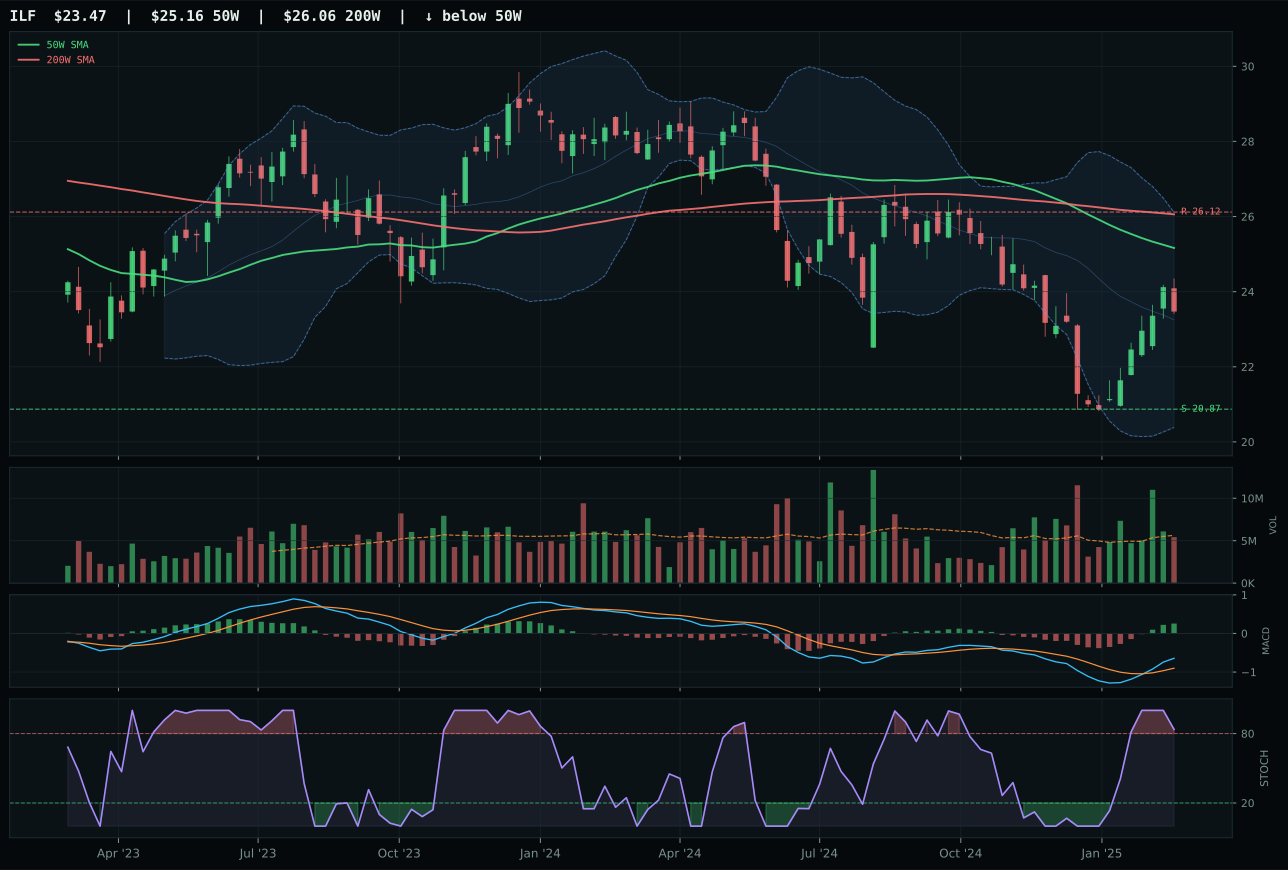
ILF has a neutral structure profile with -3.6% 13-week relative strength versus SPY.
Extension and support failure are the main tactical risks.
Tracked, but not top-2 eligible because: structurally broken.
IEMG wins decisively on broad trend strength and category-relative superiority. The emerging-markets broad ETF trades 3.1% above its 50W with MACD bullish and improving, stochastic RSI at overbought momentum of 1.00, and a clean 78.2 structure score reflecting compression strength. Category-relative strength of 5.3% is material; it tells us capital is flowing into the generalist EM play rather than India-specific (INDA) or Latin America-specific (ILF) views. INDA collapses on structure and momentum: it sits deeper in pullback mode with bearish but improving MACD and -9.8% SPY-relative weakness that flags distribution pressure. The 31.2-point gap is vast because IEMG has actual trend and sponsorship, while INDA is repairing from a deeper drawdown. Even though IEMG's momentum confirmation of 82.2 is solid and 13W return of just 2.4% is modest, it is the best available choice in a sector that macro opposes.
Emerging Markets earns 5% as a tier-3 allocation on a 13.1 composite despite a macro fit of only 30.0—one of the worst macro environments outside of energy. Credit stress and liquidity stress each suppress category-level fit by -10 basis points, reflecting the portfolio's read that emerging markets are vulnerable to dollar strength and funding withdrawal in a tightening regime. IEMG's technical evidence of 81.6 is strong, but when weighted 62/38 against macro fit of 34.0, the composite lands at 13.1. This allocation is purely technical: IEMG has trend, volume sponsorship at neutral 0.96x, and category-relative outperformance that suggests money is not fleeing EM broadly. However, the positioning is defensive—a hold rather than a conviction. For EM to earn a higher allocation tier, either credit stress would need to reverse or category-level momentum divergence would need to resolve, neither of which the macro regime supports in the near term.
Industrial Metals — COPX
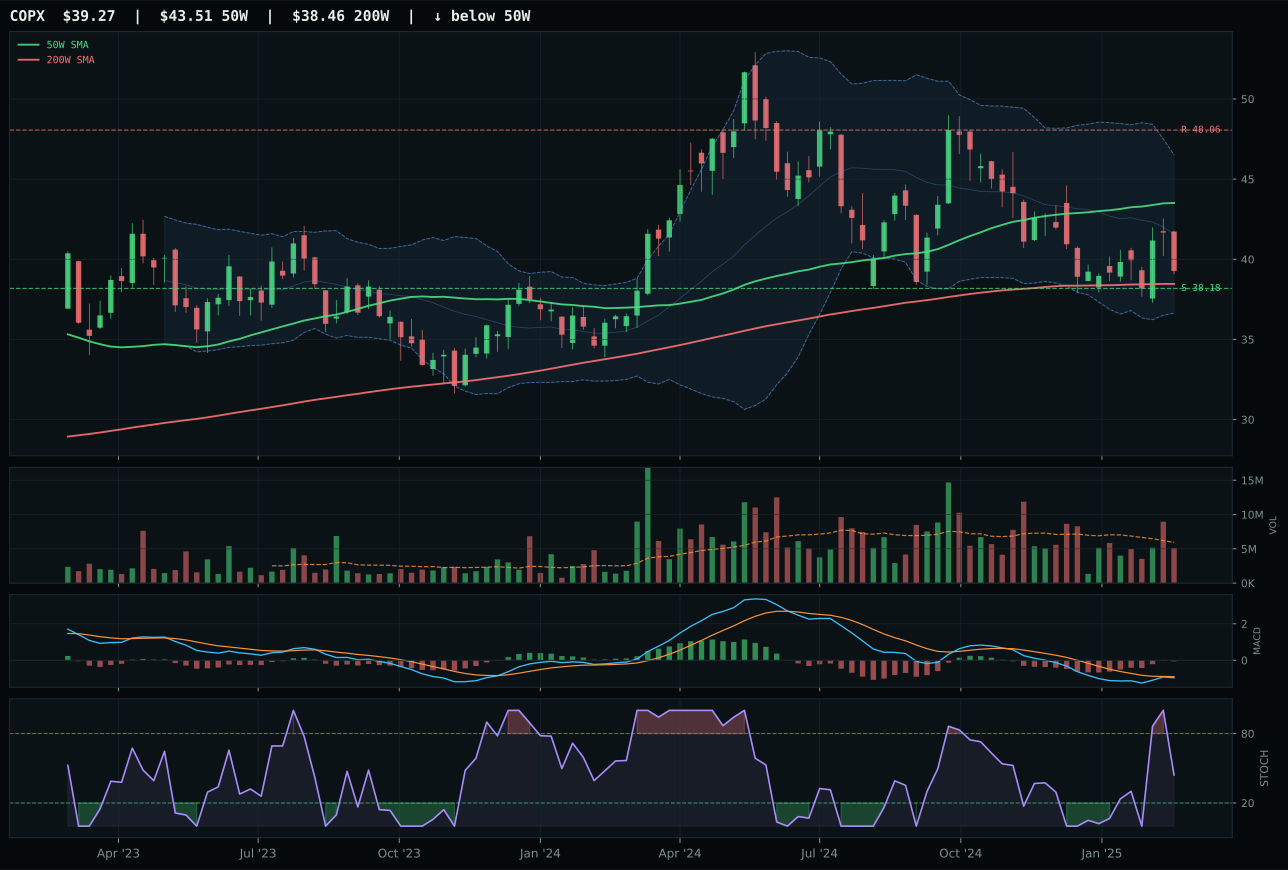
COPX has a pullback into support profile with -8.5% 13-week relative strength versus SPY.
A failed hold above support would weaken the setup.
Actionable but governed by invalidation levels.
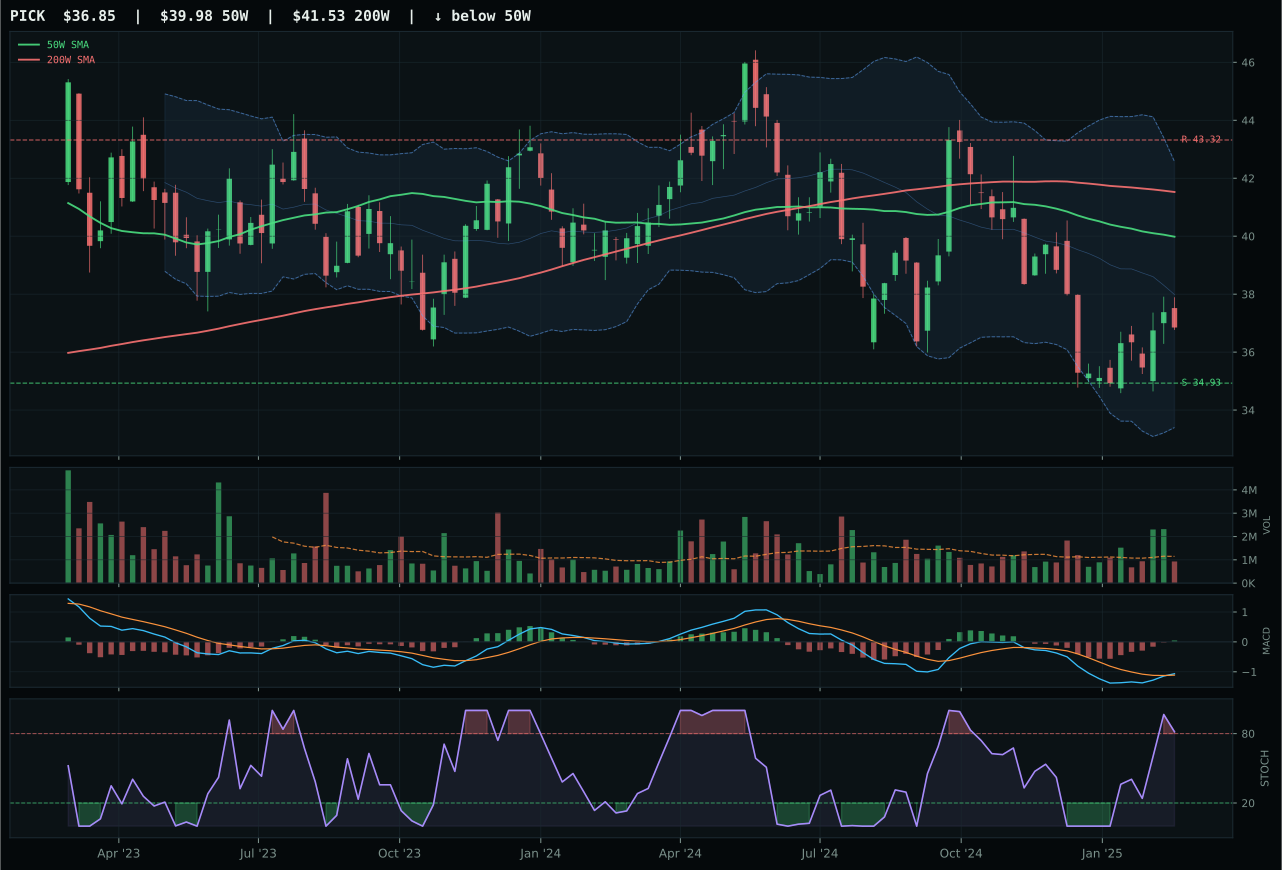
PICK has a neutral structure profile with -7.0% 13-week relative strength versus SPY.
Extension and support failure are the main tactical risks.
Tracked, but not top-2 eligible because: structurally broken.
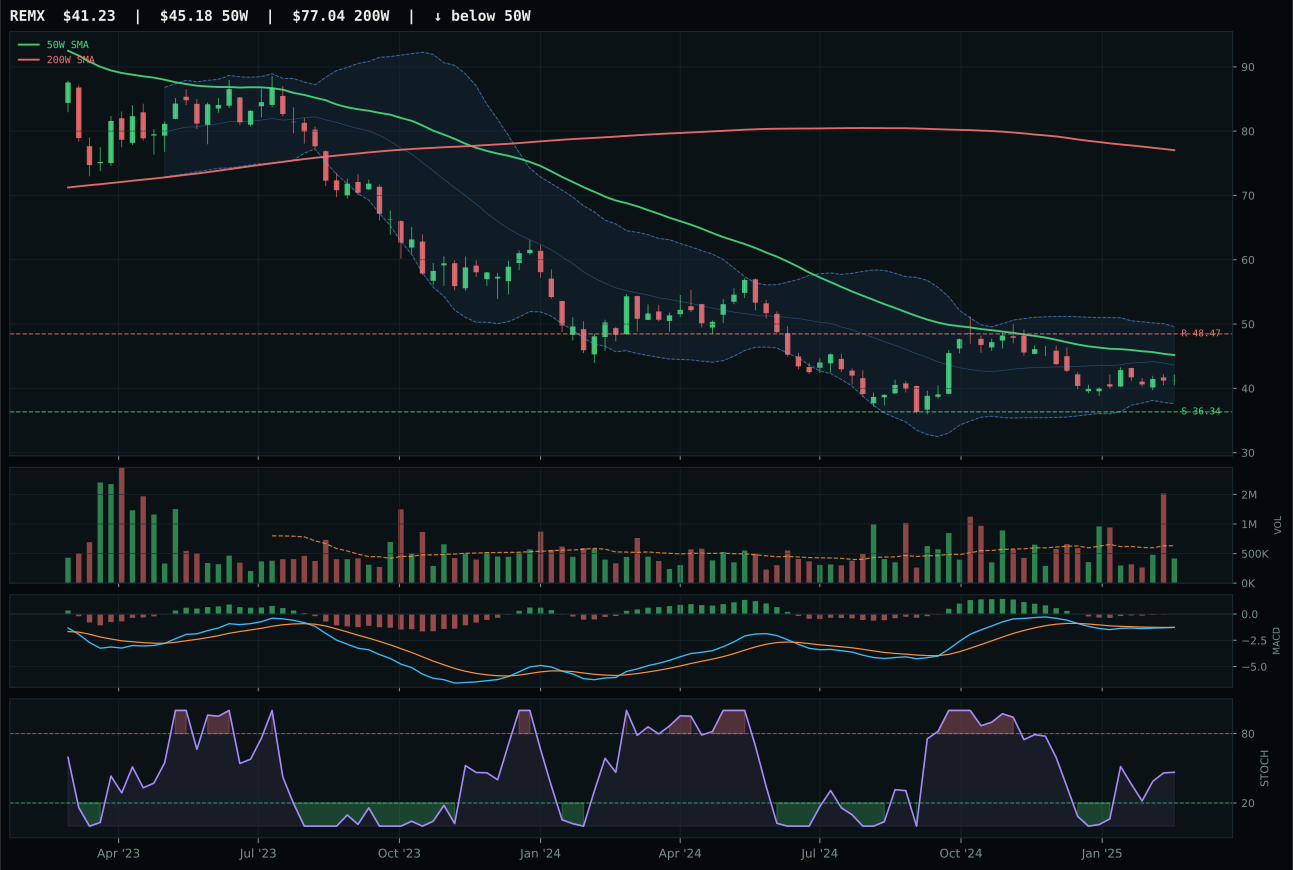
REMX has a neutral structure profile with -11.3% 13-week relative strength versus SPY.
Extension and support failure are the main tactical risks.
Tracked, but not top-2 eligible because: structurally broken.
COPX wins by winning the pullback setup against better timing than its peers, though this is a low-conviction victory. The copper ETF sits -9.8% from its 50W—deep enough into a repair zone to matter—with MACD bearish but improving and stochastic RSI rising mid-zone at 0.44. That configuration scores timing at 93, the highest in the basket, and risk/reward at 90 because the 2.9% downside to support 38.18 is trivial versus the -18.3% upside to resistance. PICK's timing scores only 75 because it remains at overbought stochastic momentum despite negative 13W returns, a bearish divergence that creates hard-filter rejection of structure. COPX's -7.8% 13W return is painful but paired with honest technicals; PICK's +0.7% return masking structural breakdown is worse. The 41.0-point gap is wide because PICK is structurally broken and COPX is merely weak—a vast difference for capital allocation.
Industrial Metals receives 0% allocation this week, ranked outside the portfolio entirely because its 10.8 composite score falls below the tier-3 cutoff and its macro fit of 35.0 offers no tailwind. Disinflation actively hurts metals (-6 at category level), and both liquidity stress (-8) and credit stress (-7) are headwinds. COPX's technical evidence of 56.7 is respectable—the timing score of 93 and risk/reward of 90 on the pullback setup are legitimate—but they cannot overcome a 43.0 macro fit that reflects zero category-specific support. This allocation is the portfolio's read that industrial metals lack both trend and macro sponsorship; the trade setup exists but does not justify capital commitment when Precious Metals offers 78.0 macro fit and Defense offers 51.0. For COPX to earn a 5% slot, either MACD would need to flip bullish (reducing the timing advantage and forcing a higher-risk entry) or disinflation pressure would need to reverse, neither of which is imminent.
Traditional Energy — XLE
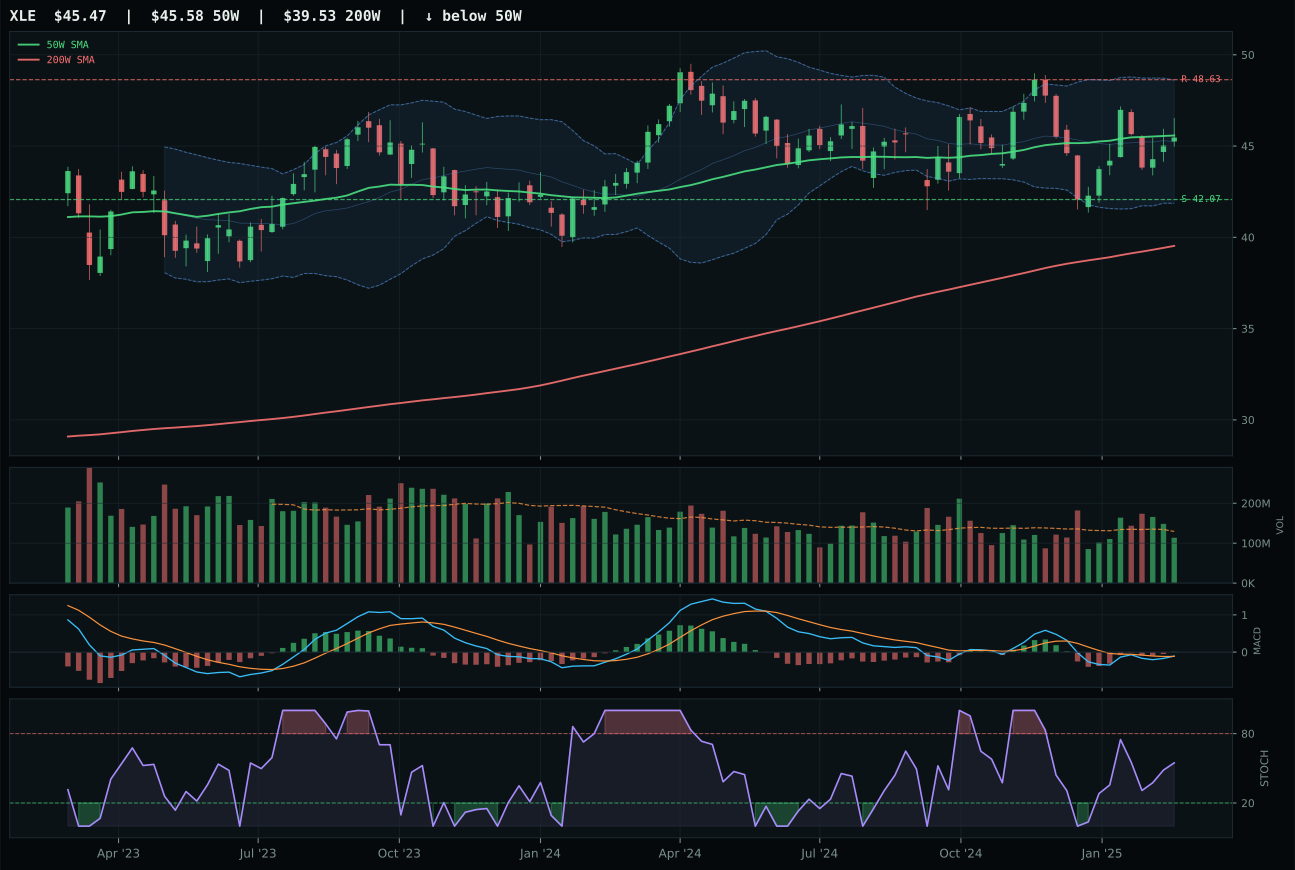
XLE has a compression near 50W profile with -7.3% 13-week relative strength versus SPY.
A failed hold above support would weaken the setup.
Actionable but governed by invalidation levels.
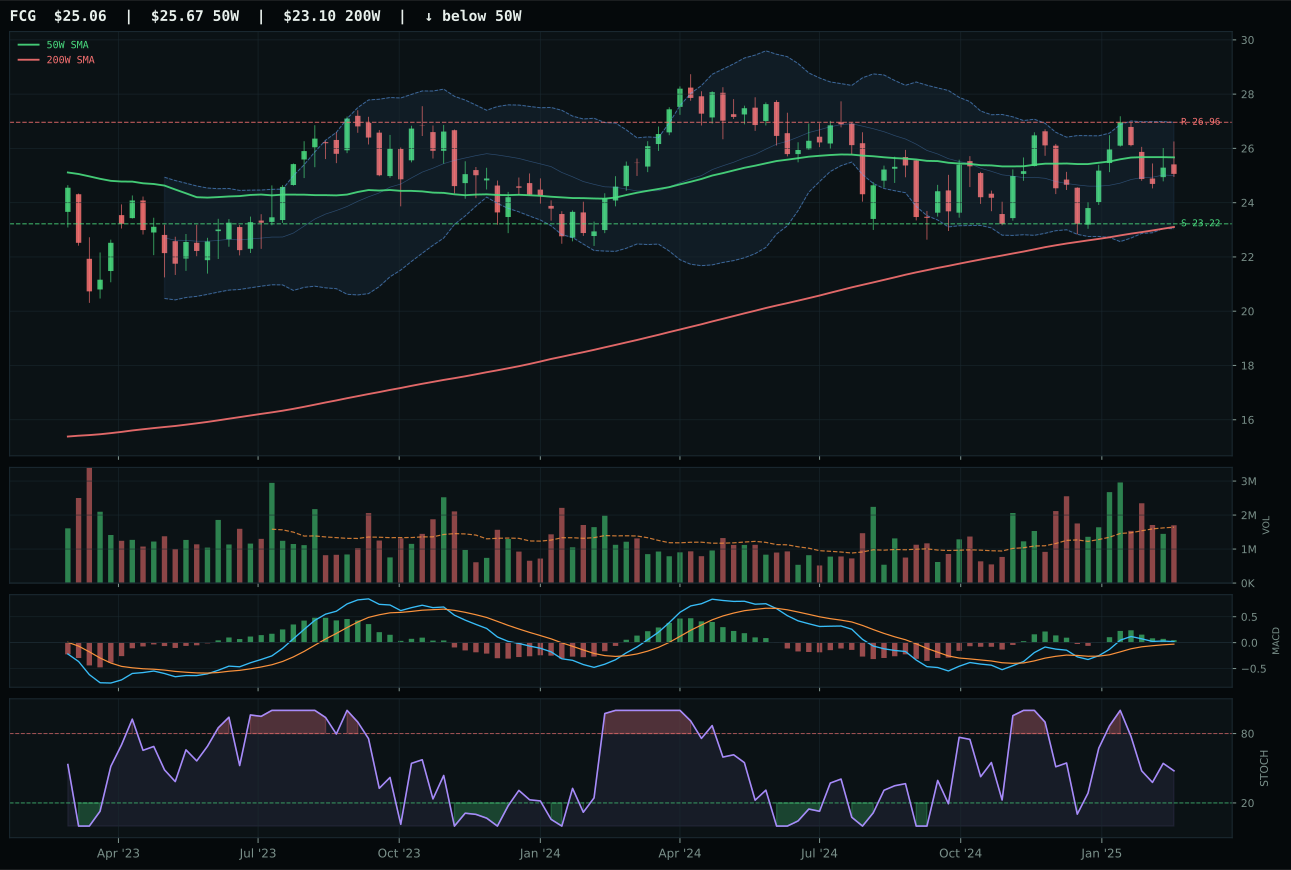
FCG has a compression near 50W profile with -6.1% 13-week relative strength versus SPY.
A failed hold above support would weaken the setup.
Actionable but governed by invalidation levels.
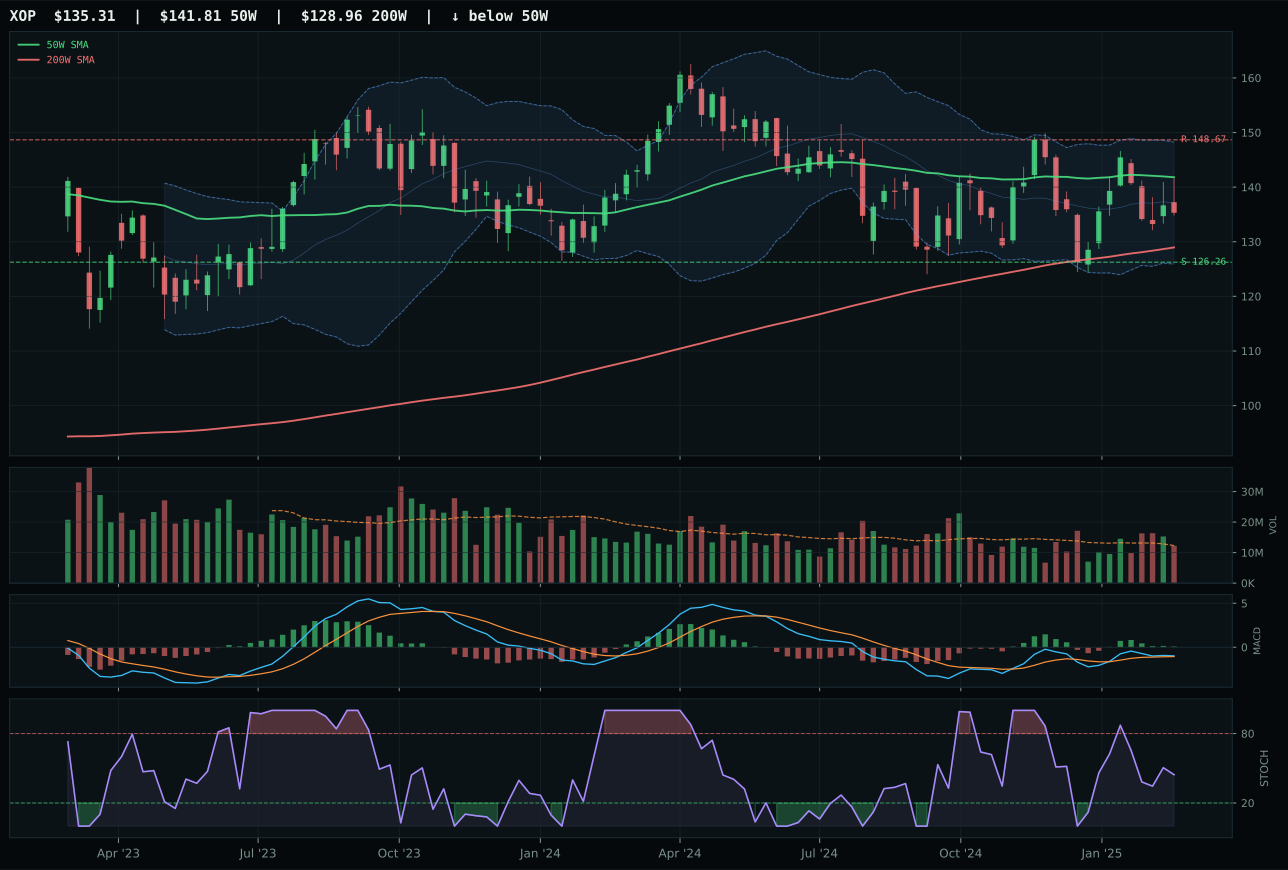
XOP has a neutral structure profile with -9.7% 13-week relative strength versus SPY.
A failed hold above support would weaken the setup.
Actionable but governed by invalidation levels.
XLE wins on pristine timing—price trades -0.2% from its 50W, the tightest setup in the category—with MACD bullish and improving and stochastic RSI rising mid-zone. The timing score of 100 reflects this compression near the moving average and the neutral Fibonacci location at Fib 0.786, a zone where mean reversion becomes actionable if volume confirms. Structure of 73.9 is clean for a near-50W setup, and risk/reward at 59.5 offers defined downside to 42.07 versus upside room. FCG loses on MACD confirmation: its MACD is bullish but flattening, losing momentum, whereas XLE's is bullish and improving. Structure score of 70.6 versus 73.9 is a narrow miss, but the MACD divergence is the decisive factor. The 3.8-point gap is tight because both setups are weak—this is a category where neither ETF is worth owning, but XLE's compression setup beats FCG's structurally flattening momentum.
Traditional Energy receives 0% allocation, excluded entirely from the portfolio on a 9.3 category score and a macro fit of only 16.0—by far the worst macro environment any category faces this week. Disinflation actively hurts energy (-10 at category level), and the disinflation pressure descriptor fires at -10, compounded by credit stress (-7) and liquidity stress (-7). Even XLE's perfect timing score of 100 cannot overcome a 70.5 technical evidence that is anchored by -6.5% 13W returns and -7.3% SPY-relative weakness. The portfolio is making a clear statement: energy is not a tactical bottom in disinflation; it is a strategic headwind. XLE's compression near 50W is a textbook mean-reversion setup, but one that works only if the macro narrative shifts. The threshold for adding this category back is either a break of disinflation pressure (requiring either inflation surprise or macro pivot) or a 5+ percentage point improvement in category-level macro fit—neither of which appears imminent.