
2025-02-14
Informational purposes only. The content in this report, including allocations, analysis, and commentary, is provided solely for informational and educational purposes. It does not constitute financial advice, investment advice, trading advice, or any other type of advice. Past performance does not guarantee future results. Always conduct your own research and consult a qualified financial professional before making investment decisions.
Weekly Allocation
| Ticker | Category | Weight | Role |
|---|---|---|---|
| FBTC | 50% | Overlay | |
| GLD | Precious Metals | 10% | Top-2 (10%) |
| XLU | Utilities & Infrastructure | 10% | Top-2 (10%) |
| CIBR | Technology | 5% | Tier-2 (5%) |
| AIQ | AI | 5% | Tier-2 (5%) |
| ITA | Defense & Aerospace | 5% | Tier-2 (5%) |
| NLR | Nuclear Energy | 5% | Tier-2 (5%) |
| IEMG | Emerging Markets | 5% | Tier-2 (5%) |
| COPX | Industrial Metals | 5% | Tier-2 (5%) |
Trade Instructions — Monday Open
Sell the tranche from 2025-01-17 (completing its 4-week hold). Buy the new tranche. Instructions show net portfolio changes — same-asset positions cancel, weight changes show the delta.
| Action | Ticker | Instruction |
|---|---|---|
| SELL | XLE | Sell 50% of XLE position (reduce 5.00% → 2.50%) |
| SELL | IGF | Sell entire IGF position (1.25% of portfolio) |
| SELL | XAR | Sell entire XAR position (1.25% of portfolio) |
| SELL | SMH | Sell entire SMH position (1.25% of portfolio) |
| BUY | ITA | Buy ITA — 20.00% of freed cash (adds 1.25% to portfolio) |
| BUY | XLU | Buy XLU — 40.00% of freed cash (adds 2.50% to portfolio) |
| BUY | AIQ | Buy AIQ — 20.00% of freed cash (adds 1.25% to portfolio) |
| BUY | IEMG | Buy IEMG — 20.00% of freed cash (adds 1.25% to portfolio) |
Current Portfolio After Trade
Combined holdings across all 4 active tranches. Each tranche is 25% of the portfolio.
| Ticker | % of Portfolio | Weight Bar |
|---|---|---|
| FBTC | 50.00% | |
| GLD | 8.75% | |
| ITA | 6.25% | |
| NLR | 5.00% | |
| CIBR | 5.00% | |
| XLU | 5.00% | |
| PAVE | 5.00% | |
| AIQ | 3.75% | |
| XLE | 2.50% | |
| COPX | 2.50% | |
| INDA | 2.50% | |
| BOTZ | 1.25% | |
| WEAT | 1.25% | |
| IEMG | 1.25% |
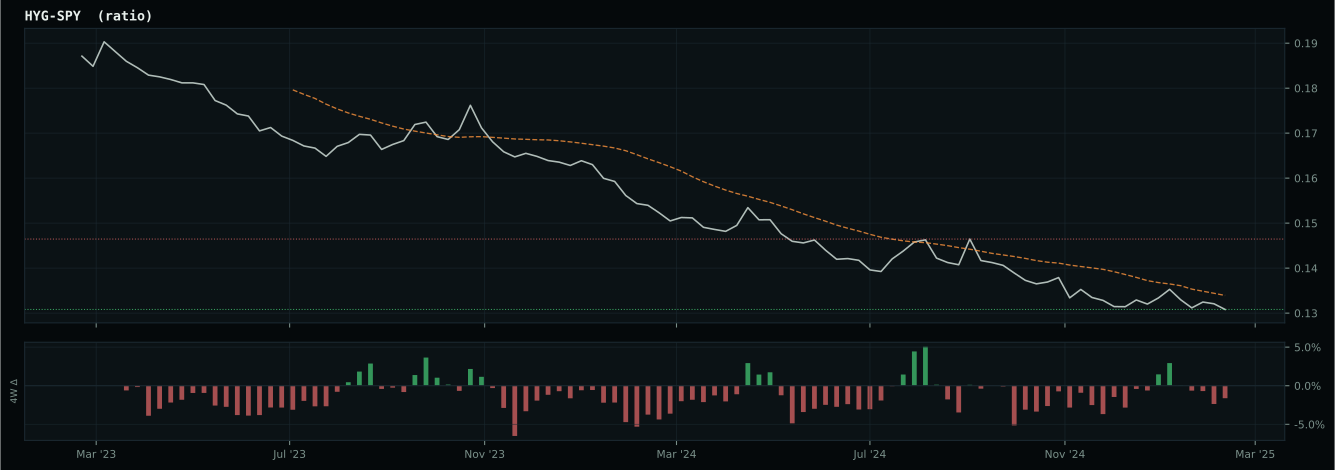
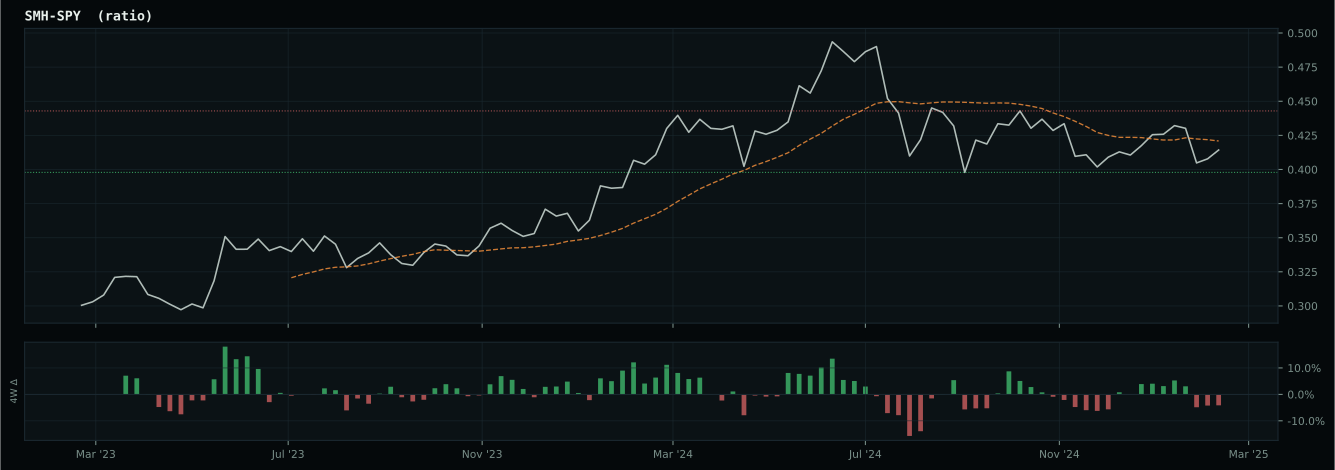
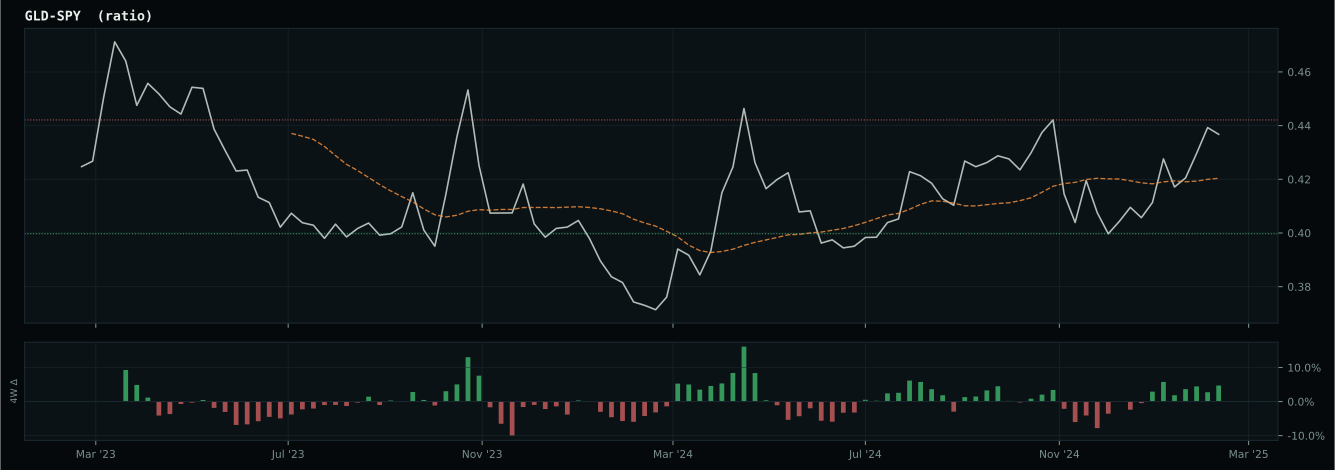
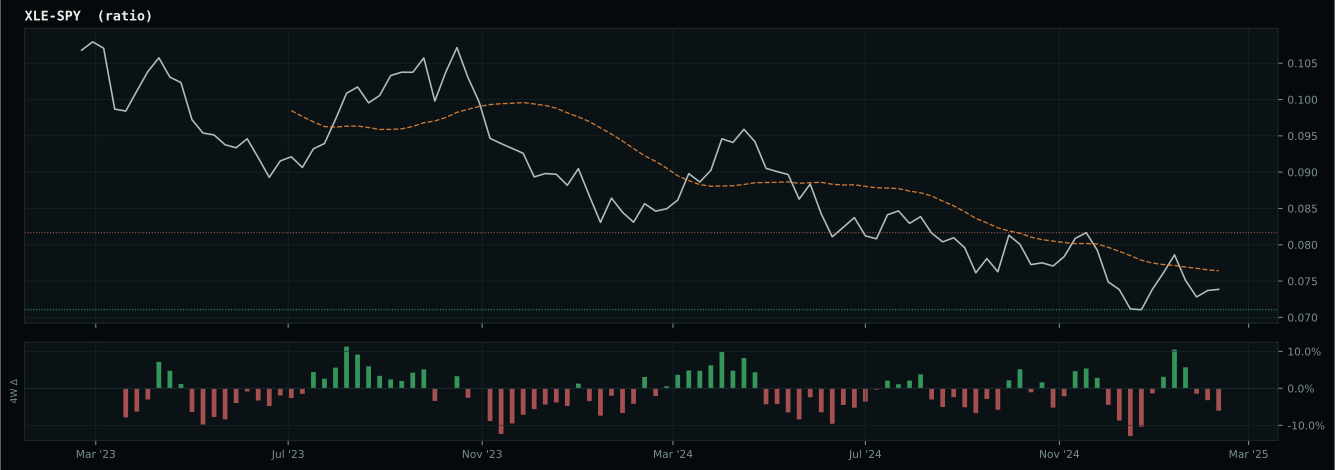
Macro Regime — Disinflation
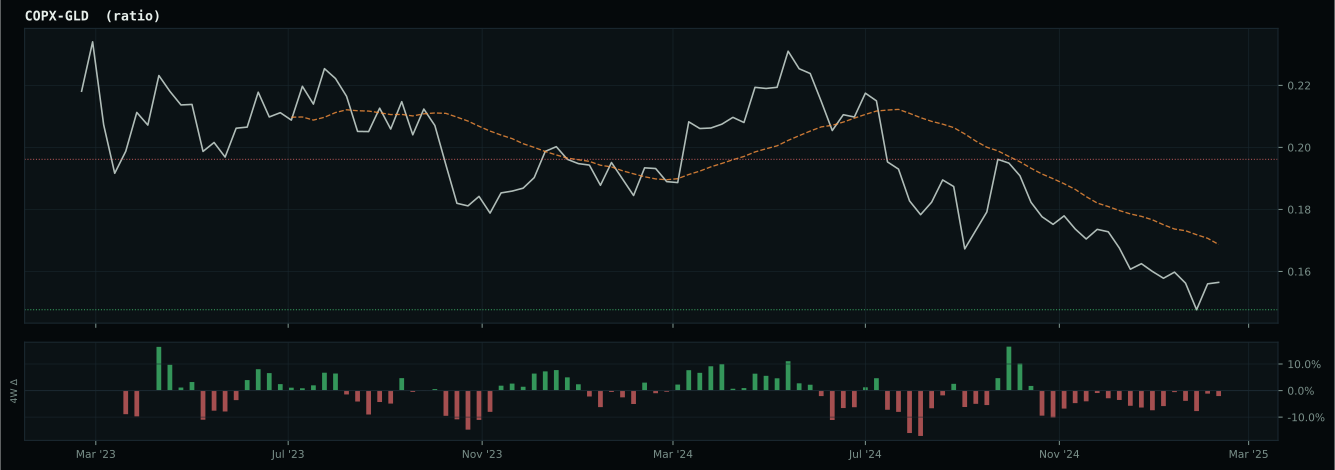
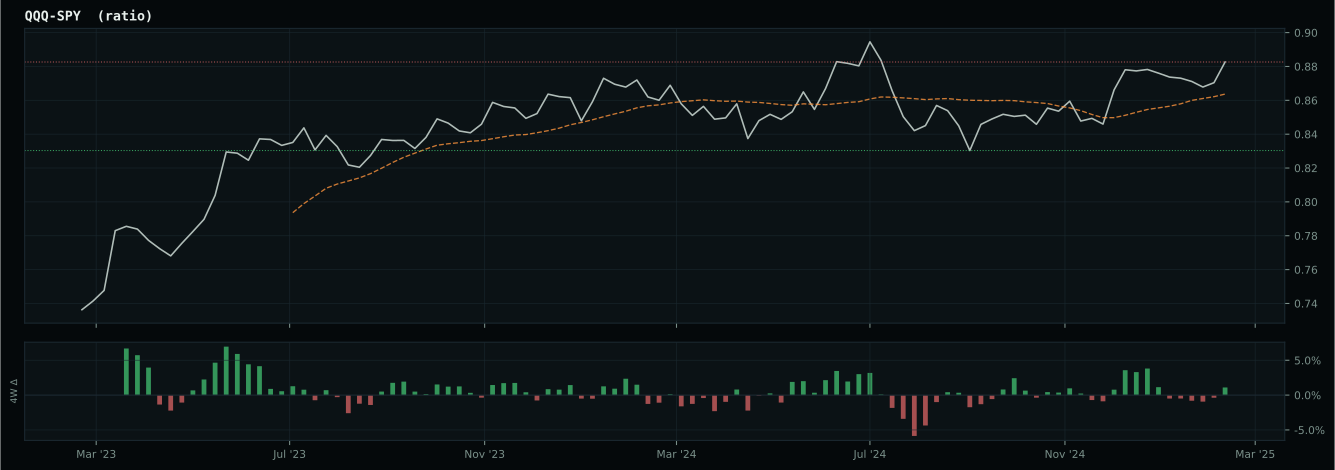
Macro Evidence Charts
Market-implied signals behind the macro regime scores. Each ratio compares two assets; the direction and slope of the ratio is what the macro engine reads.
Crypto Regime — TrendBTC
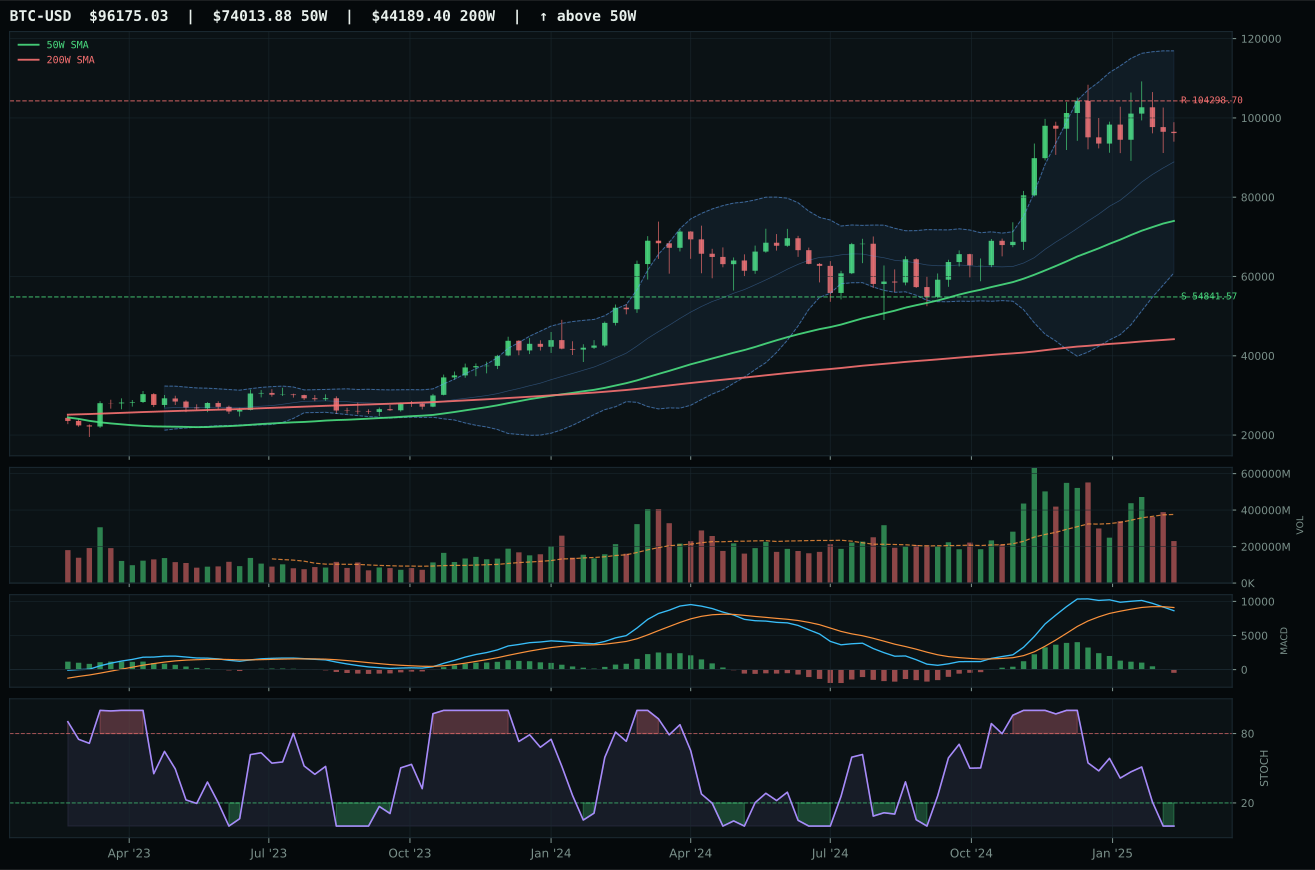
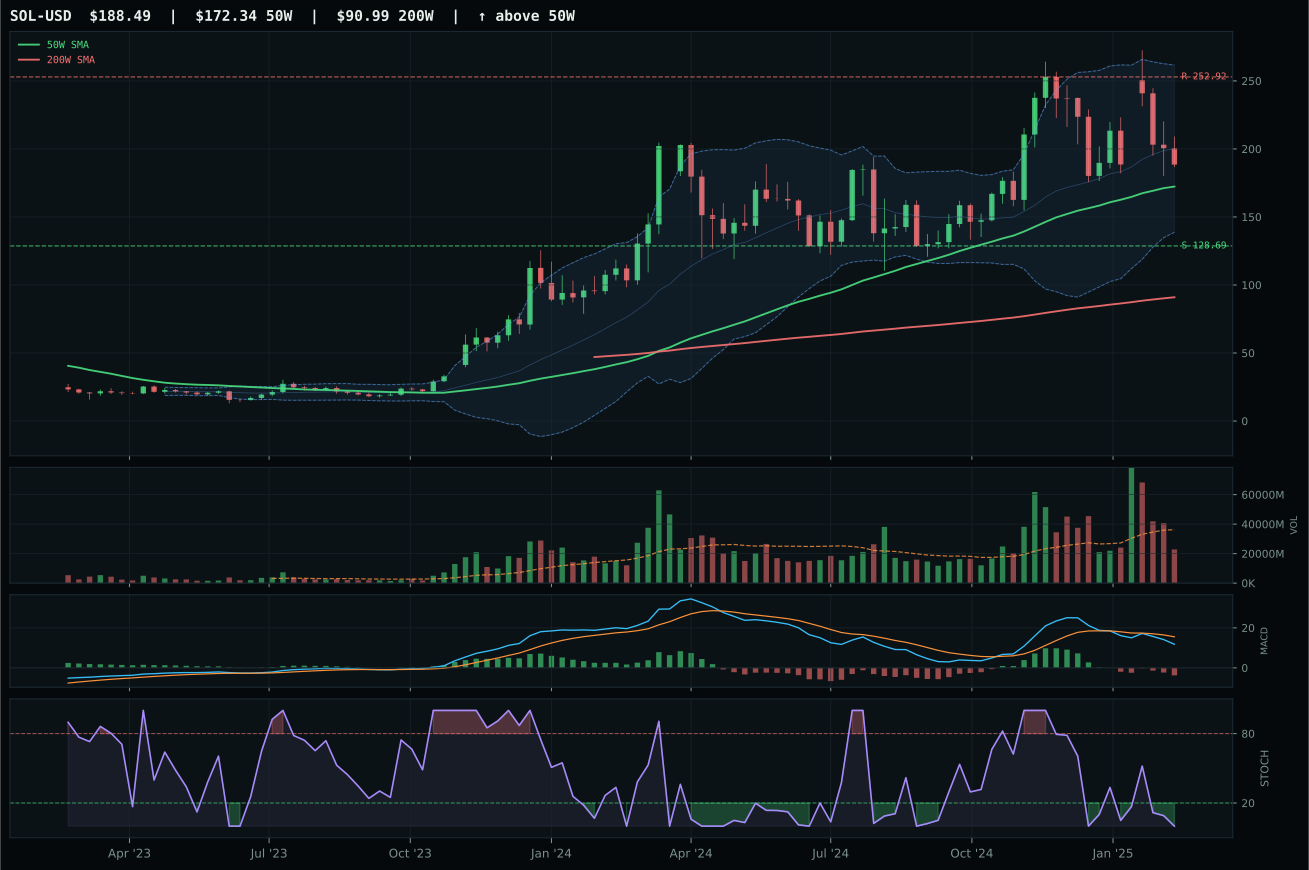
ValueBTC not armed: BTC has not made the first post-breakdown touch of the 200W buy zone after losing the 50W
TrendBTC confirmed: 2 consecutive closes above rising/flat 50W SMA
one or more available conditions failed
Category Rankings
| Rank | Category | Winner | Score | Alloc | 4W Ret | Peers (4W) |
|---|---|---|---|---|---|---|
| 1 | Precious Metals | GLD | 81.7 | 20% | +2.17% | GDX +5.3% · SLV +2.7% |
| 2 | Utilities & Infrastructure | XLU | 56.0 | 20% | -0.73% | IGF -0.4% · PAVE -9.5% |
| 3 | Technology | CIBR | 55.3 | 10% | -9.76% | IGV -14.5% · XLK -11.4% |
| 4 | AI | AIQ | 53.0 | 10% | -11.35% | BOTZ -10.8% · SMH -11.2% |
| 5 | Defense & Aerospace | ITA | 43.4 | 10% | -2.53% | XAR -5.2% · ROKT -8.1% |
| 6 | Nuclear Energy | NLR | 29.4 | 10% | -14.09% | URA -15.1% · URNM -12.0% |
| 7 | Emerging Markets | IEMG | 14.4 | 10% | -0.11% | INDA -0.6% · ILF -0.7% |
| 8 | Industrial Metals | COPX | 10.8 | 10% | -0.05% | PICK +0.9% · REMX +4.9% |
| 9 | Agriculture & Livestock | WEAT | 9.9 | 0% | -5.88% | VEGI -1.0% · MOO +0.9% |
| 10 | Traditional Energy | XLE | 7.0 | 0% | -0.90% | FCG -6.0% · XOP -7.4% |
Precious Metals — GLD
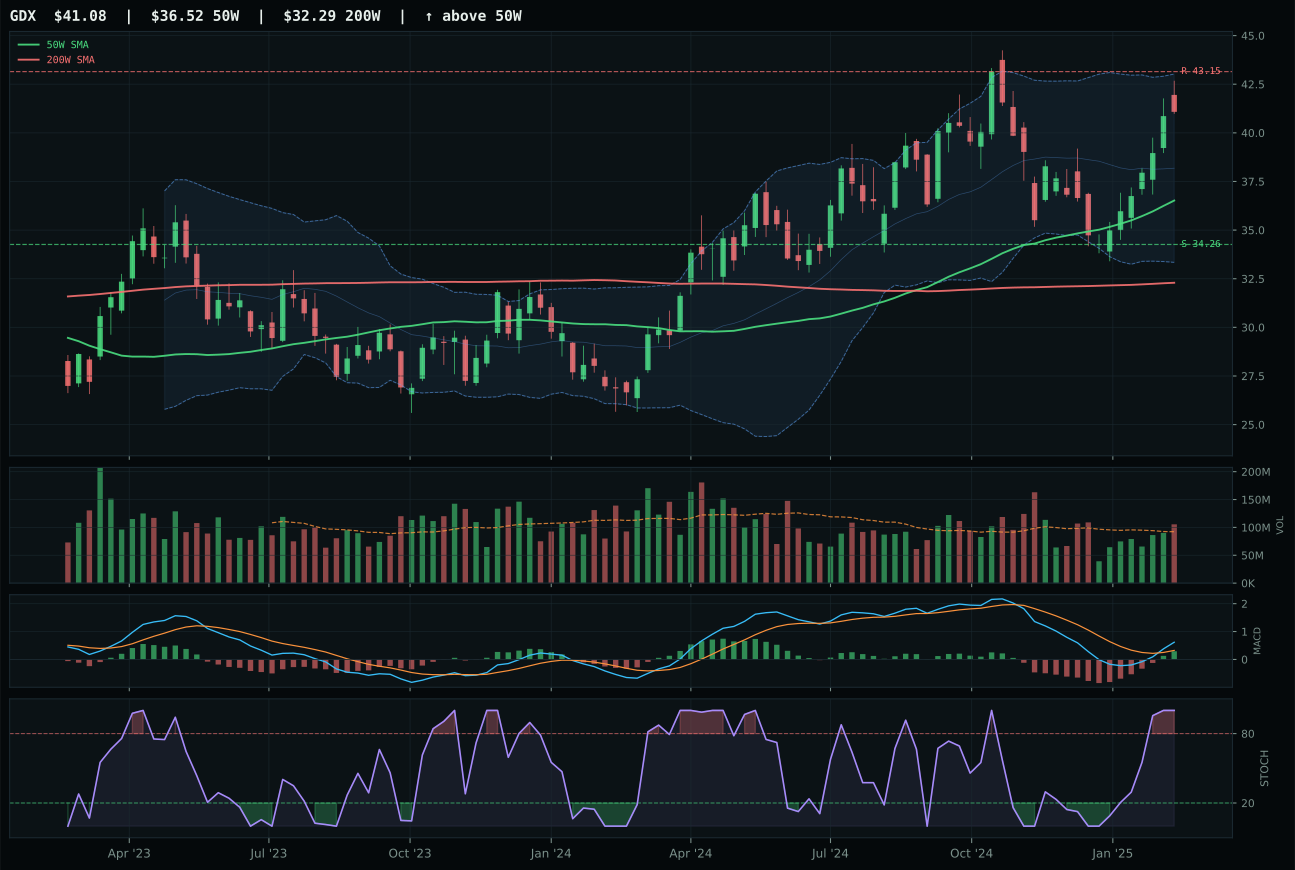
GDX has a neutral structure profile with 11.6% 13-week relative strength versus SPY.
A failed hold above support would weaken the setup.
Actionable but governed by invalidation levels.
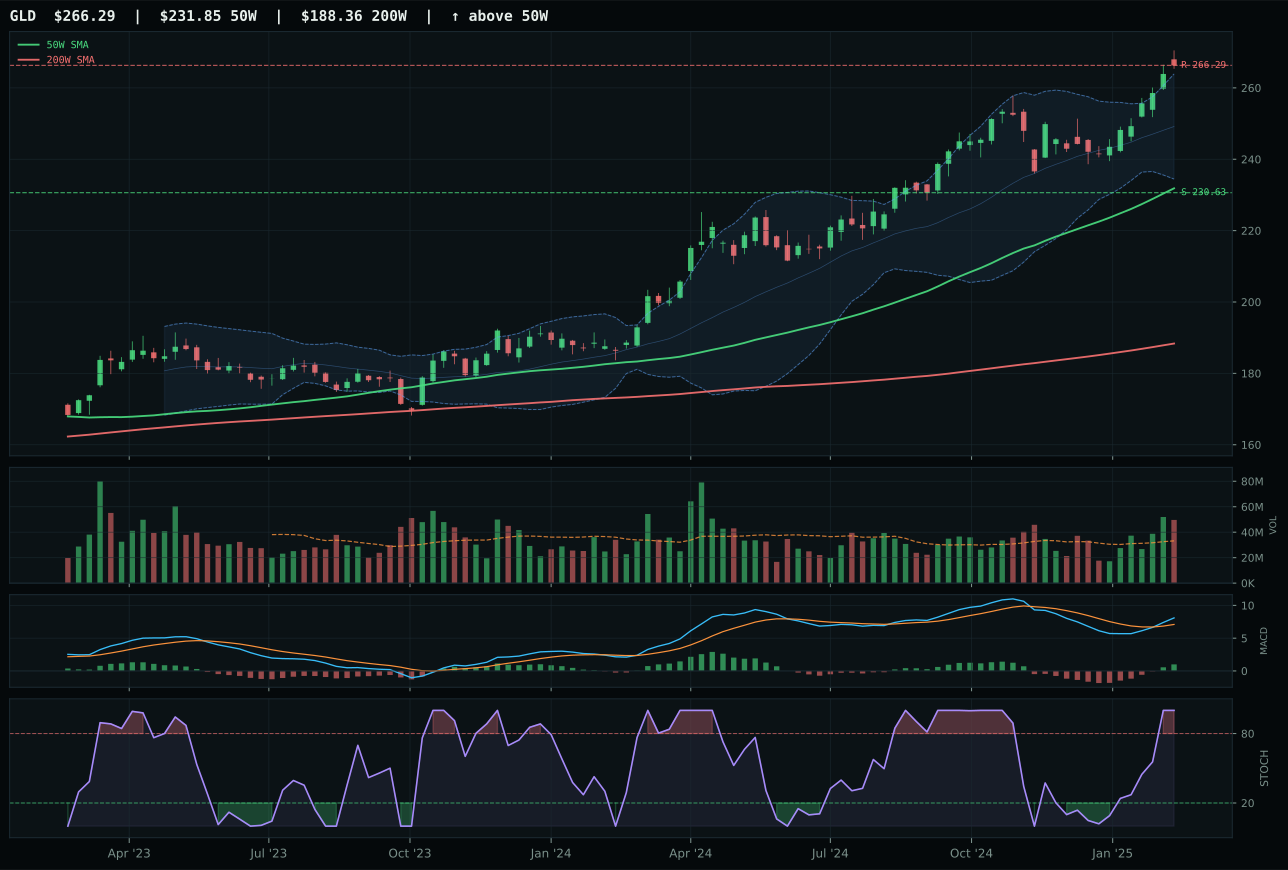
GLD has a neutral structure profile with 8.5% 13-week relative strength versus SPY.
A failed hold above support would weaken the setup.
Actionable but governed by invalidation levels.
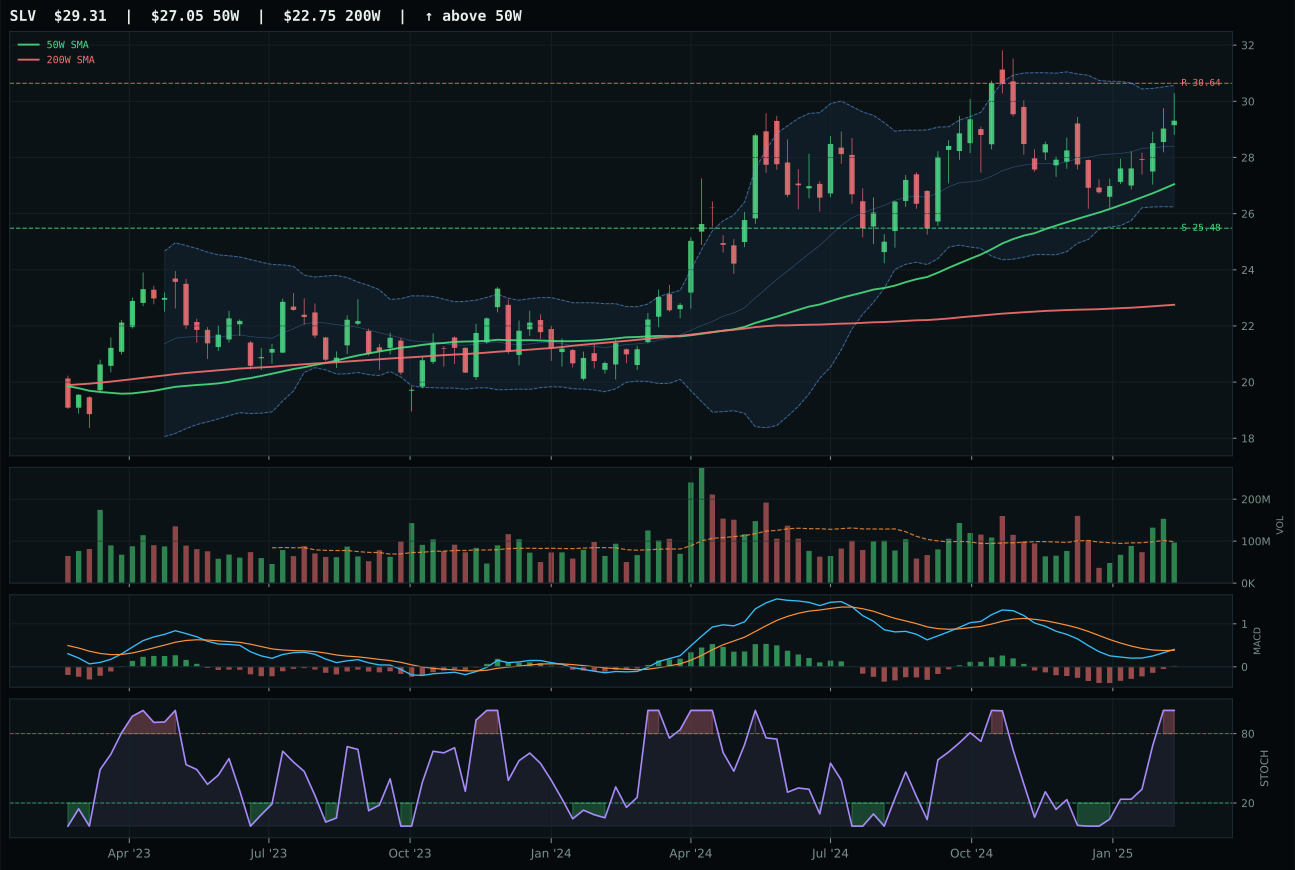
SLV has a neutral structure profile with 2.2% 13-week relative strength versus SPY.
A failed hold above support would weaken the setup.
Actionable but governed by invalidation levels.
GLD wins the precious-metals seat because its macro fit and technical evidence align cleanly. Price sits 14.9% extended above the 50W, a penalty, yet 12.6% thirteen-week returns, 8.5% relative strength versus SPY, and volume at 1.50x the twenty-week average confirm the extension is being accumulated. MACD is bullish and improving, stochastic RSI is overbought, and structure scores 80.6, suggesting clean price action without noise. GDX posts stronger technical evidence at 91.5 and superior thirteen-week returns of 15.7% with 11.6% relative strength versus SPY, but its structure is less clean at 75.2, a 5.4-point deficit that tips the decision. More importantly, GDX's macro fit is only 42.0 versus GLD's 72.0, because GDX carries higher sensitivity to liquidity and credit stress, while GLD's monetary hedge bid signal is pure and unencumbered.
Precious metals ranks top-2 at 10% allocation, driven by the highest category-level macro fit of 78.0 and a final score of 81.7 that reflects both disinflation pressure as active-plus-six and monetary hedge bid as active-plus-fourteen. This is the rare category where macro regime and technical breadth align completely. Disinflation reduces real yields, supporting gold's no-coupon carry, and monetary hedge bid signals a structural shift toward hard assets as inflation expectations reset. GLD's 100.0 trend score and 100.0 momentum confirmation provide the technical floor. The one tension is timing at 59.0, reflecting the 14.9% extension—every buyer from here is late to the party, and Fibonacci extension sits near 252 as an invalidation threshold. The allocation is correct, but position-sizing should account for the fact that reward-to-risk is compressed because entry risk is elevated. Any volume deterioration or MACD loss of improvement would justify profit-taking.
Utilities & Infrastructure — XLU
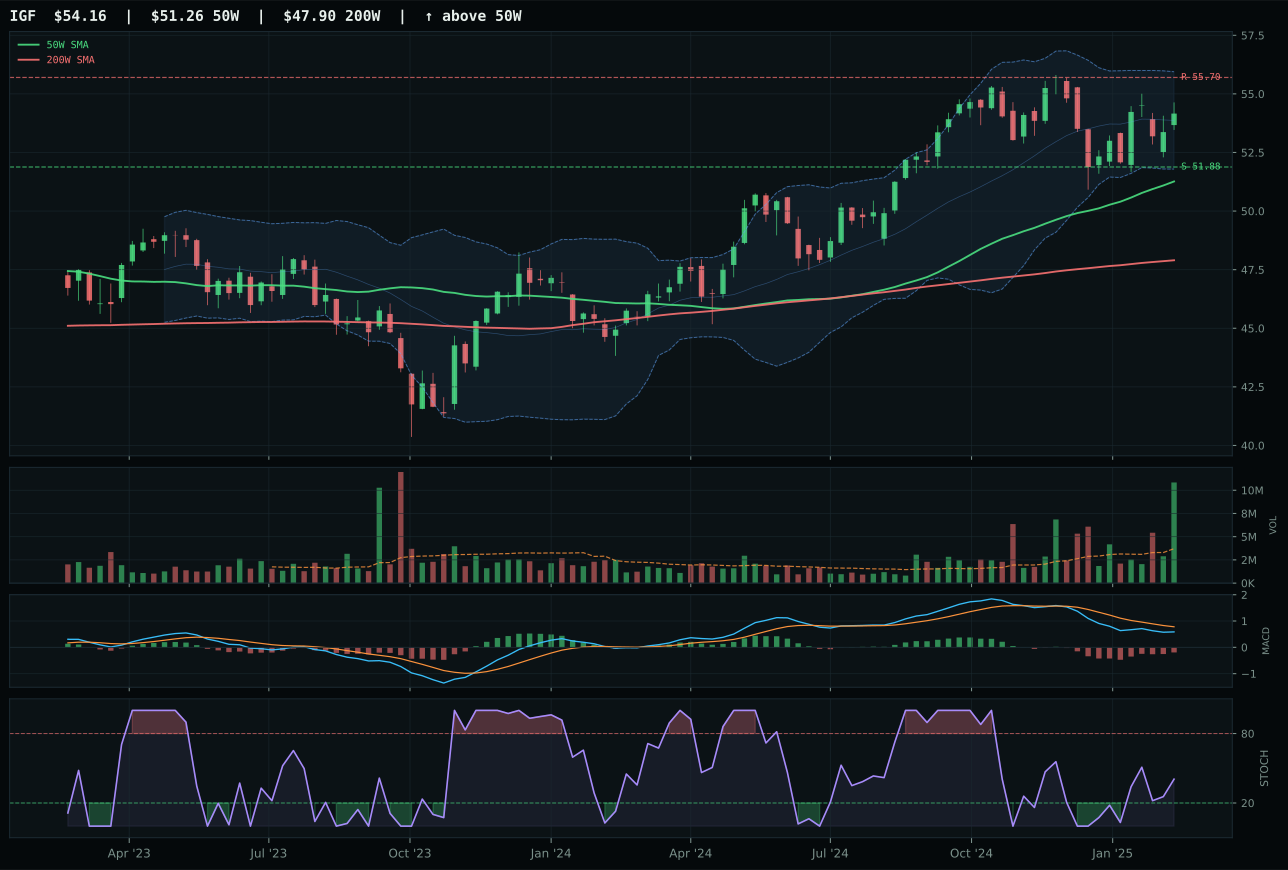
IGF has a pullback into support profile with -3.5% 13-week relative strength versus SPY.
A failed hold above support would weaken the setup.
Actionable but governed by invalidation levels.
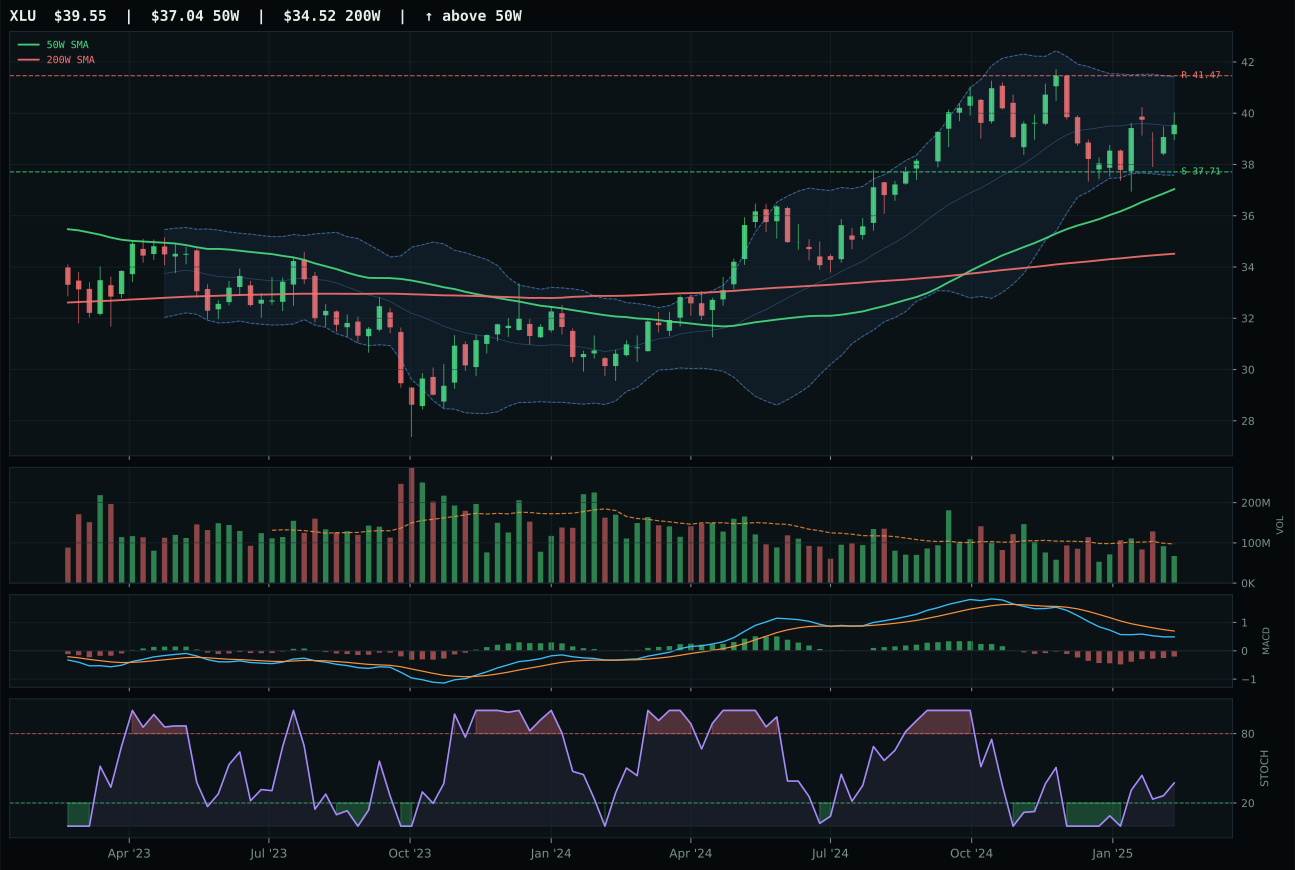
XLU has a pullback into support profile with -4.3% 13-week relative strength versus SPY.
A failed hold above support would weaken the setup.
Actionable but governed by invalidation levels.
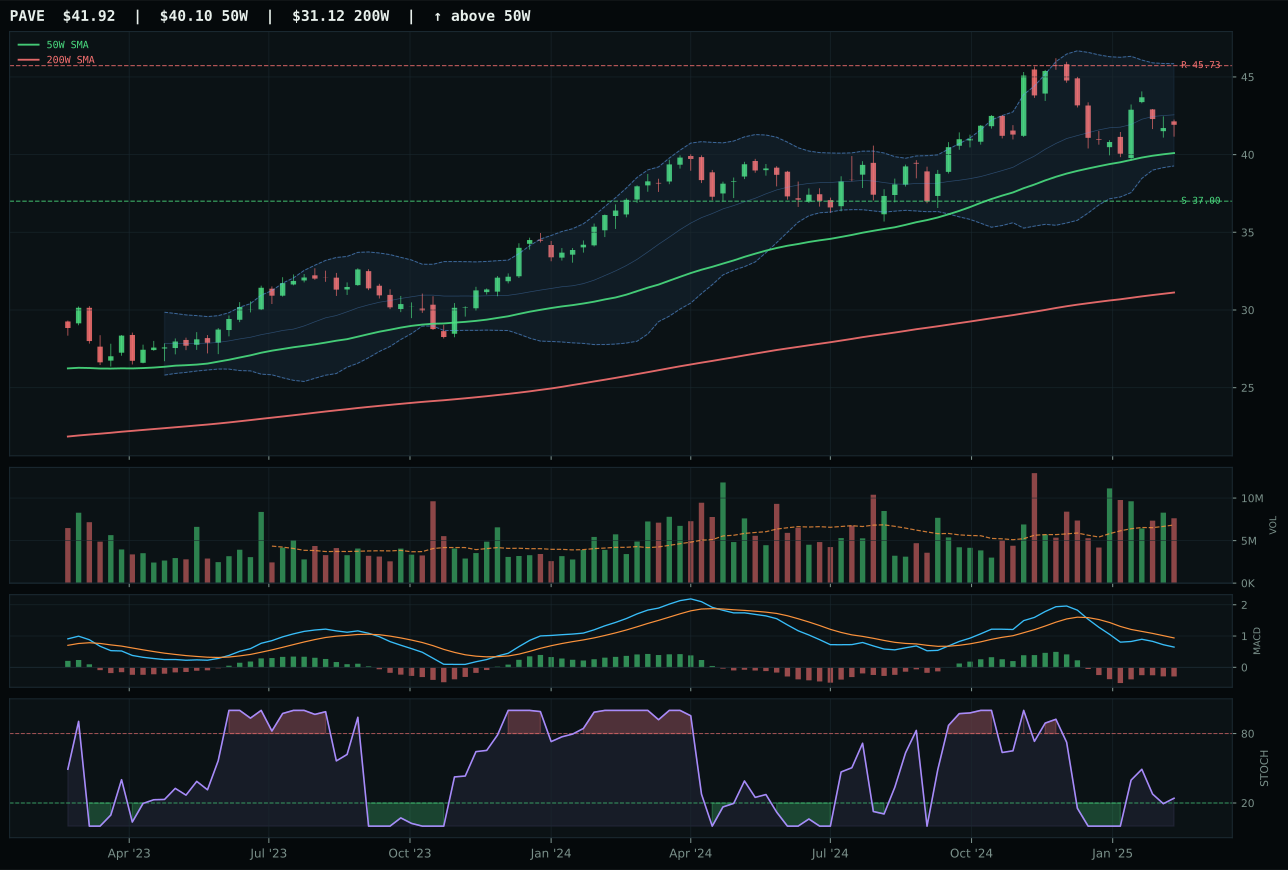
PAVE has a neutral structure profile with -8.4% 13-week relative strength versus SPY.
A failed hold above support would weaken the setup.
Actionable but governed by invalidation levels.
XLU earns the representative seat because it delivers the more durable trend argument in a category where absolute momentum is absent. Both XLU and IGF sit in pullback-into-support setups, yet XLU's 86.6 trend score reflects price above the 50W and 200W with a 0.5% slope intact, while IGF posts 88.0—a virtual tie. The deciding factor is risk-reward: XLU offers 62.0 versus IGF's 61.3, a marginal edge, yet it compounds with subtly weaker volume at 0.69x the average, which paradoxically signals patient accumulation rather than climactic interest. XLU's thirteen-week return of negative 0.2% and category-relative strength of 0.0% reflect its defensive character, not weakness. IGF's volume is stronger at accumulation-confirmation, but that volume arrives at a less-attractive risk-reward point.
Utilities & Infrastructure ranks top-2 at 10% allocation, driven by a 56.0 final score and a favorable category-level macro fit of 64.0. Disinflation helps this exposure at plus-seven, and disinflation pressure is active at plus-six, making regulated utilities and infrastructure the macro-appropriate defensive anchor. XLU's timing of 85.0 reflects its pullback-into-support structure with near 52W low near Fibonacci 0.786, a classic repair setup with defined invalidation. The tension is momentum: forty-point confirmation reflects zero thirteen-week returns, and volume-price confirmation at 53.3 signals deteriorating sponsorship. This is a regime-driven allocation, not a momentum allocation. The position is correct given disinflation tailwinds, but it requires vigilance to ensure support at 37.71 holds. Any volume collapse or break below 37.71 would justify tactical reduction despite strong macro thesis.
Technology — CIBR
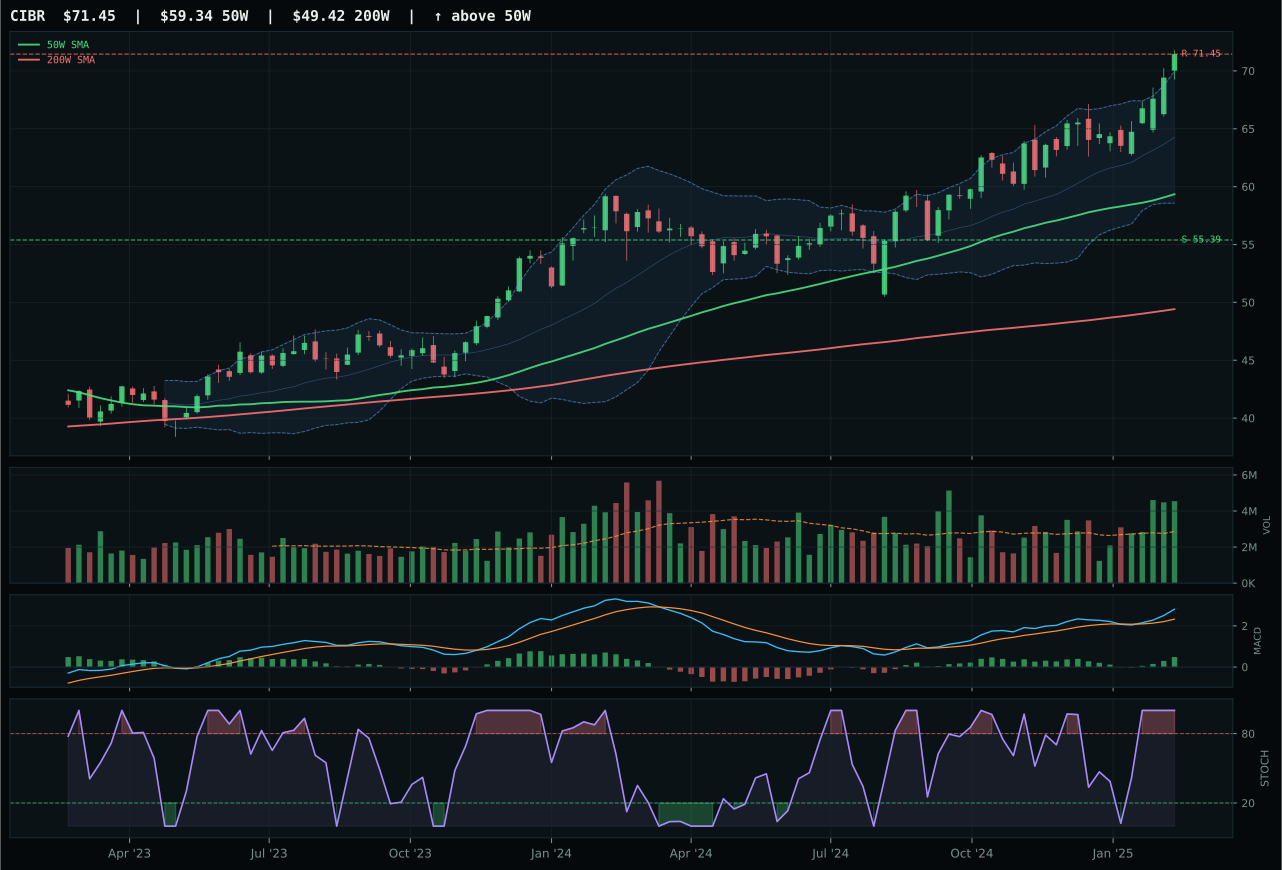
CIBR has a vertical extension profile with 12.2% 13-week relative strength versus SPY.
A failed hold above support would weaken the setup.
Actionable but governed by invalidation levels.
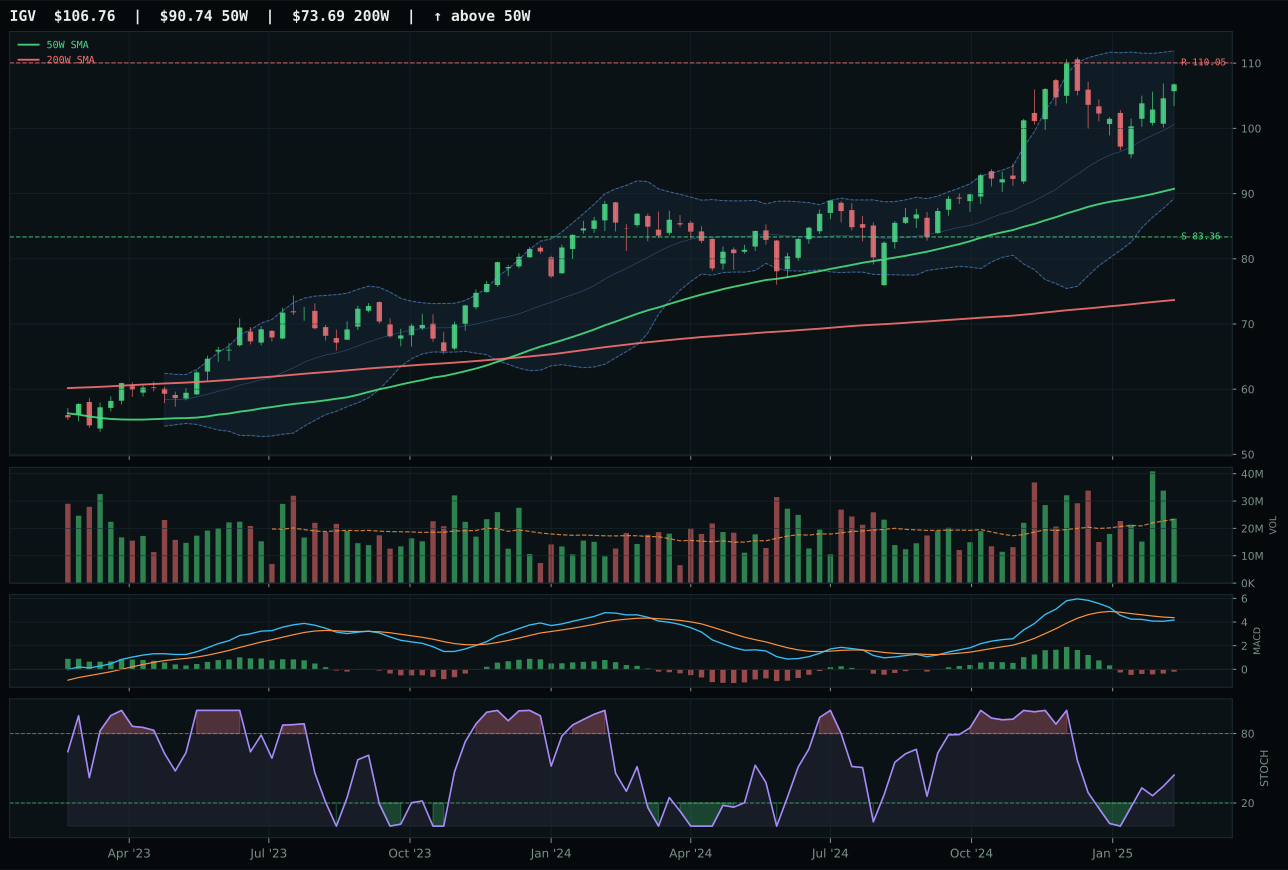
IGV has a vertical extension profile with 1.5% 13-week relative strength versus SPY.
A failed hold above support would weaken the setup.
Actionable but governed by invalidation levels.
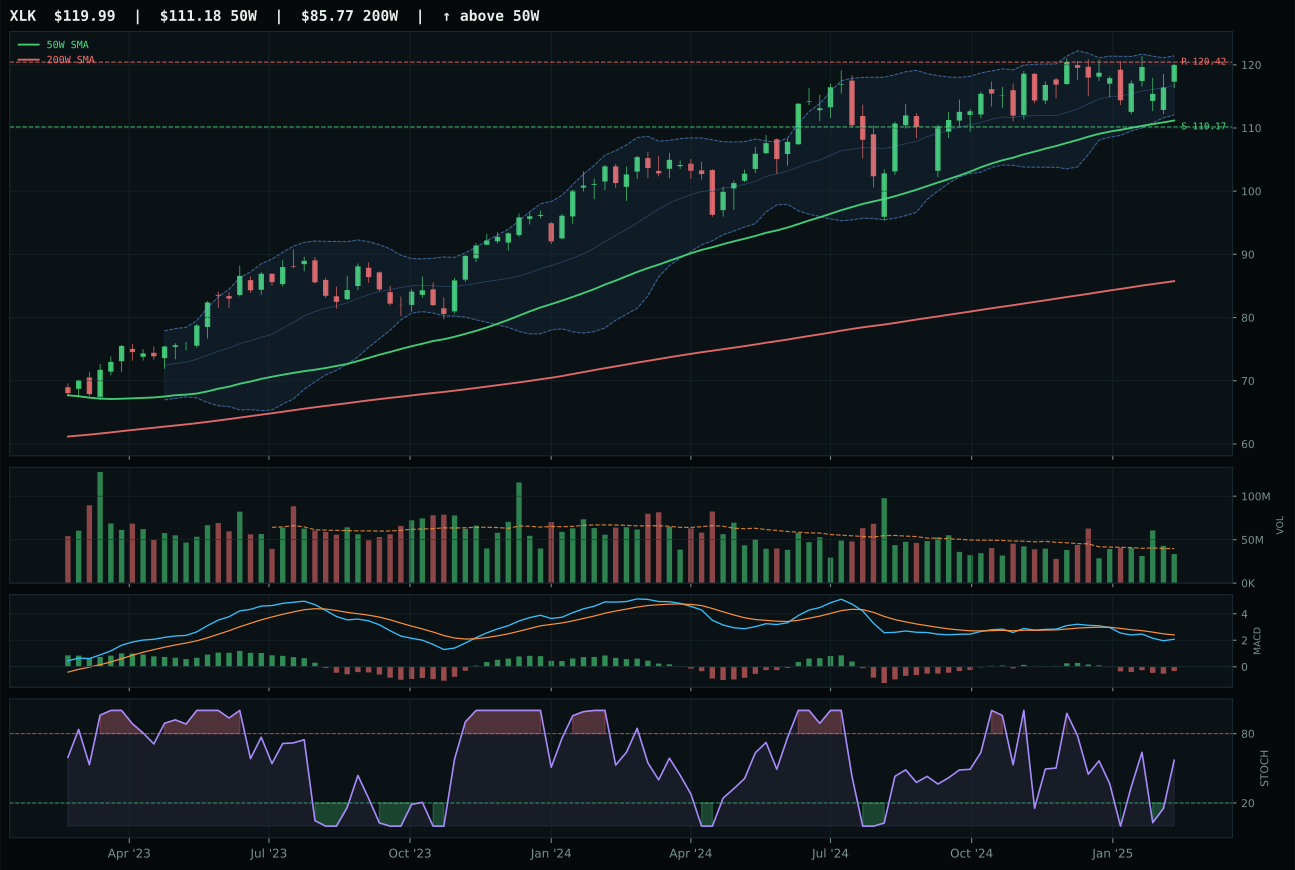
XLK has a neutral structure profile with 0.8% 13-week relative strength versus SPY.
A failed hold above support would weaken the setup.
Actionable but governed by invalidation levels.
CIBR captures the category because cybersecurity sits at the intersection of trend strength and volume confirmation that IGV cannot match. Price is 20.4% extended above the 50W, a penalty for entry risk, yet the 16.3% thirteen-week return and 12.2% relative strength versus SPY tell you the tape is accepting higher prices as legitimate. Volume at 1.59x the twenty-week average confirms accumulation rather than distribution, and MACD is bullish and improving—the trio of signals that separates a chase from a conviction. IGV's MACD remains bearish despite improvement, its volume is neutral, and category-relative strength of 0.0% means it's being left behind inside its own three-ETF basket. The setup gap between them is 8.2 points on the composite score, a decisive margin.
Technology ranks 5% in tier-2 allocation, a position it holds despite a 55.3 final category score that trails two higher-ranked alternatives. The disinflation macro regime provides modest tailwind at plus-seven points, yet both liquidity stress and credit stress are active negatives that collectively pull the category down to a 45.0 macro-fit score. CIBR's technical evidence is pristine at 100.0, enough to carry the category representative, but the macro headwinds—particularly liquidity stress at negative-ten—prevent this category from ascending into top-2 territory. The allocation stands because cyclical growth with strong relative momentum still merits a position when the regime shifts, but conviction remains conditional. Watch for volume to persist and MACD to avoid deterioration; any slip in breadth will justify reallocation to higher-ranked alternatives.
AI — AIQ
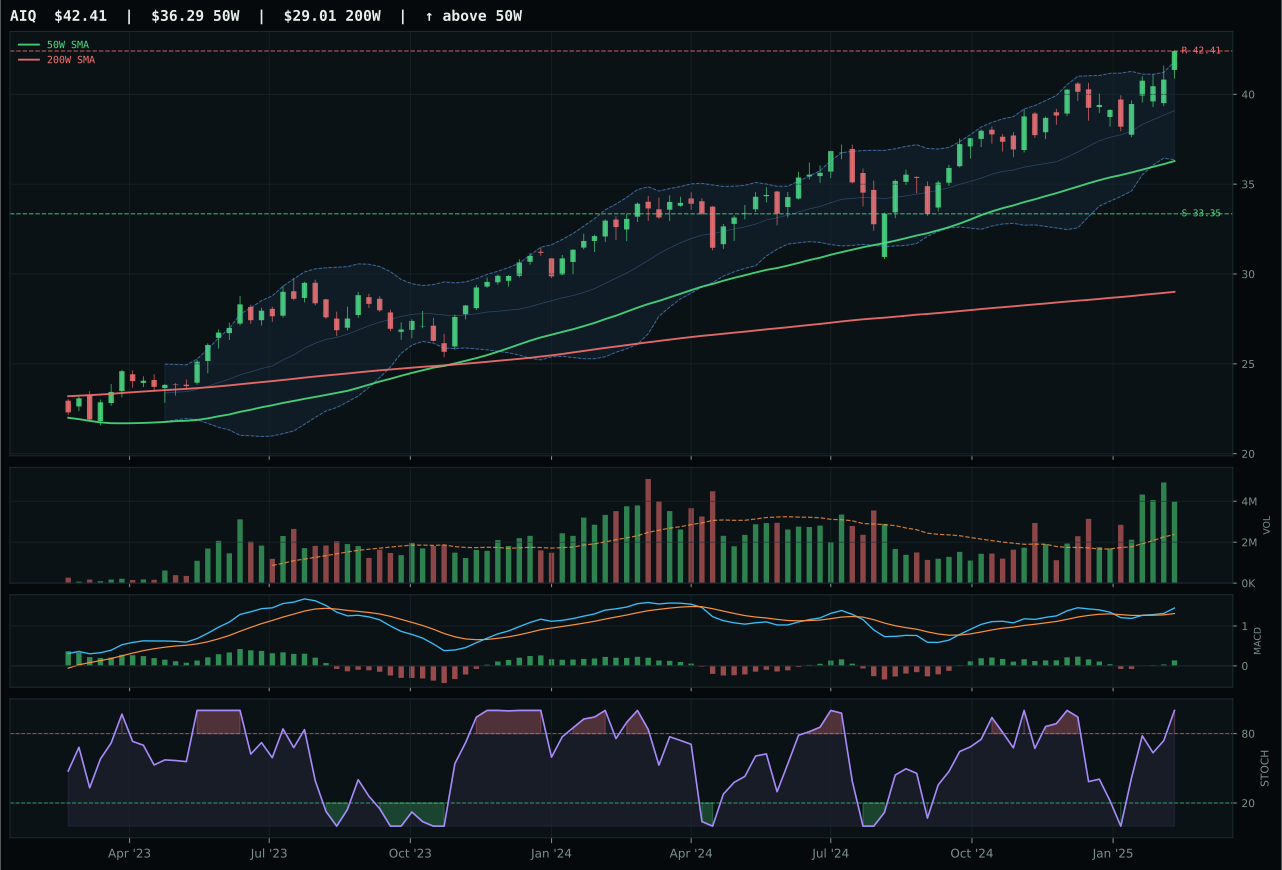
AIQ has a vertical extension profile with 8.3% 13-week relative strength versus SPY.
A failed hold above support would weaken the setup.
Actionable but governed by invalidation levels.
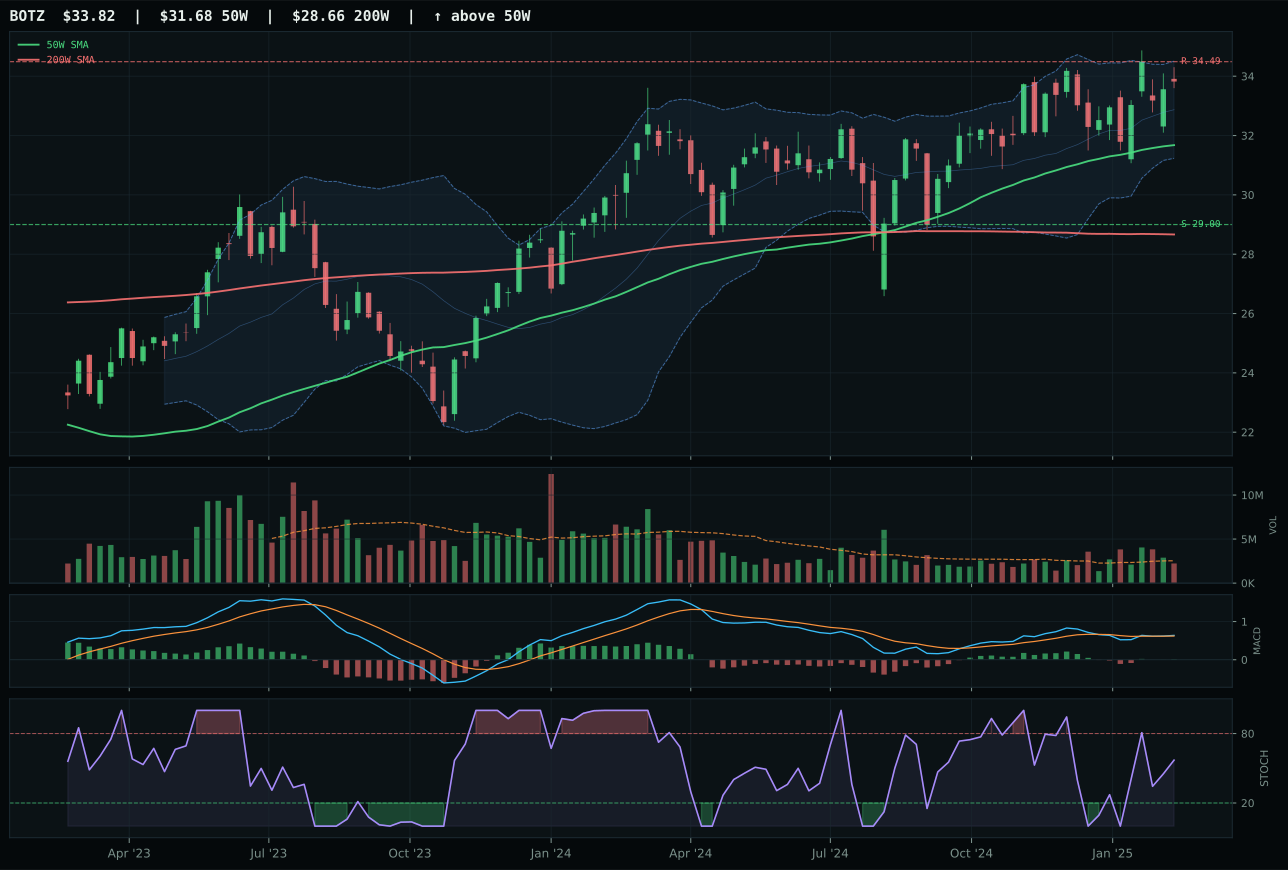
BOTZ has a neutral structure profile with 1.2% 13-week relative strength versus SPY.
A failed hold above support would weaken the setup.
Actionable but governed by invalidation levels.
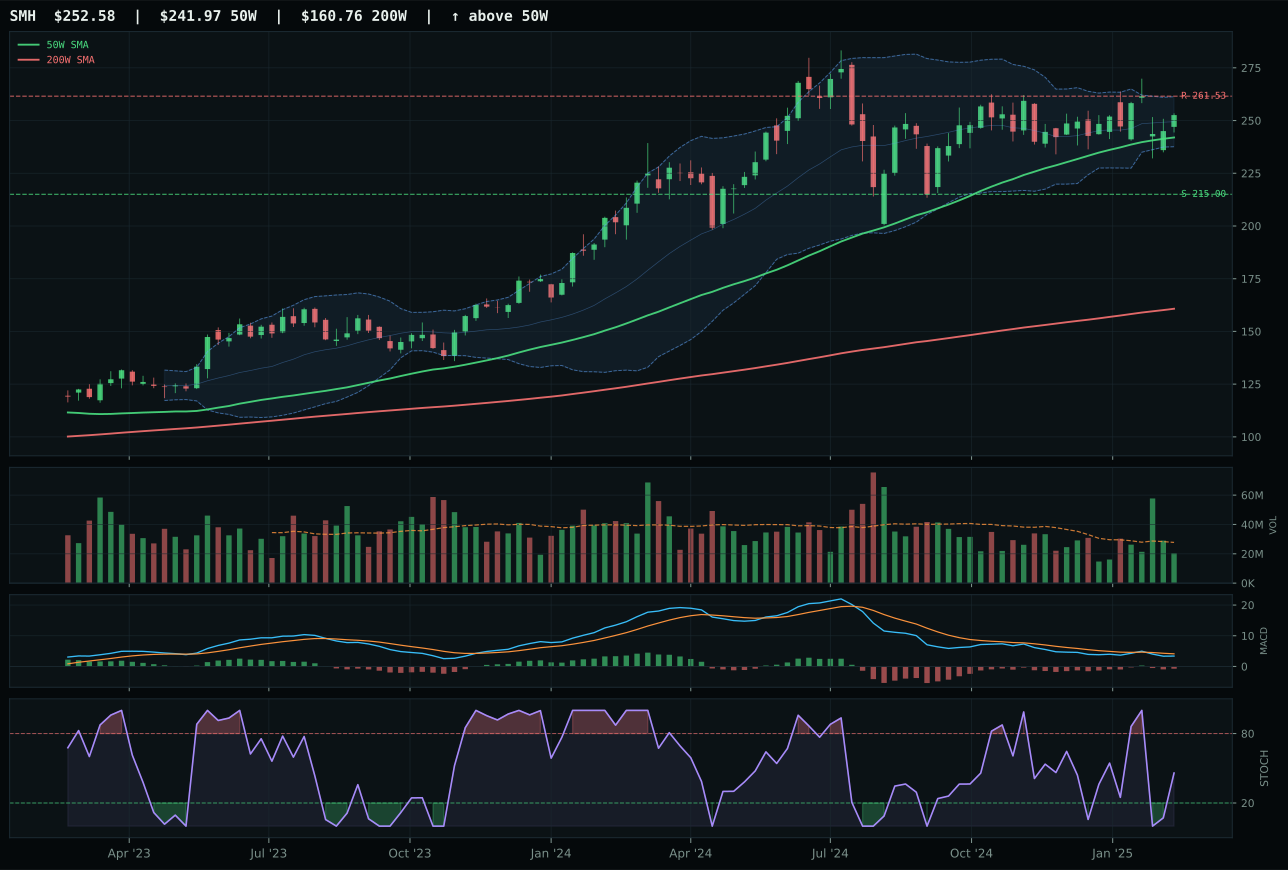
SMH has a neutral structure profile with 1.2% 13-week relative strength versus SPY.
A failed hold above support would weaken the setup.
Actionable but governed by invalidation levels.
AIQ edges out BOTZ by the narrowest margin—a mere 1.5 composite points—because vertical extension is paired with cleaner internal structure and category-relative leadership. The 16.9% extension above the 50W mirrors CIBR's penalty, yet 8.3% relative strength versus SPY and 7.1% relative strength inside its three-ETF basket prove the breadth is holding. Volume at 1.67x the twenty-week average confirms accumulation, and MACD is bullish and improving, creating a three-point technical advantage. BOTZ shows bullish MACD and overbought stochastic RSI, but its setup is neutral structure rather than vertical, its thirteen-week return of 5.3% trails AIQ's 12.4%, and category-relative strength sits at zero. The margin is tight, but margin matters when capital is scarce.
AI receives 5% allocation as tier-2, positioned below two higher-ranked categories despite a 53.0 final score that reflects strong technical evidence of 80.4 for the representative. Liquidity stress and credit stress are both active drags, combining for negative-twelve points, while disinflation pressure provides only a plus-five offset. The category-level macro fit of 35.0 reflects this unfavorable confluence—the current regime penalizes duration-sensitive narratives, and emerging-market growth dependence amplifies credit-stress sensitivity. AIQ's technical setup is solid and its volume-price confirmation ranks in the top tier, but macro timing is working against sector leadership. The allocation preserves exposure to AI secular demand while acknowledging that the macro cycle favors defensive and commodity-linked alternatives. Reallocation upward requires either macro-descriptor improvement or a fresh extension in relative strength that justifies overweighting despite headwinds.
Defense & Aerospace — ITA
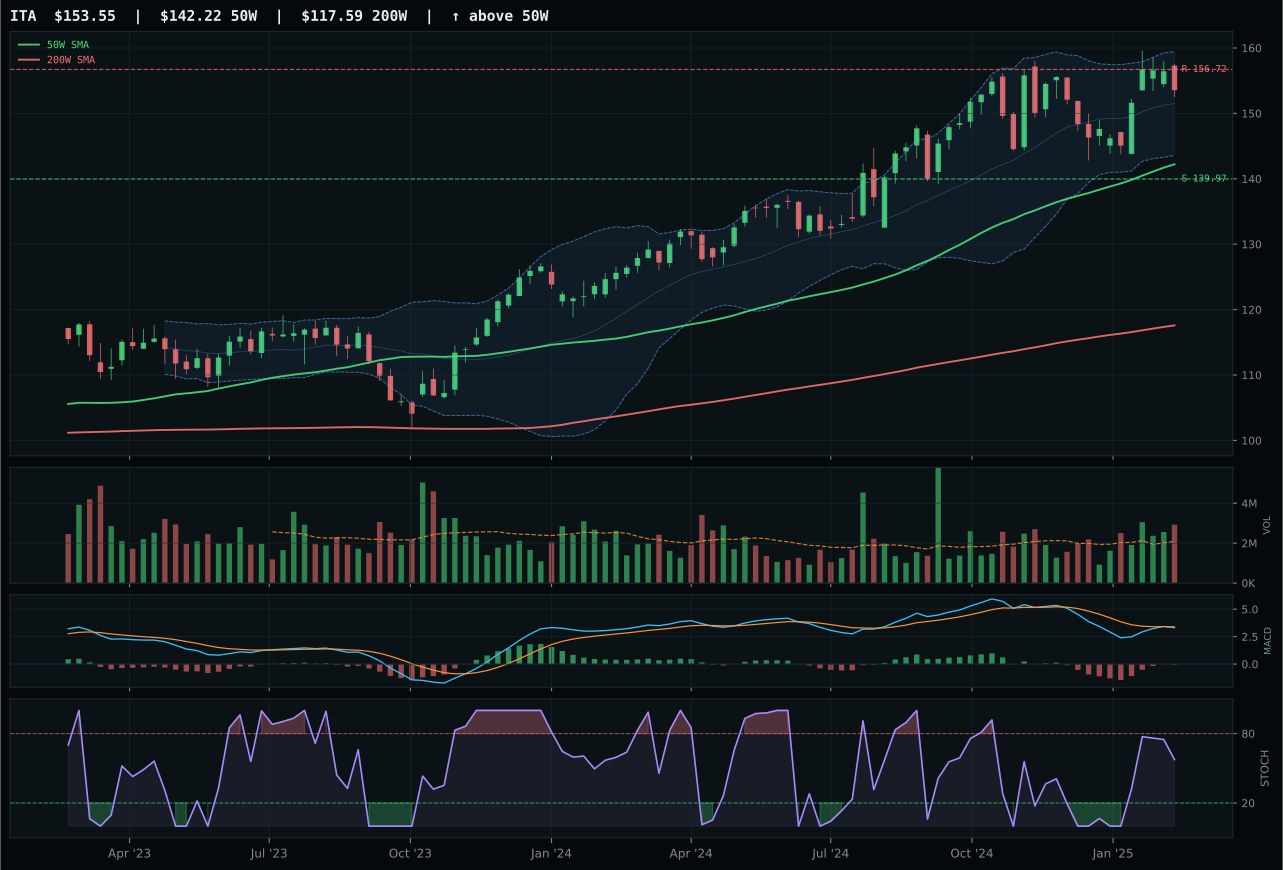
ITA has a neutral structure profile with -1.8% 13-week relative strength versus SPY.
A failed hold above support would weaken the setup.
Actionable but governed by invalidation levels.
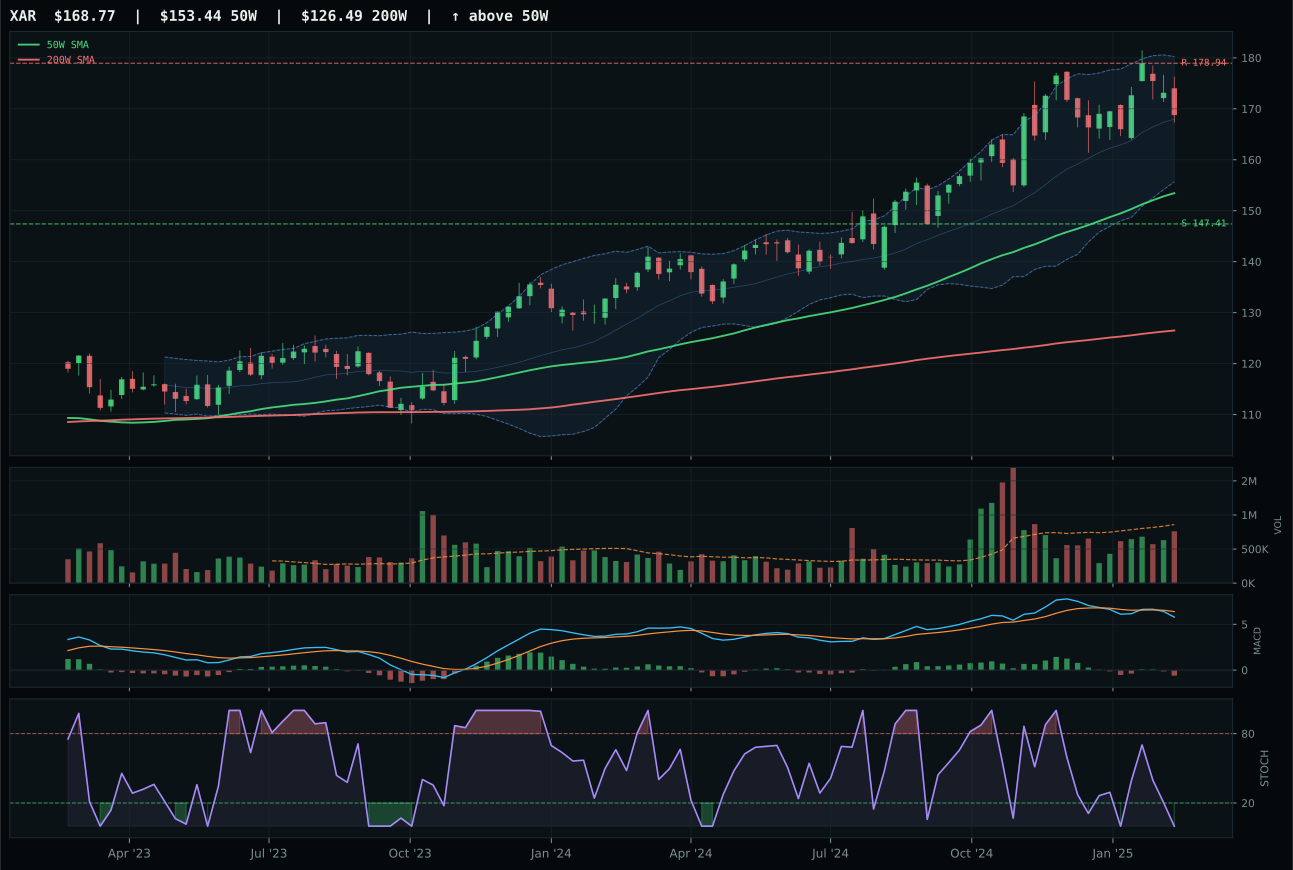
XAR has a neutral structure profile with -1.6% 13-week relative strength versus SPY.
A failed hold above support would weaken the setup.
Actionable but governed by invalidation levels.
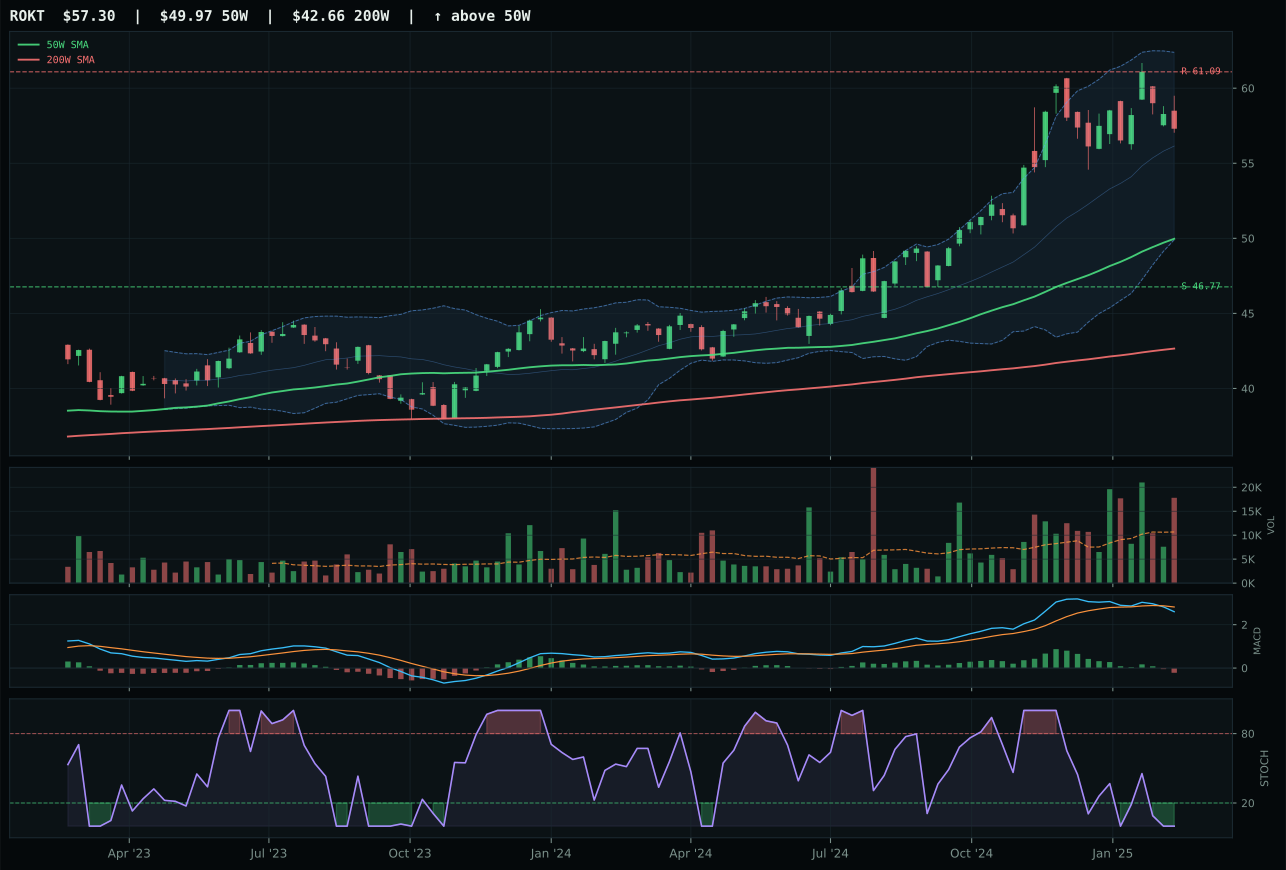
ROKT has a neutral structure profile with 0.6% 13-week relative strength versus SPY.
A failed hold above support would weaken the setup.
Tracked, but not top-2 eligible because: .
ITA wins a low-conviction category because its trend remains intact—price above the 50W and 200W with a 0.4% slope—even as absolute momentum has disappeared. The 2.3% thirteen-week return is uninspiring, and negative 1.8% relative strength versus SPY signals weakness, yet ITA's timing score of 75.0 reflects proximity to support and MACD bearish-but-improving, a setup that will either consolidate or repair. Volume at 1.40x the twenty-week average is above average, confirming that the pullback is being absorbed. Structure is neutral at 69.9, not clean, and the risk-reward is balanced at 48.8. XAR loses because its timing scores lower at 70.0, structure is worse at 68.6, and volume is merely neutral—a weaker aggregate case for a category-wide stall.
Defense & Aerospace holds 5% allocation despite a 43.4 final score that reflects the softest category-level macro fit of 51.0. Credit stress is active as a plus-two modifier, suggesting defense spending remains resilient, yet liquidity stress drags at negative-four. Disinflation pressure, absent a specific descriptor, carries neutral impact. ITA's technical evidence is only 64.3, the weakest among tier-2 representatives, and persistence is weak at 58.0, meaning volume-price confirmation is deteriorating. The allocation exists because tier-2 slots in a half-overlay portfolio require five points each, and this category cleared that floor. The real risk is that momentum confirmation of 57.1 continues to slide if volume participation thins further. Defense will justify its slot only if credit stress persists as an active positive and relative strength stabilizes around the flat line.
Nuclear Energy — NLR
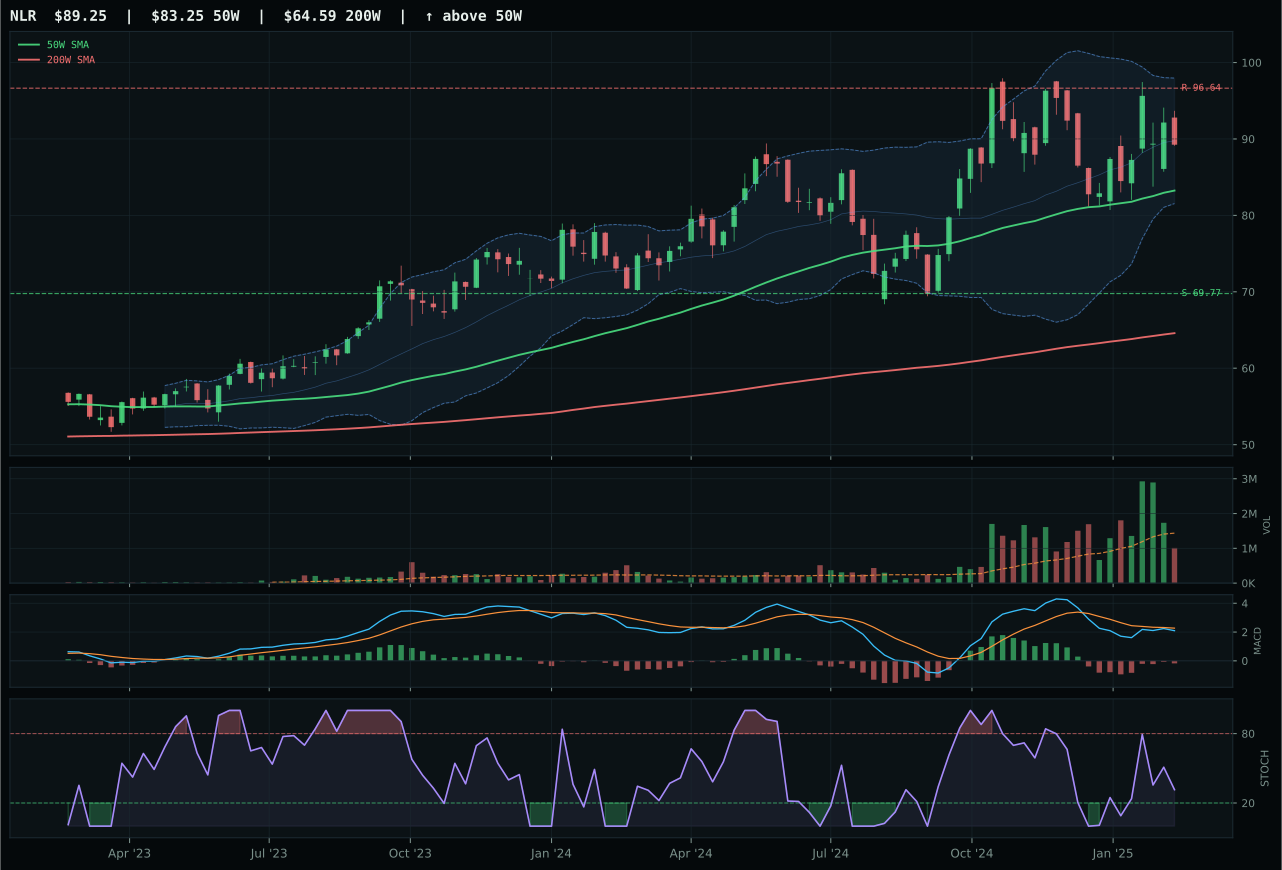
NLR has a neutral structure profile with -2.6% 13-week relative strength versus SPY.
A failed hold above support would weaken the setup.
Actionable but governed by invalidation levels.
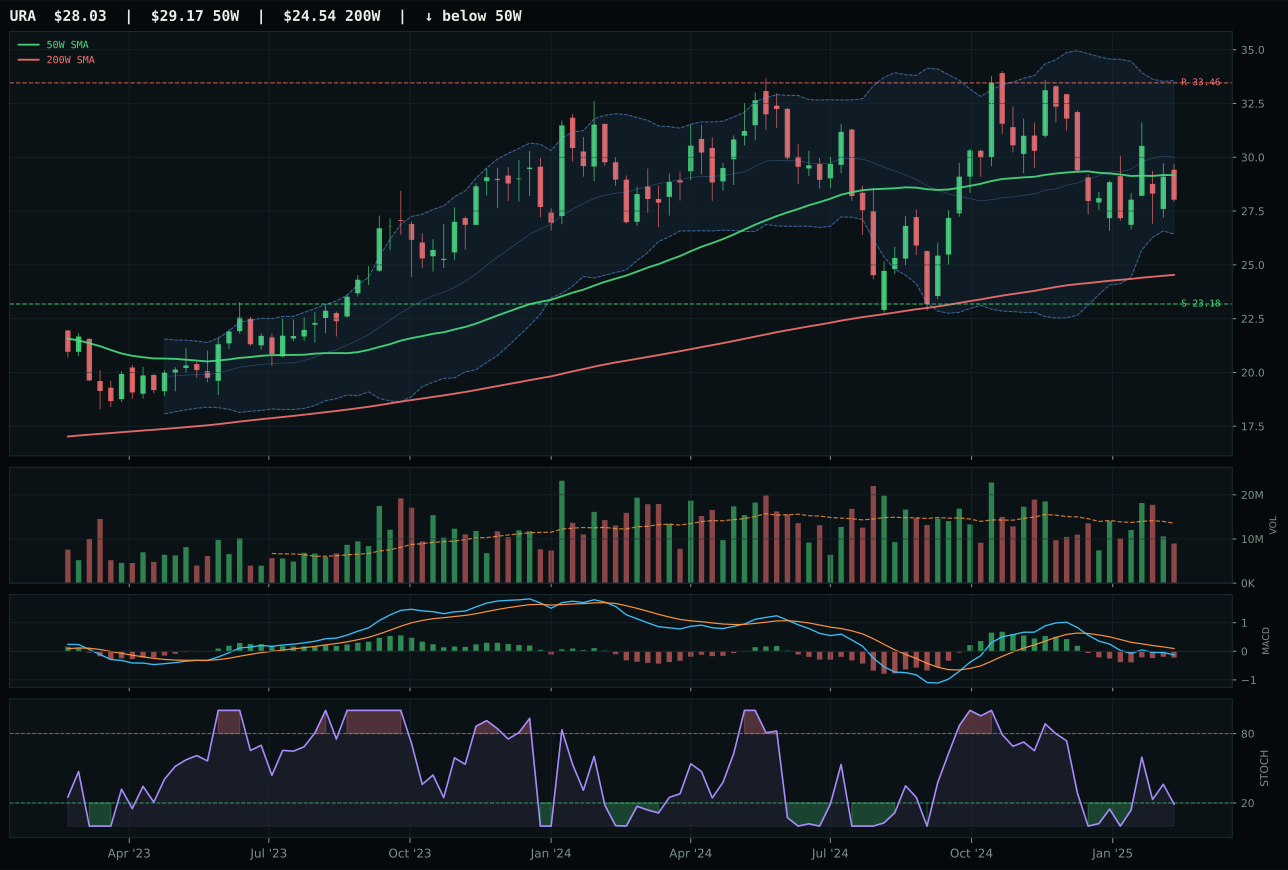
URA has a neutral structure profile with -11.6% 13-week relative strength versus SPY.
A failed hold above support would weaken the setup.
Actionable but governed by invalidation levels.
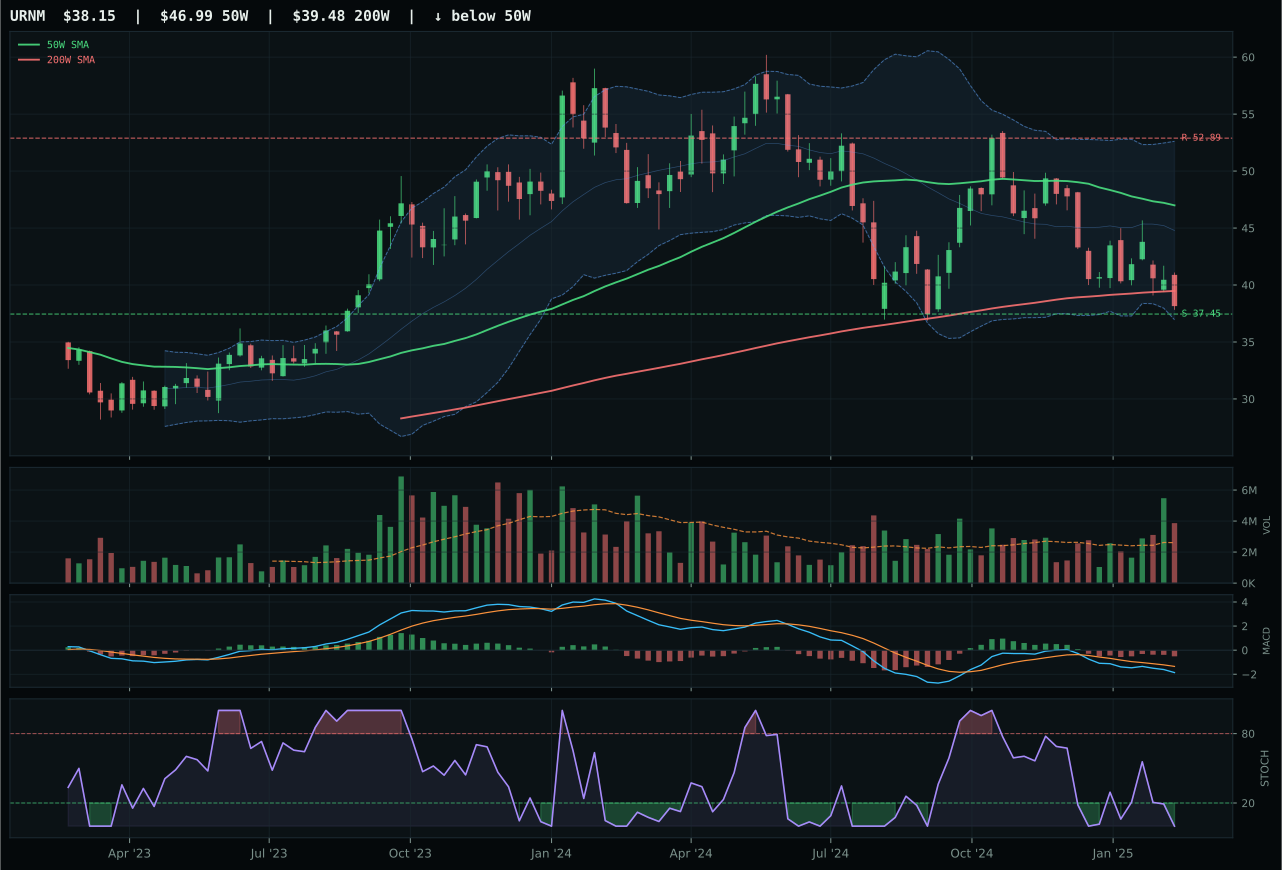
URNM has a pullback into support profile with -20.9% 13-week relative strength versus SPY.
A failed hold above support would weaken the setup.
Actionable but governed by invalidation levels.
NLR wins nuclear by fourteen points over URA because it maintains category-relative leadership despite both sitting in weak absolute positioning. Price is 7.2% from the 50W, near Fibonacci 0.236 in the upper retracement zone, and MACD is bearish but improving. The 1.5% thirteen-week return is uninspiring, yet NLR posts 9.0% category-relative strength, meaning it is outpacing URA inside the three-ETF basket. Timing scores 75.0, balancing the near-term extension with MACD improvement. Structure is neutral at 63.5. URA's structure at 62.6 is weaker and its category-relative strength is 0.0, a decisive disadvantage in a tie-like category.
Nuclear energy holds 5% allocation despite a meager final score of 29.4, the third-weakest category, because its technical evidence of 67.5 for NLR is the strongest among bottom-tier alternatives and macro fit at 50.0 is neutral rather than hostile. No active macro descriptor strongly penalizes or supports this exposure; liquidity stress at negative-seven and credit stress at negative-five are present but not categorical. The real issue is volume at 0.70x the twenty-week average—thin participation—which suggests the market has not yet committed to nuclear as a thematic rotation. The allocation is defensive and conditional; it exists to preserve optionality if the regime shifts toward secular energy-transition demand. Any volume decline further or MACD deterioration below improving would trigger immediate reallocation to higher-ranked alternatives.
Emerging Markets — IEMG
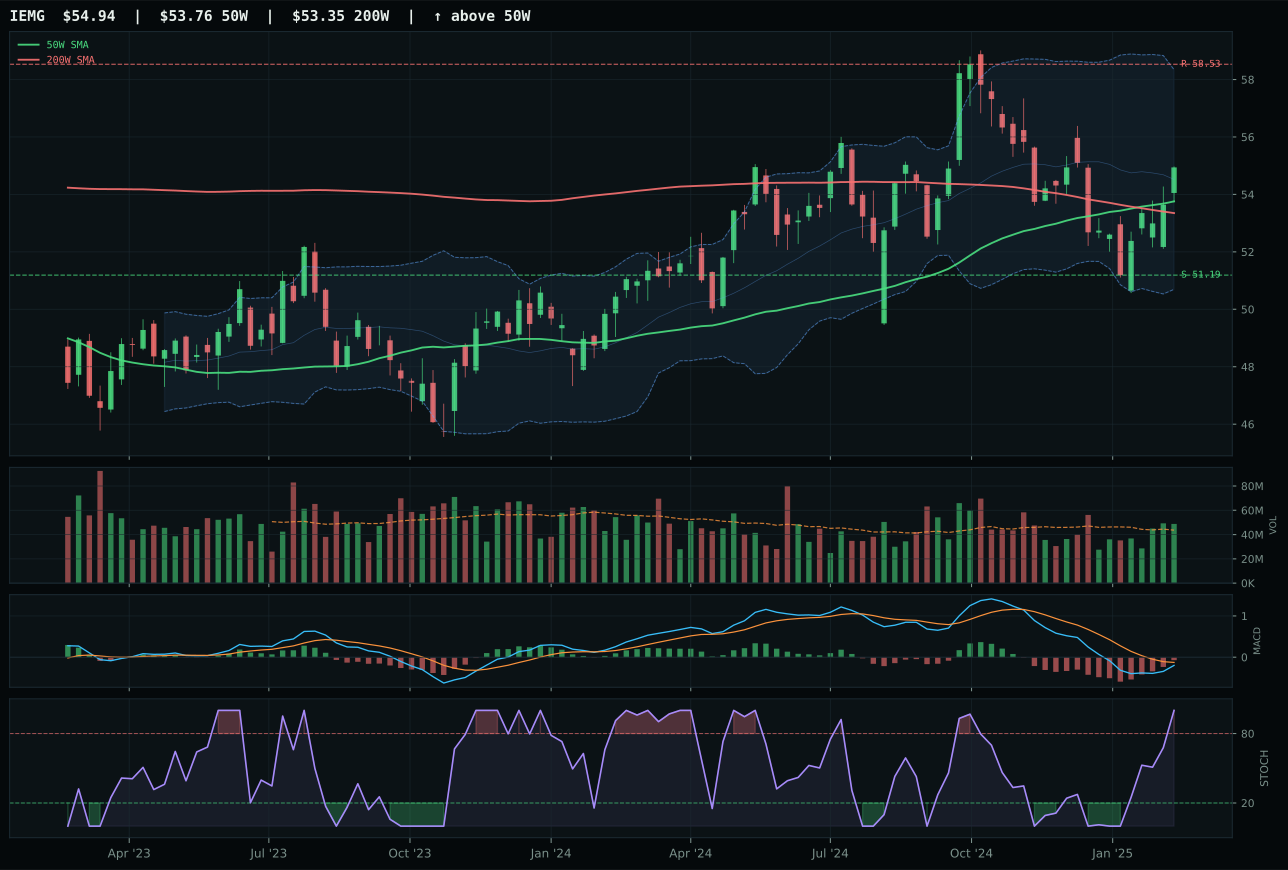
IEMG has a compression near 50W profile with -1.9% 13-week relative strength versus SPY.
A failed hold above support would weaken the setup.
Actionable but governed by invalidation levels.
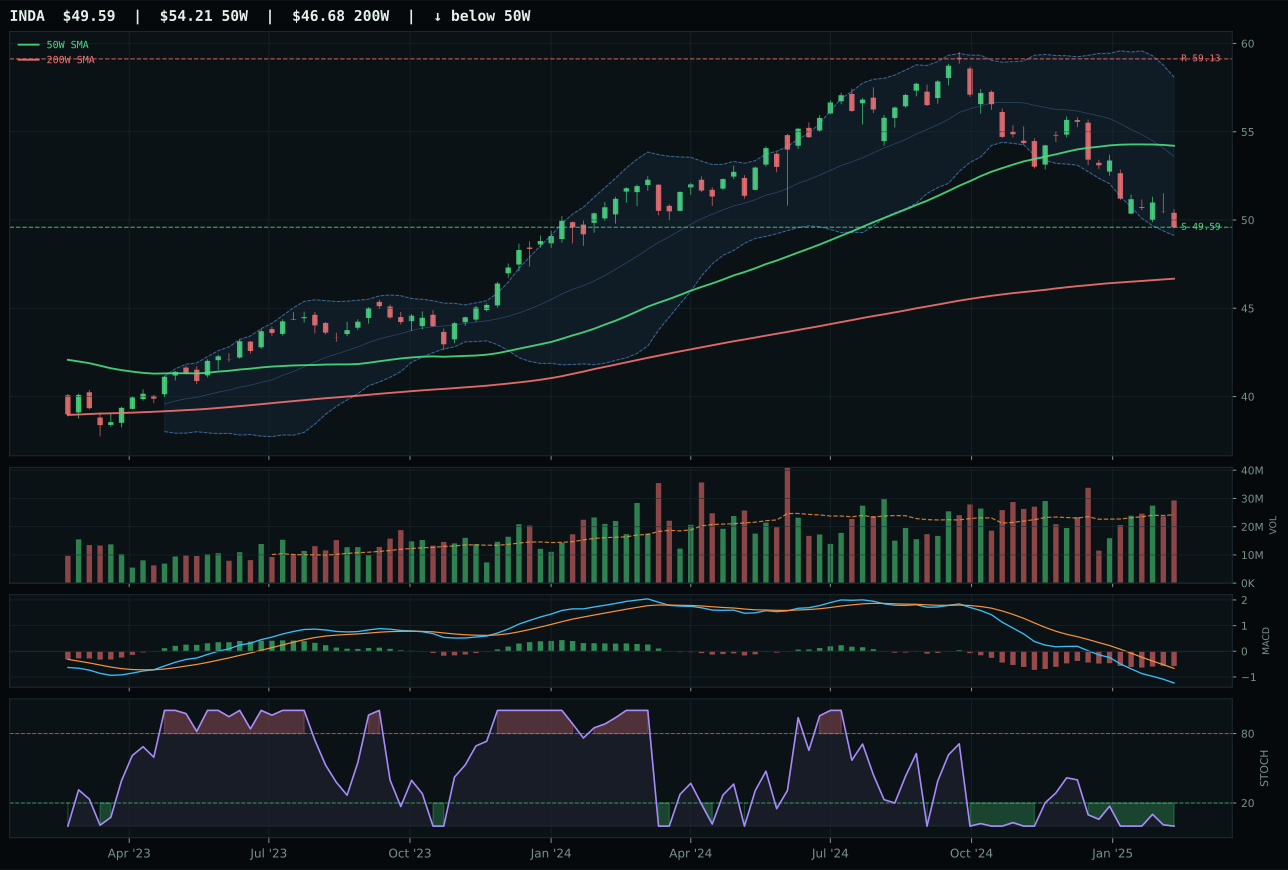
INDA has a pullback into support profile with -10.6% 13-week relative strength versus SPY.
A failed hold above support would weaken the setup.
Actionable but governed by invalidation levels.
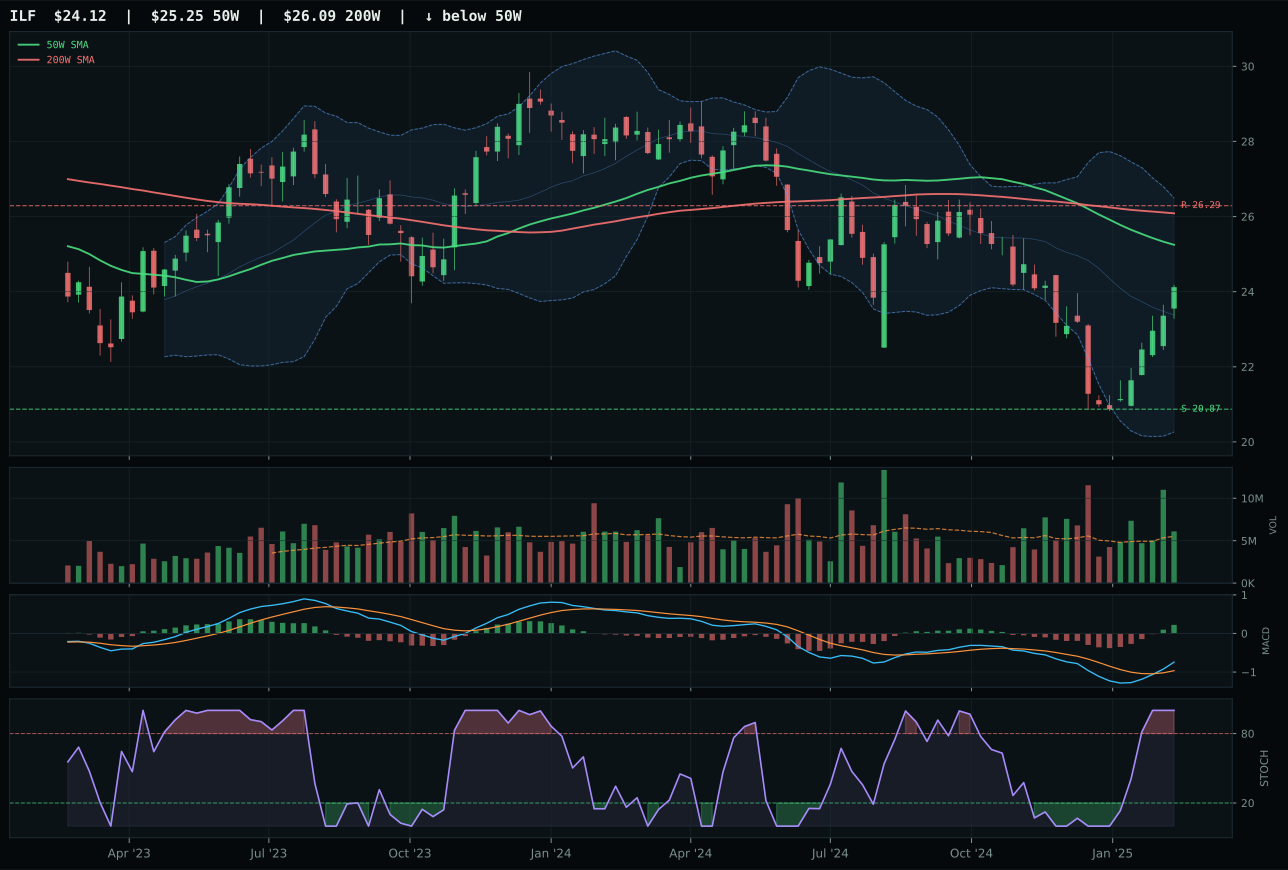
ILF has a neutral structure profile with -4.0% 13-week relative strength versus SPY.
Extension and support failure are the main tactical risks.
Tracked, but not top-2 eligible because: structurally broken.
IEMG defeats INDA decisively because it occupies the compression-near-50W setup with timing at 100.0, while INDA is a pullback-into-support with timing of 85.0. IEMG sits 2.2% from the 50W in the middle retracement zone, its MACD is bearish but improving, and stochastic RSI is overbought momentum—textbook consolidation ready to expand. Volume at 1.12x average confirms participation. The 2.2% thirteen-week return is weak, yet category-relative strength of 2.1% signals leadership. INDA's thirteen-week return is negative 6.5%, relative strength versus SPY is negative 10.6%, and category-relative strength is negative 6.6%—it is being destroyed by IEMG inside the basket. The thirty-point gap is pure technical dominance.
Emerging markets receives 5% allocation despite a category score of only 14.4, among the weakest, because IEMG's technical evidence of 78.0 is acceptable and tier-2 allocation requires representation. The category-level macro fit of 30.0 reflects terminal headwinds: credit stress and liquidity stress both active at negative-ten each. Disinflation pressure is absent from the descriptor profile. IEMG's compression setup and perfect timing offer relief, but the thirteen-week return of 2.2% is water-level momentum, and volume-price confirmation is deteriorating at 65.7. This is a position held only because the allocation framework requires it, not because conviction is high. Emerging markets will justify top-tier positioning only when credit stress deactivates or a new monetary-easing cycle begins. Until then, IEMG serves as a tactical hold with strict invalidation at the support level of 51.19.
Industrial Metals — COPX
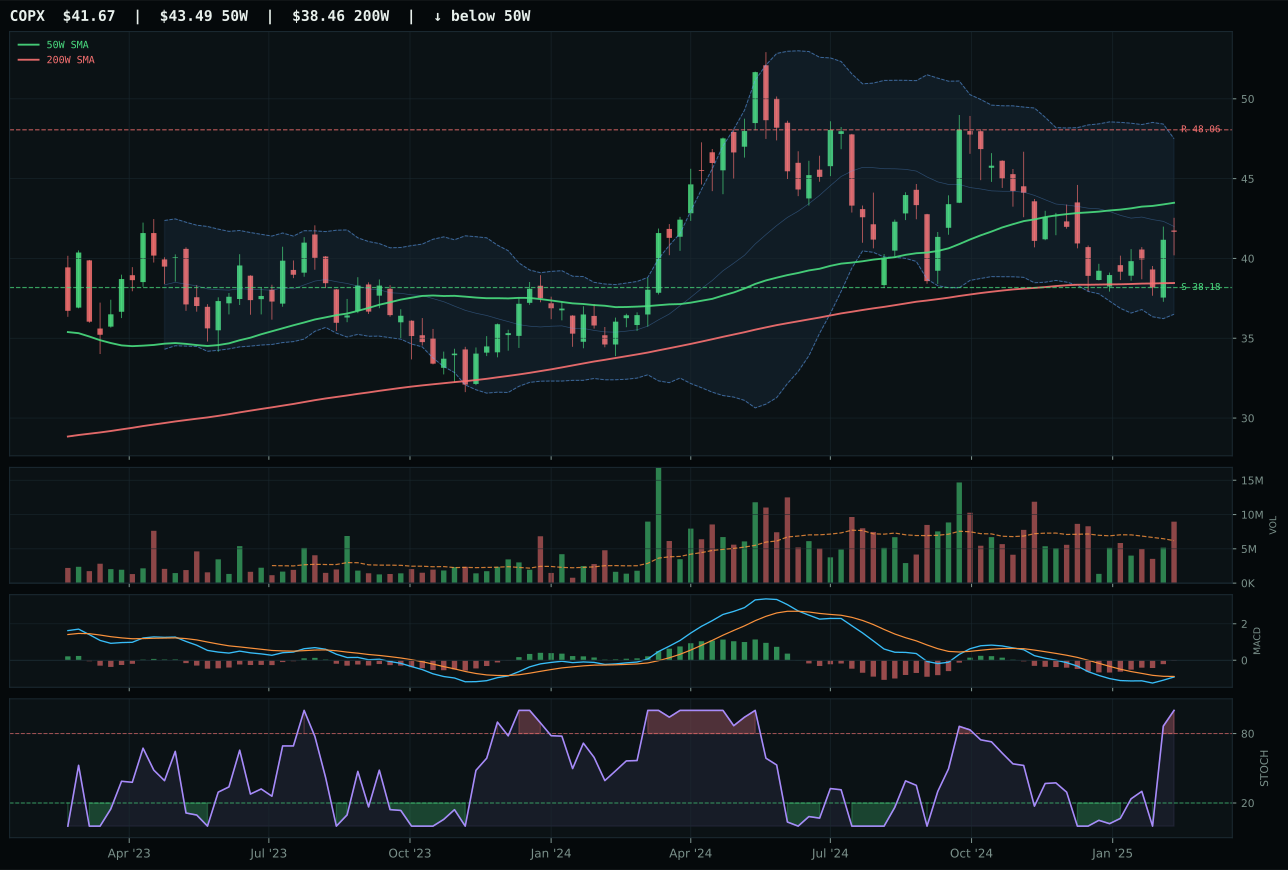
COPX has a neutral structure profile with -2.7% 13-week relative strength versus SPY.
A failed hold above support would weaken the setup.
Actionable but governed by invalidation levels.
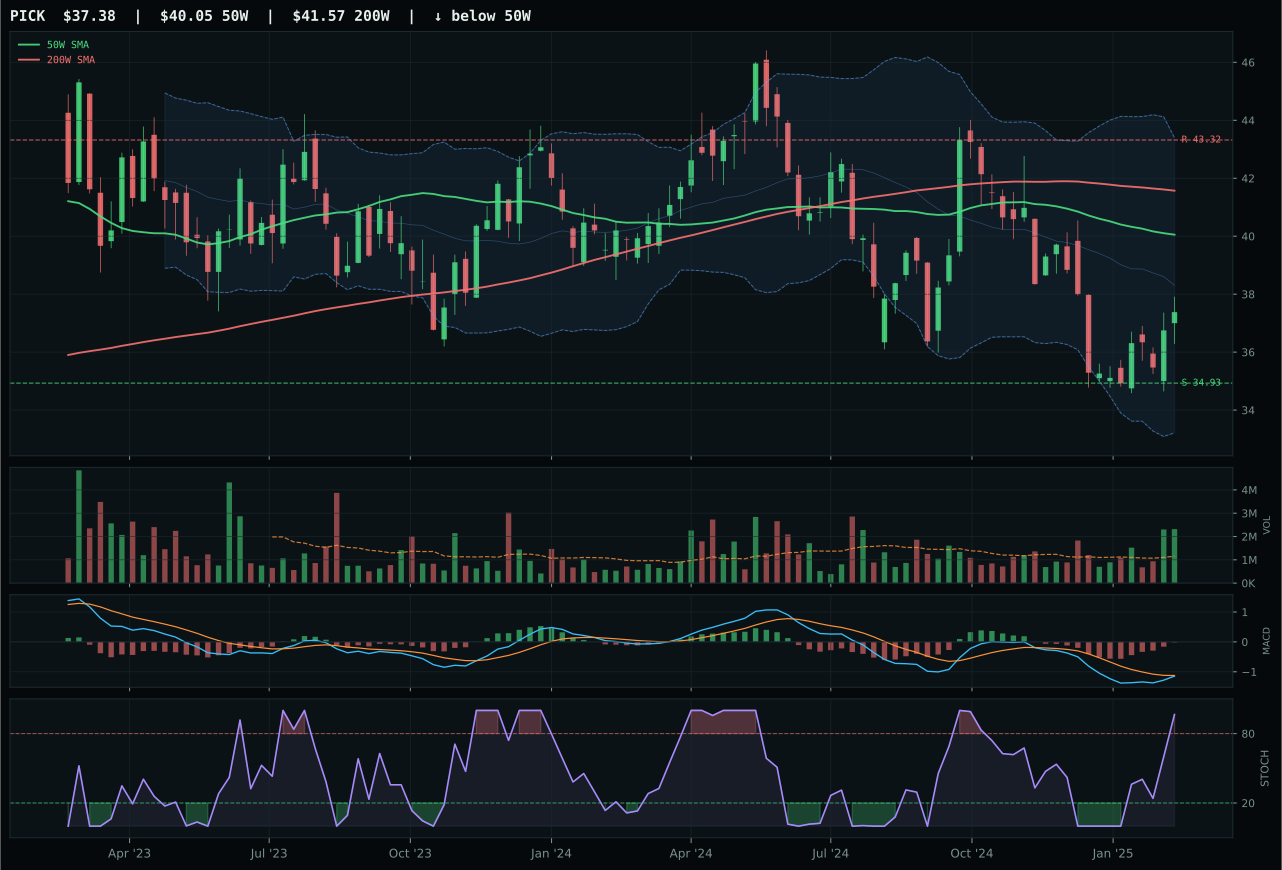
PICK has a neutral structure profile with -6.6% 13-week relative strength versus SPY.
Extension and support failure are the main tactical risks.
Tracked, but not top-2 eligible because: structurally broken.
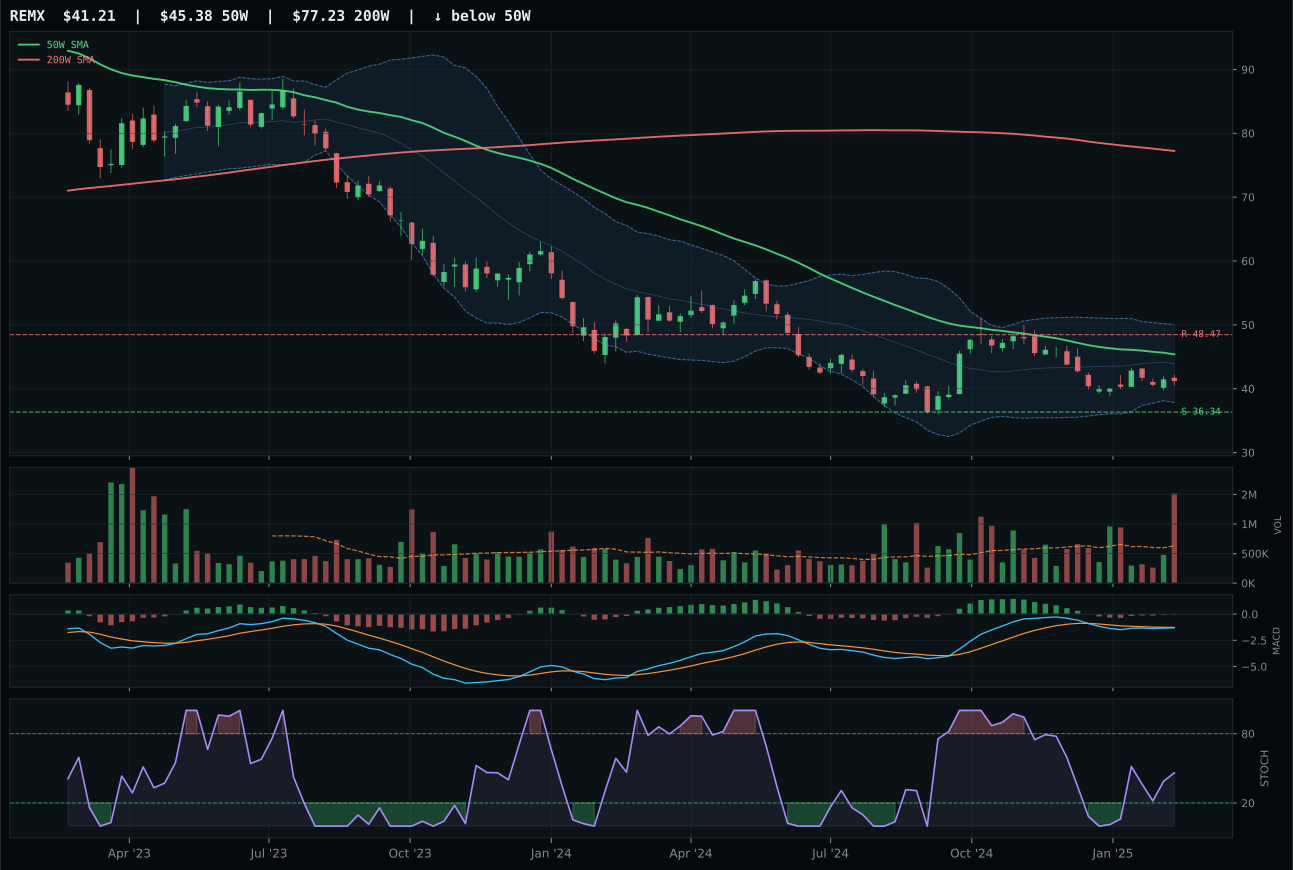
REMX has a neutral structure profile with -13.7% 13-week relative strength versus SPY.
Extension and support failure are the main tactical risks.
Tracked, but not top-2 eligible because: structurally broken.
COPX wins Industrial Metals by forty-nine points over PICK because it owns the only acceptable timing score. Price is -4.2% from the 50W—below trend but not broken—and the Fibonacci location at deep retracement near 0.618 combined with stochastic RSI overbought and MACD bearish-but-improving creates a classic value setup. Timing scores 97.0 for exactly this reason: pullback into zone with improving momentum indicators. Risk-reward of 79.2 is exceptional, offering 9.1% downside to support and 13.3% upside, a favorable asymmetry. Volume at 1.45x average confirms participation. PICK's structure is broken at 45.0 and its timing only reaches 75.0 despite occupying a repair zone, signaling weaker confirmation inside a weaker setup.
Industrial metals receives 5% allocation despite a terminal category score of only 10.8, the second-lowest ranking, because tier-2 baseline allocation requires a position. COPX's technical evidence of 72.3 is solid, but macro fit is 43.0, and the category-level macro fit tumbles to 35.0 due to active liquidity stress at negative-eight and credit stress at negative-seven. Disinflation does not help industrial metals—it raises the hurdle for demand and compresses margins. COPX's exceptional timing and risk-reward justify holding rather than zero-weighting, but this is a trade, not a conviction hold. The position should be monitored for volume deterioration or stochastic RSI failure to hold overbought; any breakdown in the repair setup invalidates the allocation case. Reallocation upward would require credit stress to shift positive or liquidity stress to deactivate, neither visible in near-term macro.
Agriculture & Livestock — WEAT
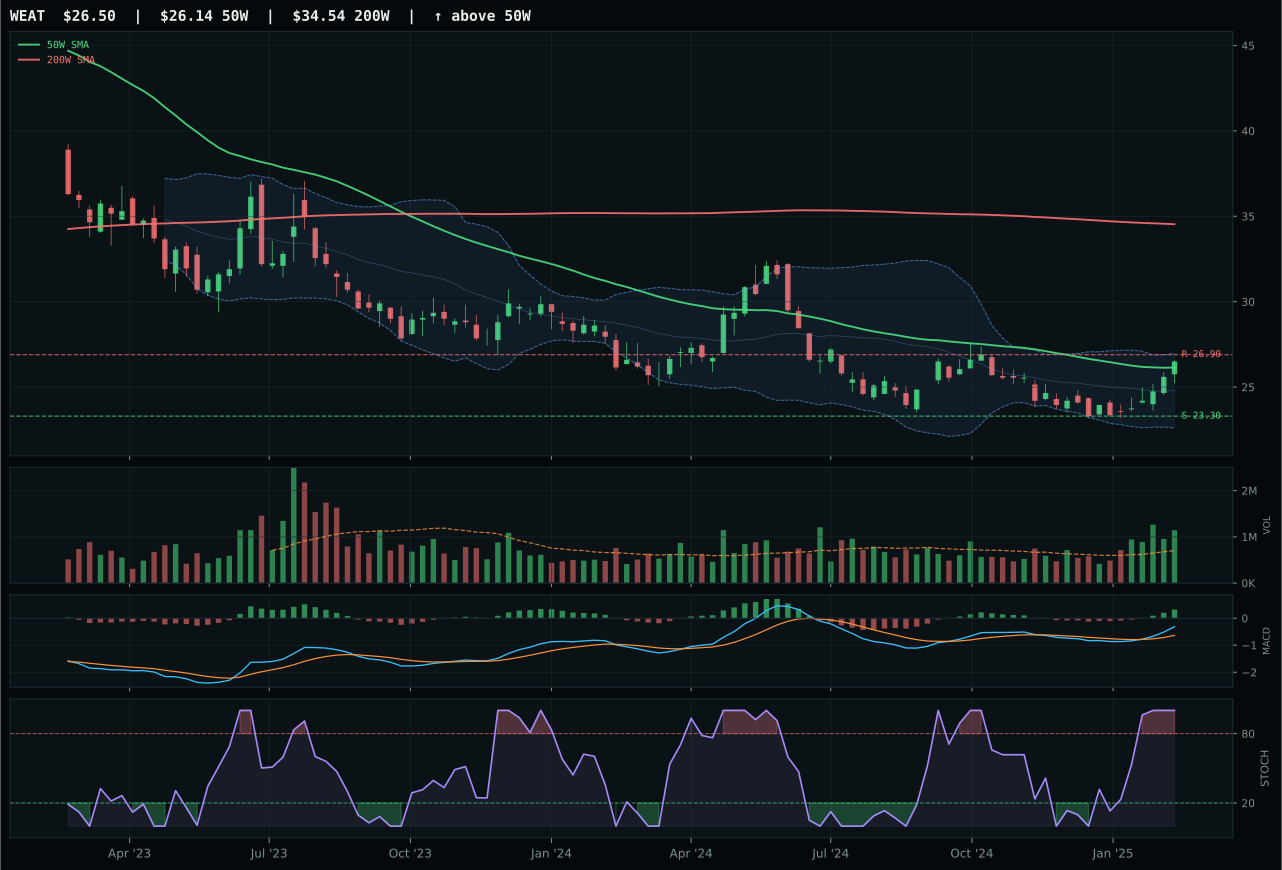
WEAT has a compression near 50W profile with 5.4% 13-week relative strength versus SPY.
A failed hold above support would weaken the setup.
Actionable but governed by invalidation levels.
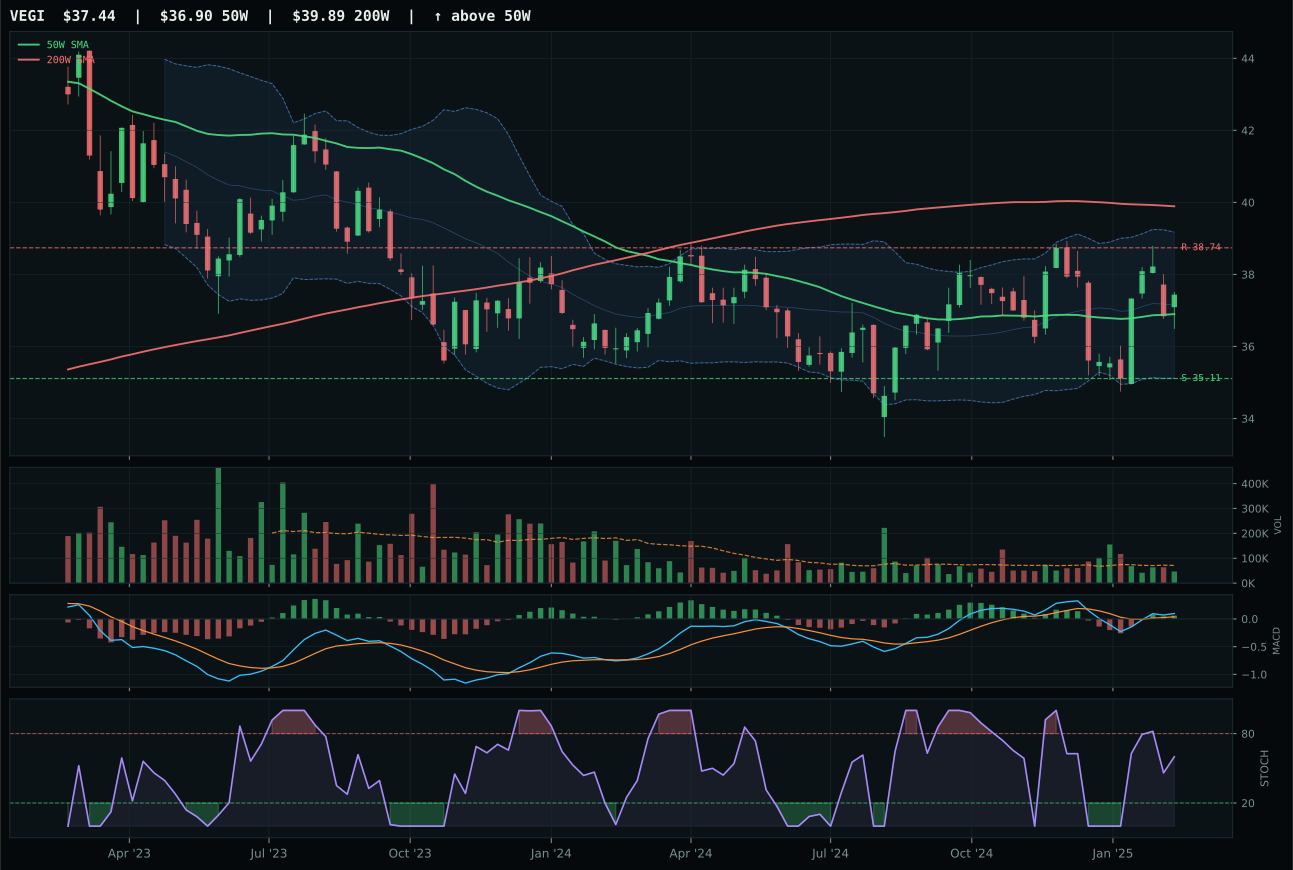
VEGI has a compression near 50W profile with -0.9% 13-week relative strength versus SPY.
A failed hold above support would weaken the setup.
Tracked, but not top-2 eligible because: .
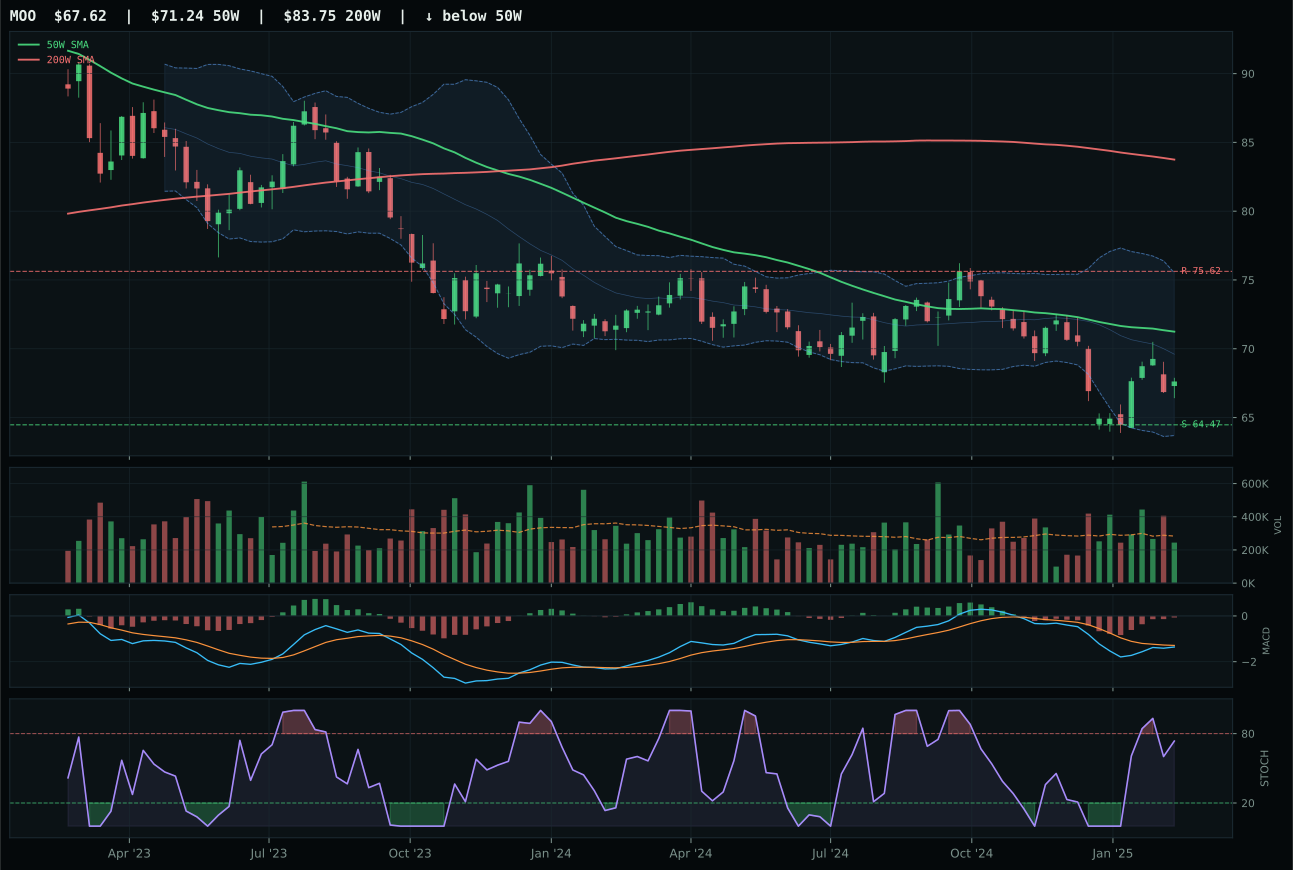
MOO has a pullback into support profile with -7.0% 13-week relative strength versus SPY.
Extension and support failure are the main tactical risks.
Tracked, but not top-2 eligible because: structurally broken.
WEAT wins cleanly—a 31.1-point gap separates it from VEGI—because timing and momentum confirmation both score at 100.0 despite price being below the 200W. The setup is compression near the 50W at just 1.4% distance, a micro-setup that can expand violently in either direction, and the MACD is bullish and improving with stochastic RSI overbought, telling you buyers are arriving. Thirteen-week returns of 9.5% and category-relative strength of 6.3% confirm the tape is sponsoring this name. Volume at 1.63x the twenty-week average provides accumulation confirmation. VEGI's timing is equally impressive at 100.0, but structure is less clean at 70.6, volume is thin participation rather than accumulation, and its category-relative strength of 0.0% means it is completely outpaced inside its own basket.
Agriculture & Livestock earns 0% allocation this week, ranked outside the portfolio at 9th or 10th place despite WEAT's exceptional 84 composite score on a technical basis. The category-level macro fit is only 32.0, dragged down by disinflation pressure at negative-eight and disinflation itself at negative-six, which directly conflicts with commodity and agricultural demand narratives. Liquidity stress adds another negative-four. Even WEAT's near-perfect timing and 100.0 momentum confirmation cannot overcome the structural macro headwind that disinflation creates for input costs and agricultural producer margins. The category would need credit stress to flip positive or monetary hedge bid to become active, neither of which is visible in the current macro regime. This is an exclusion driven by macro regime alignment, not technical deterioration—watch for disinflation pressure to deactivate as a necessary condition for readmission.
Traditional Energy — XLE
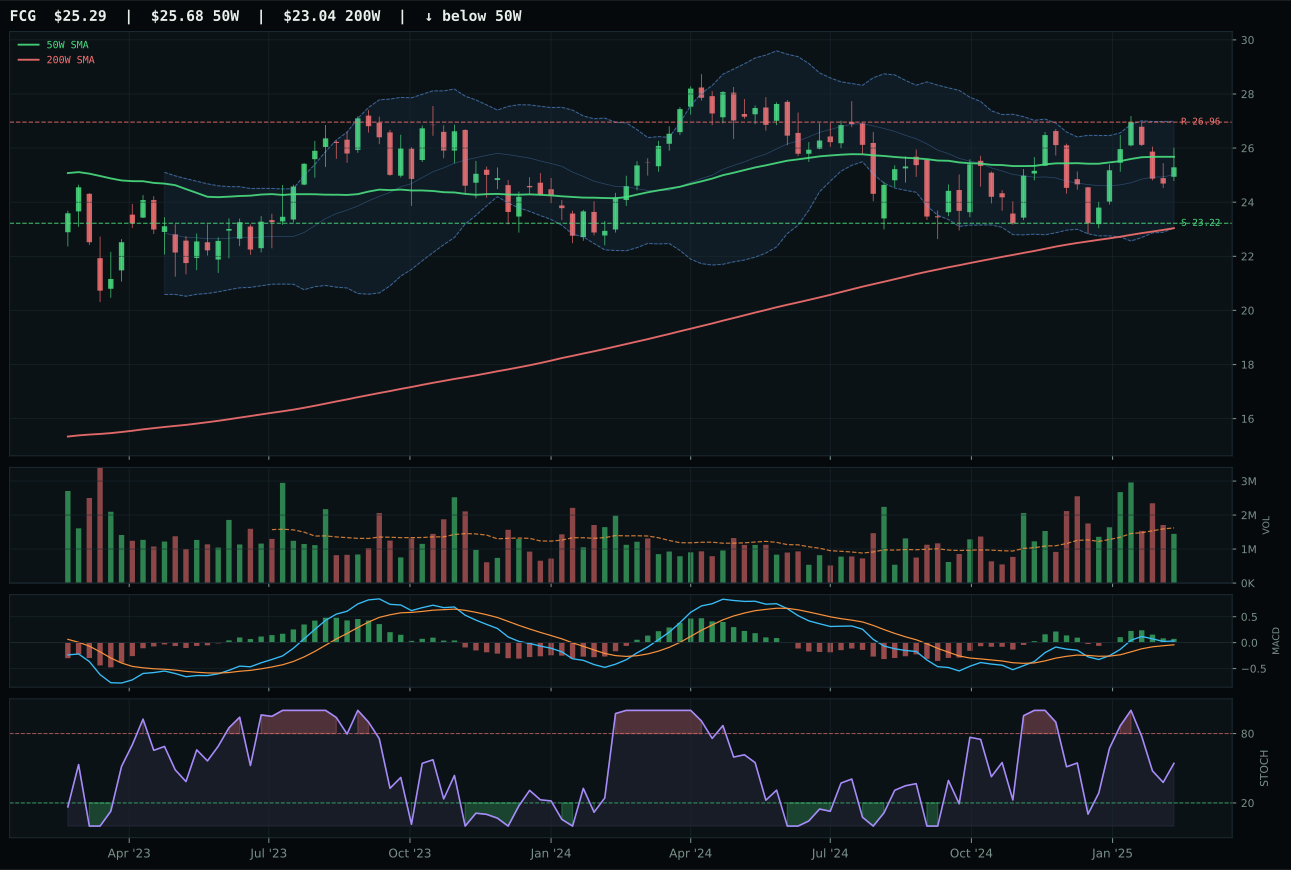
FCG has a compression near 50W profile with -3.6% 13-week relative strength versus SPY.
A failed hold above support would weaken the setup.
Actionable but governed by invalidation levels.
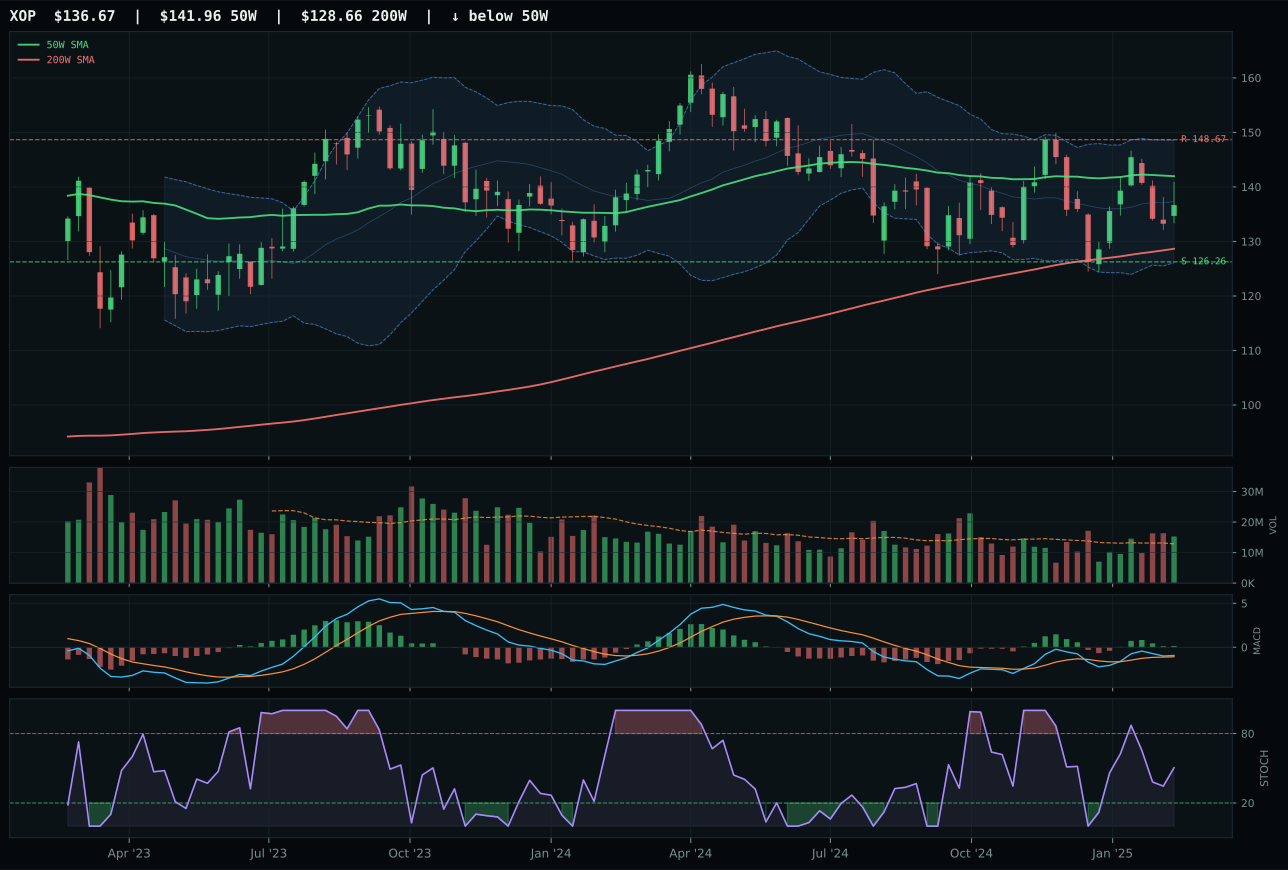
XOP has a neutral structure profile with -7.1% 13-week relative strength versus SPY.
A failed hold above support would weaken the setup.
Actionable but governed by invalidation levels.
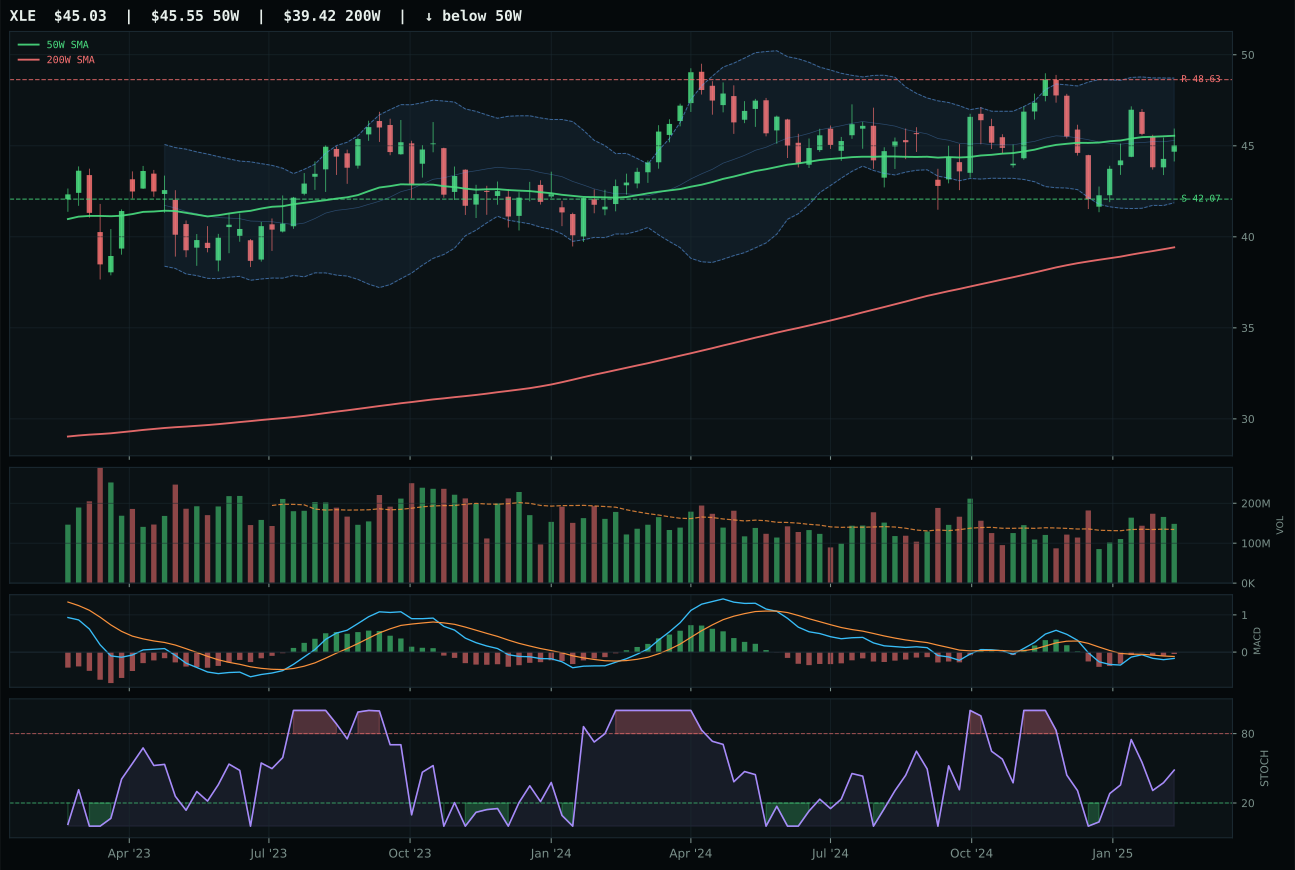
XLE has a compression near 50W profile with -9.0% 13-week relative strength versus SPY.
A failed hold above support would weaken the setup.
Actionable but governed by invalidation levels.
XLE wins the energy category, but winning here is pyrrhic. Price is -1.0% from the 50W in a compression near support, the one setup detail that saves this category from total failure. MACD is bearish but improving, stochastic RSI is falling-neutral, and the Fibonacci location is near 52W low in the repair zone, all supporting timing of 100.0. The 13W return of negative 4.9% and relative strength versus SPY of negative 9.0% tell you the sector is underwater. FCG loses because its structure is weaker at 70.8 versus XLE's 74.0, and volume is neutral versus XLE's above-average participation. Neither ETF is strong; this is relative weakness masquerading as selection.
Traditional Energy earns 0% allocation, ranked outside the portfolio, because its final score of 7.0 reflects the deepest macro headwind of any category. Disinflation pressure is active at negative-ten, disinflation itself at negative-ten, credit stress at negative-seven, and liquidity stress at negative-seven—a combined negative-thirty-four backdrop that no technical setup can overcome. XLE's momentum confirmation is just 25.9, volume-price confirmation is 29.8, and persistence is 41.0, all confirming that this is a dead weight in a disinflation regime. The category-level macro fit of 16.0 is terminal. Energy will not earn reallocation until disinflation pressure deactivates or the regime shifts toward inflation acceleration. The compression near support offers a potential repair setup, but until macro descriptors improve, capital is better deployed elsewhere.