
2025-02-07
Informational purposes only. The content in this report, including allocations, analysis, and commentary, is provided solely for informational and educational purposes. It does not constitute financial advice, investment advice, trading advice, or any other type of advice. Past performance does not guarantee future results. Always conduct your own research and consult a qualified financial professional before making investment decisions.
Slow macro Defensive trigger is active (Monetary Defense), but crypto-cycle exposure has priority for this run.
Weekly Allocation
| Ticker | Category | Weight | Role |
|---|---|---|---|
| FBTC | 50% | Overlay | |
| GLD | Precious Metals | 10% | Top-2 (10%) |
| PAVE | Utilities & Infrastructure | 10% | Top-2 (10%) |
| ITA | Defense & Aerospace | 5% | Tier-2 (5%) |
| AIQ | AI | 5% | Tier-2 (5%) |
| WEAT | Agriculture & Livestock | 5% | Tier-2 (5%) |
| CIBR | Technology | 5% | Tier-2 (5%) |
| NLR | Nuclear Energy | 5% | Tier-2 (5%) |
| XLE | Traditional Energy | 5% | Tier-2 (5%) |
Trade Instructions — Monday Open
Sell the tranche from 2025-01-10 (completing its 4-week hold). Buy the new tranche. Instructions show net portfolio changes — same-asset positions cancel, weight changes show the delta.
| Action | Ticker | Instruction |
|---|---|---|
| SELL | XLU | Sell 50% of XLU position (reduce 5.00% → 2.50%) |
| SELL | XAR | Sell 50% of XAR position (reduce 2.50% → 1.25%) |
| SELL | COPX | Sell 33% of COPX position (reduce 3.75% → 2.50%) |
| SELL | INDA | Sell 33% of INDA position (reduce 3.75% → 2.50%) |
| BUY | XLE | Buy XLE — 20.00% of freed cash (adds 1.25% to portfolio) |
| BUY | ITA | Buy ITA — 20.00% of freed cash (adds 1.25% to portfolio) |
| BUY | PAVE | Buy PAVE — 40.00% of freed cash (adds 2.50% to portfolio) |
| BUY | AIQ | Buy AIQ — 20.00% of freed cash (adds 1.25% to portfolio) |
Current Portfolio After Trade
Combined holdings across all 4 active tranches. Each tranche is 25% of the portfolio.
| Ticker | % of Portfolio | Weight Bar |
|---|---|---|
| FBTC | 50.00% | |
| GLD | 8.75% | |
| CIBR | 5.00% | |
| NLR | 5.00% | |
| XLE | 5.00% | |
| ITA | 5.00% | |
| PAVE | 5.00% | |
| COPX | 2.50% | |
| INDA | 2.50% | |
| XLU | 2.50% | |
| AIQ | 2.50% | |
| XAR | 1.25% | |
| IGF | 1.25% | |
| SMH | 1.25% | |
| BOTZ | 1.25% | |
| WEAT | 1.25% |
Macro Regime — Disinflation
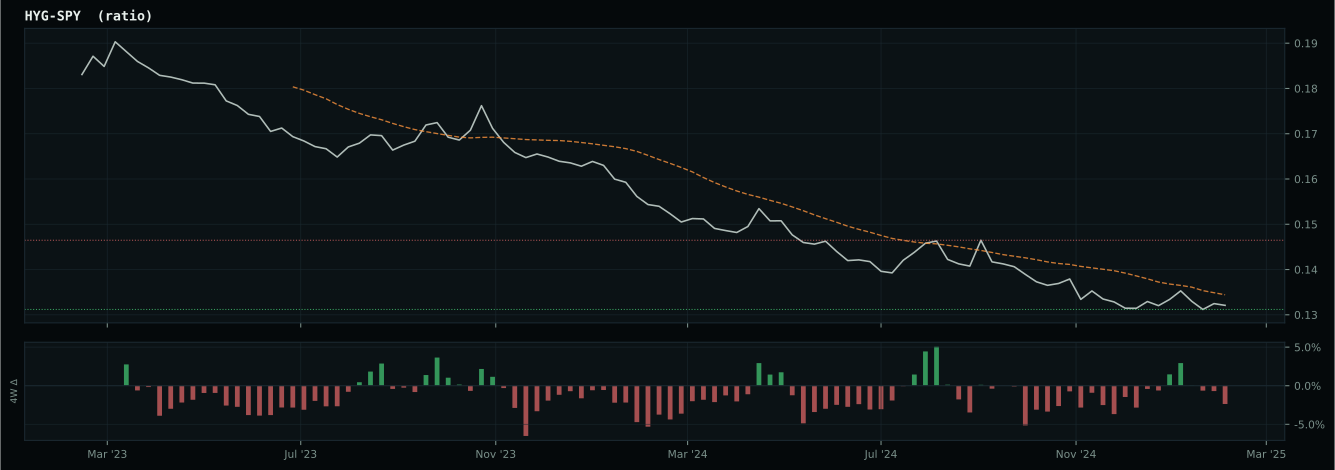
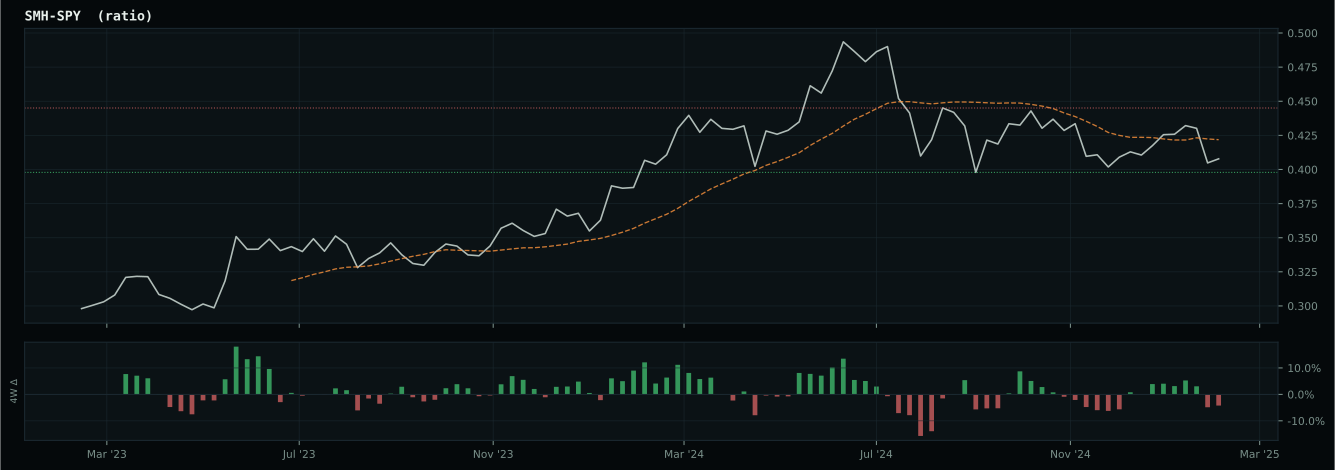
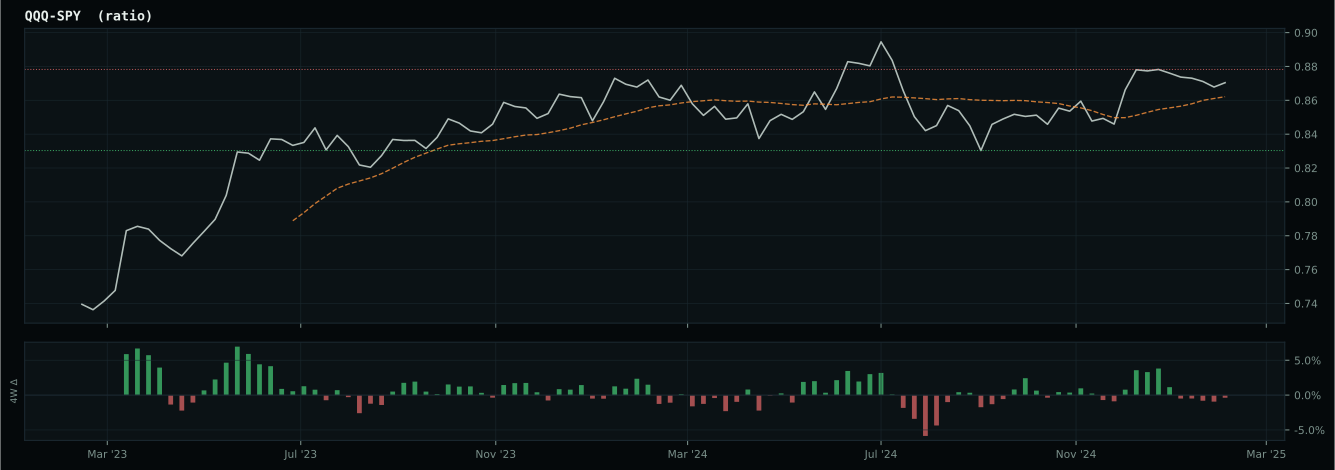
growth data is not confirming the weak market-implied risk appetite signal
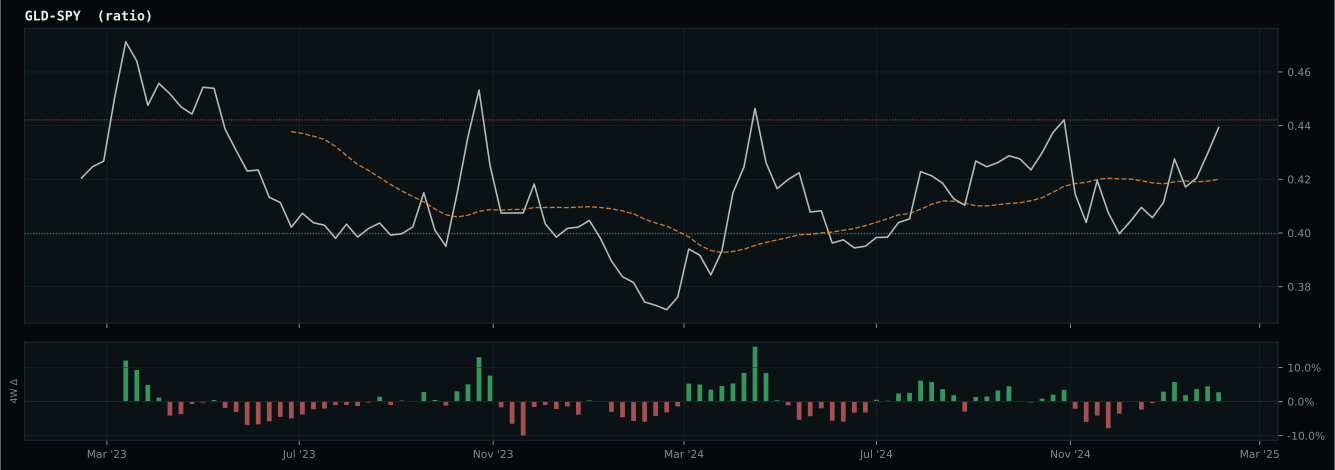
Defensive overlay cause is falling-growth or disinflation stress: gold is favored because falling real-yield pressure and monetary hedging are more relevant than cyclical commodity demand. GLD has been confirmed above its 8W SMA and is eligible.
Macro Evidence Charts
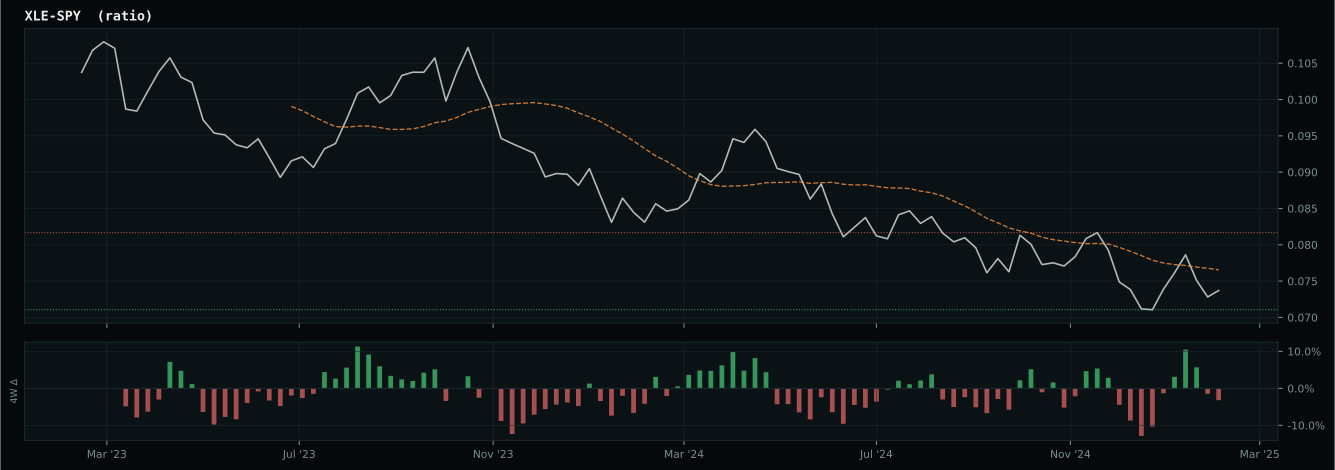
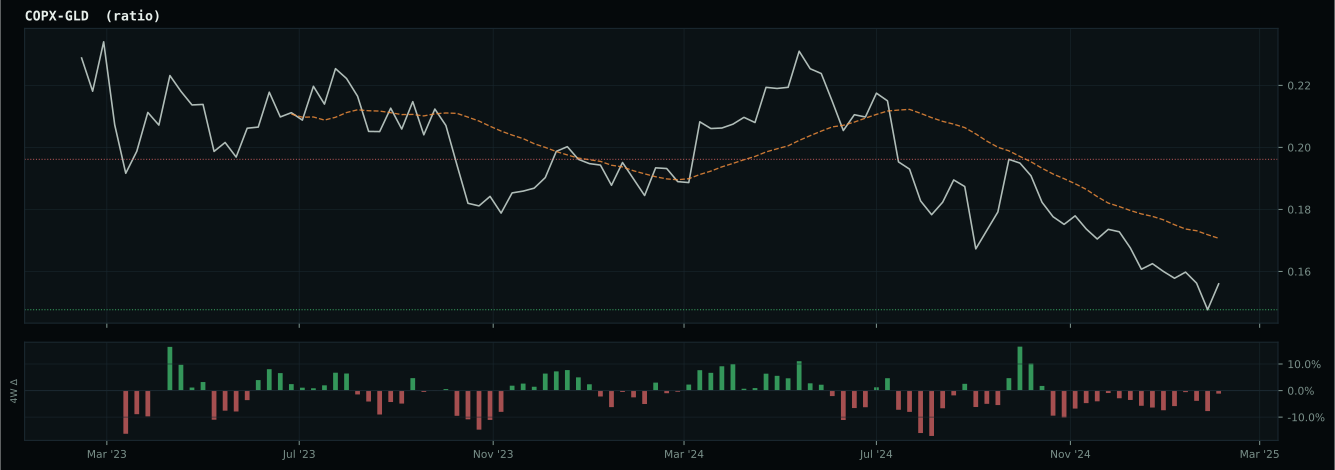
Market-implied signals behind the macro regime scores. Each ratio compares two assets; the direction and slope of the ratio is what the macro engine reads.
Crypto Regime — TrendBTC
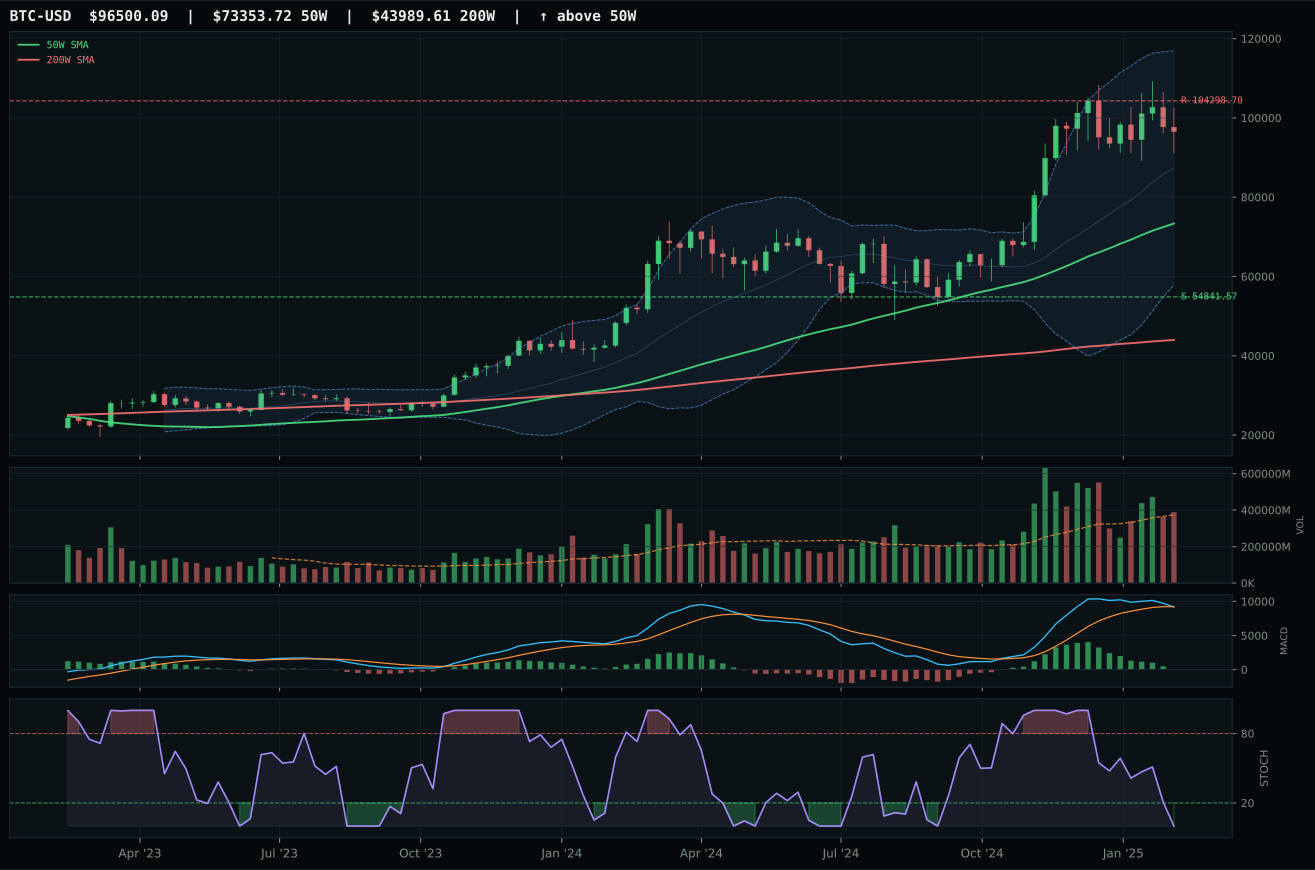
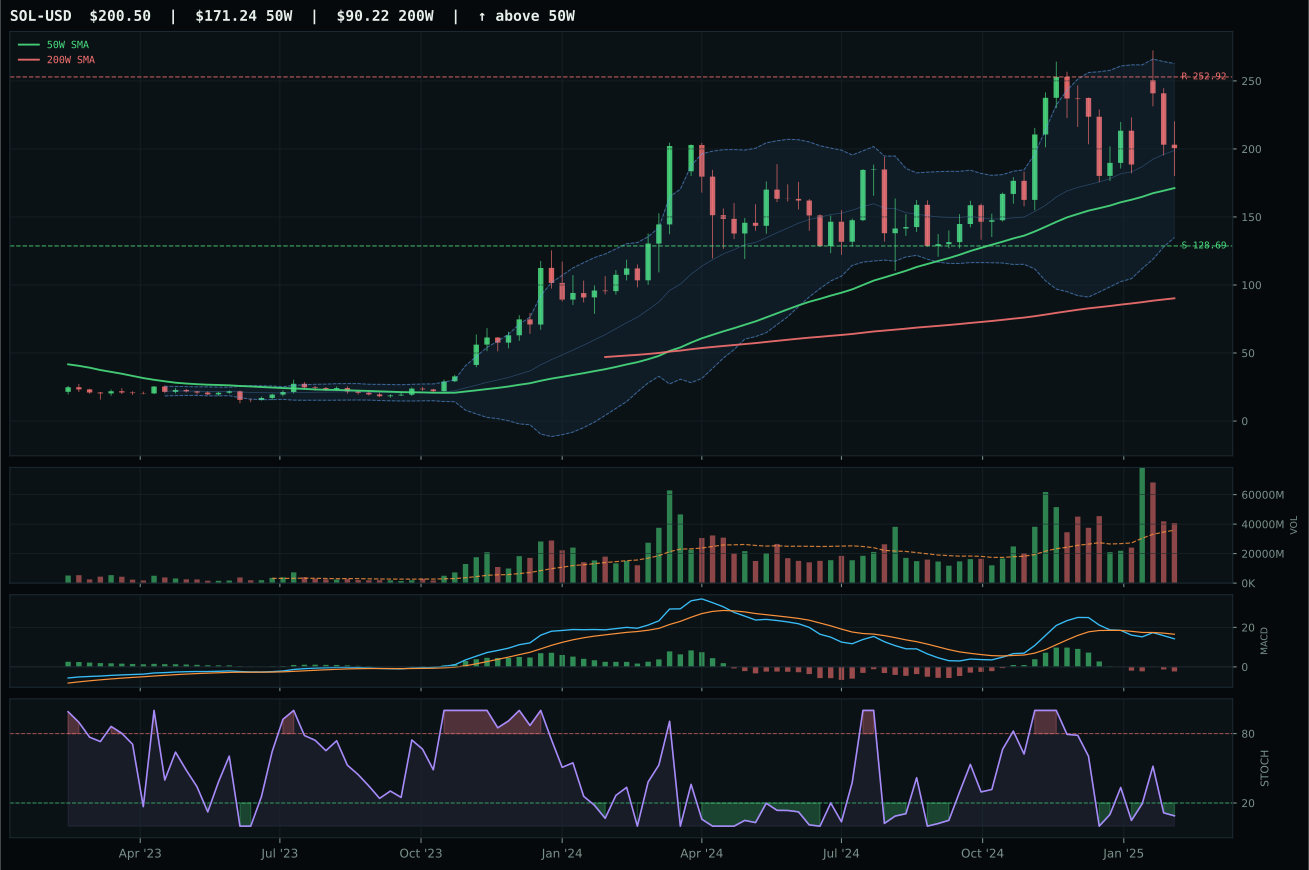
ValueBTC not armed: BTC has not made the first post-breakdown touch of the 200W buy zone after losing the 50W
TrendBTC confirmed: 2 consecutive closes above rising/flat 50W SMA
one or more available conditions failed
Category Rankings
| Rank | Category | Winner | Score | Alloc | 4W Ret | Peers (4W) |
|---|---|---|---|---|---|---|
| 1 | Precious Metals | GLD | 82.8 | 20% | -0.14% | GDX -1.4% · SLV +1.4% |
| 2 | Utilities & Infrastructure | PAVE | 67.1 | 20% | -9.33% | XLU -1.7% · IGF -1.8% |
| 3 | Defense & Aerospace | ITA | 59.1 | 10% | -6.41% | XAR -9.0% · ROKT -9.0% |
| 4 | AI | AIQ | 48.5 | 10% | -9.33% | BOTZ -9.7% · SMH -11.1% |
| 5 | Technology | CIBR | 35.3 | 10% | -7.31% | IGV -13.8% · XLK -8.7% |
| 6 | Nuclear Energy | NLR | 31.6 | 10% | -20.00% | URA -20.2% · URNM -19.1% |
| 7 | Traditional Energy | XLE | 10.1 | 10% | -1.61% | XOP -8.6% · FCG -8.7% |
| 8 | Industrial Metals | COPX | 8.0 | 10% | -5.70% | PICK -0.9% · REMX -0.8% |
| 9 | Emerging Markets | INDA | 5.5 | 0% | -3.89% | IEMG +0.1% · ILF -3.1% |
| 10 | Agriculture & Livestock | WEAT | — | 0% | -4.66% | VEGI +1.2% · MOO +2.8% |
Precious Metals — GLD
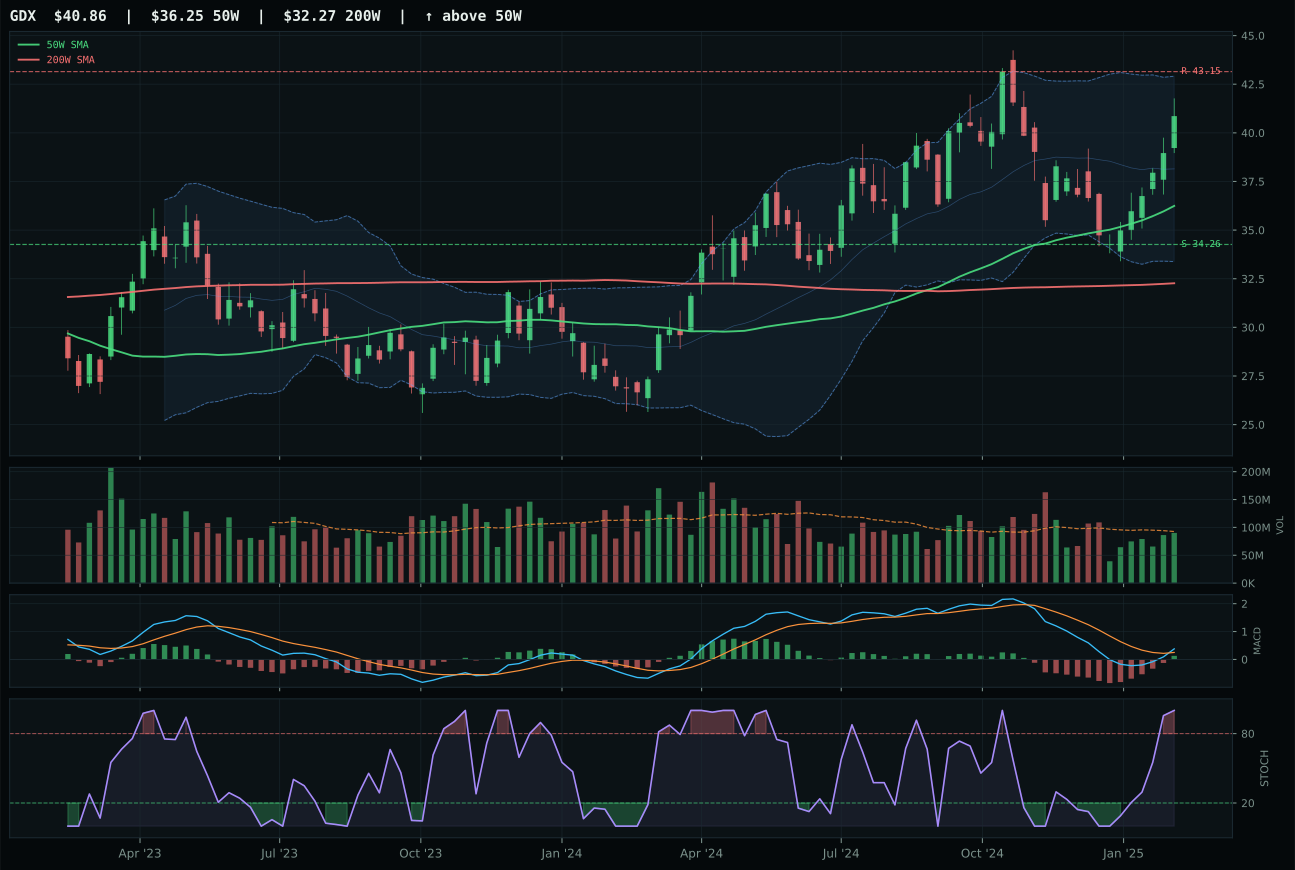
GDX has a neutral structure profile with 4.3% 13-week relative strength versus SPY.
A failed hold above support would weaken the setup.
Actionable but governed by invalidation levels.
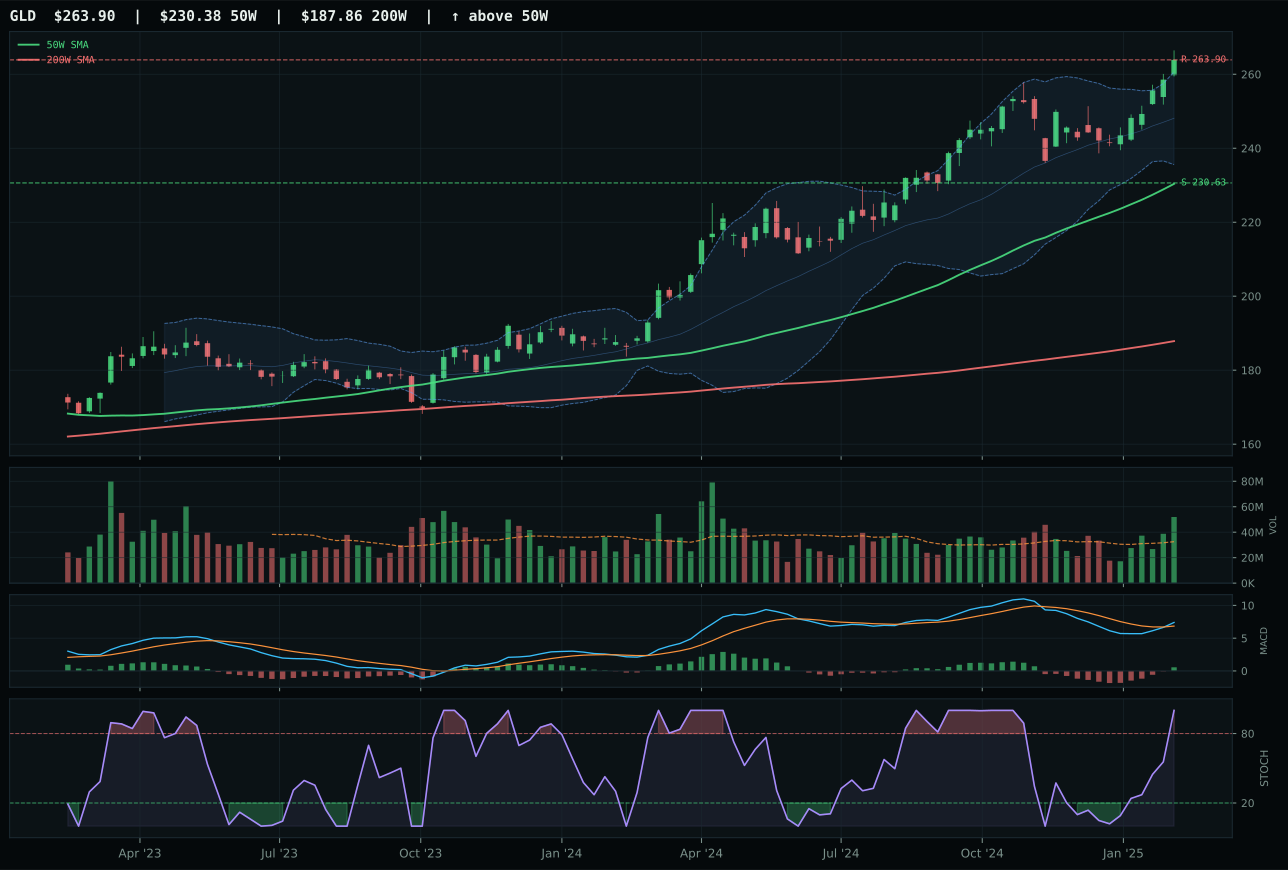
GLD has a neutral structure profile with 6.0% 13-week relative strength versus SPY.
A failed hold above support would weaken the setup.
Actionable but governed by invalidation levels.
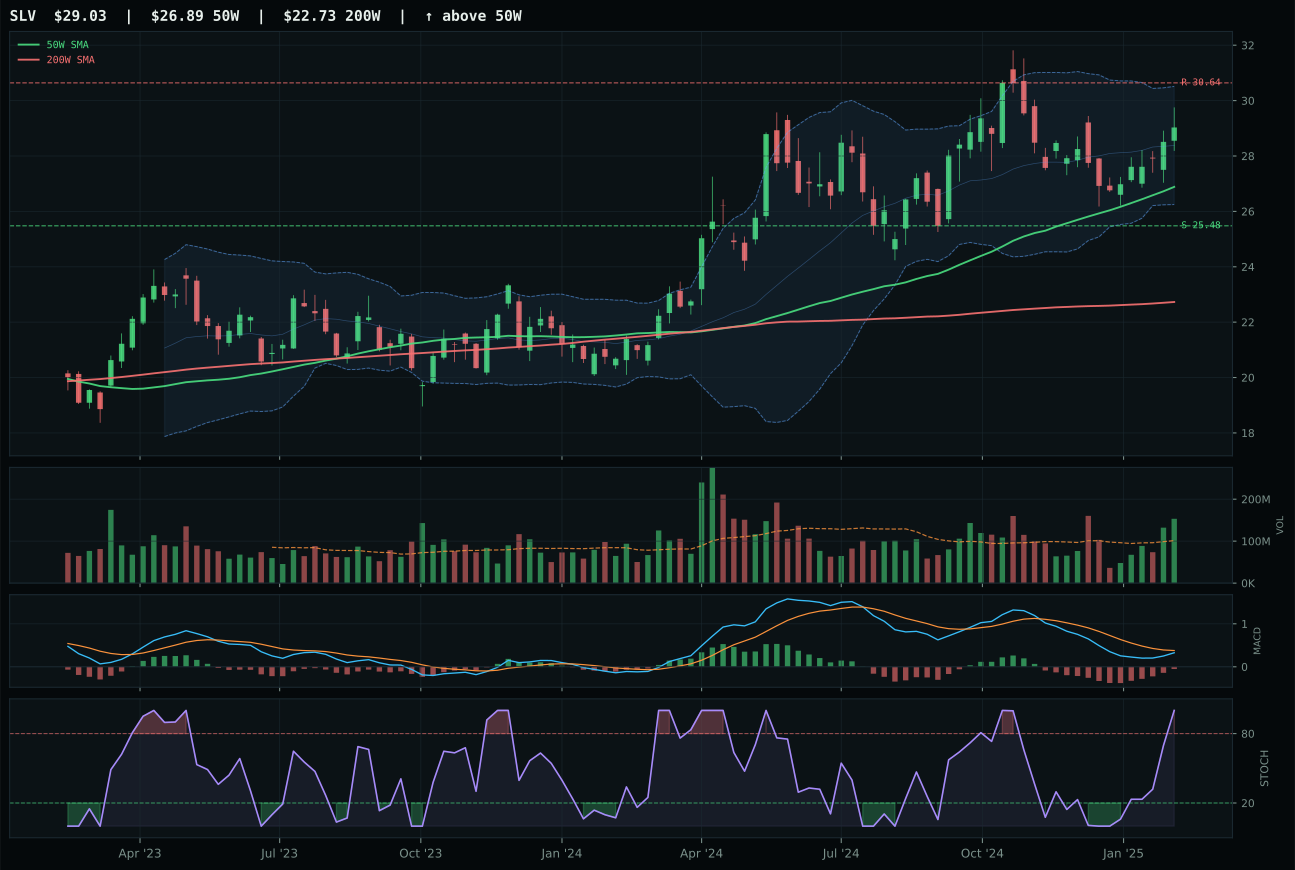
SLV has a neutral structure profile with 1.5% 13-week relative strength versus SPY.
A failed hold above support would weaken the setup.
Actionable but governed by invalidation levels.
GLD claims the top-2 overweight at 10% through dominant technical sponsorship and macro alignment. Price is 14.5% above the 50-week moving average with both MACD bullish and improving and stochastic RSI at overbought momentum—but volume accumulation at 1.60x the 20-week average shows institutional buyers are paying these prices, not sellers capitulating into strength. SPY-relative strength of 6.0% and category-relative strength of 1.7% position gold as the primary beneficiary of monetary hedge demand and disinflation tailwinds. GDX trails by 2.4 points due to weaker risk/reward (50.0 vs 52.0), less clean structure (72.2 vs 84.1), and neutral volume versus accumulation/confirmation. The neutral structure (not vertical extension) and 59.0 timing score reflect an extended but measured setup—not a panic-buying climax, but orderly institutional positioning into safety.
Precious Metals ranks as one of the two highest-scoring categories at 82.8 and earns the full 10% top-2 allocation. Macro fit is commanding at 81.0/100: monetary hedge bid is active (+14), disinflation pressure is active (+8), and dollar pressure provides a modest tailwind (+3). In the current regime—rate cuts possible, liquidity concerns rising, credit stress evident—gold is both a valuation hedge and a crisis insurance asset. The portfolio's 50% overlay reduces all category tiers by half, so the 10% slot translates to a meaningful overweight within the constrained sleeve structure. GLD's combination of clean uptrend, institutional accumulation, and macro alignment make it the rare top-2 category this week. Maintaining this allocation depends on disinflation persisting and credit conditions either stabilizing or deteriorating further—both scenarios support gold; only aggressive reflation with risk-on recovery would trigger a move to reduce.
Utilities & Infrastructure — PAVE
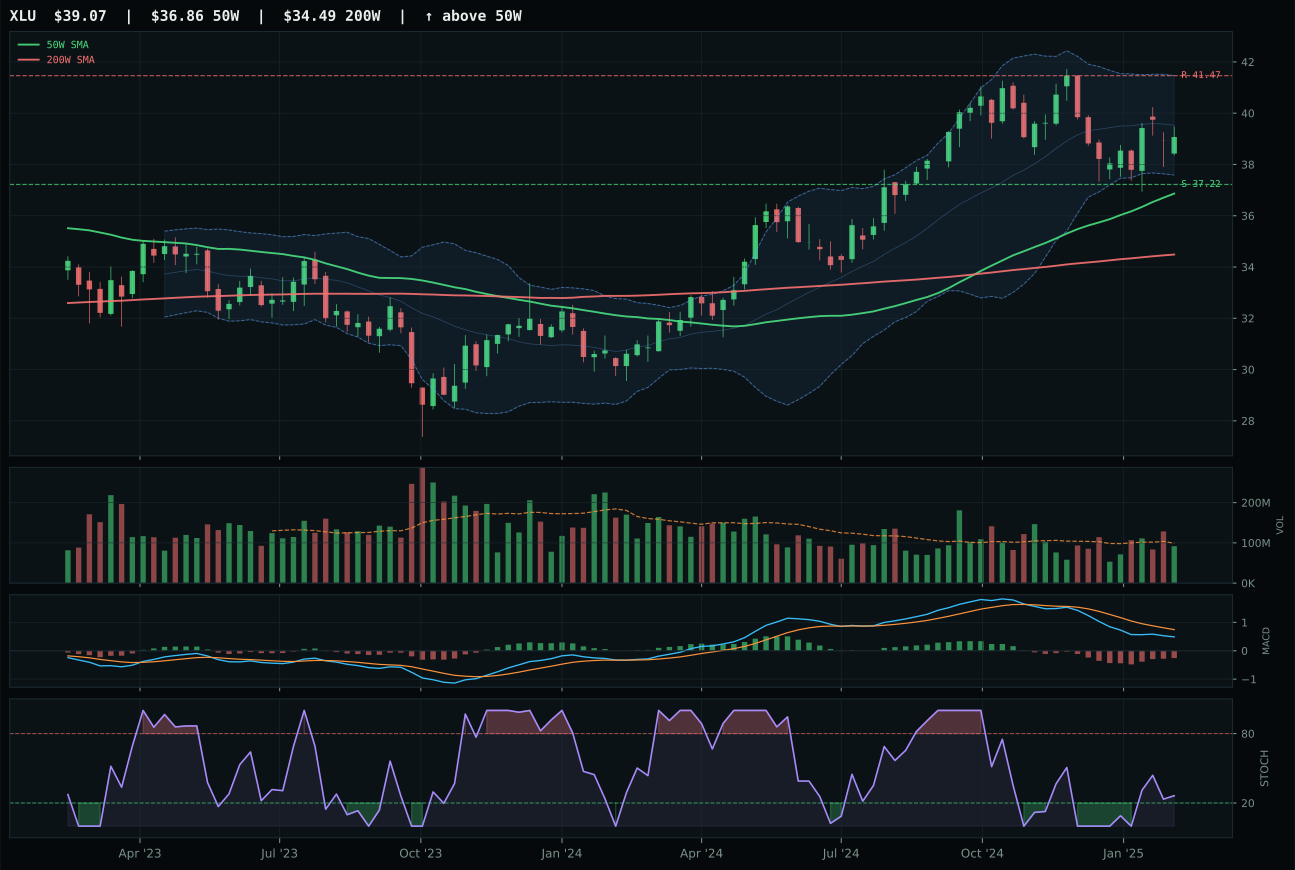
XLU has a pullback into support profile with -1.7% 13-week relative strength versus SPY.
A failed hold above support would weaken the setup.
Actionable but governed by invalidation levels.
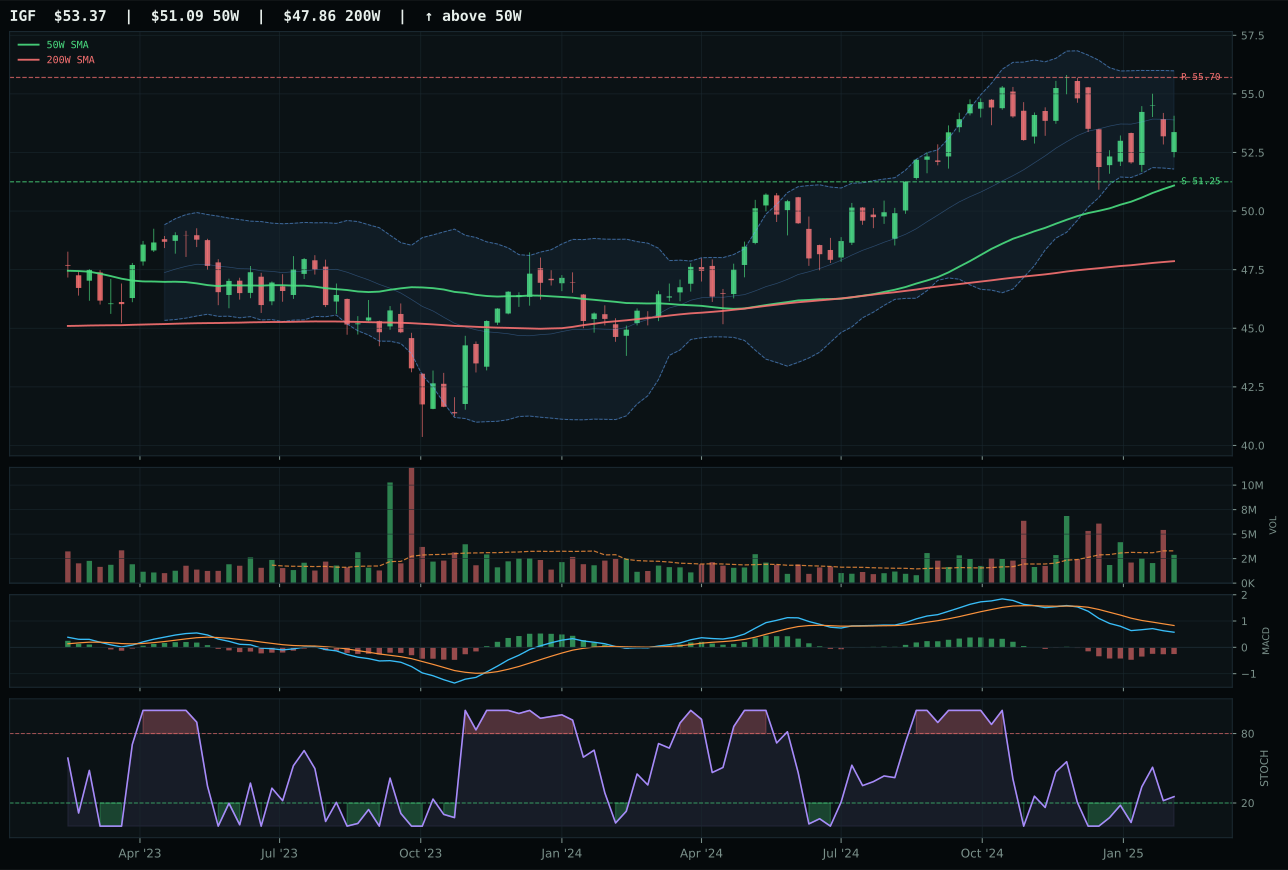
IGF has a pullback into support profile with -1.8% 13-week relative strength versus SPY.
A failed hold above support would weaken the setup.
Actionable but governed by invalidation levels.
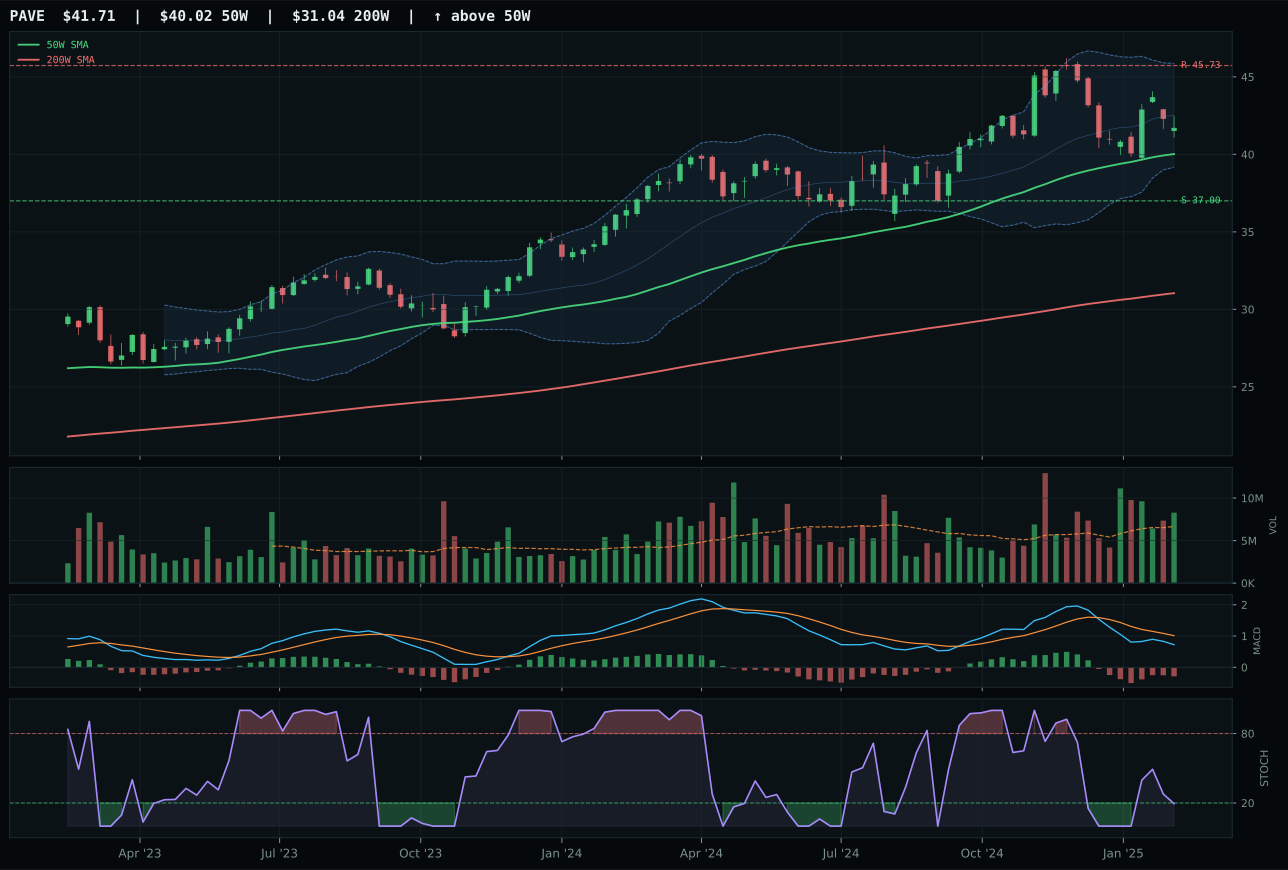
PAVE has a neutral structure profile with -7.9% 13-week relative strength versus SPY.
A failed hold above support would weaken the setup.
Actionable but governed by invalidation levels.
PAVE secures the second top-2 slot with a 67.1 final score by exploiting superior timing precision despite weaker absolute momentum. XLU is the strongest technician in the basket (composite 79, trend 90), but PAVE's timing score is 97.0 versus XLU's 85.0—a 12-point gap driven by XLU's falling/neutral stochastic and neutral volume versus PAVE's oversold stochastic (0.19) and above-average participation (1.24x). PAVE is only 4.2% from the 50-week moving average, placing it at the exact inflection between repair and breakdown, while XLU sits further away at better technical positioning but weaker entry geometry. PAVE's 13-week return of negative 7.5% is worse than XLU's negative 1.3%, and category-relative strength is negative 6.1% versus 0.0%, yet the defined-risk setup at middle Fibonacci (0.382) justifies the representative selection.
Utilities & Infrastructure ranks as the second-highest-scoring category at 67.1 and earns the 10% top-2 allocation slot. Macro fit is strong at 68.0/100: disinflation is positive for regulated utilities and long-duration infrastructure (+7), broad market bear adds defensive bid (+4), and the transition/mixed regime supports capex-heavy infrastructure projects (+4). Unlike growth or cyclical categories, utilities and infrastructure are duration hedges—lower rates benefit bond proxies and contracted cash-flow assets. PAVE's positioning in domestic infrastructure adds capex beta and benefits from government infrastructure spending narratives. The category's weakness (negative 13-week returns, falling MACD) is offset by macro tailwinds and the strategic role of boring, cash-generative assets in a disinflation backdrop. Maintaining this 10% allocation depends on rate-cut expectations remaining intact; aggressive reflation or equity risk-on reversal would trigger reallocation to higher-beta categories.
Defense & Aerospace — ITA
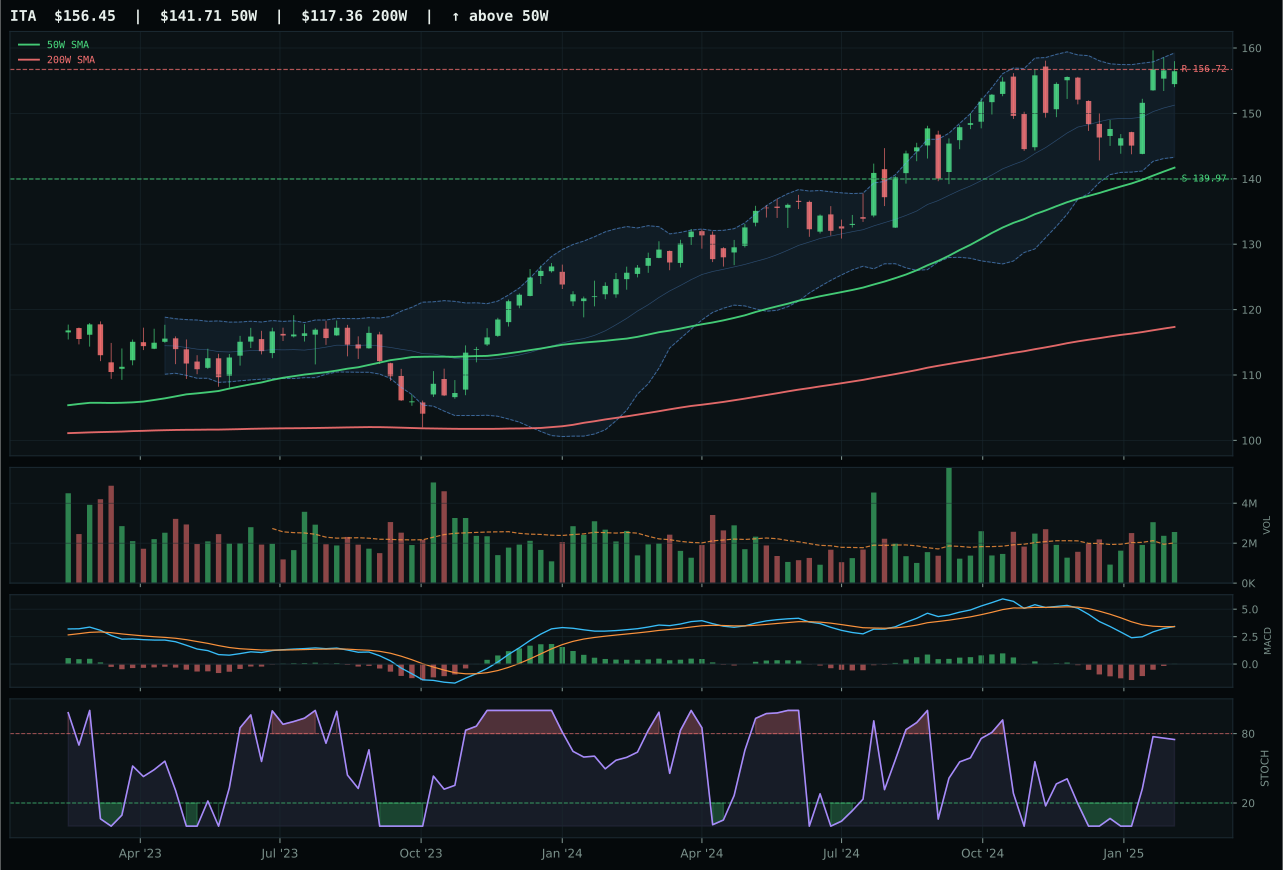
ITA has a neutral structure profile with -0.0% 13-week relative strength versus SPY.
A failed hold above support would weaken the setup.
Actionable but governed by invalidation levels.
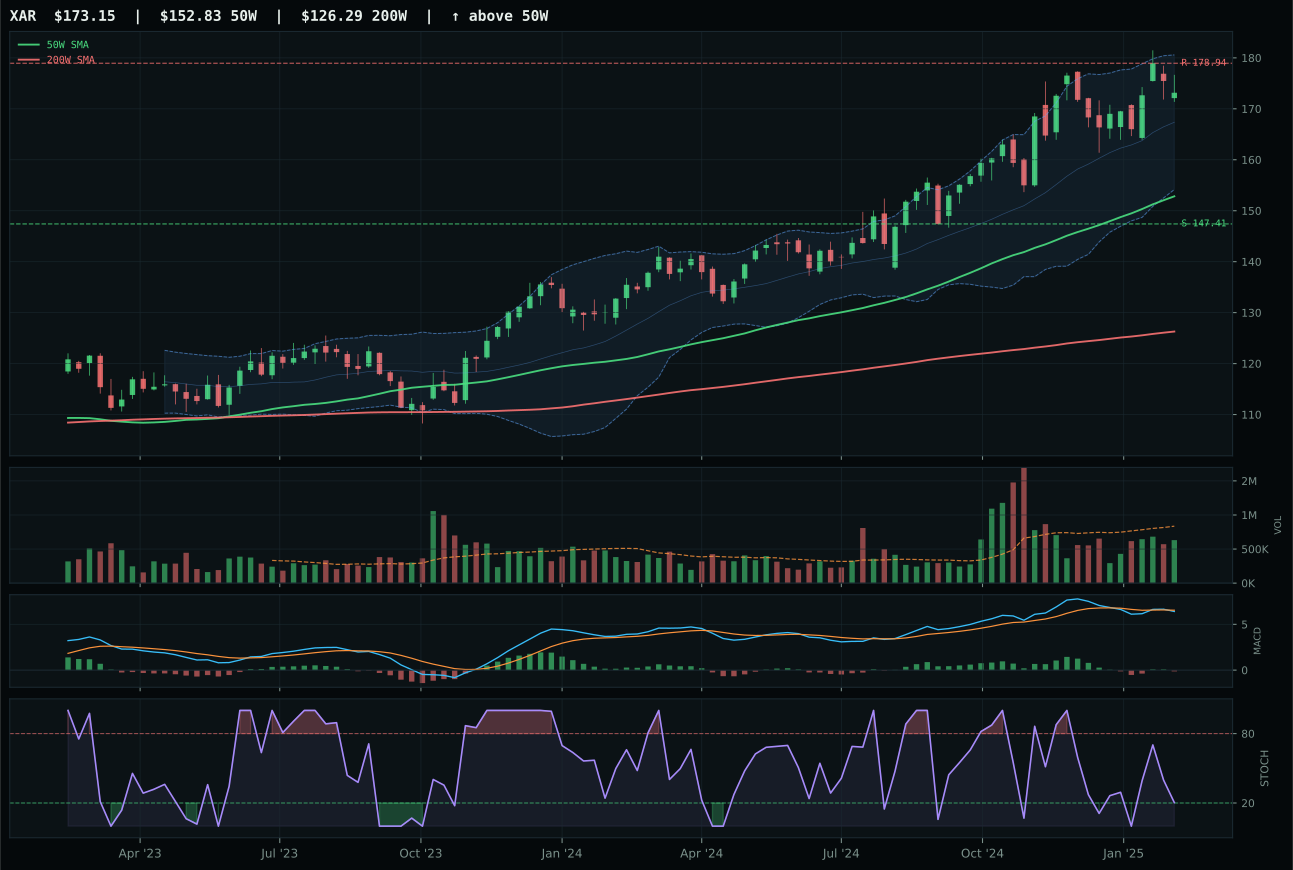
XAR has a neutral structure profile with 2.3% 13-week relative strength versus SPY.
A failed hold above support would weaken the setup.
Actionable but governed by invalidation levels.
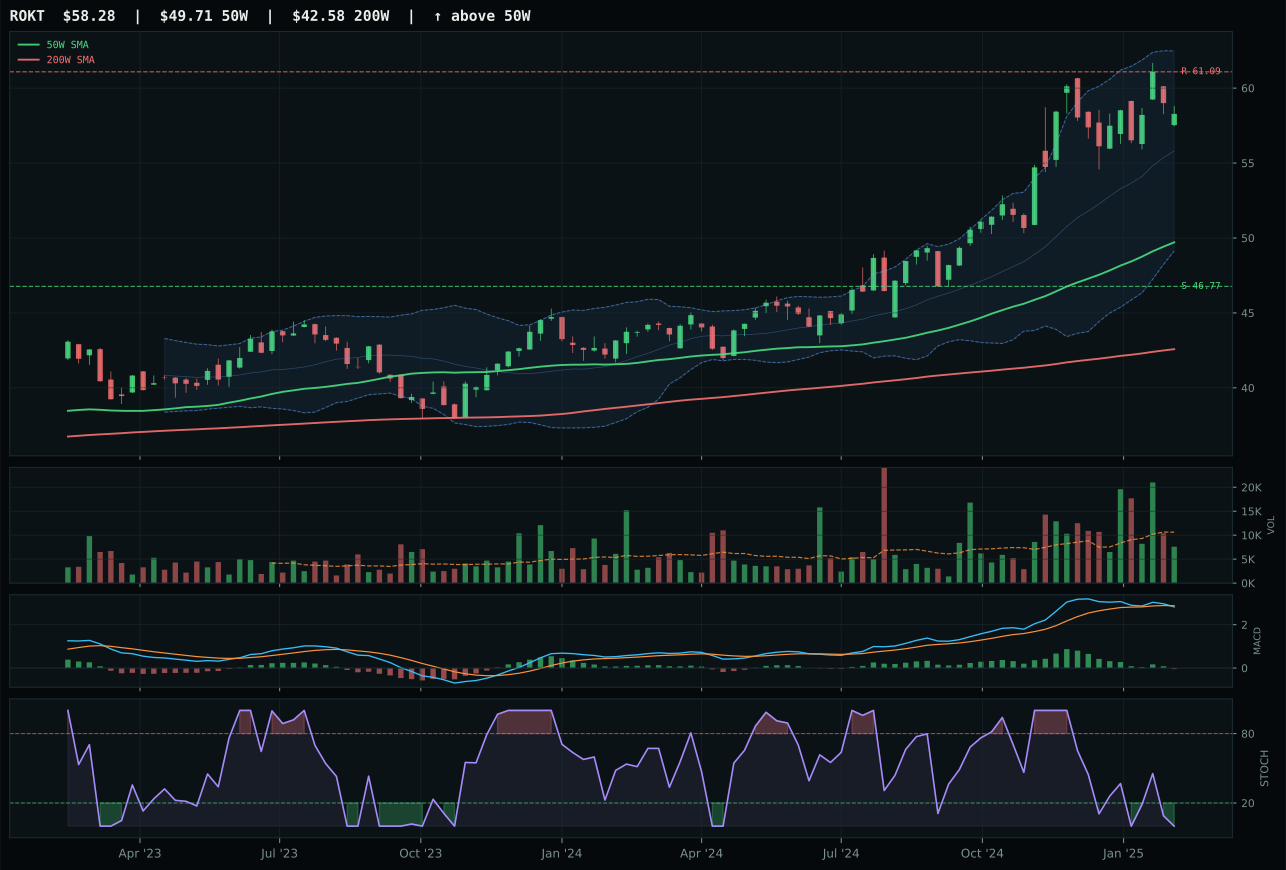
ROKT has a vertical extension profile with 6.1% 13-week relative strength versus SPY.
A failed hold above support would weaken the setup.
Tracked, but not top-2 eligible because: .
ITA wins a razor-thin decision over XAR by 1.3 points, deciding the contest through better MACD confirmation and cleaner structure. Both sit above the 50-week and 200-week moving averages in neutral structures, but ITA's MACD is bullish and improving while XAR's is bearish but improving—a meaningful gap in momentum direction. ITA's stochastic RSI is rising mid-zone versus XAR's falling/neutral, another indication that momentum is stabilizing rather than rolling over. Structure scores favor ITA (72.1 vs 71.0), and volume participation (1.27x) exceeds XAR's neutral reading. The 13-week return of 0.4% is uninspiring, but category-relative strength of -2.4% places ITA at parity with XAR's 0.0%, eliminating relative advantage as a tiebreaker. Risk/reward is constrained (upside capped at -0.2% to resistance) and the setup trades on defense-prime durability rather than emerging conviction.
Defense & Aerospace earns 5% in the tier-2 slot with a 59.1 final score, placing it inside the top-8 but well below the top-2 threshold. Macro fit is neutral-positive at 58.0/100: broad market bear is active and positive (+6), dollar pressure supports defense budgets (+3), but credit stress and liquidity concerns trim the upside. The category benefits from geopolitical tail-risk hedging in a mixed macro backdrop, yet technical momentum is loose—ITA's 13-week return barely registering and MACD confirmation requiring constant scrutiny. The 5% allocation reflects a holding pattern: the category is too defensive and too late in the cycle to justify top-2 capital, yet the broad-market-bear environment and fiscal support narrative keep it relevant. Pushing this to top-2 would require either a sharp risk-off catalyst that triggers flight-to-safety flows or evidence of institutional accumulation at current levels.
AI — AIQ
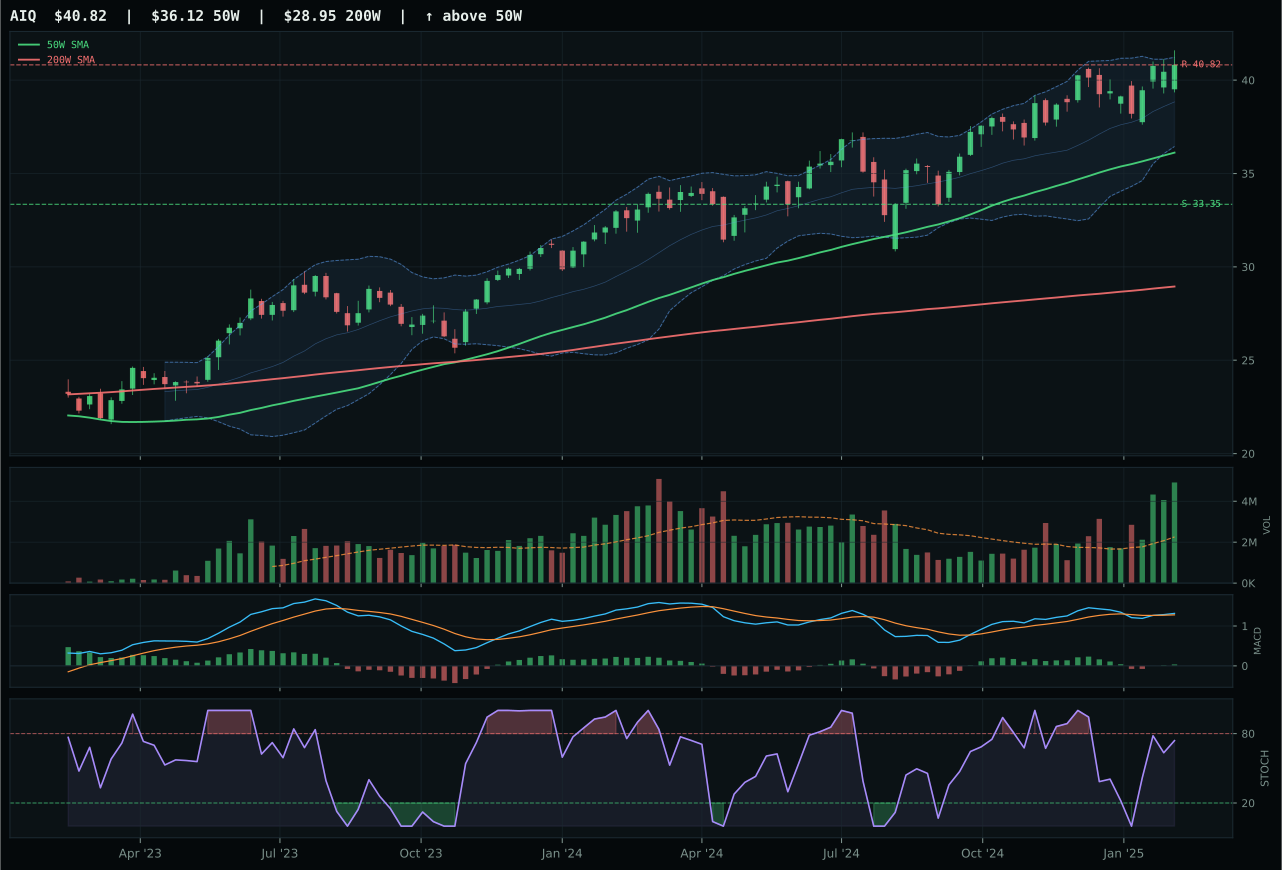
AIQ has a neutral structure profile with 4.9% 13-week relative strength versus SPY.
A failed hold above support would weaken the setup.
Actionable but governed by invalidation levels.
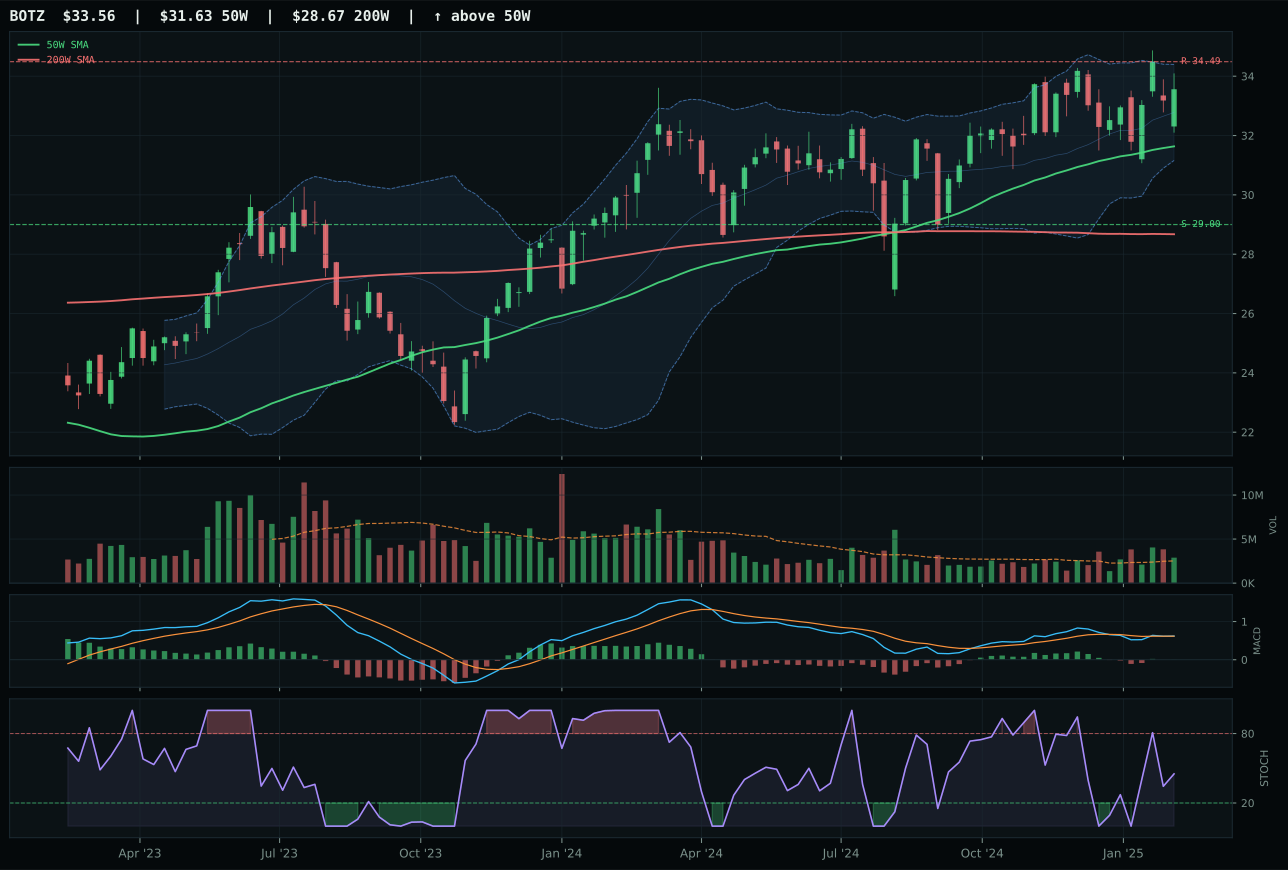
BOTZ has a neutral structure profile with -0.9% 13-week relative strength versus SPY.
A failed hold above support would weaken the setup.
Actionable but governed by invalidation levels.
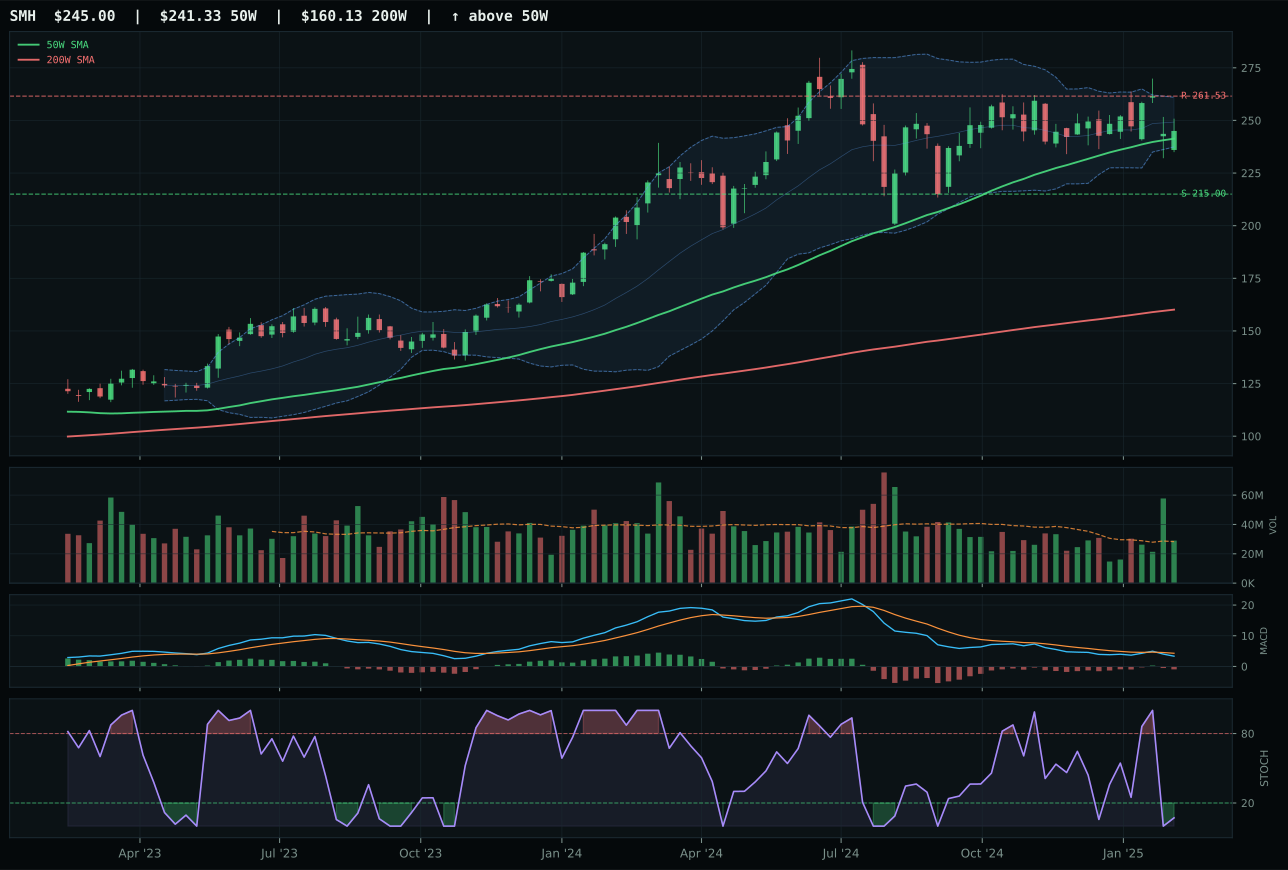
SMH has a compression near 50W profile with -6.0% 13-week relative strength versus SPY.
A failed hold above support would weaken the setup.
Actionable but governed by invalidation levels.
AIQ edges BOTZ by 9.6 points through superior technical sponsorship and breadth. Both are neutral structures sitting above their 50-week and 200-week moving averages, but AIQ's volume profile—2.18x the 20-week average with accumulation/confirmation—is materially stronger than BOTZ's above-average participation. AIQ's 13-week return of 5.3% and category-relative strength of 5.8% establish sustained outperformance, while BOTZ flatlined at -0.5% over 13 weeks with zero category-relative edge. MACD is bullish and improving for both, but AIQ's cleaner structure (80.6 vs 75.9) and rising mid-zone stochastic RSI at 0.74 convey less overbought stress than BOTZ's equivalent reading. The 13% distance from the 50-week and timing score of 75.0 position AIQ as a controlled entry rather than an extended chase.
AI receives 5% in the tier-2 allocation slot despite a solid 48.5 final score. The category's macro fit is poor at 23.0/100: liquidity stress, credit stress, broad market bear risk, and dollar pressure all penalize growth and cyclical AI exposure during a disinflation regime. Technical evidence is robust (AIQ's 78.4 reasoned score is strong), but macro headwinds—specifically the -12 hit from liquidity stress and -8 from credit stress—override upside momentum. The category earns its 5% sleeve because the technicals remain constructive and the broadest measure of AI breadth (neutral to rising MACD, volume accumulation) suggests patient institutional participants are still building. Improvement would require either macro relief signals (credit spreads narrowing, liquidity conditions normalizing) or a full capitulation washout that creates fresh support recognition.
Technology — CIBR
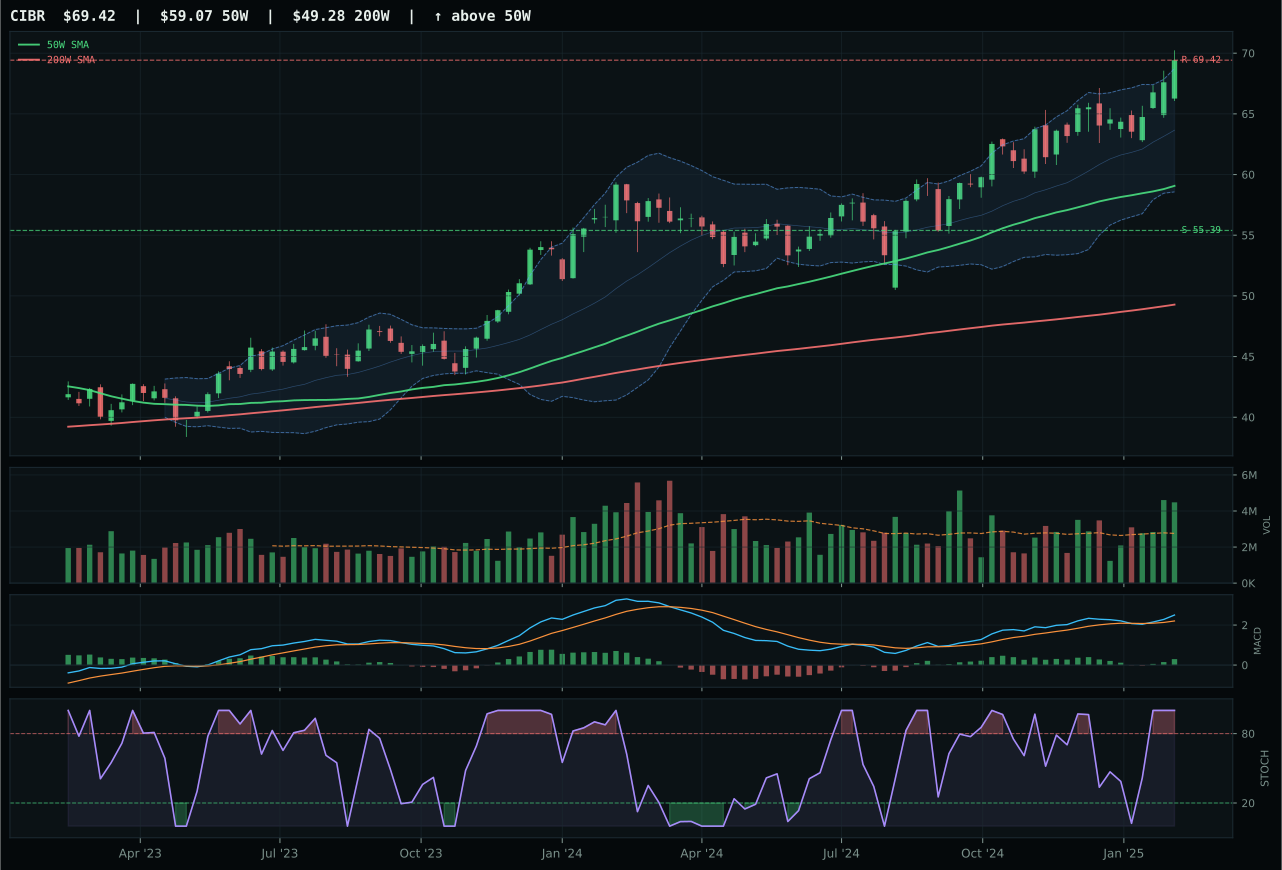
CIBR has a vertical extension profile with 8.5% 13-week relative strength versus SPY.
A failed hold above support would weaken the setup.
Actionable but governed by invalidation levels.
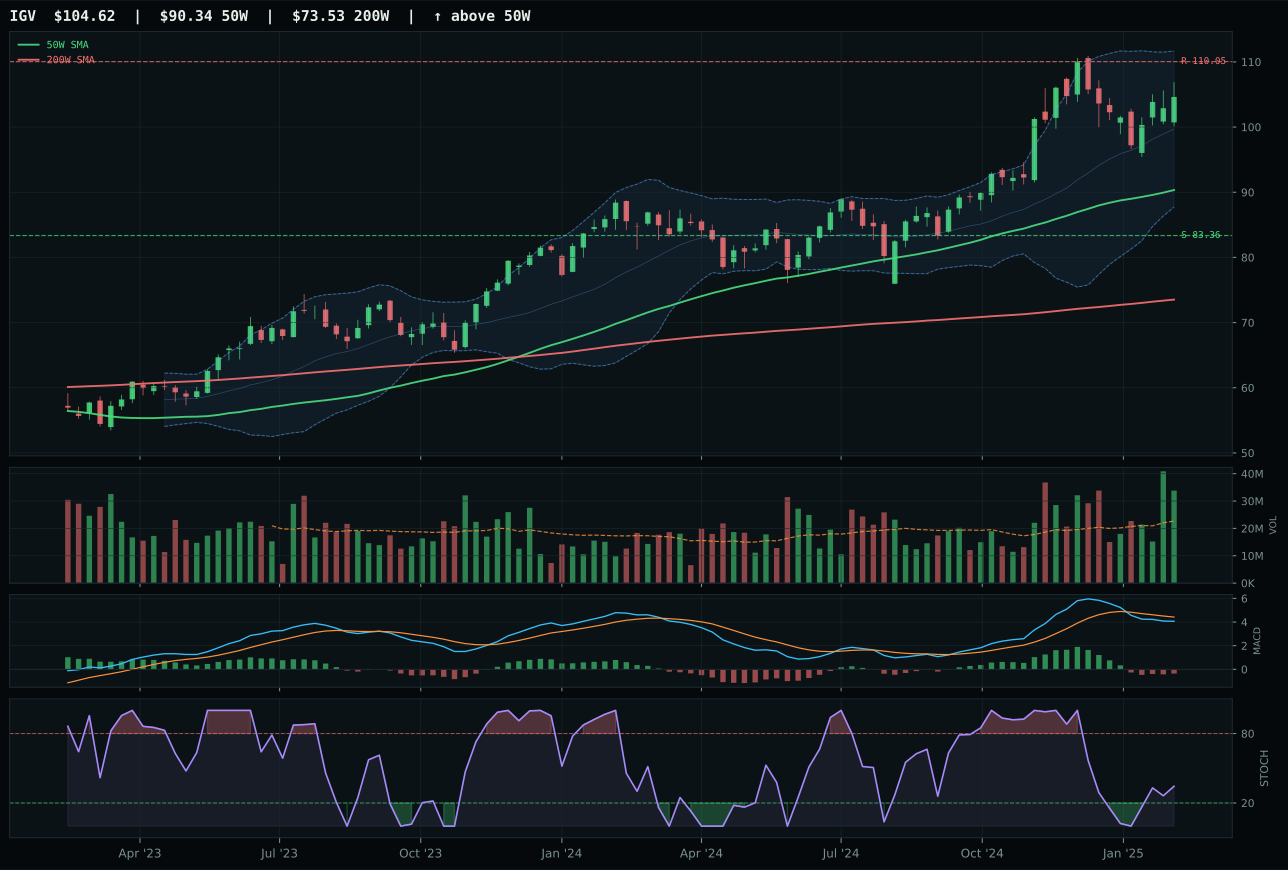
IGV has a vertical extension profile with 2.9% 13-week relative strength versus SPY.
A failed hold above support would weaken the setup.
Actionable but governed by invalidation levels.
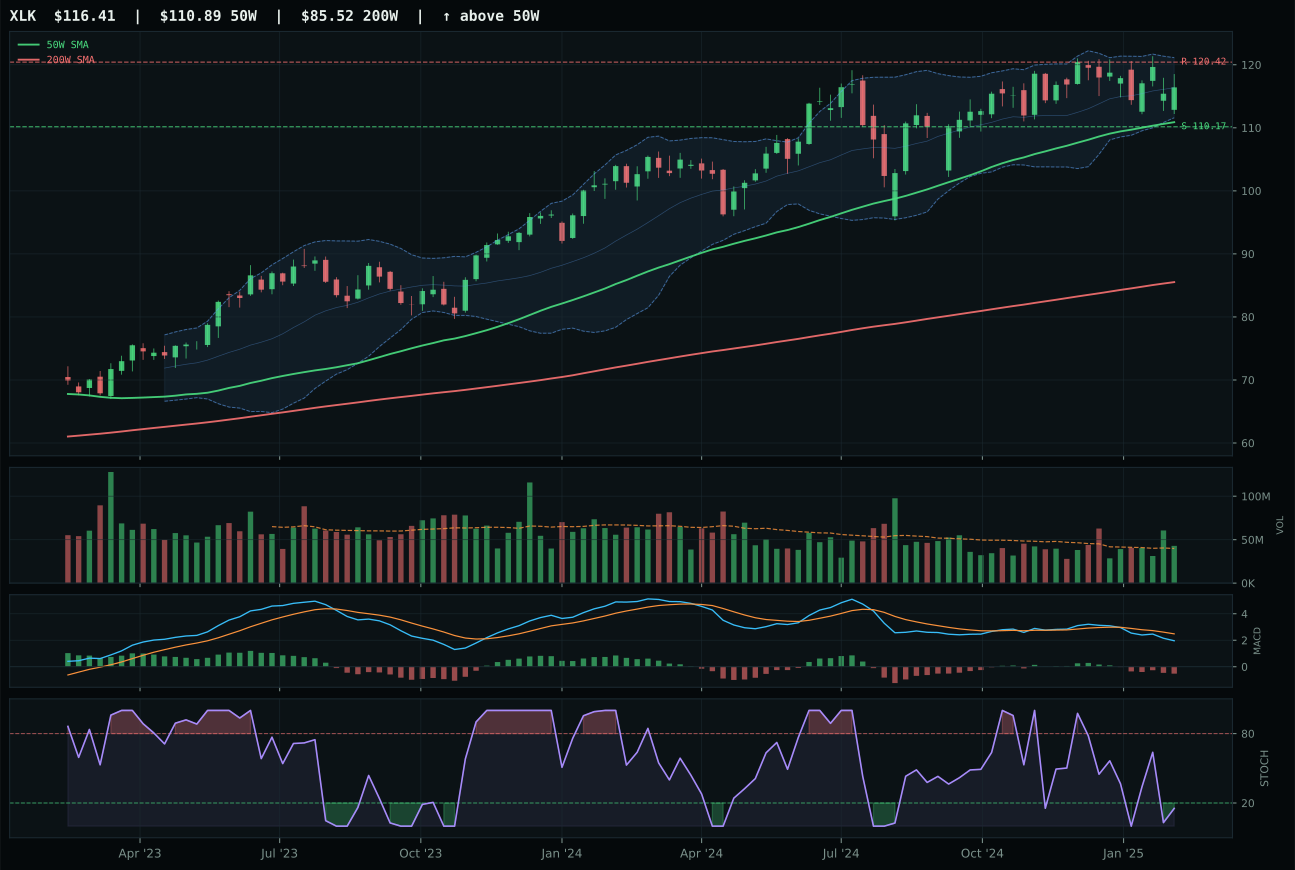
XLK has a neutral structure profile with -2.3% 13-week relative strength versus SPY.
A failed hold above support would weaken the setup.
Actionable but governed by invalidation levels.
CIBR prevails with a cleanly structured vertical extension that is being actively accumulated rather than passively held. Price sits 17.5% above the 50-week moving average with MACD bullish and improving, stochastic RSI at overbought momentum, and volume confirming at 1.63x the 20-week average—the hallmark of sponsored strength. Category-relative strength of 5.6% and SPY-relative strength of 8.5% demonstrate that cybersecurity is outpacing both the broad market and its own peer set, IGV, which trails by 12.6 points due to weaker MACD (bearish/weakening), inferior volume confirmation, and near-zero category-relative strength. The setup carries extension risk—every new buyer arrives late—but the quality of accumulation and relative outperformance justify the selection for the 5% tier-2 sleeve.
Technology ranks outside the top-2 with a final score of 35.3, earning a 5% allocation in the tier-2 sleeve. The category's 40.0/100 macro fit severely constrains its appeal despite solid technical evidence: disinflation helps the exposure and relative strength arguments are real, but liquidity stress, credit stress, and dollar pressure all active simultaneously create structural headwinds that cap upside. In a disinflation regime, growth and duration-sensitive businesses typically underperform; this category's placement reflects the portfolio's defensive lean. For Technology to move into top-2 consideration, macro conditions would need to shift toward risk-on sentiment and liquidity normalization, or the technicals would need to demonstrate capitulation-style consolidation with institutional accumulation at lower prices.
Nuclear Energy — NLR
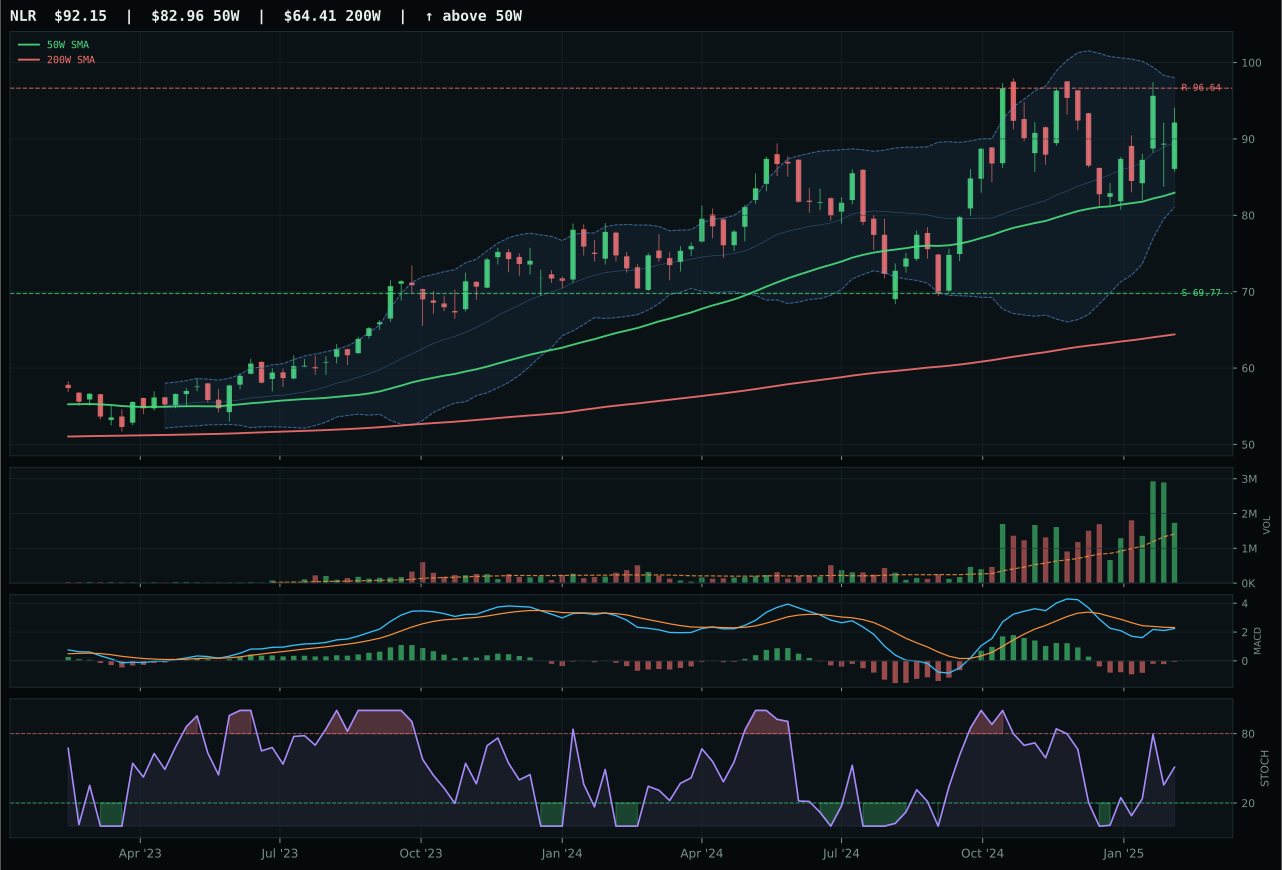
NLR has a neutral structure profile with 1.1% 13-week relative strength versus SPY.
A failed hold above support would weaken the setup.
Actionable but governed by invalidation levels.
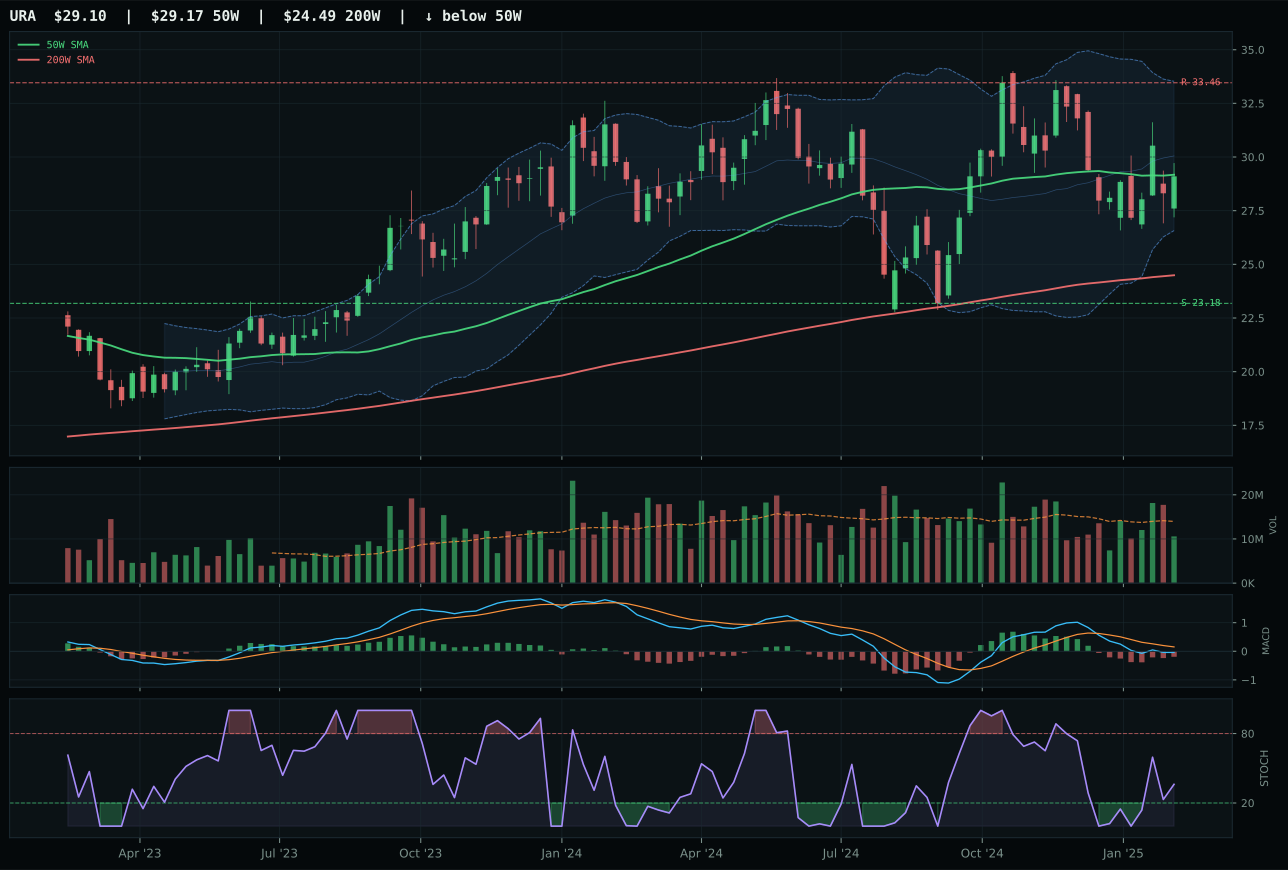
URA has a compression near 50W profile with -6.6% 13-week relative strength versus SPY.
A failed hold above support would weaken the setup.
Actionable but governed by invalidation levels.
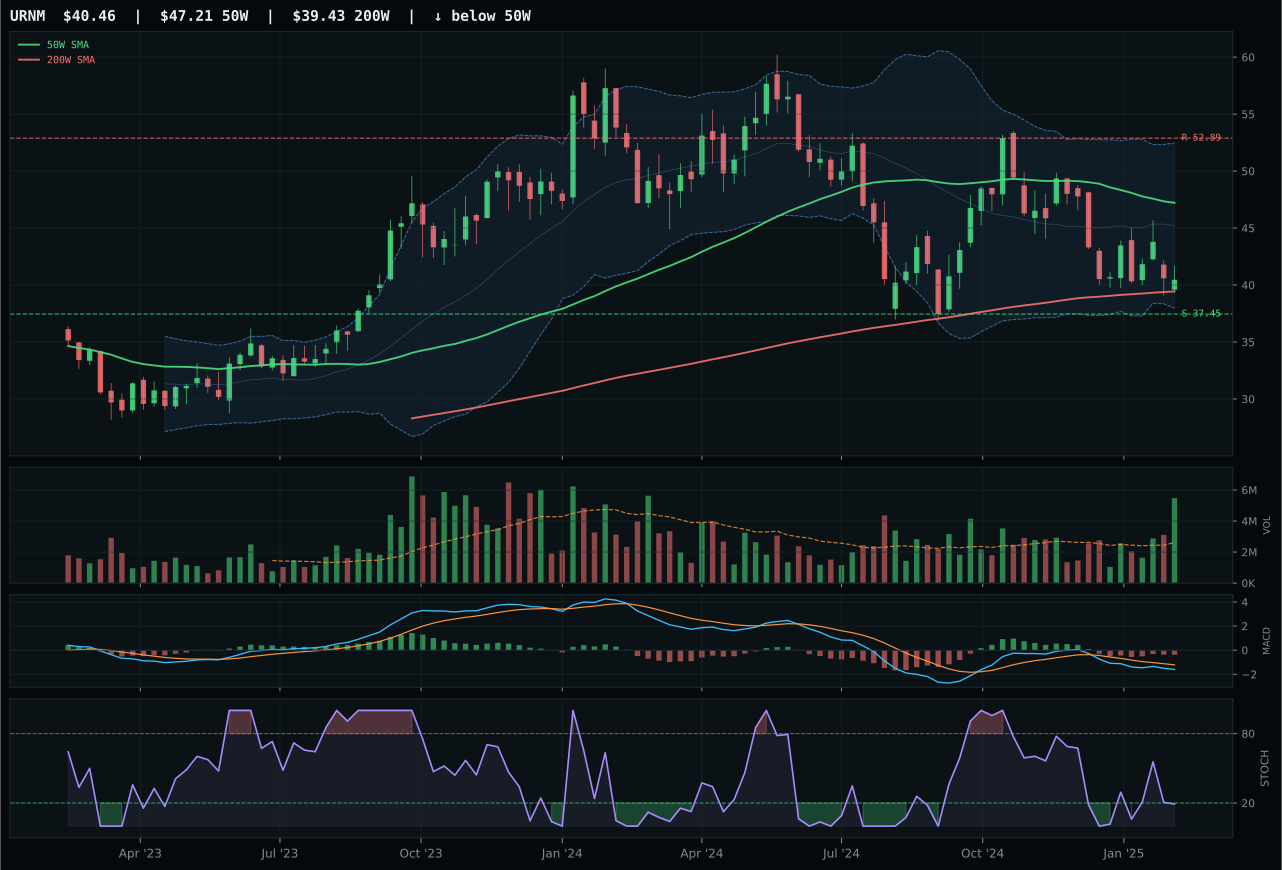
URNM has a neutral structure profile with -13.5% 13-week relative strength versus SPY.
A failed hold above support would weaken the setup.
Actionable but governed by invalidation levels.
NLR claims the 5% tier-2 slot over URA by 6.2 points through stronger category-relative strength and cleaner accumulation signals. Both sit above their 50-week and 200-week moving averages in neutral structures, but NLR's relative strength advantage is substantial: 7.6% category-relative versus 0.0%, and 1.1% SPY-relative versus negative 6.6%. Volume at 1.23x the 20-week average exceeds URA's neutral participation, and NLR's MACD (bearish but improving) with rising mid-zone stochastic RSI (0.51) conveys stabilization more convincingly than URA's compression near the 50-week with falling stochastic. NLR's 13-week return is weak at 1.5%, but the 26-week return (26.7%) establishes longer-term uptrend persistence that URA cannot match. The 11.1% distance from the 50-week carries extension risk, but institutional breadth (7.6% category-relative outperformance) validates the positioning.
Nuclear Energy earns 5% in the tier-2 allocation with a score of 31.6. Macro fit is mixed at 34.0/100: liquidity stress (-7), credit stress (-5), and risk appetite broken (-4) all penalize the category, but broad market bear is active and positive (+3), providing a defensive tailwind. Unlike agricultural commodities or industrial metals, nuclear energy benefits from energy security narratives and long-duration contracted revenue (utilities regulation). NLR's category-relative strength of 7.6% suggests specialist capital is rotating into nuclear as a hedge against both energy scarcity and geopolitical risk. The 5% slot reflects a hold pattern: the technicals are constructive enough to justify inclusion, but macro headwinds and modest 13-week momentum prevent top-2 elevation. For promotion to top-2, the category would need either evidence of broader institutional adoption (rising SPY-relative strength above 3%) or a macro shift toward energy-supply risk or rate-cut speculation.
Traditional Energy — XLE
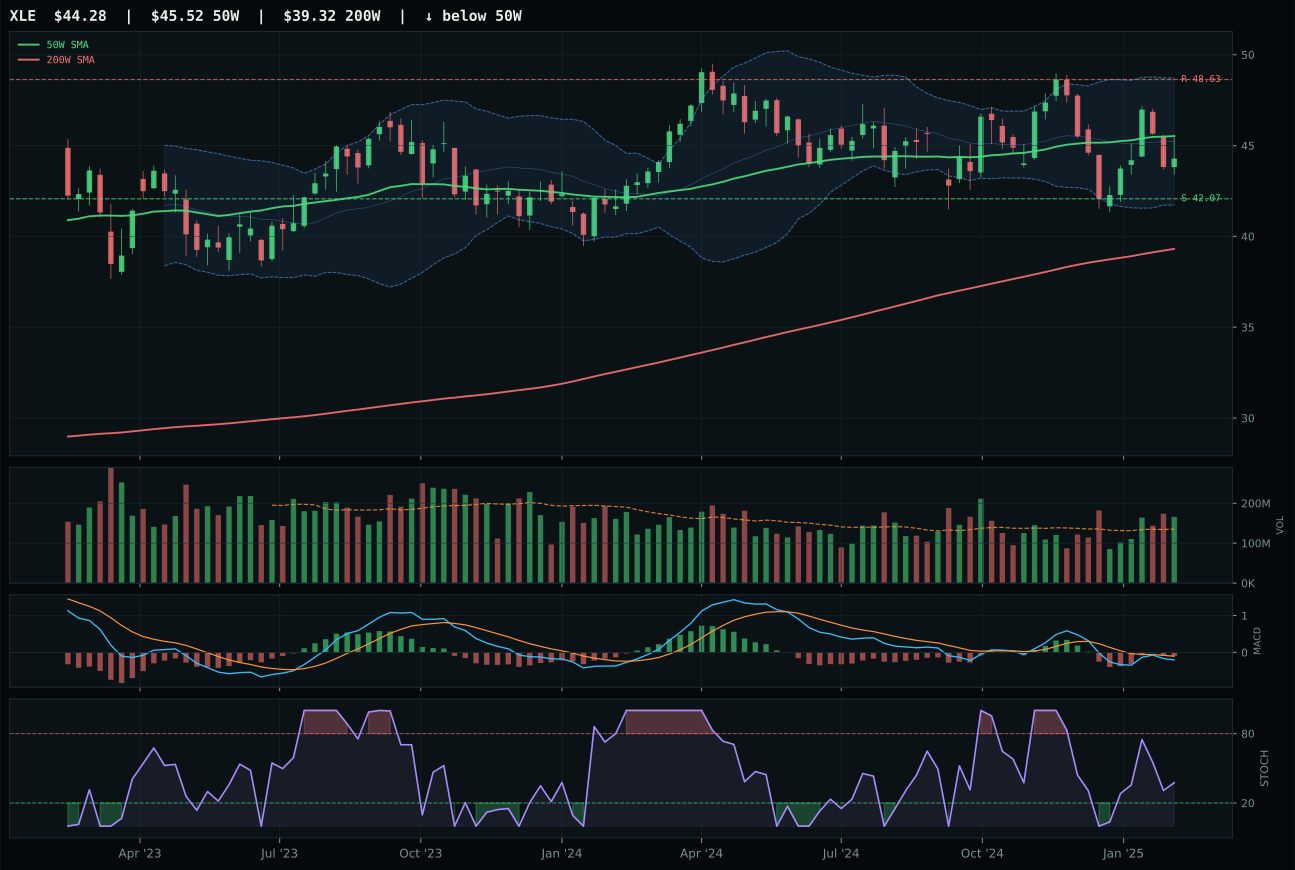
XLE has a compression near 50W profile with -6.0% 13-week relative strength versus SPY.
A failed hold above support would weaken the setup.
Actionable but governed by invalidation levels.
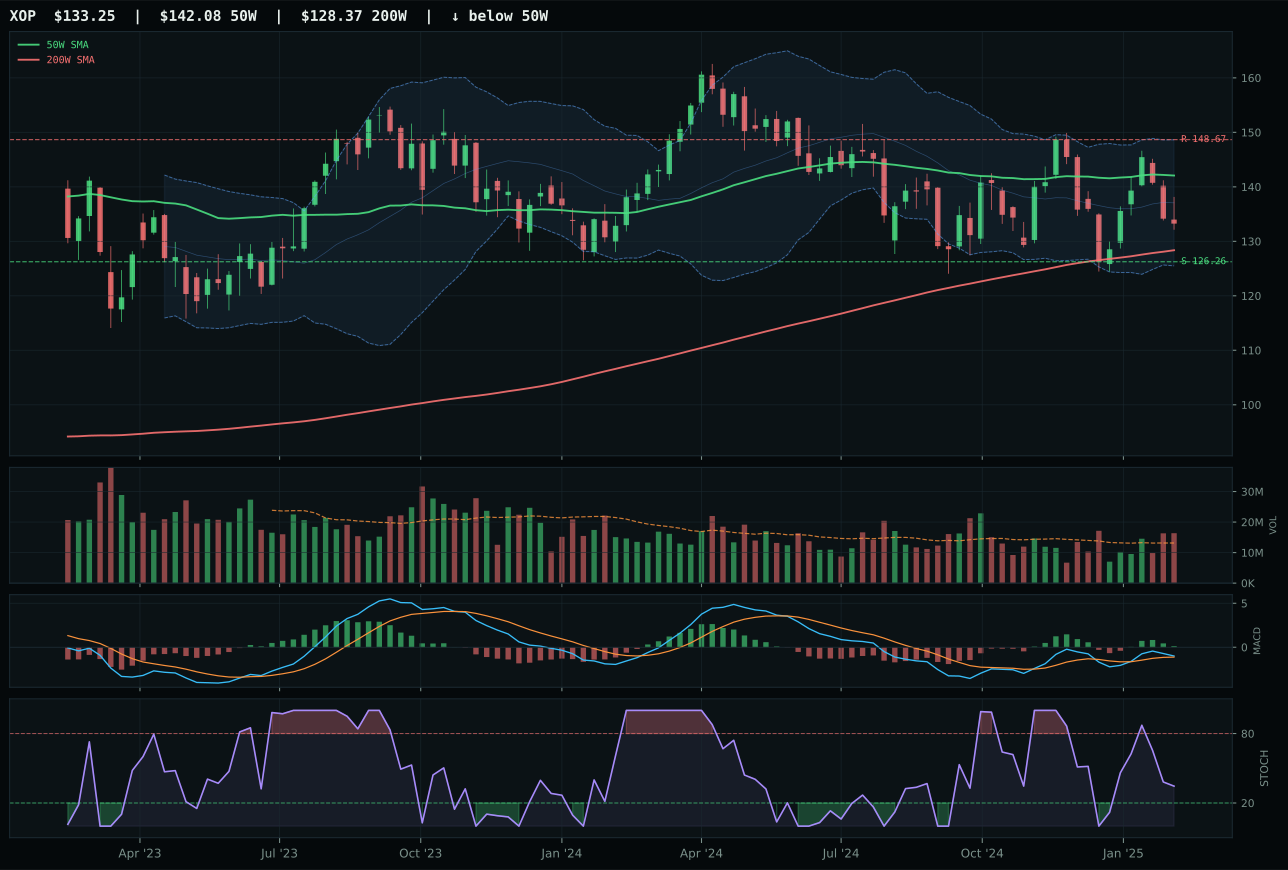
XOP has a neutral structure profile with -5.3% 13-week relative strength versus SPY.
A failed hold above support would weaken the setup.
Actionable but governed by invalidation levels.
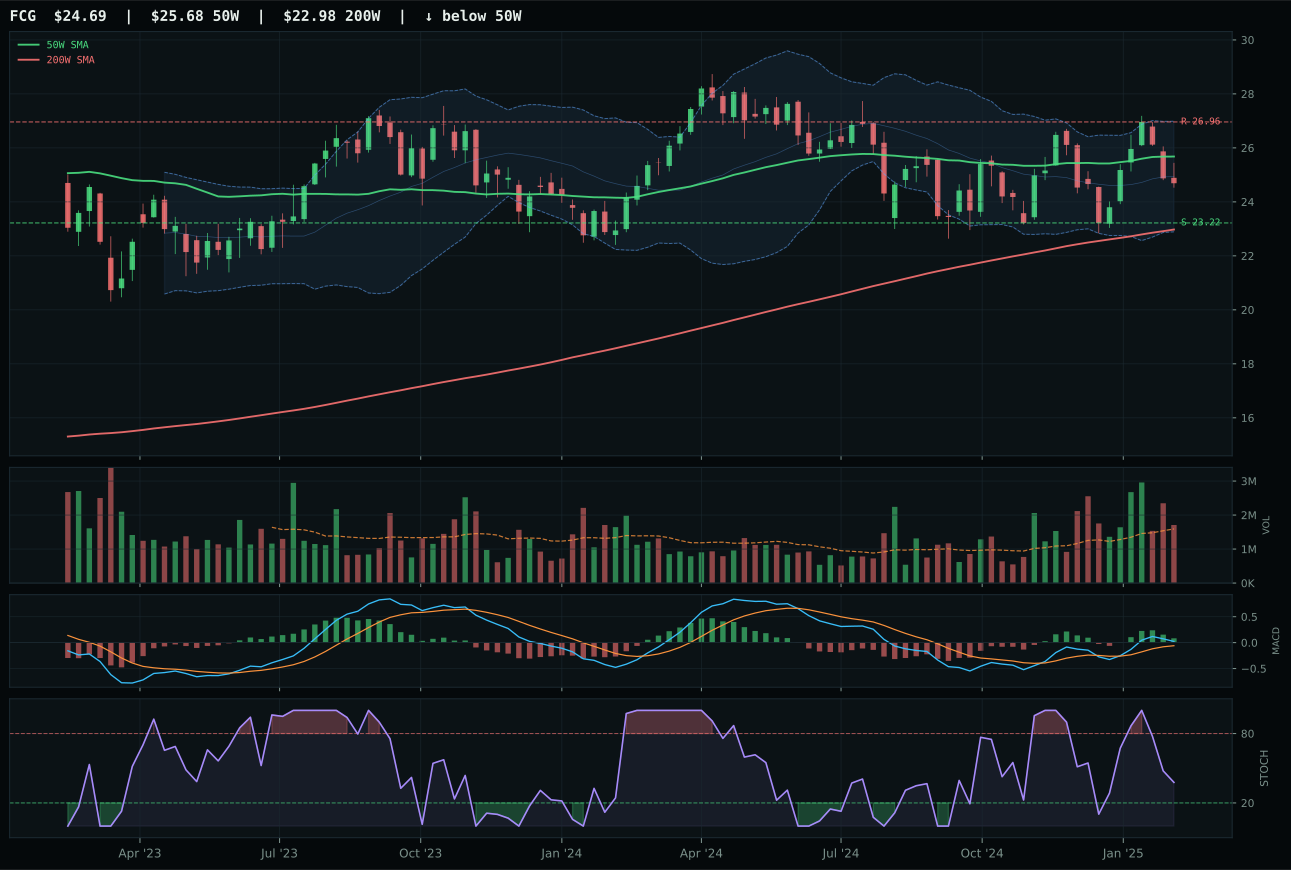
FCG has a neutral structure profile with -1.6% 13-week relative strength versus SPY.
A failed hold above support would weaken the setup.
Actionable but governed by invalidation levels.
XLE edges XOP by a thin margin to claim the tier-2 5% slot, winning on timing precision rather than momentum breadth. Price is 2.6% below the 50-week moving average in compression near support at 42.07, placing the setup at the inflection point between repair and collapse. XLE's timing score is 100.0 (maximum possible) due to MACD bearish but improving, stochastic RSI falling/neutral, and Fibonacci proximity to the near 52-week low—the inverse of strength, but the exact setup for a coil entry. XOP counters with bullish and improving MACD and a higher technical score (62.5 vs 39.3), but its timing score (82.0) is subordinate to XLE's precision. Volume for XLE is above-average participation at 1.23x, matching XOP; neither shows accumulation conviction. The 13-week return of negative 5.5% and SPY-relative strength of negative 6.0% confirm energy is a laggard in disinflation.
Traditional Energy receives 5% in the tier-2 sleeve despite a weak 10.1 final score, reflecting the 50% overlay that forces smaller allocations across all tiers. Macro fit is severely negative at 16.0/100: disinflation pressure is active and penalizes energy demand (-10), credit stress pressures capex cycles (-7), and liquidity stress constrains leverage-dependent producers (-7). The category is a laggard outright—the reasoned ETF proof order shows FCG leading at 53.0, XOP at 50.9, and XLE trailing at 35.8, yet XLE still wins the representative slot due to timing precision and pullback-into-support structure. The 5% allocation is defensive, driven by the need for energy exposure as a portfolio anchor and the compressed setup at support offering defined risk entry. Energy cannot move to top-2 without either a demand shock (geopolitical event, production disruption) or a clear supply-constraint signal; current momentum is directionally negative.
Agriculture & Livestock — WEAT
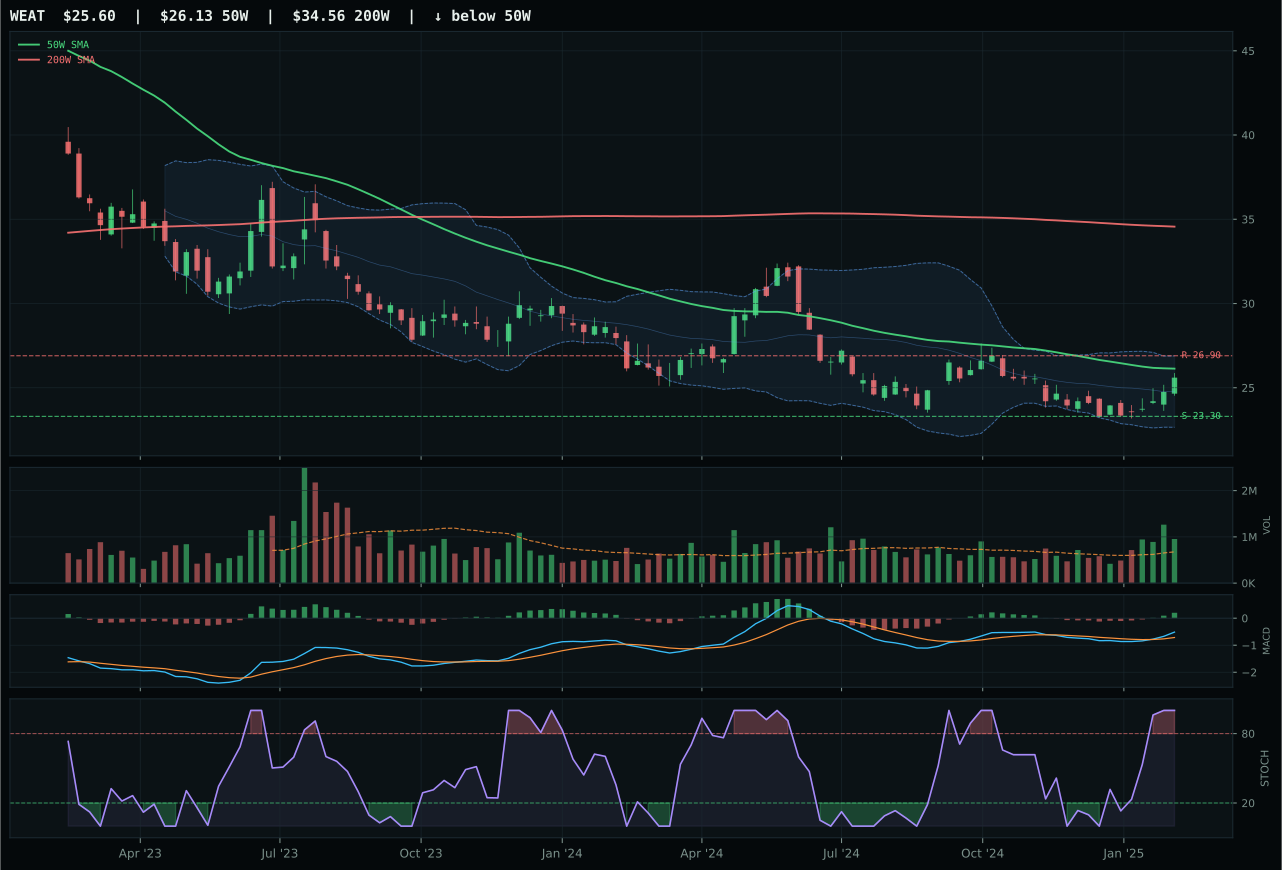
WEAT has a compression near 50W profile with -0.2% 13-week relative strength versus SPY.
Extension and support failure are the main tactical risks.
Tracked, but not top-2 eligible because: structurally broken.
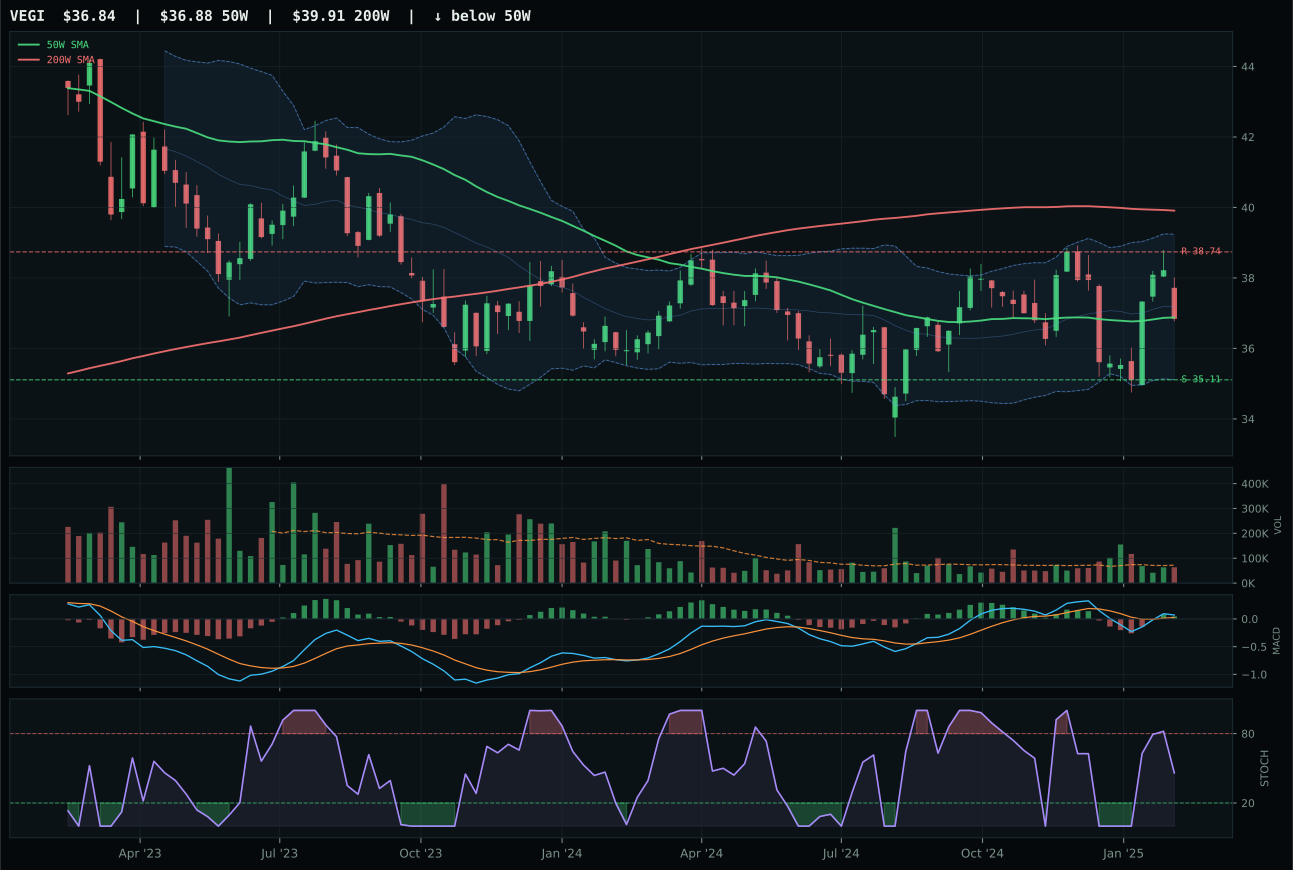
VEGI has a pullback into support profile with -0.3% 13-week relative strength versus SPY.
Extension and support failure are the main tactical risks.
Tracked, but not top-2 eligible because: structurally broken.
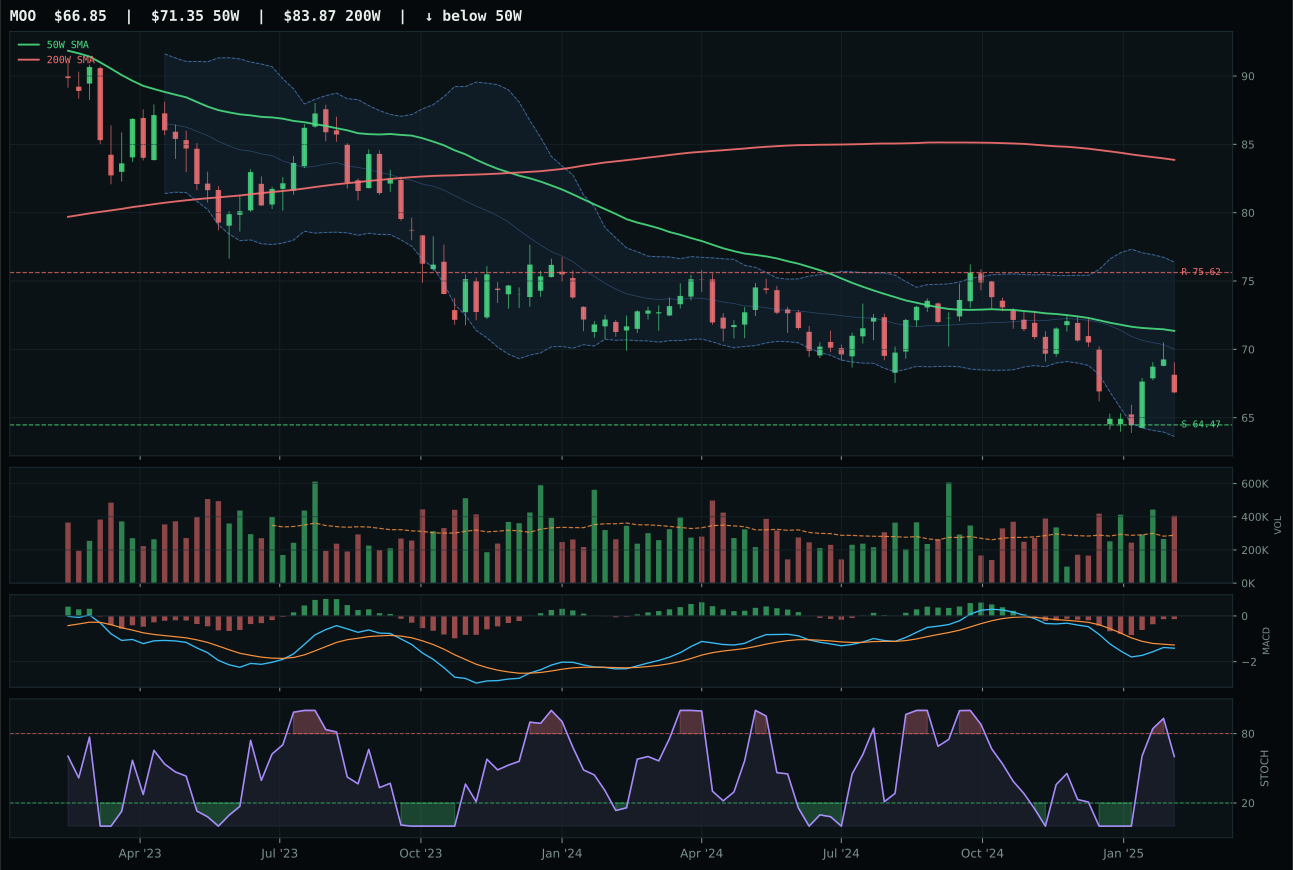
MOO has a pullback into support profile with -6.1% 13-week relative strength versus SPY.
Extension and support failure are the main tactical risks.
Tracked, but not top-2 eligible because: structurally broken.
WEAT wins by 17.2 points over VEGI, though both trades remain structurally compromised. Price is 2.0% below the 50-week moving average in a compression near the 50-week, which means support at 23.30 is the line in the sand—not a bullish setup, but a defined risk trade. WEAT's stochastic RSI sits at overbought momentum (1.00) while MACD is bullish and improving, creating a classic coil scenario where timing is precise but conviction is low. Volume at 1.41x the 20-week average exceeds VEGI's neutral participation, and category-relative strength of 0.1% versus 0.0% is immaterial but positive. The 100.0 timing score reflects proximity to the 50-week and Fibonacci support, not momentum strength—this is a trapped-money setup with limited upside to resistance (-4.8%) and tight risk/reward.
Agriculture & Livestock is excluded entirely this week with a 0.0 final score and ranked outside the allocation scheme. The category is structurally broken: disinflation pressure is a direct negative (-6), and both liquidity stress and disinflation-specific headwinds suppress commodity demand. Macro fit at 32.0/100 reflects the reality that agricultural inputs and livestock pricing deteriorate in deflationary regimes—lower wage growth, lower consumer spending, lower animal protein demand. WEAT's timing score (100.0) is a mirage; it reflects technical proximity to support, not institutional interest. The entire category basket (WEAT, VEGI, MOO) averages negative 13-week returns, and the reasoned ETF proof order (41.4, 40.4, 32.3) shows all three are trapped in downtrends. For Agriculture to earn even a 5% slot, disinflation would need to reverse or commodity prices would need to stabilize with evidence of supply-side stress returning.
Industrial Metals — COPX
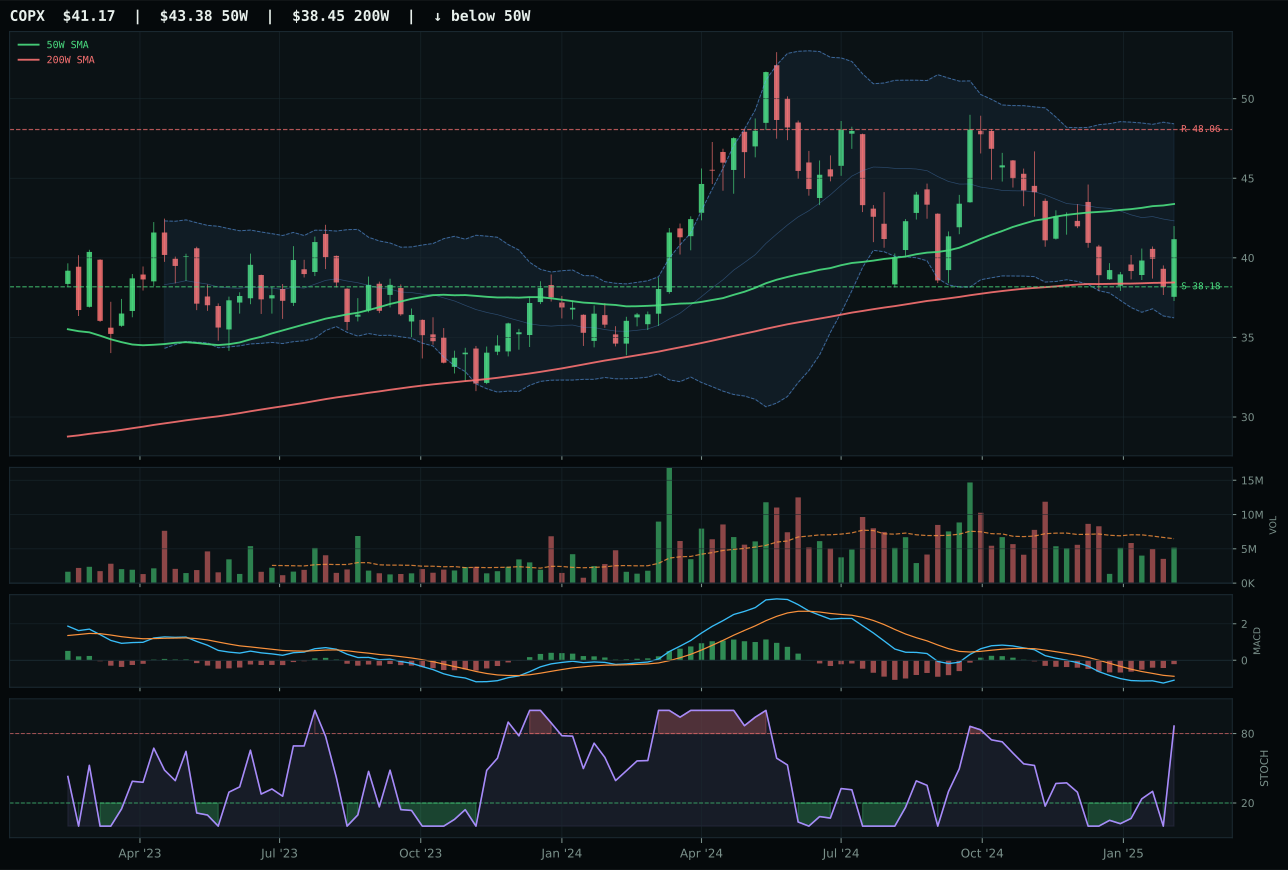
COPX has a neutral structure profile with -7.1% 13-week relative strength versus SPY.
A failed hold above support would weaken the setup.
Actionable but governed by invalidation levels.
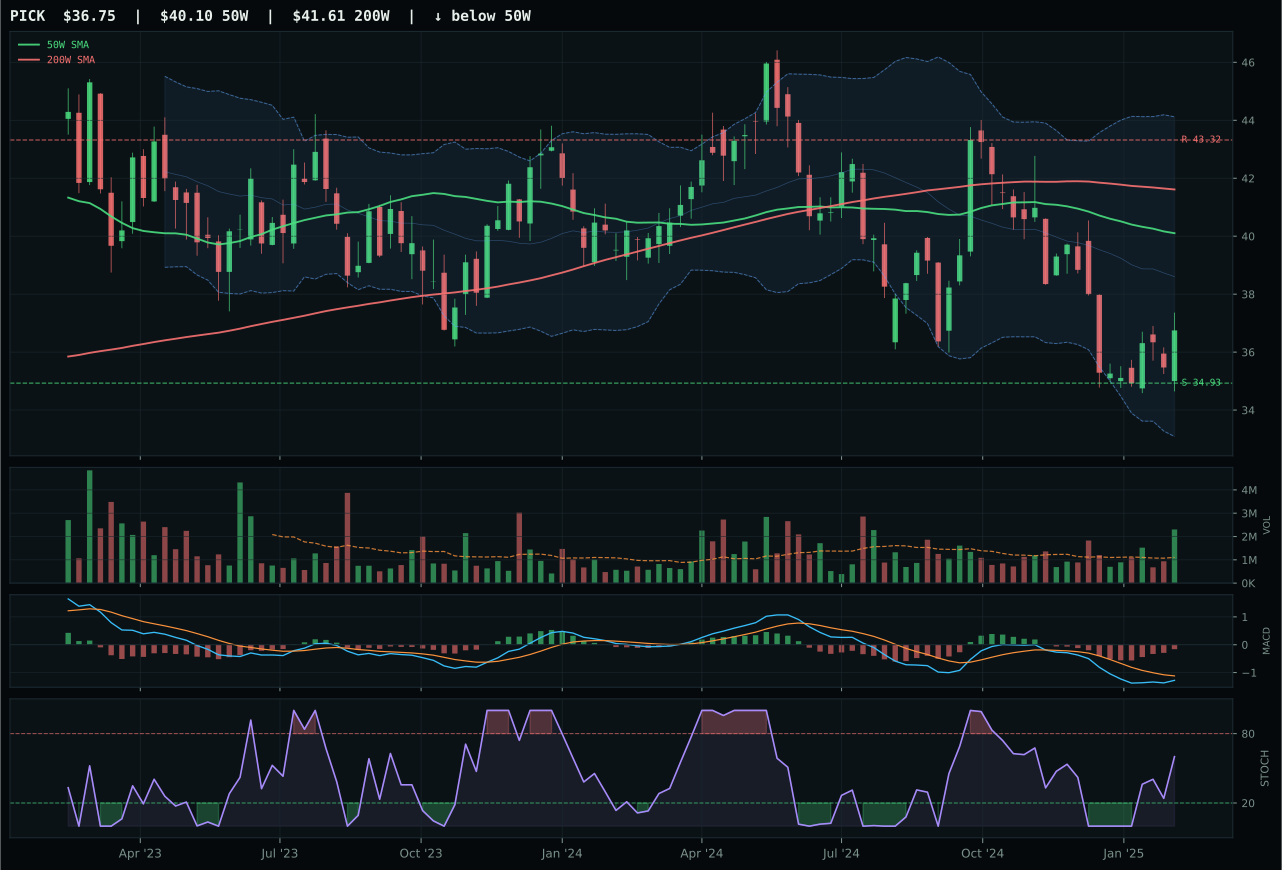
PICK has a neutral structure profile with -10.8% 13-week relative strength versus SPY.
Extension and support failure are the main tactical risks.
Tracked, but not top-2 eligible because: structurally broken.
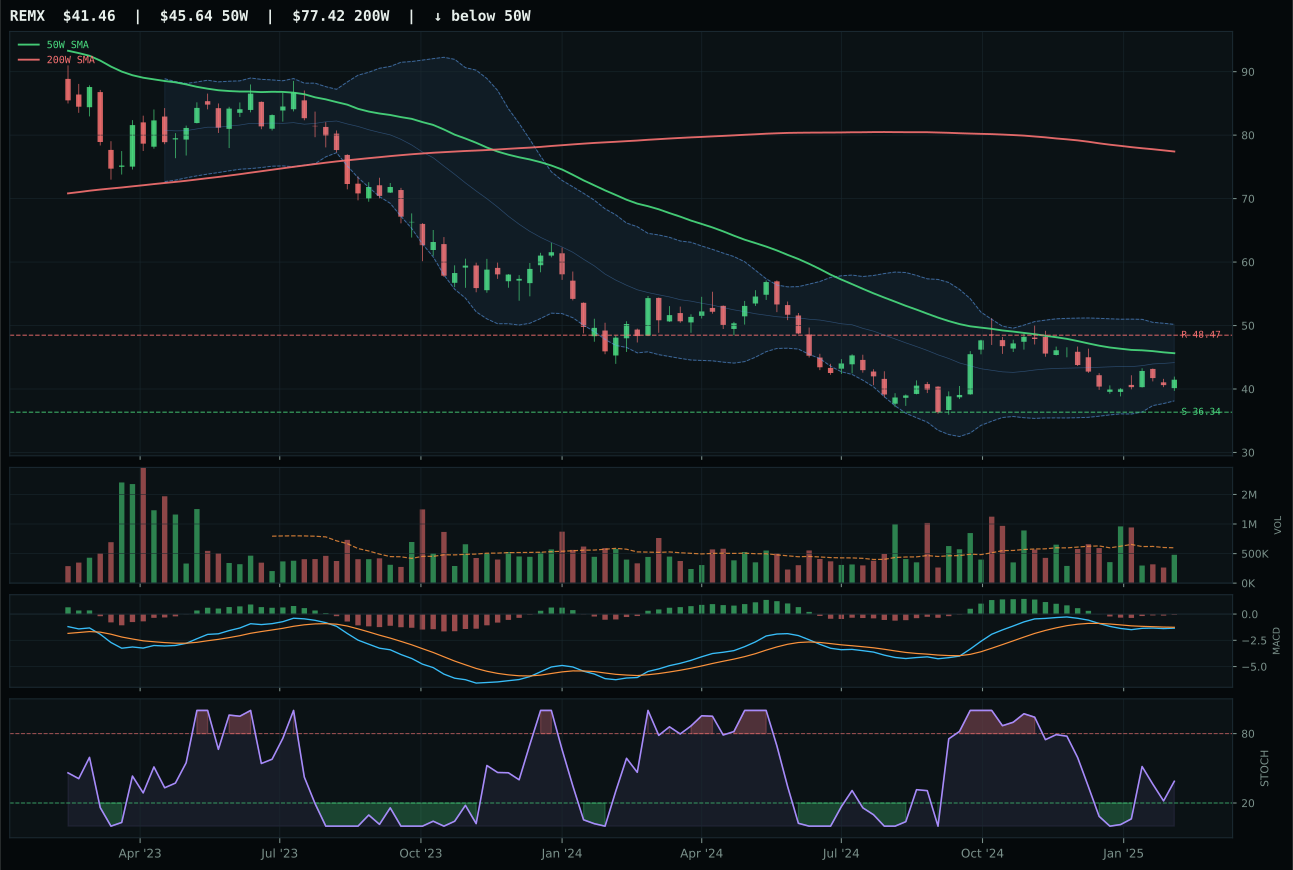
REMX has a neutral structure profile with -13.8% 13-week relative strength versus SPY.
Extension and support failure are the main tactical risks.
Tracked, but not top-2 eligible because: structurally broken.
COPX wins a decisive contest by 43.6 points, yet the category remains excluded from the portfolio. Price sits 5.1% below the 50-week moving average (pullback, not breakdown), with MACD bearish but improving and stochastic RSI at overbought momentum (0.86)—a setup that suggests exhaustion selling is fading but not that institutional buyers have arrived. Volume is neutral at 0.80x the 20-week average, a critical deficit; there is no accumulation signal. COPX's 13-week return is negative 6.7%, and SPY-relative strength is negative 7.1%, establishing that copper and industrial metals are lagging the broad market. The risk/reward is inverted (upside -14.3% to resistance versus downside 7.8% to support), and timing score at 82.0 reflects Fibonacci proximity to the decision zone, not momentum quality.
Industrial Metals earns 0% and is ranked outside the allocation entirely. The final score of 8.0 reflects structural exclusion: macro fit at 28.0/100 is the lowest of any eligible category, with dollar pressure (-7), credit stress (-7), and liquidity stress (-8) all active and negative. In a disinflation regime, industrial-metals demand collapses as capex cycles contract and credit stress dampens project starts. COPX's 13-week return is sharply negative, and the entire reasoned proof order (COPX 51.9, PICK 39.4, REMX 19.6) shows a basket in unambiguous downtrend. For Industrial Metals to earn allocation, either disinflation would need to reverse or there would need to be evidence of central-bank strategic stockpiling or supply constraints forcing institutional reaccumulation. Currently, neither condition is present.
Emerging Markets — INDA
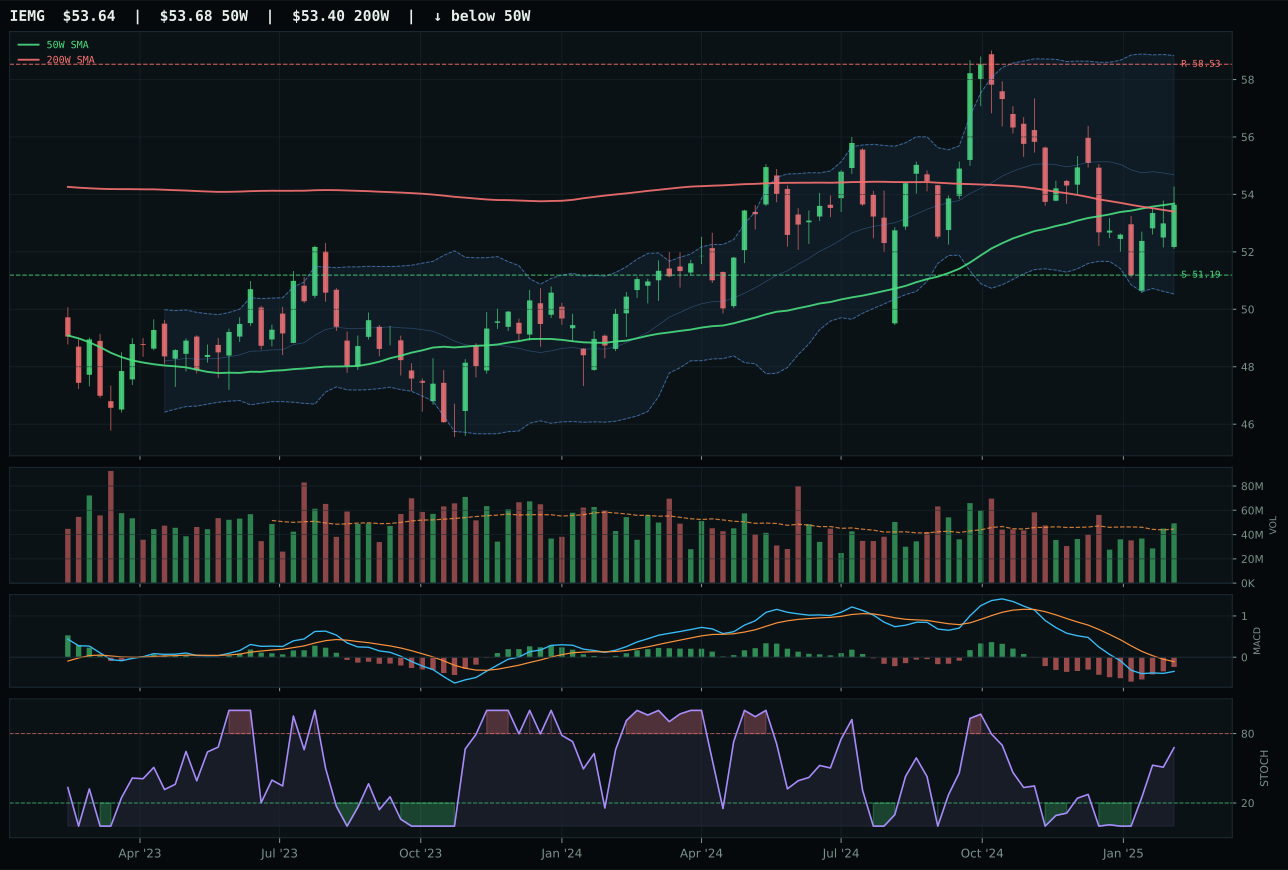
IEMG has a pullback into support profile with -4.4% 13-week relative strength versus SPY.
A failed hold above support would weaken the setup.
Actionable but governed by invalidation levels.
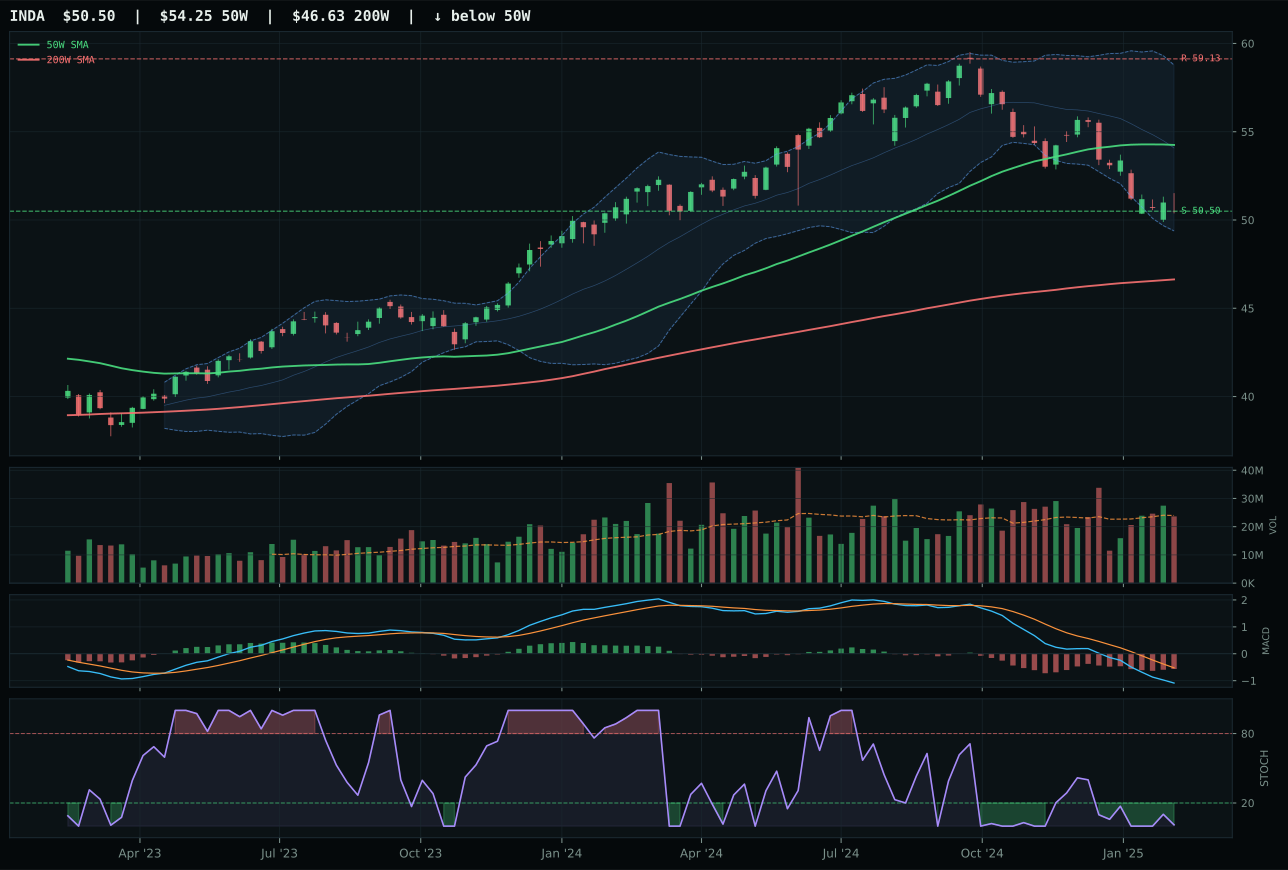
INDA has a pullback into support profile with -7.5% 13-week relative strength versus SPY.
A failed hold above support would weaken the setup.
Actionable but governed by invalidation levels.
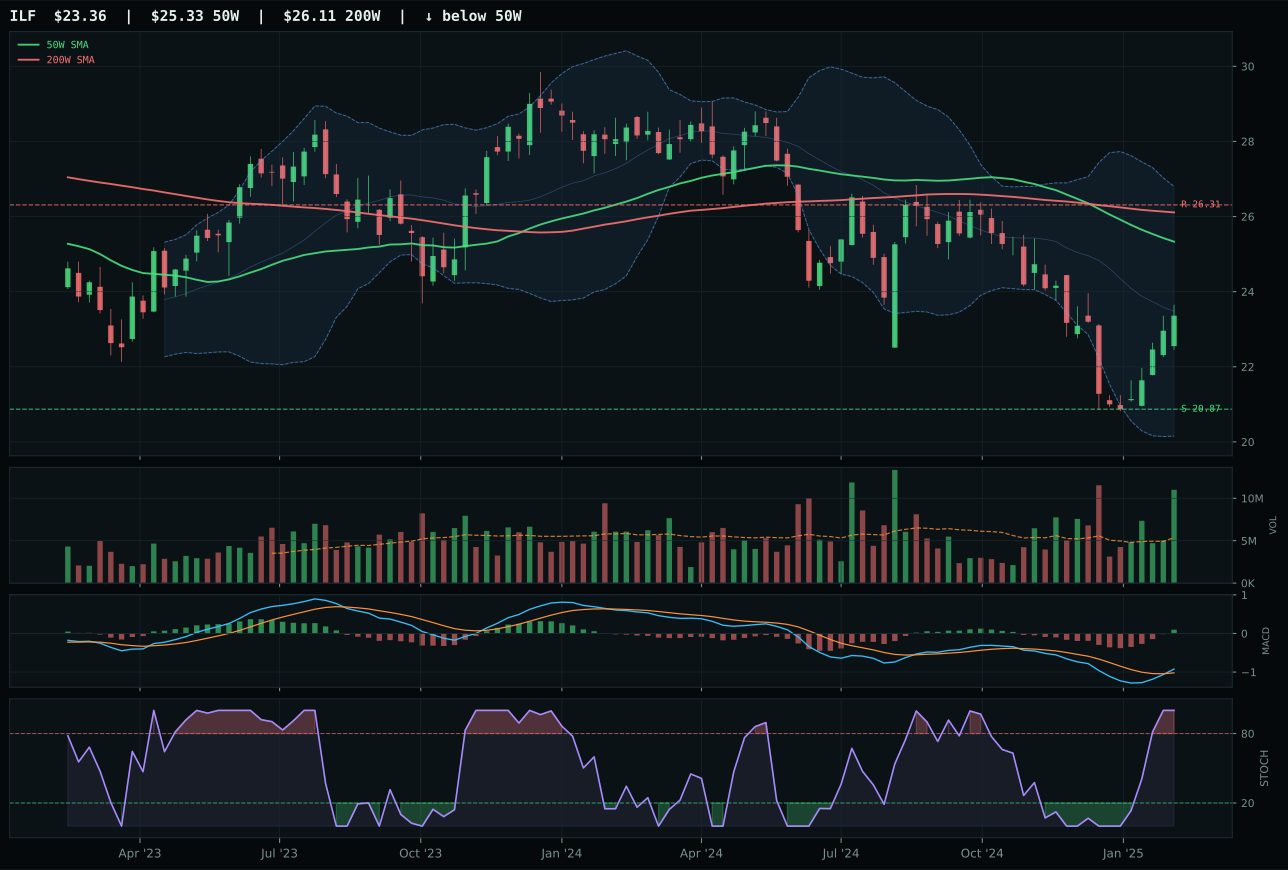
ILF has a neutral structure profile with -6.0% 13-week relative strength versus SPY.
Extension and support failure are the main tactical risks.
Tracked, but not top-2 eligible because: structurally broken.
INDA wins selection as the category representative, though the victory margin is illusory—both INDA and IEMG are deteriorating structures. INDA's 13-week return is negative 7.1% with SPY-relative strength of negative 7.5%, placing it in a clear downtrend, yet stochastic RSI at oversold turn-up (0.01) identifies the precise capitulation point. IEMG sits at negative 3.9% over 13 weeks (better breadth) with rising mid-zone stochastic (0.51), but its fuller price structure and above-average participation volume suggest momentum participants are still engaged rather than capitulating. INDA's oversold trigger is the differentiator: it identifies the exhaustion zone where institutional buyers typically add exposure in repair setups. Timing scores heavily favor INDA (99.0 vs 100.0 for IEMG), but INDA's composite technical score (59) reflects the severity of relative underperformance.
Emerging Markets is excluded entirely this week with a final score of 5.5 and 0% allocation. The macro environment is hostile: dollar pressure is active and severe (-14), credit stress (-10), liquidity stress (-10), and broad market bear (-9) combine to create a toxic backdrop for emerging-market equities. Macro fit at 7.0/100 is the second-lowest of all categories. In disinflation with dollar strength, EM currencies weaken and local interest rates may need to rise to defend pegs, crushing asset valuations. The category basket (IEMG, ILF, INDA) is uniformly negative in 13-week returns, and the reasoned ETF proof order (IEMG 54.1, ILF 33.9, INDA 29.2) shows no construction momentum anywhere. For Emerging Markets to earn a 5% sleeve, dollar weakness would need to reverse or credit spreads would need to narrow sharply—neither is happening in the current macro regime.