
2025-01-31
Informational purposes only. The content in this report, including allocations, analysis, and commentary, is provided solely for informational and educational purposes. It does not constitute financial advice, investment advice, trading advice, or any other type of advice. Past performance does not guarantee future results. Always conduct your own research and consult a qualified financial professional before making investment decisions.
Weekly Allocation
| Ticker | Category | Weight | Role |
|---|---|---|---|
| FBTC | 50% | Overlay | |
| GLD | Precious Metals | 10% | Top-2 (10%) |
| PAVE | Utilities & Infrastructure | 10% | Top-2 (10%) |
| ITA | Defense & Aerospace | 5% | Tier-2 (5%) |
| COPX | Industrial Metals | 5% | Tier-2 (5%) |
| INDA | Emerging Markets | 5% | Tier-2 (5%) |
| CIBR | Technology | 5% | Tier-2 (5%) |
| NLR | Nuclear Energy | 5% | Tier-2 (5%) |
| AIQ | AI | 5% | Tier-2 (5%) |
Trade Instructions — Monday Open
Sell the tranche from 2025-01-03 (completing its 4-week hold). Buy the new tranche. Instructions show net portfolio changes — same-asset positions cancel, weight changes show the delta.
| Action | Ticker | Instruction |
|---|---|---|
| SELL | CIBR | Sell 20% of CIBR position (reduce 6.25% → 5.00%) |
| SELL | XLE | Sell 25% of XLE position (reduce 5.00% → 3.75%) |
| SELL | XAR | Sell 33% of XAR position (reduce 3.75% → 2.50%) |
| SELL | XLU | Sell 20% of XLU position (reduce 6.25% → 5.00%) |
| SELL | SMH | Sell 50% of SMH position (reduce 2.50% → 1.25%) |
| BUY | COPX | Buy COPX — 20.00% of freed cash (adds 1.25% to portfolio) |
| BUY | ITA | Buy ITA — 20.00% of freed cash (adds 1.25% to portfolio) |
| BUY | PAVE | Buy PAVE — 40.00% of freed cash (adds 2.50% to portfolio) |
| BUY | AIQ | Buy AIQ — 20.00% of freed cash (adds 1.25% to portfolio) |
Current Portfolio After Trade
Combined holdings across all 4 active tranches. Each tranche is 25% of the portfolio.
| Ticker | % of Portfolio | Weight Bar |
|---|---|---|
| FBTC | 50.00% | |
| GLD | 8.75% | |
| CIBR | 5.00% | |
| XLU | 5.00% | |
| NLR | 5.00% | |
| XLE | 3.75% | |
| INDA | 3.75% | |
| COPX | 3.75% | |
| ITA | 3.75% | |
| XAR | 2.50% | |
| PAVE | 2.50% | |
| SMH | 1.25% | |
| WEAT | 1.25% | |
| IGF | 1.25% | |
| BOTZ | 1.25% | |
| AIQ | 1.25% |
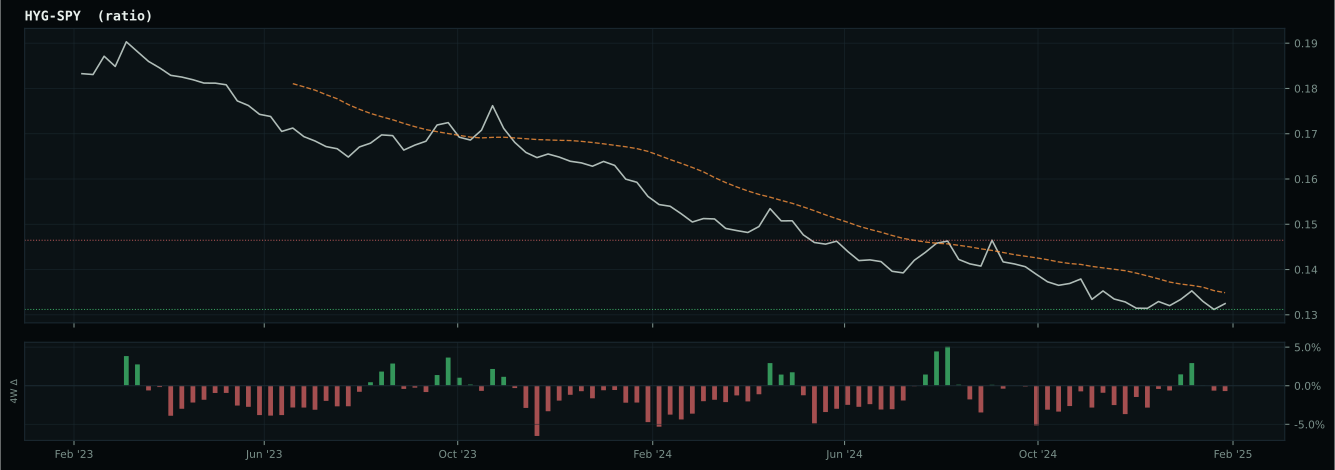
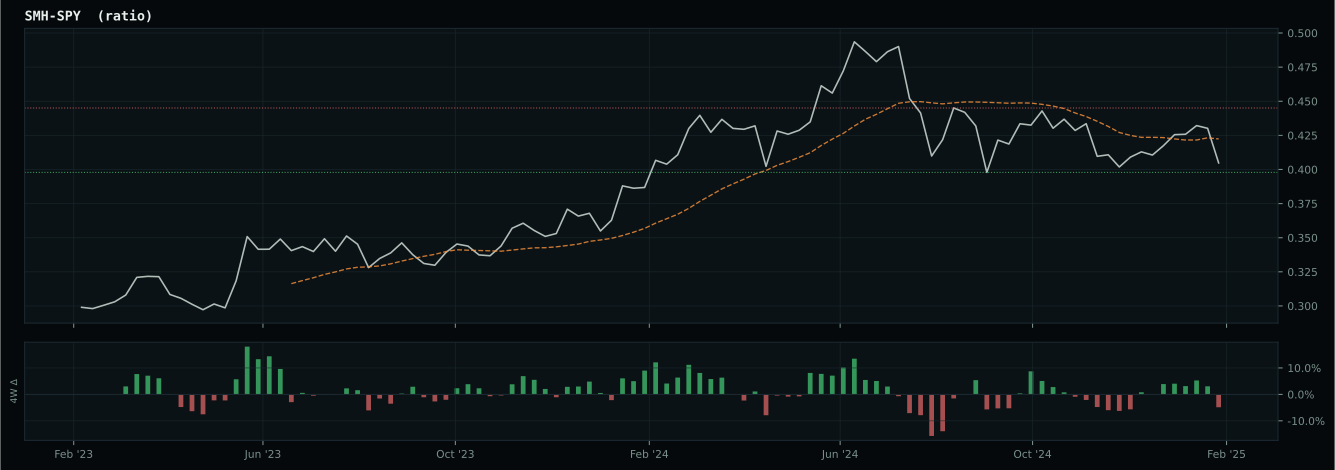
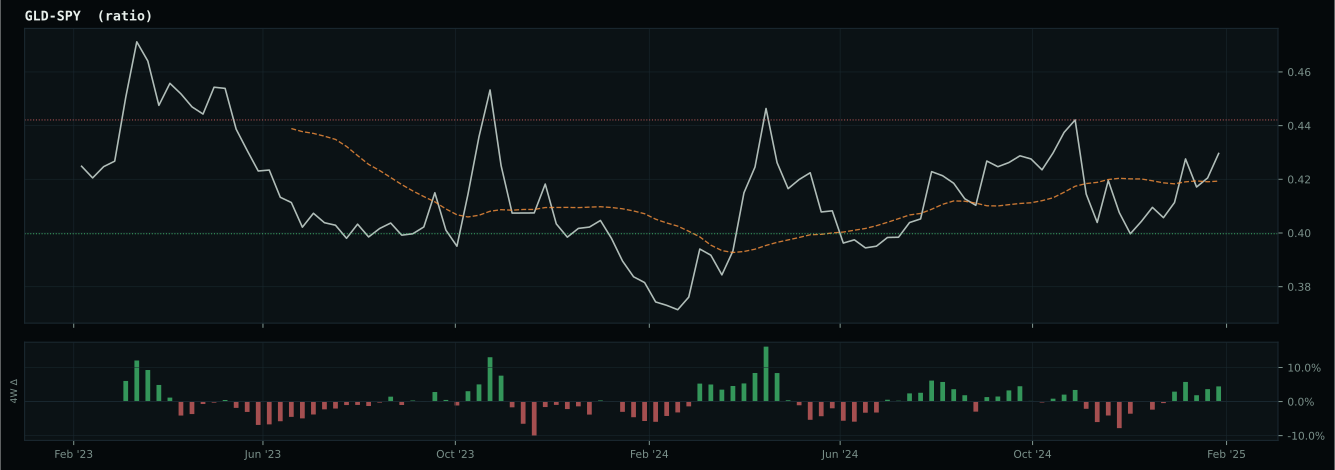
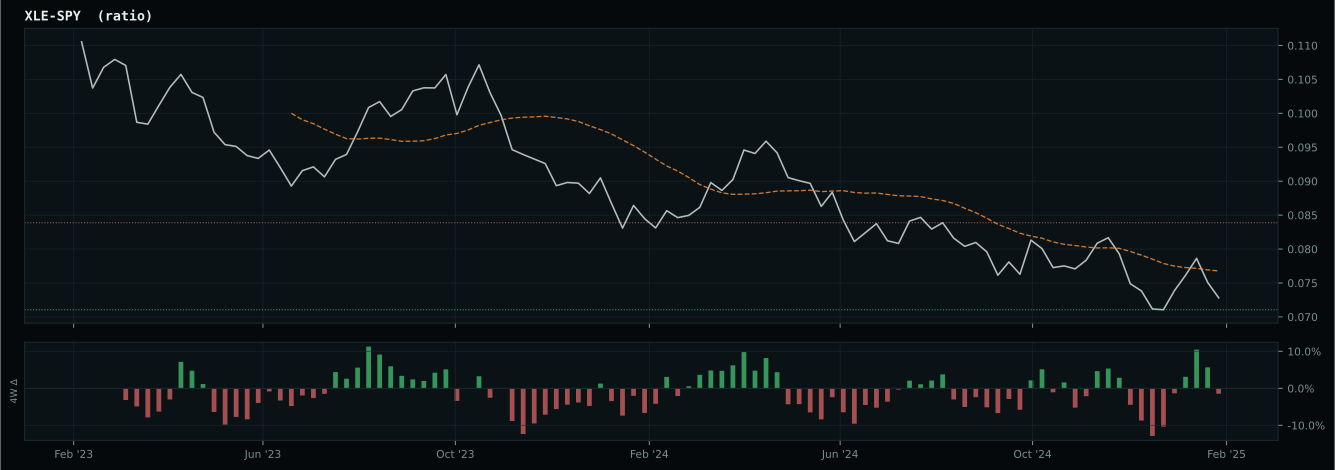
Macro Regime — Disinflation
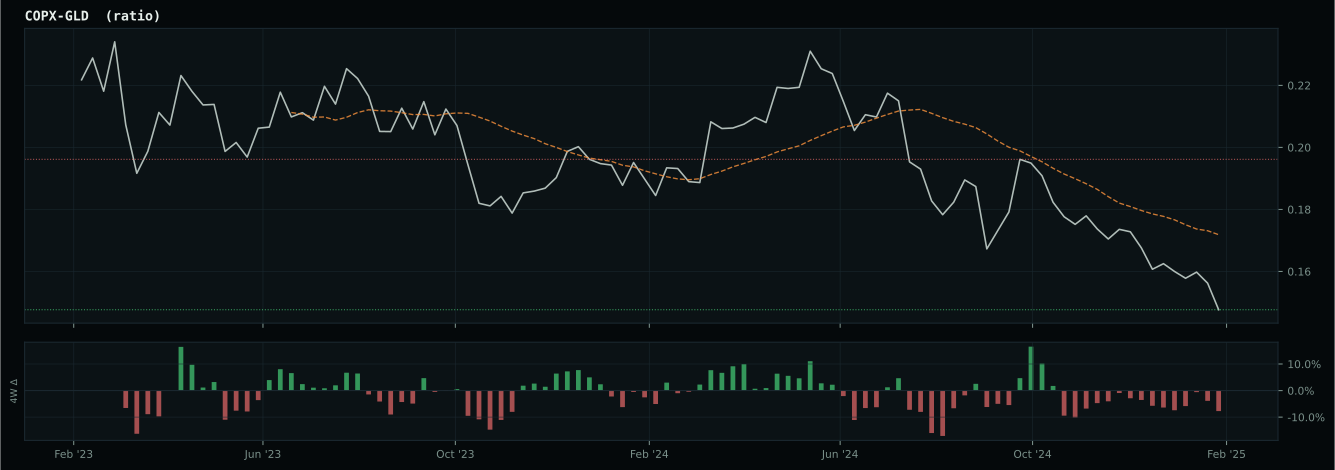
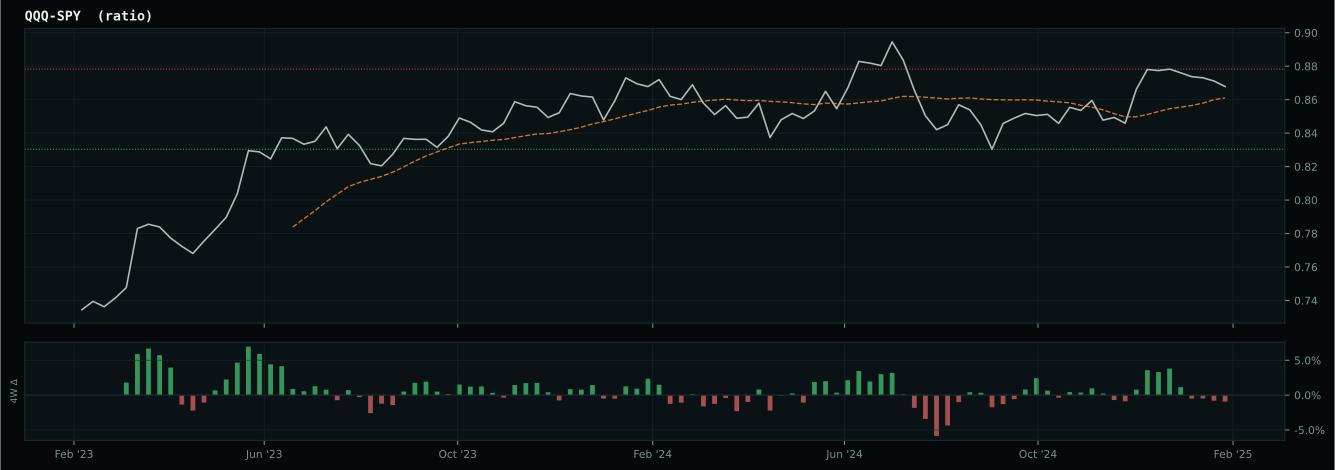
Macro Evidence Charts
Market-implied signals behind the macro regime scores. Each ratio compares two assets; the direction and slope of the ratio is what the macro engine reads.
Crypto Regime — TrendBTC
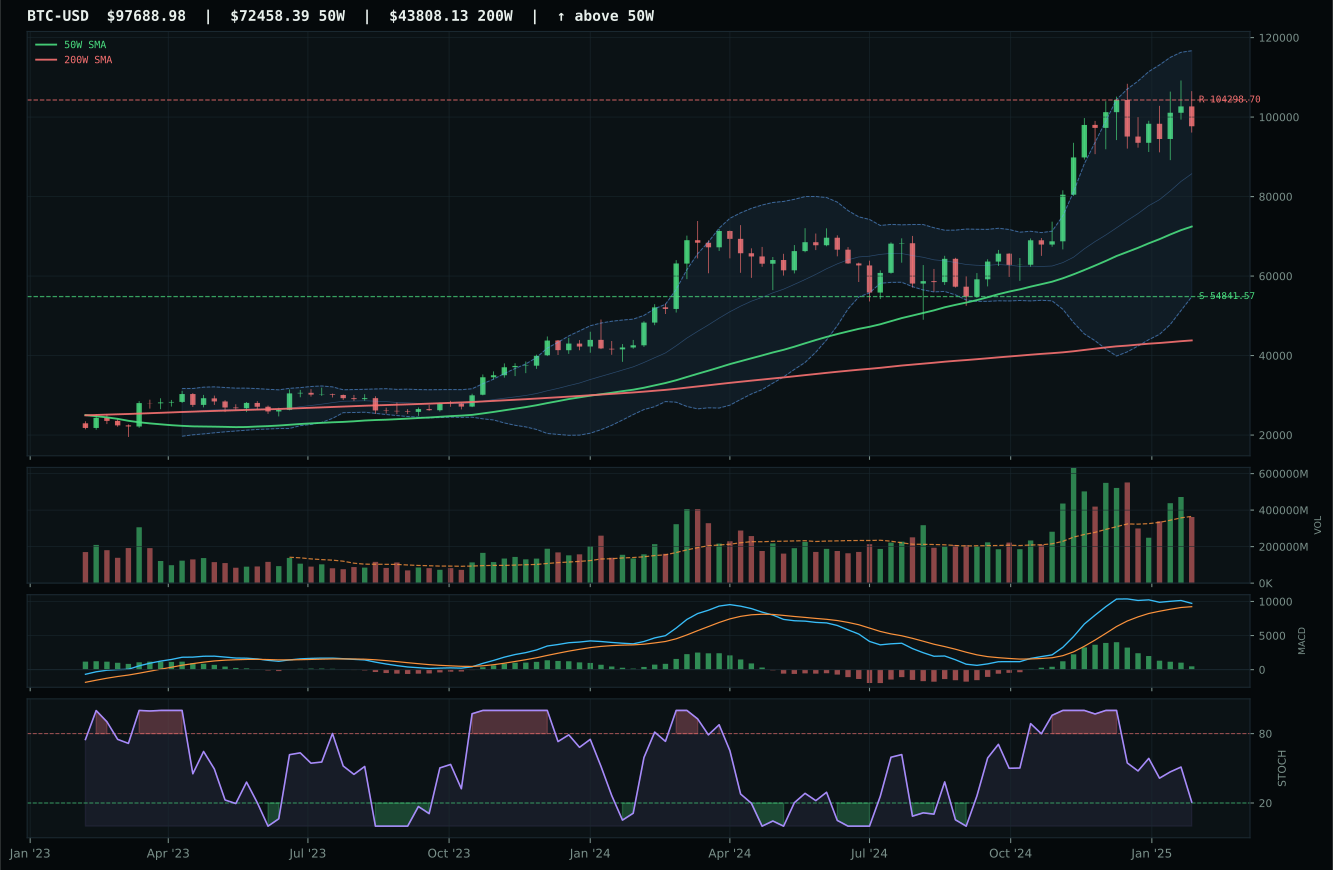
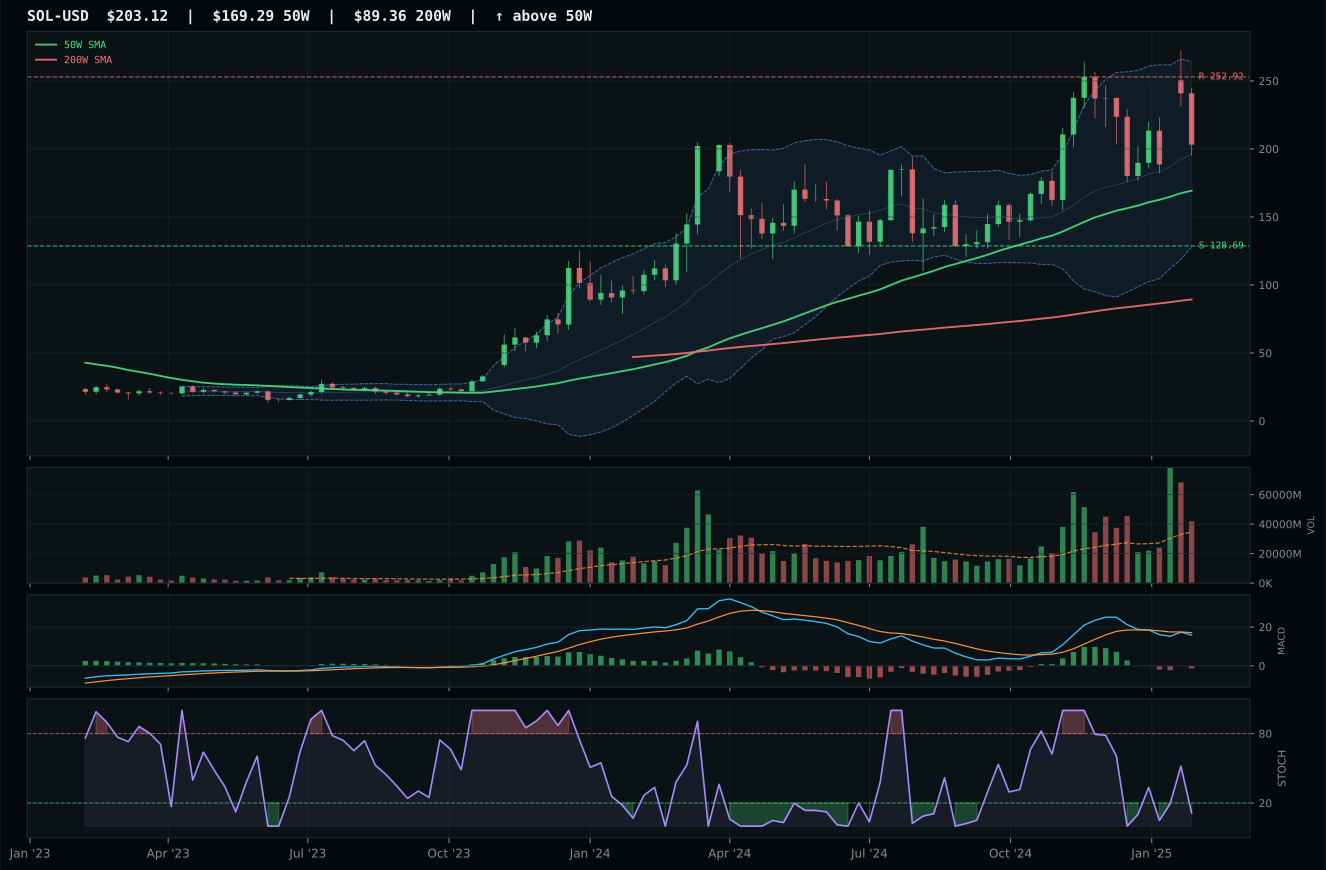
ValueBTC not armed: BTC has not made the first post-breakdown touch of the 200W buy zone after losing the 50W
TrendBTC confirmed: 2 consecutive closes above rising/flat 50W SMA
one or more available conditions failed
Category Rankings
| Rank | Category | Winner | Score | Alloc | 4W Ret | Peers (4W) |
|---|---|---|---|---|---|---|
| 1 | Precious Metals | GLD | 66.7 | 20% | +2.05% | GDX +3.0% · SLV +1.1% |
| 2 | Utilities & Infrastructure | PAVE | 64.7 | 20% | -2.70% | XLU +3.0% · IGF +2.2% |
| 3 | Defense & Aerospace | ITA | 62.4 | 10% | +0.77% | XAR -2.7% · ROKT -2.6% |
| 4 | Technology | CIBR | 28.4 | 10% | +1.46% | IGV -1.9% · XLK +0.4% |
| 5 | Nuclear Energy | NLR | 26.9 | 10% | -6.53% | URA -8.5% · URNM -10.9% |
| 6 | AI | AIQ | 22.8 | 10% | +0.23% | BOTZ +0.3% · SMH -0.3% |
| 7 | Traditional Energy | XLE | 9.4 | 10% | +4.25% | XOP -1.8% · FCG -1.6% |
| 8 | Agriculture & Livestock | MOO | 5.5 | 10% | +0.56% | VEGI -1.2% · WEAT -1.8% |
| 9 | Industrial Metals | COPX | — | 0% | +4.02% | REMX +0.6% · PICK +4.3% |
| 10 | Emerging Markets | INDA | — | 0% | -4.93% | IEMG +3.0% · ILF +0.5% |
Precious Metals — GLD
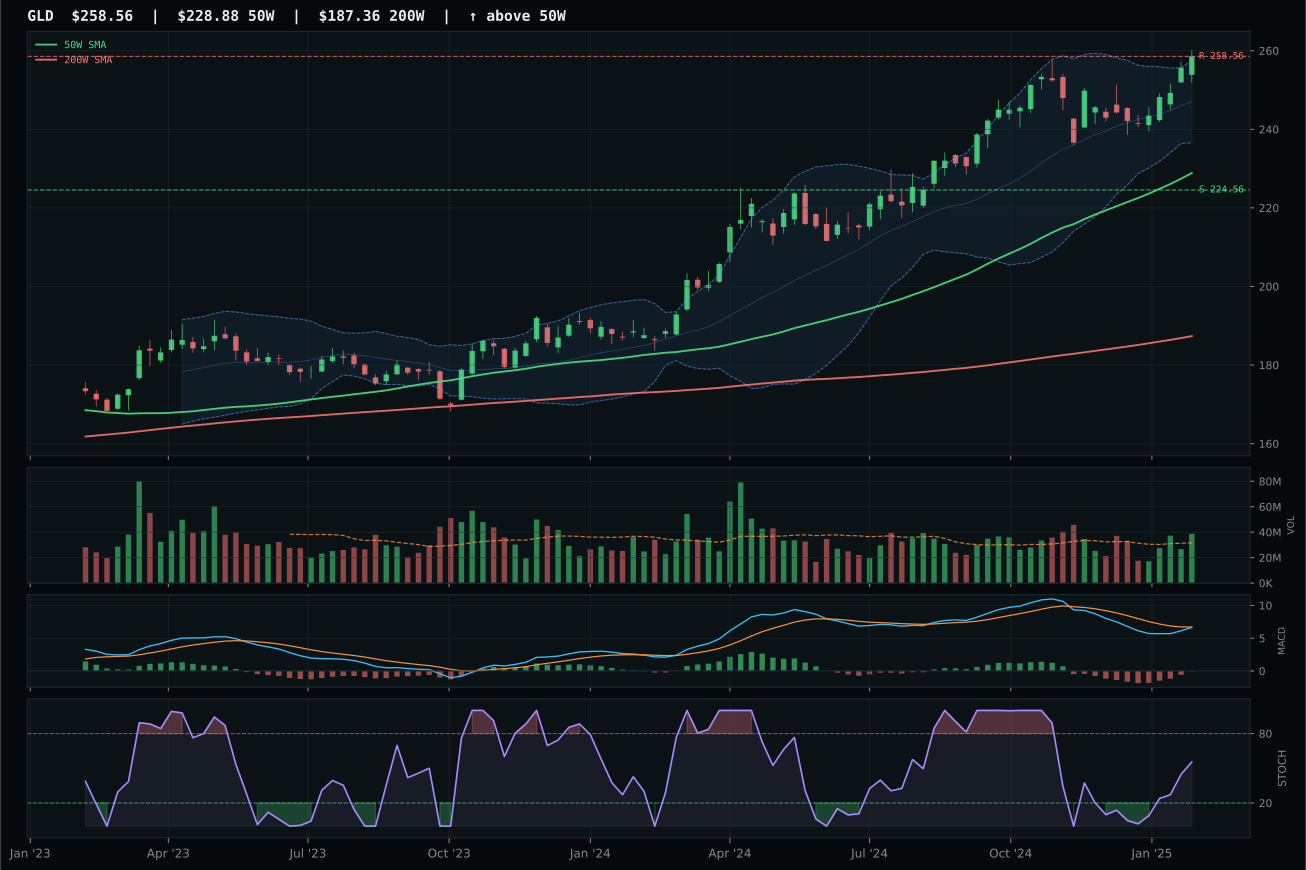
GLD has a neutral structure profile with -3.0% 13-week relative strength versus SPY.
A failed hold above support would weaken the setup.
Actionable but governed by invalidation levels.
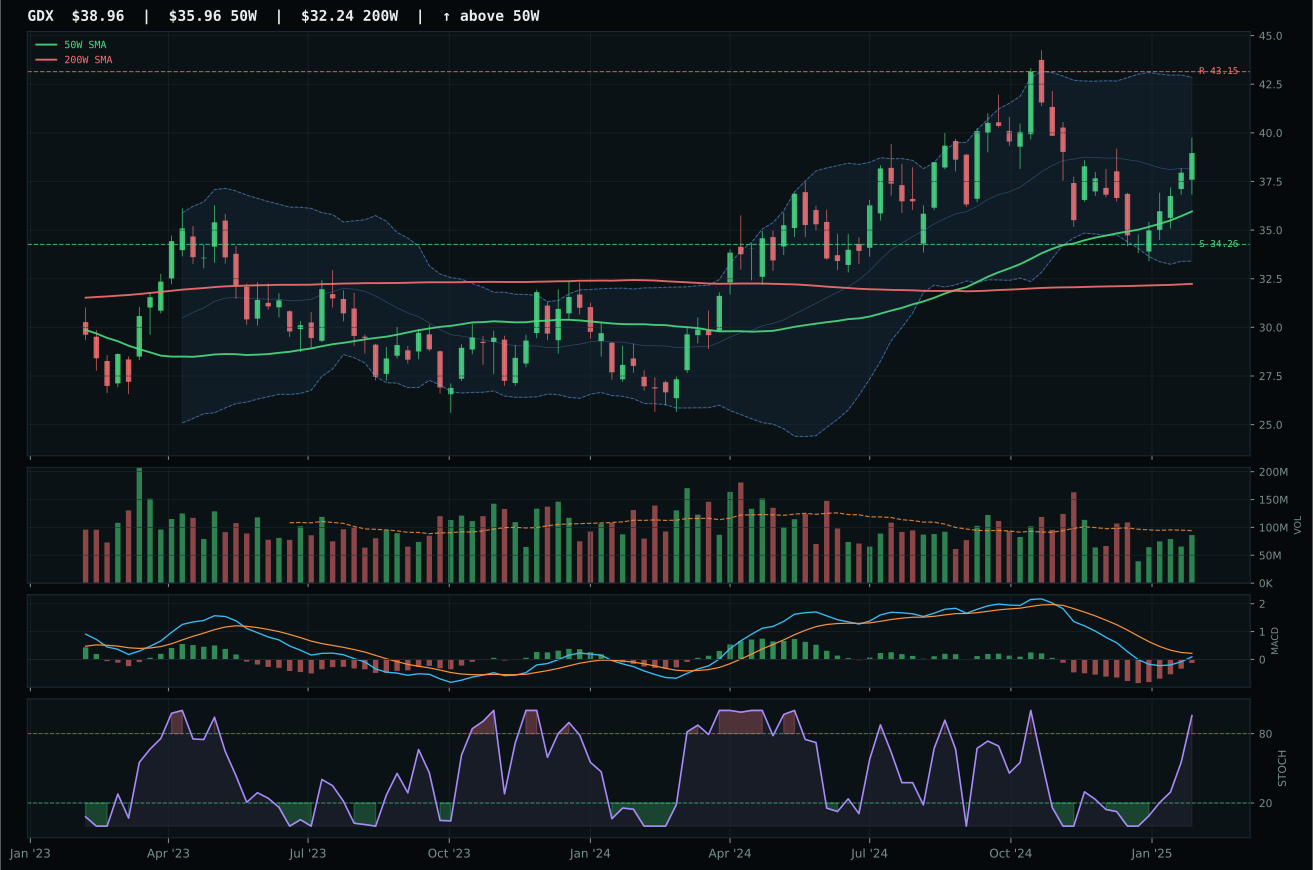
GDX has a neutral structure profile with -7.6% 13-week relative strength versus SPY.
A failed hold above support would weaken the setup.
Actionable but governed by invalidation levels.
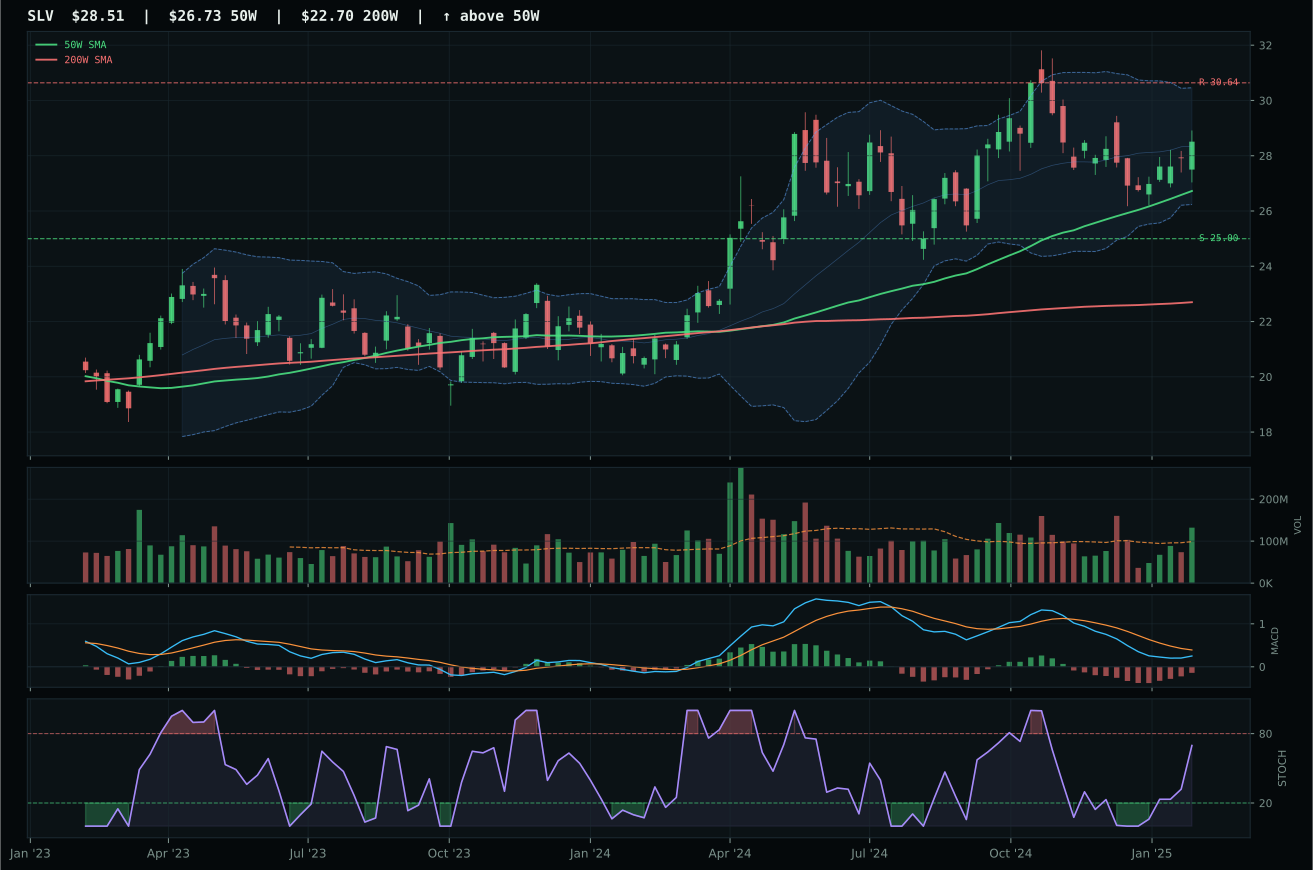
SLV has a neutral structure profile with -8.9% 13-week relative strength versus SPY.
A failed hold above support would weaken the setup.
Actionable but governed by invalidation levels.
GLD locked the top-2 slot by combining uptrend confirmation with macro tailwinds in a way competitors could not replicate. Price sits 13% above the 50-week moving average at neutral structure with 4.6% category-relative strength, marking it as the category leader while GDX has overbought stochastic RSI momentum but lagging -7.6% SPY-relative performance and 0.0% category outperformance. GLD's 1.22x volume participation is above-average and accumulative; GDX's neutral volume at 0.94x looks like distribution into strength. The 2.4% 13-week return is modest but consistent with a grinding higher move into a macro hedge, not a squeeze that will reverse violently.
Precious Metals ranked as the second-highest eligible category at 66.7, earning 10% allocation as one of only two top-2 selections. The macro fit of 67.0/100 was the highest or tied-highest among all categories; disinflation regime delivered +8, disinflation pressure added +6, dollar pressure contributed +3, offset slightly by liquidity stress at -4. At 62% technical and 38% macro, GLD's 77.0 technical evidence and the category's macro alignment created a genuine portfolio edge. The setup is fundamentally defensive: price is consolidating near highs with gentle slope and improving MACD, typical of money rotating into gold as real rates compress. This allocation reflects the macro thesis that disinflation stays in place; if dollar rallied sharply or real yields spiked, the category would face headwinds, but under current TrendBTC regime and active descriptors, precious metals merit its top-tier seat.
Utilities & Infrastructure — PAVE
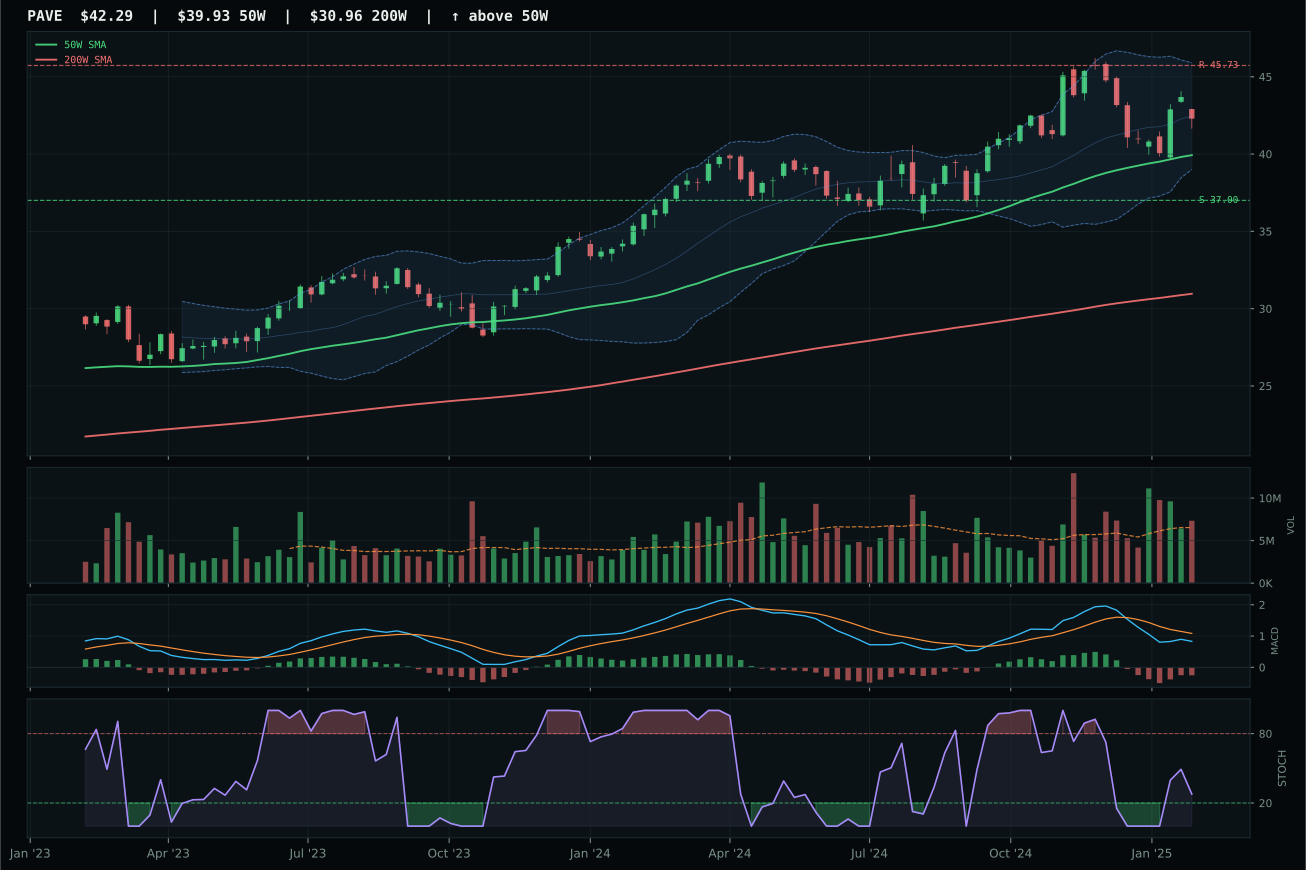
PAVE has a neutral structure profile with -3.0% 13-week relative strength versus SPY.
A failed hold above support would weaken the setup.
Actionable but governed by invalidation levels.
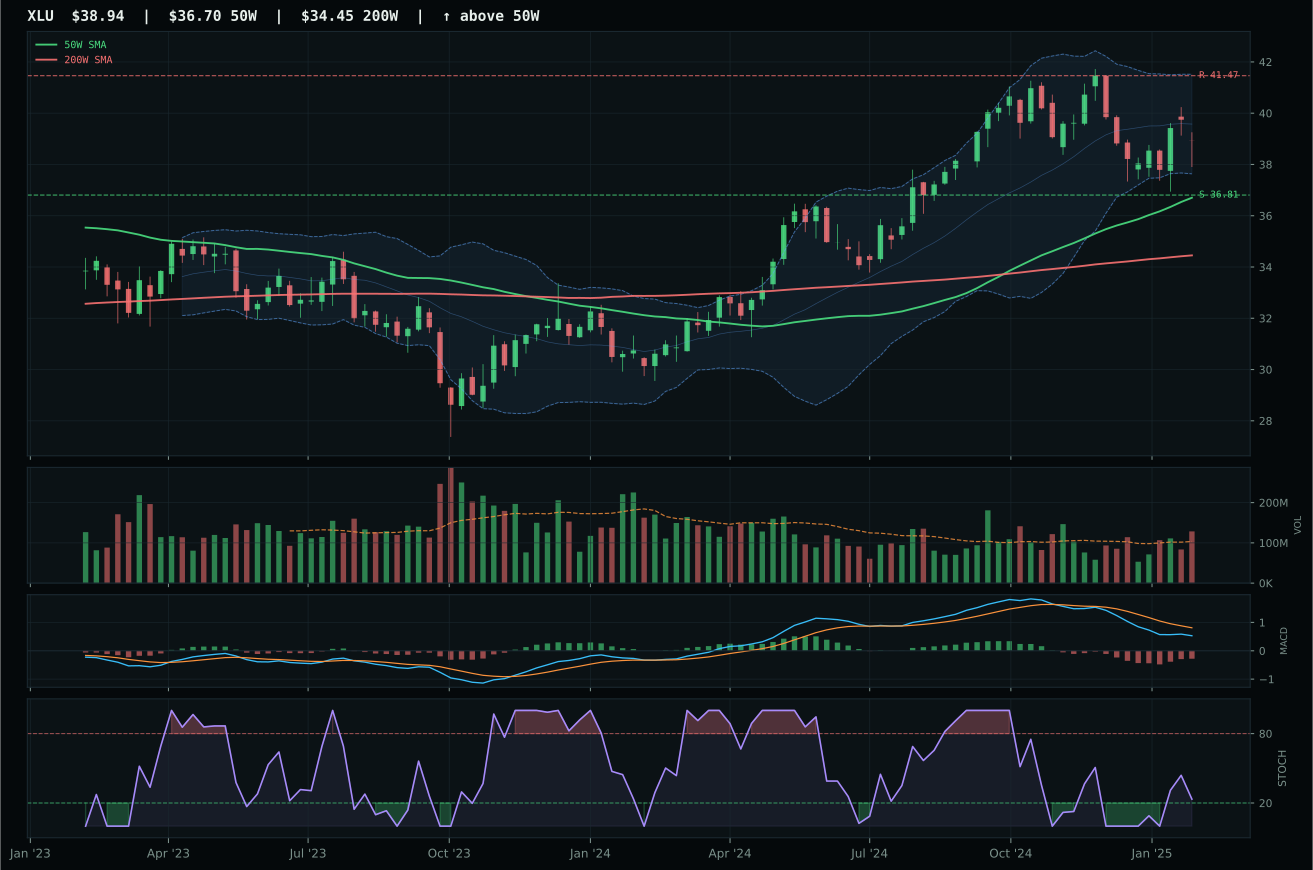
XLU has a neutral structure profile with -5.7% 13-week relative strength versus SPY.
A failed hold above support would weaken the setup.
Actionable but governed by invalidation levels.
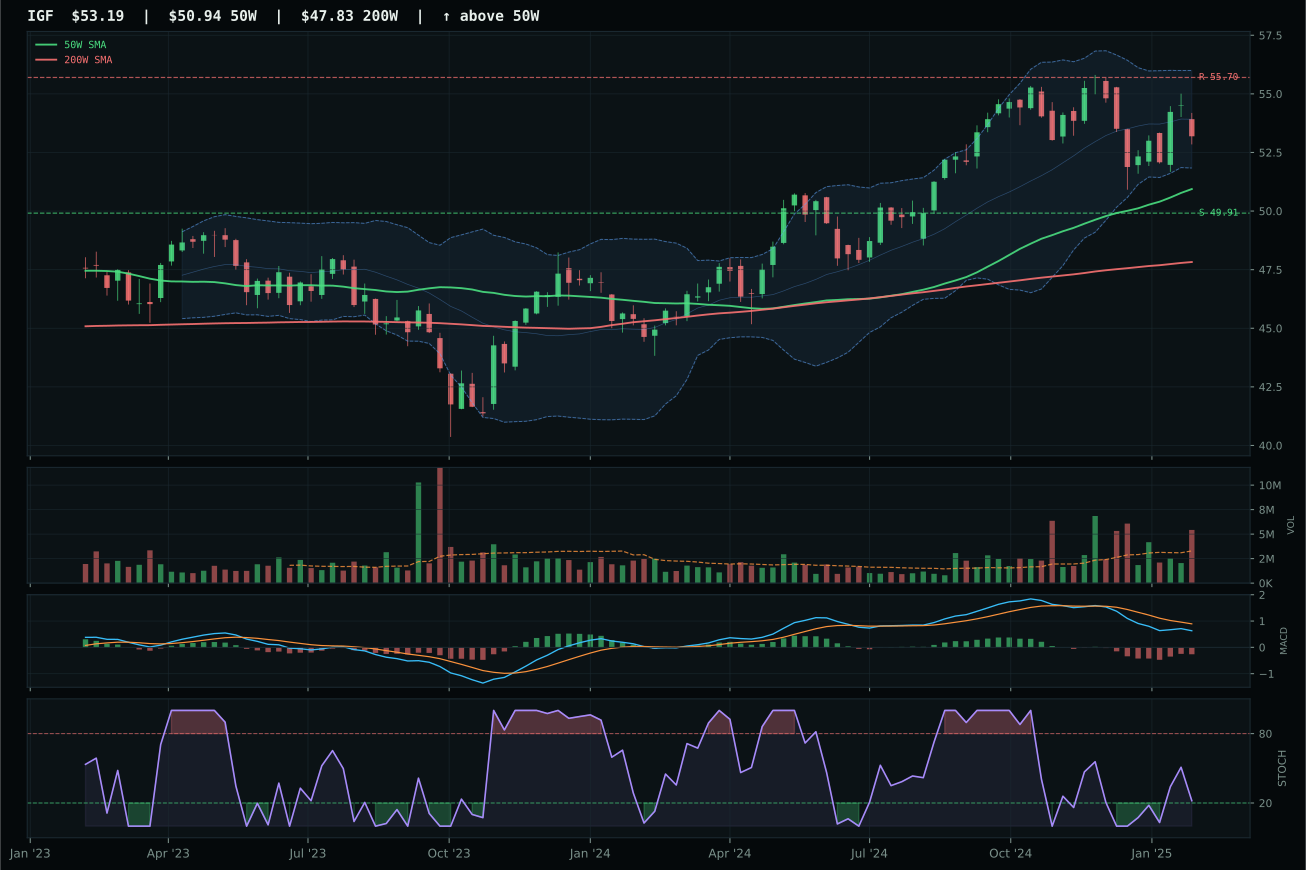
IGF has a neutral structure profile with -5.1% 13-week relative strength versus SPY.
A failed hold above support would weaken the setup.
Actionable but governed by invalidation levels.
PAVE locked the second top-2 slot by combining the cleanest structure in the category with measurable category-relative strength of 2.1% versus XLU's -0.6%. Both names sit above moving averages in neutral structures with identical 83-point timing scores, but PAVE's 88.5 trend score and above-average 1.13x participation beat XLU's equivalent marks by clean margins. Price sits only 5.9% above the 50-week moving average, offering better risk-reward than XLU's tighter positioning; PAVE's 54.5 risk-reward score captures reasonable downside to support (14.3%) against compressed upside to resistance (7.5%), a classic inflation-hedge structure. The 2.4% 13-week return matches GLD's and reflects steady accumulation rather than squeeze.
Utilities & Infrastructure earned top-2 selection with a 64.7 category score, reflecting the second-highest ranking and justifying 10% allocation. The macro fit was strong at 68.0/100, driven by disinflation (+7), Transition/Mixed (+4), disinflation pressure (+6), broad market bear (+4), partially offset by -3 liquidity stress. PAVE's 74.9 technical evidence and the category's favorable macro created a genuine portfolio thesis: regulated utilities and infrastructure benefit from falling real rates (disinflation), steady cash flows (beat market volatility), and capex tailwinds from Transition dynamics. At 62% technical and 38% macro, the category's combination of technical steadiness and macro alignment justifies a top-2 seat alongside precious metals. The allocation reflects a risk-off regime where defensive, cash-generative exposures merit capital; PAVE's modest momentum (2.4% 13-week) is acceptable precisely because the macro environment makes duration and stability more valuable than momentum.
Defense & Aerospace — ITA
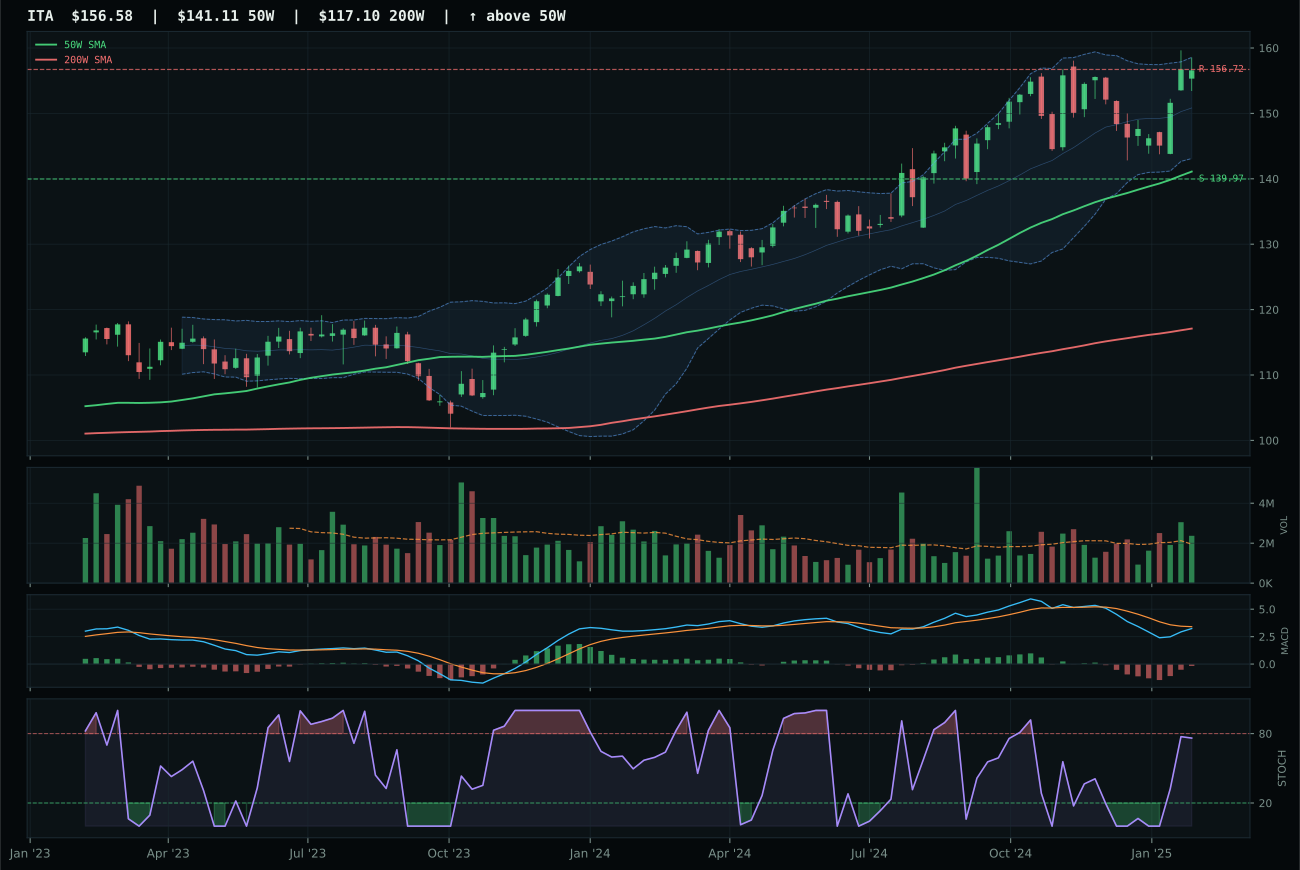
ITA has a neutral structure profile with 2.9% 13-week relative strength versus SPY.
A failed hold above support would weaken the setup.
Actionable but governed by invalidation levels.
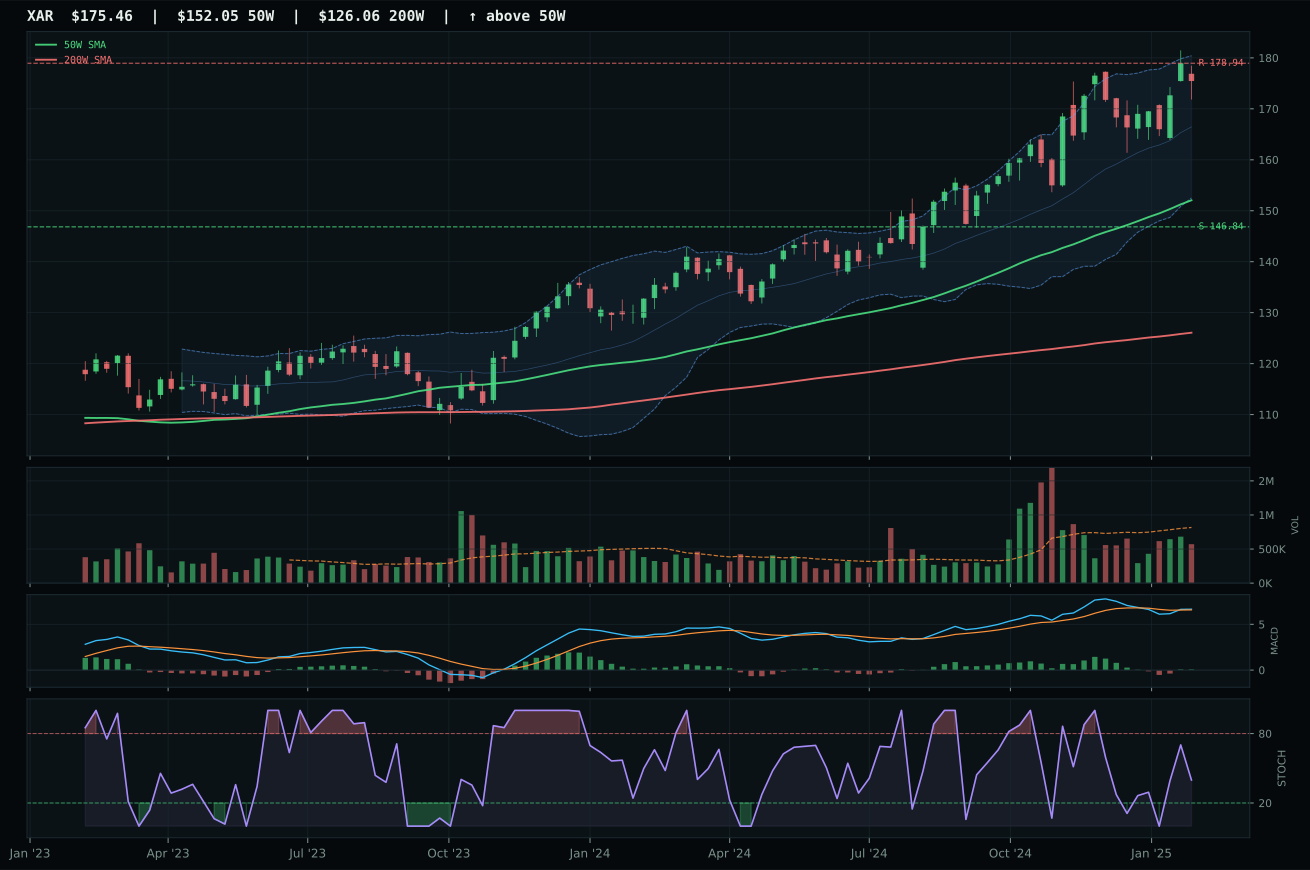
XAR has a vertical extension profile with 7.8% 13-week relative strength versus SPY.
A failed hold above support would weaken the setup.
Actionable but governed by invalidation levels.
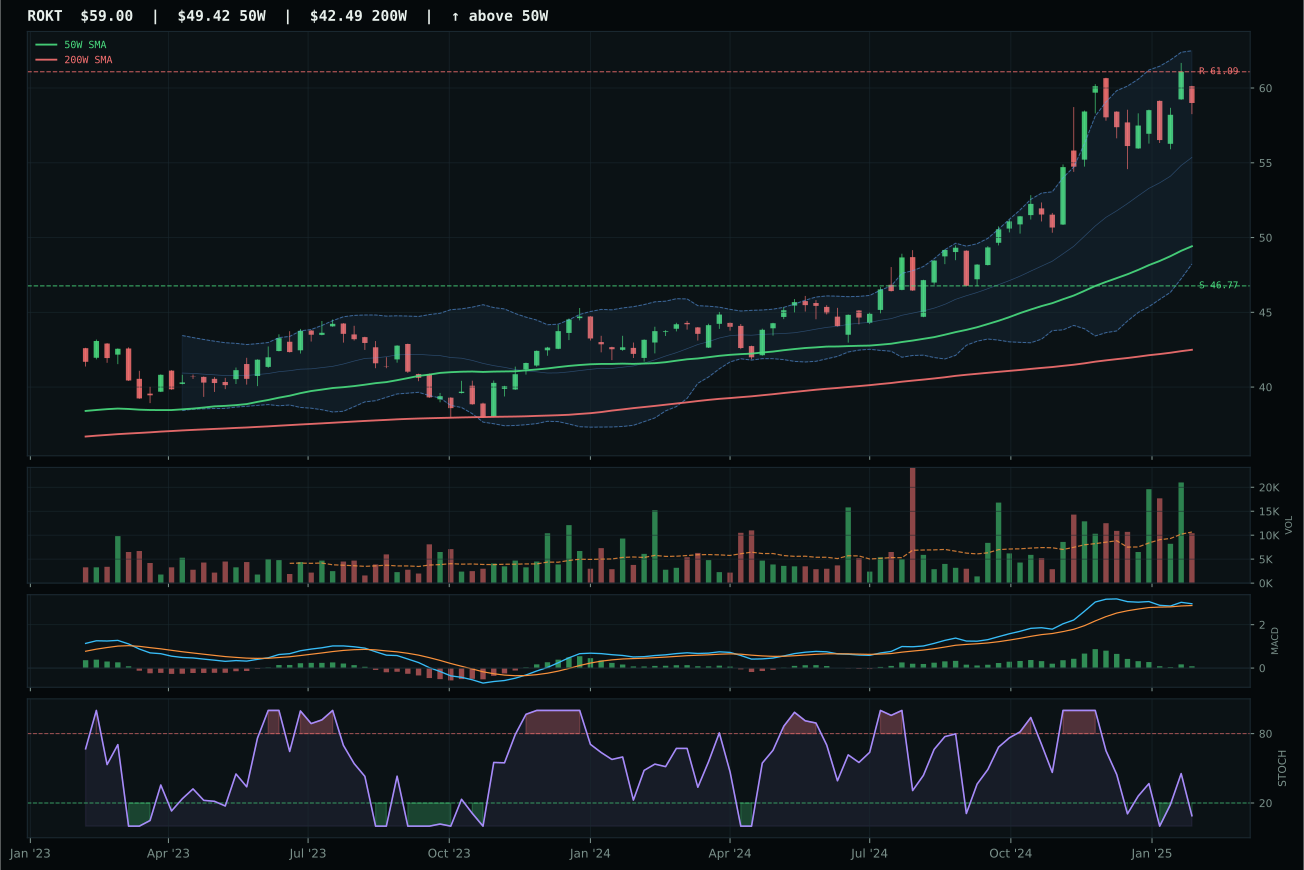
ROKT has a vertical extension profile with 11.0% 13-week relative strength versus SPY.
A failed hold above support would weaken the setup.
Tracked, but not top-2 eligible because: .
ITA claimed the narrow win over XAR by trading timing precision for structure quality. Both names trade within two points on reasoned evidence (70.4 vs 69.6), but ITA's 75-point timing score captures support at 139.97 holding intact and stochastic RSI rising from mid-zone—cleaner invalidation logic. XAR's vertical extension setup has stronger SPY-relative momentum at 7.8% versus ITA's 2.9%, but that strength came with thin participation volume and a less clean structure (69.2 vs 72.0), making it harder to trust as a base for new capital. ITA's above-average participation at 1.22x its 20-day average suggests conviction behind a more methodical move rather than a squeeze into resistance.
Defense & Aerospace held a 62.4 score that qualified it for 5% allocation as a third-tier category, reflecting solid technical hygiene but muted macro fit. The category macro fit registered 60.0/100, driven by broad market bear (+6), dollar pressure (+3), and a +3 bonus from Transition/Mixed macro state, but liquidity stress cost -4. At 62% technical weight and 38% macro, ITA's 75.6 technical evidence pulled the weighted average; macro was neutral-to-slight-tailwind rather than crushing headwind. The category landed its allocation because the defense narrative sits defensively within a bear-marked regime, and timing showed RSI still rising mid-zone across the board. To move toward top-2, the category would need either stronger SPY-relative returns or confirmation that dollar pressure was reversing—neither appeared likely given macro positioning.
Technology — CIBR
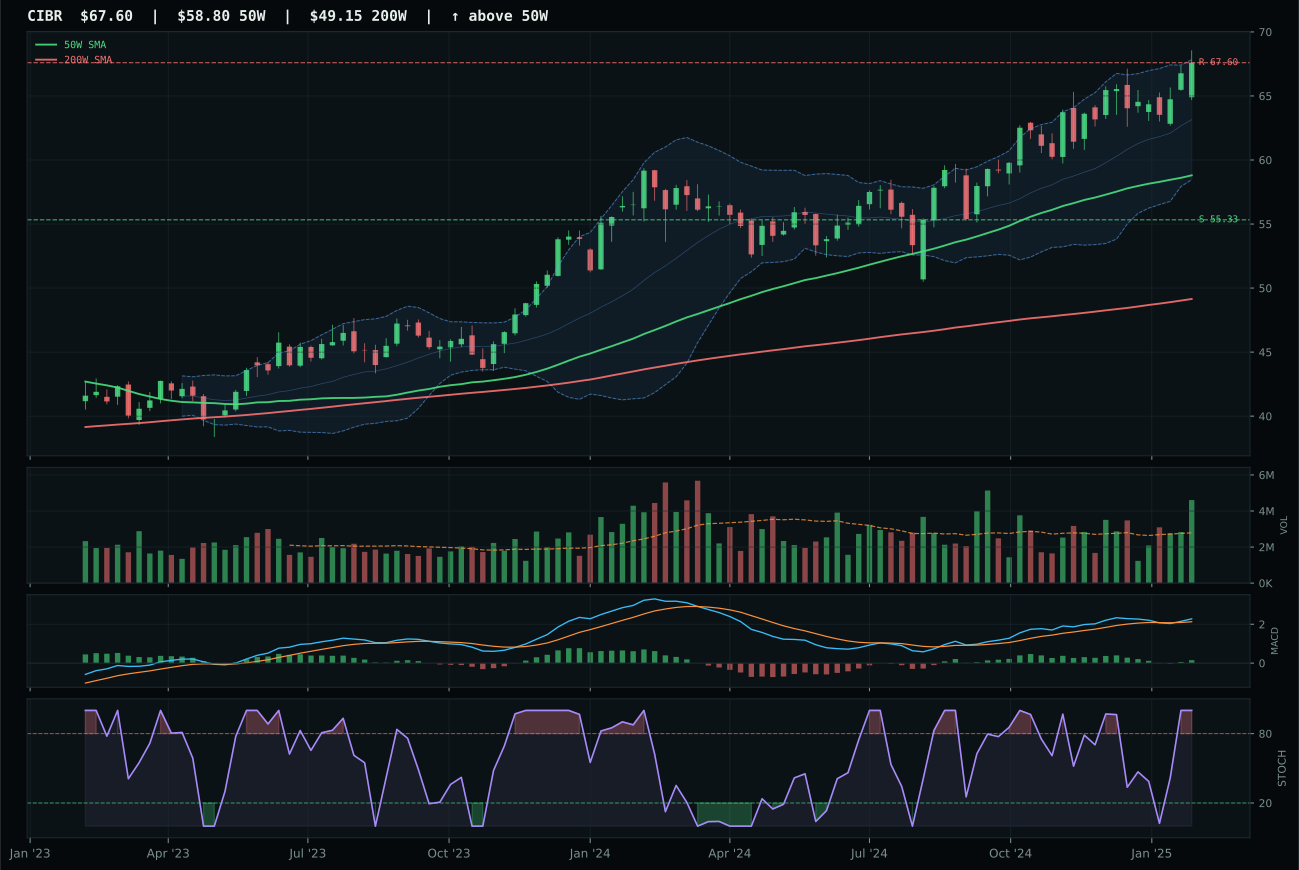
CIBR has a neutral structure profile with 6.8% 13-week relative strength versus SPY.
A failed hold above support would weaken the setup.
Actionable but governed by invalidation levels.
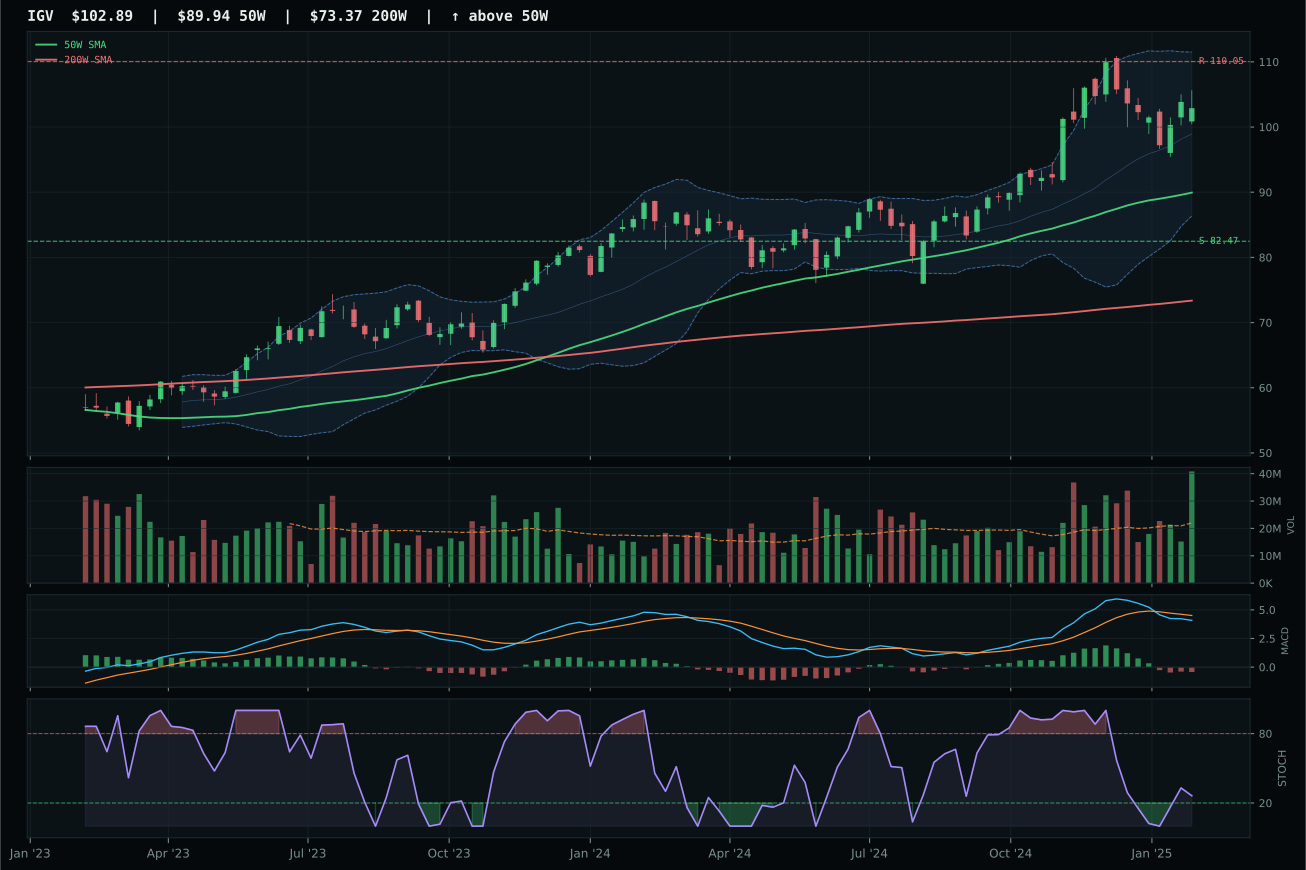
IGV has a neutral structure profile with 6.1% 13-week relative strength versus SPY.
A failed hold above support would weaken the setup.
Actionable but governed by invalidation levels.
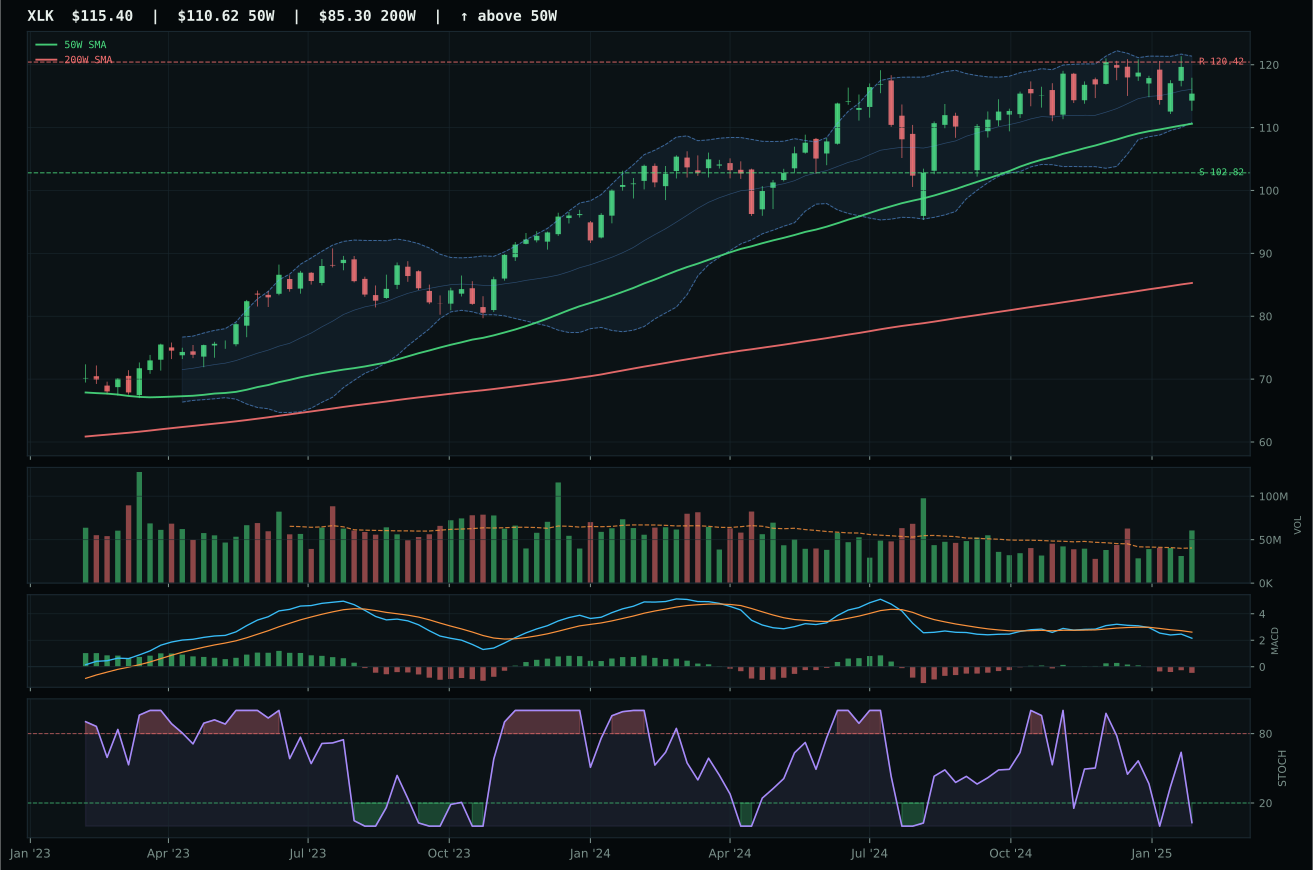
XLK has a neutral structure profile with -2.3% 13-week relative strength versus SPY.
A failed hold above support would weaken the setup.
Actionable but governed by invalidation levels.
CIBR seized the category lead because its technical architecture is clean and accumulating. The 6.8% relative strength versus SPY combined with 0.7% outperformance within the category tells you money is rotating into cybersecurity specifically, not just broad tech strength; volume at 1.65x its 20-day average confirms institutional buyers are stepping in, not rotating out. IGV's bearish MACD divergence and distribution pressure at identical SPY-relative returns (6.1%) reveal a structural flaw that CIBR has already escaped. The setup sits 15% above the 50-week moving average at neutral structure, which is extension without overextension—every new buyer paid up, but the move still has air beneath it rather than sitting on capitulation.
Technology earned 5% allocation despite a 28.4 final score that ranks it well below the top tier, because its representative showed enough technical spine to justify holding it. The category itself scored on macro tailwind: disinflation and broad-market bear dynamics added +5 and +4 basis points to the reasoning layer, but credit and liquidity stress dragged it down by -7 and -10 respectively. At 62% technical weight and 38% macro, CIBR's strong trend (100 out of 100) and volume-price confirmation (94.4) anchored an otherwise modest composite. To climb higher, the entire category would need either SPY-relative strength to reappear or volume distribution to reverse into genuine accumulation; right now it occupies a narrow zone where cybersecurity shows relative merit within its own basket, but macro headwinds keep the whole sleeve capped.
Nuclear Energy — NLR
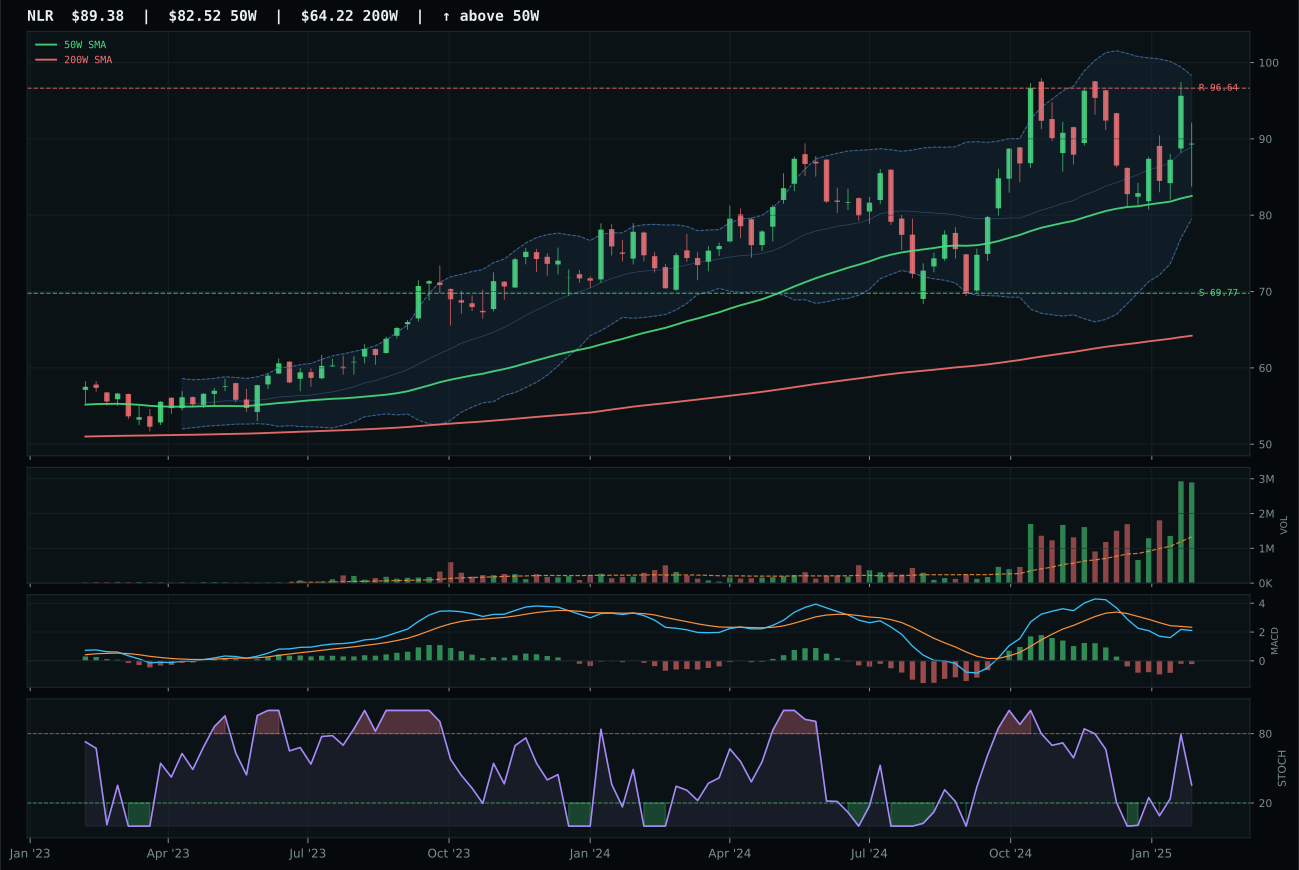
NLR has a neutral structure profile with -6.2% 13-week relative strength versus SPY.
A failed hold above support would weaken the setup.
Actionable but governed by invalidation levels.
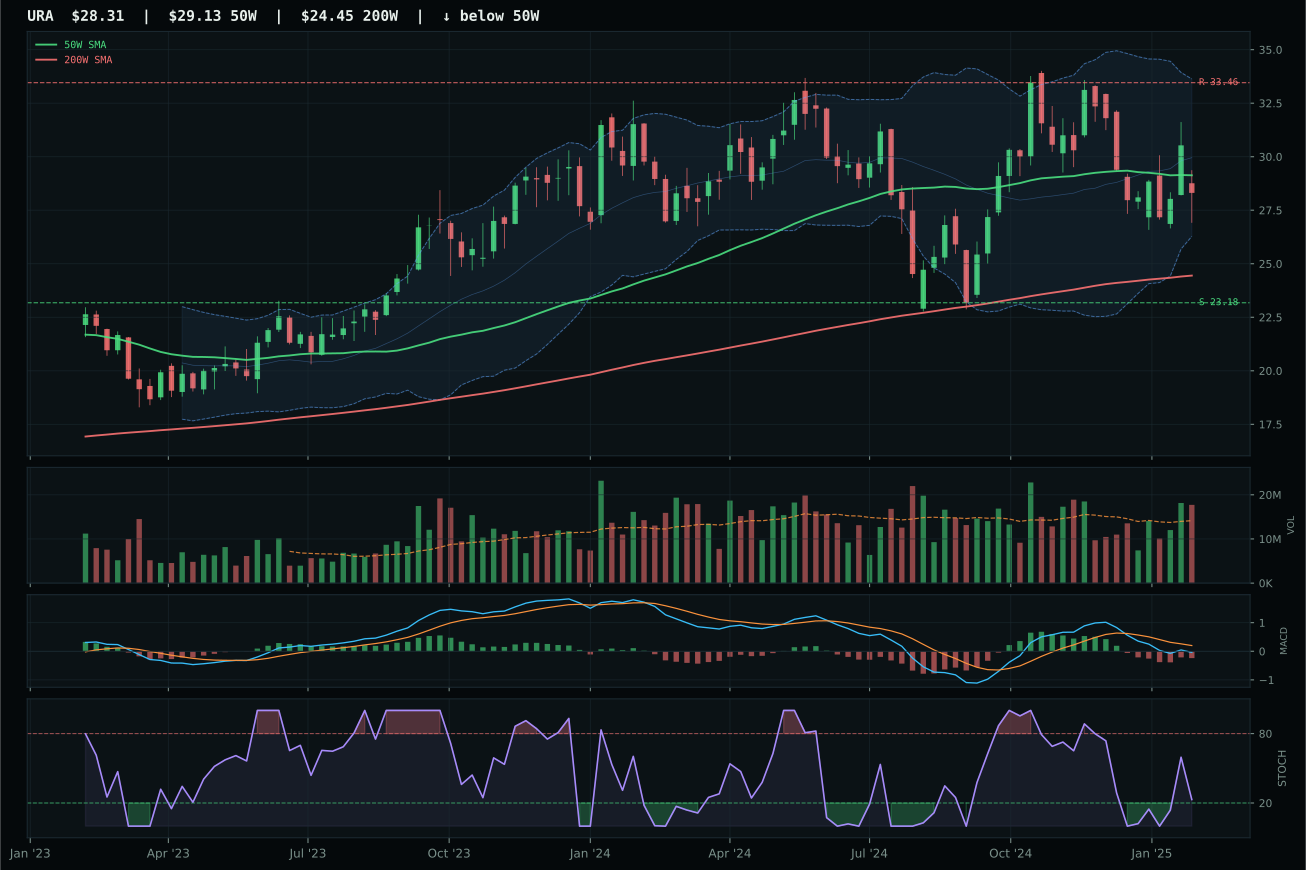
URA has a compression near 50W profile with -12.8% 13-week relative strength versus SPY.
A failed hold above support would weaken the setup.
Actionable but governed by invalidation levels.
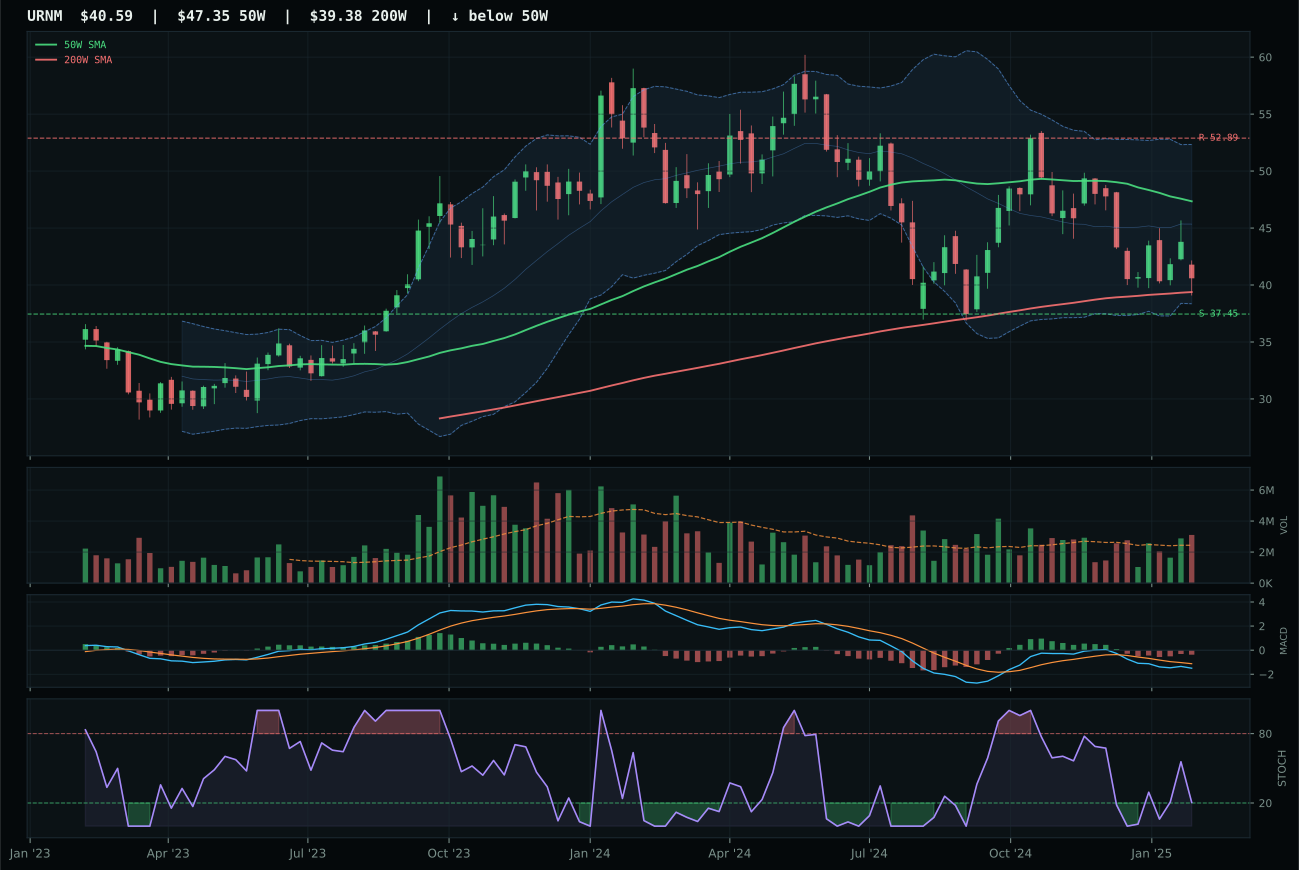
URNM has a neutral structure profile with -17.7% 13-week relative strength versus SPY.
A failed hold above support would weaken the setup.
Actionable but governed by invalidation levels.
NLR edged URA despite a close reasoned evidence gap (40.2 vs 49.5 in URA's favor) because category-relative strength broke the tie at 6.6% versus 0.0%. Both names sit above moving averages in neutral structures with similar timing and MACD geometry, but NLR's 2.17x volume participation—marked as distribution pressure rather than accumulation—reveals aggressive selling into strength that actually prevents the overbought condition from destroying mean-reversion odds. URA's compression setup near the 50-week moving average is tighter and more mechanically balanced, but it lacks the 6.6% outperformance relative to peers that proves NLR has attracted more institutional attention.
Nuclear Energy scored 26.9 and earned 5% allocation as a lower-tier category held mainly on structure rather than macro. The category macro fit was neutral at 38.0/100—no major tailwinds, but broad market bear (+3) and a few positive descriptors offset the -7 liquidity stress and -5 credit stress drag. NLR's 38.2 technical evidence was moderate; at 62% technical and 38% macro, the category was fundamentally a neutral placeholder. Macro reasons were sparse: no category-specific descriptor profile favored nuclear, and the active bear environment suggested defensive utility merit without conviction. To move nuclear toward 10%, the category would need either explicit energy security tailwinds (geopolitical stress, energy transition themes) or clearer technical momentum—right now it's held at 5% because it provides a niche energy hedge without demanding major thesis revision or significant momentum.
AI — AIQ
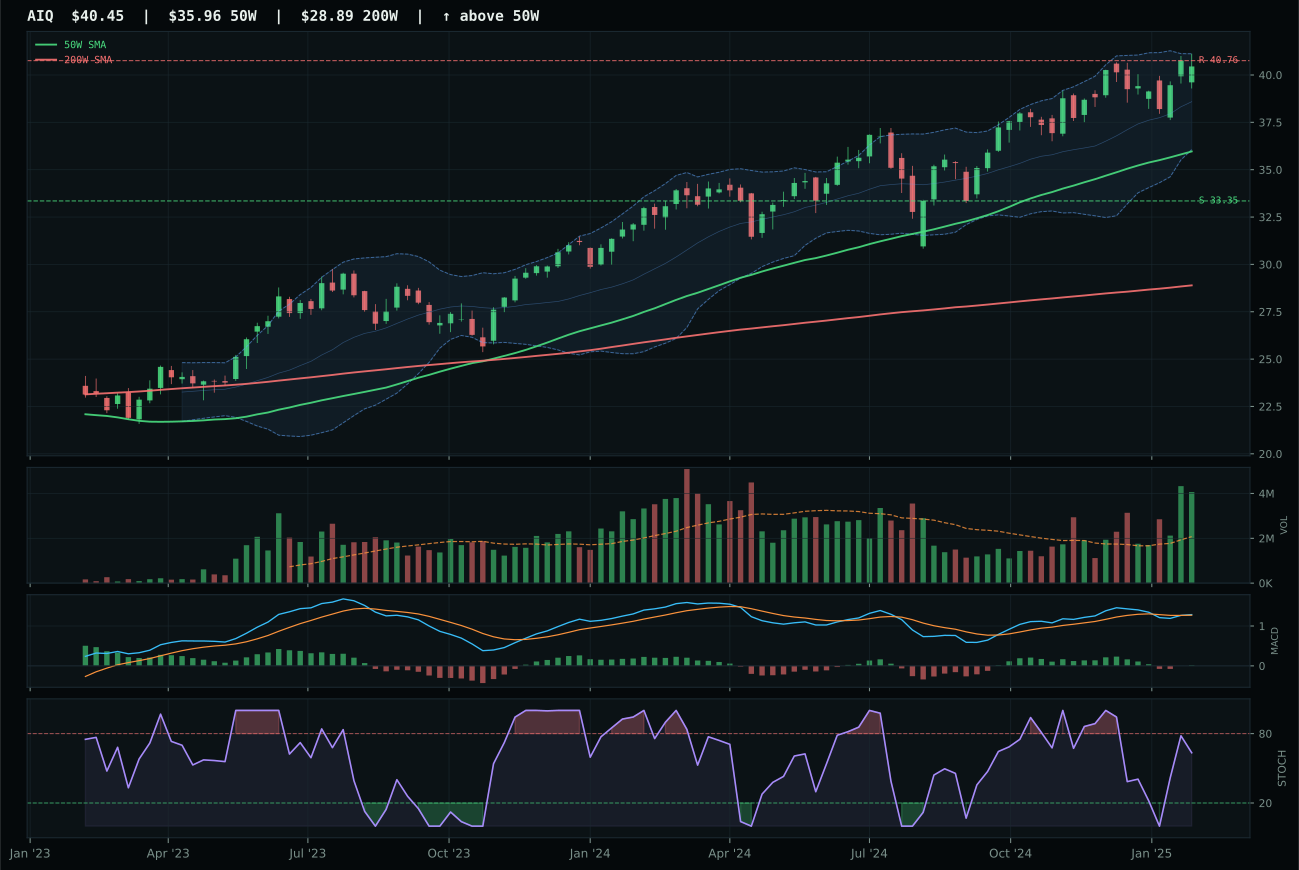
AIQ has a neutral structure profile with 4.1% 13-week relative strength versus SPY.
A failed hold above support would weaken the setup.
Actionable but governed by invalidation levels.
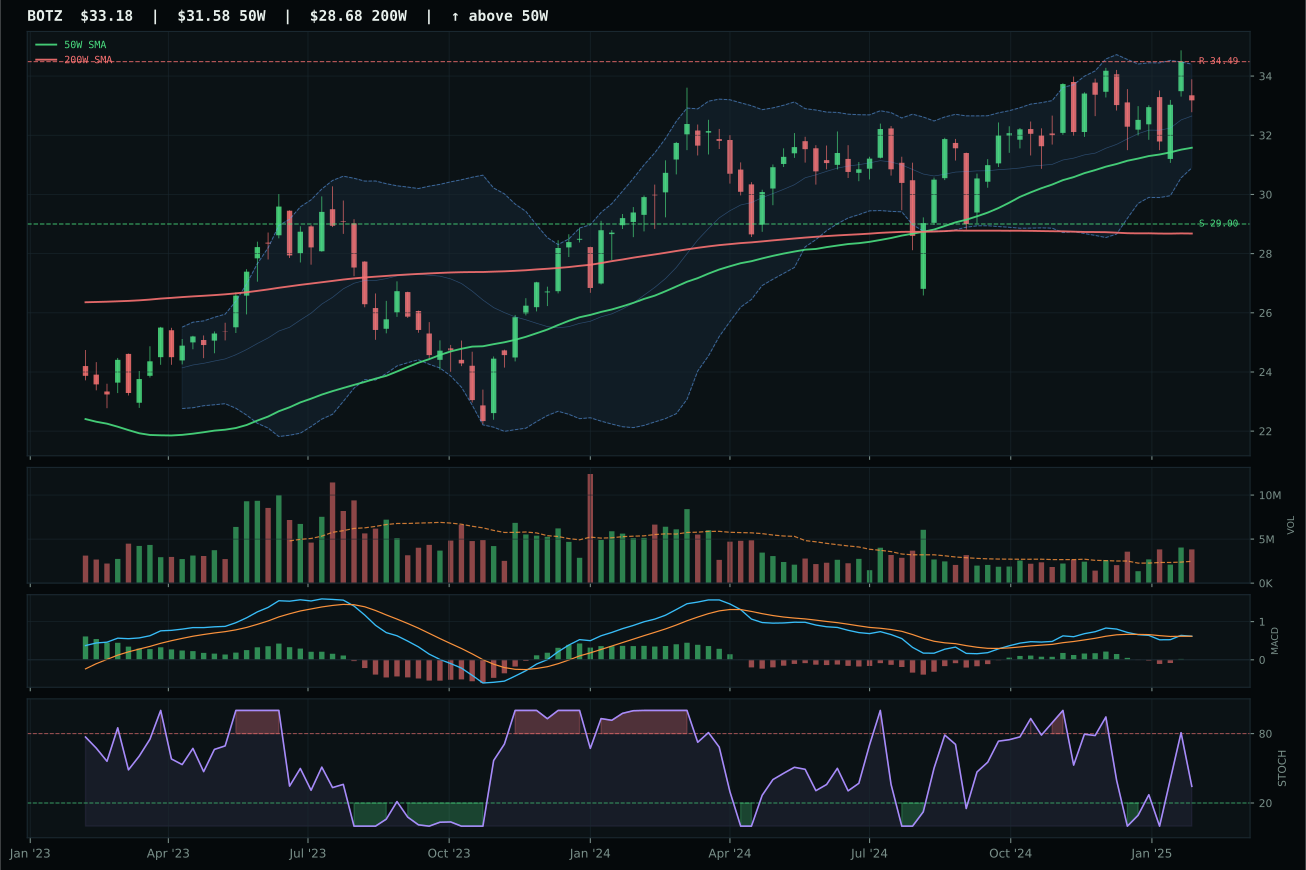
BOTZ has a neutral structure profile with -1.7% 13-week relative strength versus SPY.
A failed hold above support would weaken the setup.
Actionable but governed by invalidation levels.
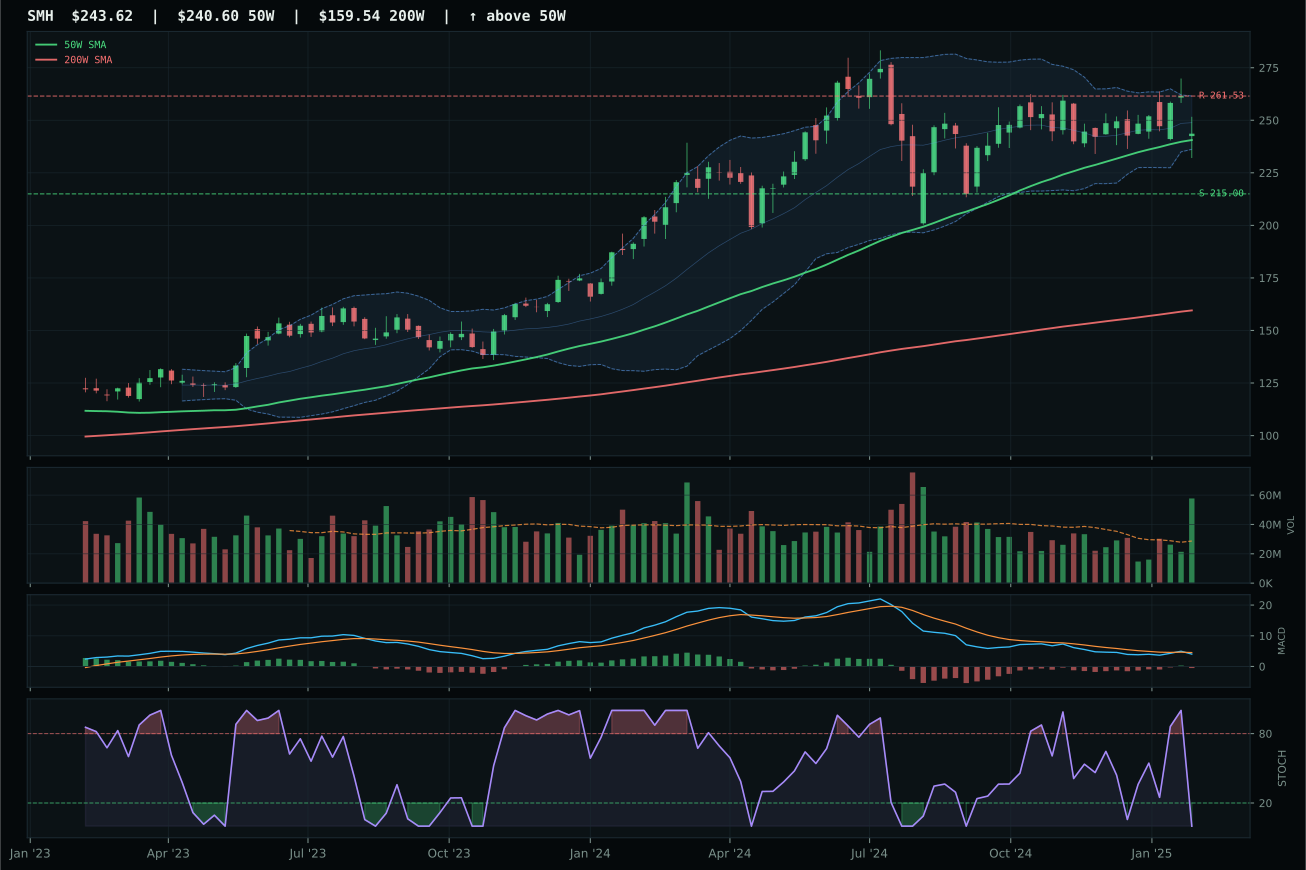
SMH has a compression near 50W profile with -5.9% 13-week relative strength versus SPY.
A failed hold above support would weaken the setup.
Actionable but governed by invalidation levels.
AIQ won by outrunning BOTZ on category-relative strength (5.8% vs 0.0%) despite both sitting in neutral structures near resistance. The 9.5% 13-week return with distribution pressure volume is a warning flag that usually kills a setup, but AIQ's 4.1% SPY-relative strength and bullish-but-flattening MACD hold slightly better than BOTZ's bearish-but-improving posture. Neither name is accumulating; volume is rejecting both moves, which explains why neither clears the 30-point threshold to reach top-2 eligibility. BOTZ's 1.7% SPY underperformance versus AIQ's 4.1% overperformance marks the technical distinction—AIQ has at least kept pace with broad market weakness while BOTZ has lagged further.
AI earned only 5% despite AIQ's relative technical strength because the entire category scored 22.8—third tier among all ten. Macro lit up like a warning light: liquidity stress (-12), credit stress (-8), and broad market bear (-8) crushed the 23.0 macro fit score to levels that offset 49.6 technical evidence in the reasoned ETF layer. Disinflation helped (+5) but couldn't overcome the headwind. At 62% technical, 38% macro, the category's unforgiving macro profile forced it into a 5% hold position rather than a top-2 slot. For AI to justify moving to 10%, the broad-market bear descriptor would need to reverse or liquidity stress to ease; as it sits, the category is fighting structural macro resistance that no amount of near-term price strength can overcome.
Industrial Metals — COPX
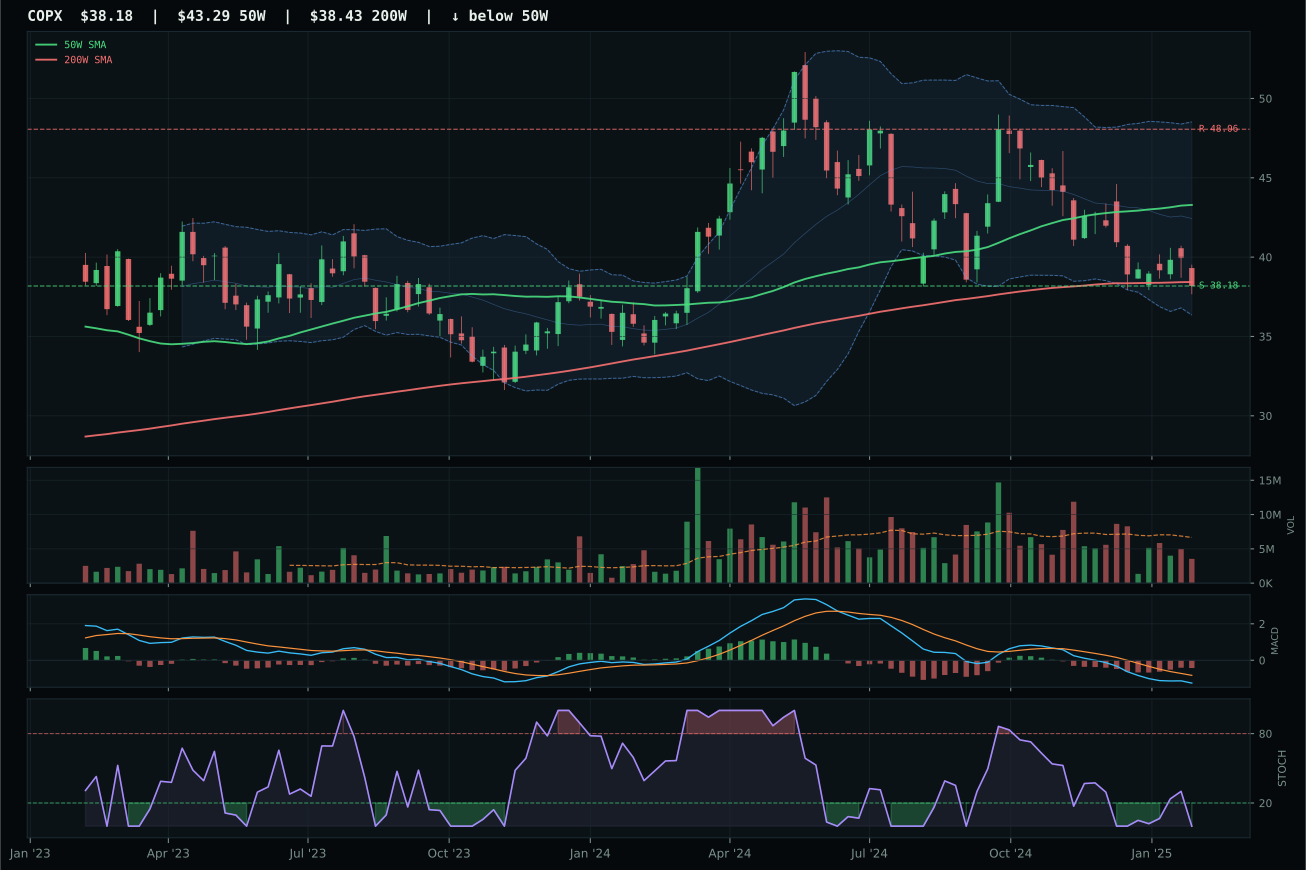
COPX has a pullback into support profile with -19.1% 13-week relative strength versus SPY.
A failed hold above support would weaken the setup.
Actionable but governed by invalidation levels.
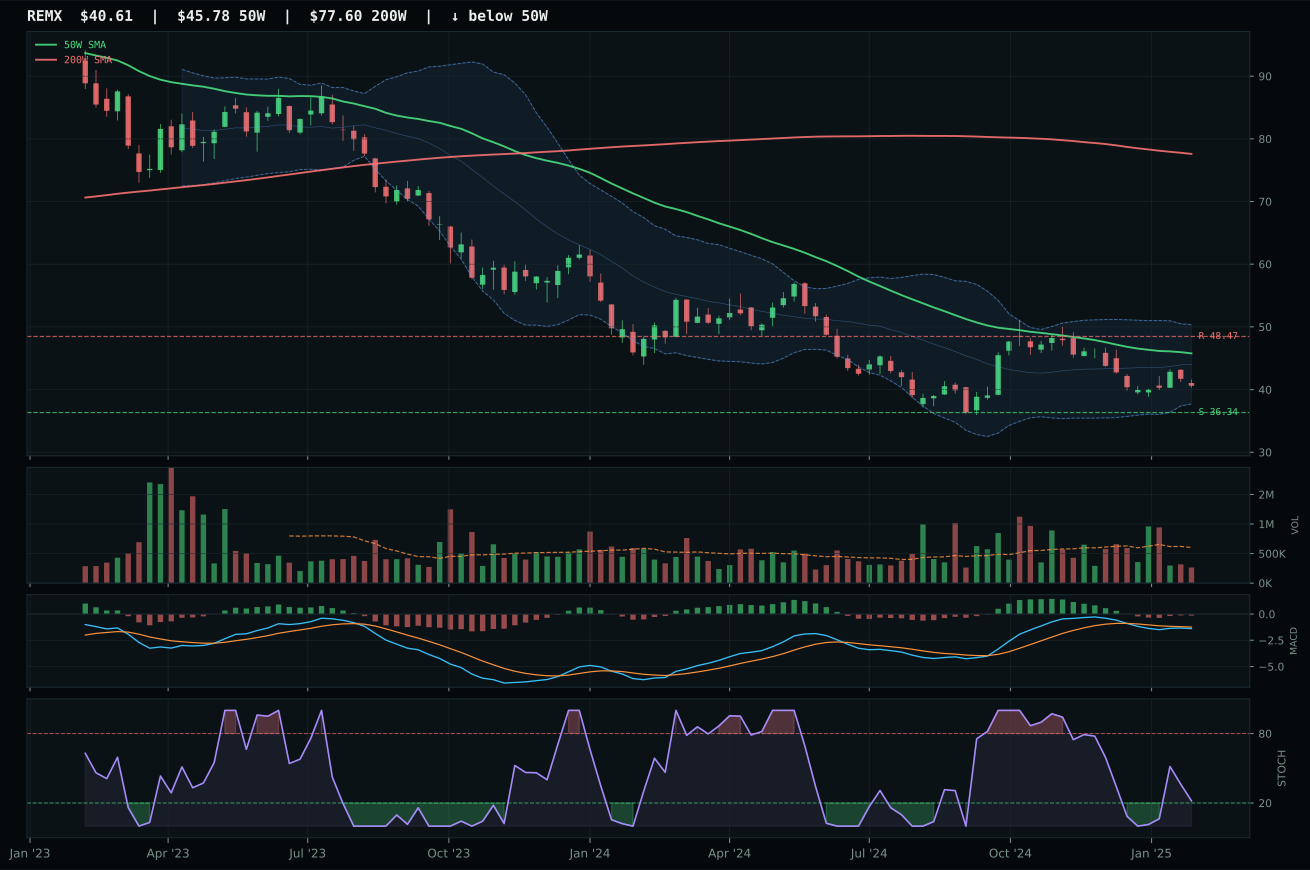
REMX has a neutral structure profile with -21.2% 13-week relative strength versus SPY.
Extension and support failure are the main tactical risks.
Tracked, but not top-2 eligible because: structurally broken.
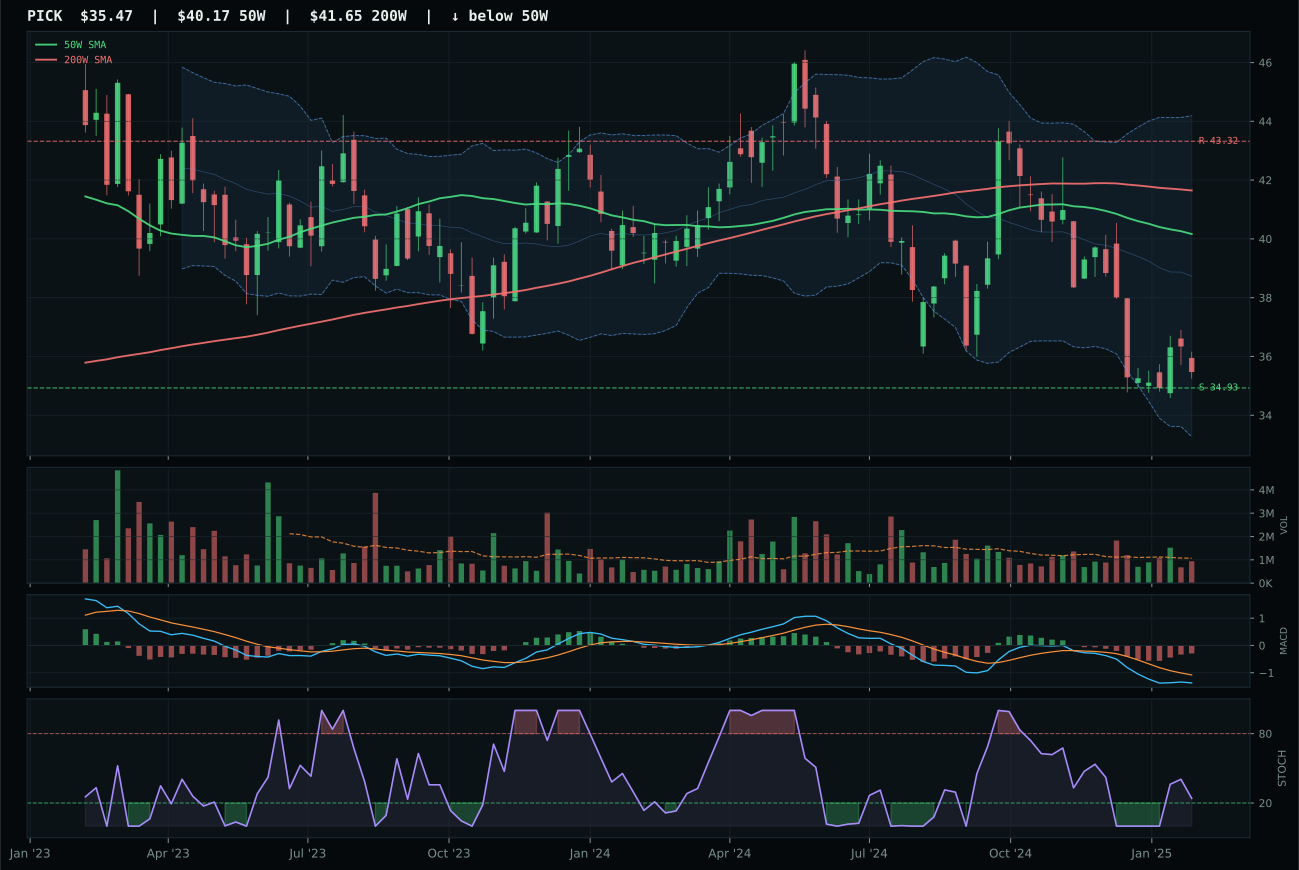
PICK has a pullback into support profile with -18.0% 13-week relative strength versus SPY.
Extension and support failure are the main tactical risks.
Tracked, but not top-2 eligible because: structurally broken.
COPX earned the category lead not through strength but through the least amount of structural damage. Price has pulled back 11.8% below the 50-week moving average into a defined support zone at 38.18, giving the setup a hard invalidation line—if support breaks, the trend is dead. Stochastic RSI at the 0.00 oversold extreme and MACD bearish-but-improving mark textbook reversal geometry. REMX lost the battle because its structure deteriorated (33 vs 67.8 cleanliness) and it has already extended further negative with -21.2% SPY-relative performance versus COPX's -19.1%. COPX's risk-reward at 90 out of 100 captures a full 20.6% downside buffer to resistance but only 0% upside—this is pure support reversal trading, not a trend continuation.
Industrial Metals earned 5% allocation despite a 0.0 category score because the reasoner deemed COPX eligible—barely. The macro fit plummeted to 28.0/100, poisoned by liquidity stress (-8), credit stress (-7), and dollar pressure (-7), leaving no macro oxygen. COPX's 39.8 technical evidence couldn't overcome the -38 basis-point macro drag; momentum confirmation scored 0.0 (past 4-week return: -2.0%, 13-week: -13.7%), and volume-price confirmation at 30.3 screamed rejection. The category is in the portfolio because COPX sits at a defined support level with oversold stochastic RSI, offering a low-risk entry IF the setup holds—but it's a 5% allocation of last resort, not conviction. For industrial metals to move to 10%, copper would need to hold support, credit stress would need to ease, and the dollar would need to weaken; as it stands, this is a salvage position, not a growth play.
Emerging Markets — INDA
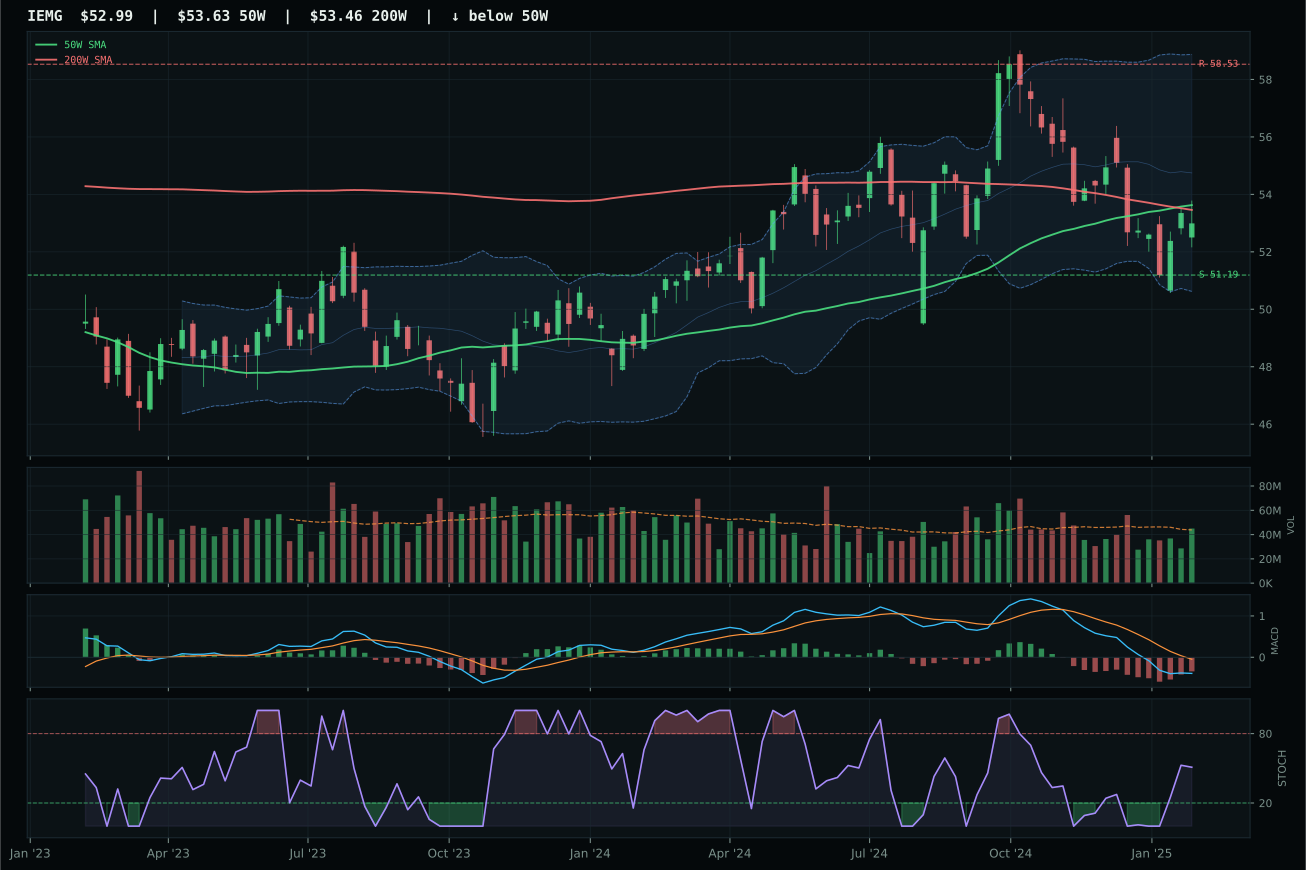
IEMG has a pullback into support profile with -10.4% 13-week relative strength versus SPY.
A failed hold above support would weaken the setup.
Actionable but governed by invalidation levels.
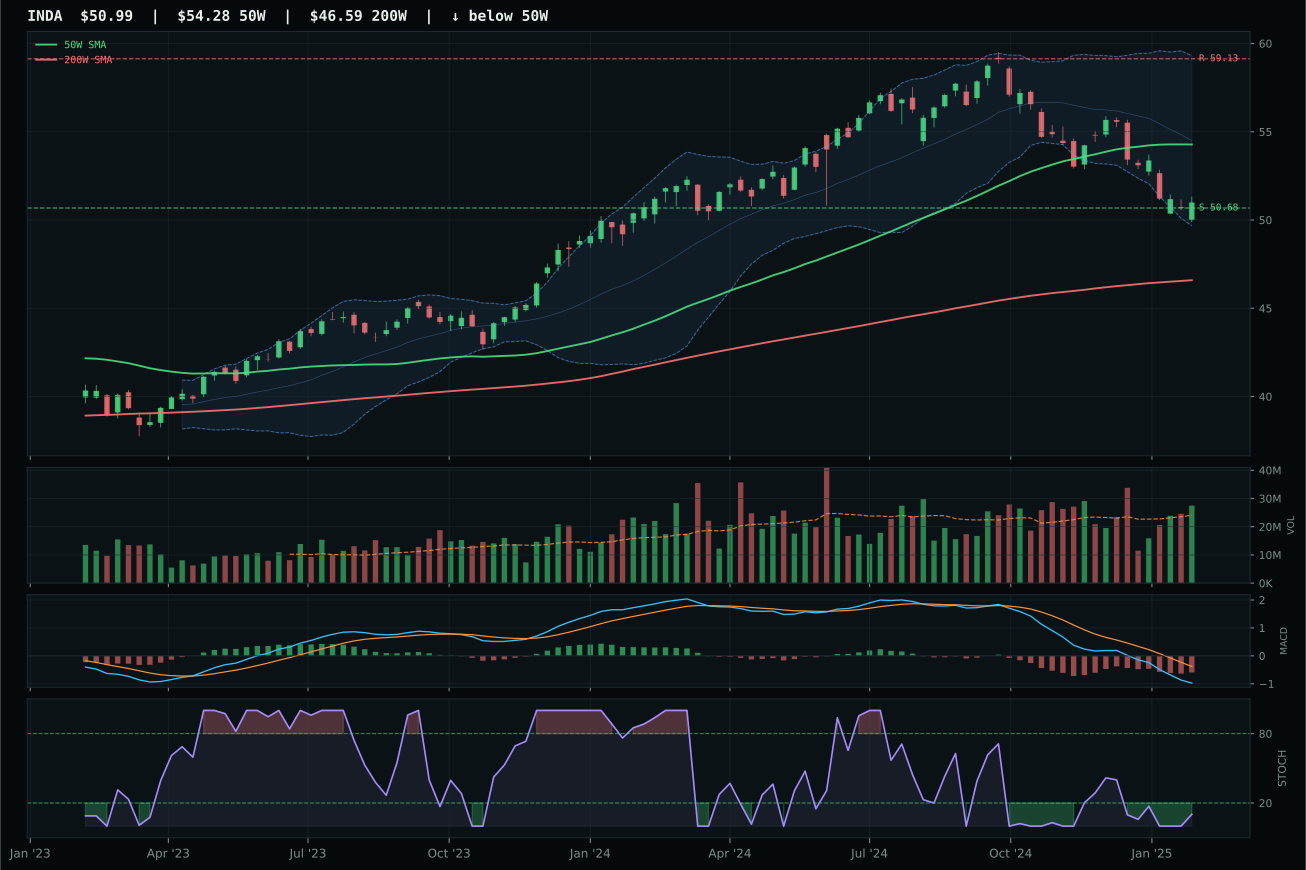
INDA has a pullback into support profile with -12.4% 13-week relative strength versus SPY.
A failed hold above support would weaken the setup.
Actionable but governed by invalidation levels.
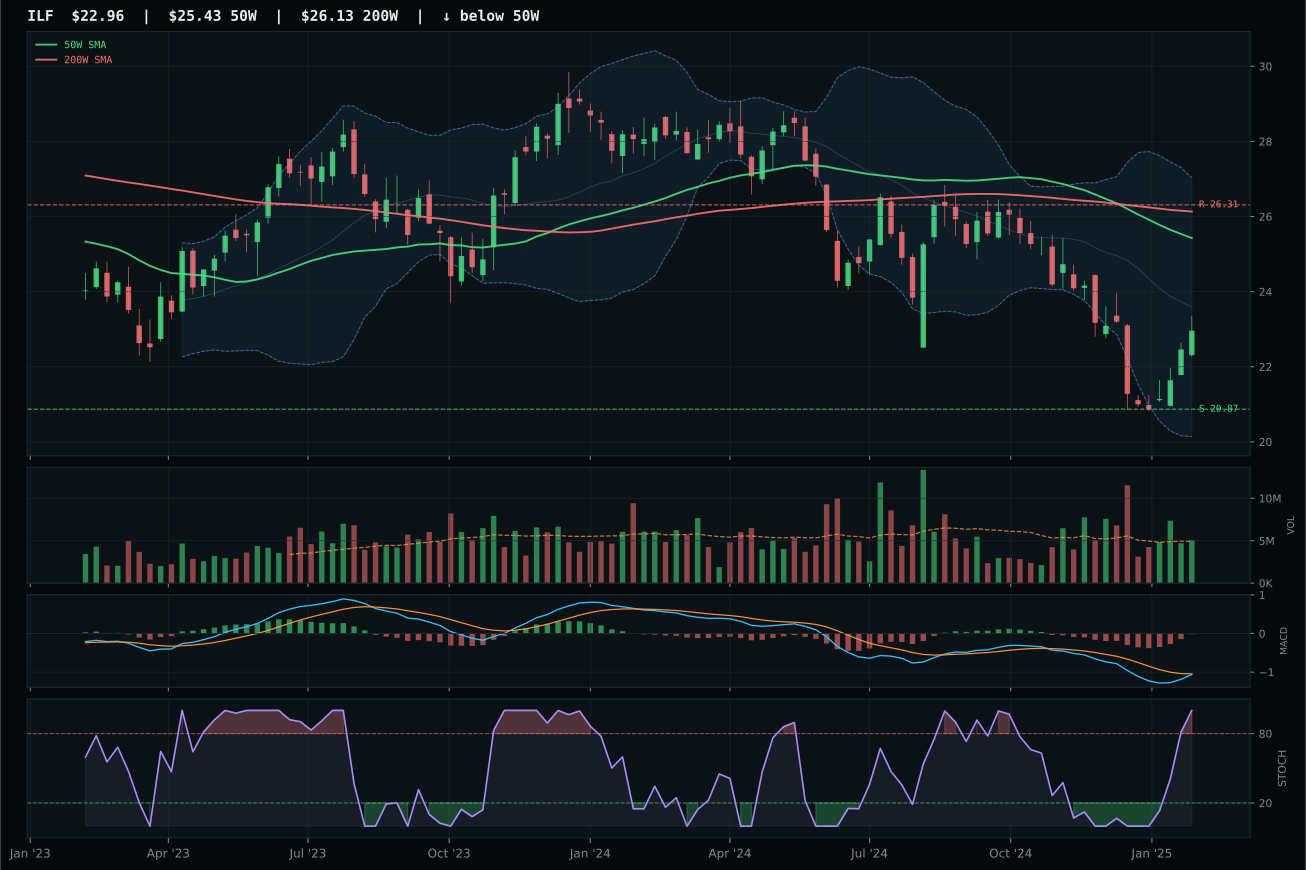
ILF has a neutral structure profile with -10.5% 13-week relative strength versus SPY.
Extension and support failure are the main tactical risks.
Tracked, but not top-2 eligible because: structurally broken.
INDA claimed the category lead despite 42 out of 100 technical evidence—the worst score among winners—because IEMG's 56.7 technical evidence came bundled with 24 out of 100 macro fit, making IEMG technically stronger but macro-poisoned. INDA's pullback into support at 50.68 with stochastic RSI oversold turn-up (0.10) offers clearer reversal geometry than IEMG's rising mid-zone stochastic at support; INDA's above-average participation also beats IEMG's neutral volume, suggesting at least some accumulation into the dip. The -7.1% 13-week return and -12.4% SPY underperformance are brutal, but the timing score of 94 rewards a chart that sits in defined repair territory rather than grinding downward on deteriorating momentum.
Emerging Markets scored 0.0 and earned 5% allocation despite manifest category failure because INDA's mechanical setup (oversold turn-up near Fib 0.786) provided a defined entry if support held. The category macro fit was abysmal at 7.0/100: dollar pressure (-14), credit stress (-10), liquidity stress (-10), and broad market bear (-9) created a -43 basis-point drag that no technical merit could overcome. INDA's 4.5 technical evidence at 62% weight and 35.0 macro fit at 38% weight yielded a composite that scored below zero but was held eligible because the pullback-into-support structure gave a tactical entry point. This is a maximum-conviction 5% position that the market could dispose of overnight if support at 50.68 breaks, but as long as dollar pressure and credit stress remain active macro descriptors, emerging markets are largely unavailable to the portfolio. For allocation to expand, either the dollar would need to weaken significantly or risk appetite would need to genuinely stabilize—currently neither is signaling.
Traditional Energy — XLE
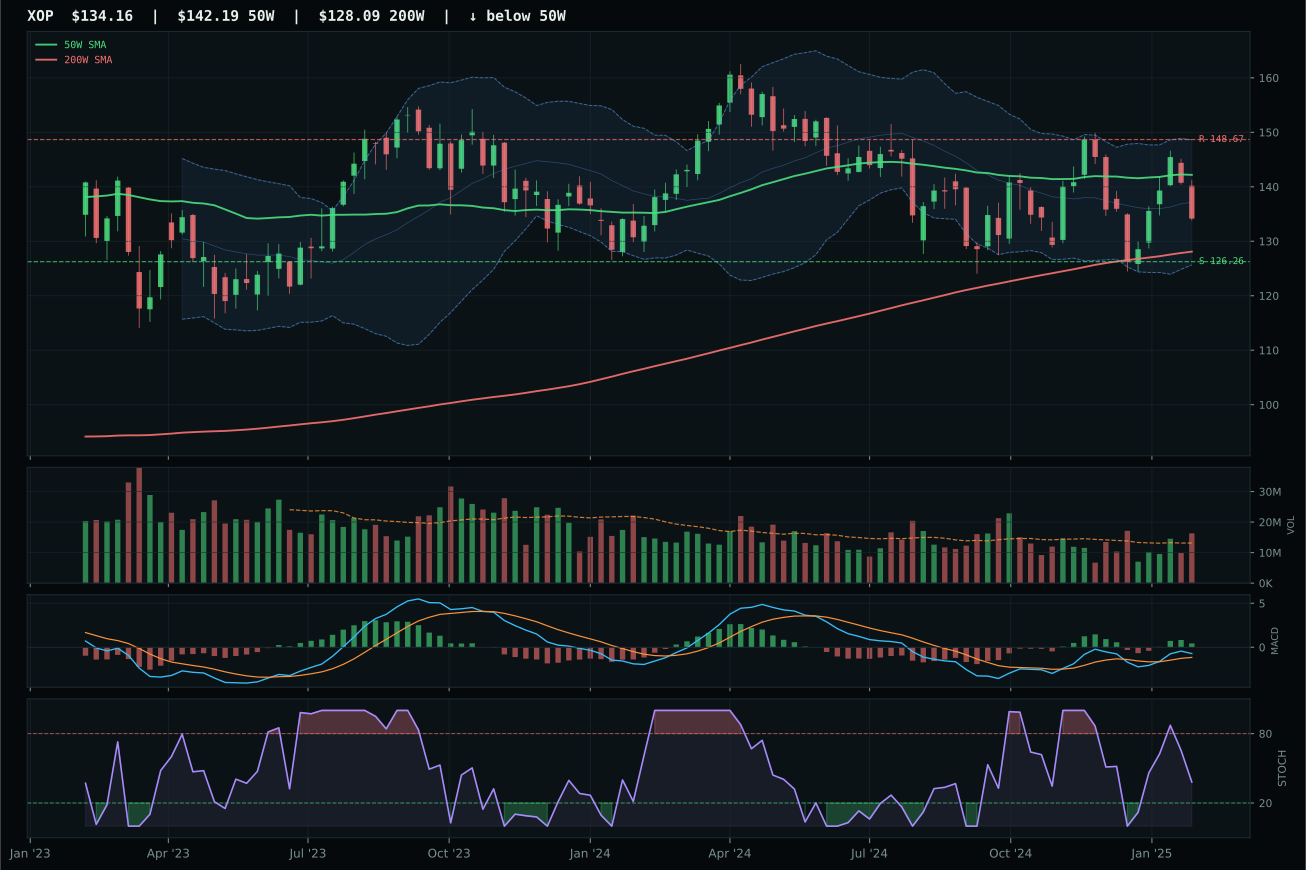
XOP has a neutral structure profile with -1.7% 13-week relative strength versus SPY.
A failed hold above support would weaken the setup.
Actionable but governed by invalidation levels.
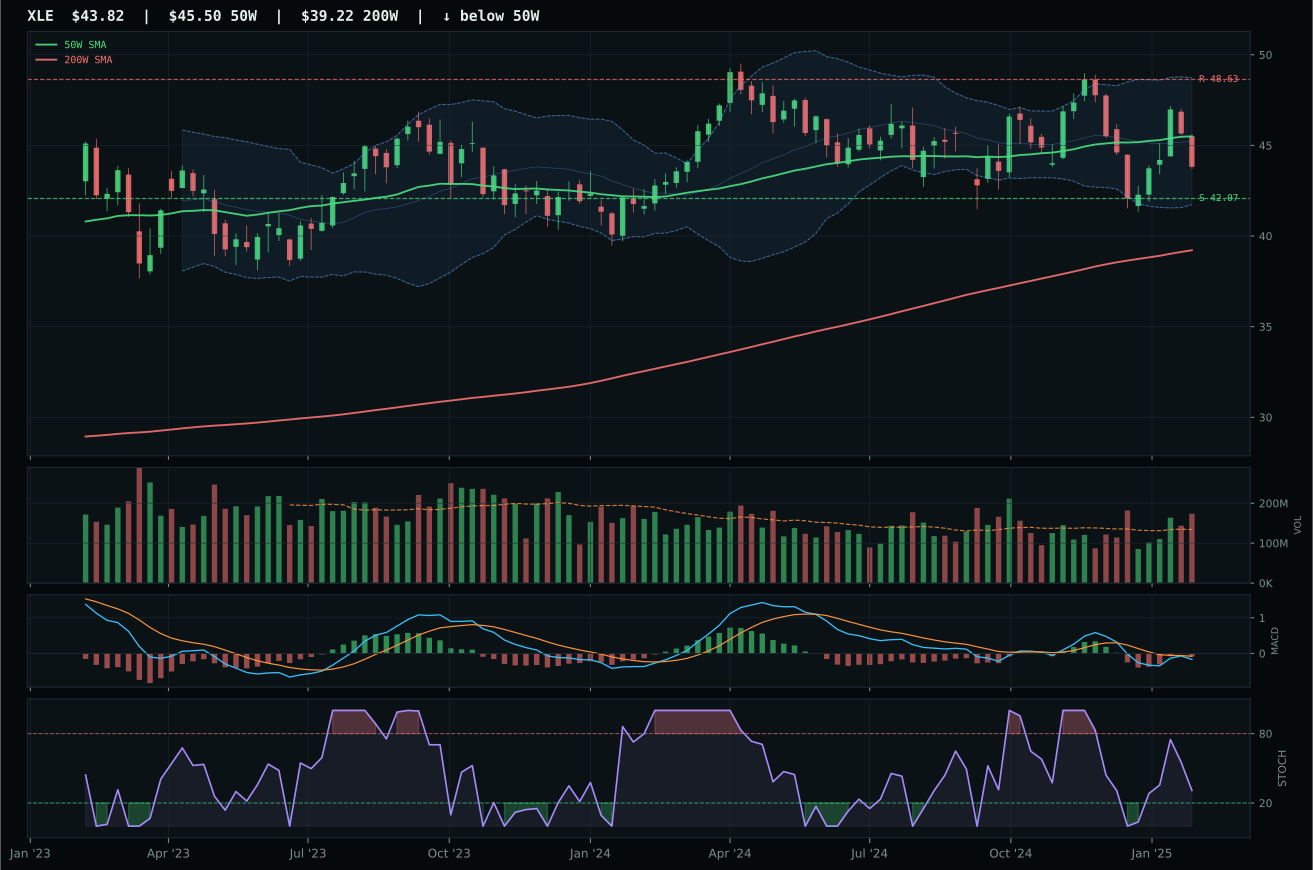
XLE has a pullback into support profile with -5.8% 13-week relative strength versus SPY.
A failed hold above support would weaken the setup.
Actionable but governed by invalidation levels.
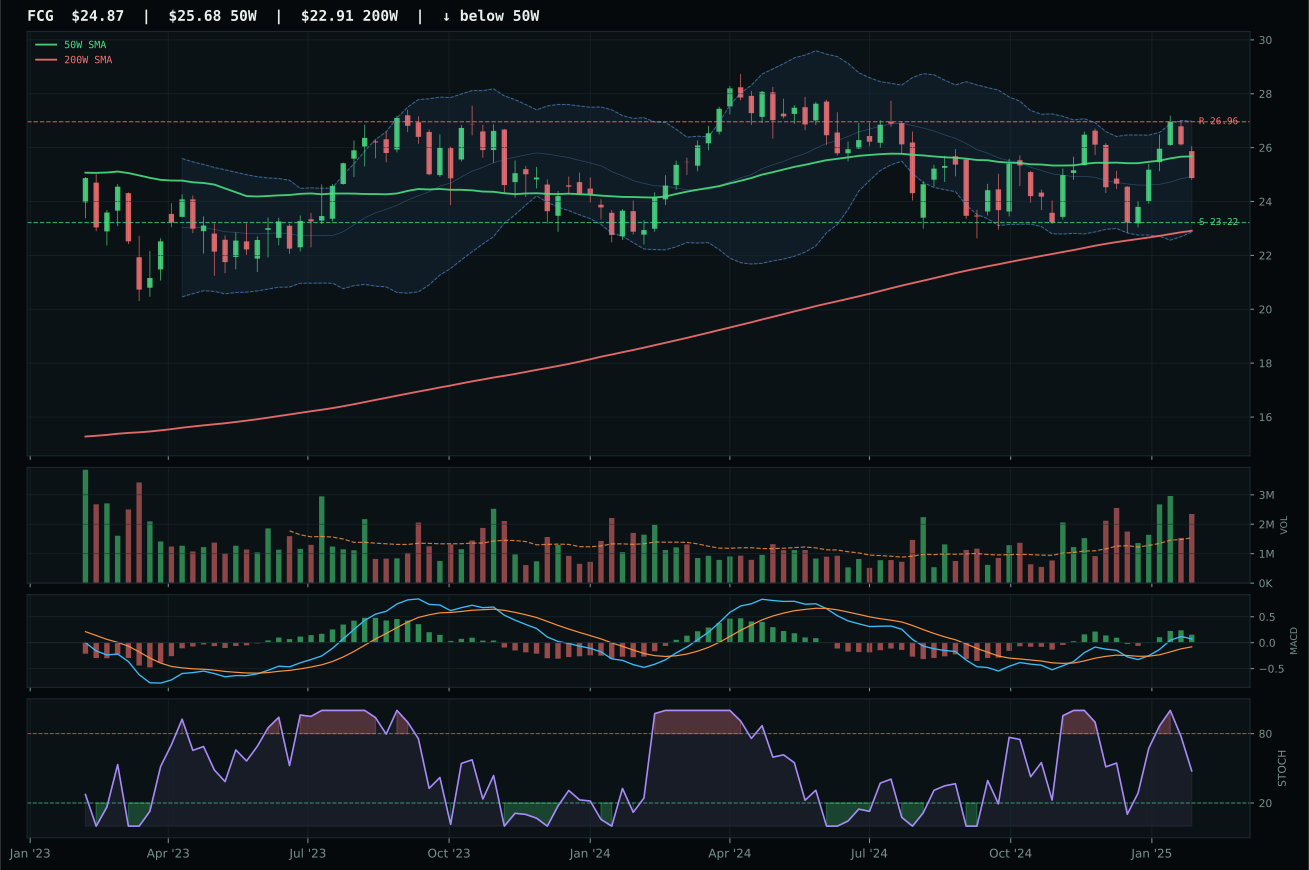
FCG has a neutral structure profile with 1.7% 13-week relative strength versus SPY.
A failed hold above support would weaken the setup.
Actionable but governed by invalidation levels.
XLE's timing score of 100 out of 100 separated it from XOP's 82, reflecting a pullback into support at 42.07 with stochastic RSI falling-neutral (0.30) rather than XOP's deeper retracement with less defined entry geometry. Both names are negative on 13-week returns and show weak momentum confirmation, but XLE's risk-reward at 87.8 versus XOP's 81.1 reveals XLE is closer to support and farther from resistance—better odds on a mean-reversion trade. XOP's bullish MACD appears strong until volume distribution is factored in; XLE's bearish-improving MACD aligns with the pullback structure, offering clarity that XOP's conflicting indicators obscure.
Traditional Energy scored 9.5 and earned 0% allocation because it sits outside the portfolio entirely this week. The category macro fit came in at a dismal 16.0/100, crushed by disinflation pressure (-10), disinflation headwind (-10), credit stress (-7), and liquidity stress (-7). XLE's 39.8 technical evidence couldn't overcome the -44 basis-point macro deficit; at 62% technical and 38% macro, the category failed the fundamental portfolio thesis. Even XLE's perfect timing score (100) and elite risk/reward (95.8) couldn't redeem a regime where disinflation actively hurts energy demand narratives and dollar strength (implicit in credit stress) keeps commodity leverage expensive. For energy to earn allocation, the macro regime would need to flip from Disinflation to Reflation or Transition, or active disinflation pressure descriptor would need to toggle off—neither is likely given current Fed messaging and market structure.
Agriculture & Livestock — MOO
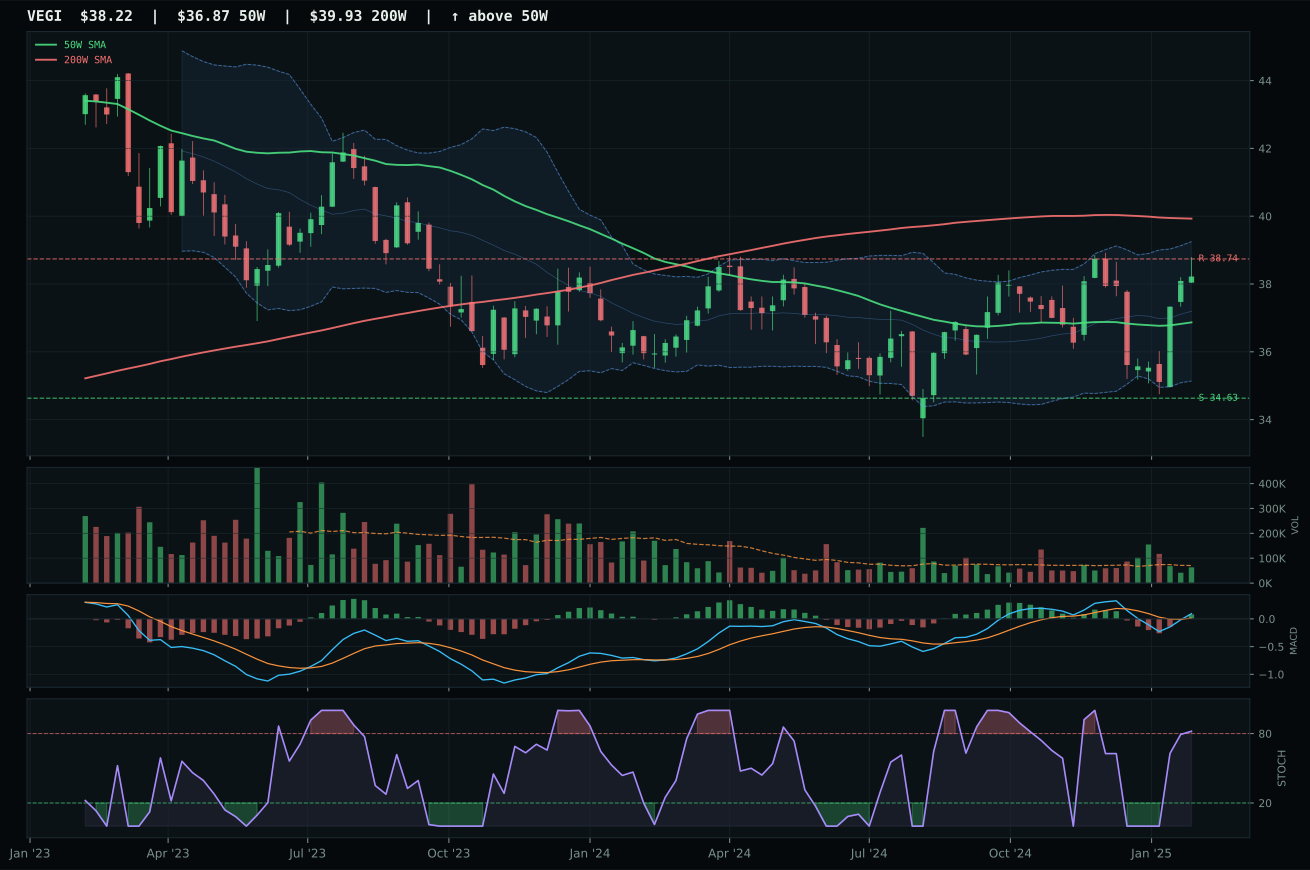
VEGI has a neutral structure profile with -2.1% 13-week relative strength versus SPY.
A failed hold above support would weaken the setup.
Tracked, but not top-2 eligible because: .
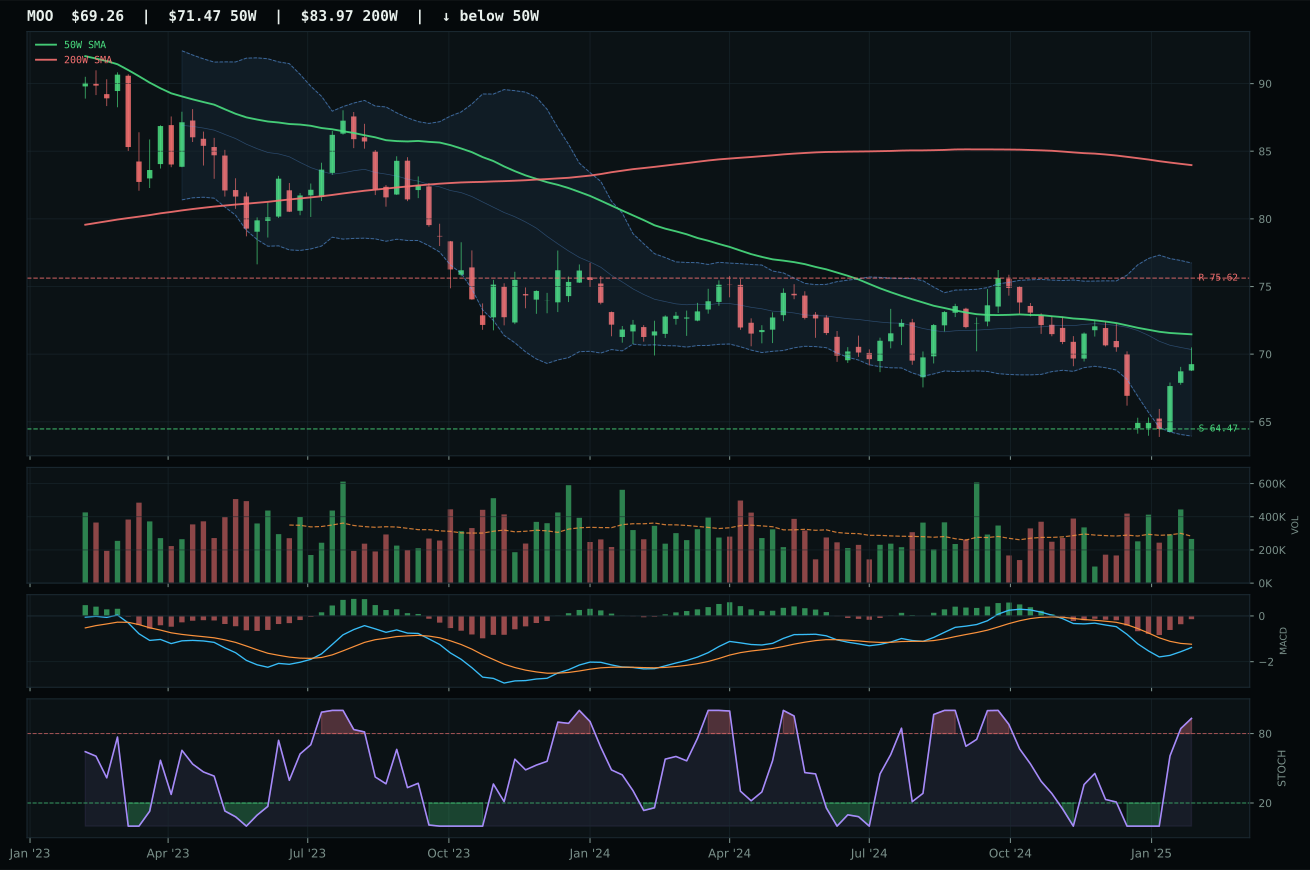
MOO has a neutral structure profile with -8.5% 13-week relative strength versus SPY.
Extension and support failure are the main tactical risks.
Tracked, but not top-2 eligible because: structurally broken.
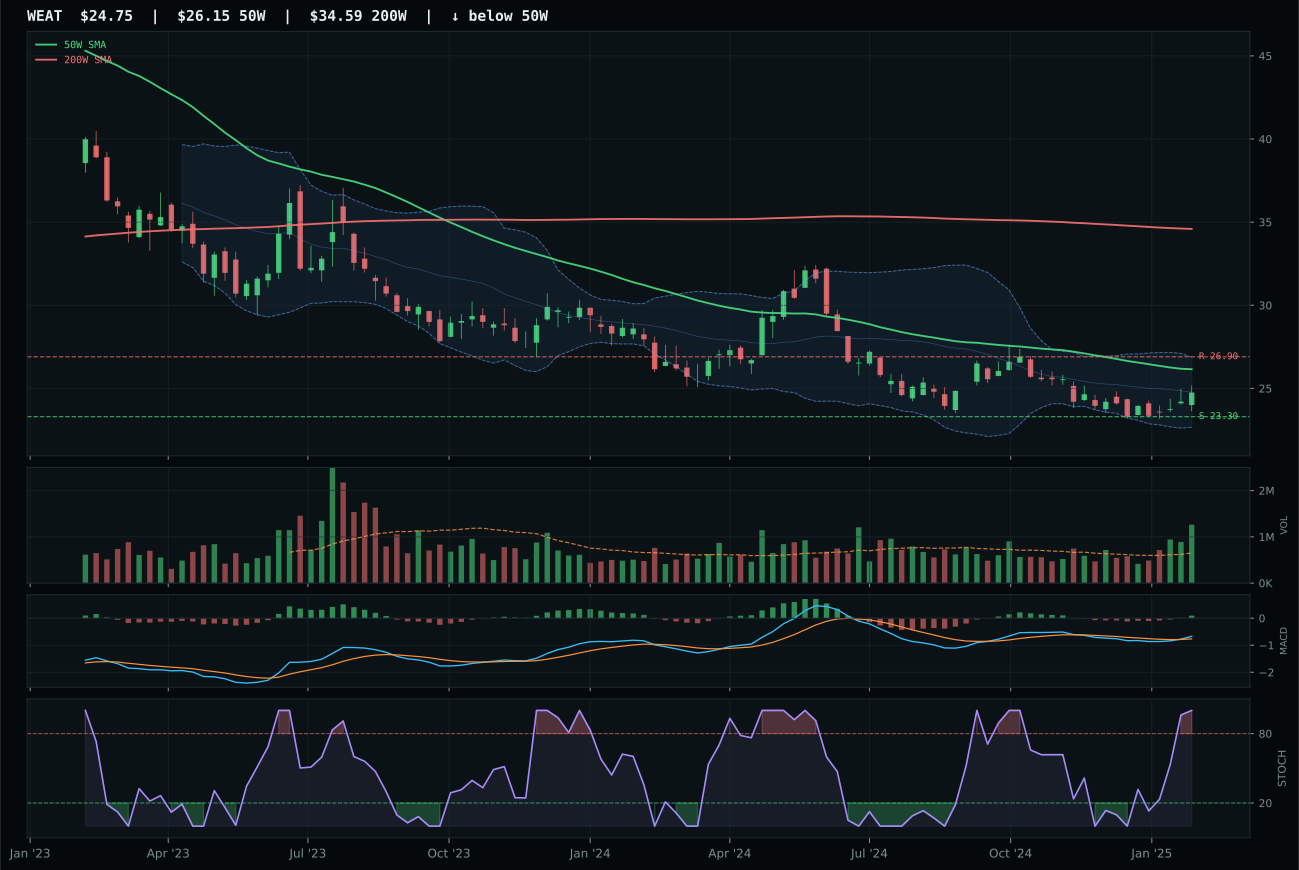
WEAT has a neutral structure profile with -8.5% 13-week relative strength versus SPY.
Extension and support failure are the main tactical risks.
Tracked, but not top-2 eligible because: structurally broken.
MOO wins a broken category by being the least broken name. Price sits 3.1% below the 50-week moving average rather than 3.7% above it like VEGI, which means MOO's risk-reward punches harder (73.4 vs 47.3)—more downside room to support before invalidation, more upside to resistance before profit-taking becomes urgent. Both names carry overbought stochastic RSI at the 0.93-0.94 band despite weak 13-week returns, suggesting a technical coil rather than genuine momentum. VEGI's bullish-improving MACD is actually a liability here because it conflicts with falling prices; MOO's bearish-improving posture aligns with the chart, offering clearer setup geometry even if the absolute technicals are weaker.
Agriculture & Livestock scored 5.5 and earned 0% allocation because it failed the eligibility filter. The category macro fit came in at 32.0/100, crushed by disinflation pressure (-8), disinflation headwind (-6), and liquidity stress (-4). At 62% technical weight, MOO's 42.0 technical evidence was median at best; at 38% macro, the -6 disinflation hit was structural. The 3/2/1 weighted ETF basket started at 41.8, then the reasoner tested it against volume-price sponsorship, persistence, and setup quality—and the category flunked. For agriculture to earn even a 5% sleeve, disinflation pressure would need to reverse (meaning inflation suddenly re-accelerating), or liquidity stress would need to ease materially. Right now, the sector sits outside the portfolio entirely because macro regime and technical evidence align on weakness, not opportunity.