
2025-01-24
Informational purposes only. The content in this report, including allocations, analysis, and commentary, is provided solely for informational and educational purposes. It does not constitute financial advice, investment advice, trading advice, or any other type of advice. Past performance does not guarantee future results. Always conduct your own research and consult a qualified financial professional before making investment decisions.
Weekly Allocation
| Ticker | Category | Weight | Role |
|---|---|---|---|
| FBTC | 50% | Overlay | |
| ITA | Defense & Aerospace | 10% | Top-2 (10%) |
| XLU | Utilities & Infrastructure | 10% | Top-2 (10%) |
| GLD | Precious Metals | 5% | Tier-2 (5%) |
| BOTZ | AI | 5% | Tier-2 (5%) |
| XLE | Traditional Energy | 5% | Tier-2 (5%) |
| NLR | Nuclear Energy | 5% | Tier-2 (5%) |
| CIBR | Technology | 5% | Tier-2 (5%) |
| INDA | Emerging Markets | 5% | Tier-2 (5%) |
Trade Instructions — Monday Open
Sell the tranche from 2024-12-27 (completing its 4-week hold). Buy the new tranche. Instructions show net portfolio changes — same-asset positions cancel, weight changes show the delta.
| Action | Ticker | Instruction |
|---|---|---|
| SELL | CIBR | Sell 17% of CIBR position (reduce 7.50% → 6.25%) |
| SELL | GLD | Sell 12% of GLD position (reduce 10.00% → 8.75%) |
| SELL | IGF | Sell 50% of IGF position (reduce 2.50% → 1.25%) |
| SELL | XAR | Sell 25% of XAR position (reduce 5.00% → 3.75%) |
| SELL | SMH | Sell 33% of SMH position (reduce 3.75% → 2.50%) |
| BUY | XLU | Buy XLU — 40.00% of freed cash (adds 2.50% to portfolio) |
| BUY | ITA | Buy ITA — 40.00% of freed cash (adds 2.50% to portfolio) |
| BUY | BOTZ | Buy BOTZ — 20.00% of freed cash (adds 1.25% to portfolio) |
Current Portfolio After Trade
Combined holdings across all 4 active tranches. Each tranche is 25% of the portfolio.
| Ticker | % of Portfolio | Weight Bar |
|---|---|---|
| FBTC | 50.00% | |
| GLD | 8.75% | |
| CIBR | 6.25% | |
| XLU | 6.25% | |
| XLE | 5.00% | |
| NLR | 5.00% | |
| XAR | 3.75% | |
| INDA | 3.75% | |
| SMH | 2.50% | |
| COPX | 2.50% | |
| ITA | 2.50% | |
| IGF | 1.25% | |
| WEAT | 1.25% | |
| BOTZ | 1.25% |
Macro Regime — Disinflation
Macro Evidence Charts
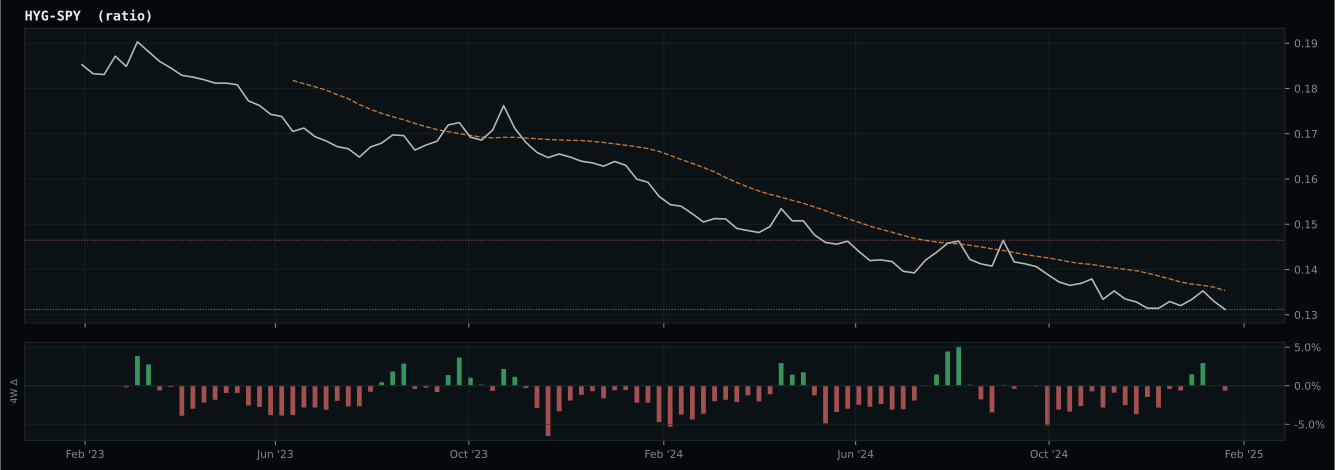
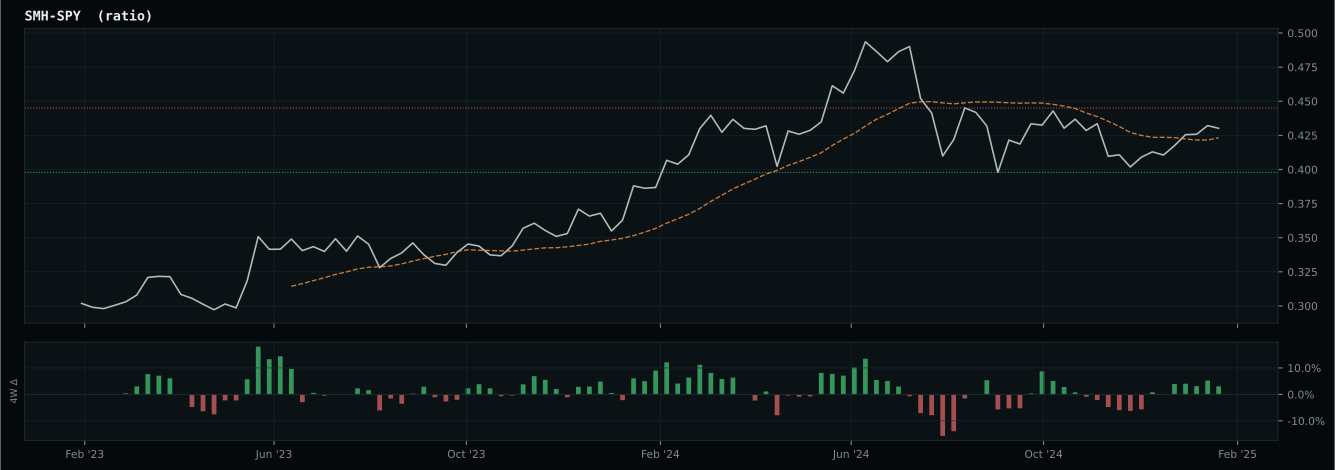
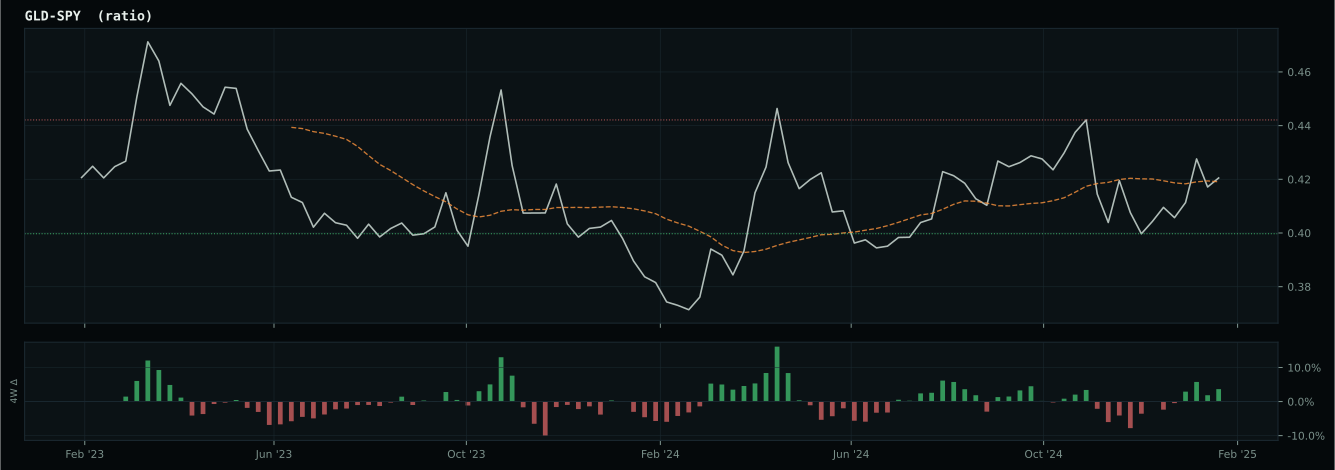
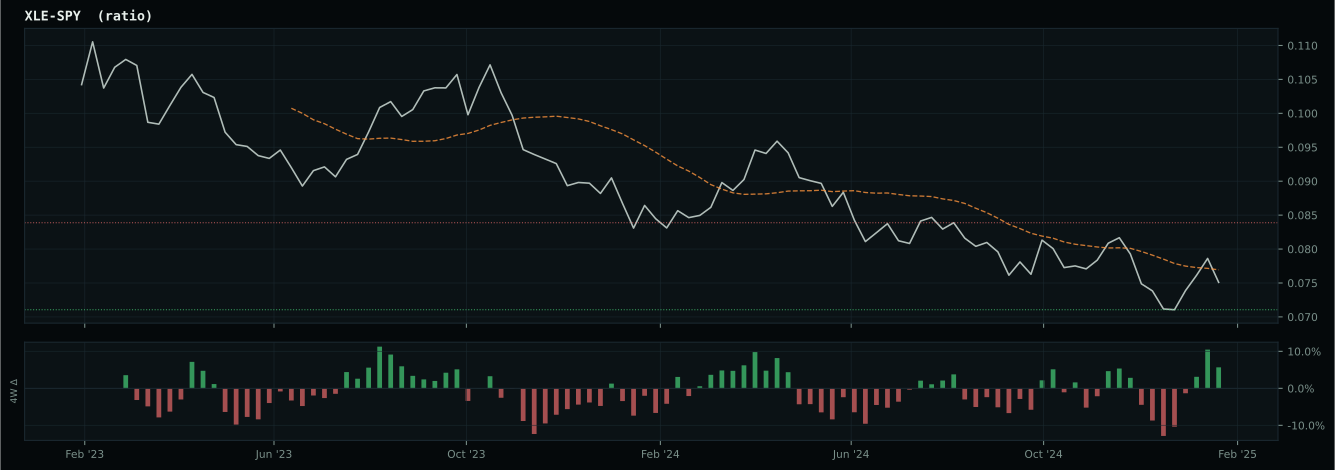
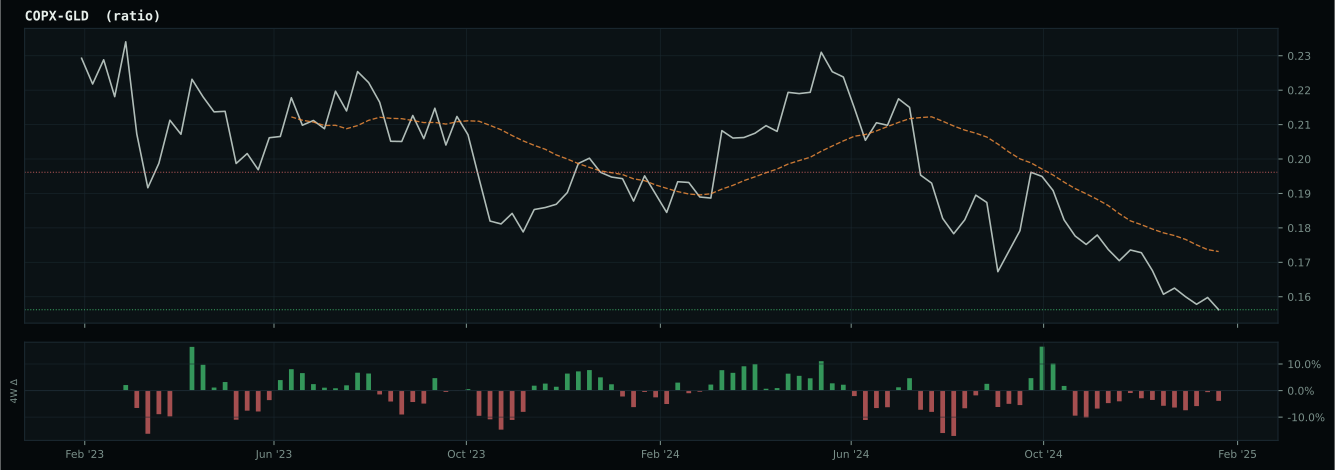
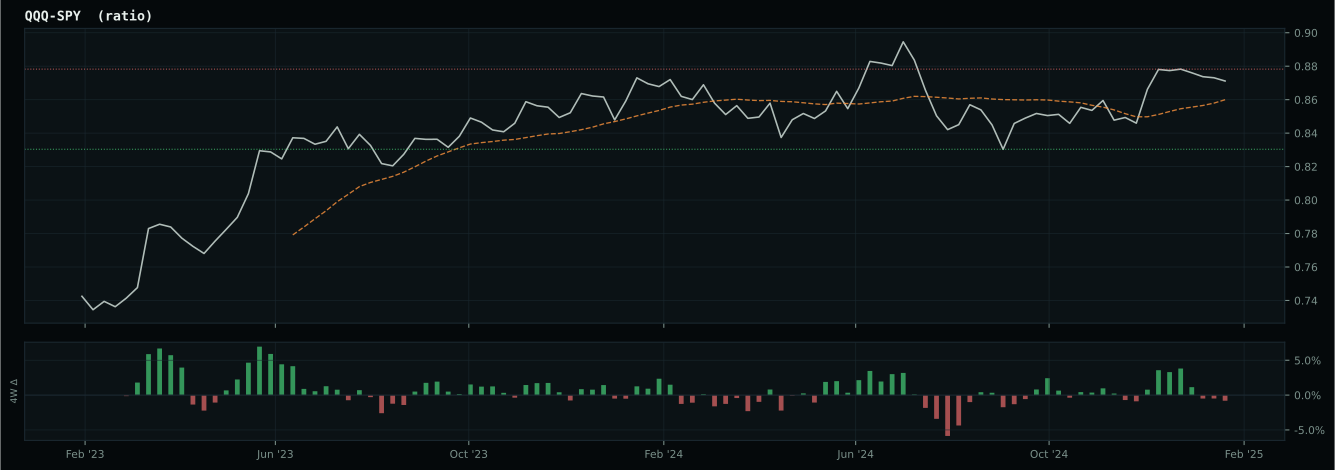
Market-implied signals behind the macro regime scores. Each ratio compares two assets; the direction and slope of the ratio is what the macro engine reads.
Crypto Regime — TrendBTC
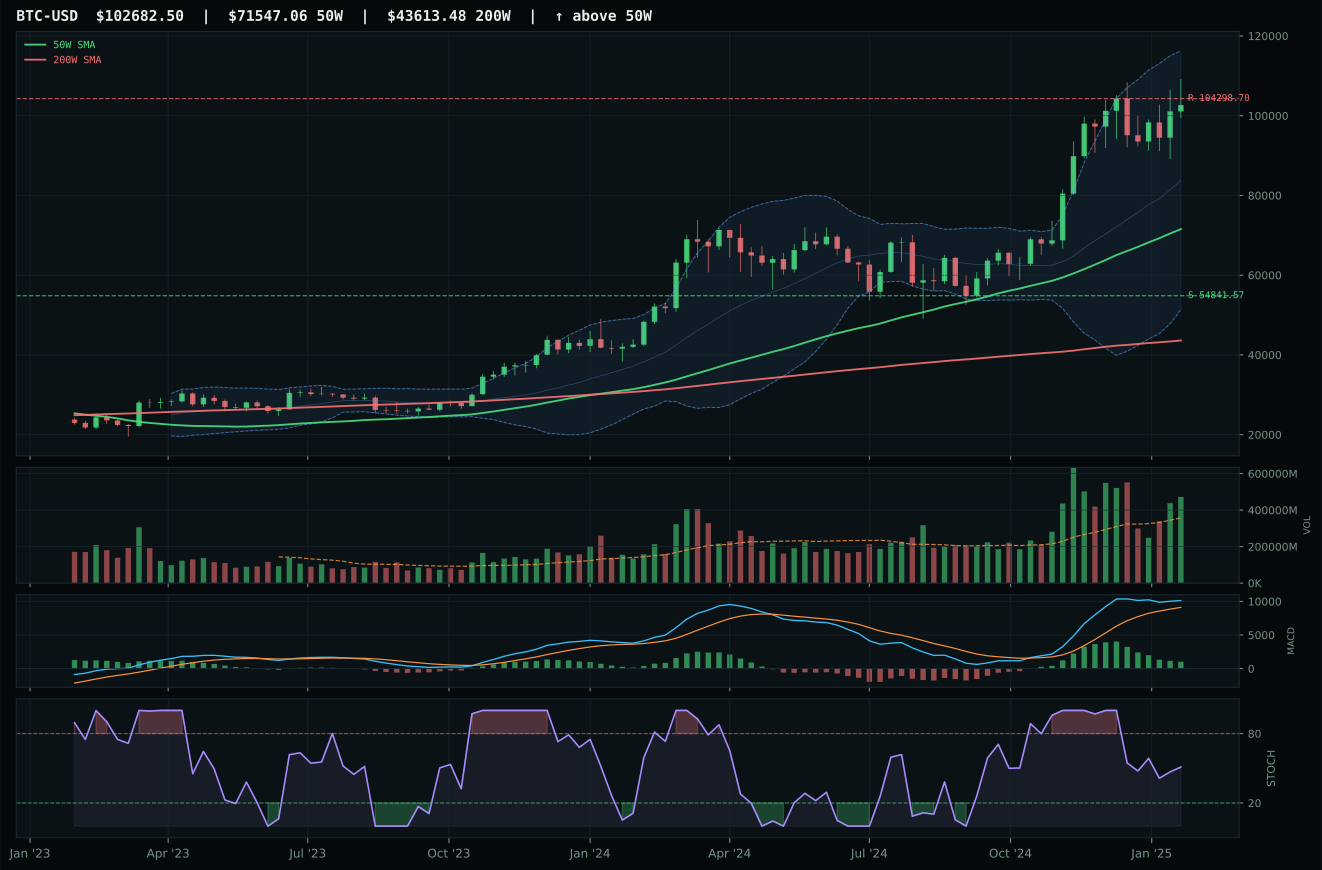
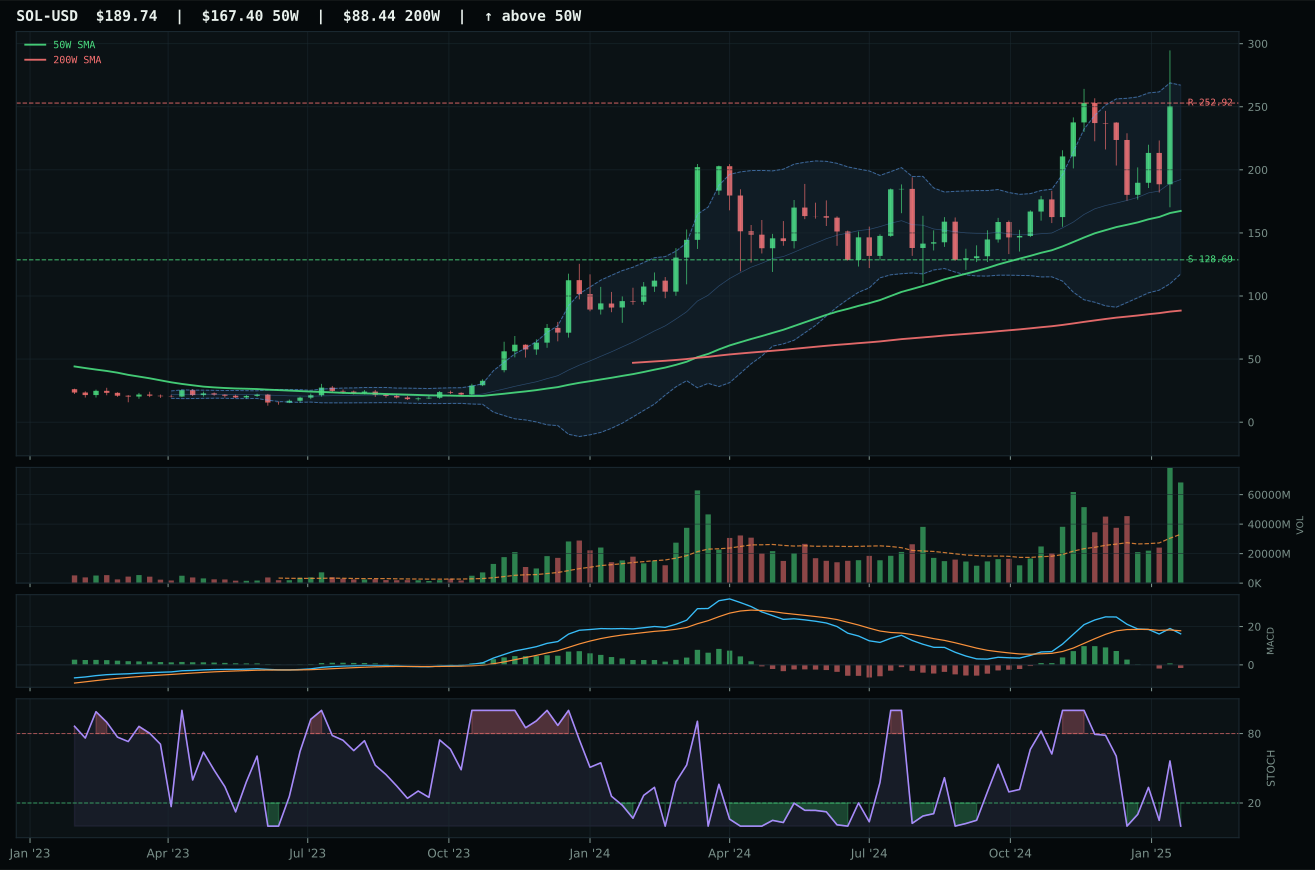
ValueBTC not armed: BTC has not made the first post-breakdown touch of the 200W buy zone after losing the 50W
TrendBTC confirmed: 2 consecutive closes above rising/flat 50W SMA
one or more available conditions failed
Category Rankings
| Rank | Category | Winner | Score | Alloc | 4W Ret | Peers (4W) |
|---|---|---|---|---|---|---|
| 1 | Defense & Aerospace | ITA | 62.3 | 20% | -2.97% | XAR -7.3% · ROKT -6.6% |
| 2 | Utilities & Infrastructure | XLU | 61.4 | 20% | +3.35% | PAVE -5.3% · IGF +0.2% |
| 3 | Precious Metals | GLD | 54.4 | 10% | +6.93% | GDX +9.5% · SLV +7.5% |
| 4 | AI | BOTZ | 50.6 | 10% | +0.60% | AIQ +3.9% · SMH +3.6% |
| 5 | Traditional Energy | XLE | 48.3 | 10% | +0.10% | FCG -2.7% · XOP -3.5% |
| 6 | Nuclear Energy | NLR | 44.8 | 10% | -6.54% | URA -9.9% · URNM -13.5% |
| 7 | Technology | CIBR | 36.7 | 10% | +4.68% | IGV -0.0% · XLK +3.1% |
| 8 | Industrial Metals | COPX | 31.0 | 10% | +0.18% | REMX -0.2% · PICK +2.4% |
| 9 | Agriculture & Livestock | MOO | 12.7 | 0% | -0.25% | VEGI -1.1% · WEAT +7.5% |
| 10 | Emerging Markets | INDA | — | 0% | -1.56% | IEMG +5.5% · ILF +5.4% |
Defense & Aerospace — ITA
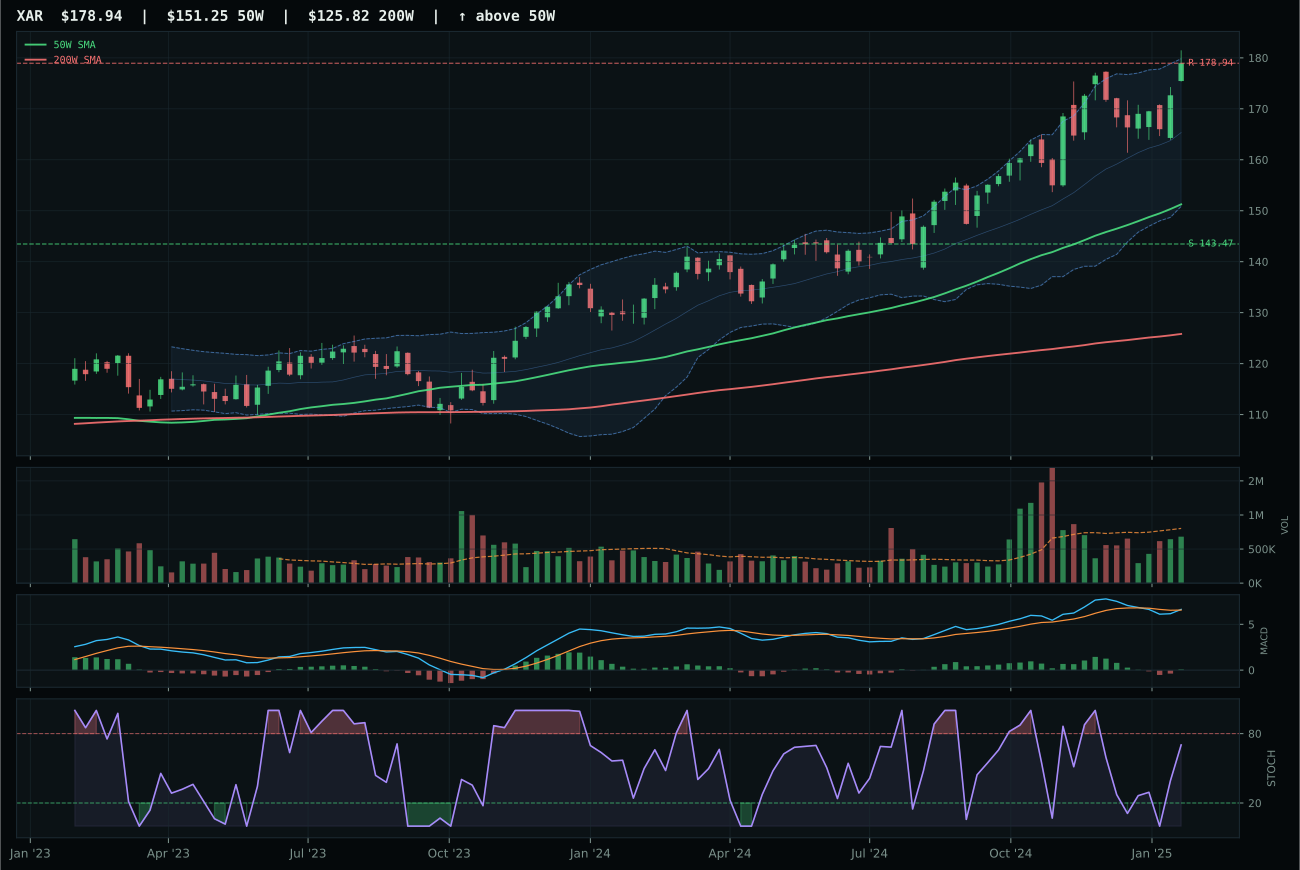
XAR has a vertical extension profile with 7.3% 13-week relative strength versus SPY.
A failed hold above support would weaken the setup.
Actionable but governed by invalidation levels.
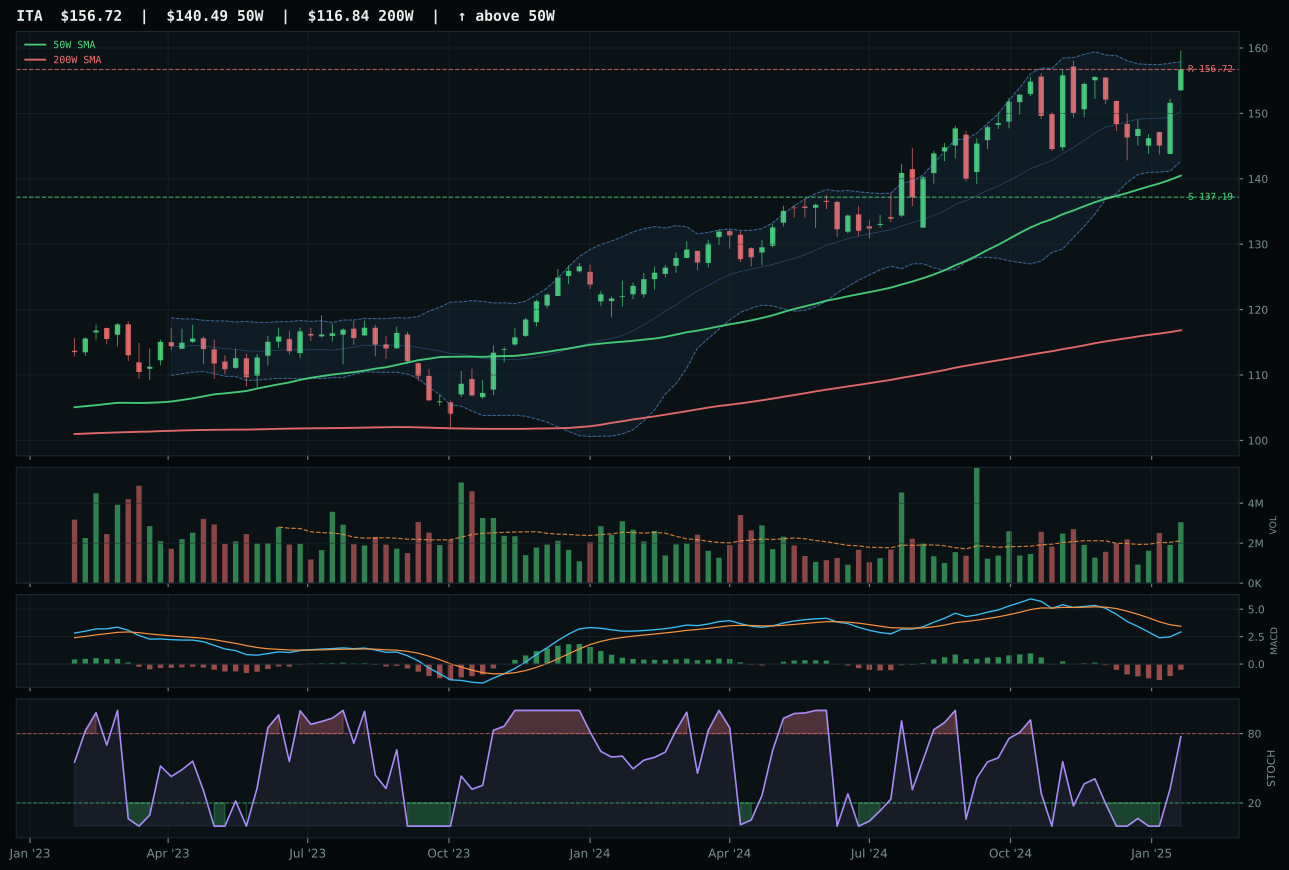
ITA has a neutral structure profile with -0.3% 13-week relative strength versus SPY.
A failed hold above support would weaken the setup.
Actionable but governed by invalidation levels.
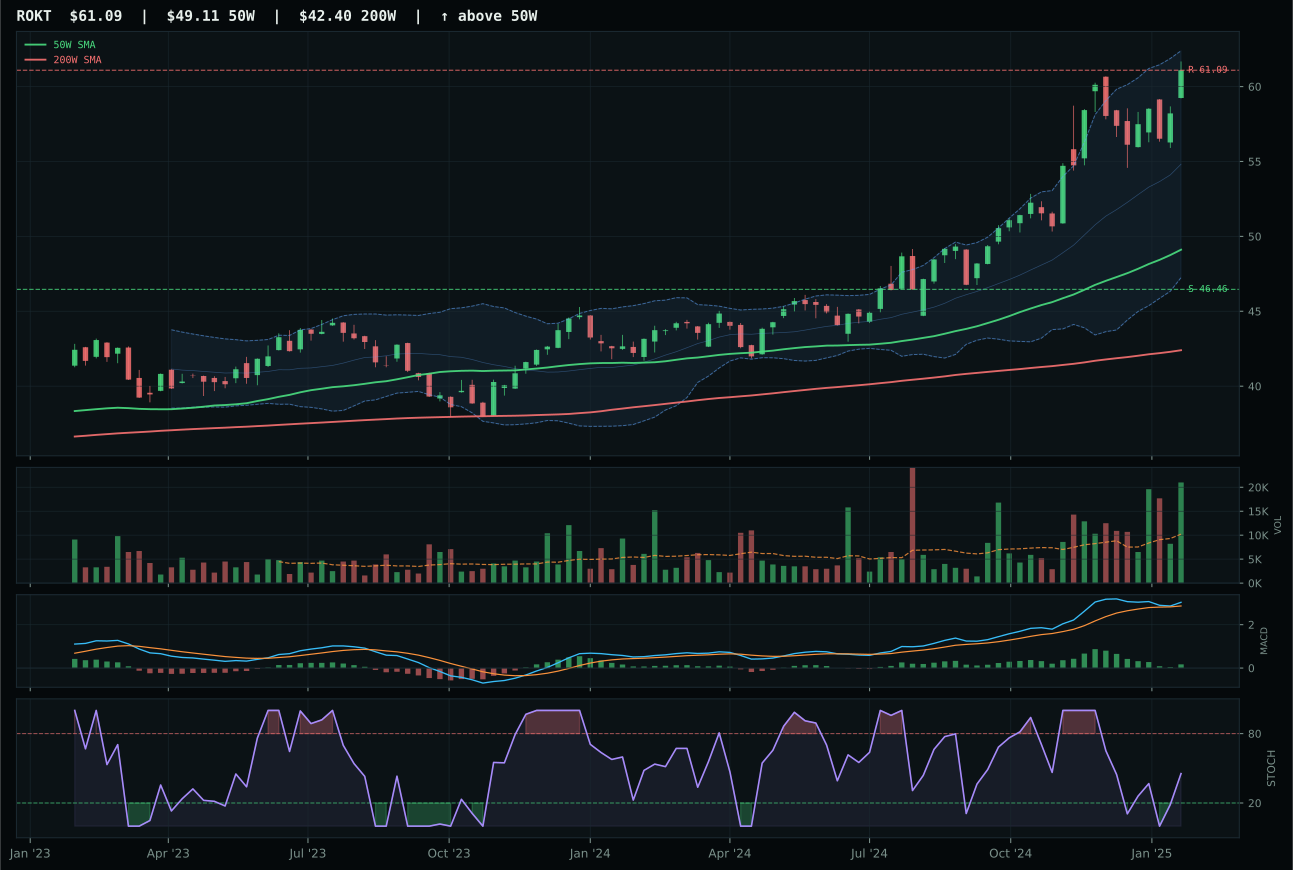
ROKT has a vertical extension profile with 13.5% 13-week relative strength versus SPY.
A failed hold above support would weaken the setup.
Tracked, but not top-2 eligible because: .
ITA wins a close decision over XAR by holding better timing and volume confirmation despite XAR's technical superiority on trend and momentum. ITA's setup is neutral structure sitting 11.6% above its 50-week average—compressed relative to XAR's vertical extension at 18.3%—which gives ITA the benefit of less stretched risk-reward (47.1 versus XAR's 42.8) and above-average volume participation that suggests institutional accumulation rather than momentum chasing. XAR is bullish and improving on MACD with rising stochastic, appearing stronger on paper, but ITA's bearish-but-improving MACD paired with 62.3 volume-price confirmation and 75.0 timing score reflects a more durable setup; the intermediate-term positioning is superior even if the near-term momentum read favors XAR. The 0.1-point gap confirms this is category coin-flip territory, but ITA's risk management wins.
Defense & Aerospace earned a 10% top-2 allocation slot because its 62.3 category score ranks among the two highest across all ten categories this week, driven by 70.8 technical evidence and a 60.0 macro fit that benefits from broad market bear conditions (+6) and dollar strength (+3). In a disinflation regime, investors rotate toward durable cash flows and geopolitical hedges; ITA's 4.7% thirteen-week return may lag the S&P 500 by -0.3%, but that defensive profile is exactly what the current macro environment demands. The category's position as a top-2 holding reflects confidence in the structural setup and alignment with near-term market psychology. Any deterioration in stochastic momentum or failure to hold the 137.19 support would warrant a downgrade, but for now, defense durability merits equal weight alongside utilities.
Utilities & Infrastructure — XLU
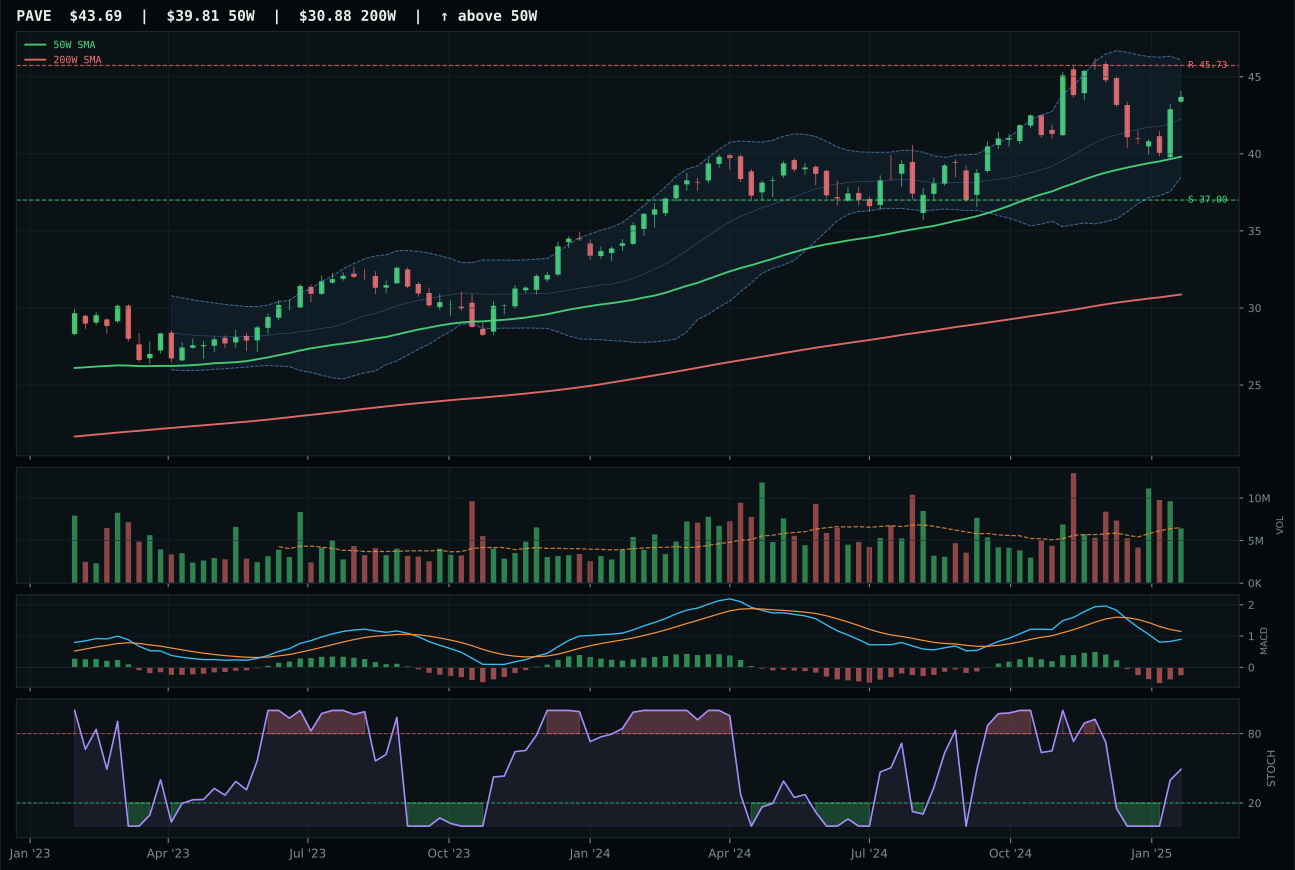
PAVE has a neutral structure profile with 1.0% 13-week relative strength versus SPY.
A failed hold above support would weaken the setup.
Actionable but governed by invalidation levels.
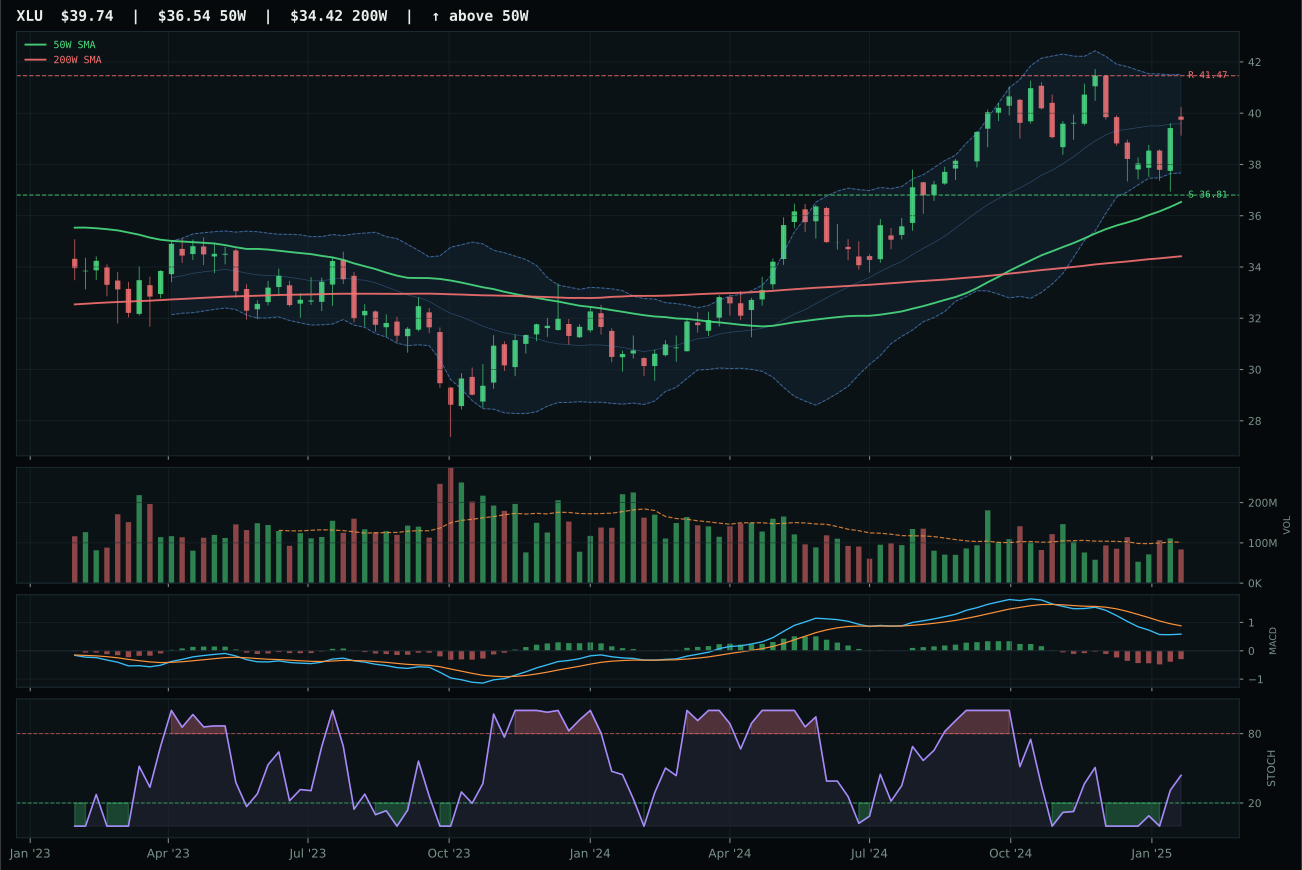
XLU has a neutral structure profile with -6.1% 13-week relative strength versus SPY.
A failed hold above support would weaken the setup.
Actionable but governed by invalidation levels.
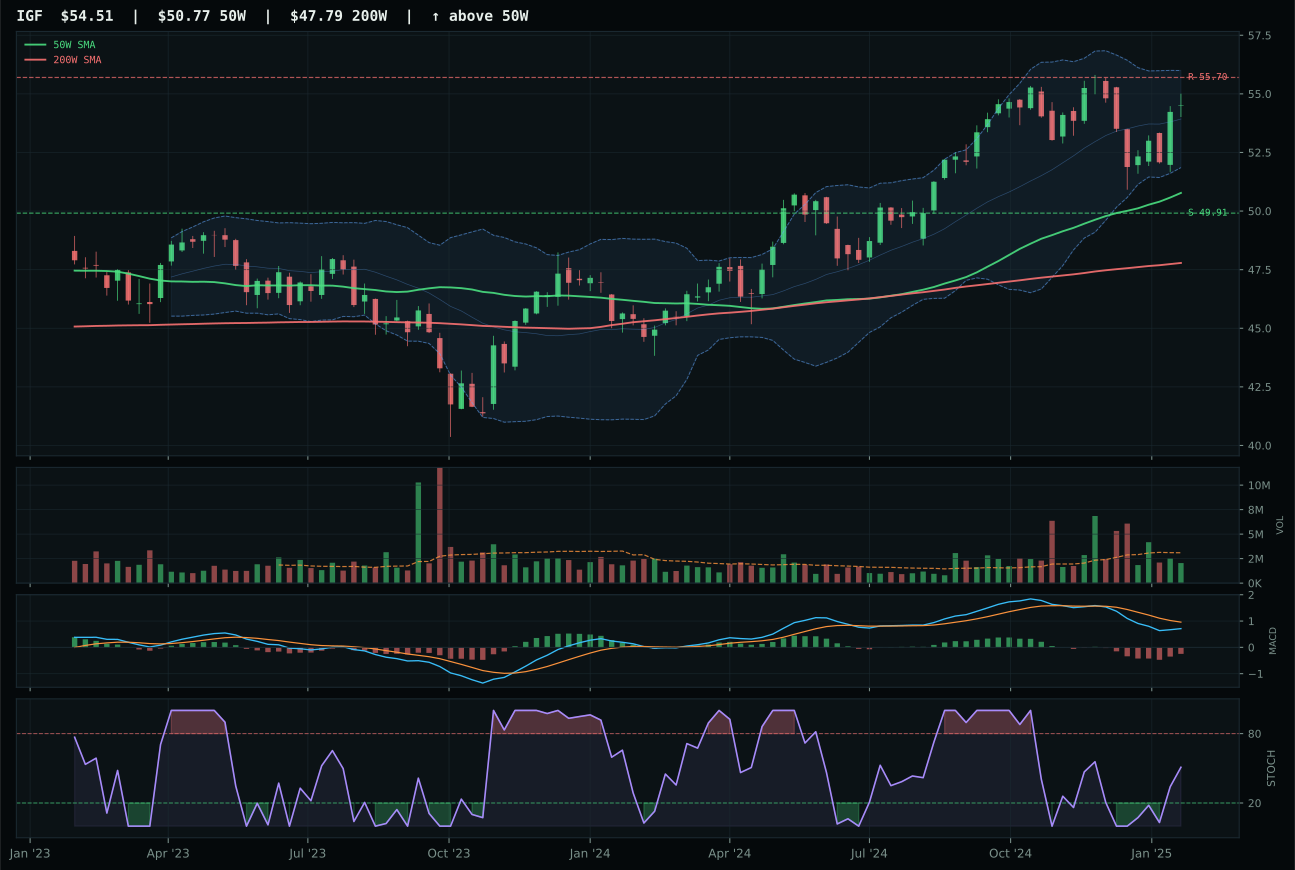
IGF has a neutral structure profile with -4.1% 13-week relative strength versus SPY.
A failed hold above support would weaken the setup.
Actionable but governed by invalidation levels.
XLU wins a close decision over PAVE on superior timing (83.0 versus 78.0) and marginally better structure (74.7 versus 68.9) despite PAVE's higher relative strength showing better SPY performance. XLU sits 8.9% above the 50-week with bearish-but-improving MACD and rising stochastic at 0.44, the setup of a deflation hedge entering early accumulation; PAVE's MACD is bearish-weakening with identical structural setup, which means XLU is maintaining momentum confirmation while PAVE is losing it. Both trade near 52-week highs in upper retracement zones, but XLU's volume-price confirmation score (55.1) edges PAVE's (56 momentum composite) on the combination of trend persistence and technical rhythm. The 0.1-point score separation reflects two similar setups where timing advantages and macro narrative (regulated utility defense versus domestic capex) give XLU the edge. This is categorically the closest decision in the allocation.
Utilities & Infrastructure earned a top-2 10% allocation slot because its 61.4 category score ranks among the two highest across all ten categories, driven by 63.7 technical evidence and a robust 60.0 macro fit that explicitly benefits from disinflation (+7), broad market bear (+4), and disinflation pressure (+6). The category is a natural home for capital fleeing growth narratives into duration-sensitive, dividend-bearing assets in a falling-rate environment. XLU's -1.1% thirteen-week return reflects the tug-of-war between rising equity multiples (negative for duration) and falling rates (positive for yields)—it is neutral rather than convex, making it a stable carry. The top-2 allocation reflects confidence that this category will outperform risk assets as disinflation persists. To maintain this position, XLU must hold the 36.81 support and avoid a break below the 50-week; violation of either would suggest early signs of mean reversion in growth and warrant a tactical reduction.
Precious Metals — GLD
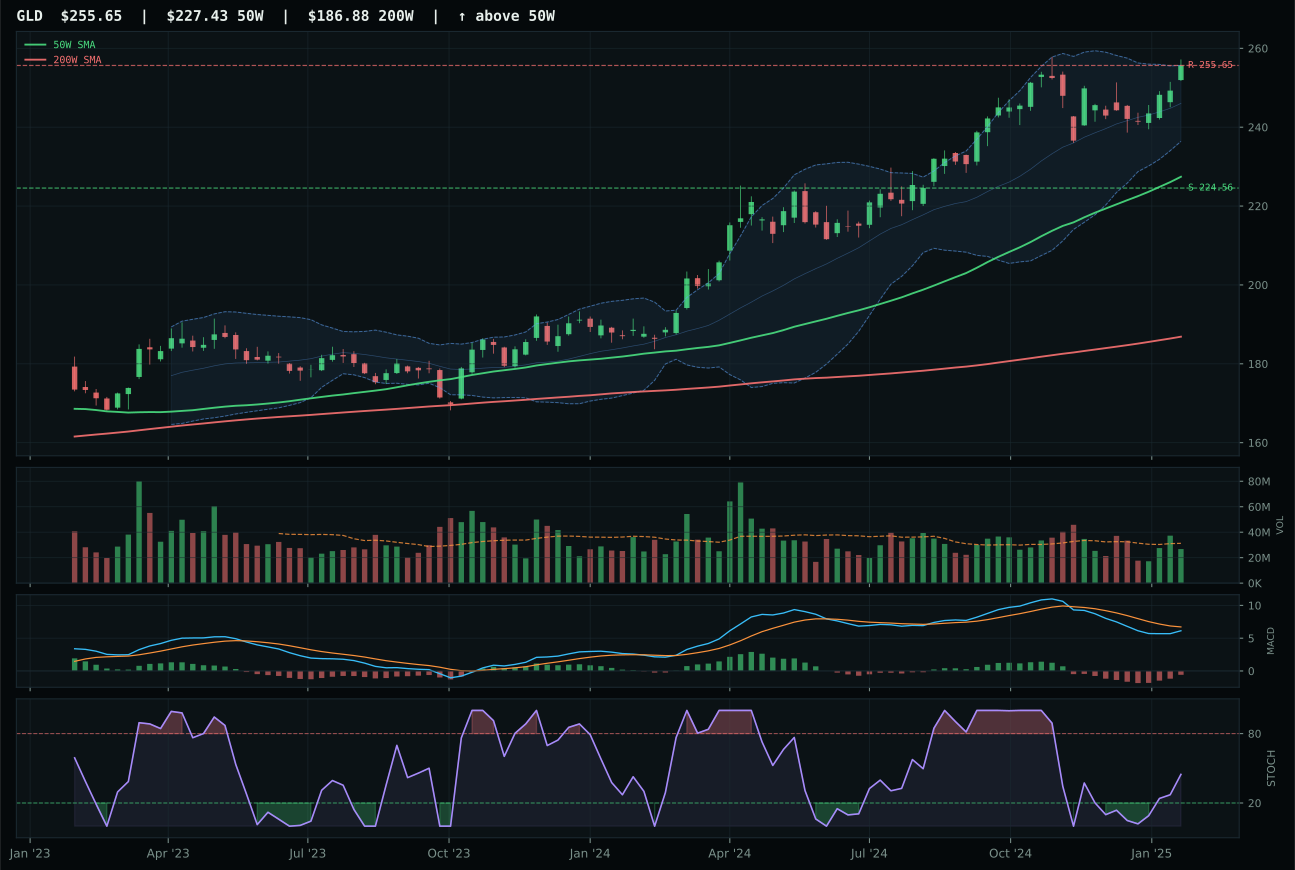
GLD has a neutral structure profile with -4.1% 13-week relative strength versus SPY.
A failed hold above support would weaken the setup.
Actionable but governed by invalidation levels.
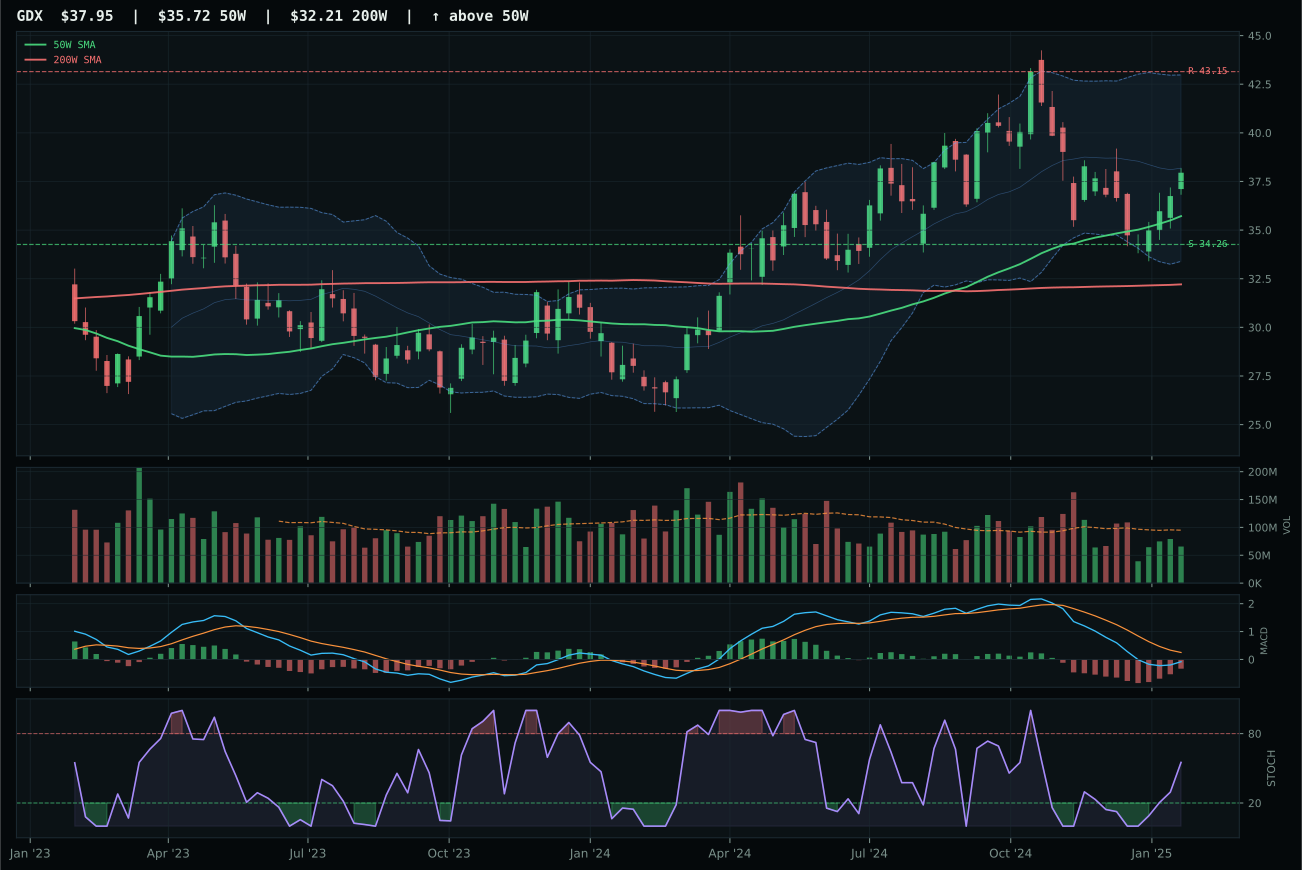
GDX has a neutral structure profile with -13.7% 13-week relative strength versus SPY.
A failed hold above support would weaken the setup.
Actionable but governed by invalidation levels.
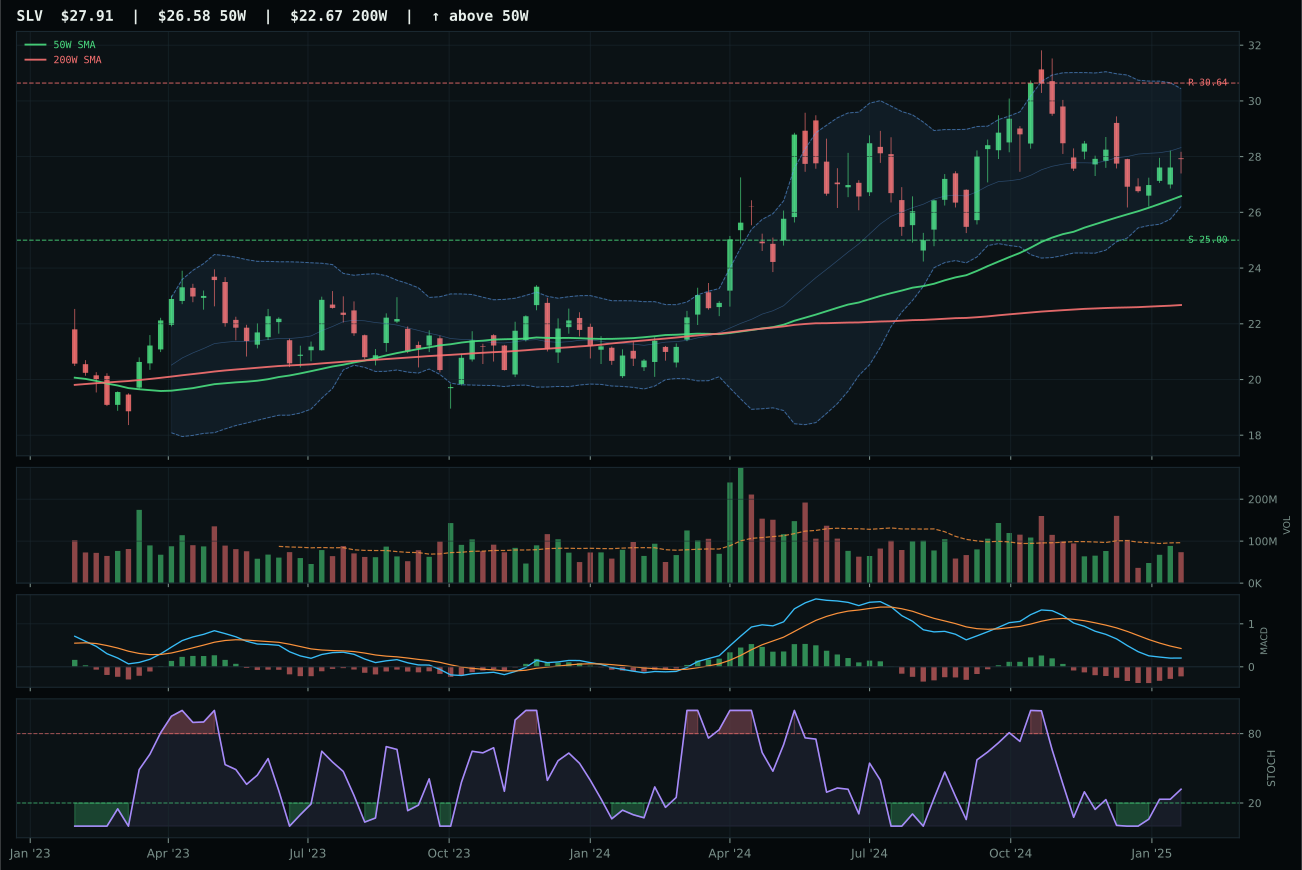
SLV has a neutral structure profile with -13.9% 13-week relative strength versus SPY.
A failed hold above support would weaken the setup.
Actionable but governed by invalidation levels.
GLD wins on cleaner structure and superior category-relative strength that proves gold is capturing disinflation flows while miners stumble. GLD's 72.9 structure score edges GDX's 65.1 on compression tightness and cleanliness, and critically, GLD scores 9.6% relative strength within the category basket while GDX is flat at 0.0%—this tells the story of alpha rotation from leveraged exposure into the core monetary hedge. Both sit near 52-week highs with neutral volume, but GLD's 0.9% 13-week return versus GDX's -8.7% confirms that gold is holding sponsorship while miners have rolled over; GLD's MACD is bearish-but-improving with rising stochastic, the textbook pattern for unconfirmed strength. Volume is neutral (0.86x) rather than accumulative, but that's acceptable in precious metals where institutional hedging moves quietly compared to equity capital.
Precious Metals earned 5% allocation based on a 54.4 category score that reflects solid macro fit (60.0) in a disinflation environment where gold benefits from both yield compression and currency anxiety. The category's 70.6 reasoned score for GLD—technical evidence at 73.5—translates into a legitimate carry position in a regime where nominal growth is decelerating and central banks are unlikely to tighten aggressively. GLD's rising Fibonacci zone, neutral volume, and improving MACD create a setup that is ready to participate if risk-off sentiment accelerates or real yields continue falling. The 5% position reflects confidence in gold's role as a portfolio hedge without committing enough capital to create concentration risk. To move to top-2, the category would need to break above 240 with volume confirmation or see explicit credit stress trigger a flight-to-quality rush.
AI — BOTZ
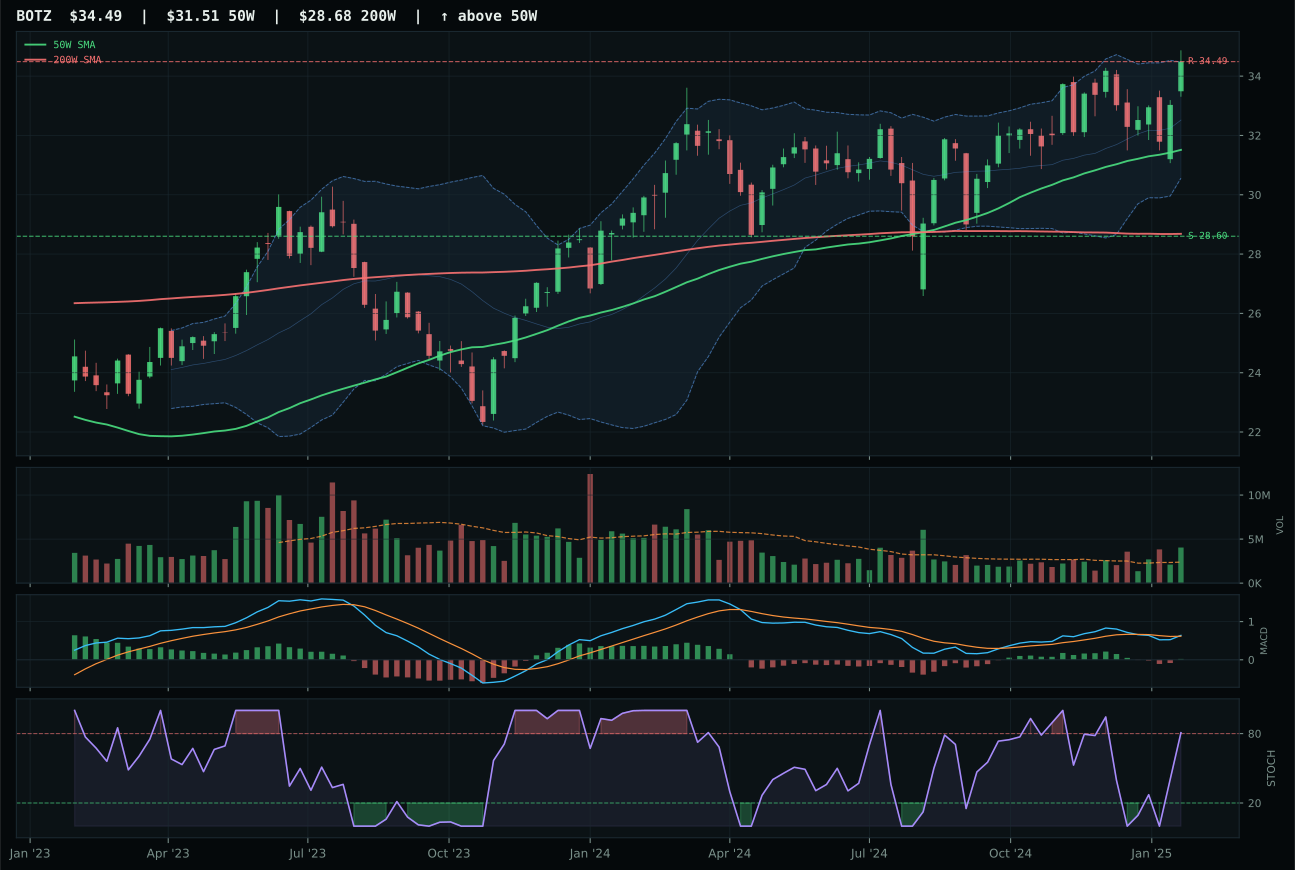
BOTZ has a neutral structure profile with 4.0% 13-week relative strength versus SPY.
A failed hold above support would weaken the setup.
Actionable but governed by invalidation levels.
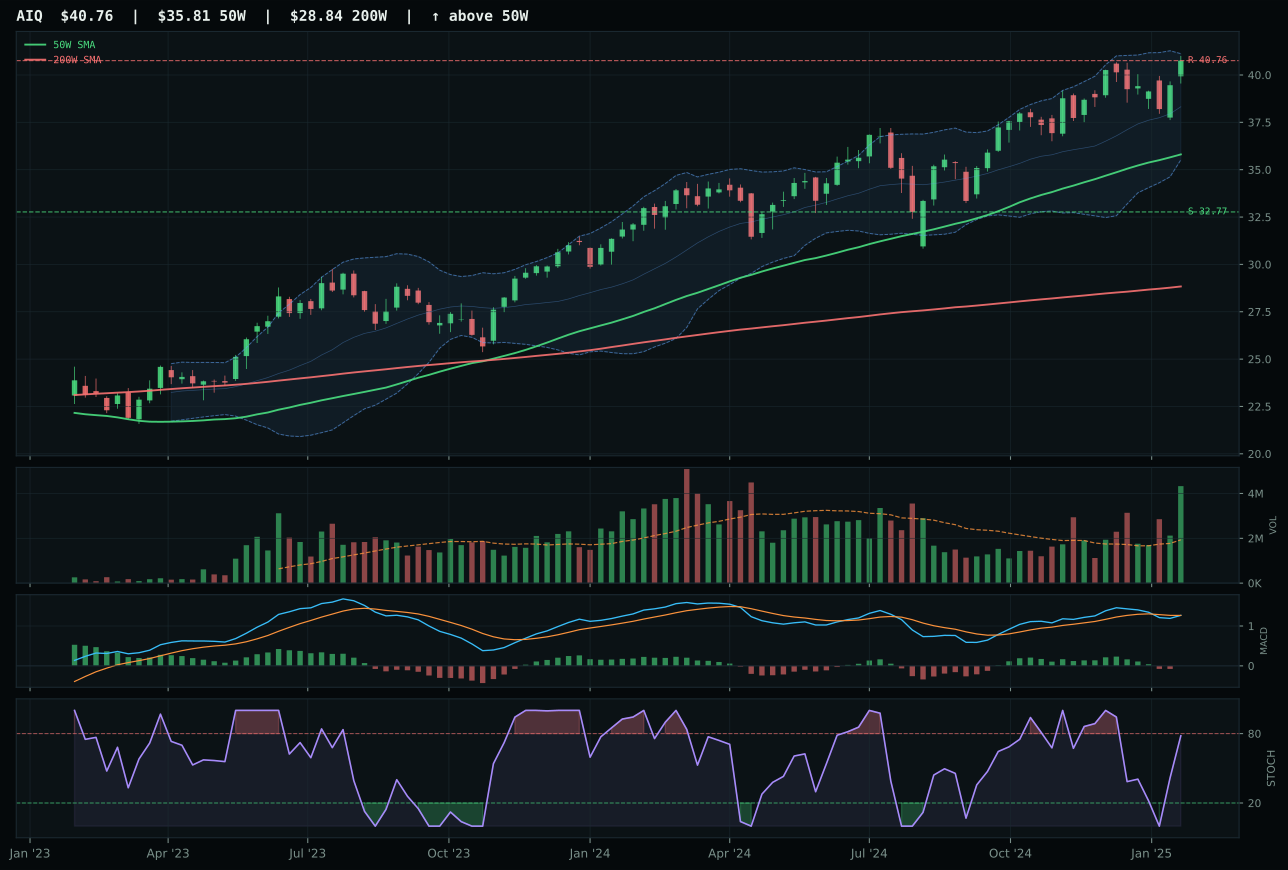
AIQ has a neutral structure profile with 4.1% 13-week relative strength versus SPY.
A failed hold above support would weaken the setup.
Actionable but governed by invalidation levels.
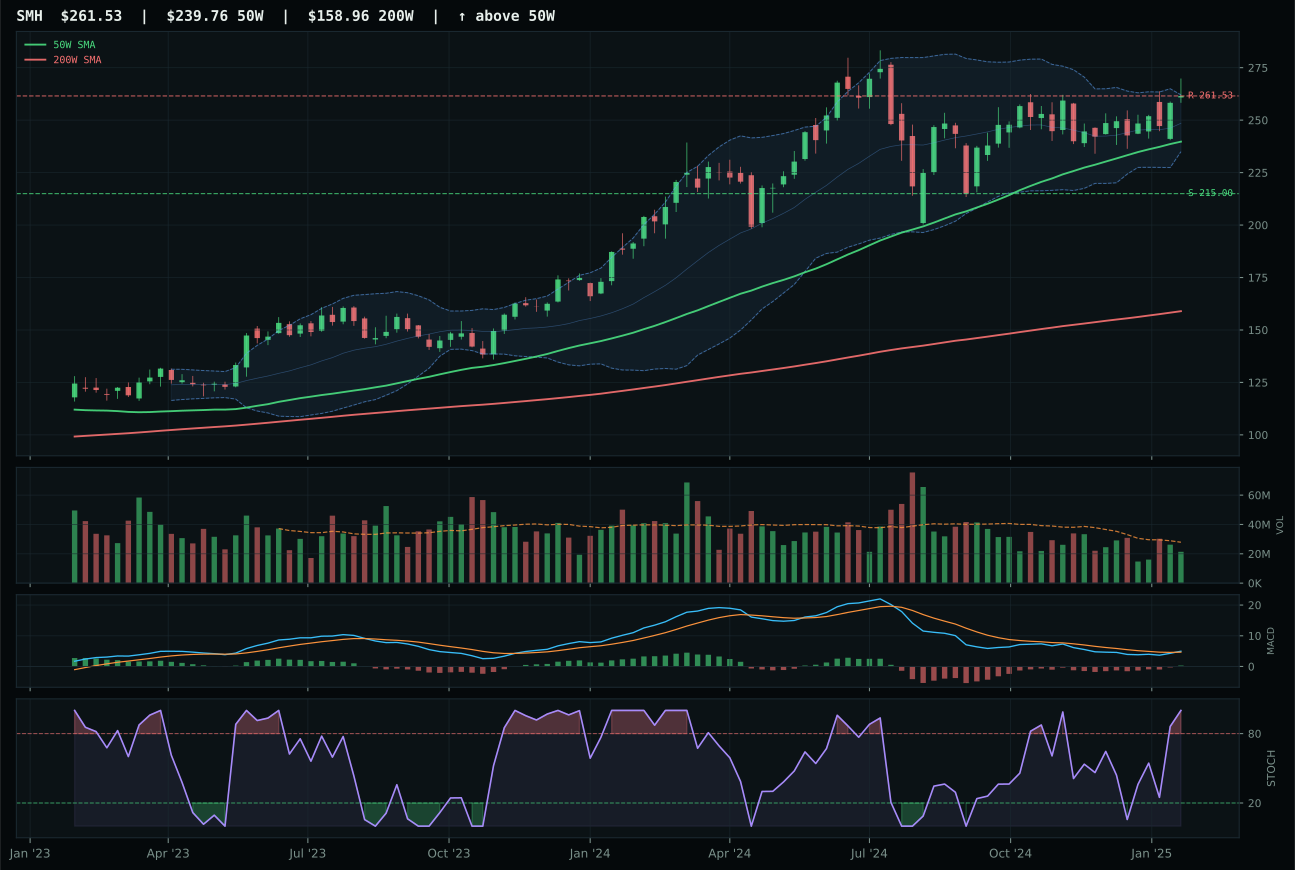
SMH has a neutral structure profile with -1.6% 13-week relative strength versus SPY.
A failed hold above support would weaken the setup.
Actionable but governed by invalidation levels.
BOTZ wins on decisive momentum and volume confirmation that AIQ cannot match. Its 96.9 technical evidence score reflects a 100.0 trend (price above both key moving averages with SPY outperformance at 4.0%), and critically, a 95.9 momentum confirmation score that stamps volume accumulation at 1.69x into the price action—this means institutional accumulation is underwriting the move, not speculation. AIQ's MACD is already bearish and weakening while BOTZ's is bullish and improving, a clear divergence that suggests BOTZ is retaining buyer interest while AIQ is losing it. Even though both trade in neutral structure and both show 9% 13-week returns, BOTZ's volume profile and momentum persistence (81.0) tower over AIQ's, making this a clear category win on the quality of sponsorship rather than magnitude of return.
AI landed 5% allocation—outside top-2—despite BOTZ's superior technicals because the category's 50.6 score reflects a hostile macro backdrop: liquidity stress and credit concerns drag down the 23.0 macro fit, and broad market bear dynamics subtract 8 points from category reasoning. Even though BOTZ's technical evidence scores 96.9 out of 100, macro conditions are simply unfavorable for cyclical growth narratives. The category needs either credit stress to ease or market-wide capitulation to complete before it moves from a tactical 5% hold to a top-2 leadership position. Current setup is strong enough to maintain exposure, but not strong enough to increase it when broader systemic headwinds persist.
Traditional Energy — XLE
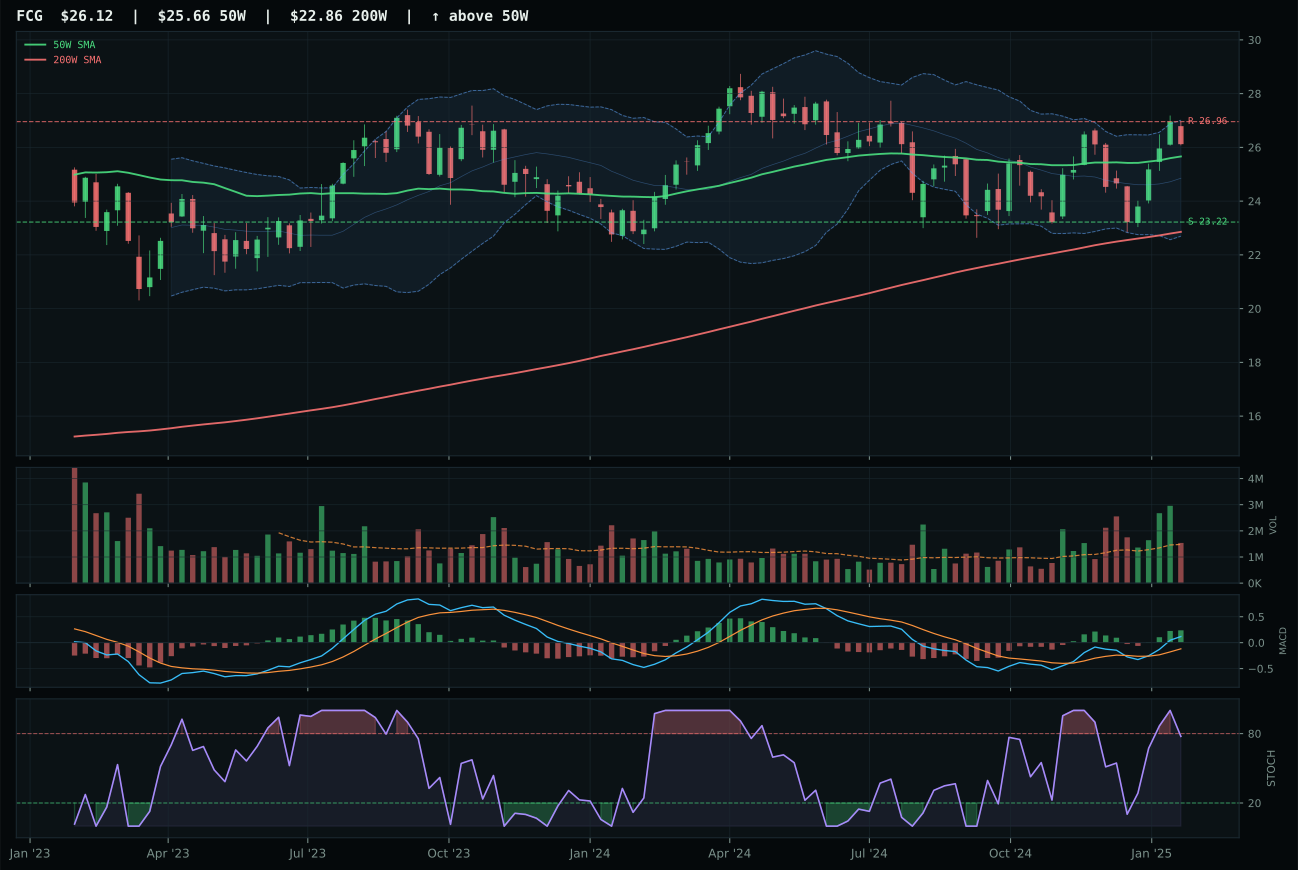
FCG has a compression near 50W profile with 3.0% 13-week relative strength versus SPY.
A failed hold above support would weaken the setup.
Actionable but governed by invalidation levels.
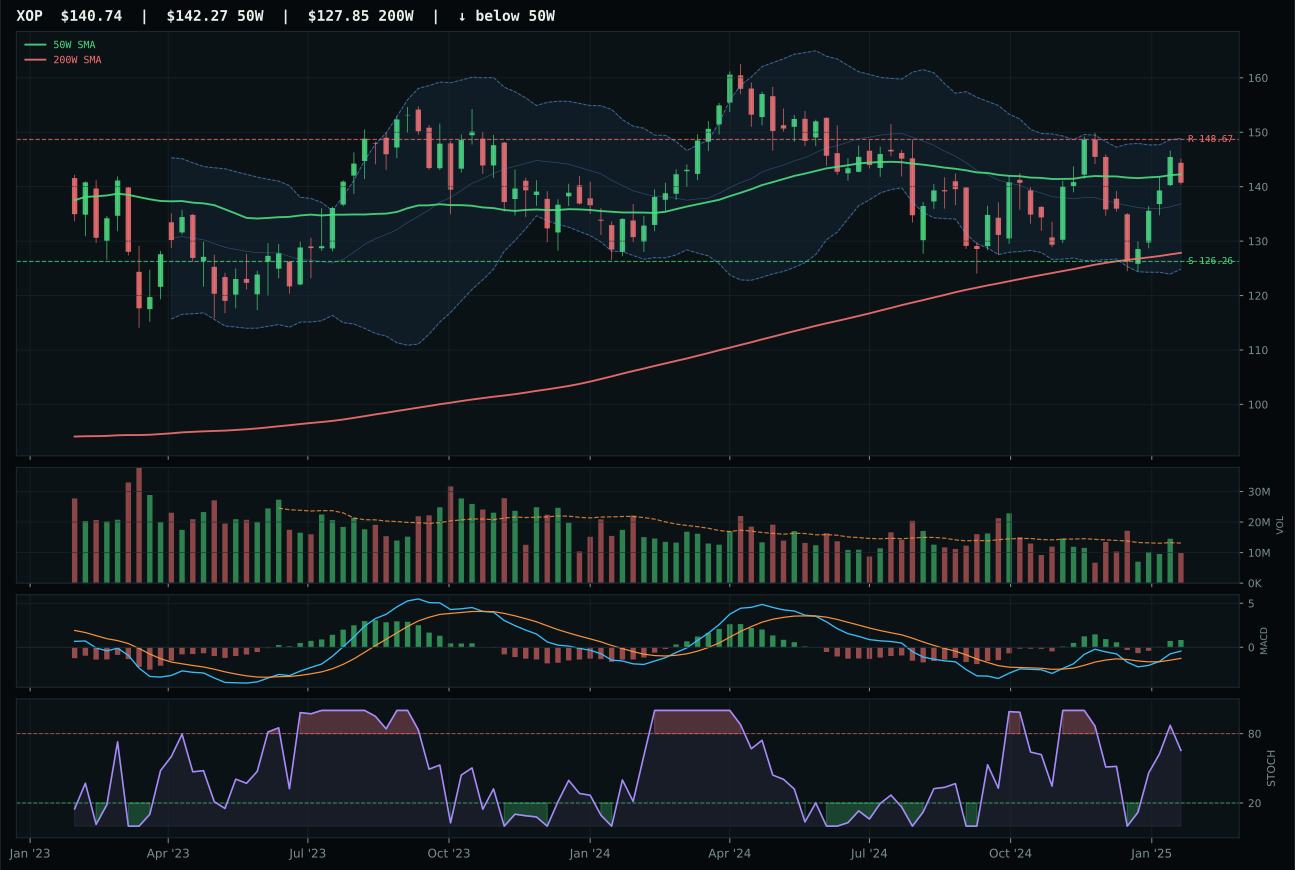
XOP has a compression near 50W profile with -0.2% 13-week relative strength versus SPY.
A failed hold above support would weaken the setup.
Actionable but governed by invalidation levels.
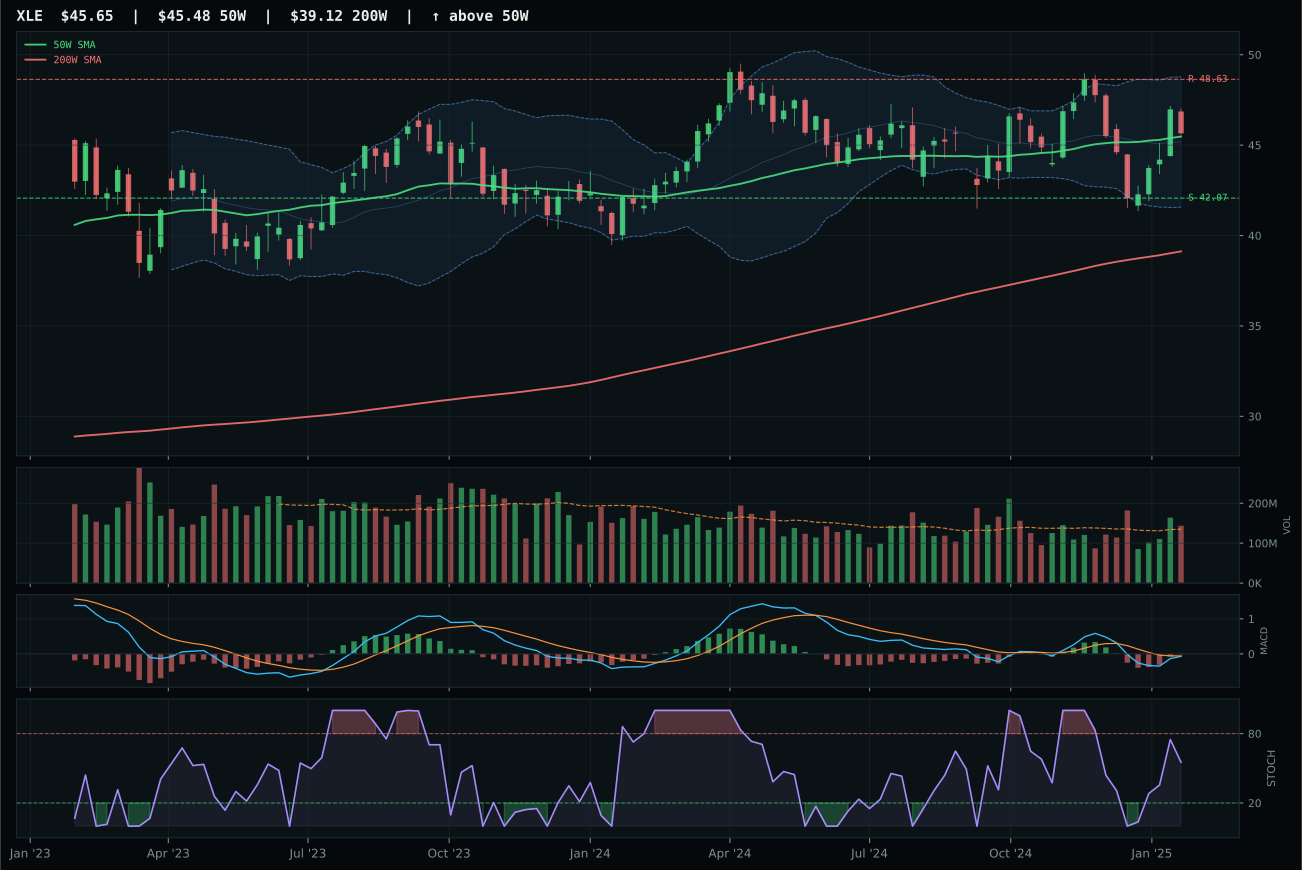
XLE has a compression near 50W profile with -3.3% 13-week relative strength versus SPY.
A failed hold above support would weaken the setup.
Actionable but governed by invalidation levels.
XLE wins a disappointing category by holding better timing (100.0) and compression setup than FCG despite FCG's technical superiority on trend and momentum. XLE sits exactly at its 50-week average (0.5% distance), compressing near a key decision level that creates defined directional optionality; FCG appears stronger with 95.6 technical evidence, bullish-and-improving MACD, and higher 13-week return (8.0%), but FCG's weaker risk-reward (57.5 versus XLE's 65.9) and momentum extension remove it as the category representative. XLE's setup is compression near the 50-week with bearish-but-improving MACD and neutral volume—this is coiled rather than committed, offering entry optionality rather than momentum chase. The 10.2-point score gap in favor of FCG on technical evidence is reversed by XLE's superior timing and setup quality, reflecting a portfolio that values defined risk management over pure momentum in commodities.
Traditional Energy received 5% allocation based on a 48.7 category score that reflects a disinflation regime actively penalizing commodity exposure (-10 to category macro fit). Real asset sponsorship (+7) and commodity breadth positive provide modest offset, but the fundamental headwind remains: energy and disinflation are typically incompatible narratives. XLE's selection is tactical rather than strategic—the compressed setup near the 50-week is defensible, and 1.7% thirteen-week performance, while unspectacular, avoids the outright damage seen in other categories. The 5% position serves as a real-asset rebalancer and disinflation hedge; it is not sized for conviction. Movement to top-2 would require either a dollar reversal, inflation reimagination, or a confirmed break above the 48.63 resistance on accumulating volume—none of which is evident this week.
Nuclear Energy — NLR
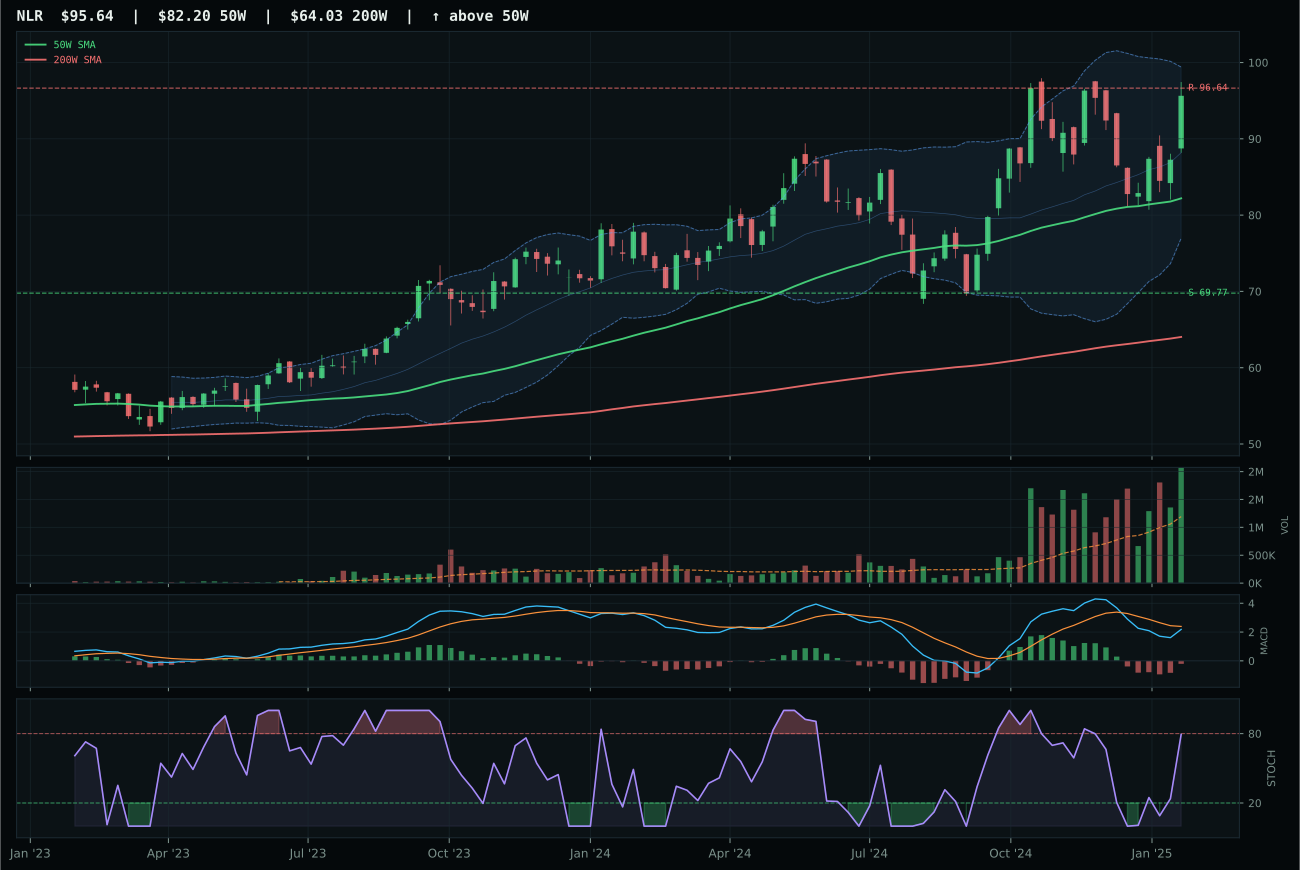
NLR has a vertical extension profile with -1.5% 13-week relative strength versus SPY.
A failed hold above support would weaken the setup.
Actionable but governed by invalidation levels.
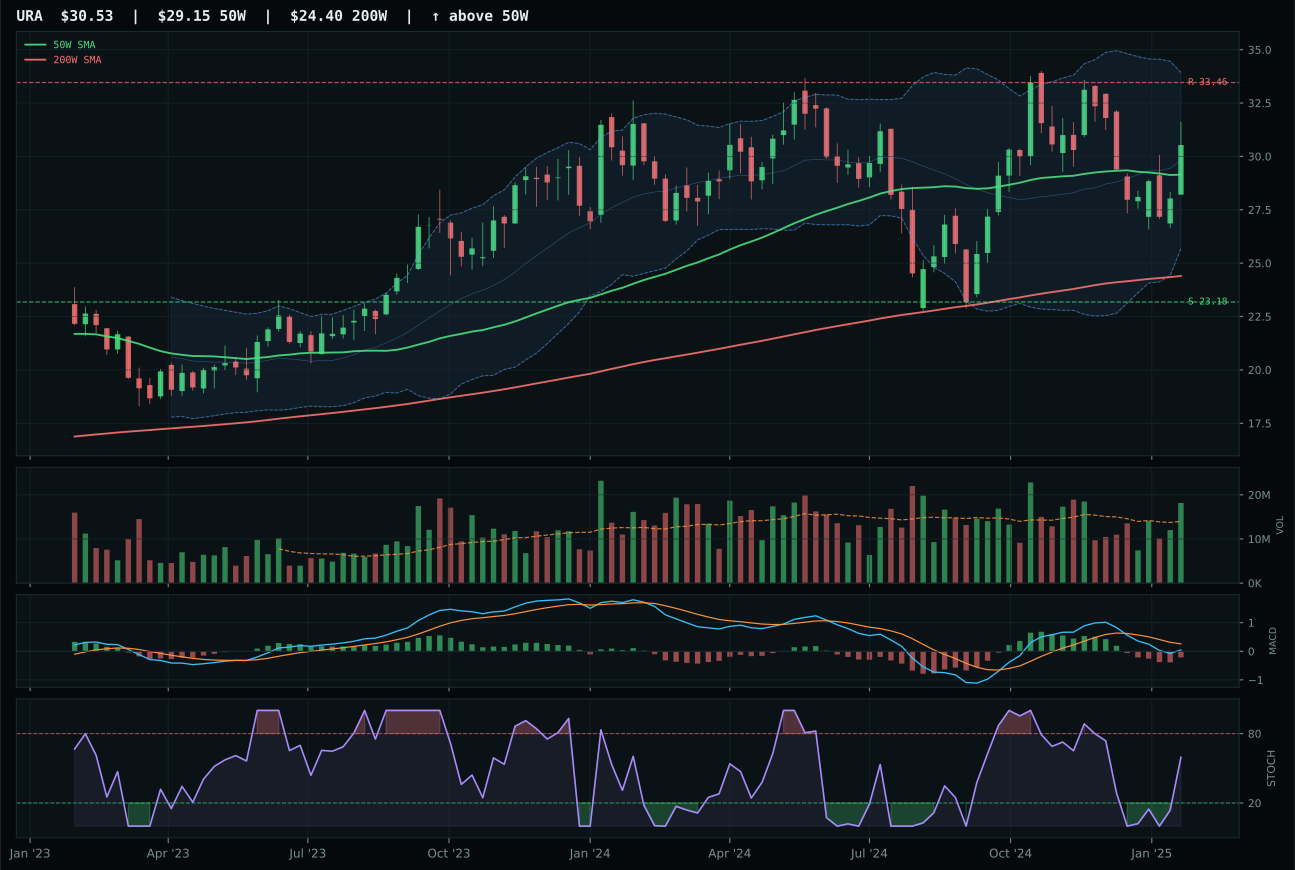
URA has a neutral structure profile with -8.3% 13-week relative strength versus SPY.
A failed hold above support would weaken the setup.
Actionable but governed by invalidation levels.
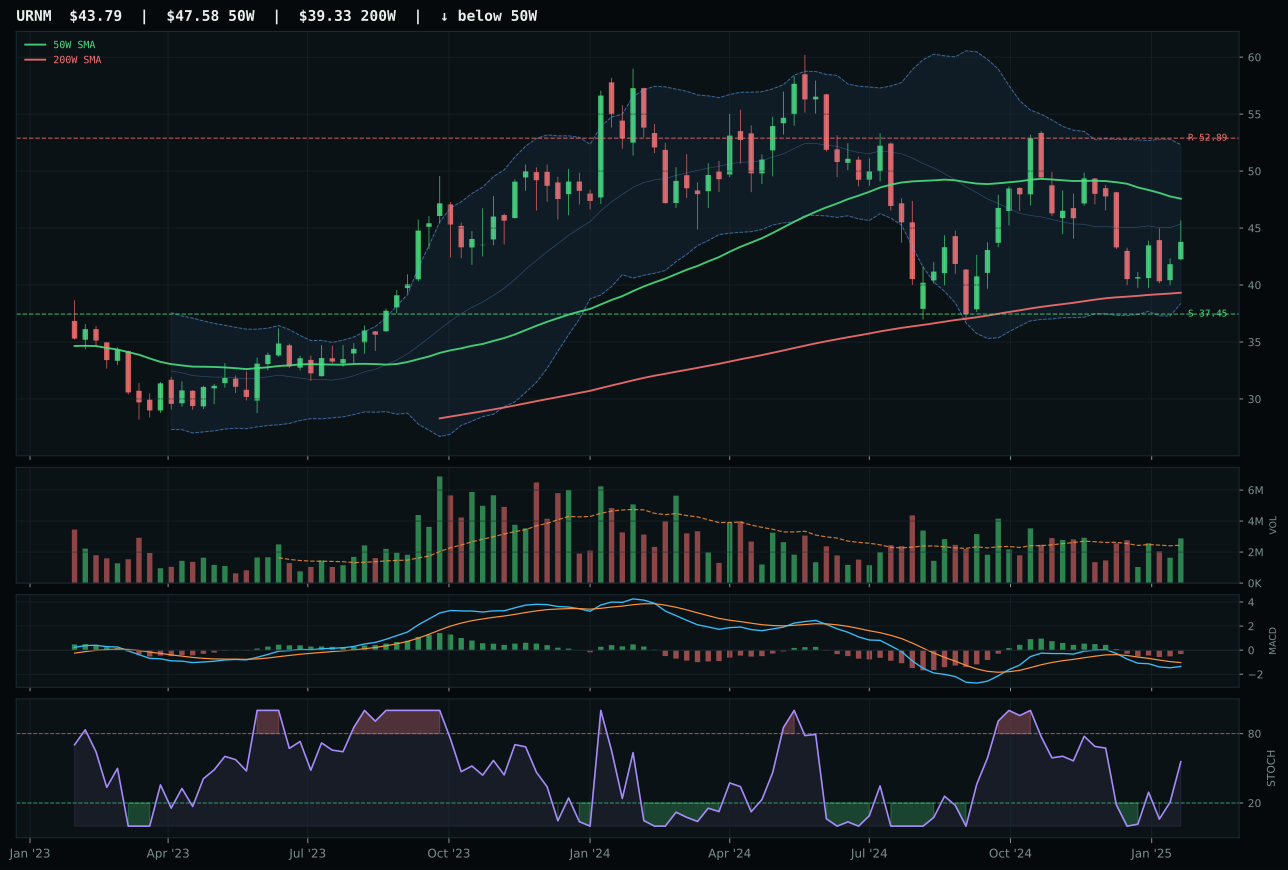
URNM has a neutral structure profile with -16.4% 13-week relative strength versus SPY.
A failed hold above support would weaken the setup.
Actionable but governed by invalidation levels.
NLR wins on dominant momentum confirmation (98.6) and volume accumulation (2.45x 20-week average) that stamps institutional demand into the chart despite being extended 16.4% above the 50-week average. URA's technical evidence is weak at 49.5 and its MACD is bearish-weakening (versus NLR's bearish-but-improving), making NLR's 78.9 technical score an overwhelming advantage. NLR's 4W return is 15.4%, generating momentum confirmation at 98.6 despite category-relative strength of only 6.8%—this tells the story of a broad-based squeeze where volume is real rather than speculative. The vertical extension setup is normally penalized for entry risk (timing scores only 53.0), but 2.45x volume and rising stochastic at 0.79 demonstrate sustained accumulation, not late-stage blowoff. NLR's 75.2 structure score on vertical extension beats URA's neutral structure setup, reflecting higher-quality price action.
Nuclear Energy earned 5% allocation on a 44.8 category score that reflects a technical setup (91.9 evidence) that outweighs modest macro support (53.0 fit). Real asset sponsorship is active (+7), and broad market bear conditions (+3) create marginal tailwinds, but the category is outside top-2 because relative strength versus SPY (-1.5%) and the absolute momentum void (compared to BOTZ or RNLR) suggest this is a secondary rotation. NLR's extended valuation (16.4% above 50-week) and rising stochastic momentum indicate the move is mature; additional upside would require price consolidation and base-building. The 5% position captures the technical quality without overcommitting to a narrative that macro breadth does not yet support. Upgrade to top-2 would require either confirmed breakthrough above 96.64 resistance with persistent volume or a risk-off event that re-emphasizes nuclear as a non-carbon baseload alternative.
Technology — CIBR
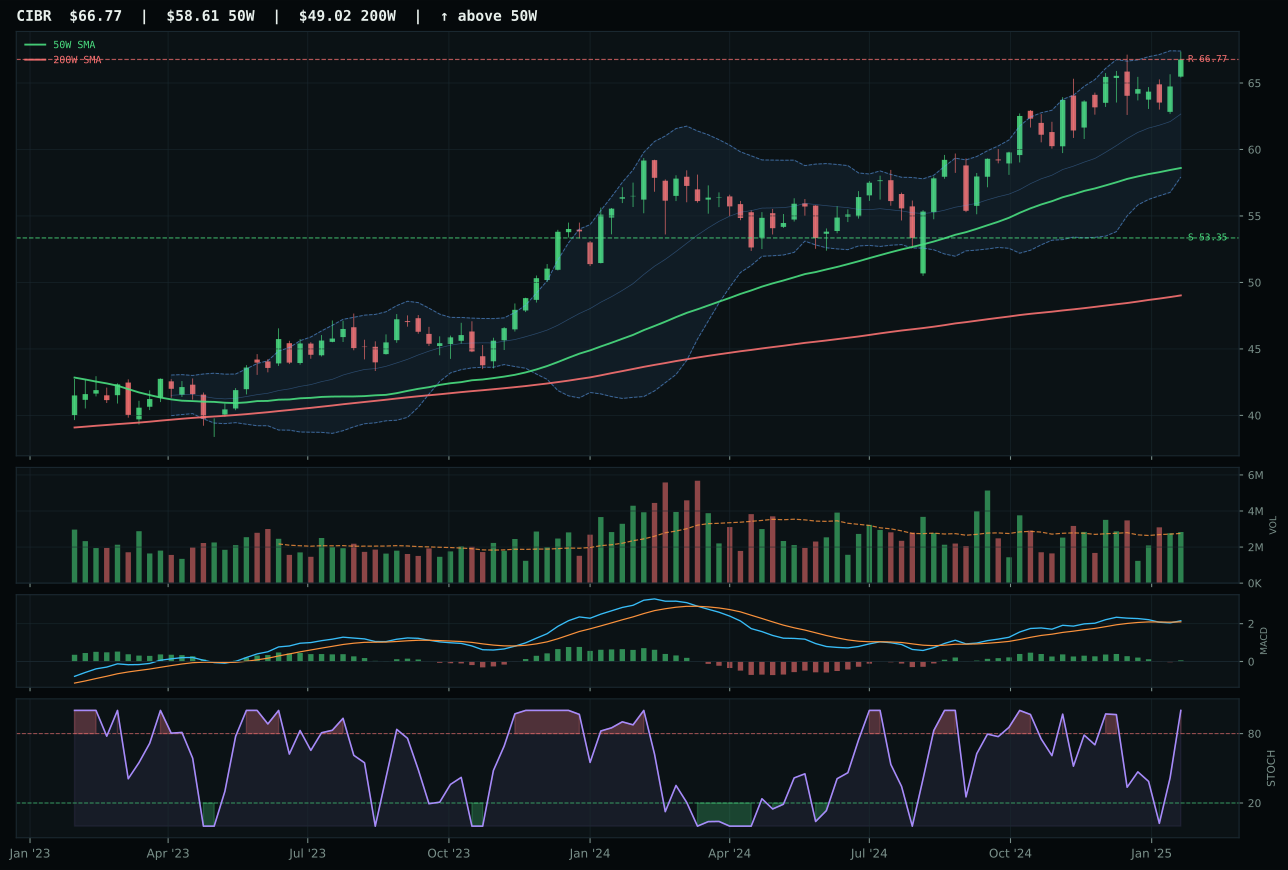
CIBR has a neutral structure profile with 4.3% 13-week relative strength versus SPY.
A failed hold above support would weaken the setup.
Actionable but governed by invalidation levels.
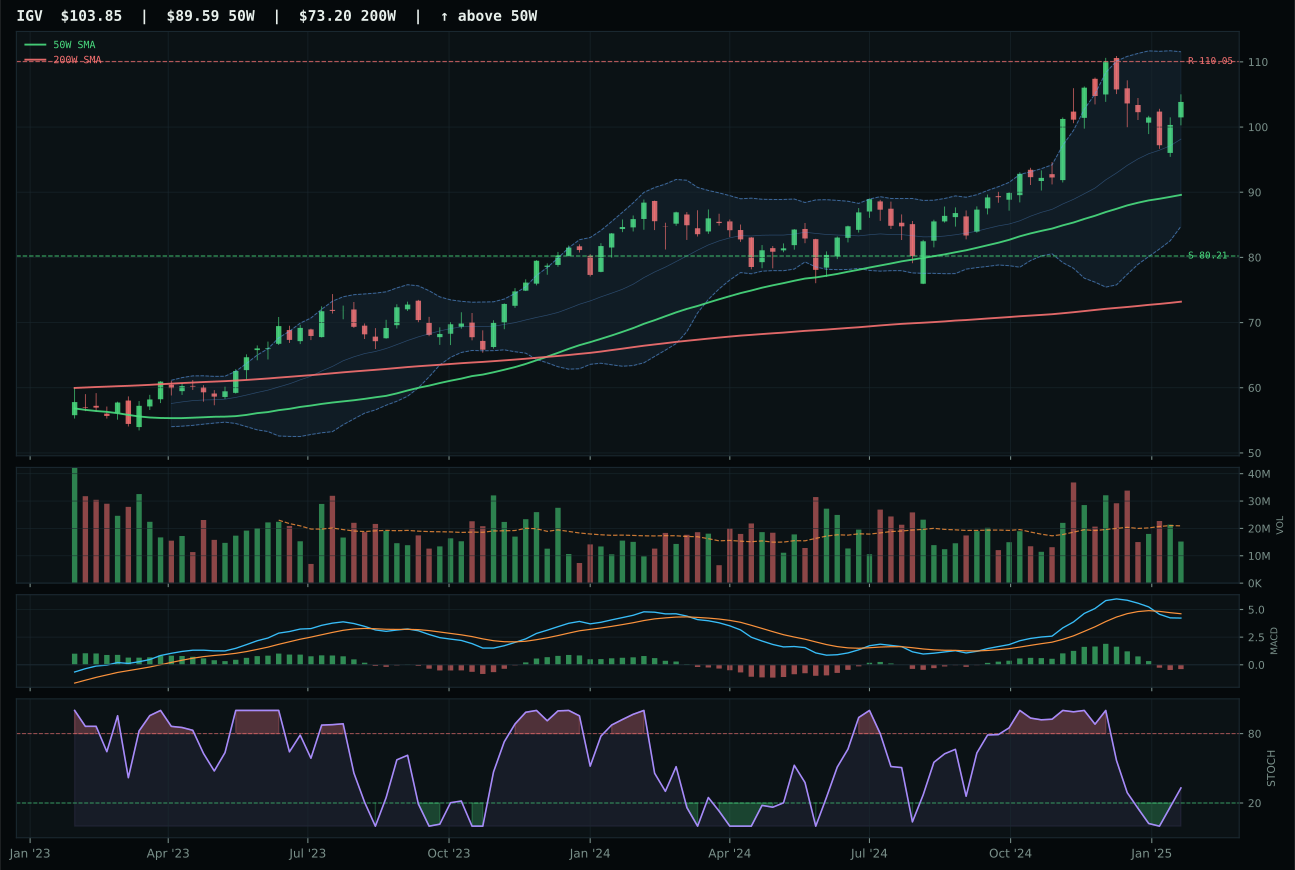
IGV has a vertical extension profile with 7.6% 13-week relative strength versus SPY.
A failed hold above support would weaken the setup.
Actionable but governed by invalidation levels.
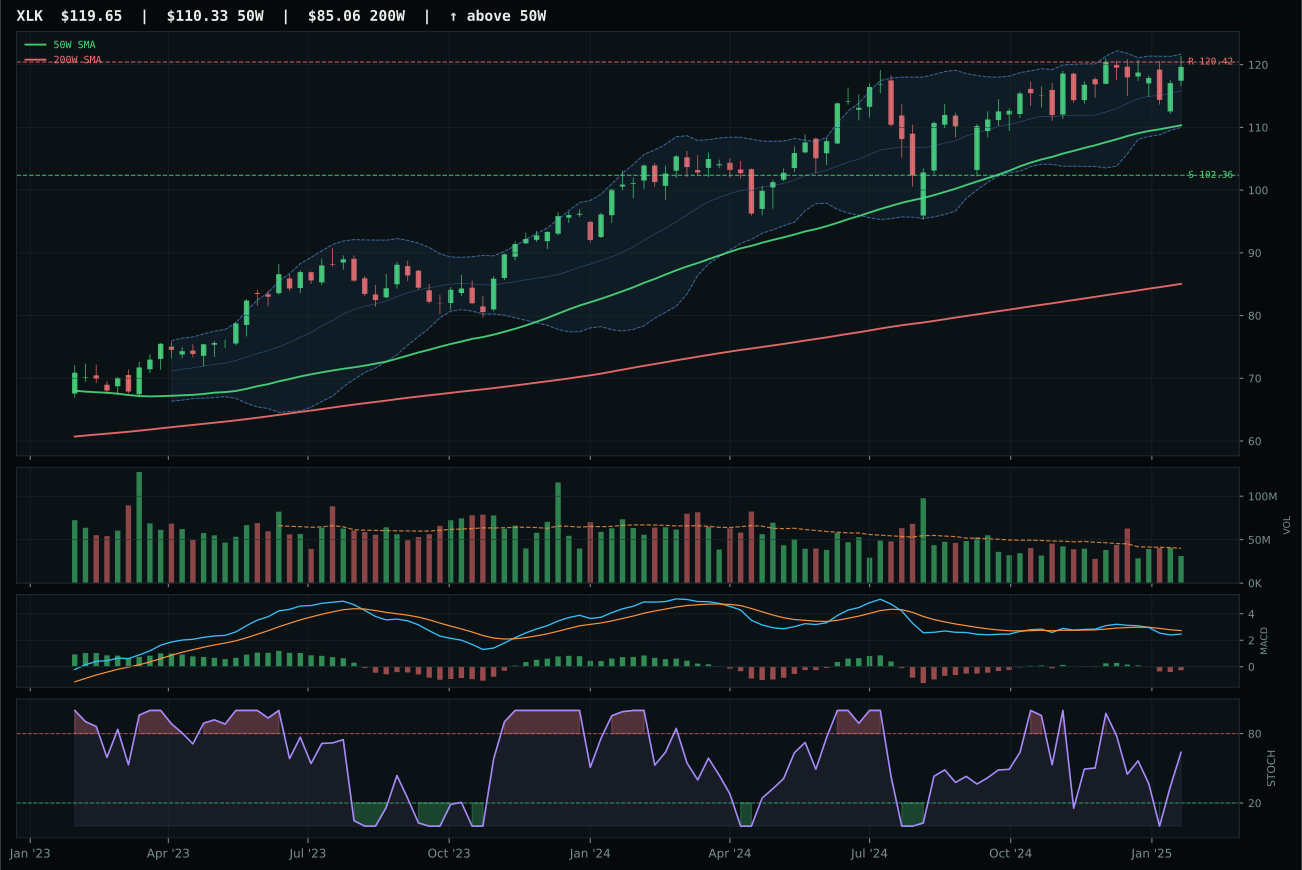
XLK has a neutral structure profile with -1.1% 13-week relative strength versus SPY.
A failed hold above support would weaken the setup.
Actionable but governed by invalidation levels.
CIBR wins the category on superior technical sponsorship and cleaner structure than IGV, despite both trading near 52-week highs. CIBR's 74.1 structure score reflects tighter compression and better cleanliness, while its bullish-but-flattening MACD holds confirmation that IGV has already lost—IGV's MACD is bearish and weakening, signaling deteriorating participation despite a higher 13-week return of 12.6%. The gap is decisive: volume confirmation scores 71.0 for CIBR against 48 for IGV, meaning accumulation is real versus thin participation masquerading as strength. CIBR's 4.3% relative strength versus SPY, paired with neutral structure and neutral volume, represents a steady technical hold rather than a late-stage extension, making it the only defensible entry in a category fighting headwinds from liquidity stress and credit concerns.
Technology earned a 5% sleeve—ranked outside the top-2 categories—because its 36.7 final score reflects technical strength hamstrung by a disinflation regime that penalizes duration-sensitive growth narratives. Liquidity stress and credit concerns subtract 10 points from category macro fit, while the modest 4.3% SPY relative strength shows technology is not leading this week's market. The category would need either confirmation of momentum into fresh all-time highs with stronger volume, or a regime shift toward inflation/credit normalization to climb into the top-2 allocation tier. For now, it serves as a tactical holding—reasonable setups with solid structure, but no macro tailwind to justify increased conviction.
Emerging Markets — INDA
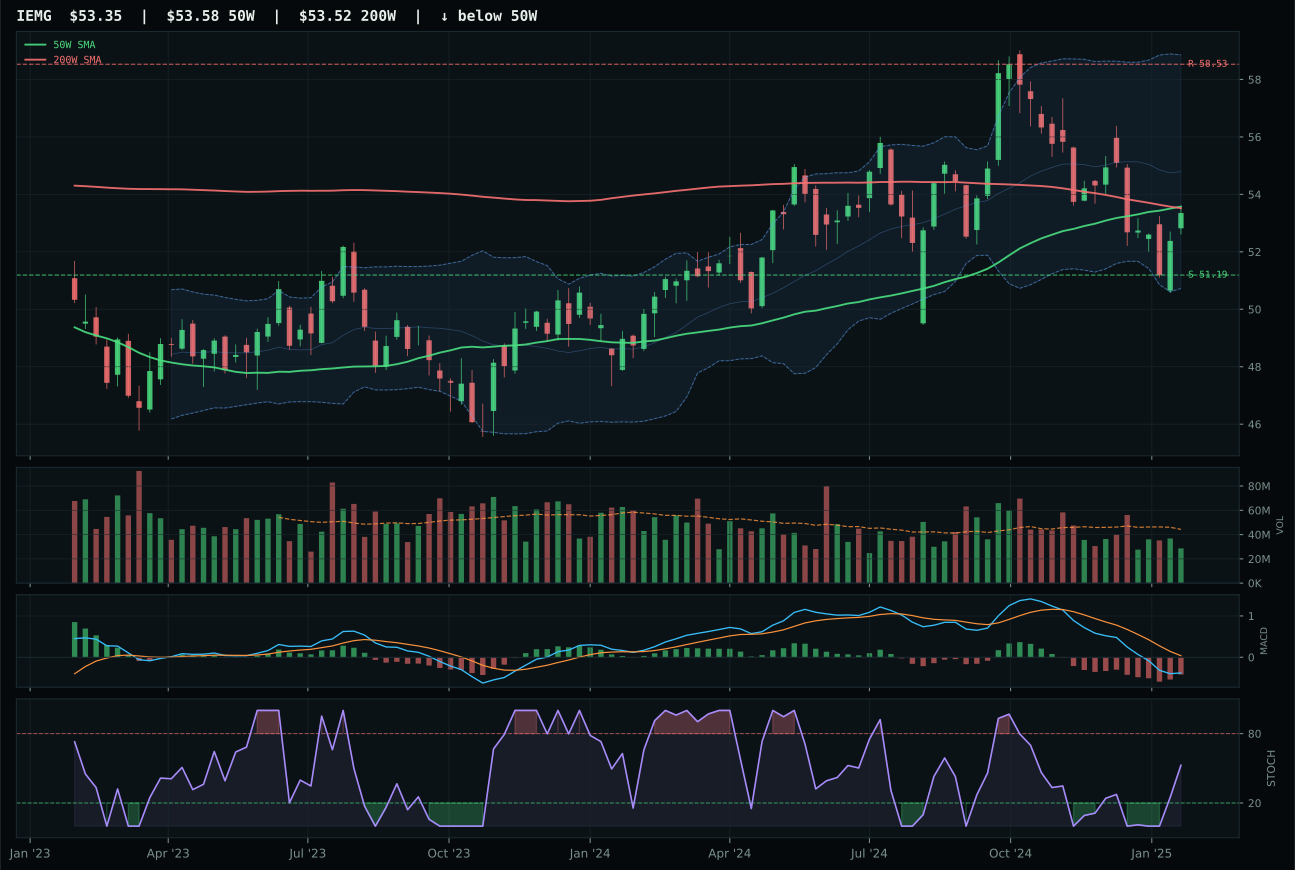
IEMG has a pullback into support profile with -10.3% 13-week relative strength versus SPY.
A failed hold above support would weaken the setup.
Actionable but governed by invalidation levels.
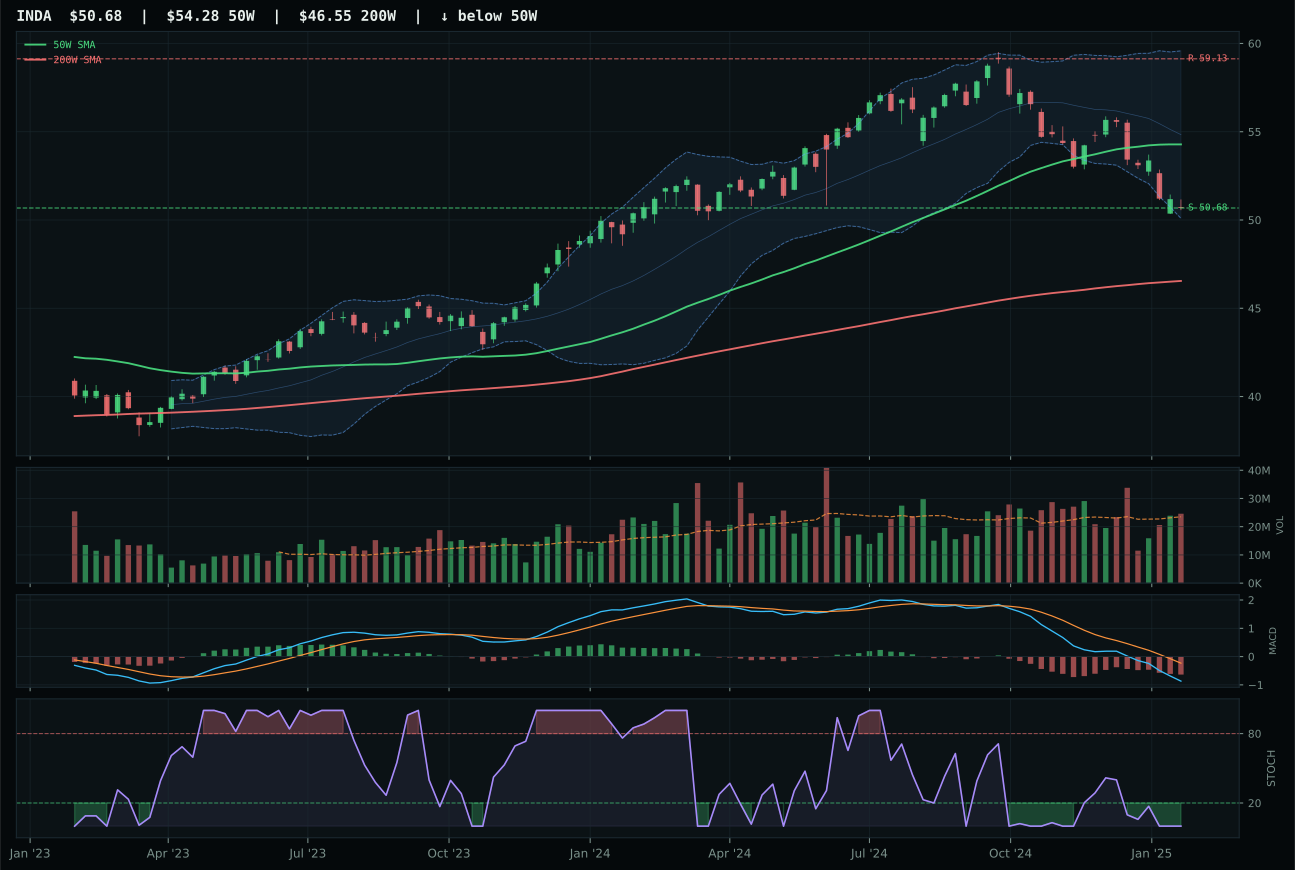
INDA has a pullback into support profile with -12.4% 13-week relative strength versus SPY.
A failed hold above support would weaken the setup.
Actionable but governed by invalidation levels.
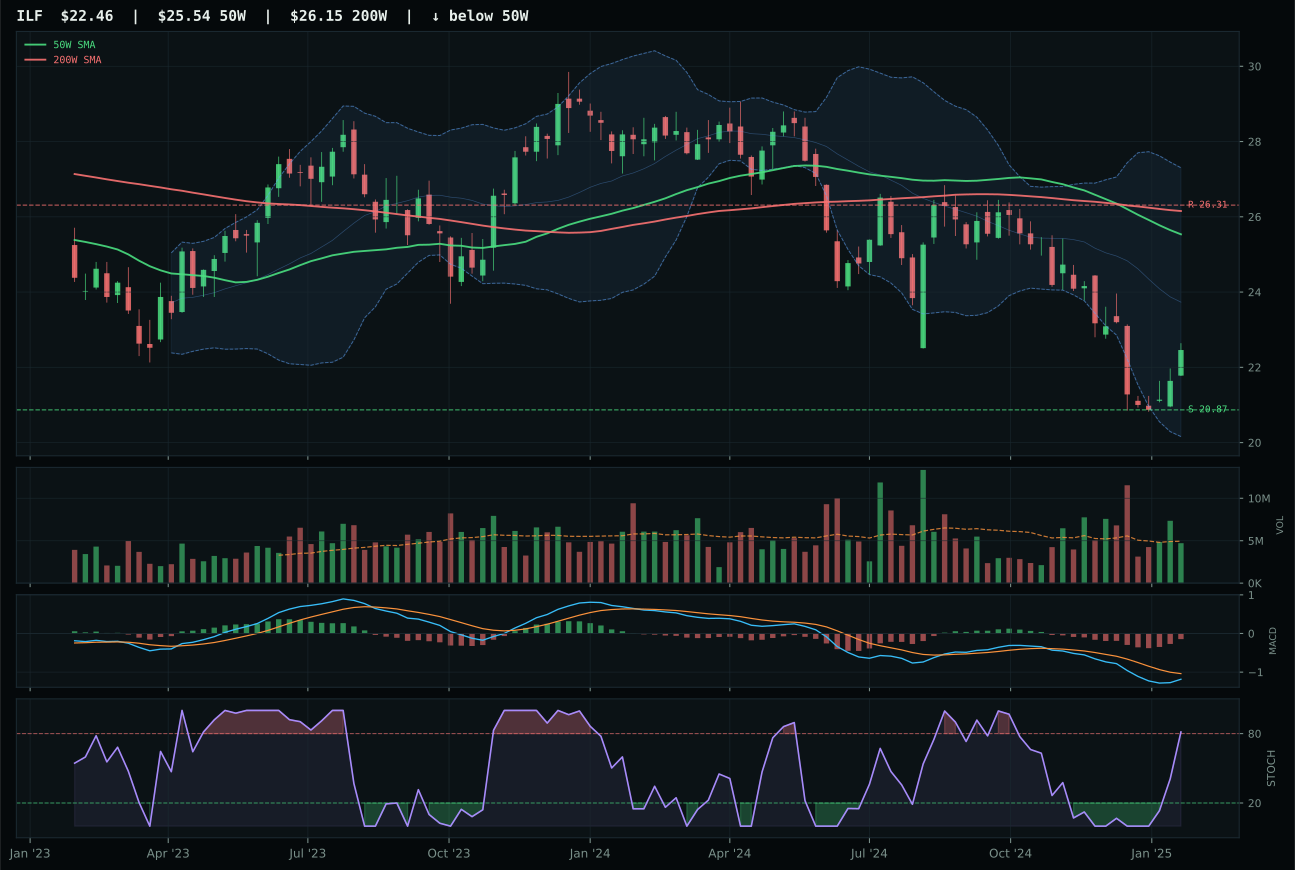
ILF has a neutral structure profile with -15.8% 13-week relative strength versus SPY.
Extension and support failure are the main tactical risks.
Tracked, but not top-2 eligible because: structurally broken.
INDA wins a deeply troubled category on volume-neutral positioning and mean-reversion timing setup that prevent further deterioration. INDA's technical evidence is only 26.2, reflective of a -12.4% relative strength versus SPY and -7.4% 13-week return, but its 80.0 timing score and 77.2 risk-reward (upside capped at -14.3% to resistance versus downside support at 0.0%) reflect a base-building pattern rather than momentum failure. IEMG scores 43.8 technical evidence with better MACD (bearish-but-improving versus INDA's bearish-weakening) and rising stochastic, but IEMG's thin volume participation undermines conviction and its -0.4% distance to the 50-week suggests late-stage mean reversion is being rejected. INDA's oversold stochastic (0.00) and pullback-into-support setup provide the only defensible entry pattern, even though both names are functionally unfit for portfolio allocation.
Emerging Markets received 5% allocation despite a catastrophic 0.0 final category score that ranks it last or second-to-last among all ten categories. Dollar pressure (-14 macro contribution), credit stress (-10), and liquidity stress (-10) create an actively hostile environment for EM assets, and INDA's -12.4% relative weakness versus SPY confirms this with technical precision. The category is ineligible and outside the system's core logic, held only because portfolio rules require a 5% placeholder and INDA's oversold stochastic offers a potential mean reversion tail hedge. This is a forced position, not a conviction allocation. To move from 5% placeholder to any meaningful position, the category would need a sharp dollar reversal, credit stress alleviation, or confirmation that the oversold stochastic can drive a multi-week recovery with volume confirmation. Current regime conditions suggest deferral; EM rotation typically begins only after risk-off peaks and flight-to-quality exhausts itself.
Industrial Metals — COPX
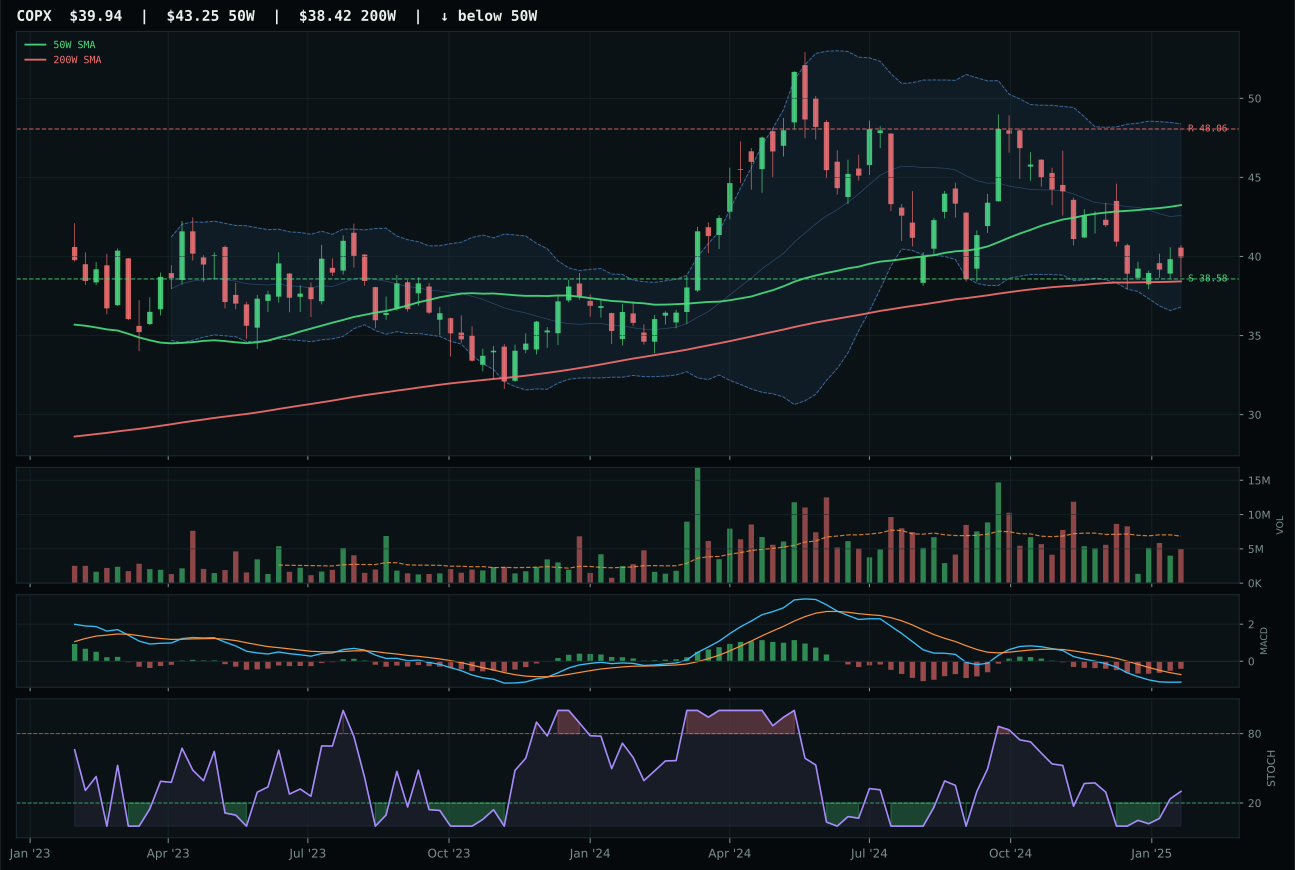
COPX has a pullback into support profile with -16.2% 13-week relative strength versus SPY.
A failed hold above support would weaken the setup.
Actionable but governed by invalidation levels.
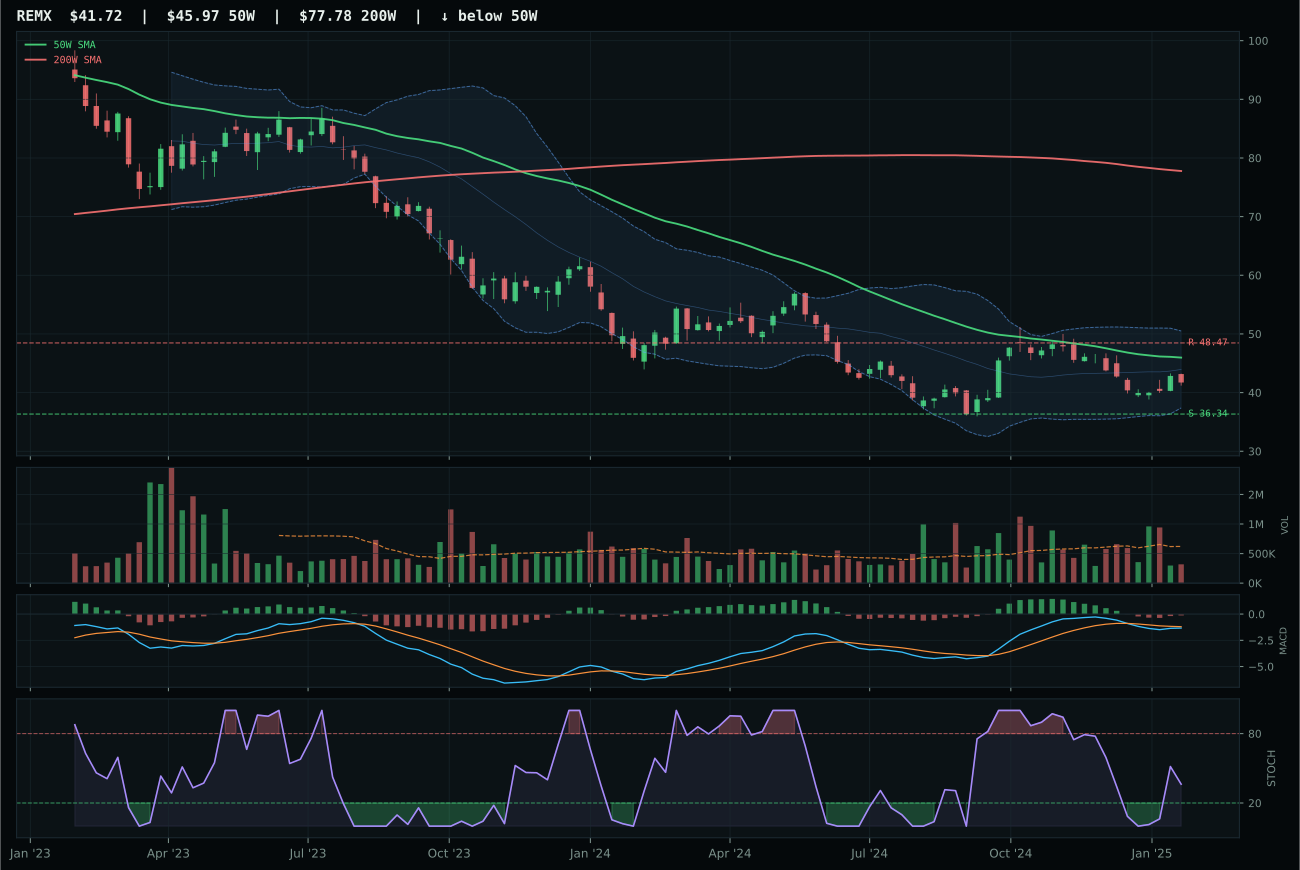
REMX has a neutral structure profile with -16.6% 13-week relative strength versus SPY.
Extension and support failure are the main tactical risks.
Tracked, but not top-2 eligible because: structurally broken.
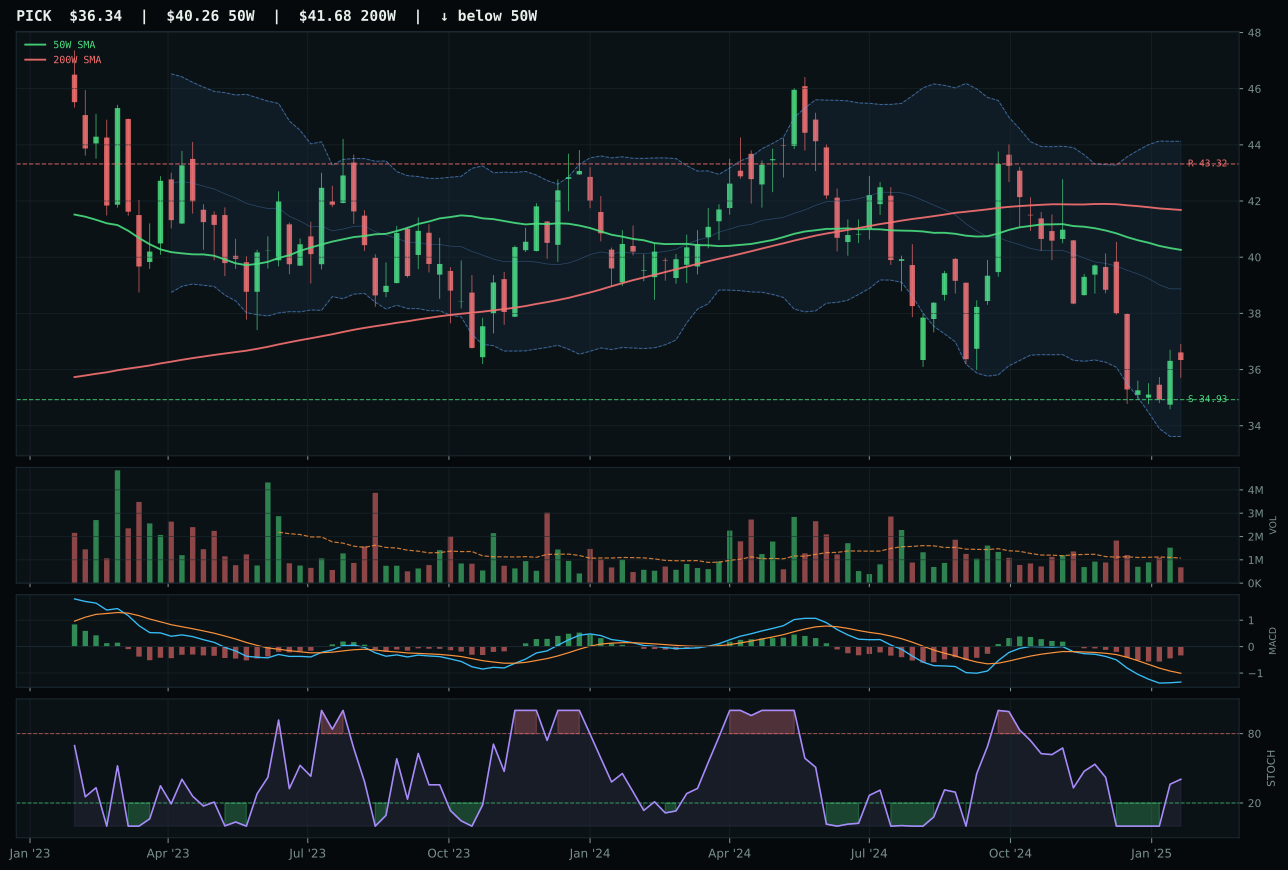
PICK has a pullback into support profile with -15.6% 13-week relative strength versus SPY.
Extension and support failure are the main tactical risks.
Tracked, but not top-2 eligible because: structurally broken.
COPX wins a category where all three names have failed, claiming category representation through superior timing (100.0) and risk-reward (98.0) that reflect a pullback into support rather than continuation momentum. Price sits 7.6% below the 50-week average, approaching support at 38.58 with only 3.5% downside to invalidation versus 16.9% upside to resistance—this creates genuine asymmetry in a commodity pullback context. MACD is bearish but improving and stochastic RSI is rising mid-zone at 0.30, the setup of a technical bounce candidate rather than a fundamental recovery. REMX is structurally broken (only 6 composite score, -16.6% relative strength) and PICK is similarly damaged, leaving COPX as the only name with a defined invalidation zone and a low-volatility entry point. The setup is not attractive; it is merely the least broken option available.
Industrial Metals received zero allocation because despite COPX's superior setup, the category's 31.0 final score reflects a momentum void that makes it ineligible: BOTZ momentum confirmation is 95.9, while COPX registers only 12.5—real participants are absent despite favorable timing and risk-reward. The 4W return of 1.8% and -11.2% thirteen-week decline tell the story: this is a value trap bounce, not a conviction accumulation. Metals scarcity and commodity breadth positive provide +14 and +10 macro tailwinds respectively, but liquidity stress (-8) and credit stress (-7) are actively working against the category. To earn allocation, copper (and its proxies) would need actual volume participation and breadth confirmation; a one-week reversal pattern sitting near support does not justify portfolio space when other setups offer both technical and momentum confirmation. The category is technically ready for a mean reversion trade, but macro conditions and participation patterns suggest deferral.
Agriculture & Livestock — MOO
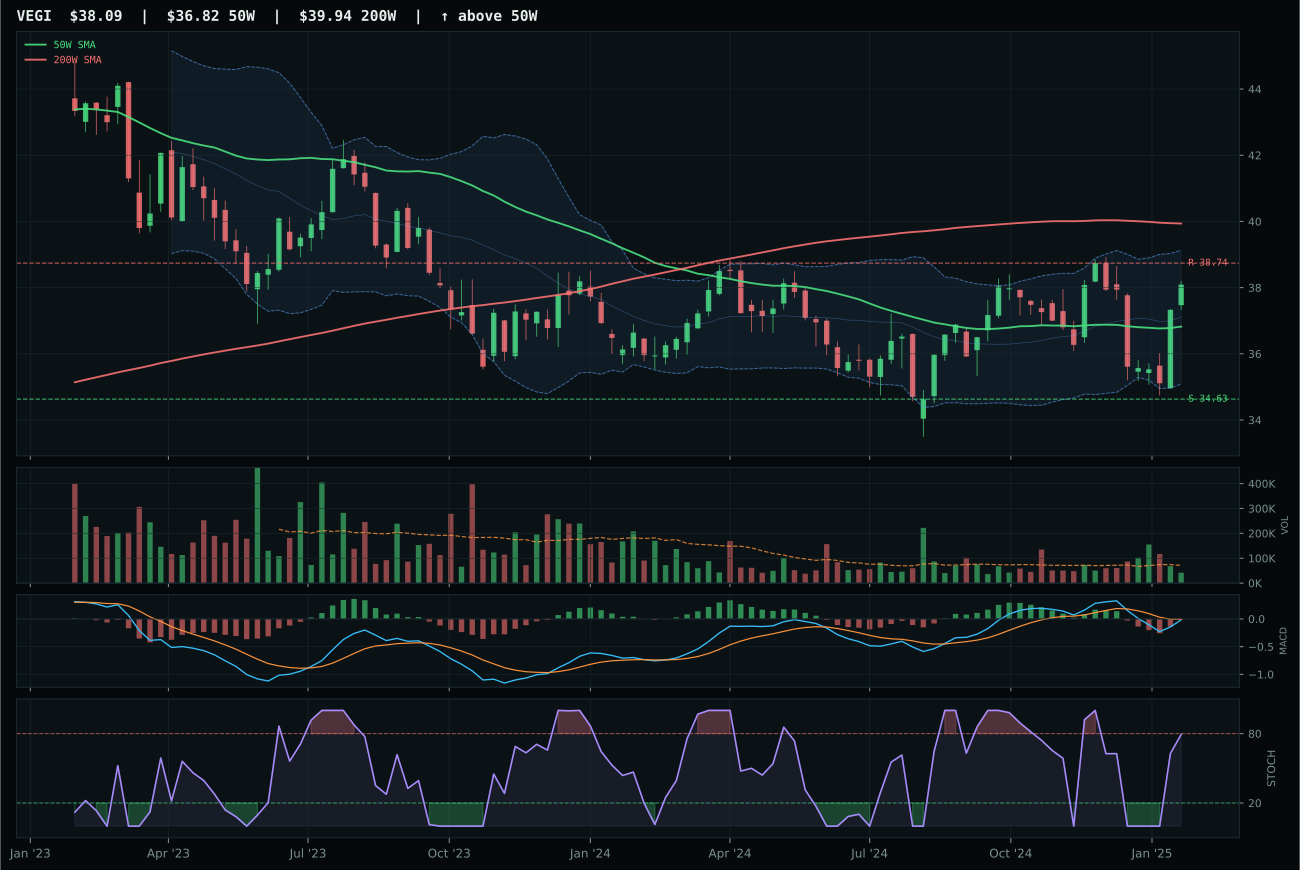
VEGI has a neutral structure profile with -2.8% 13-week relative strength versus SPY.
A failed hold above support would weaken the setup.
Tracked, but not top-2 eligible because: .
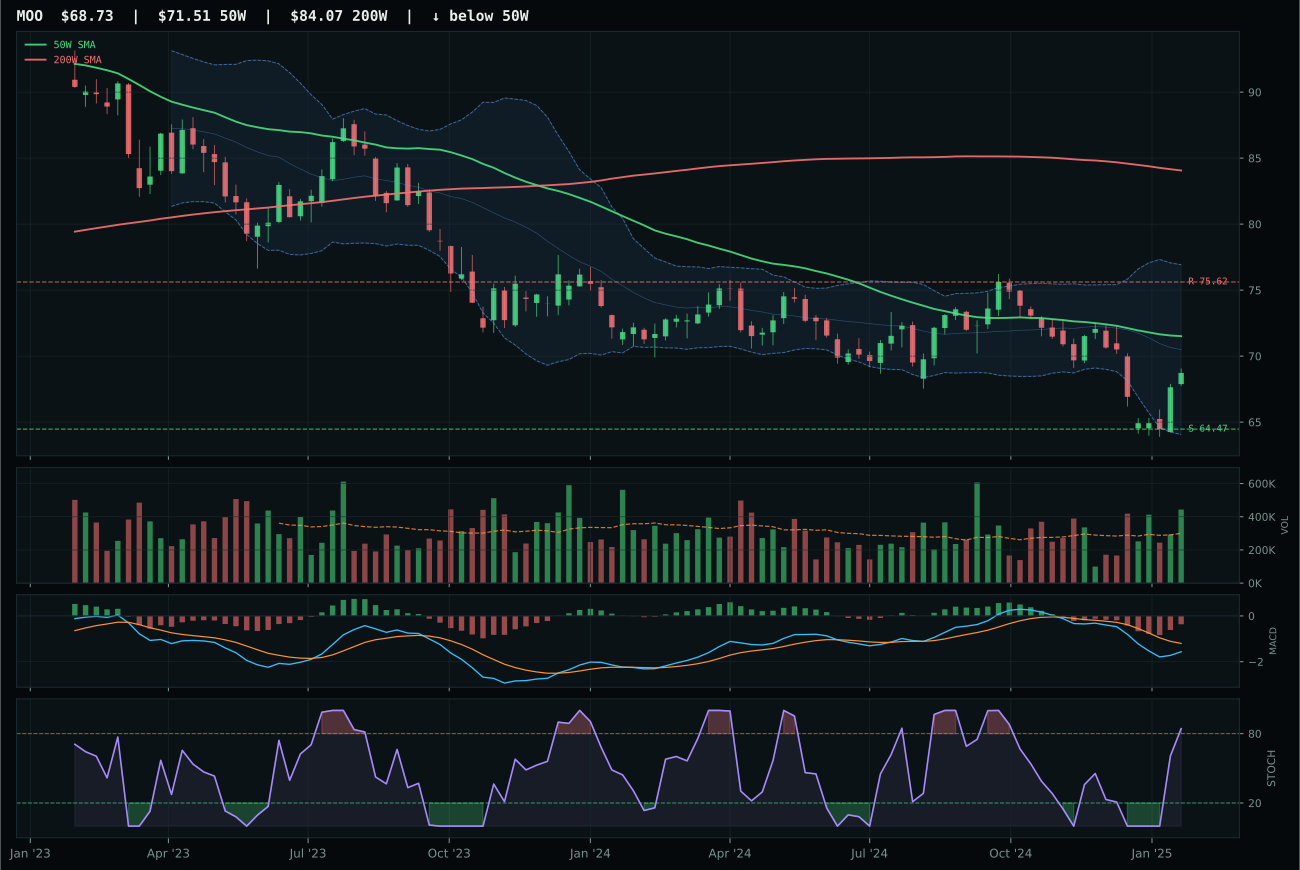
MOO has a neutral structure profile with -9.7% 13-week relative strength versus SPY.
Extension and support failure are the main tactical risks.
Tracked, but not top-2 eligible because: structurally broken.
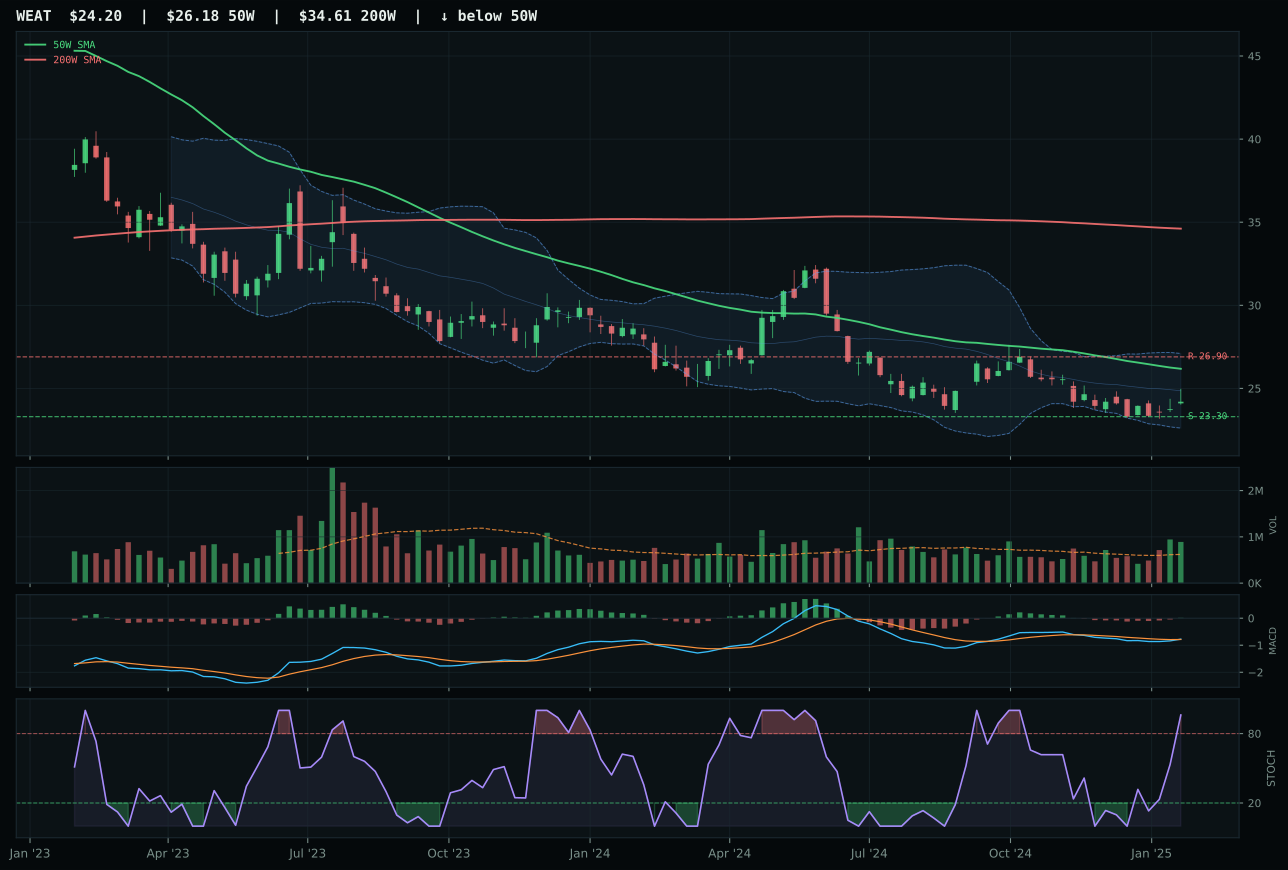
WEAT has a pullback into support profile with -10.3% 13-week relative strength versus SPY.
Extension and support failure are the main tactical risks.
Tracked, but not top-2 eligible because: structurally broken.
MOO wins by default in a structurally broken category, scoring 42.0 on technical evidence but claiming category representation through superior risk-reward (77.8 versus VEGI's 48.0) and above-average volume participation. The setup is deeply unattractive: price sits 3.9% below the 50-week average with a negative slope, the 13-week return is -4.7%, and relative strength versus SPY is -9.7%—these are not signs of strength but of capitulation. MOO's one edge is its retracement into support (near Fib 0.618 at 68.60) paired with overbought stochastic (0.84), which creates a mean-reversion candidate rather than a directional play. VEGI appears technically sounder (45.0 technical score, neutral structure), but thin volume participation undermines its thesis; between two deteriorating setups, MOO's above-average volume at 1.48x provides the only evidence of institutional interest.
Agriculture & Livestock received zero allocation and ranks 9th or 10th among categories this week because its 12.7 final score reflects technical deterioration layered onto unfavorable macro conditions. Disinflation actively harms commodity-linked assets (-6 points to category macro fit), and while commodity breadth positive and real asset sponsorship provide modest tailwinds (+5 and +8 respectively), they are overwhelmed by structural damage: price below the 50-week, negative relative strength, and MACD weakness prevent any holding that would command conviction. The category would need a sharp dollar reversal, commodity inflation shock, or confirmation of support holding with volume confirmation to earn even a 5% position. For now, it remains entirely outside the portfolio, as the technical setup is simply too compromised to justify entry despite the value proposition.