
2025-01-17
Informational purposes only. The content in this report, including allocations, analysis, and commentary, is provided solely for informational and educational purposes. It does not constitute financial advice, investment advice, trading advice, or any other type of advice. Past performance does not guarantee future results. Always conduct your own research and consult a qualified financial professional before making investment decisions.
Weekly Allocation
| Ticker | Category | Weight | Role |
|---|---|---|---|
| FBTC | 50% | Overlay | |
| XLE | Traditional Energy | 10% | Top-2 (10%) |
| GLD | Precious Metals | 10% | Top-2 (10%) |
| IGF | Utilities & Infrastructure | 5% | Tier-2 (5%) |
| XAR | Defense & Aerospace | 5% | Tier-2 (5%) |
| NLR | Nuclear Energy | 5% | Tier-2 (5%) |
| CIBR | Technology | 5% | Tier-2 (5%) |
| SMH | AI | 5% | Tier-2 (5%) |
| COPX | Industrial Metals | 5% | Tier-2 (5%) |
Trade Instructions — Monday Open
Sell the tranche from 2024-12-20 (completing its 4-week hold). Buy the new tranche. Instructions show net portfolio changes — same-asset positions cancel, weight changes show the delta.
| Action | Ticker | Instruction |
|---|---|---|
| SELL | XLK | Sell entire XLK position (2.50% of portfolio) |
| SELL | SLV | Sell entire SLV position (2.50% of portfolio) |
| SELL | XLU | Sell 25% of XLU position (reduce 5.00% → 3.75%) |
| SELL | INDA | Sell 25% of INDA position (reduce 5.00% → 3.75%) |
| SELL | AIQ | Sell entire AIQ position (1.25% of portfolio) |
| SELL | MOO | Sell entire MOO position (1.25% of portfolio) |
| BUY | CIBR | Buy CIBR — 12.50% of freed cash (adds 1.25% to portfolio) |
| BUY | GLD | Buy GLD — 25.00% of freed cash (adds 2.50% to portfolio) |
| BUY | IGF | Buy IGF — 12.50% of freed cash (adds 1.25% to portfolio) |
| BUY | SMH | Buy SMH — 12.50% of freed cash (adds 1.25% to portfolio) |
| BUY | XLE | Buy XLE — 25.00% of freed cash (adds 2.50% to portfolio) |
| BUY | NLR | Buy NLR — 12.50% of freed cash (adds 1.25% to portfolio) |
Current Portfolio After Trade
Combined holdings across all 4 active tranches. Each tranche is 25% of the portfolio.
| Ticker | % of Portfolio | Weight Bar |
|---|---|---|
| FBTC | 50.00% | |
| GLD | 10.00% | |
| CIBR | 7.50% | |
| XAR | 5.00% | |
| XLE | 5.00% | |
| NLR | 5.00% | |
| XLU | 3.75% | |
| INDA | 3.75% | |
| SMH | 3.75% | |
| COPX | 2.50% | |
| IGF | 2.50% | |
| WEAT | 1.25% |
Macro Regime — Disinflation
Macro Evidence Charts
Market-implied signals behind the macro regime scores. Each ratio compares two assets; the direction and slope of the ratio is what the macro engine reads.
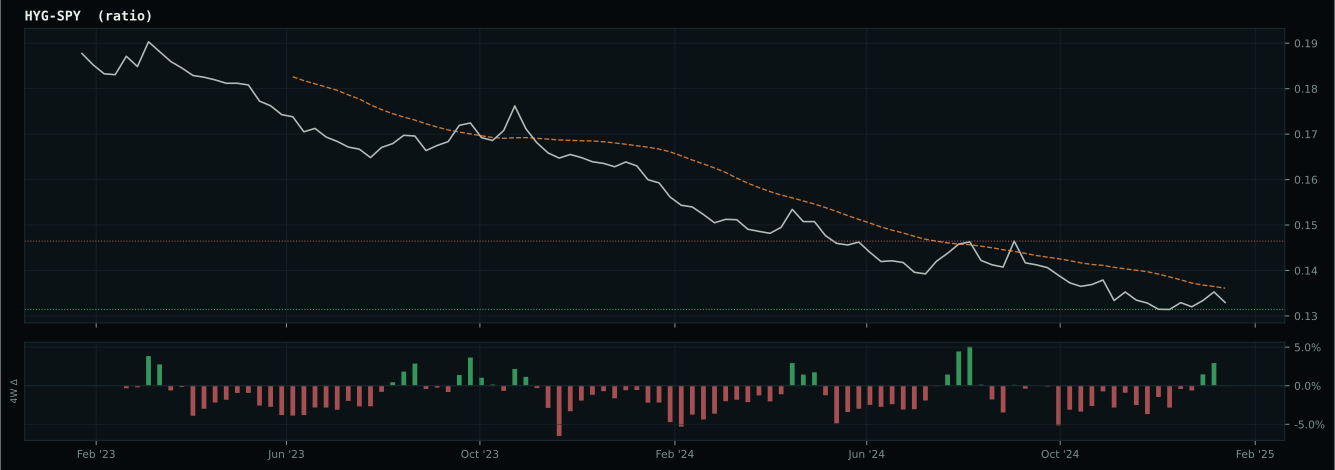
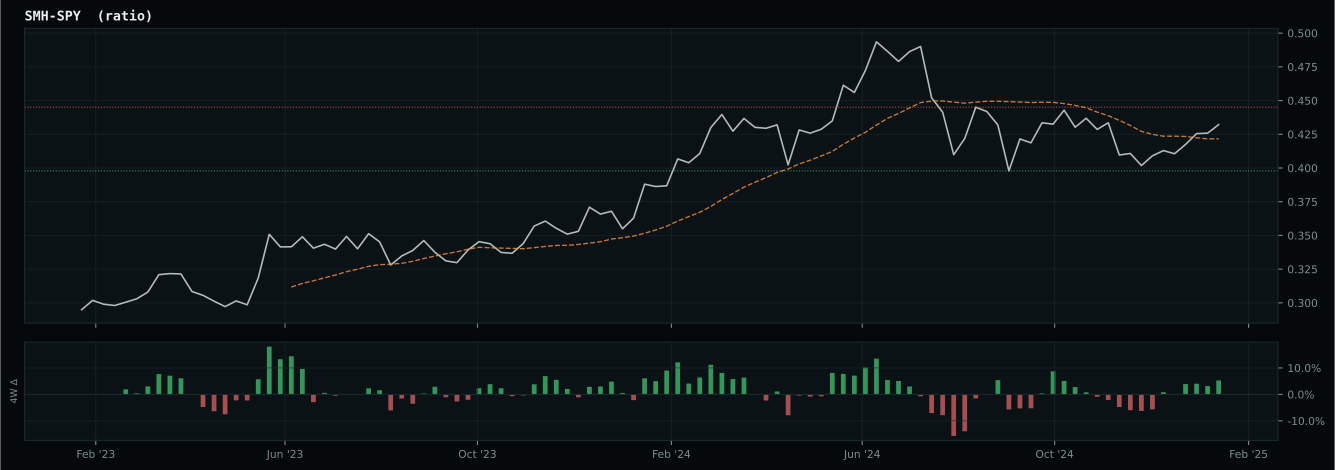
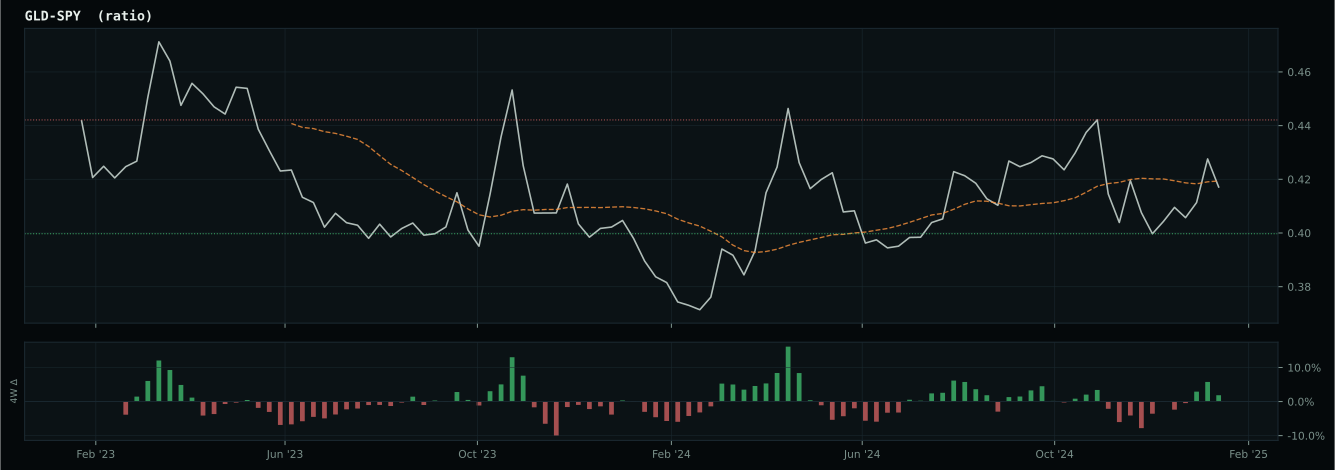
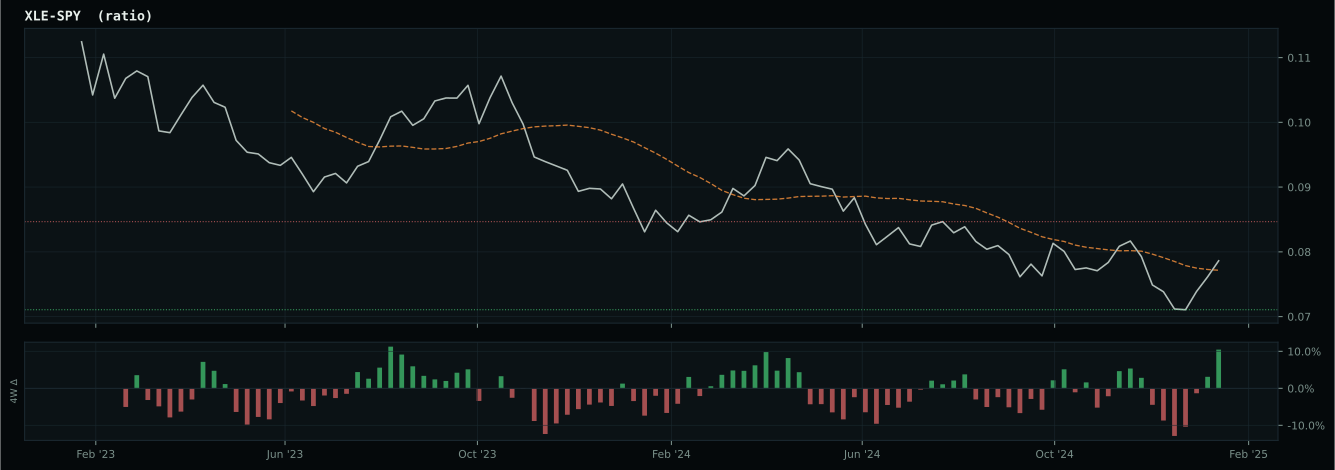
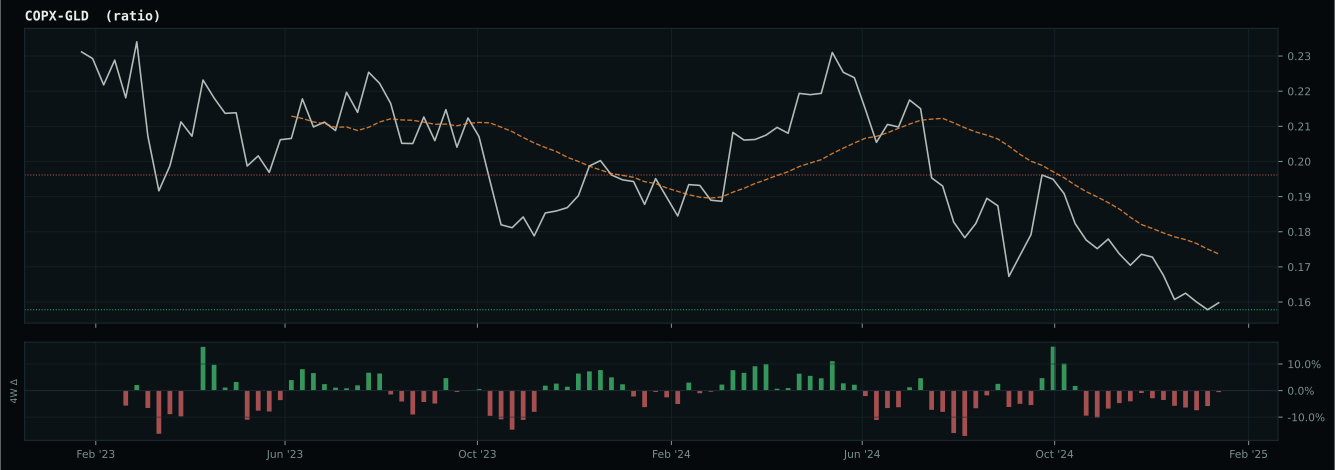
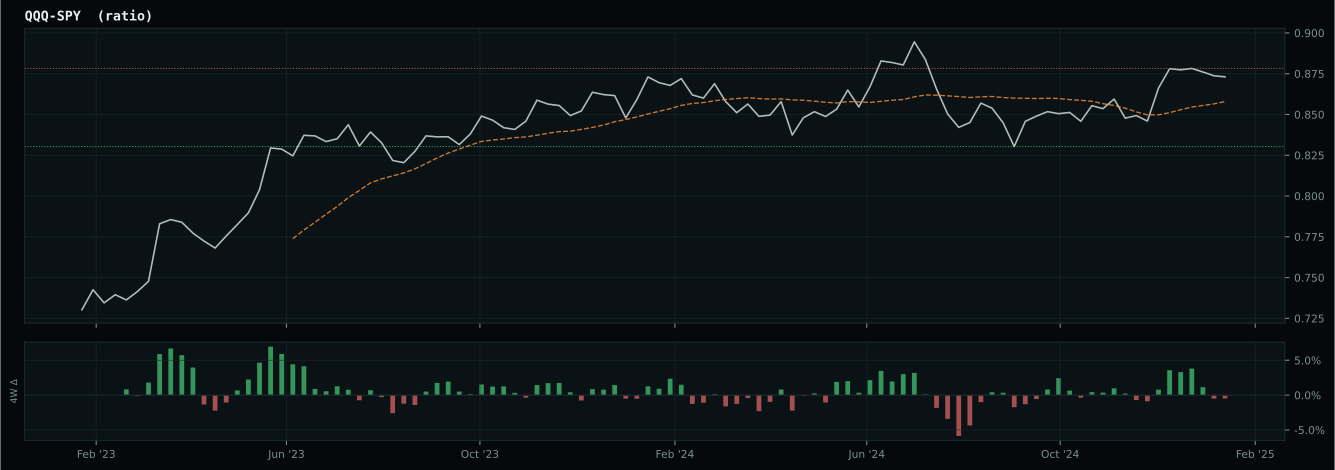
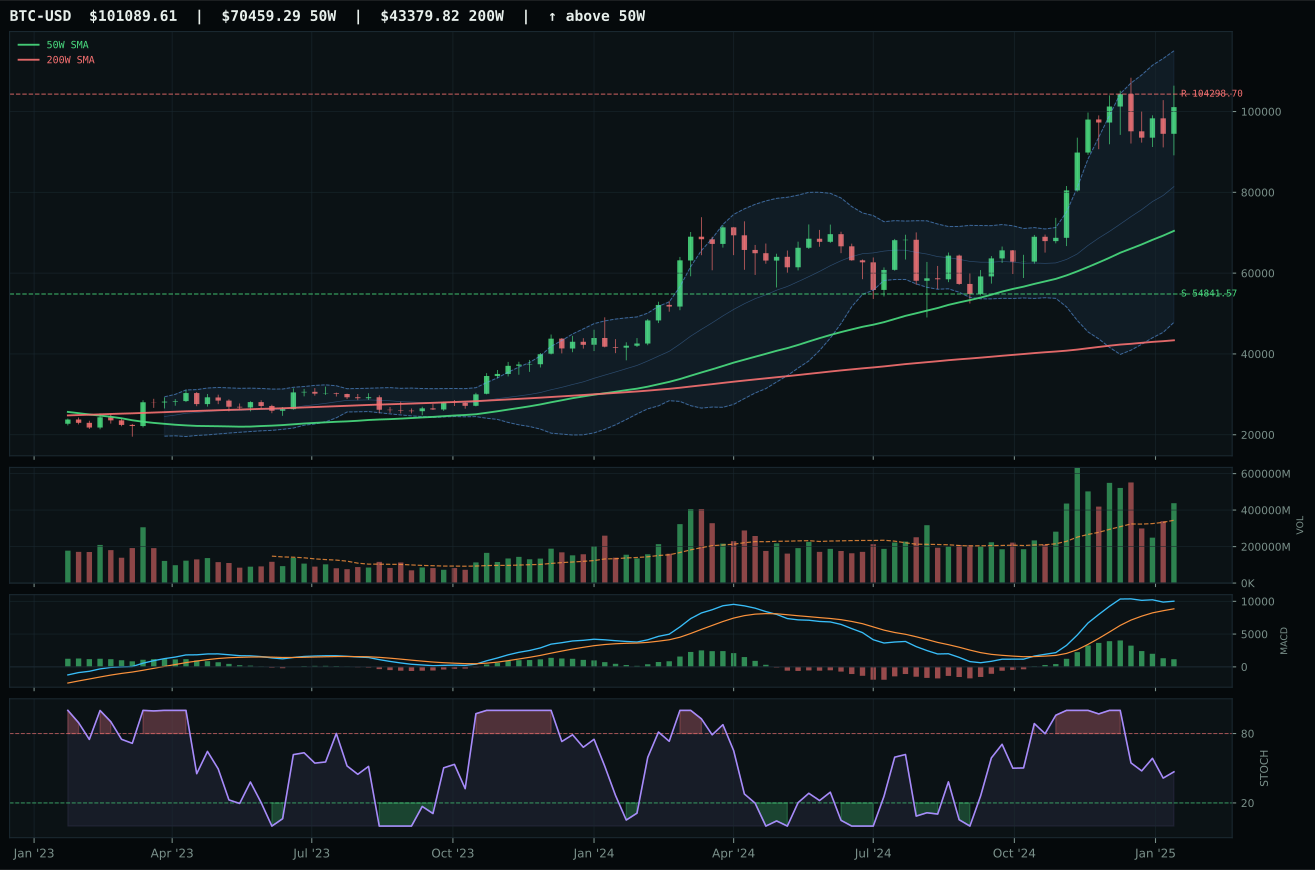
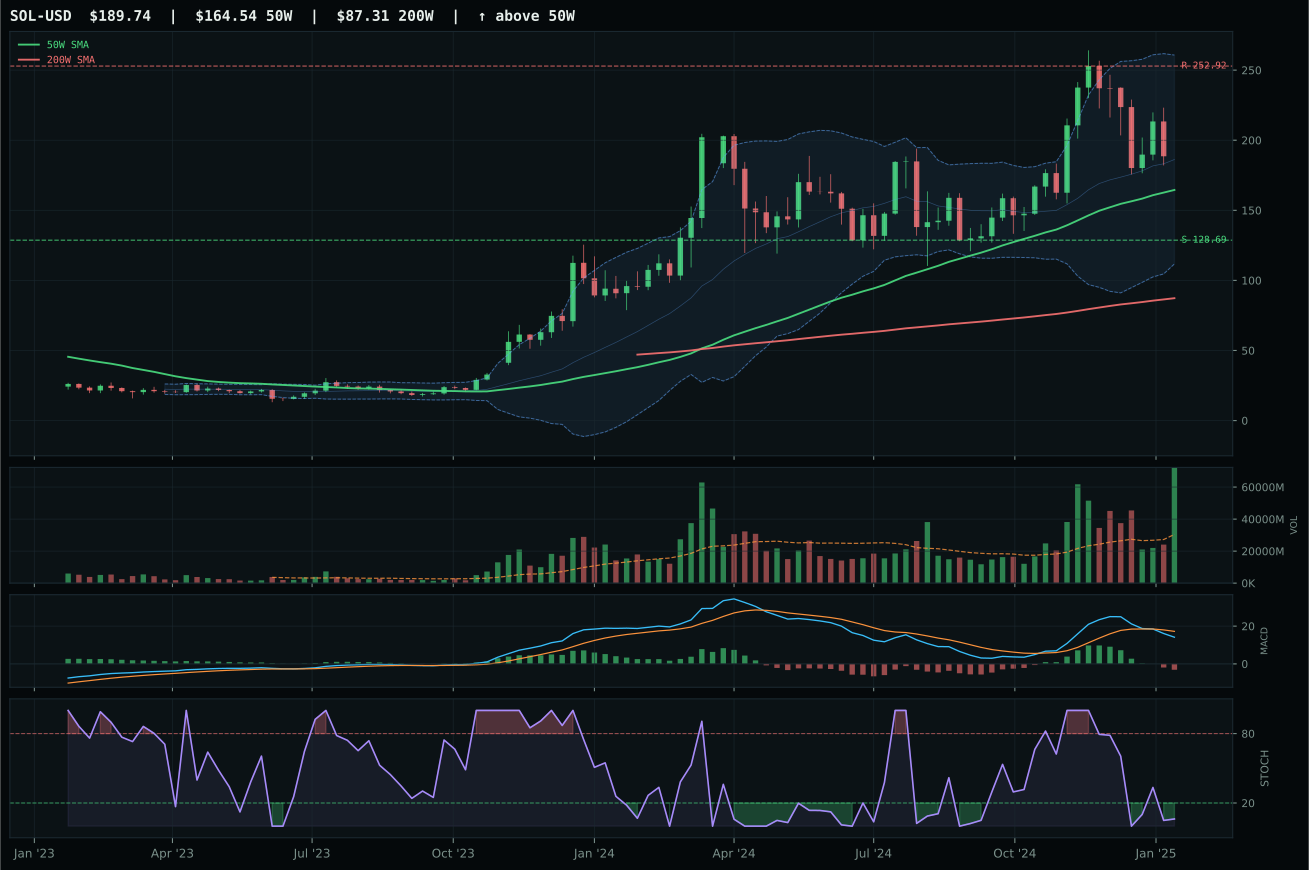
Crypto Regime — TrendBTC
ValueBTC not armed: BTC has not made the first post-breakdown touch of the 200W buy zone after losing the 50W
TrendBTC confirmed: 2 consecutive closes above rising/flat 50W SMA
one or more available conditions failed
Category Rankings
| Rank | Category | Winner | Score | Alloc | 4W Ret | Peers (4W) |
|---|---|---|---|---|---|---|
| 1 | Traditional Energy | XLE | 62.5 | 20% | -3.44% | FCG -5.2% · XOP -4.9% |
| 2 | Precious Metals | GLD | 61.8 | 20% | +7.04% | SLV +6.0% · GDX +12.2% |
| 3 | Utilities & Infrastructure | IGF | 52.8 | 10% | -0.77% | PAVE -2.7% · XLU -0.4% |
| 4 | Defense & Aerospace | XAR | 44.3 | 10% | -2.65% | ITA +0.9% · ROKT -2.3% |
| 5 | Nuclear Energy | NLR | 39.4 | 10% | +1.42% | URA +0.3% · URNM -9.0% |
| 6 | Technology | CIBR | 34.3 | 10% | +9.48% | IGV +5.7% · XLK +2.7% |
| 7 | AI | SMH | 29.6 | 10% | -2.33% | AIQ +7.0% · BOTZ +2.5% |
| 8 | Industrial Metals | COPX | 29.2 | 10% | +2.88% | REMX -4.5% · PICK +2.5% |
| 9 | Agriculture & Livestock | MOO | 10.3 | 0% | -0.35% | VEGI -0.2% · WEAT +9.3% |
| 10 | Emerging Markets | INDA | — | 0% | -2.44% | ILF +10.6% · IEMG +4.5% |
Traditional Energy — XLE
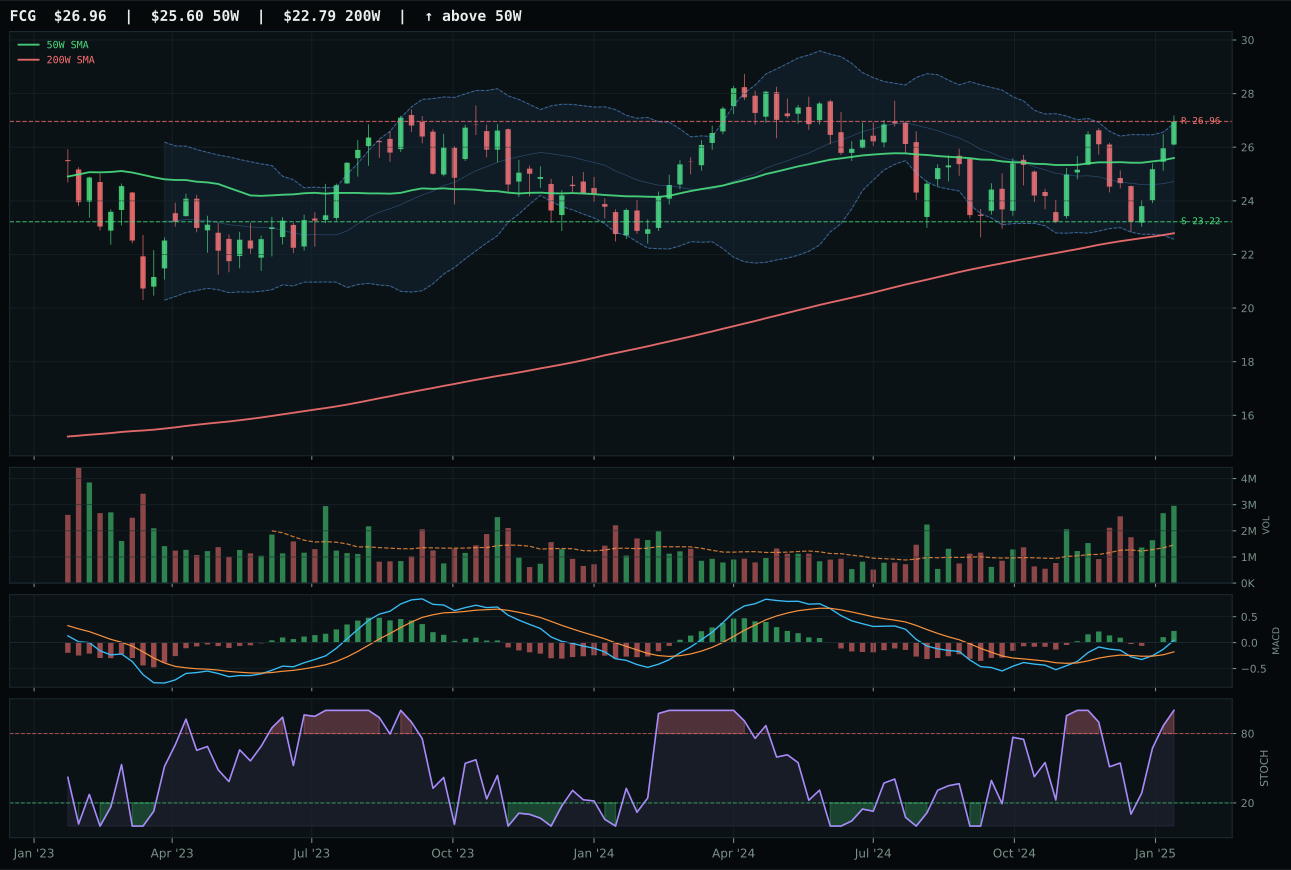
FCG has a neutral structure profile with 9.2% 13-week relative strength versus SPY.
A failed hold above support would weaken the setup.
Actionable but governed by invalidation levels.
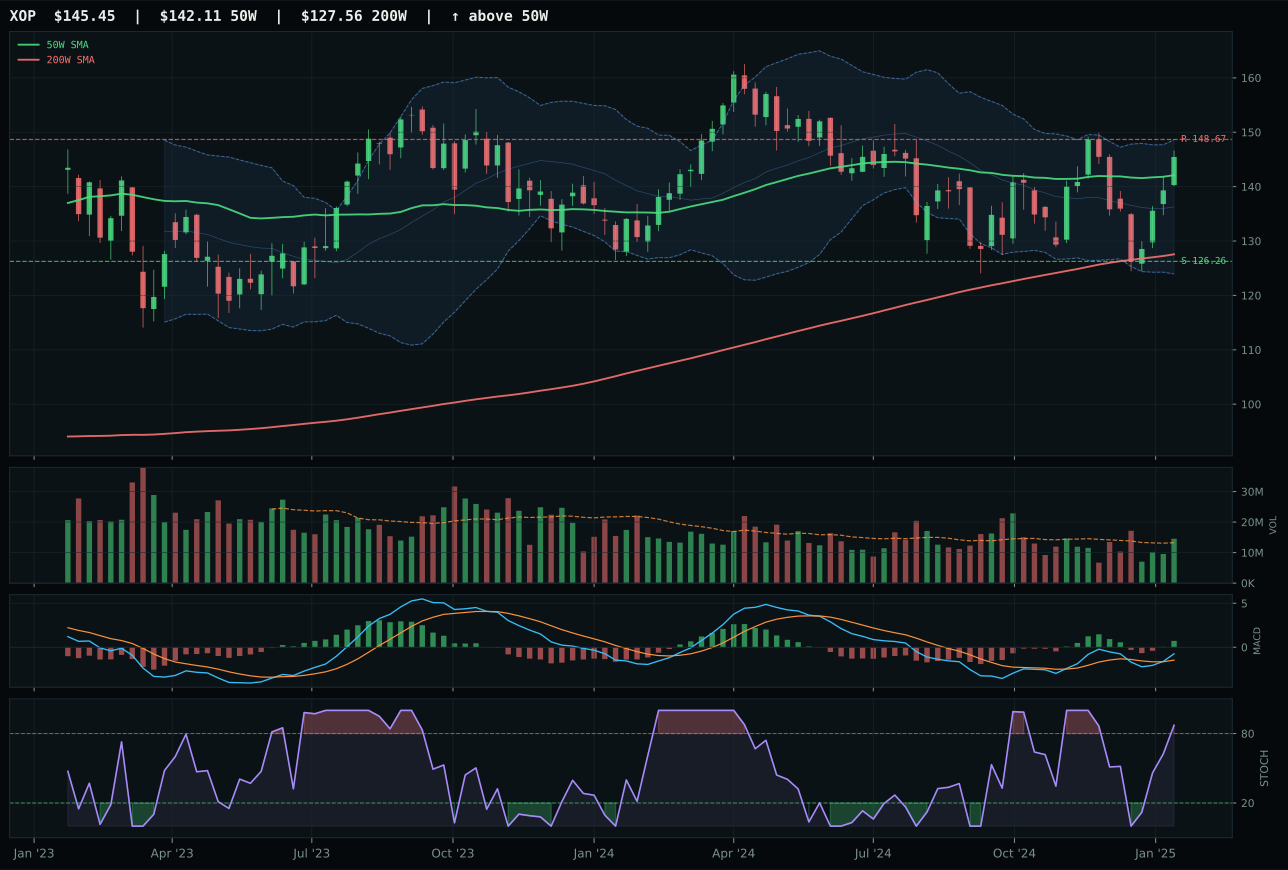
XOP has a compression near 50W profile with 5.6% 13-week relative strength versus SPY.
A failed hold above support would weaken the setup.
Actionable but governed by invalidation levels.
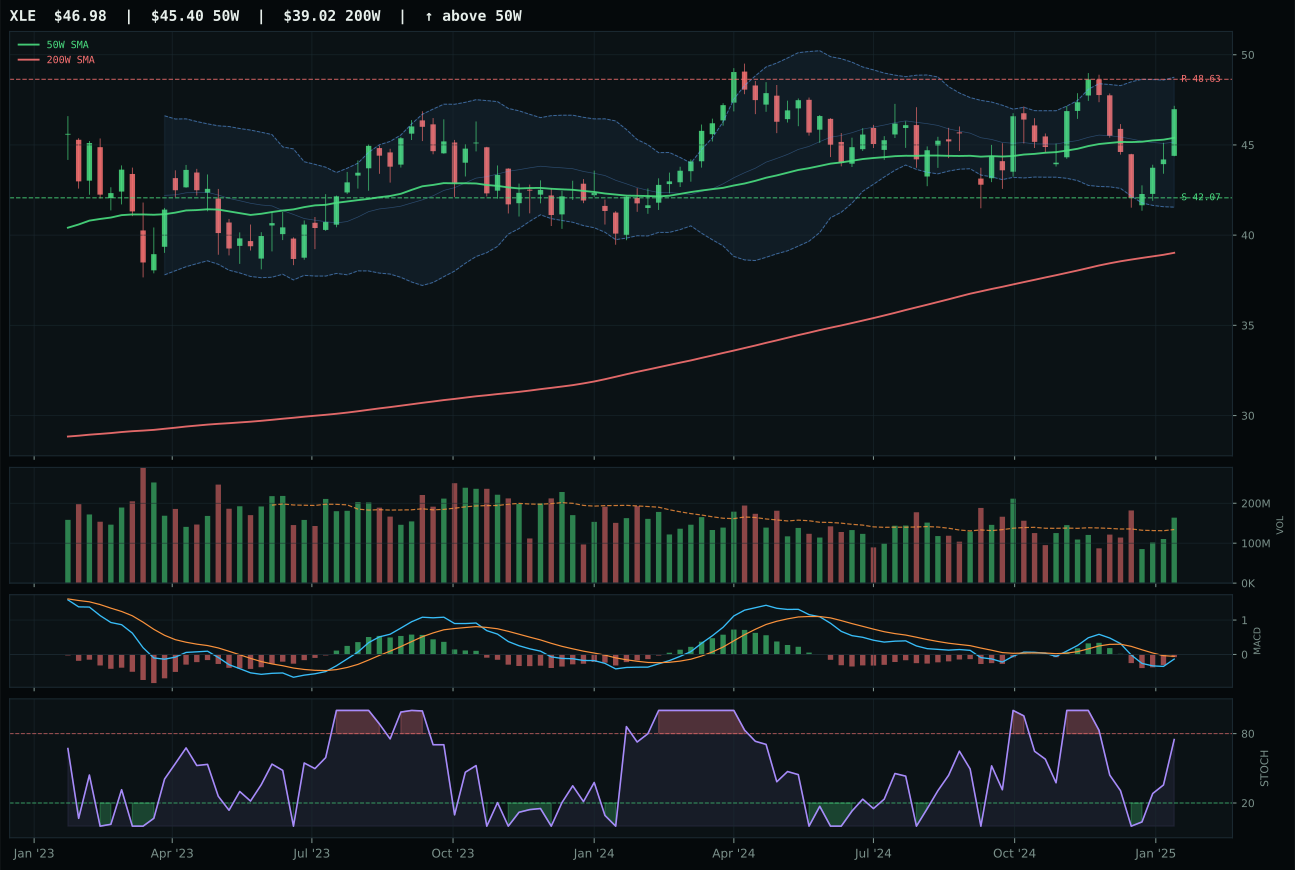
XLE has a neutral structure profile with 1.8% 13-week relative strength versus SPY.
A failed hold above support would weaken the setup.
Actionable but governed by invalidation levels.
XLE captured the energy category and locked in a top-2 allocation slot by posting the strongest timing score at 98.0/100, the cleanest structure at 76.8, and the best overall trend at 95.7—a tri-angle dominance that trumped FCG's superior momentum and MACD strength. Energy trades just 3.6% above the 50W, placing price in the near 52W low/repair zone near Fib 0.786, a setup that signals recovery without extended valuations. MACD is bearish but improving, stochastic RSI sits in rising mid-zone at 0.74, and volume is above-average participation at 1.22x, all confirming that institutional capital is rotating into the sector from defensive positioning. FCG's setup is technically superior with bullish-and-improving MACD and overbought-momentum stochastic RSI, but its stochastic reading of overbought tells the story: FCG is extended and more vulnerable to profit-taking, while XLE is still early in a retracement recovery. The 4W return of 11.7% on XLE confirms fresh money is entering; the 13W of 4.0% shows this is no speculative spike. XLE's -3.8% category-relative strength is the only weakness, but the absolute technical case is clearest.
Traditional Energy earned a 10% top-2 allocation, matching Precious Metals as one of the two highest-scoring categories at 62.5. Energy scarcity is the dominant macro tailwind at +16, real asset sponsorship adds +7, but disinflation pressure works against this space at -10 and credit stress at -7. The category-level macro fit of 39.0/100 is lower than metals, yet energy still ranked into the top-2 because the technical setup (XLE at 78.6 technical evidence) is genuinely clean and early-cycle. XLE's trend at 95.7 and timing at 98.0 reflect a recovery pattern that rewards entry now rather than waiting for euphoria. This allocation is a dual thesis: energy scarcity is real given global demand and constrained supply, and the technical setup is constructive for capital deployment. Reduction would be triggered by either a break below the 42.07 support level or a reversal in energy scarcity narratives.
Precious Metals — GLD
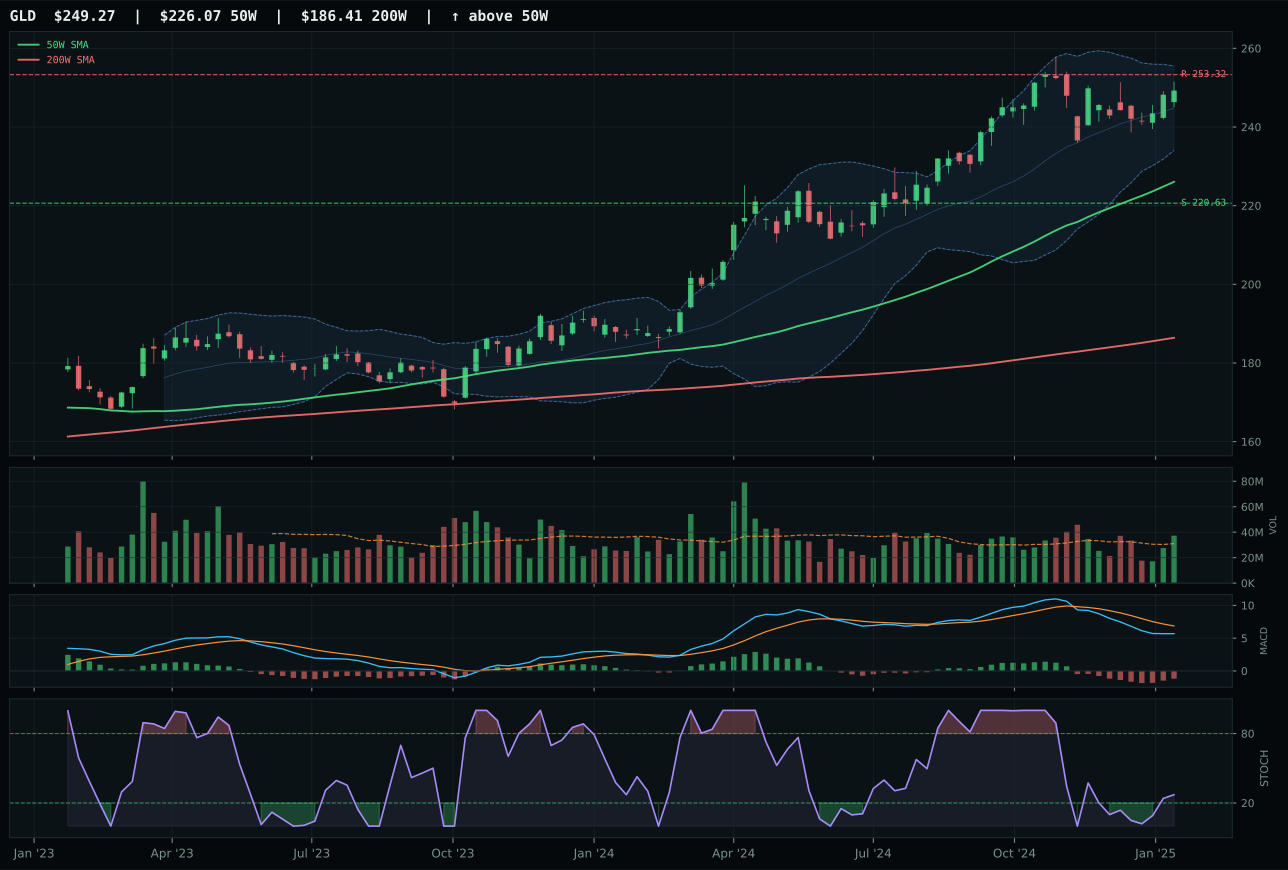
GLD has a neutral structure profile with -3.0% 13-week relative strength versus SPY.
A failed hold above support would weaken the setup.
Actionable but governed by invalidation levels.
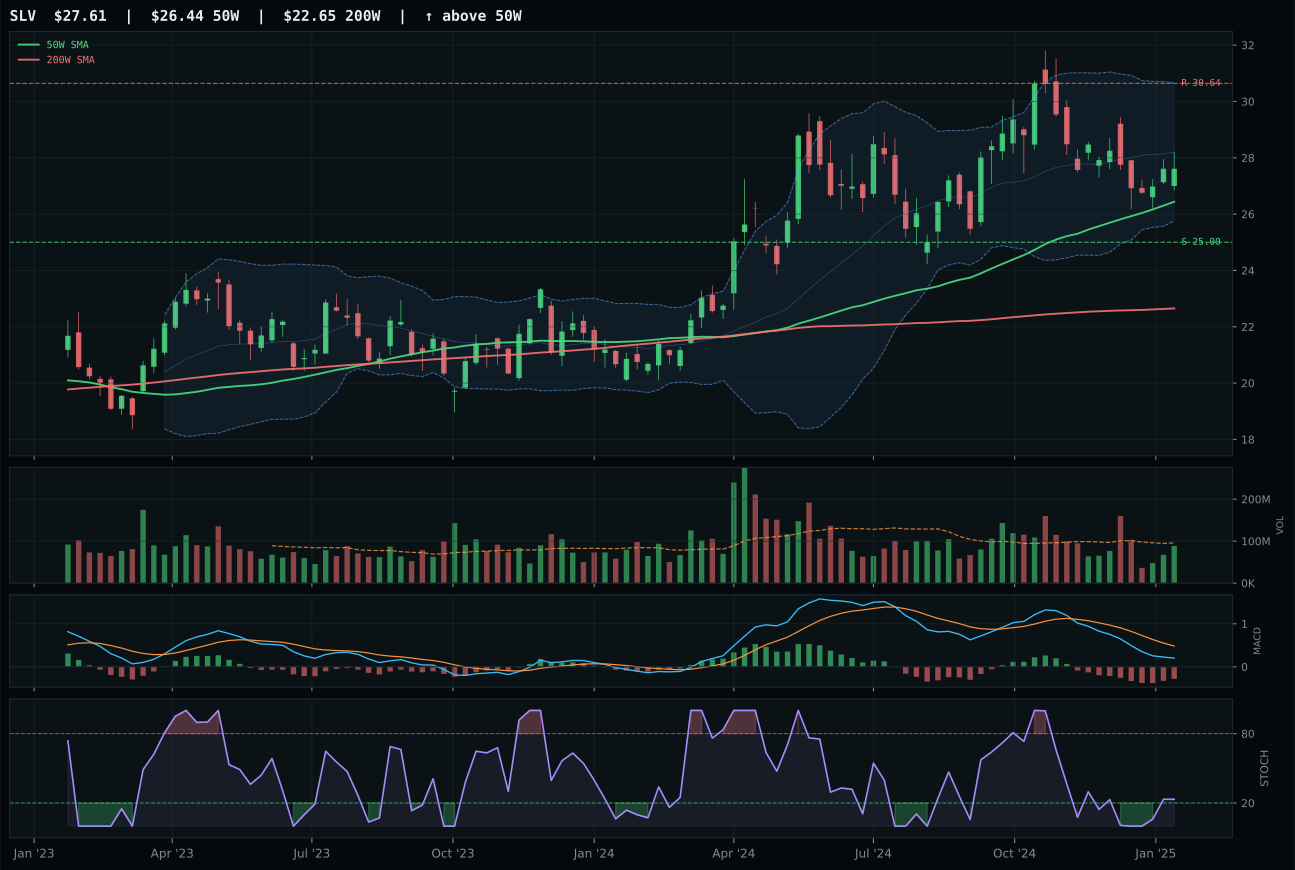
SLV has a neutral structure profile with -12.1% 13-week relative strength versus SPY.
A failed hold above support would weaken the setup.
Actionable but governed by invalidation levels.
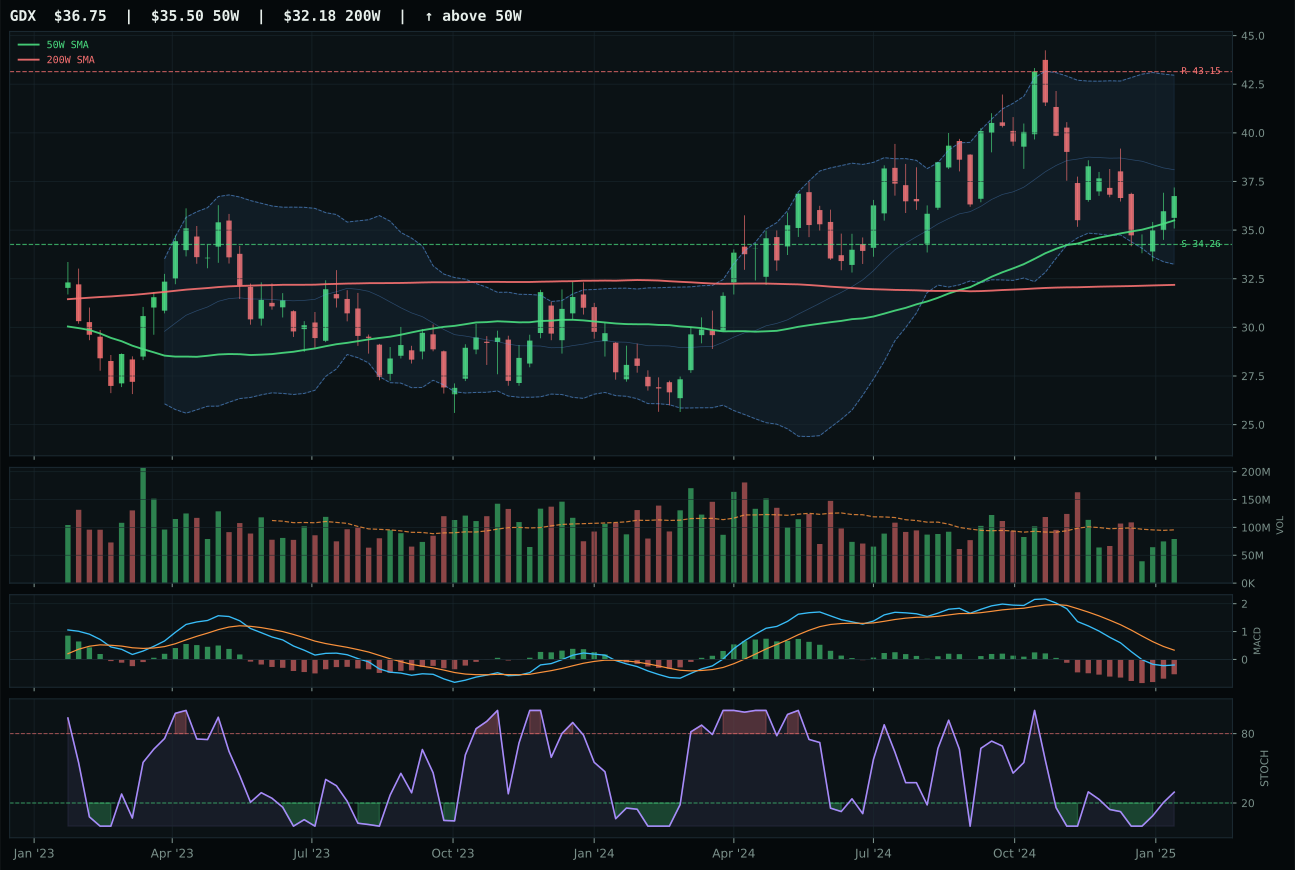
GDX has a neutral structure profile with -17.1% 13-week relative strength versus SPY.
A failed hold above support would weaken the setup.
Actionable but governed by invalidation levels.
GLD seized the precious metals category and earned a top-2 allocation slot by combining superior structure (73.0 vs SLV's 68.0), stronger volume confirmation at 1.20x 20W average versus SLV's neutral participation, and commanding category-relative strength of 9.1% versus SLV's 0.0%. Gold sits above both moving averages with a 0.5% 50W slope, just 10.3% from the 50W and positioned in the upper retracement/momentum zone near Fib 0.236—a setup that says accumulation is ongoing but not yet parabolic. MACD is bearish but improving and stochastic RSI is rising mid-zone at 0.27, both confirming that institutional buyers are stepping in without aggressive FOMO yet appearing. SLV's -12.1% SPY-relative weakness over 13 weeks tells the story: silver's hybrid monetary-industrial nature is being rejected in a deflationary regime where industrial demand is suspect but monetary protection is less valued than gold's purity. The score gap of 6.1 points is decisive; GLD is winning on technical merit and macro narrative fit simultaneously.
Precious Metals earned a 10% top-2 allocation, anchored by GLD as the portfolio's core monetary hedge against disinflation and credit stress. The category score of 61.8 ranks second only to traditional energy at 62.5, reflecting a category-level macro fit of 81.0/100 that is exceptionally strong in the current regime. Monetary hedge bid is actively rewarding this space at +14 points, disinflation pressure adds +6, and dollar pressure contributes +3—a tri-fold setup supporting gold as a safe haven in a rate-cutting cycle. The technical evidence score of 78.6 on the representative ETF confirms the setup is not just macro narrative; GLD is building above key averages with volume confirmation and better category-relative momentum than silver or miners. This allocation will persist as long as credit stress remains elevated or rate-cut expectations remain in force; a sharp pivot toward re-inflation or risk-on sentiment would force a reduction.
Utilities & Infrastructure — IGF
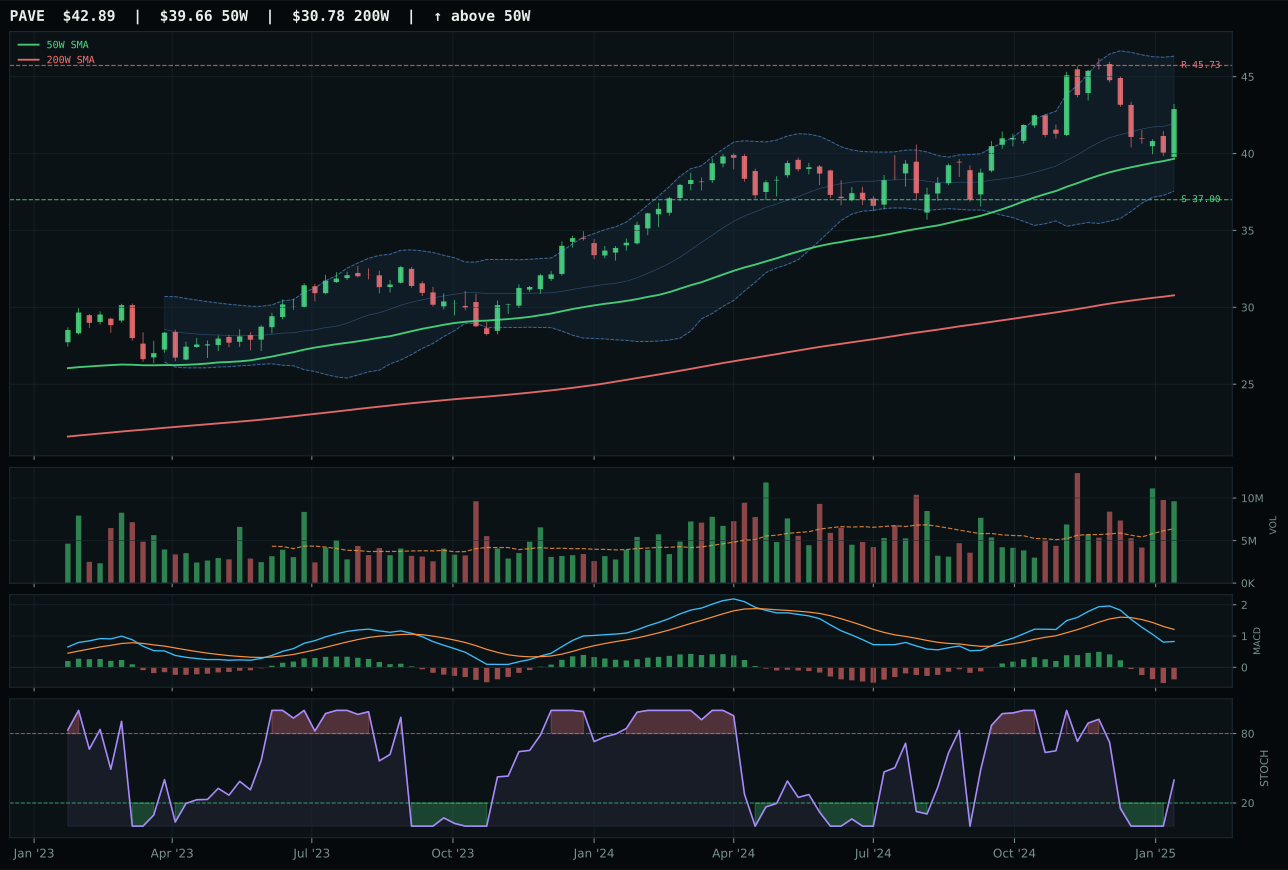
PAVE has a neutral structure profile with -1.3% 13-week relative strength versus SPY.
A failed hold above support would weaken the setup.
Actionable but governed by invalidation levels.
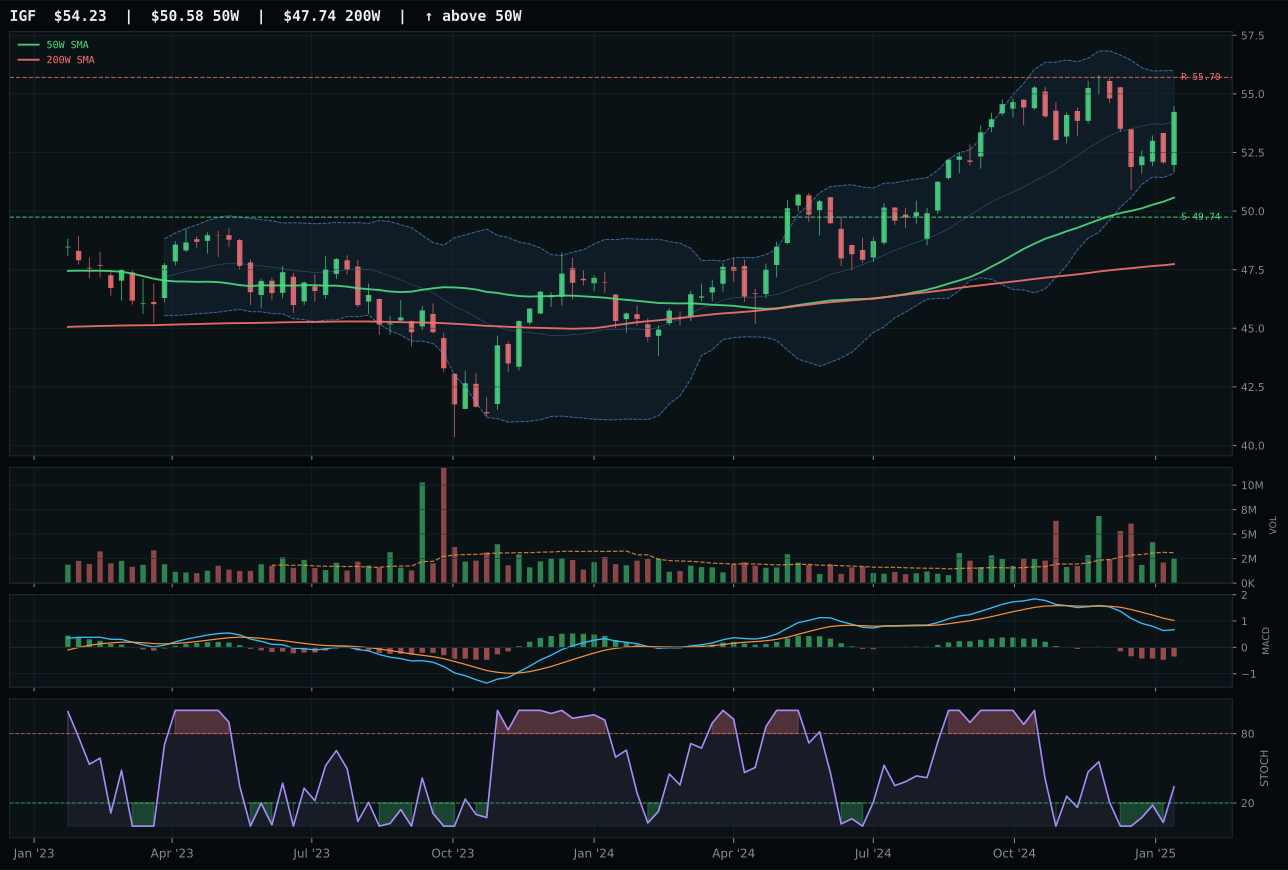
IGF has a neutral structure profile with -4.1% 13-week relative strength versus SPY.
A failed hold above support would weaken the setup.
Actionable but governed by invalidation levels.
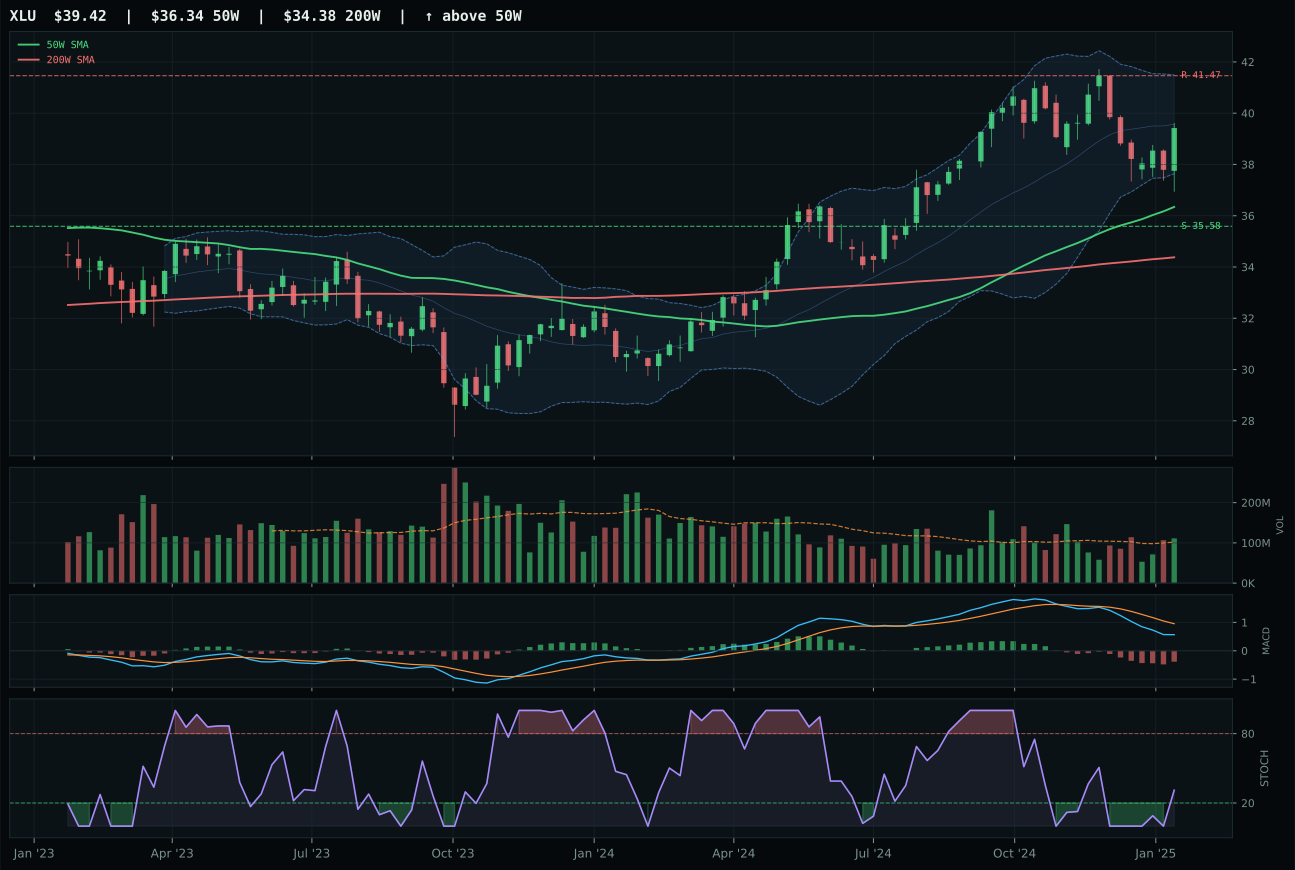
XLU has a neutral structure profile with -6.0% 13-week relative strength versus SPY.
A failed hold above support would weaken the setup.
Actionable but governed by invalidation levels.
IGF won the utilities & infrastructure category by offering a cleaner structure (73.0 vs PAVE's 70 composite) and better category-relative strength at 0.0% versus PAVE's disadvantaged +2.8% relative return positioning (which masked absolute weakness). Utilities sit above both moving averages with a 0.4% 50W slope, just 7.2% from the 50W in the upper retracement/momentum zone near Fib 0.236—a setup that is technically neutral and patient. MACD is bearish/weakening on both candidates, but IGF's stochastic RSI sits rising mid-zone at 0.34, a softer signal than PAVE's rising mid-zone with above-average accumulation volume, yet PAVE's volume advantage does not change the fundamental technical score because trend and structure are more predictive in a torn market. PAVE's 0.9% 13W return versus IGF's -1.9% shows the domestic infrastructure play has outrun the global income story, but the allocator needs cleaner structure over near-term momentum in this regime. The score gap of 5.7 points reflects IGF's slightly superior setup discipline, not a blowout technical advantage.
Utilities & Infrastructure earned 5% allocation as a tier-3 category with a final score of 52.8, ranking solidly in the middle-to-lower portion of the allocation tiers. Disinflation helps this exposure at +7 and transition/mixed macro helps at +4, while liquidity stress subtracts only -3—the macro environment is comparatively favorable for defensive, income-producing equities in a rate-cutting cycle. The category-level macro fit of 68.0/100 is strong, reflecting that utilities and infrastructure are beneficiaries of lower-for-longer rates and defensive positioning. IGF's technical evidence of 45.5/100 is modest, confirming the setup is solid but not urgent; trend at 75.8 and timing at 78.0 are both constructive for patient accumulation. The allocation holds because this is where capital typically rotates when growth is no longer trusted and yield becomes scarce, but the lower composite scores on both IGF and PAVE suggest this is a late-cycle defensive trade, not an early-stage momentum setup. Promotion to top-2 would require either a marked deterioration in credit markets or a sharper turn toward recession fears.
Defense & Aerospace — XAR
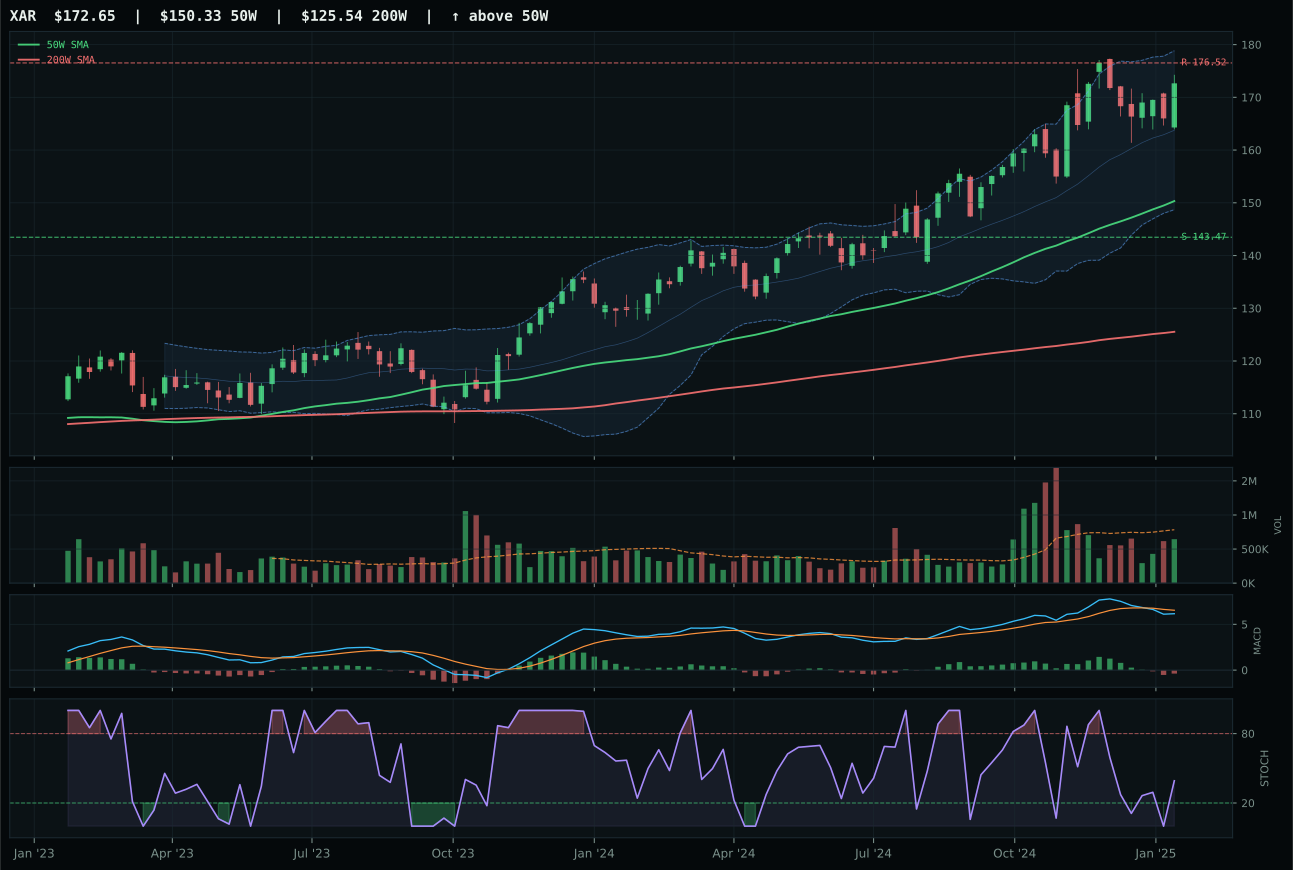
XAR has a neutral structure profile with 3.7% 13-week relative strength versus SPY.
A failed hold above support would weaken the setup.
Actionable but governed by invalidation levels.
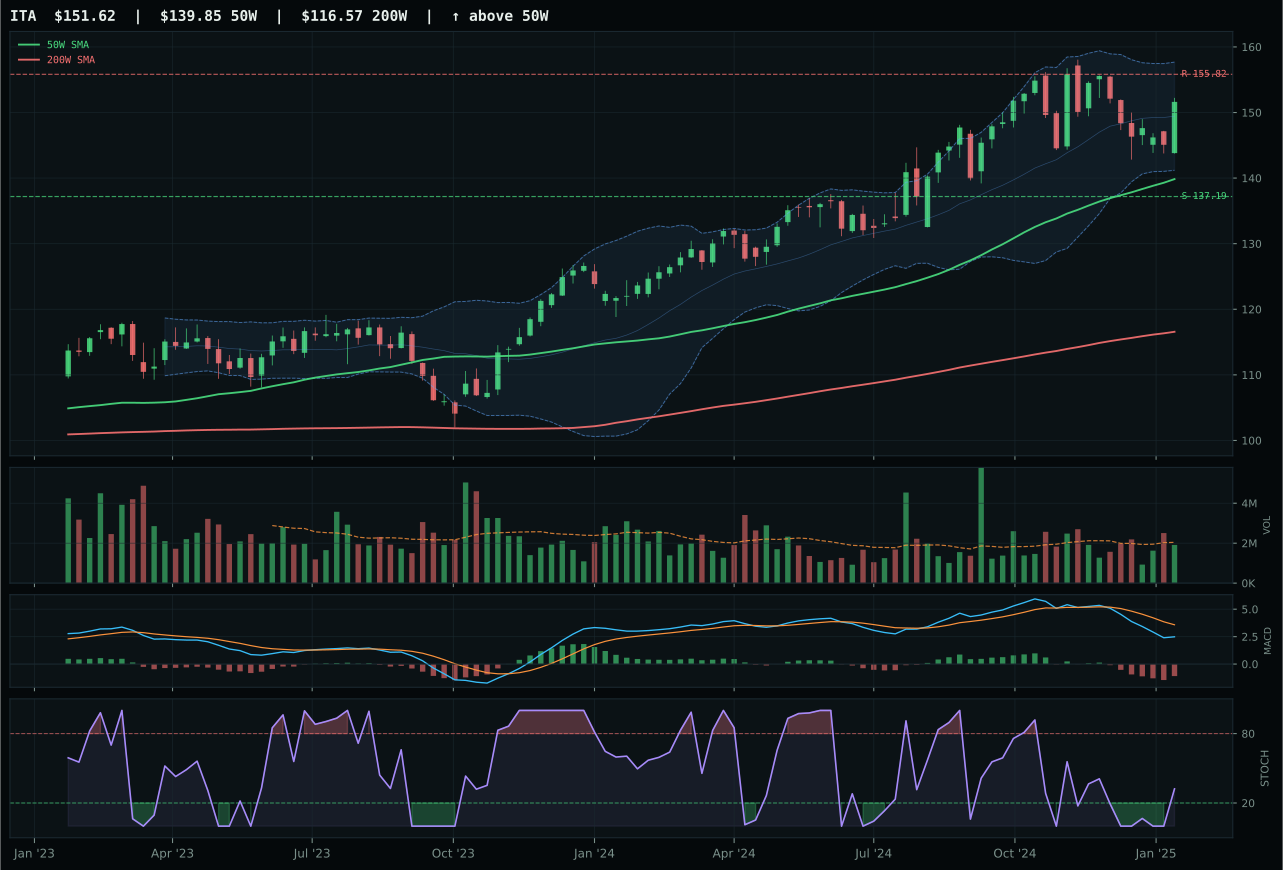
ITA has a neutral structure profile with -4.3% 13-week relative strength versus SPY.
A failed hold above support would weaken the setup.
Actionable but governed by invalidation levels.
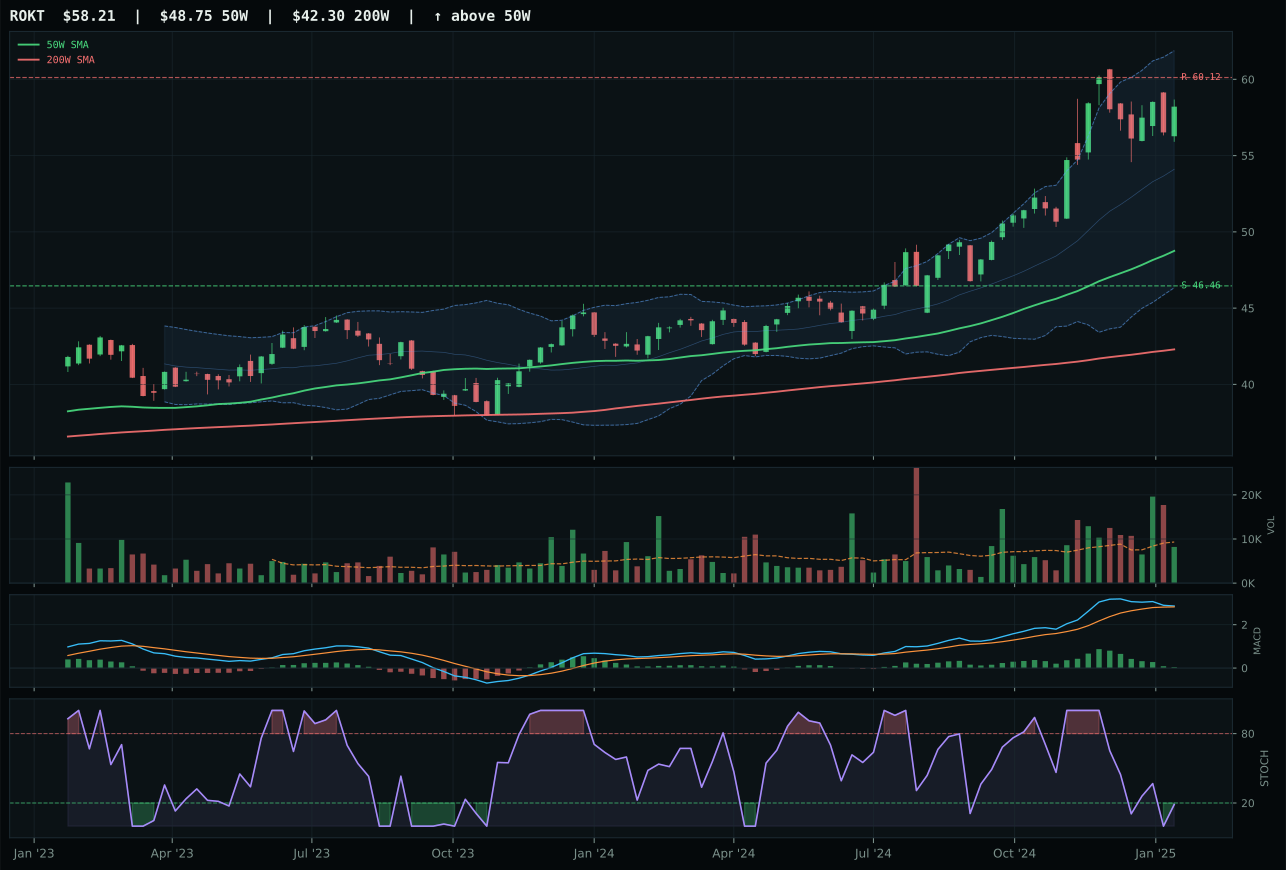
ROKT has a vertical extension profile with 9.2% 13-week relative strength versus SPY.
A failed hold above support would weaken the setup.
Tracked, but not top-2 eligible because: .
XAR captured the defense category by posting stronger RS versus SPY at 3.7% versus ITA's -4.3%, delivering superior relative momentum despite both sitting in neutral structures. The XAR setup sits 14.8% above the 50W near the 52W high/extension zone, placing it in a higher-risk area where fresh buyers are paying for leadership rather than value; however, the 20.2% 26W return and tight compression at the support level (143.47) signal the move has been methodical accumulation rather than panic buying. ITA's weakness is structural—cleanliness deteriorates to 50.0 from compression at 77.9, and the negative category-relative strength of -8.0% suggests the defense-prime durability thesis is underperforming pure aerospace plays. MACD is bearish/weakening for both, but XAR's stochastic RSI sits in rising mid-zone at 0.39, giving room for momentum to improve; ITA's same timing metric offers no advantage. The 6.3-point score gap reflects XAR's technical leadership, though neither setup is screaming accumulation.
Defense & Aerospace earned 5% allocation as a tier-3 category at a final score of 44.3, placing it in the solid middle of the category rankings. Broad market bear and dollar pressure are both active tailwinds (+6 and +3 respectively), and the category-level macro fit of 60.0/100 is robust—this is one of the few equity theses that benefits from geopolitical tension and currency strength. However, the technical evidence score of 52.3 is modest, meaning the chart setup does not scream urgency; XAR is extended from its 50W and the setup is in the upper retracement zone. The allocation holds its 5% position because the macro case is real and the structure is not broken, but a pullback to better technical entry points would be required to push this into a top-2 overweight slot alongside energy and precious metals.
Nuclear Energy — NLR
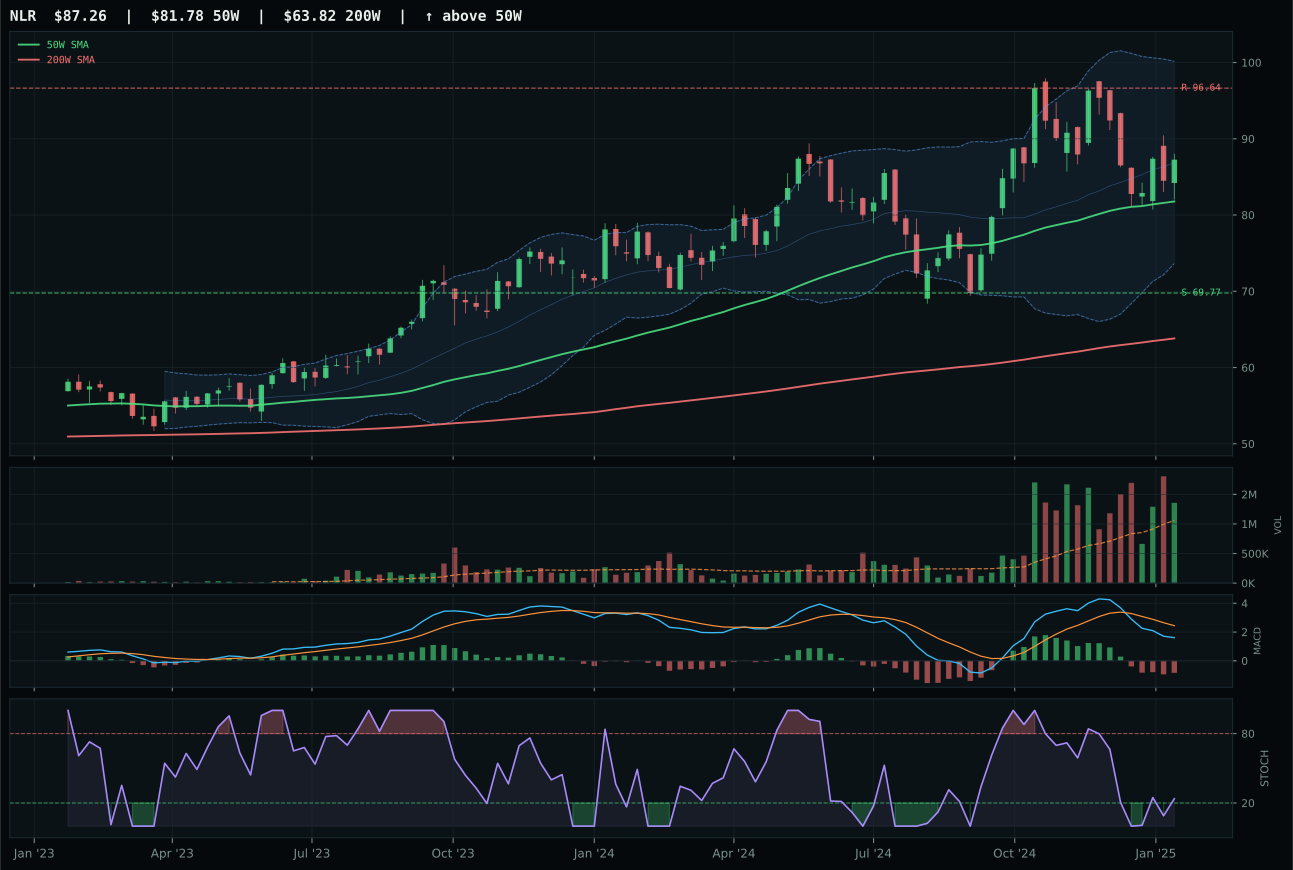
NLR has a neutral structure profile with -11.9% 13-week relative strength versus SPY.
A failed hold above support would weaken the setup.
Actionable but governed by invalidation levels.
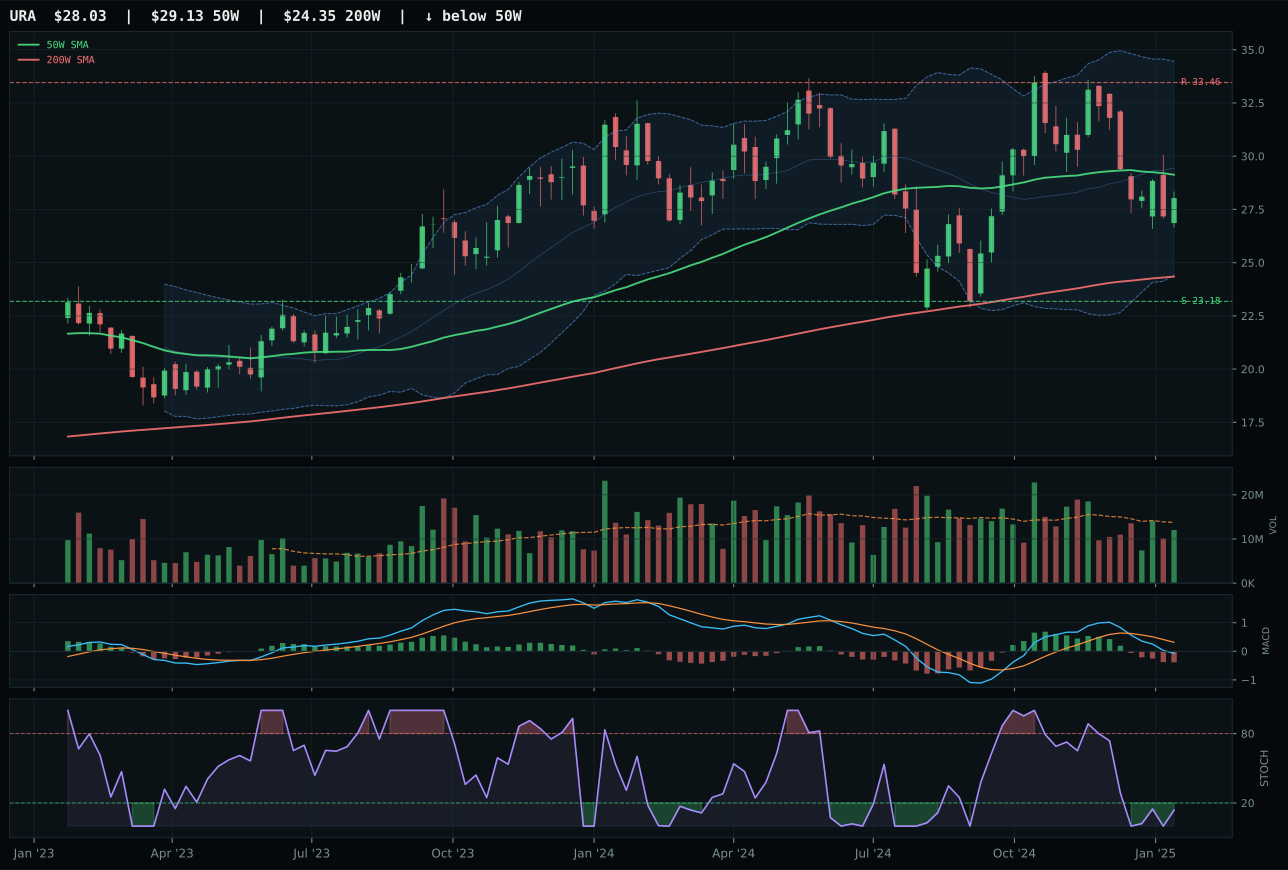
URA has a neutral structure profile with -18.5% 13-week relative strength versus SPY.
A failed hold above support would weaken the setup.
Actionable but governed by invalidation levels.
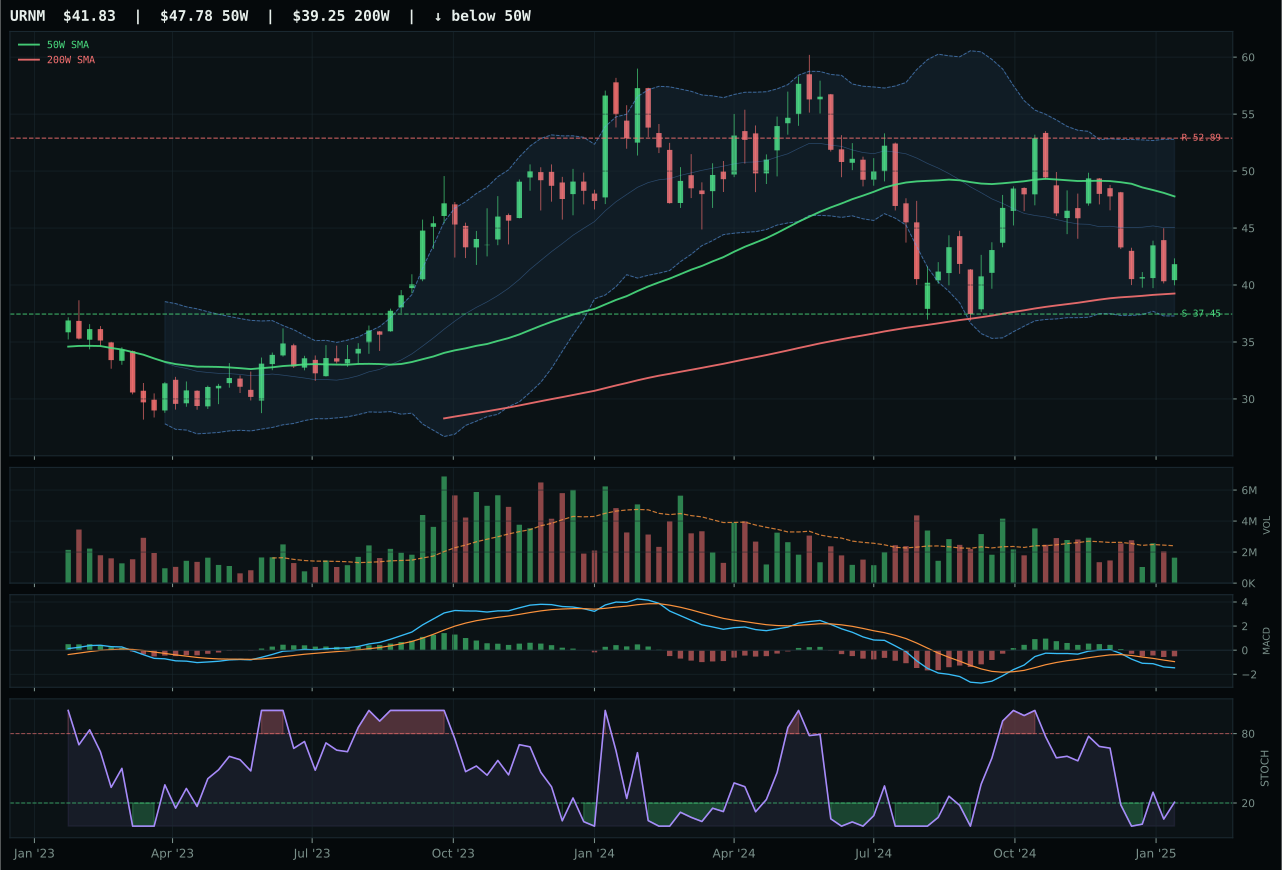
URNM has a neutral structure profile with -23.1% 13-week relative strength versus SPY.
A failed hold above support would weaken the setup.
Actionable but governed by invalidation levels.
NLR won the nuclear energy category by posting stronger category-relative strength at 6.5% versus URA's 0.0%, better volume confirmation at 1.28x 20W average versus URA's neutral participation, and a cleaner stochastic RSI setup (rising mid-zone at 0.24 vs oversold turn up). Nuclear sits above both moving averages with a 0.2% 50W slope, 6.7% from the 50W in the upper retracement/momentum zone near Fib 0.382—a setup that is technically sound but not screaming urgency. NLR's MACD is bearish/weakening, a vulnerability, but the rising mid-zone stochastic RSI and above-average volume suggest accumulation is occurring despite the MACD weakness. URA's oversold stochastic turn-up looks tempting on paper, but it often marks capitulation rather than accumulation, and the -18.5% 13W SPY-relative weakness tells the true story: uranium has been left for dead. The 19.1-point score gap reflects NLR's steadier utilities/energy mix outperforming pure-play uranium uranium exposure in a regime where energy scarcity benefits both equally but steadier assets win on risk-adjusted flow.
Nuclear Energy earned 5% allocation as a tier-3 category with a final score of 39.4, ranking outside the top-2 but ahead of several weaker structures. Energy scarcity is active at +9 and real asset sponsorship at +7, but liquidity stress at -7 and credit stress at -5 are moderate headwinds. The category-level macro fit of 54.0/100 is solid—nuclear benefits from the same energy-scarcity narrative as oil and gas, plus an added ESG tailwind in certain regimes. NLR's technical evidence of 48.0/100 is respectable for a defensive utility play, confirming the structure is sound if unspectacular. The allocation holds because energy scarcity is real and nuclear offers both energy security and defensiveness, but the -11.9% SPY-relative weakness suggests the market is not yet enthusiastically embracing this space. A break above 96.64 resistance or a sharp tightening in uranium spot prices would be needed to justify promotion to top-2 status.
Technology — CIBR
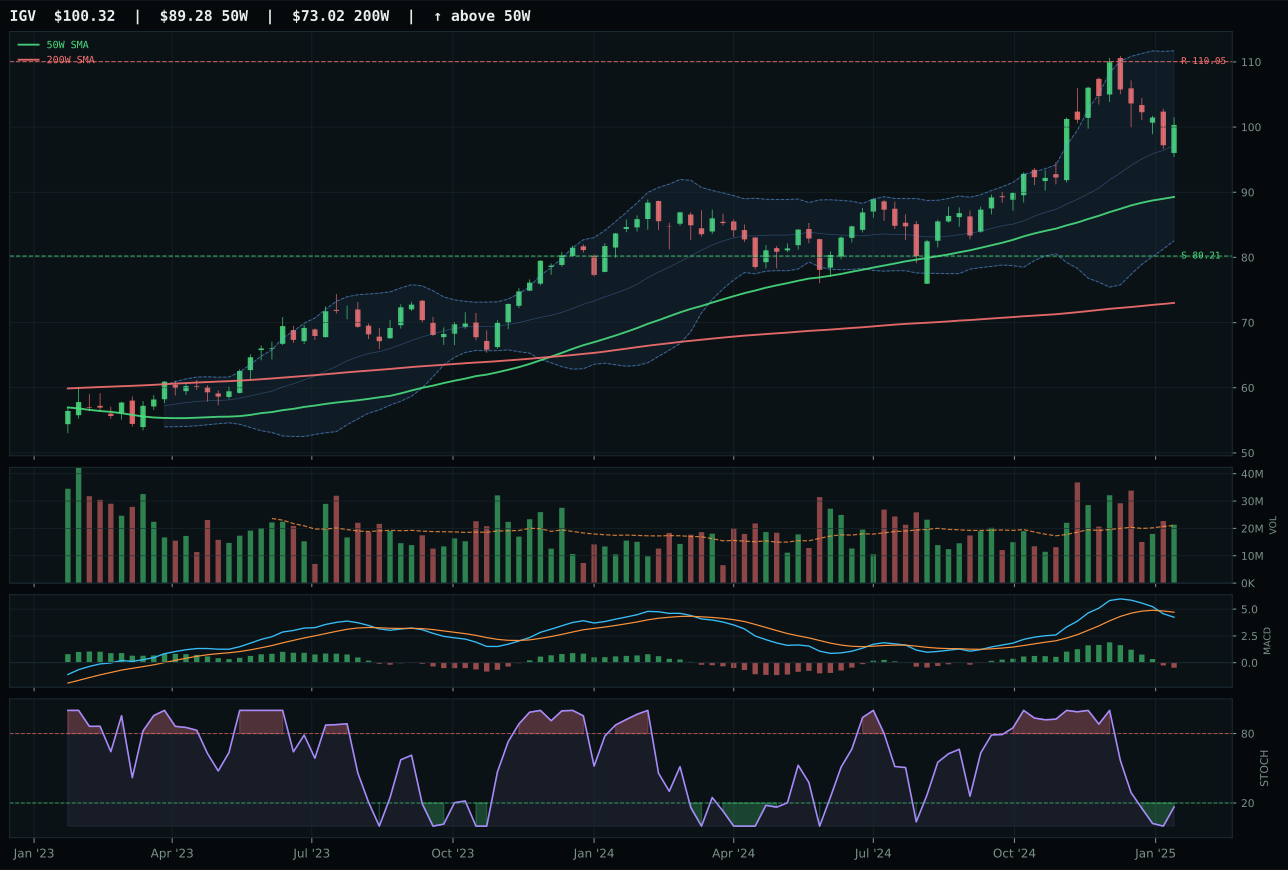
IGV has a neutral structure profile with 6.5% 13-week relative strength versus SPY.
A failed hold above support would weaken the setup.
Actionable but governed by invalidation levels.
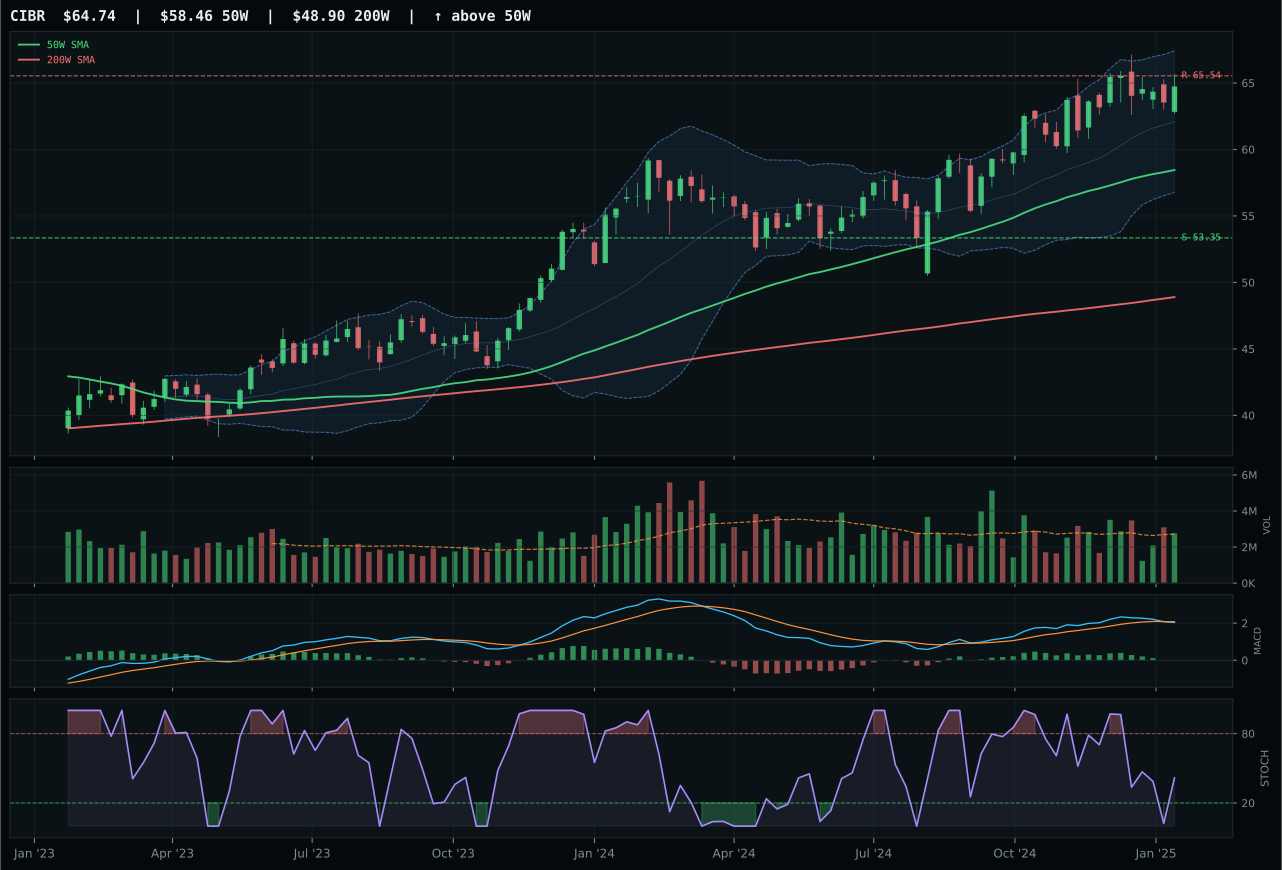
CIBR has a neutral structure profile with 1.7% 13-week relative strength versus SPY.
A failed hold above support would weaken the setup.
Actionable but governed by invalidation levels.
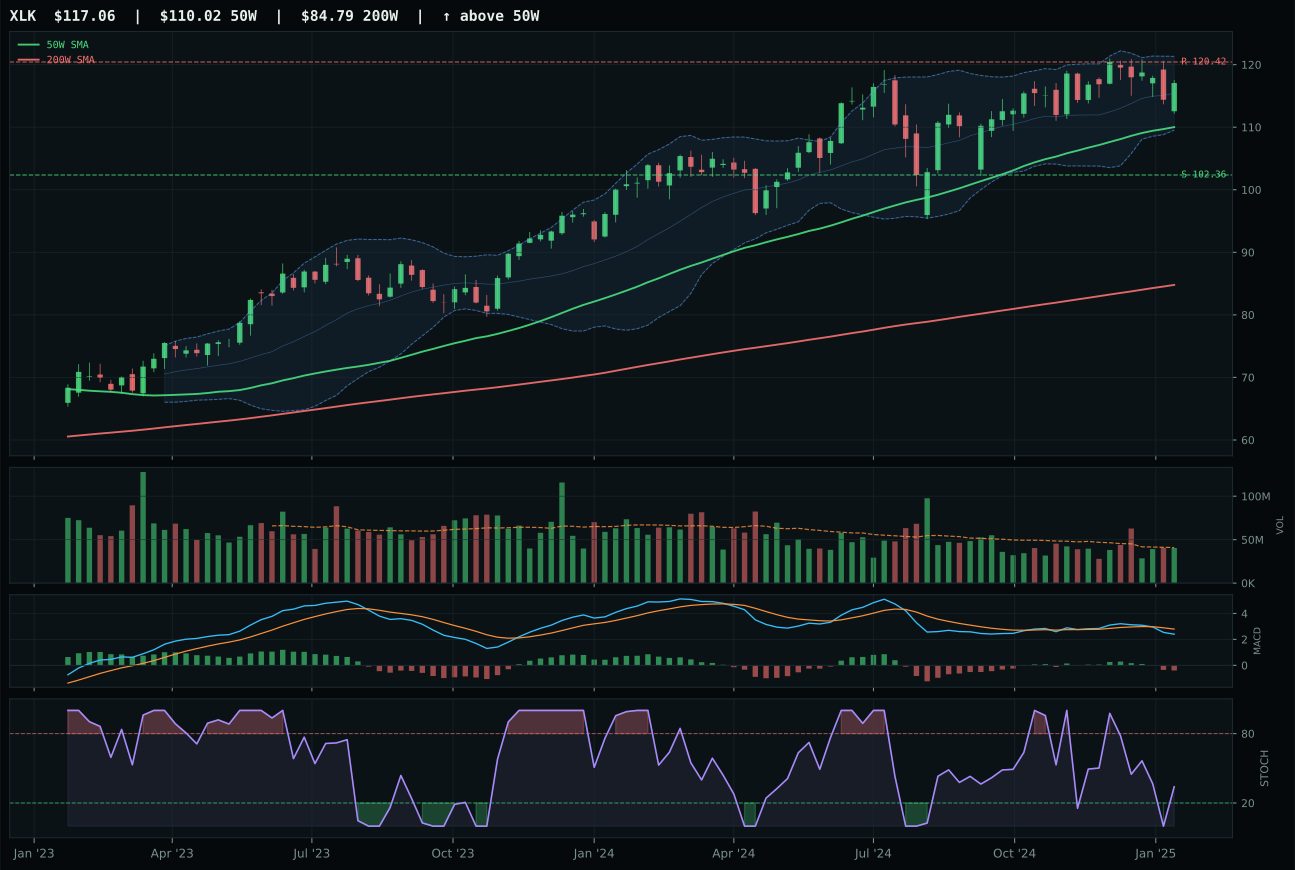
XLK has a neutral structure profile with -0.8% 13-week relative strength versus SPY.
A failed hold above support would weaken the setup.
Actionable but governed by invalidation levels.
CIBR won the category by assembling a cleaner structure (71.6 vs IGV's 67.8) and maintaining better category-relative momentum, despite trailing SPY-relative strength at 1.7%. The cybersecurity thesis sits above both the 50-week and 200-week moving averages with a gentle 0.3% slope, placing price 10.7% from the 50W in a neutral setup that rewards patience over urgency. IGV, the runner-up cloud/enterprise software play, carries higher absolute RS versus SPY at 6.5% but suffers from disinflation headwinds that are actively weighing on its macro fit—credit stress and liquidity stress each subtract significant points from its narrative support. CIBR's MACD is bearish but the structure is clean enough that the score reflects a setup waiting for confirmation rather than one already extended; stochastic RSI sits falling/neutral at 0.42, not overbought, meaning fresh accumulation could still drive the name higher without repricing risk asymmetrically.
Technology received 5% allocation as a tier-2 category, ranking below the two overweight sleeves but ahead of several structurally weaker alternatives. The category score of 34.3 reflects a 40.0/100 macro fit that is being actively hurt by liquidity stress (-10) and credit stress (-7), offsetting the disinflation tail wind (+5). The setup is technically sound—price is above key averages, compression is tight, and the representative ETF has room to move into resistance—but the macro environment is not sponsoring aggressive rotation into technology at this moment. Disinflation and declining real rates typically favor this sector, yet the active stress descriptors are eating into the case; an improvement in credit conditions or a sharp liquidation liquidation reversal would be needed to elevate this category into the top-2 allocation tier.
AI — SMH
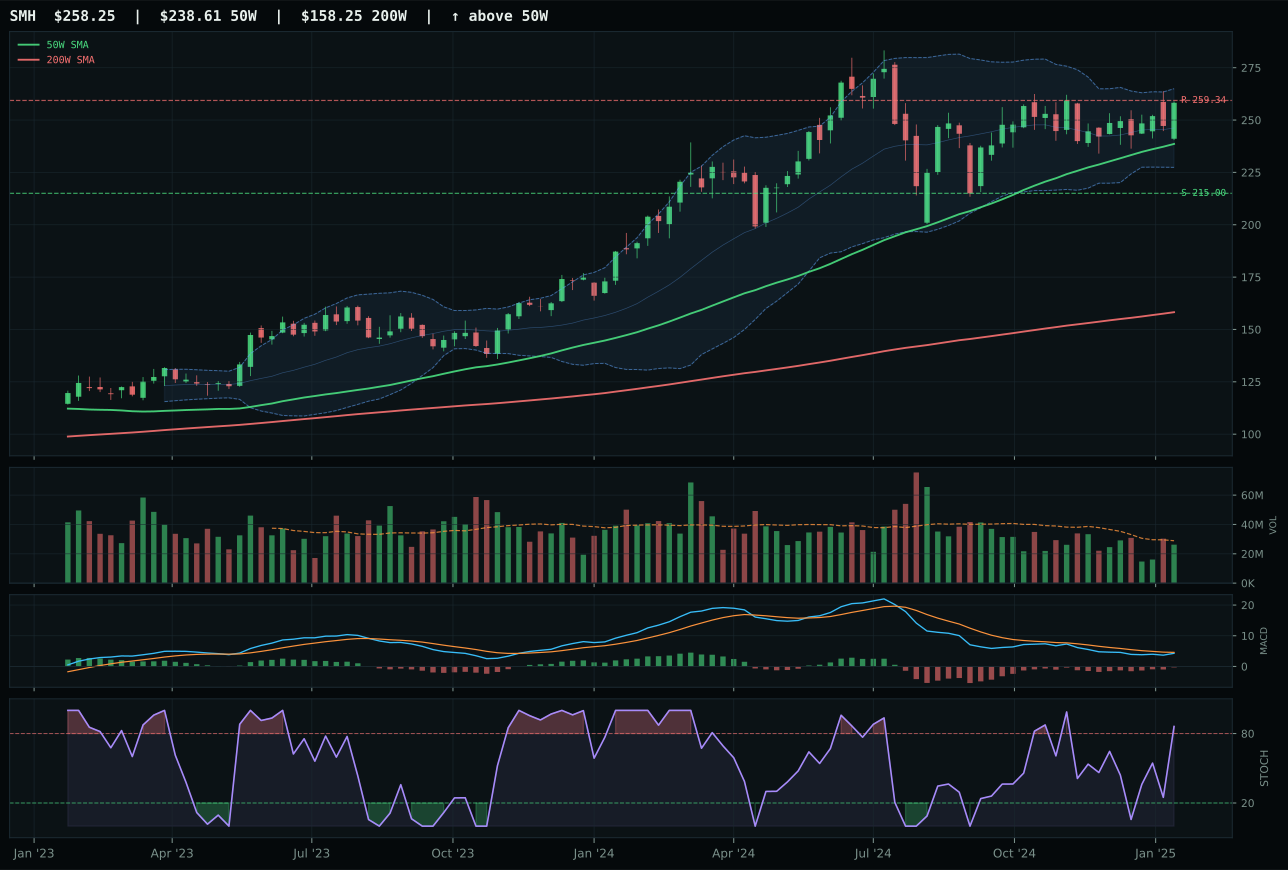
SMH has a neutral structure profile with 0.5% 13-week relative strength versus SPY.
A failed hold above support would weaken the setup.
Actionable but governed by invalidation levels.
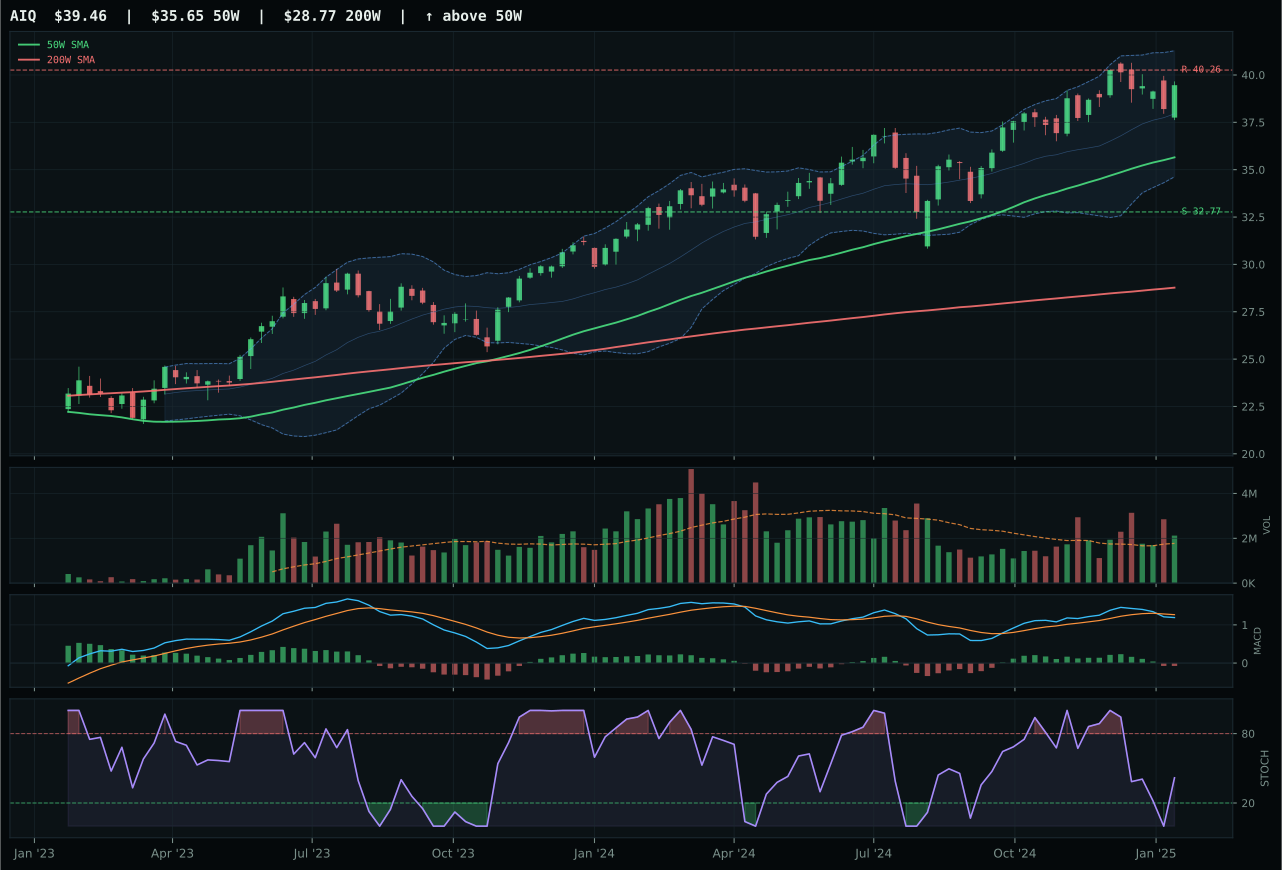
AIQ has a neutral structure profile with 2.3% 13-week relative strength versus SPY.
A failed hold above support would weaken the setup.
Actionable but governed by invalidation levels.
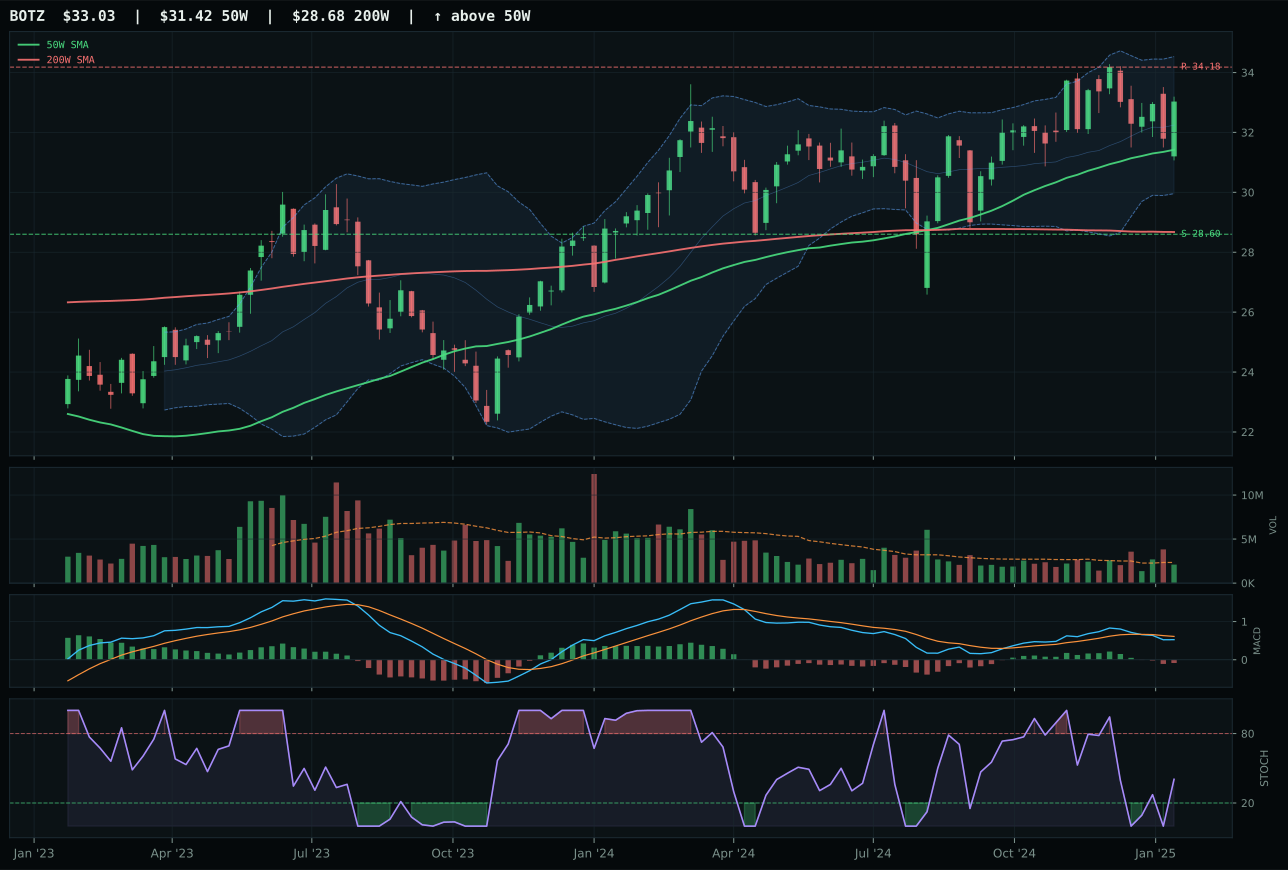
BOTZ has a neutral structure profile with 0.8% 13-week relative strength versus SPY.
A failed hold above support would weaken the setup.
Actionable but governed by invalidation levels.
SMH defeated AIQ by posting a superior trend score (93.7 vs 85) and momentum confirmation (66.2 vs 51), even though AIQ posted stronger 13W returns at 4.5% versus 2.7%. The semiconductor compute play sits comfortably above both the 50W and 200W with the tightest distance-to-50W among the three ETFs at 8.2%, placing it in an earlier-stage repair zone where volume and price action remain constructive. SMH's MACD is bearish but improving, and stochastic RSI has reached overbought momentum at 0.86—a signal that the move has drawn participation but is not yet exhausted. AIQ's structure is neutral and its volume is above-average, but the 2.3% SPY-relative strength over 13 weeks suggests the broader software/application breadth is being left behind by pure hardware leadership. The score gap of 3.8 points reflects SMH's technical clarity: a clean uptrend with improving momentum indicators, not a late-stage extension.
AI received 5% allocation as a tier-2 category, despite posting a category score of 29.6 that ranks notably below precious metals and energy. Liquidity stress is actively suppressing this sector at -12 points, while credit stress adds another -8 point headwind; disinflation helps at +5, but the macro regime is decidedly unfavorable for growth-dependent compute and semiconductor narratives. The representative ETF SMH has the technical setup to work—trend is strong, timing is early—but the portfolio cannot justify overweighting a category where five macro flags are flashing red. This allocation holds a small position pending either a sharp improvement in credit spreads or a shift in monetary conditions that would restore risk appetite to technology and AI-dependent equities.
Industrial Metals — COPX
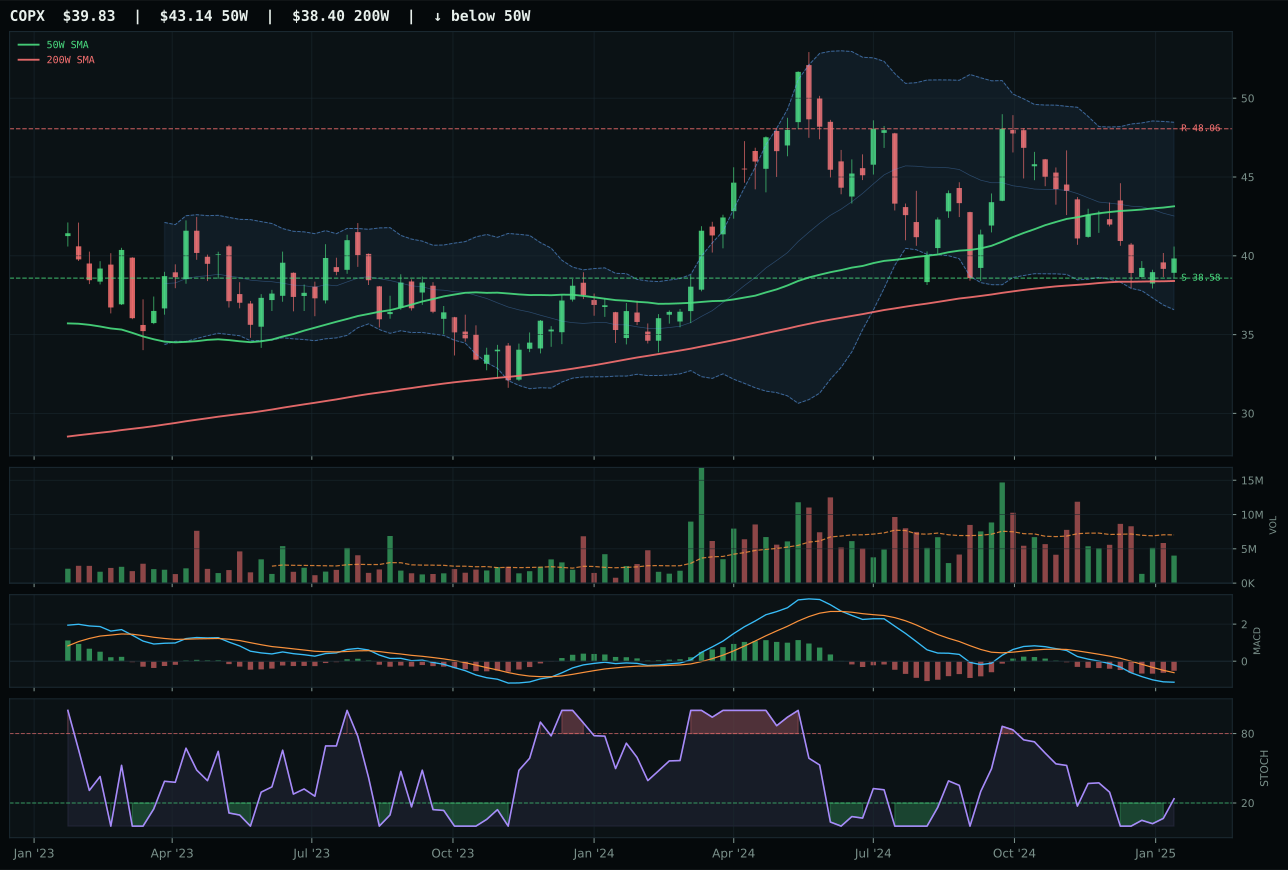
COPX has a pullback into support profile with -15.3% 13-week relative strength versus SPY.
A failed hold above support would weaken the setup.
Actionable but governed by invalidation levels.
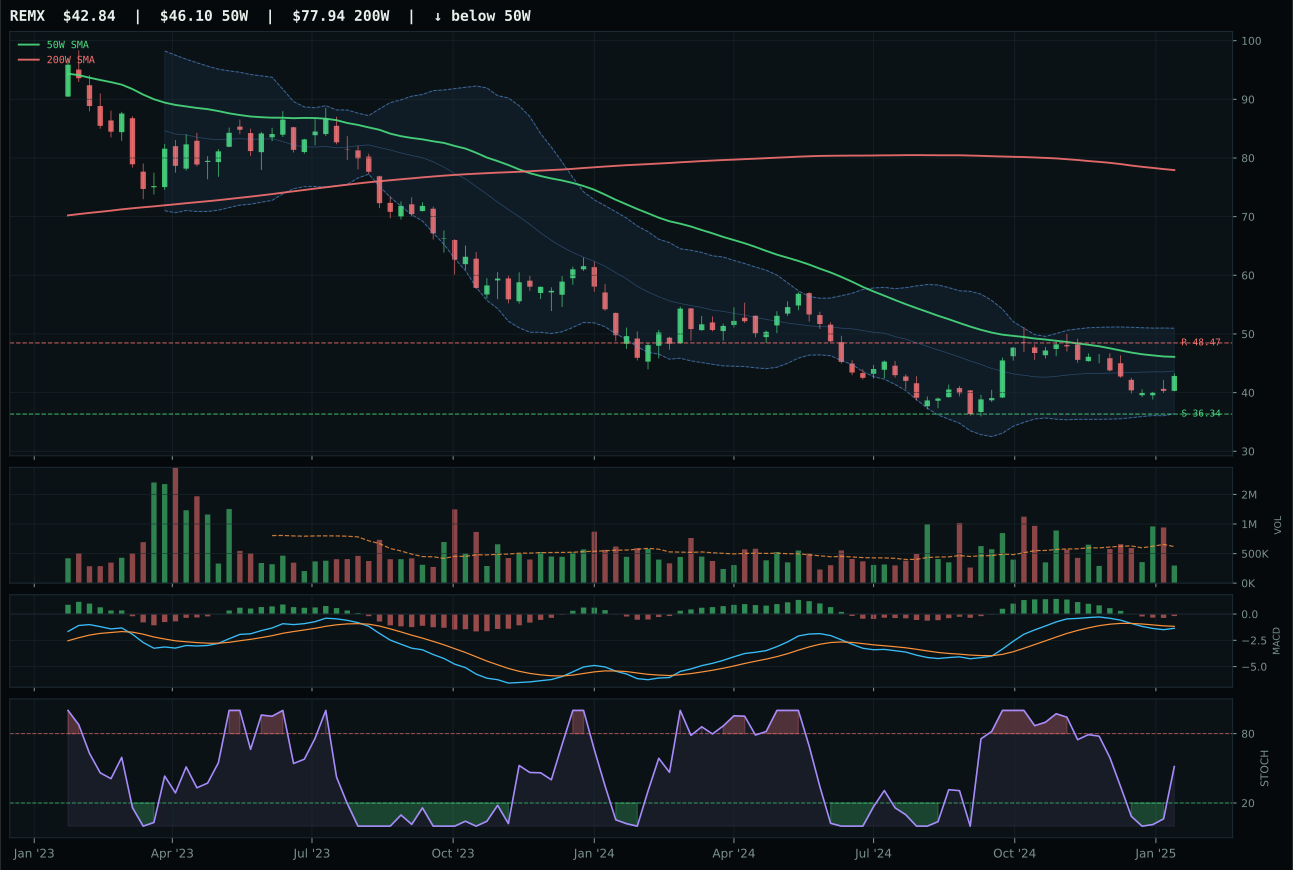
REMX has a neutral structure profile with -10.6% 13-week relative strength versus SPY.
Extension and support failure are the main tactical risks.
Tracked, but not top-2 eligible because: structurally broken.
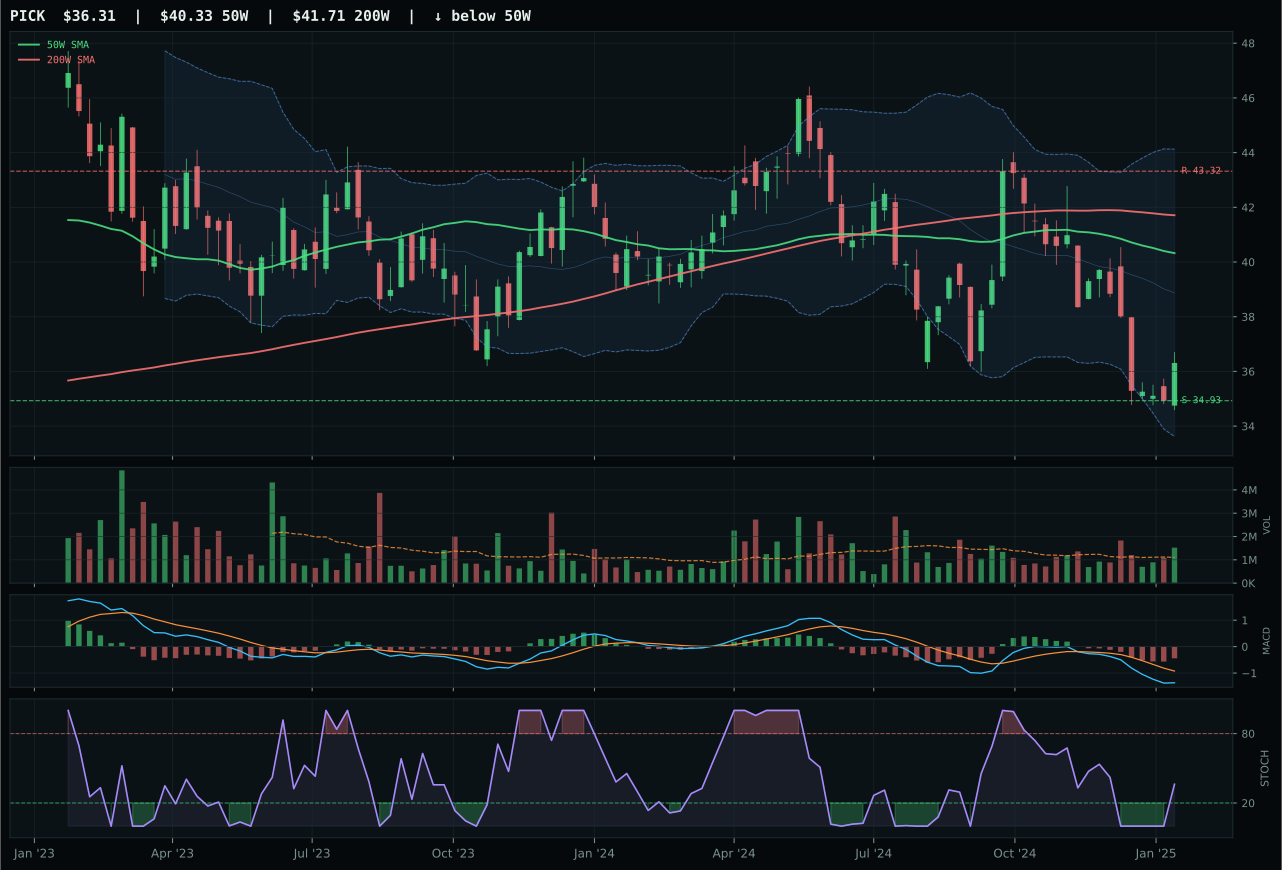
PICK has a pullback into support profile with -14.7% 13-week relative strength versus SPY.
Extension and support failure are the main tactical risks.
Tracked, but not top-2 eligible because: structurally broken.
COPX won the industrial metals category despite a composite score of only 56/100 because it offers the only clean technical setup in a basket of broken structures. Copper sits -7.7% below its 50W but above the 200W in a textbook pullback-into-support pattern, with support crisply defined at 38.58 and resistance at 48.06—a risk/reward of 90.0/100 that reflects a 3.2% downside and -17.1% upside asymmetry. The timing score of 100.0/100 is the key differentiator: MACD is bearish but improving, stochastic RSI is rising mid-zone at 0.24 in the deep retracement zone near Fib 0.618, and price is positioned exactly where accumulation into support typically begins. REMX is structurally broken with no clean support, and PICK offers similar retracement setup but weaker momentum confirmation. COPX's 13W return is negative at -13.1% and RS versus SPY sits at -15.3%—terrible momentum metrics—but the setup's mechanical beauty (defined support, improving MACD, rising stochastic) trumps the trend score of 53.0. This is a category playing defense, not offense.
Industrial Metals received 5% allocation as a tier-3 category with a final score of 29.2, ranking in the lower-middle of the allocation tiers. The macro environment is split: metals scarcity is active at +14 and commodity breadth positive at +10, but liquidity stress at -8 and credit stress at -7 are real headwinds. The category-level macro fit of 58.0/100 is moderate—metals are benefiting from the supply-scarcity narrative, but industrial demand is soft in a disinflation regime. COPX's technical setup (pullback into support, improving MACD, defined risk) justifies holding the position, but the -15.3% SPY relative weakness over 13 weeks signals that the industrial cycle is not yet rewarding these exposures. This allocation holds as a scarcity play, but will be reduced if support at 38.58 breaks or if the supply narrative deteriorates.
Agriculture & Livestock — MOO
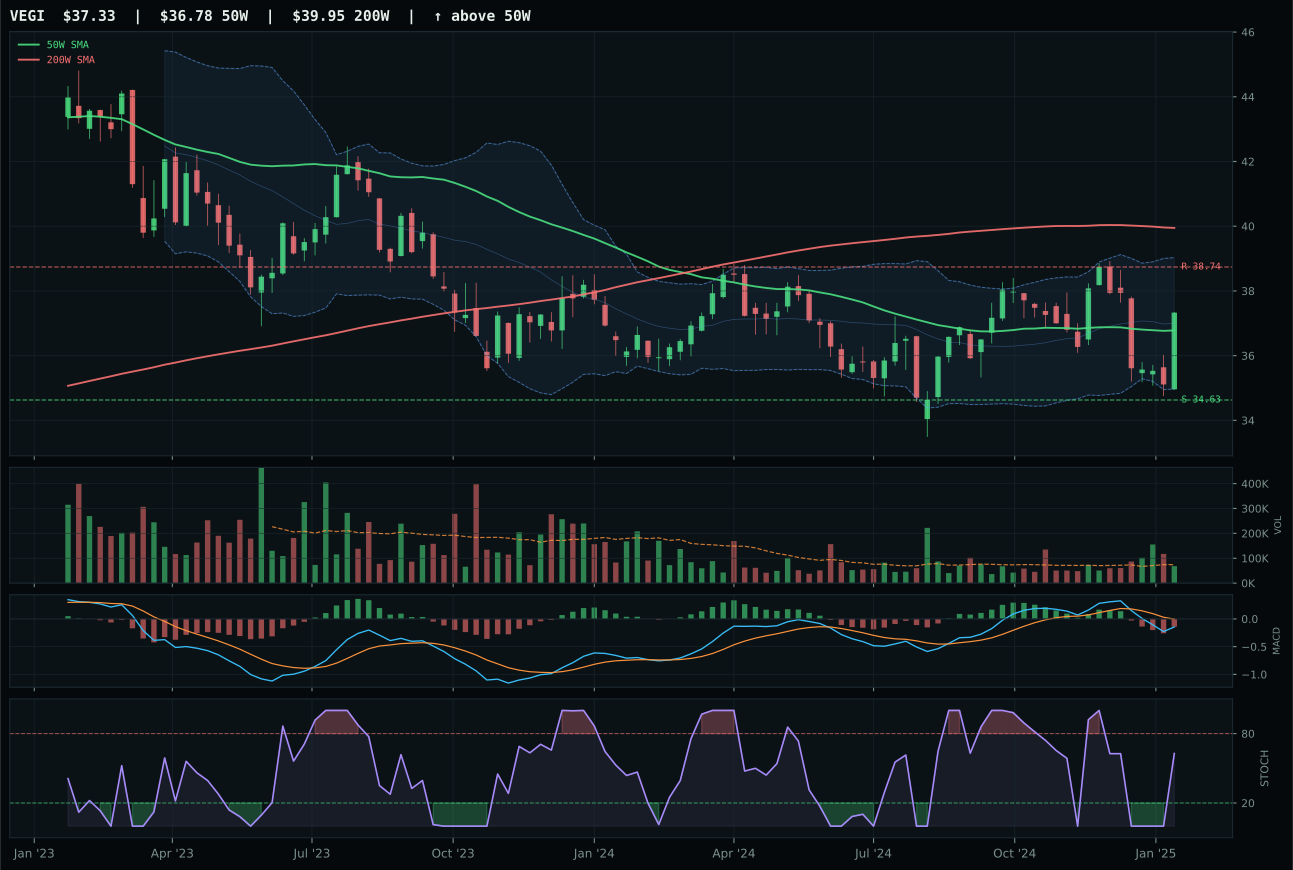
VEGI has a compression near 50W profile with -2.6% 13-week relative strength versus SPY.
A failed hold above support would weaken the setup.
Tracked, but not top-2 eligible because: .
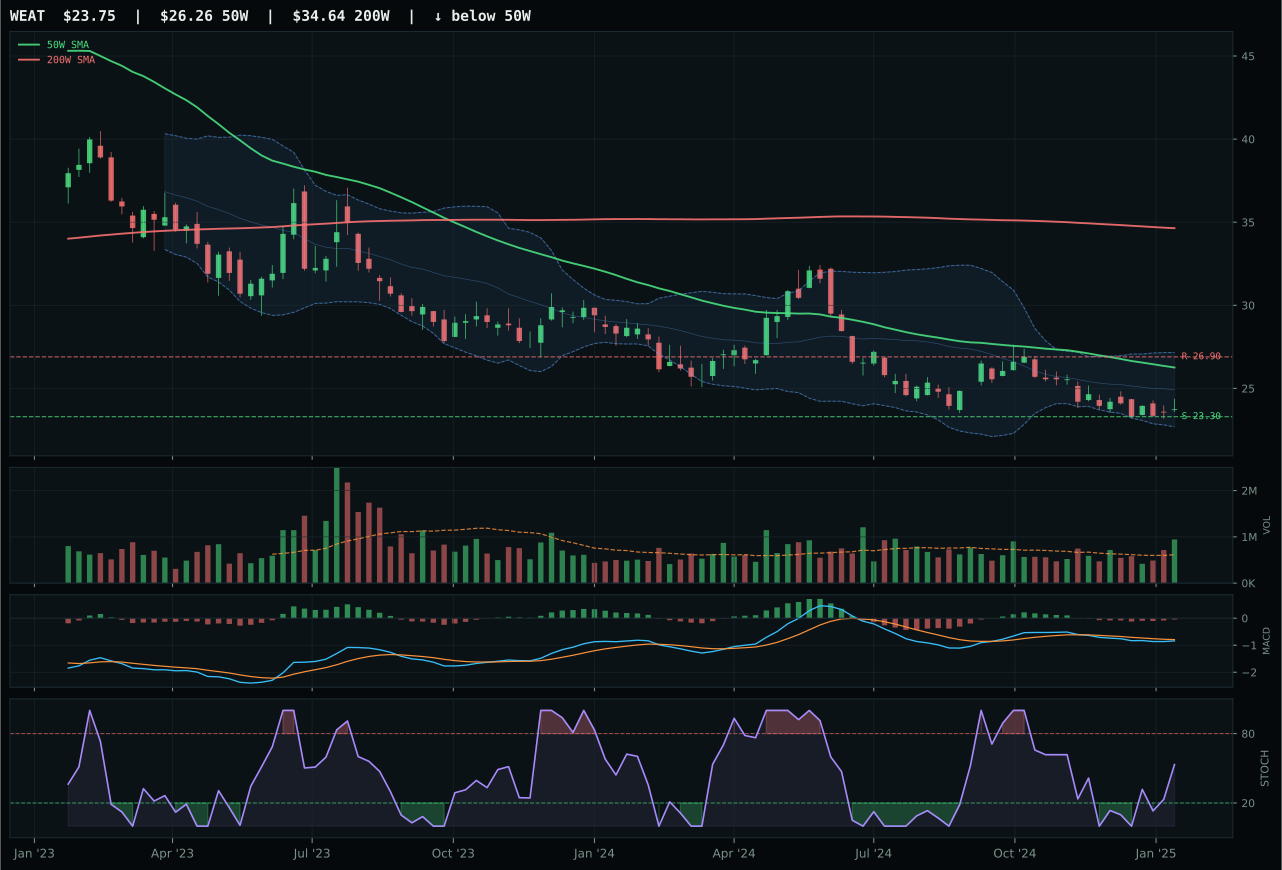
WEAT has a pullback into support profile with -9.8% 13-week relative strength versus SPY.
Extension and support failure are the main tactical risks.
Tracked, but not top-2 eligible because: structurally broken.
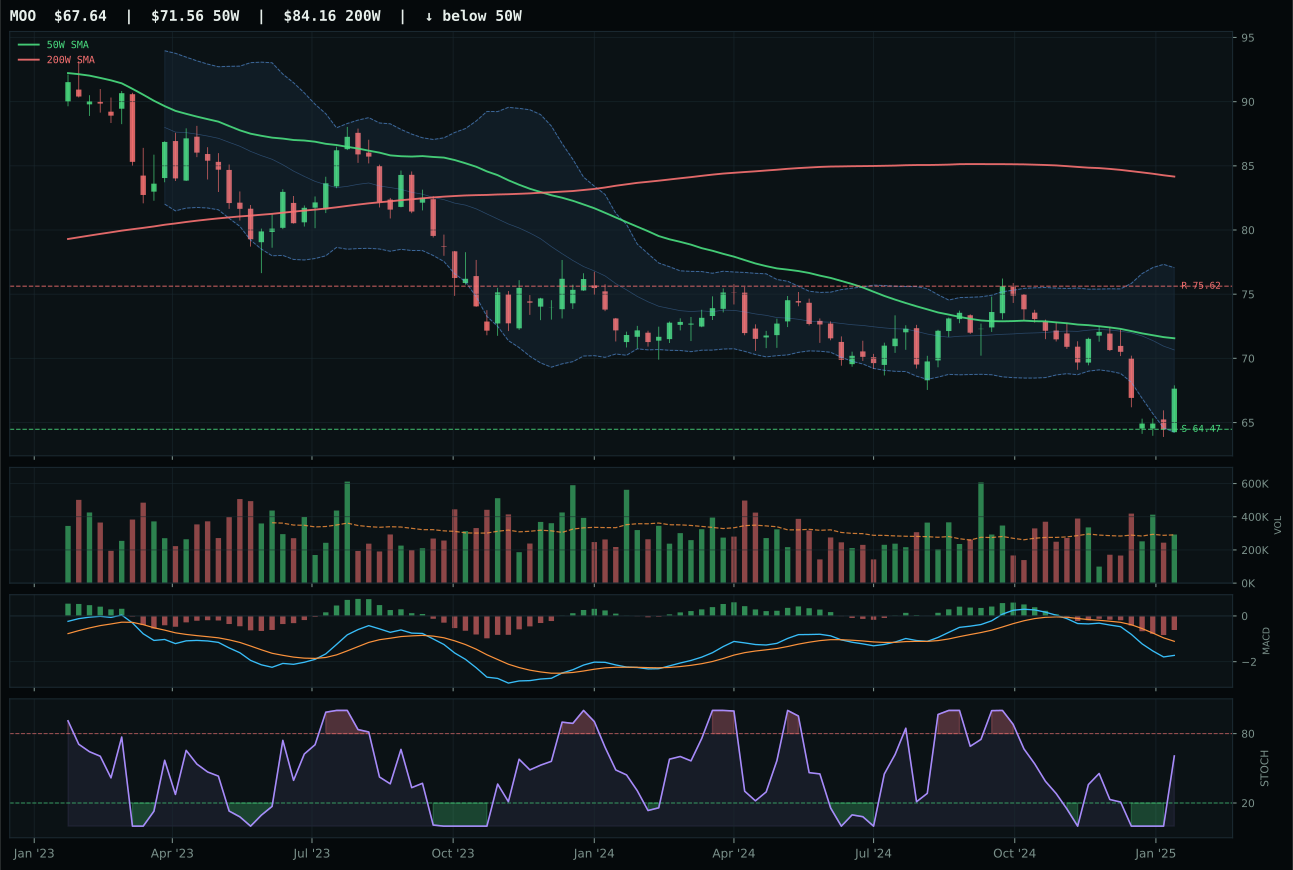
MOO has a pullback into support profile with -9.7% 13-week relative strength versus SPY.
Extension and support failure are the main tactical risks.
Tracked, but not top-2 eligible because: structurally broken.
MOO won the agriculture category despite posting a composite score of 12/100, the lowest in its peer set, because the other two candidates (VEGI and WEAT) were structurally more broken. MOO's risk/reward is exceptional at 91.6/100—the ETF sits -5.5% from its 50W with support defined at 64.47 and resistance at 75.62, creating a 4.9% downside risk and -10.6% upside to resistance. This asymmetry is the core of why MOO wins: it is pulling into support in the deep retracement zone near Fib 0.618, giving the setup a mechanical entry point if buyers step in. VEGI's compression near the 50W offers poor risk/reward at 53.4, and WEAT trades even further extended. MOO's trend is broken at 12.5/100, MACD is bearish/weakening, momentum is near zero at 14.8/100, and the 13W return is negative at -7.4%—all red flags. However, the timing score of 88.0 recognizes that this is when broken assets often offer the best asymmetry, and MOO's structure pulls cleanly into support rather than hanging in compression.
Agriculture & Livestock received 0% allocation this week, excluded from the portfolio entirely and ranking 9th or 10th among all categories. The final score of 10.3 reflects a macro regime actively hostile to real asset commodities: disinflation pressure subtracts -8 points, commodity breadth positive adds only +5, and the technical representative (MOO) is ineligible due to its collapsed trend and momentum scores. The category's macro fit is 45.0/100, but the weighted category score after testing the 3/2/1 basket against eligibility filters is 10.3—well below the threshold for inclusion. Real asset sponsorship is active at +8, but it cannot overcome the broad disinflation headwind and the fact that all three ETFs in the basket are broken technically. Allocation will return to this space only if trend improves materially or if a macro shift—toward inflation surprise or supply shock—rebalances the risk regime.
Emerging Markets — INDA
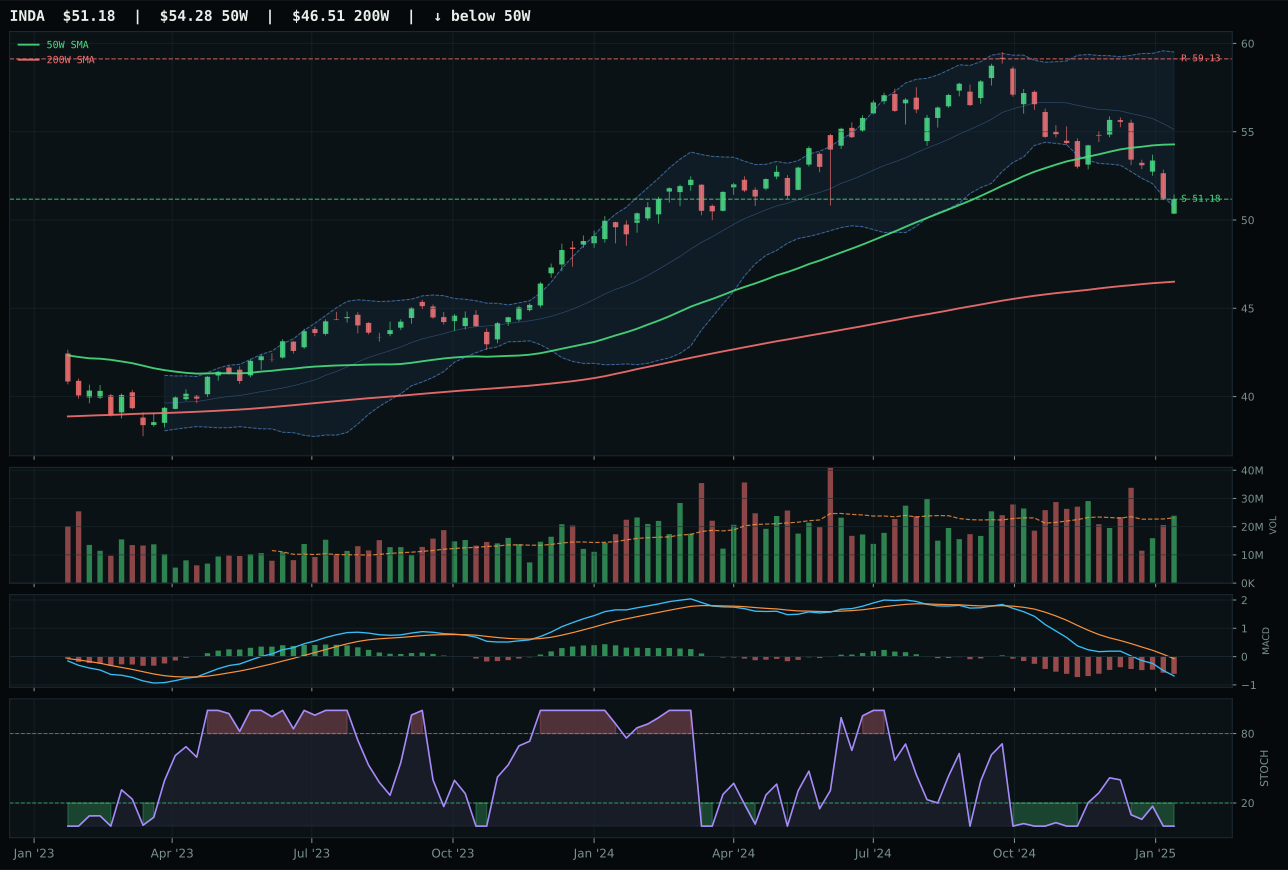
INDA has a pullback into support profile with -11.7% 13-week relative strength versus SPY.
A failed hold above support would weaken the setup.
Actionable but governed by invalidation levels.
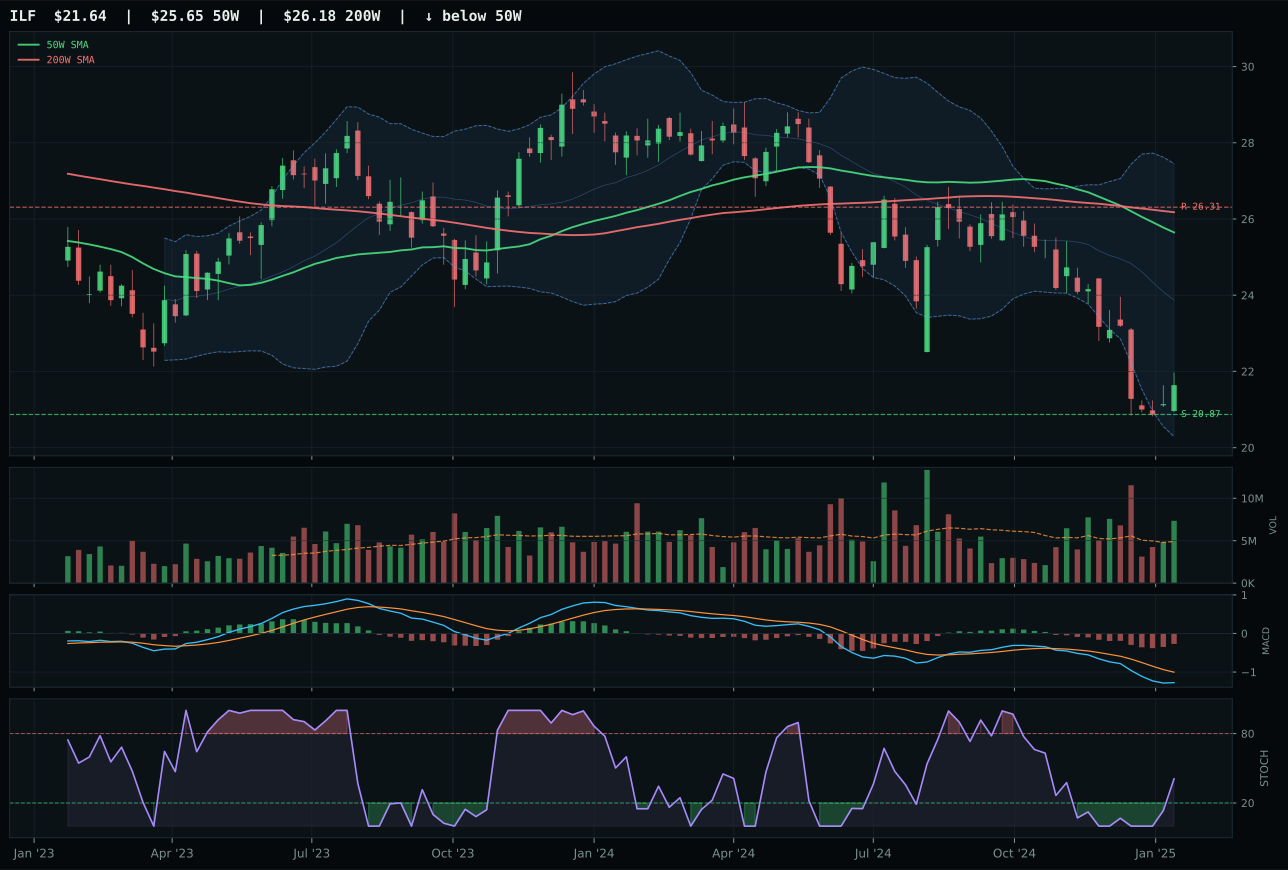
ILF has a pullback into support profile with -16.6% 13-week relative strength versus SPY.
Extension and support failure are the main tactical risks.
Tracked, but not top-2 eligible because: structurally broken.
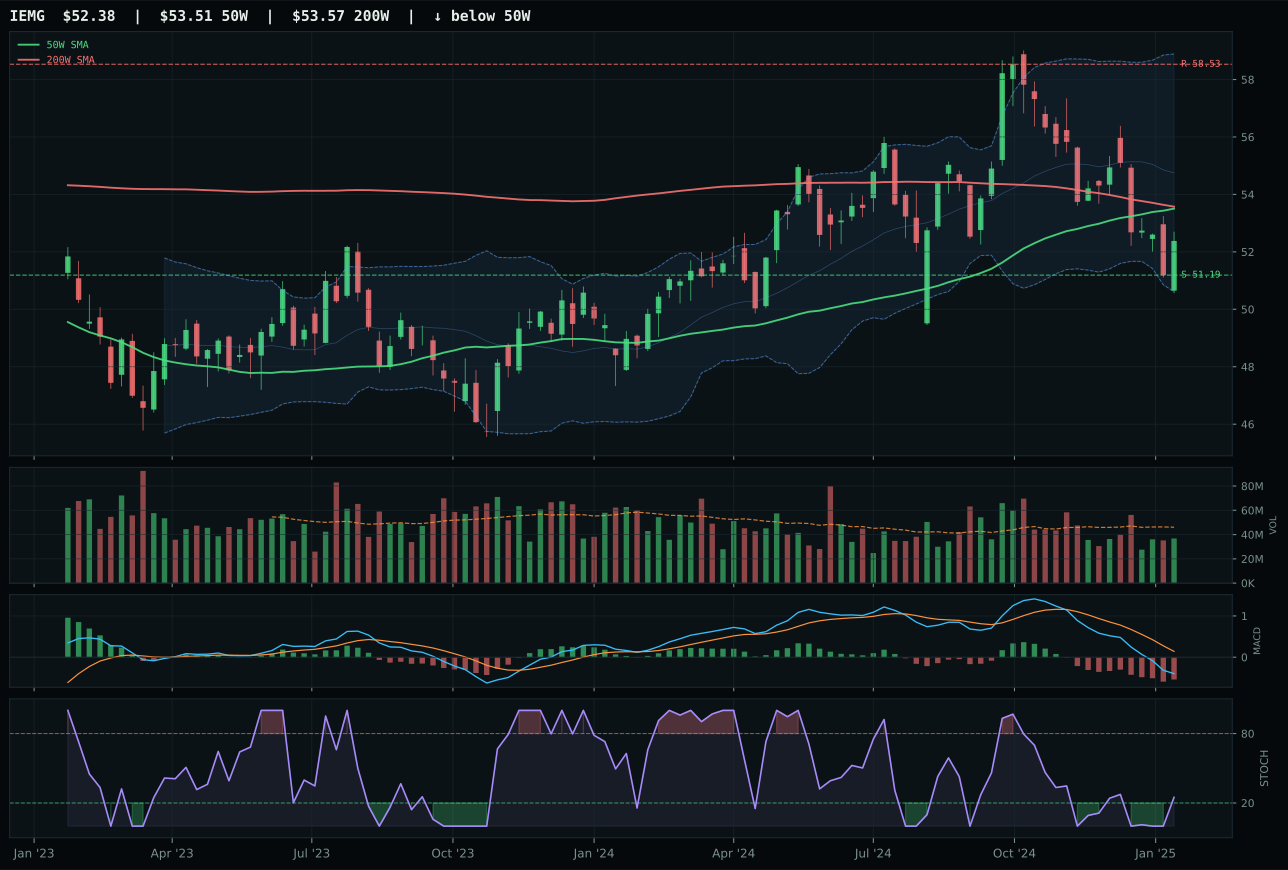
IEMG has a pullback into support profile with -10.8% 13-week relative strength versus SPY.
Extension and support failure are the main tactical risks.
Tracked, but not top-2 eligible because: structurally broken.
INDA won the emerging markets category but the victory is hollow: all three candidates are technically insolvent. INDA posts a composite score of 52/100 versus ILF's 13/100 and IEMG's 22/100, but the margin reflects only that INDA's pullback-into-support structure (support at 51.18) is cleaner than its peers' broken patterns. India sits below its 50W by 5.7%, above the 200W, with a stochastic RSI reading of oversold at 0.00—a signal that sellers are exhausted but not yet that buyers are in. MACD is bearish/weakening and momentum confirmation is zero at 0.0/100, the lowest possible score; the 13W return of -9.5% and -11.7% SPY-relative weakness confirm that emerging-market equities are being abandoned. Timing score is 87.0/100 because price is so deep in the retracement zone (Fib 0.786) that downside risk is mechanical—only 0.0% to support versus -13.4% to resistance. This is a category of broken momentum and broken trends; INDA merely looks least broken.
Emerging Markets received 0% allocation this week, excluded from the portfolio entirely and ranking as one of the worst-scoring categories at 0.0. The macro regime is actively hostile: dollar pressure at -14, credit stress at -10, liquidity stress at -10, and broad market bear at -9 combine to create a category-level macro fit of just 7.0/100. No amount of technical retracement beauty can overcome a regime where the dollar is strong, credit is stressed, and EM carry trades are being unwound. The representative ETF INDA is eligible at 52/100 composite, but the final category score after testing the 3/2/1 basket collapsed to 0.0 due to failed persistence and volume-price confirmation—the oversold stochastic is a flag of capitulation, not accumulation. This allocation will not return until emerging currencies stabilize, credit spreads narrow, or dollar strength reverses; a near-term technical bounce in INDA is possible but insufficient to restore portfolio allocation.