
2025-01-10
Informational purposes only. The content in this report, including allocations, analysis, and commentary, is provided solely for informational and educational purposes. It does not constitute financial advice, investment advice, trading advice, or any other type of advice. Past performance does not guarantee future results. Always conduct your own research and consult a qualified financial professional before making investment decisions.
Weekly Allocation
| Ticker | Category | Weight | Role |
|---|---|---|---|
| FBTC | 50% | Overlay | |
| GLD | Precious Metals | 10% | Top-2 (10%) |
| XLU | Utilities & Infrastructure | 10% | Top-2 (10%) |
| XAR | Defense & Aerospace | 5% | Tier-2 (5%) |
| CIBR | Technology | 5% | Tier-2 (5%) |
| COPX | Industrial Metals | 5% | Tier-2 (5%) |
| INDA | Emerging Markets | 5% | Tier-2 (5%) |
| NLR | Nuclear Energy | 5% | Tier-2 (5%) |
| WEAT | Agriculture & Livestock | 5% | Tier-2 (5%) |
Trade Instructions — Monday Open
Sell the tranche from 2024-12-13 (completing its 4-week hold). Buy the new tranche. Instructions show net portfolio changes — same-asset positions cancel, weight changes show the delta.
| Action | Ticker | Instruction |
|---|---|---|
| SELL | CIBR | Sell 17% of CIBR position (reduce 7.50% → 6.25%) |
| SELL | NLR | Sell 25% of NLR position (reduce 5.00% → 3.75%) |
| SELL | AIQ | Sell 50% of AIQ position (reduce 2.50% → 1.25%) |
| SELL | IGF | Sell 50% of IGF position (reduce 2.50% → 1.25%) |
| SELL | MOO | Sell 50% of MOO position (reduce 2.50% → 1.25%) |
| BUY | GLD | Buy GLD — 20.00% of freed cash (adds 1.25% to portfolio) |
| BUY | XLU | Buy XLU — 40.00% of freed cash (adds 2.50% to portfolio) |
| BUY | INDA | Buy INDA — 20.00% of freed cash (adds 1.25% to portfolio) |
| BUY | WEAT | Buy WEAT — 20.00% of freed cash (adds 1.25% to portfolio) |
Current Portfolio After Trade
Combined holdings across all 4 active tranches. Each tranche is 25% of the portfolio.
| Ticker | % of Portfolio | Weight Bar |
|---|---|---|
| FBTC | 50.00% | |
| GLD | 7.50% | |
| CIBR | 6.25% | |
| XAR | 5.00% | |
| XLU | 5.00% | |
| INDA | 5.00% | |
| NLR | 3.75% | |
| COPX | 2.50% | |
| XLK | 2.50% | |
| SLV | 2.50% | |
| SMH | 2.50% | |
| XLE | 2.50% | |
| AIQ | 1.25% | |
| IGF | 1.25% | |
| MOO | 1.25% | |
| WEAT | 1.25% |
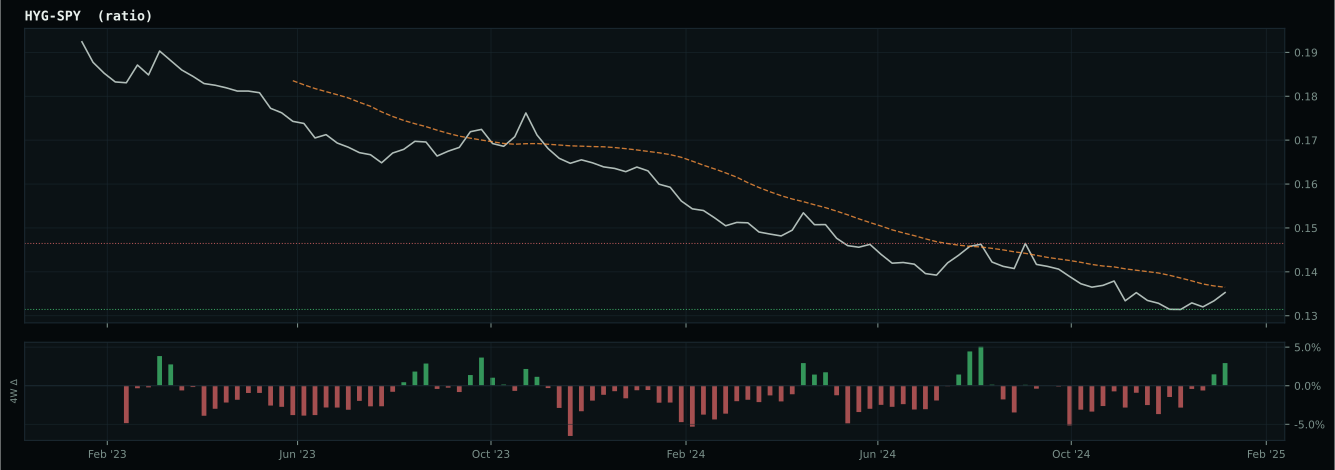
Macro Regime — Disinflation
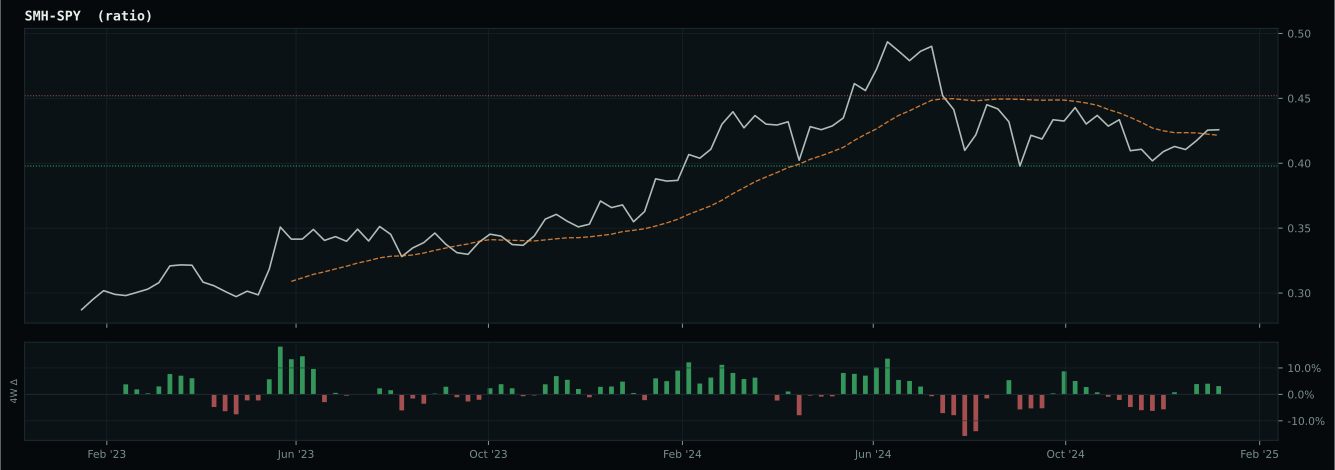
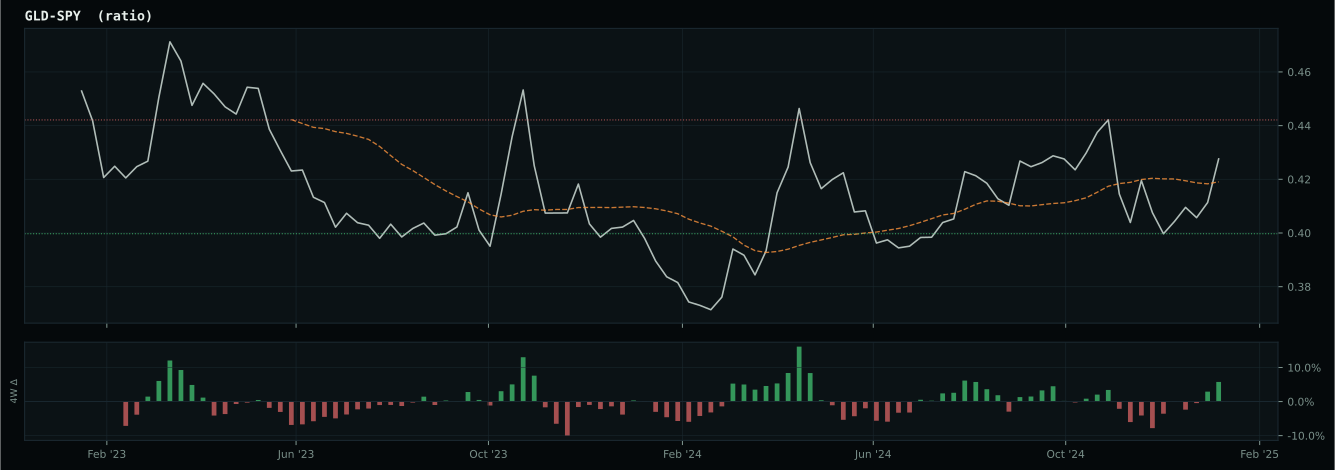
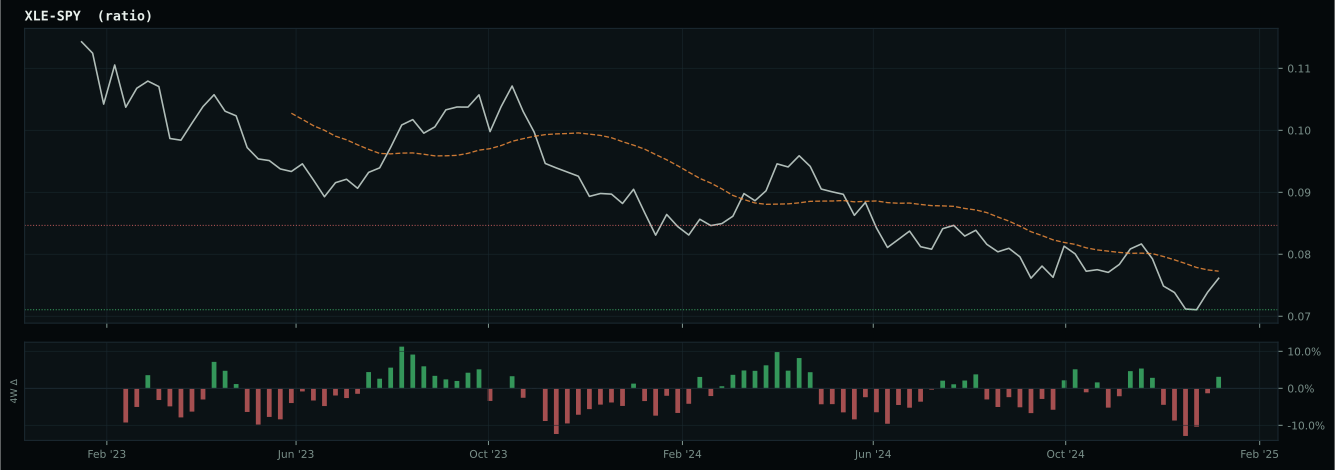
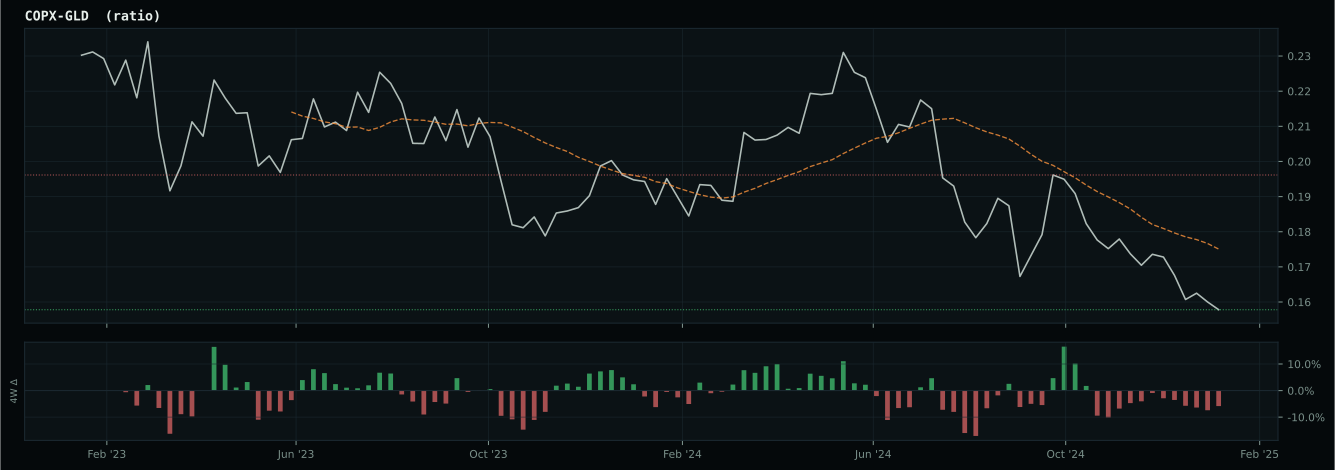
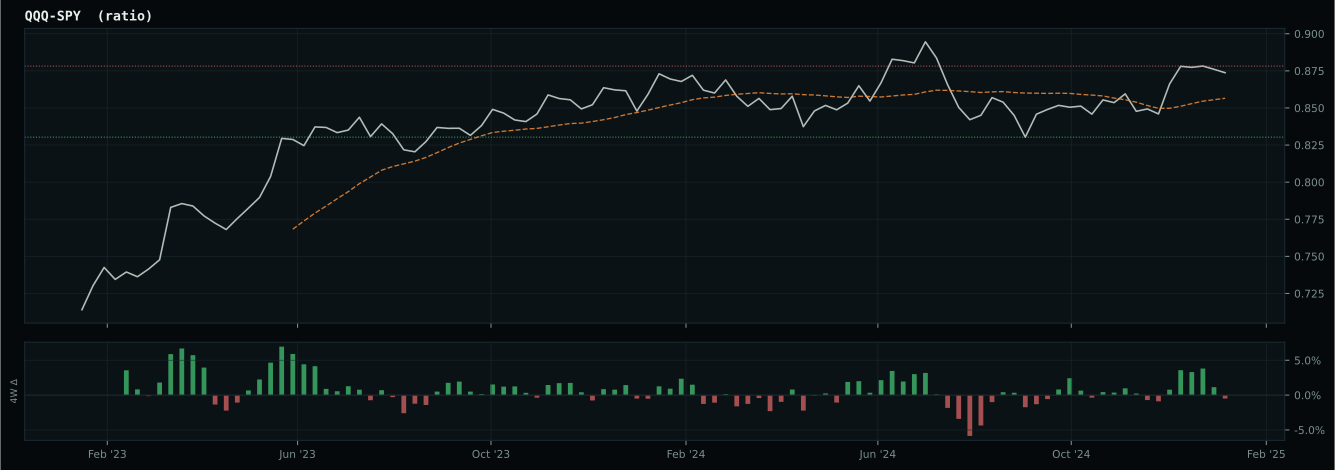
Macro Evidence Charts
Market-implied signals behind the macro regime scores. Each ratio compares two assets; the direction and slope of the ratio is what the macro engine reads.
Crypto Regime — TrendBTC
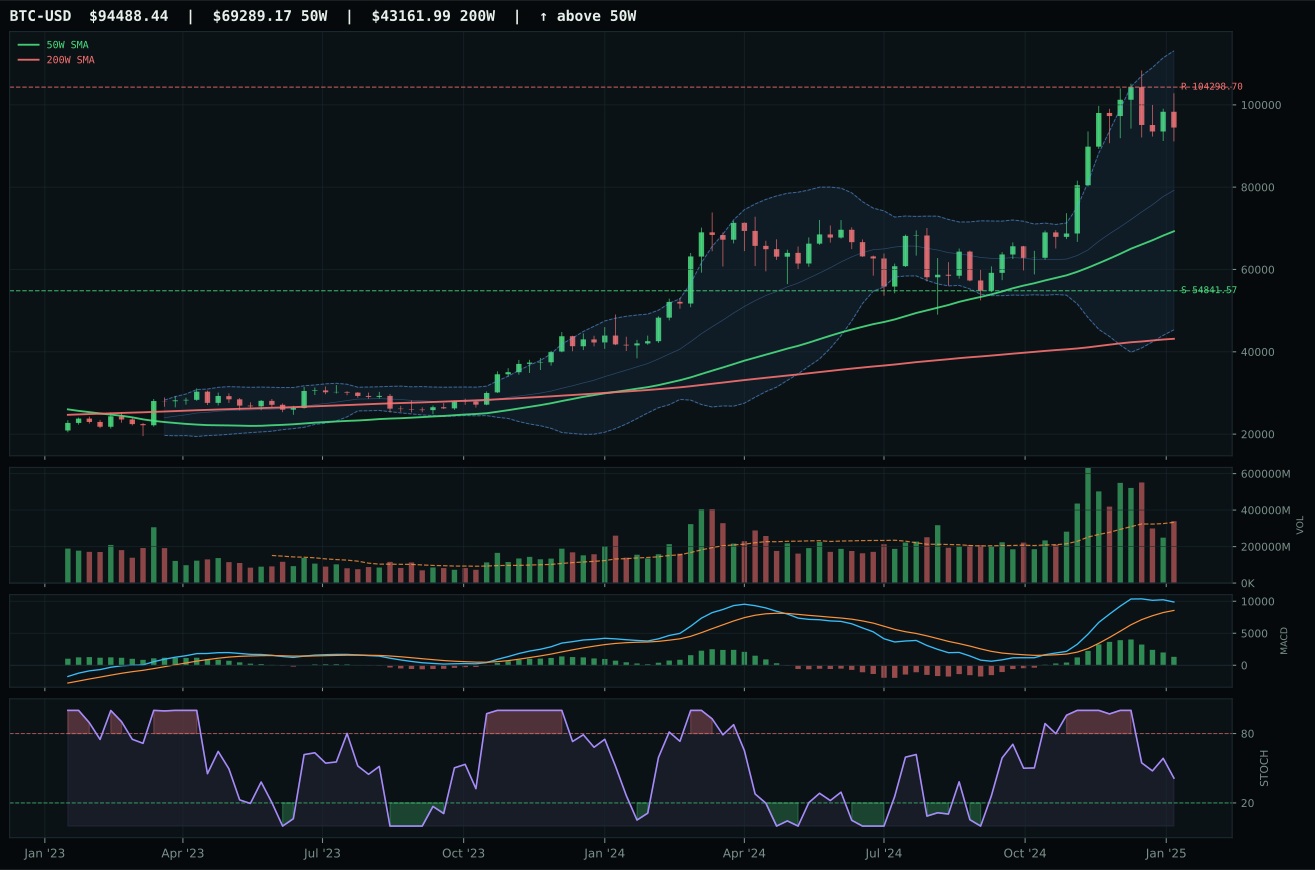
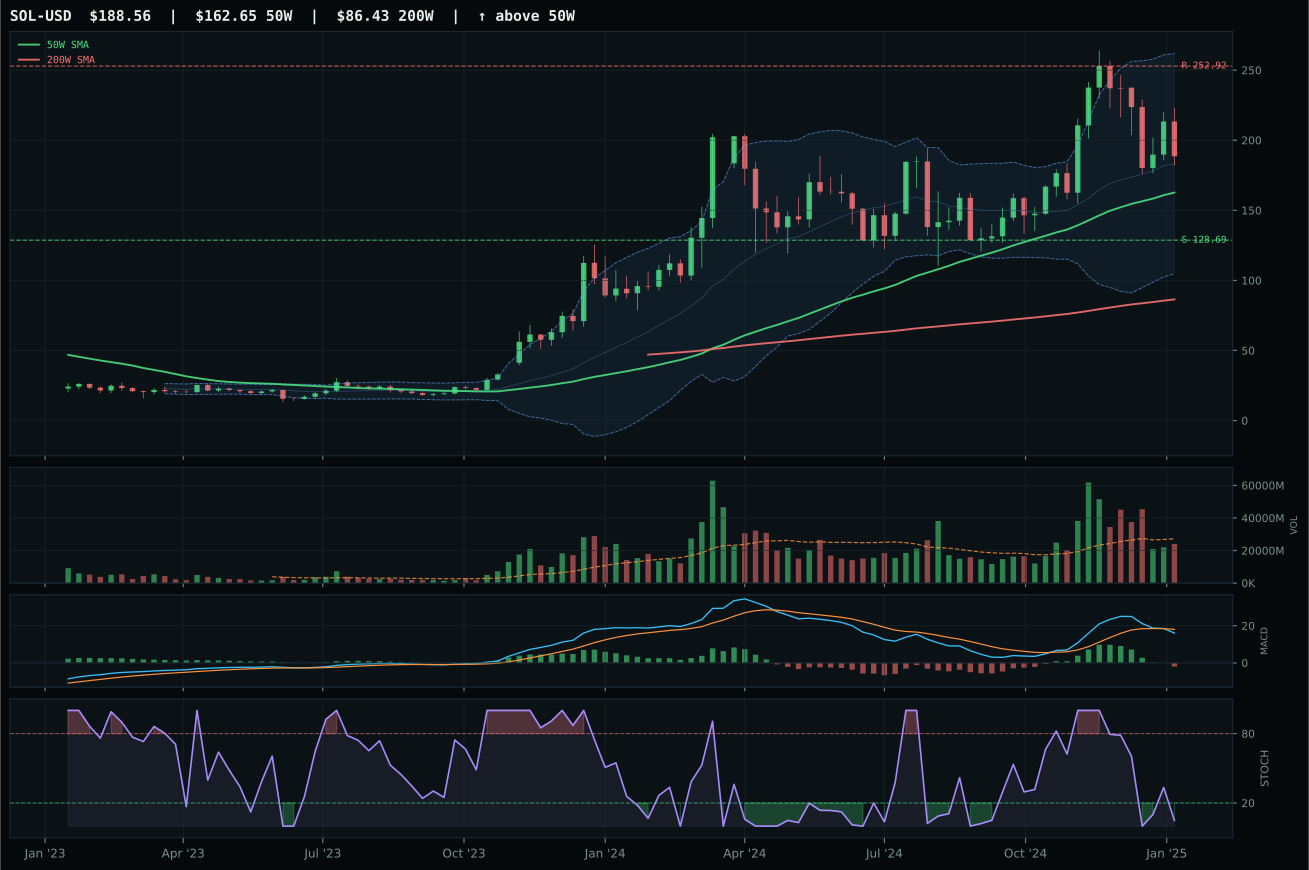
ValueBTC not armed: BTC has not made the first post-breakdown touch of the 200W buy zone after losing the 50W
TrendBTC confirmed: 2 consecutive closes above rising/flat 50W SMA
one or more available conditions failed
Category Rankings
| Rank | Category | Winner | Score | Alloc | 4W Ret | Peers (4W) |
|---|---|---|---|---|---|---|
| 1 | Precious Metals | GLD | 54.9 | 20% | +8.79% | SLV +8.0% · GDX +17.7% |
| 2 | Utilities & Infrastructure | XLU | 44.4 | 20% | +3.79% | IGF +3.3% · PAVE +5.9% |
| 3 | Defense & Aerospace | XAR | 41.4 | 10% | +5.93% | ROKT +4.0% · ITA +9.4% |
| 4 | Technology | CIBR | 32.5 | 10% | +11.41% | IGV +10.1% · XLK +4.2% |
| 5 | Nuclear Energy | NLR | 19.5 | 10% | +10.21% | URA +9.5% · URNM +1.1% |
| 6 | AI | SMH | 11.5 | 10% | +2.46% | AIQ +9.6% · BOTZ +8.7% |
| 7 | Traditional Energy | FCG | 10.7 | 10% | -4.44% | XOP -4.0% · XLE +0.6% |
| 8 | Agriculture & Livestock | WEAT | — | 10% | +8.65% | MOO +4.7% · VEGI +6.1% |
| 9 | Industrial Metals | COPX | — | 0% | +7.27% | REMX +3.5% · PICK +6.5% |
| 10 | Emerging Markets | INDA | — | 0% | +0.10% | IEMG +6.7% · ILF +12.4% |
Precious Metals — GLD
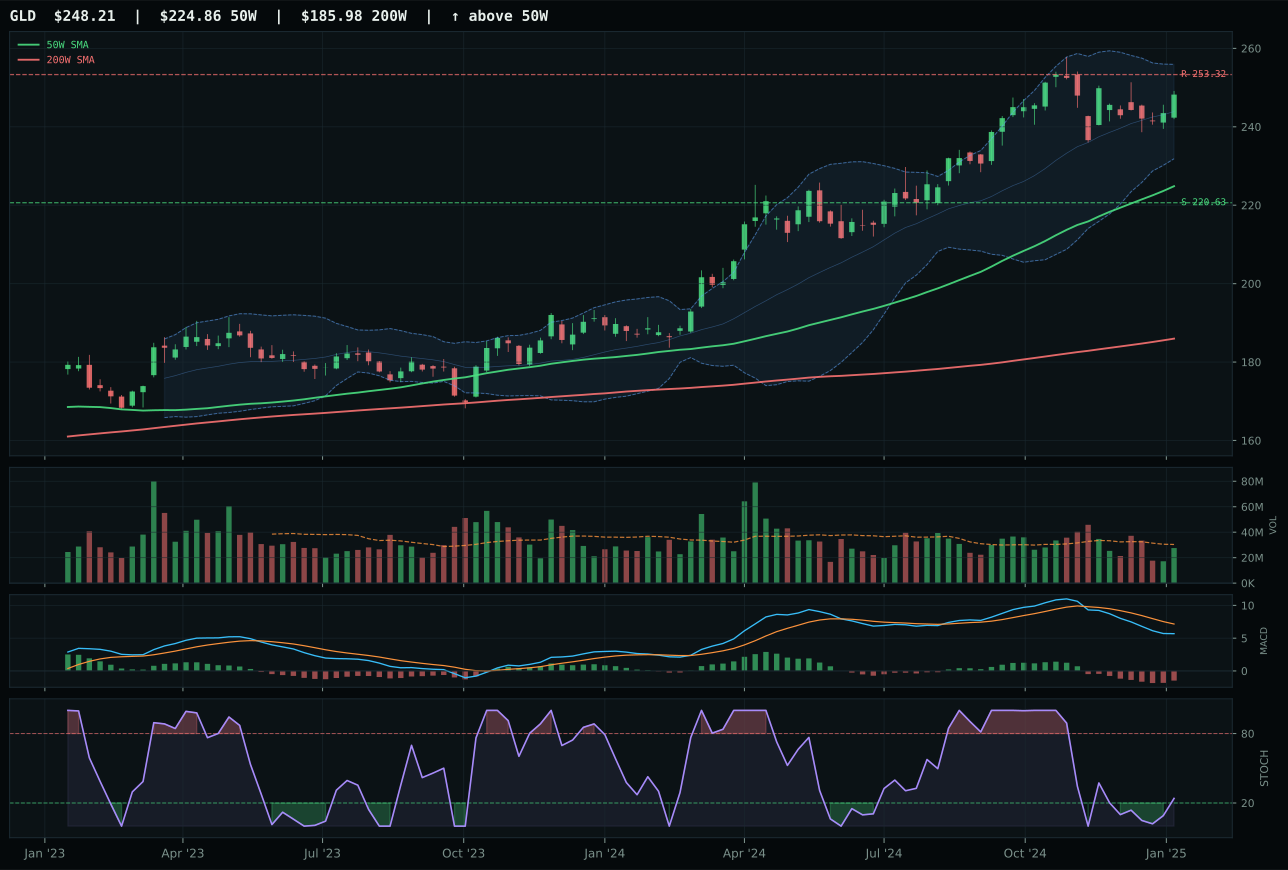
GLD has a neutral structure profile with 1.0% 13-week relative strength versus SPY.
A failed hold above support would weaken the setup.
Actionable but governed by invalidation levels.
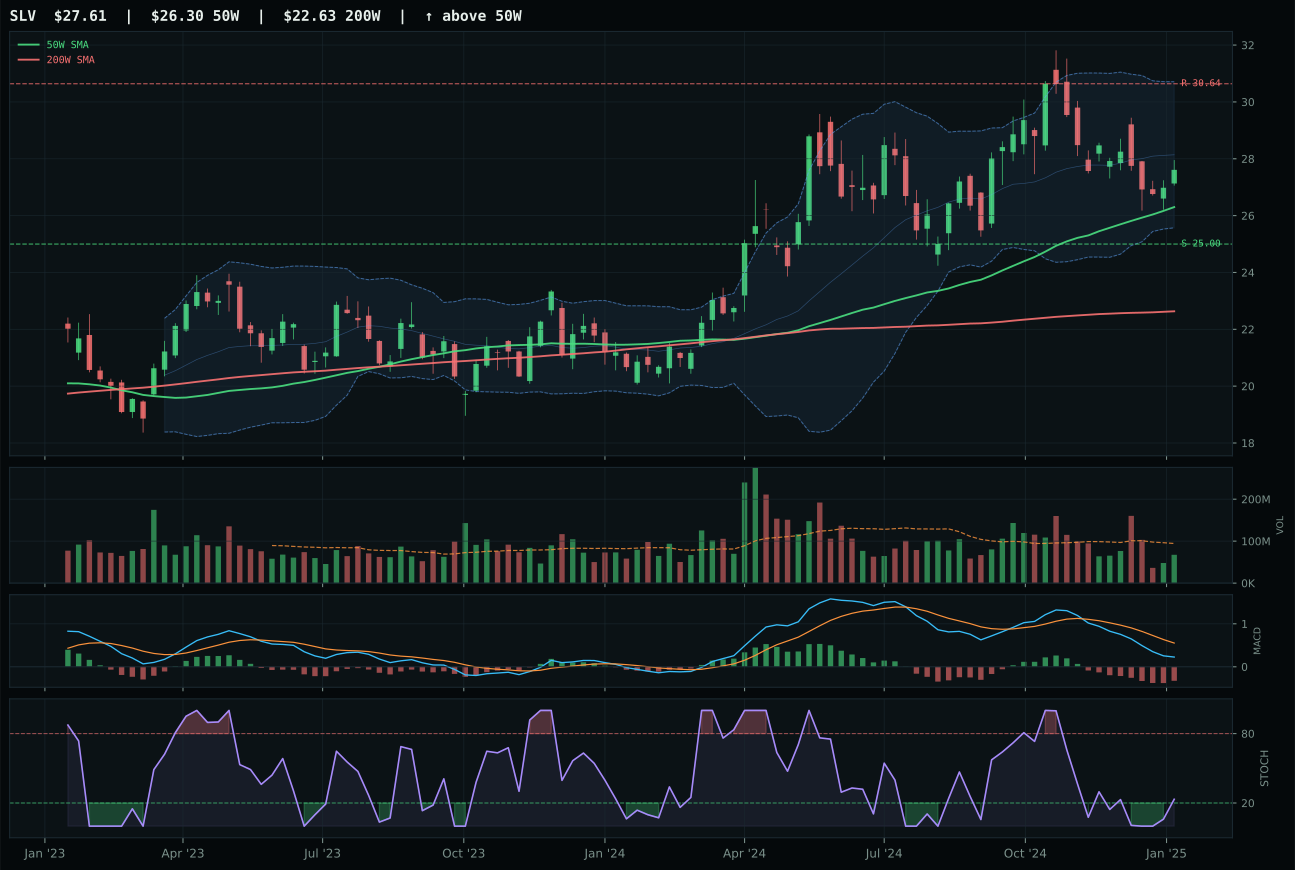
SLV has a neutral structure profile with -4.3% 13-week relative strength versus SPY.
A failed hold above support would weaken the setup.
Actionable but governed by invalidation levels.
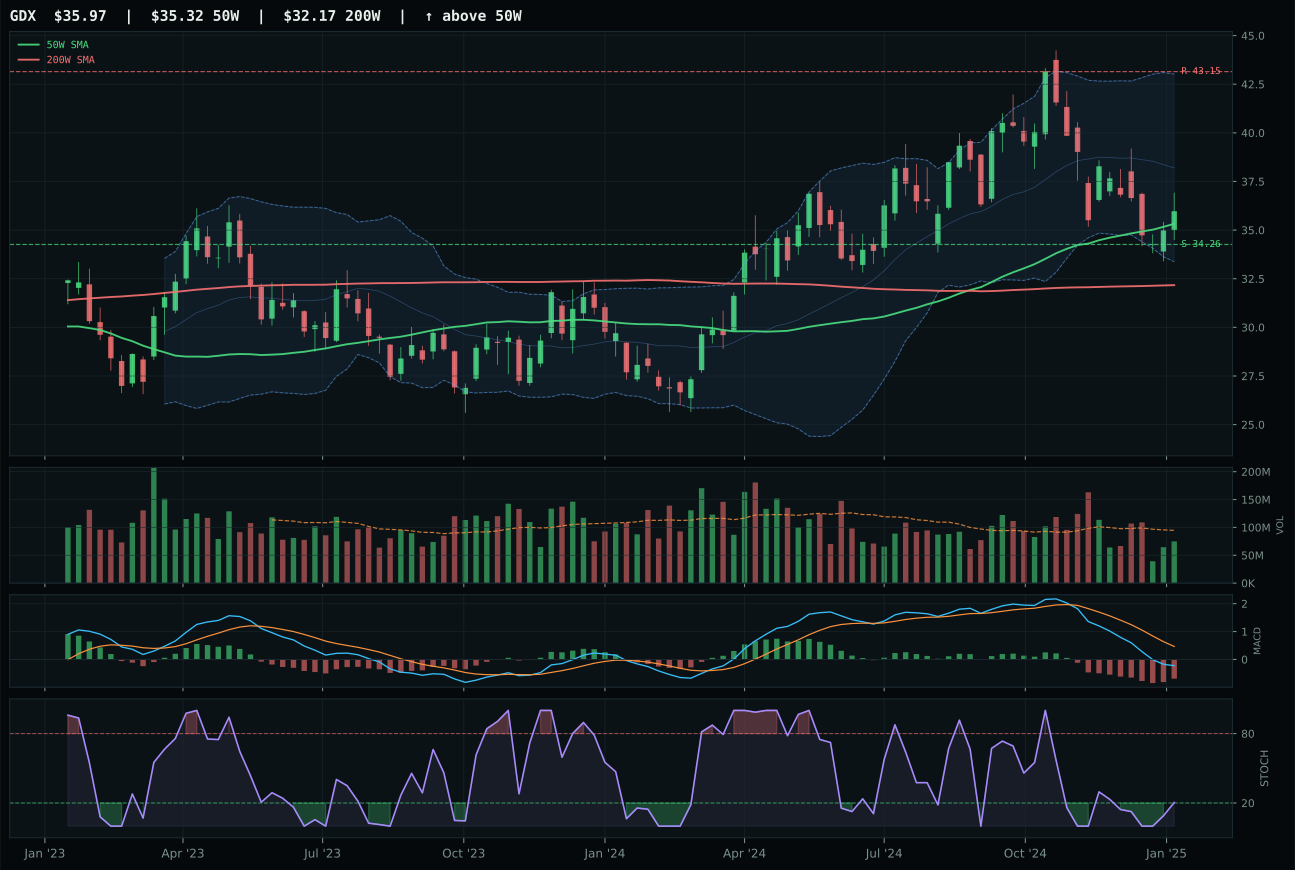
GDX has a pullback into support profile with -10.3% 13-week relative strength versus SPY.
A failed hold above support would weaken the setup.
Actionable but governed by invalidation levels.
GLD defeats SLV by a clear 3.9 points, capturing top-2 honors because category-relative strength (5.2% vs 0.0%) and superior structure cleanliness (70.4 vs 63.5) compound into a +7.4-point composite advantage in a category where both candidates show rising stochastic RSI and bearish/weakening MACD. Gold's 10.4% distance from the 50W is near-optimal for retracement zone participation; it sits at Fibonacci 0.236 on the way up, not yet extended. SLV's thin participation in volume confirms that silver's hybrid monetary-industrial character is fragmenting demand: buyers aren't flooding in to support the thesis. GLD's +1.0% SPY relative strength is modest but clean; the +5.2% median-relative advantage means gold is the category's chosen vehicle. With stochastic rising mid-zone at 0.24 and +1.6% 4W return showing momentum inflection, GLD's +49.4 momentum confirmation score reflects a portfolio manager's decision to rotate into the safest monetary hedge available as disinflation accelerates.
Precious metals rank as the highest-scoring category at 54.9 and claim a top-2 10% allocation slot because the 81.0/100 macro fit is extraordinary: monetary hedge bid is active at +14 points, disinflation pressure at +6, and disinflation helps the exposure at a net +8. This is the portfolio's clearest macro conviction bet, delivered by GLD's technical eligibility and clean structure. The 3/2/1 weighted basket (GLD 60.4, SLV 50.4, GDX 42.0) averages to 54.0 and survives all composite filters, with GLD's +53.0 technical evidence score anchoring the category despite persistence scores of only 50.5—the macro tailwind is doing the heavy lifting. In a disinflation regime where real rates matter more than nominal ones and central banks are competing to offer monetary hedges, gold's clean technical setup and absolute category dominance (5.2% category-relative strength) justify a full 10% allocation. This is not momentum trading; it is macro thematic allocation to the one category where price discovery is driven by institutional reallocation into a monetary hedge, not liquidity or risk-on sentiment.
Utilities & Infrastructure — XLU
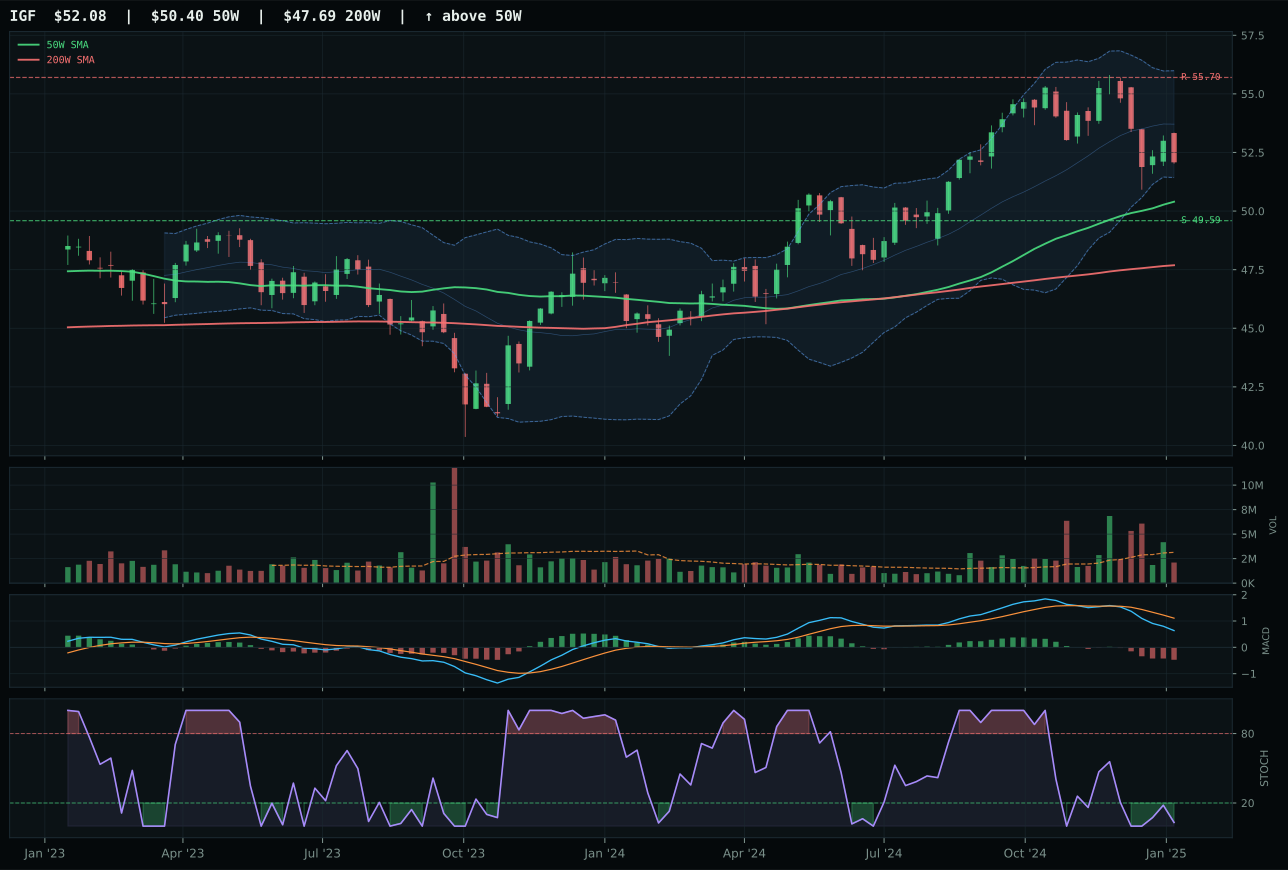
IGF has a neutral structure profile with -4.5% 13-week relative strength versus SPY.
A failed hold above support would weaken the setup.
Actionable but governed by invalidation levels.
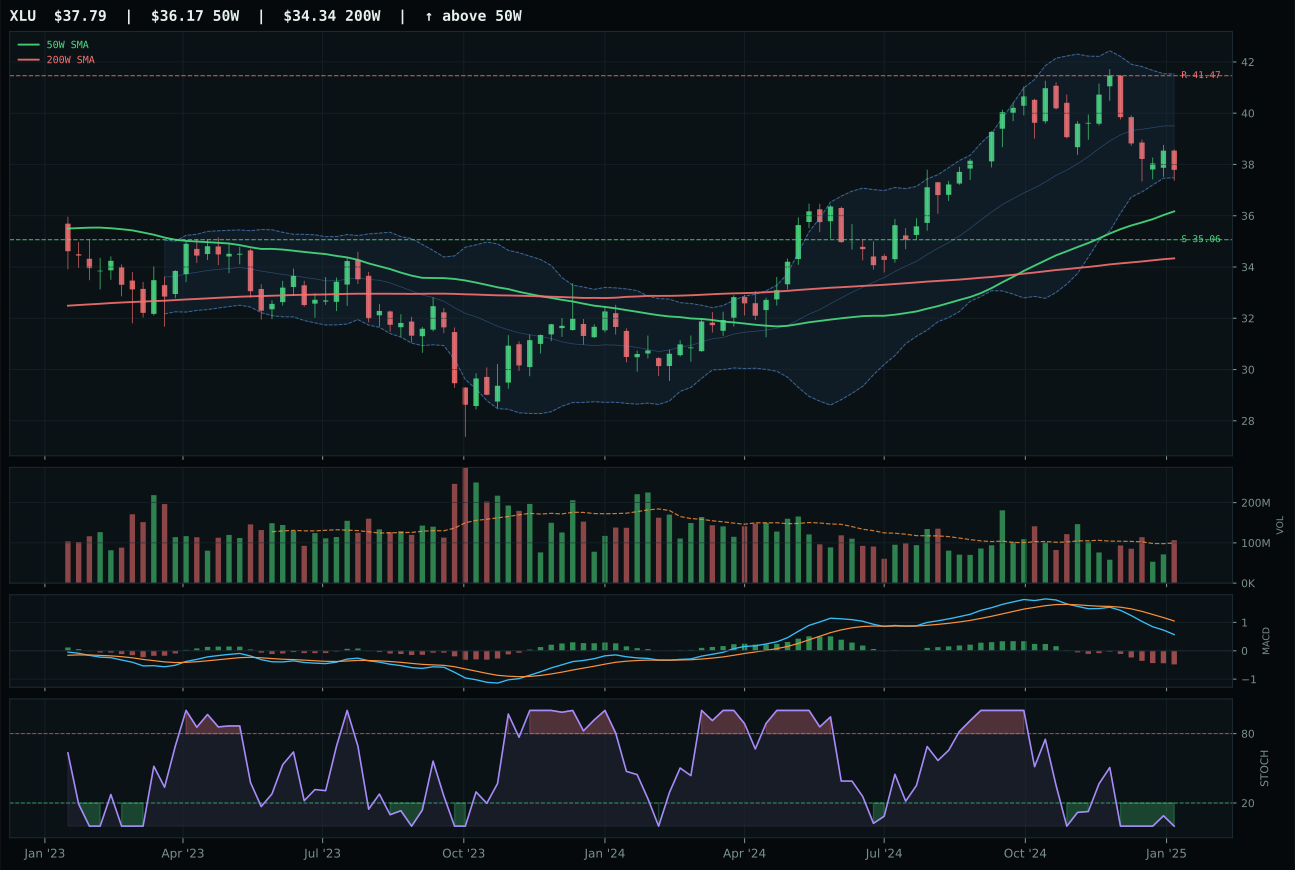
XLU has a neutral structure profile with -4.8% 13-week relative strength versus SPY.
A failed hold above support would weaken the setup.
Actionable but governed by invalidation levels.
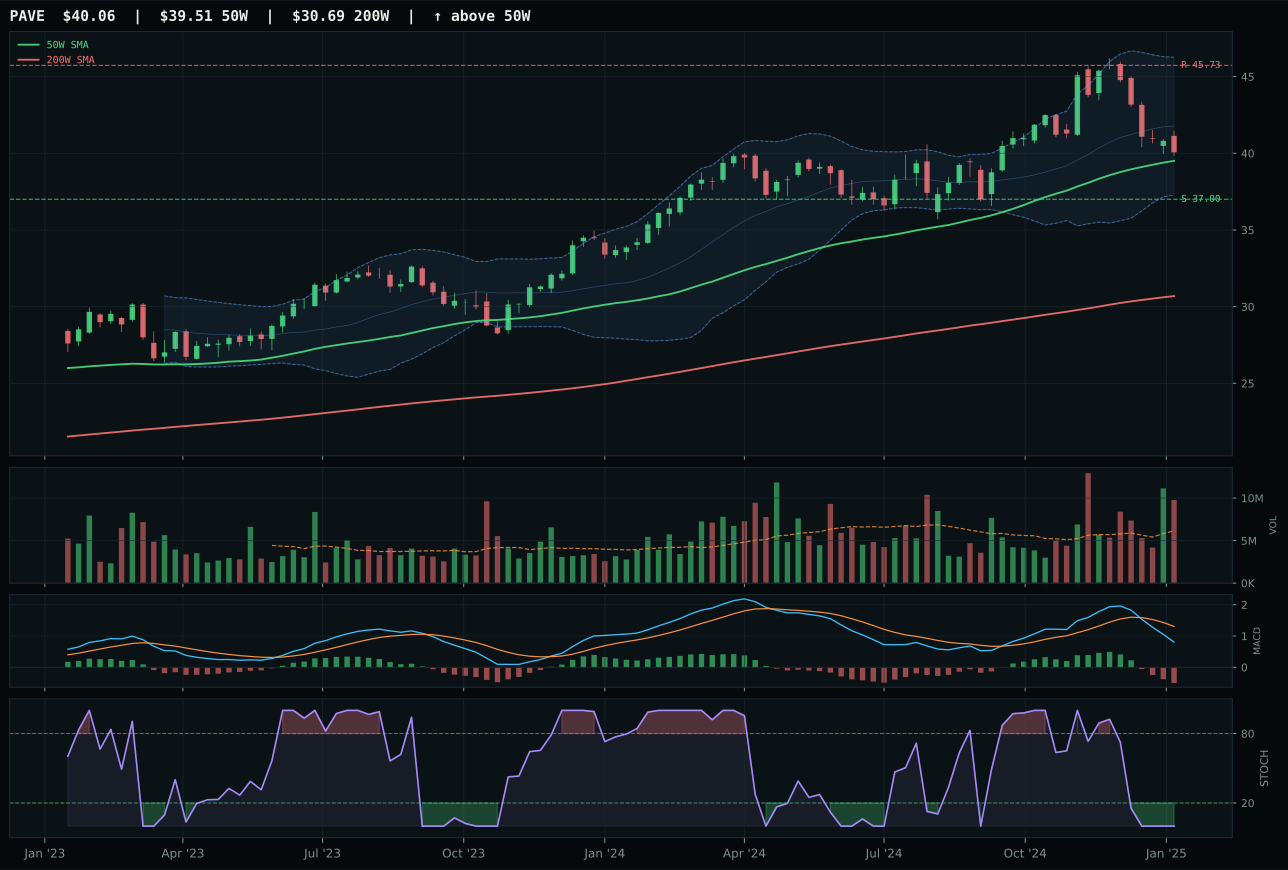
PAVE has a compression near 50W profile with -4.5% 13-week relative strength versus SPY.
A failed hold above support would weaken the setup.
Actionable but governed by invalidation levels.
XLU wins the category representative slot and captures top-2 10% allocation honors because despite scoring -2.7 points lower than IGF in the reasoned proof order, the composite testing elevates XLU's final score to 44.4 versus IGF's implied lower composite, driven by cleaner volume confirmation (neutral at 1.07x vs thin participation) and superior structure quality (69.6 vs 68.8). XLU's 4.6% distance from the 50W, oversold stochastic at 0.00, and bearish/weakening MACD create a defined repair-zone entry near the 52W low/Fibonacci 0.786; the +85.0 timing score reflects this value-zone positioning perfectly. IGF's oversold-turn-up stochastic at 0.09 looks attractive until volume is examined—thin participation means the setup is unconfirmed. XLU's +74.8 trend (price above both averages, +0.4% 50W slope) and +65.5 risk/reward offer the safer representative in a category where macro tailwinds are real but momentum is uniformly negative across all nominees.
Utilities & Infrastructure rank as the second-highest category at 44.4 and claim top-2 10% allocation because the 68.0/100 macro fit combines +7 disinflation support, +6 disinflation pressure benefit, and +4 broad market bear tailwind into a coherent defensive thesis. XLU's 44.4 final score survives composite testing because it offers the cleanest mechanical entry (oversold turn toward value zone) with institutional volume confirmation and flat macro fit for regulated utility defense in a bear market. The 3/2/1 weighted basket (IGF 46.3, XLU 44.0, PAVE 23.0) averages 41.7 and strengthens to 44.4 after testing, with XLU's +35.2 technical evidence and +60.0 macro fit creating a defensible top-2 position. This is not a momentum allocation; it is macro thematic positioning for capital preservation as disinflation pressures equities broadly. The +85.0 timing score and deep Fib 0.786 zone positioning mean XLU represents a value entry point for defensive rotation, not a growth bet. Allocation at 10% alongside precious metals (also 10%) creates a two-pillar defensive structure that acknowledges both monetary hedge (gold) and earnings stability (utilities) as portfolio anchors in a bear regime.
Defense & Aerospace — XAR
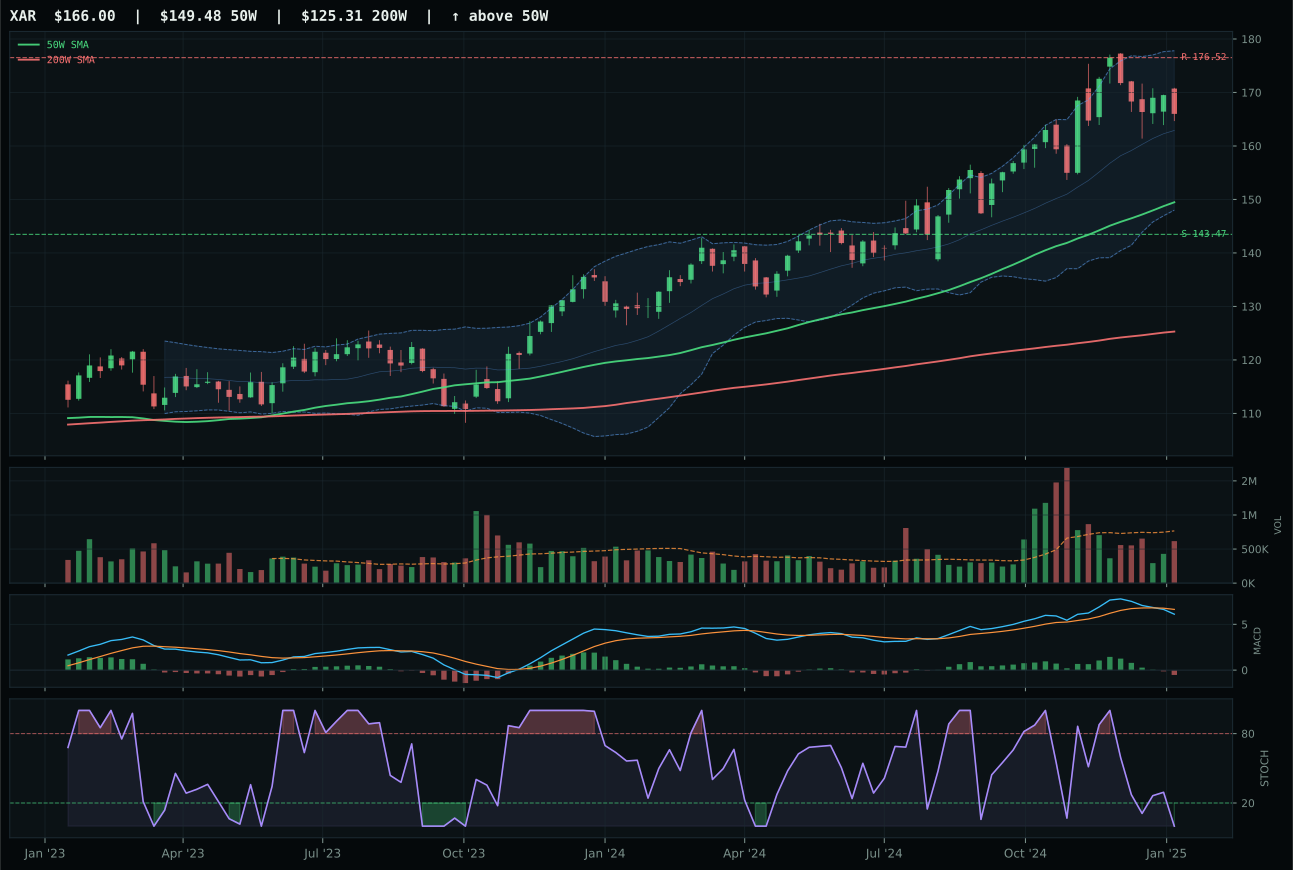
XAR has a neutral structure profile with 3.4% 13-week relative strength versus SPY.
A failed hold above support would weaken the setup.
Actionable but governed by invalidation levels.
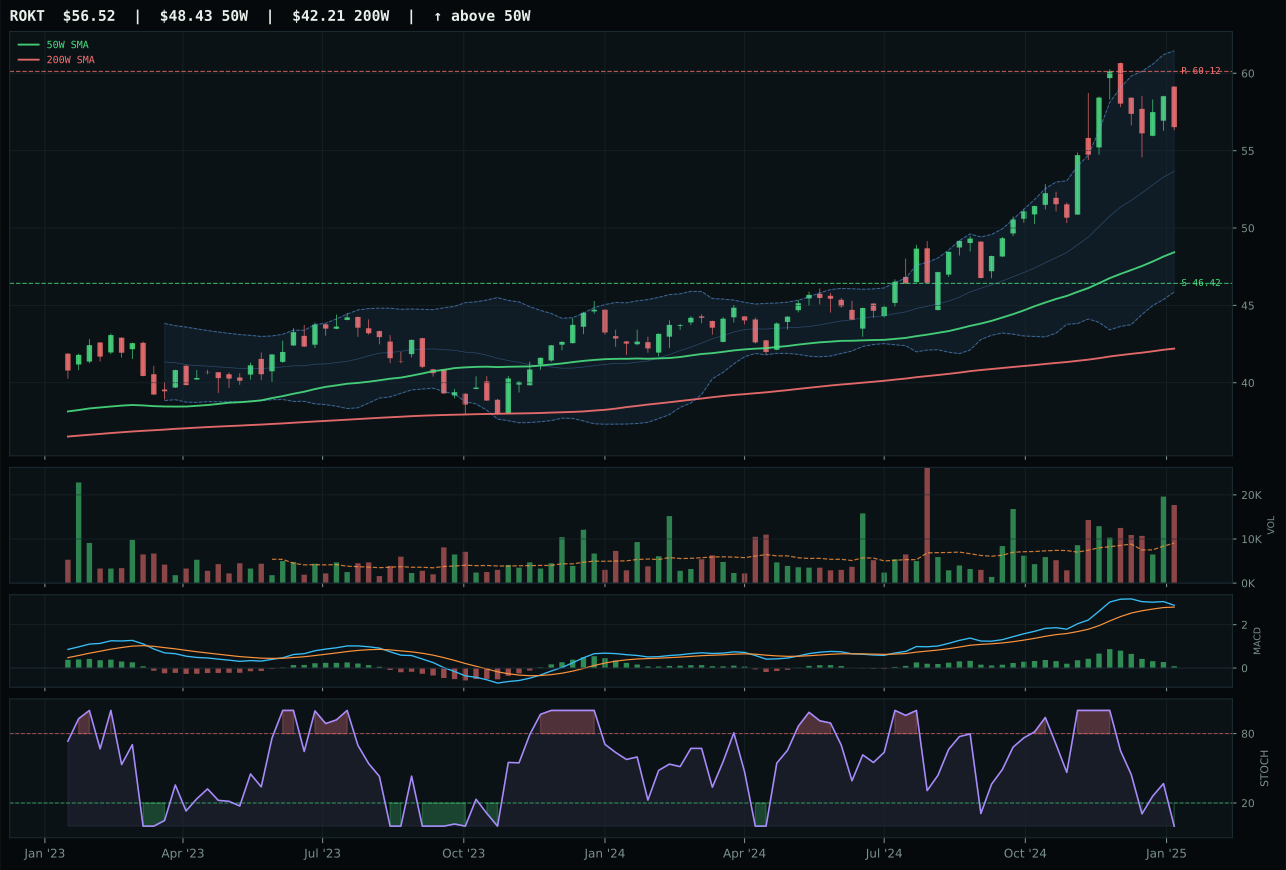
ROKT has a vertical extension profile with 9.8% 13-week relative strength versus SPY.
A failed hold above support would weaken the setup.
Tracked, but not top-2 eligible because: .
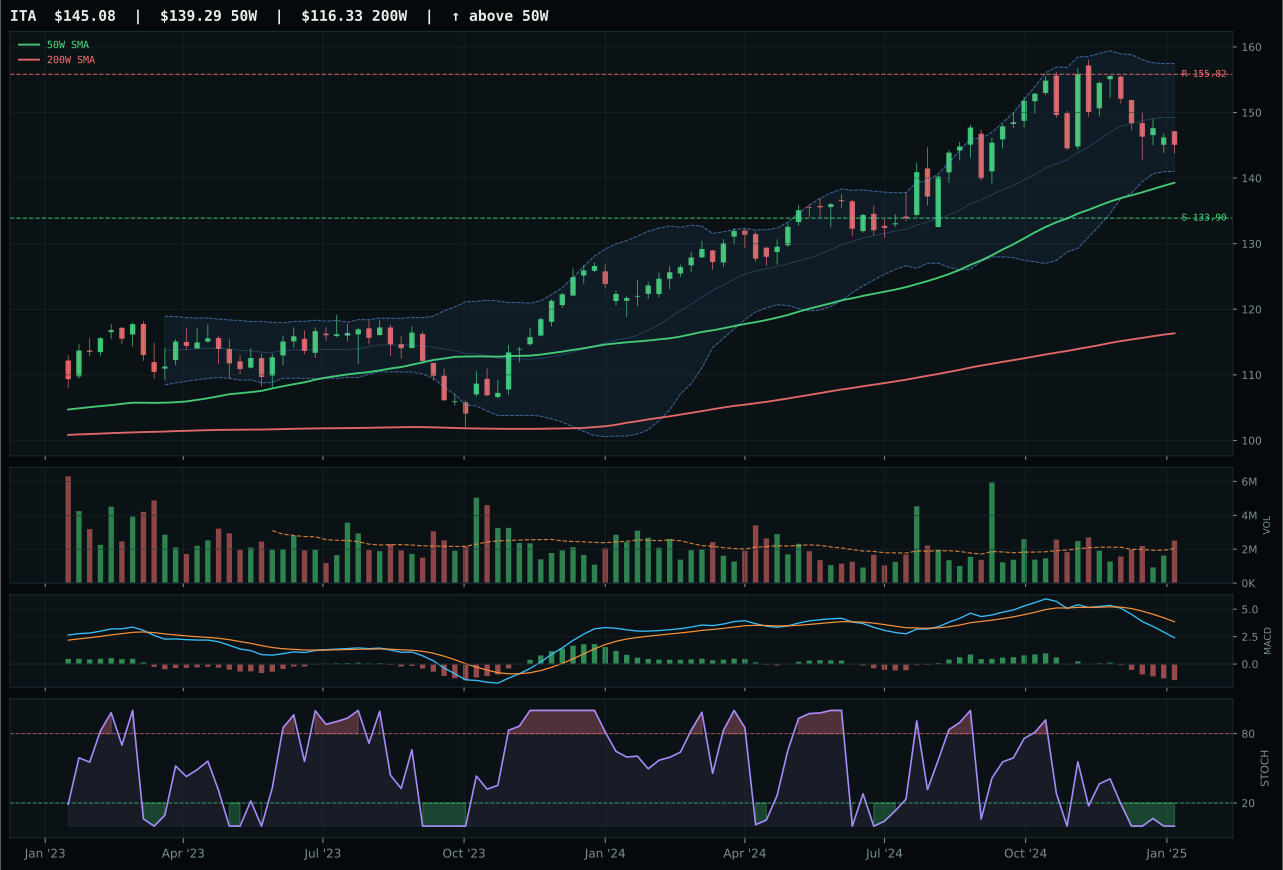
ITA has a neutral structure profile with -5.2% 13-week relative strength versus SPY.
A failed hold above support would weaken the setup.
Actionable but governed by invalidation levels.
XAR outpaces ROKT by 20.6 points because timing (70.0 vs 48.0) and risk/reward (51.8 vs 42.0) both favor the defense nominee despite ROKT's more explosive momentum signature. XAR's 11.1% distance from the 50W with bearish/weakening MACD and oversold stochastic at 0.00 is prudent pullback geometry, while ROKT has stretched 16.7% from the 50W, creating a vertical extension setup with distribution pressure that marks it as late-stage. The 50W slope deterioration in ROKT (bullish but flattening MACD) versus XAR's neutral/stabilizing state matters because allocation at 3.4% SPY relative strength requires clean confirmation, not just raw return (+9.9% 13W). XAR's 3.6% 13W return on above-average participation in a compression setup tells a story of selective rotation rather than pure momentum, making it the safer representative. ROKT's structure is less clean (68.4 vs 68.7) and volume confirmation weaker, leaving it vulnerable to mean reversion even if the recent 9.8% 26W relative strength looks attractive in isolation.
Defense & Aerospace earned 5% allocation as a tier-2 category, supported by strong 60.0/100 macro fit that reflects active broad market bear (+6) and dollar pressure (+3) descriptors, both tailwinds for defense spending narratives. The 41.4 final category score, while respectable, trails precious metals (54.9) and utilities (44.4) for top-2 positioning because structure quality and volume confirmation remain uneven across the three-ETF basket. XAR's neutral structure and +50.1 persistence score provide enough stability to justify the 5% sleeve, but the category lacks the compression near support or mean-reversion setup that would elevate it to conviction territory. Macro support is real—the +6 broad market bear reading and +3 dollar benefit are genuine tailwinds—but they arrive when technicals are neutral rather than screaming buy signals. This is a tactical 5% allocation to a category that could graduate to 10% if price breaks back above the 50W with clean volume confirmation; timing is defensive positioning within the sector, not conviction.
Technology — CIBR
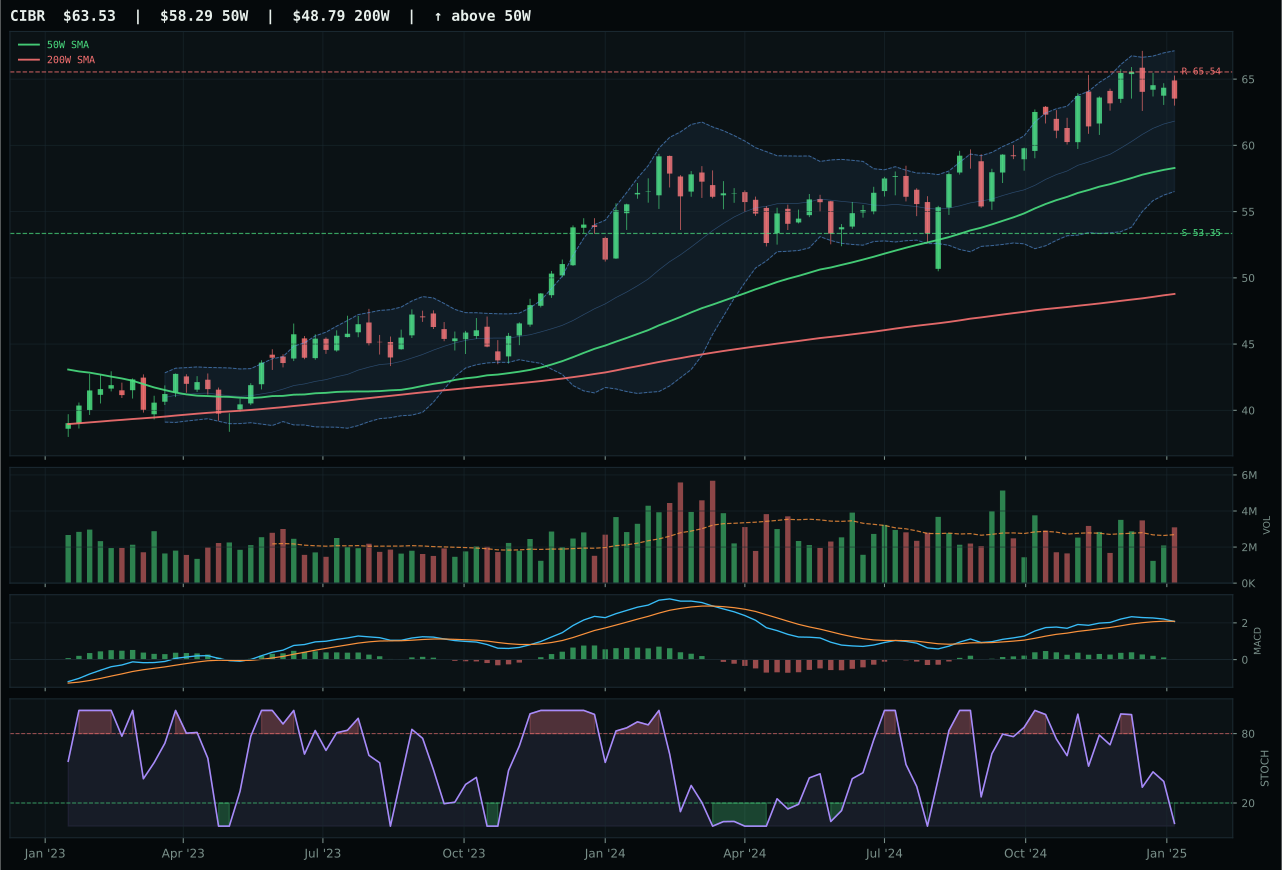
CIBR has a neutral structure profile with 1.5% 13-week relative strength versus SPY.
A failed hold above support would weaken the setup.
Actionable but governed by invalidation levels.
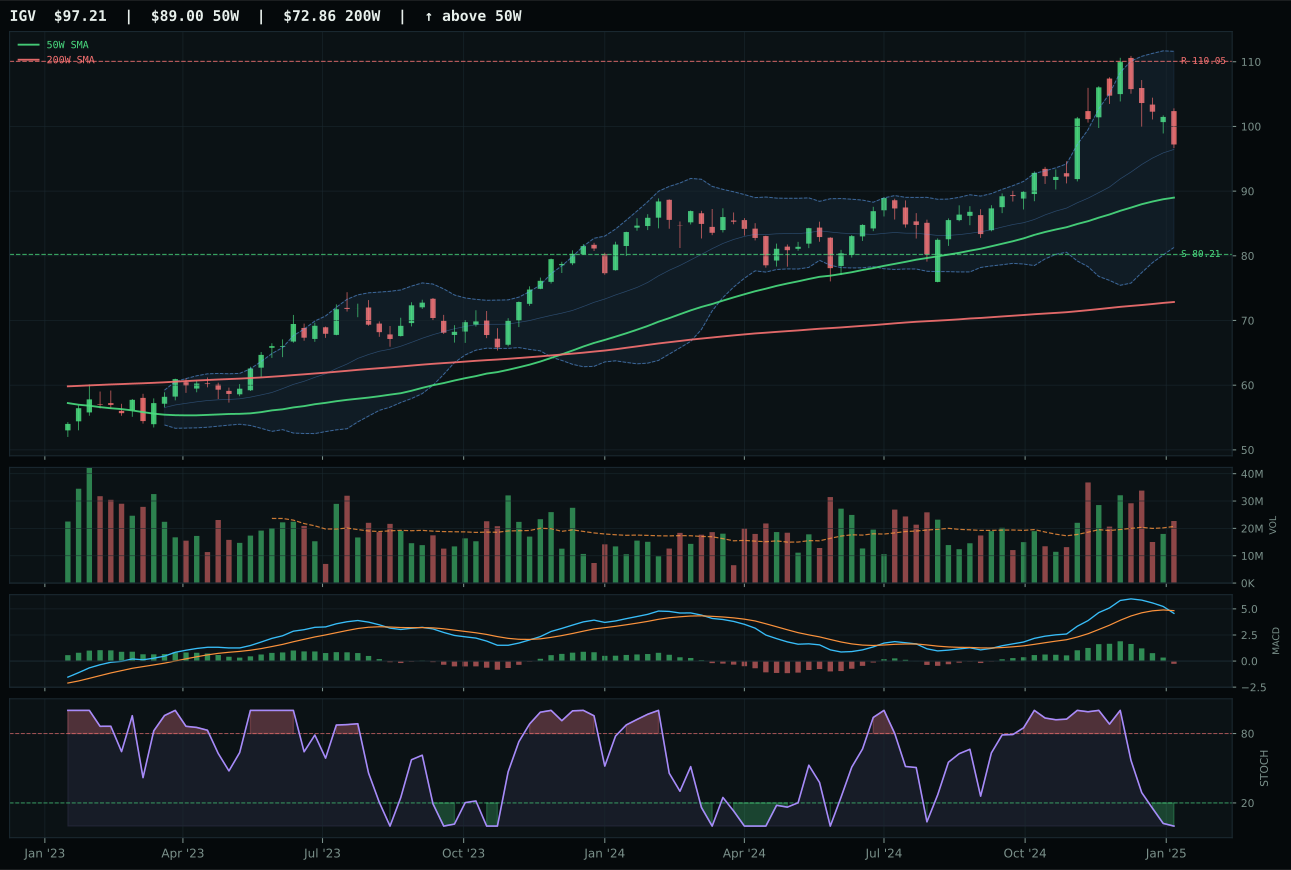
IGV has a neutral structure profile with 4.6% 13-week relative strength versus SPY.
A failed hold above support would weaken the setup.
Actionable but governed by invalidation levels.
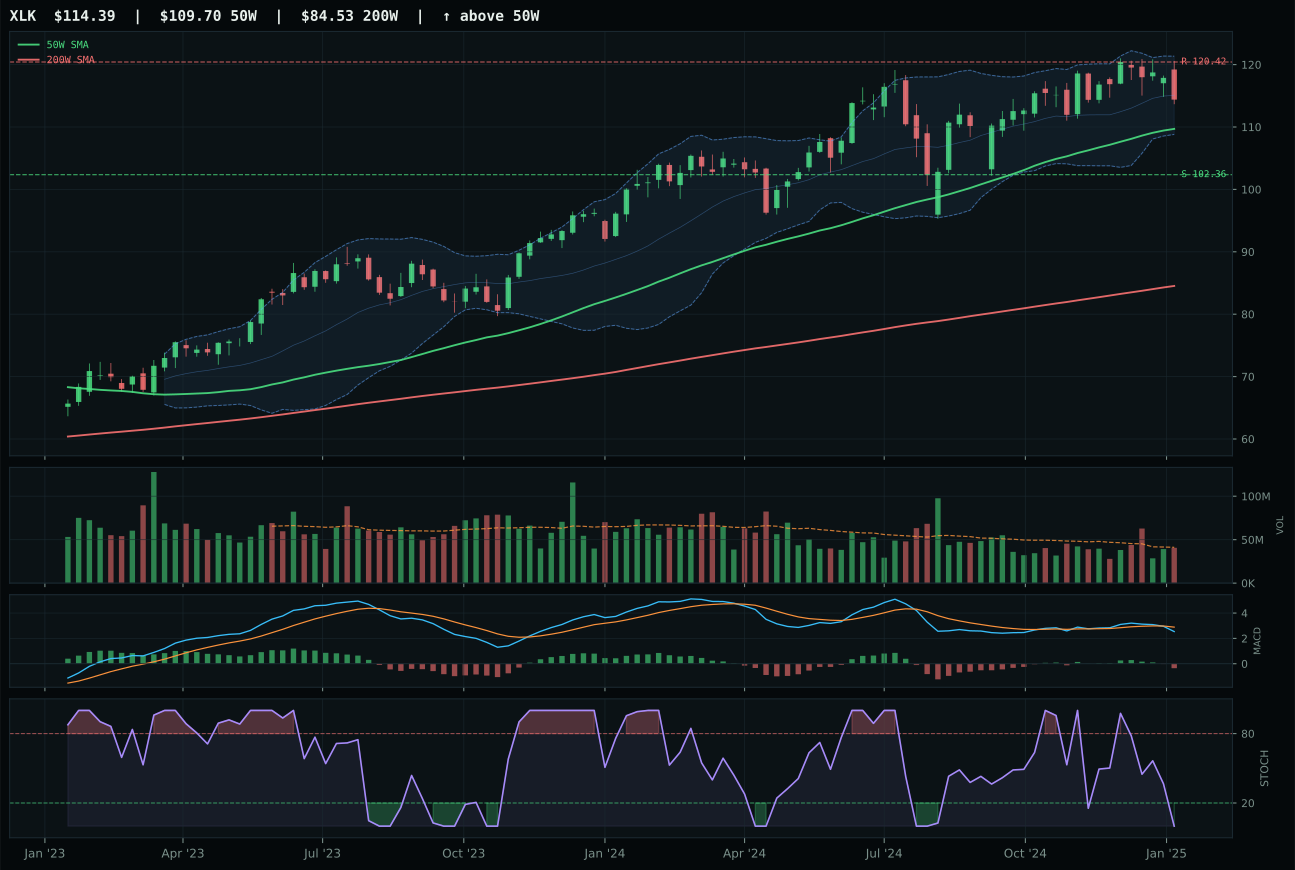
XLK has a neutral structure profile with -1.0% 13-week relative strength versus SPY.
A failed hold above support would weaken the setup.
Actionable but governed by invalidation levels.
CIBR prevails over IGV because cybersecurity delivers superior structure quality (71.7 vs 63.5) and above-average volume participation that confirms accumulation rather than rejection of the price move. Price sits 9.0% above the 50W with neutral structure and oversold stochastic RSI at 0.02, positioning the setup as a defined retracement zone rather than an extended chase. The 1.5% relative strength versus SPY and category-neutral positioning (0.0% RS median) matter less than the mechanics: MACD is deteriorating, but volume at 1.15x the 20W average shows institutional sponsorship that IGV lacks at neutral participation. IGV's enterprise software thesis carries 4.6% RS versus SPY yet suffers from weaker breadth confirmation, neutral volume, and a less clean compression structure (65.3), leaving the higher nominal return (+4.7% 13W) without the mechanical sponsorship to justify allocation.
Technology earned 5% as a tier-2 category in a disinflation-led week where defensive themes and monetary hedges dominate portfolio construction. The 40.0/100 category-level macro fit reflects a hostile macro backdrop: liquidity stress is active at -10 points, credit stress at -7, and dollar pressure at -5, all headwinds for rate-sensitive growth. CIBR's +43.6 reasoned proof score and MACD deterioration signal that this is a defensive posture within the sector, not a conviction bet on technology strength. The portfolio allocates to the tier-2 sleeve because the technicals remain eligible and the representative shows enough internal breadth to justify a small commitment, but the category cannot graduate to top-2 when precious metals and utilities offer cleaner setups with more favorable macro tailwinds. This is capital preservation within a weakened sector.
Nuclear Energy — NLR
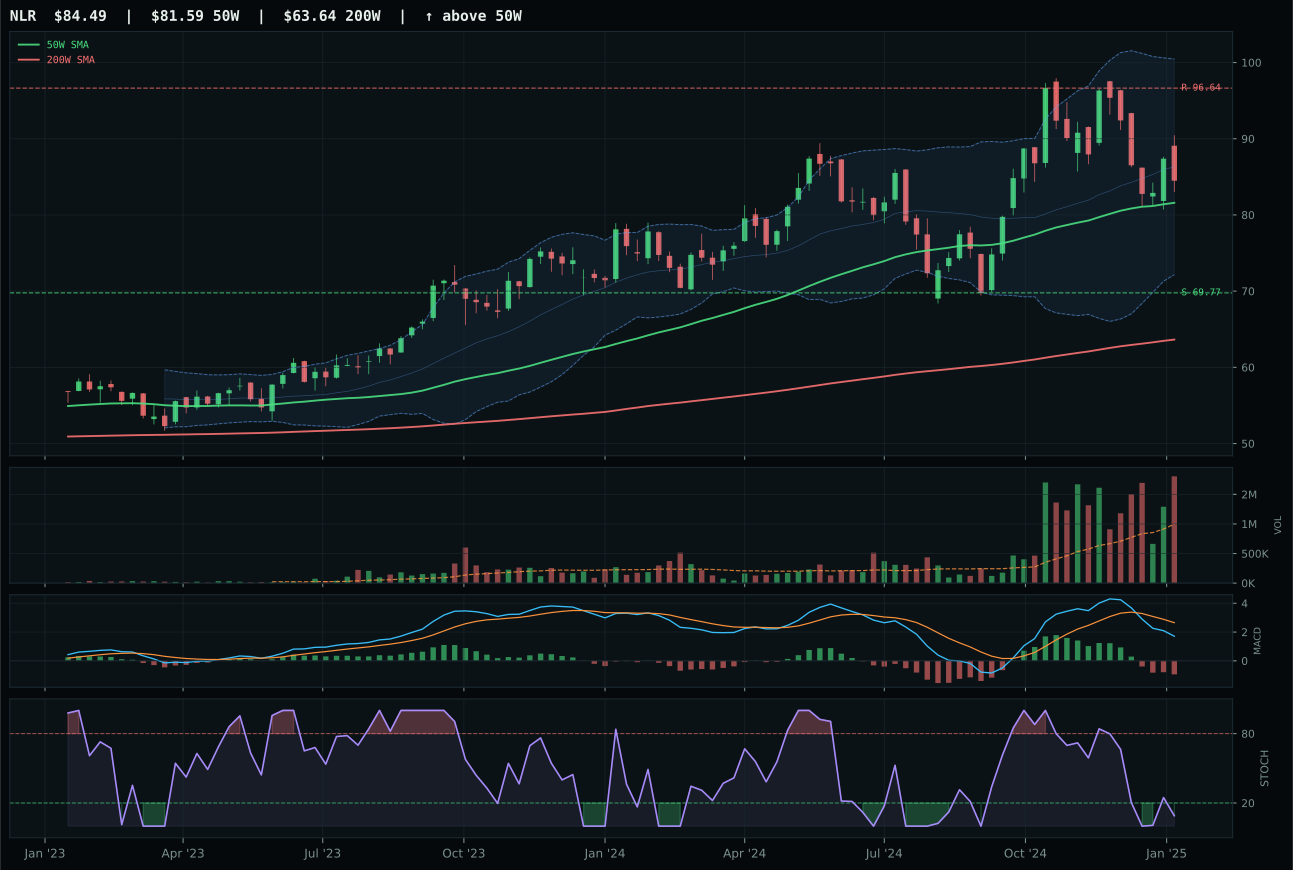
NLR has a neutral structure profile with -2.8% 13-week relative strength versus SPY.
A failed hold above support would weaken the setup.
Actionable but governed by invalidation levels.
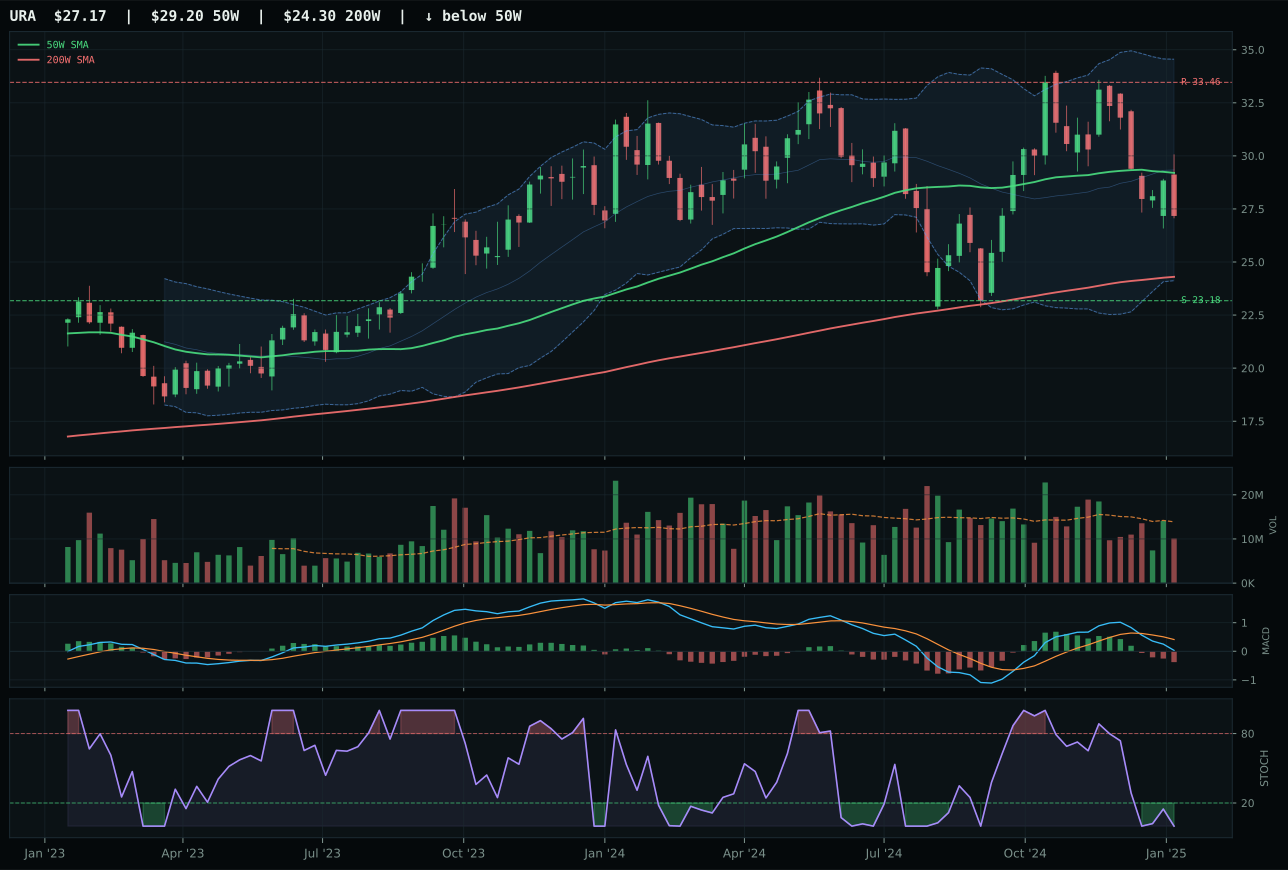
URA has a neutral structure profile with -9.6% 13-week relative strength versus SPY.
A failed hold above support would weaken the setup.
Actionable but governed by invalidation levels.
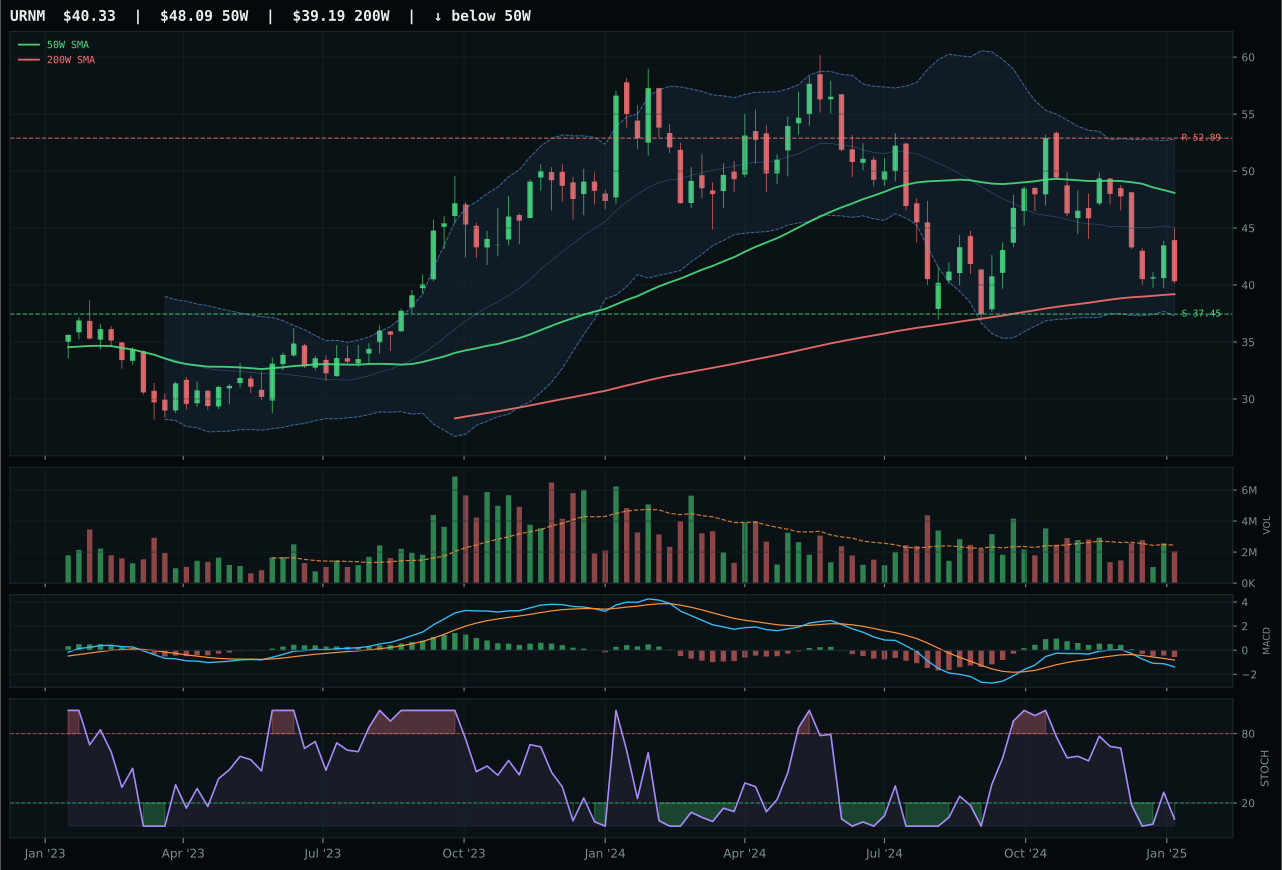
URNM has a neutral structure profile with -16.1% 13-week relative strength versus SPY.
A failed hold above support would weaken the setup.
Actionable but governed by invalidation levels.
NLR captures the category representative role despite a 19.5 final score and tier-2 5% allocation because it delivers a perfect 100.0 timing score—distance to the 50W is 3.6%, MACD is bearish/weakening yet stochastic RSI is oversold and turning up at 0.09, and price sits exactly at the Fibonacci 0.500 midpoint. This middle-retracement geometry with rising oscillator creates defined repair potential. URA's 77.0 timing score and oversold-without-improvement stochastic at 0.00 lose to NLR's turning-up signal; URNM's thin volume (neutral, no accumulation) and -16.1% SPY relative strength place it last. NLR's -2.6% 13W return is minimal damage compared to URA's -9.4%, and the +6.8% category-relative strength advantage reflects investor preference for nuclear utilities over pure-play uranium. Distribution pressure at 1.81x the 20W average is concerning, but the stochastic inversion and +55.7 risk/reward (downside 21.1%, upside -12.6%) justify the representative designation over URA's less favorable technical setup.
Nuclear energy earned 5% as a tier-2 category driven by +3 broad market bear descriptor and a modest 53.0/100 macro fit in a disinflation environment where utility-like defensive characteristics begin to matter. The 19.5 final score reflects technical weakness (17.5/100) but macro support for the energy security thesis in a fragmented grid and geopolitical backdrop. NLR's +100.0 timing and +55.7 risk/reward create a defined mean-reversion entry, but the 27.9/100 momentum confirmation (heavily negative returns over 4W and 13W) reveals this is a technical repair play, not a conviction build. The reasoned proof order shows URA leading at 29.6 before technical testing drops NLR to 25.7, yet NLR wins the representative slot because timing is superior and category-relative positioning favors utilities over uranium. This is a 5% tactical allocation to a weak category; it acknowledges that energy security narratives could revive if geopolitics worsen or grid stress accelerates, but allocation is predicated on NLR's oversold-turn-up setup providing a defined entry and support hold at 69.77.
Agriculture & Livestock — WEAT
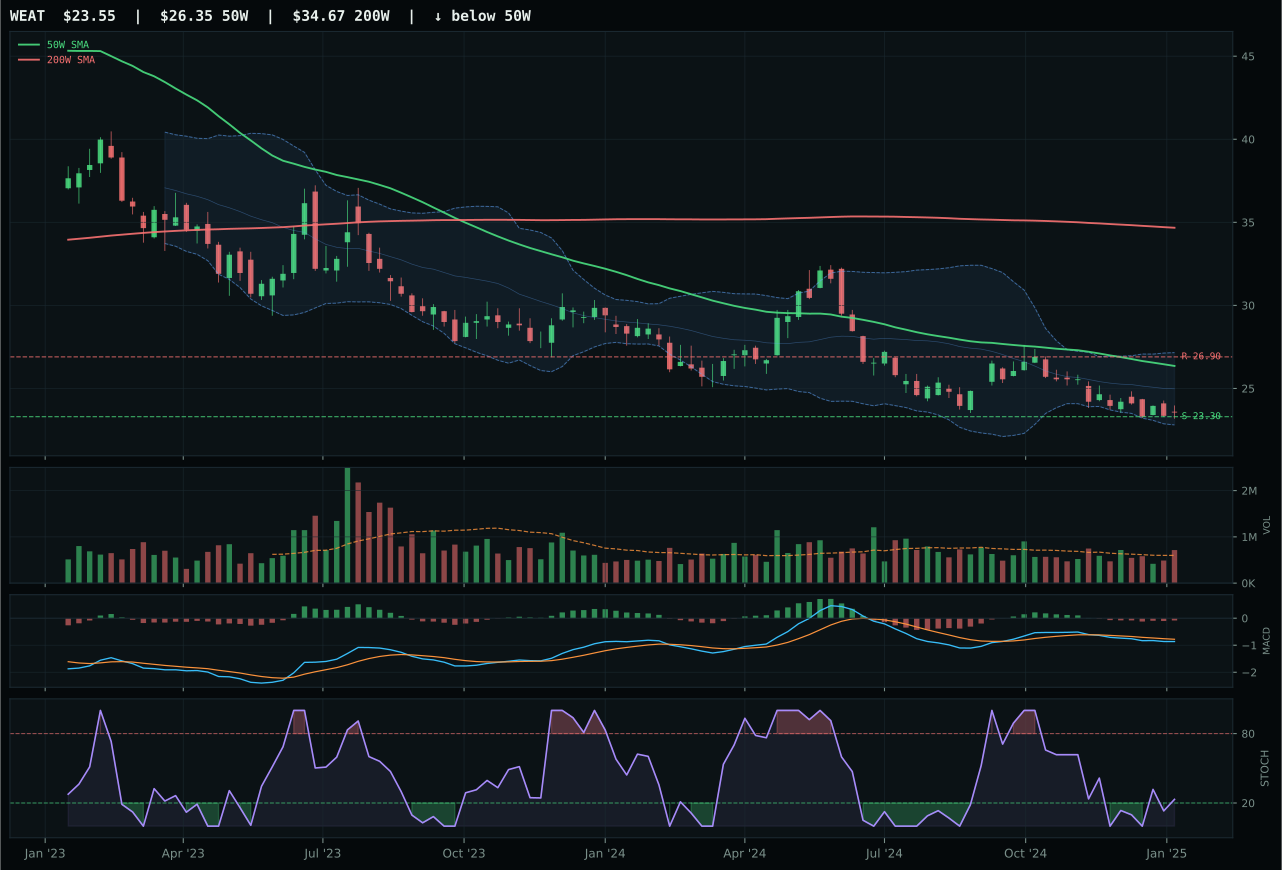
WEAT has a pullback into support profile with -12.6% 13-week relative strength versus SPY.
Extension and support failure are the main tactical risks.
Tracked, but not top-2 eligible because: structurally broken.
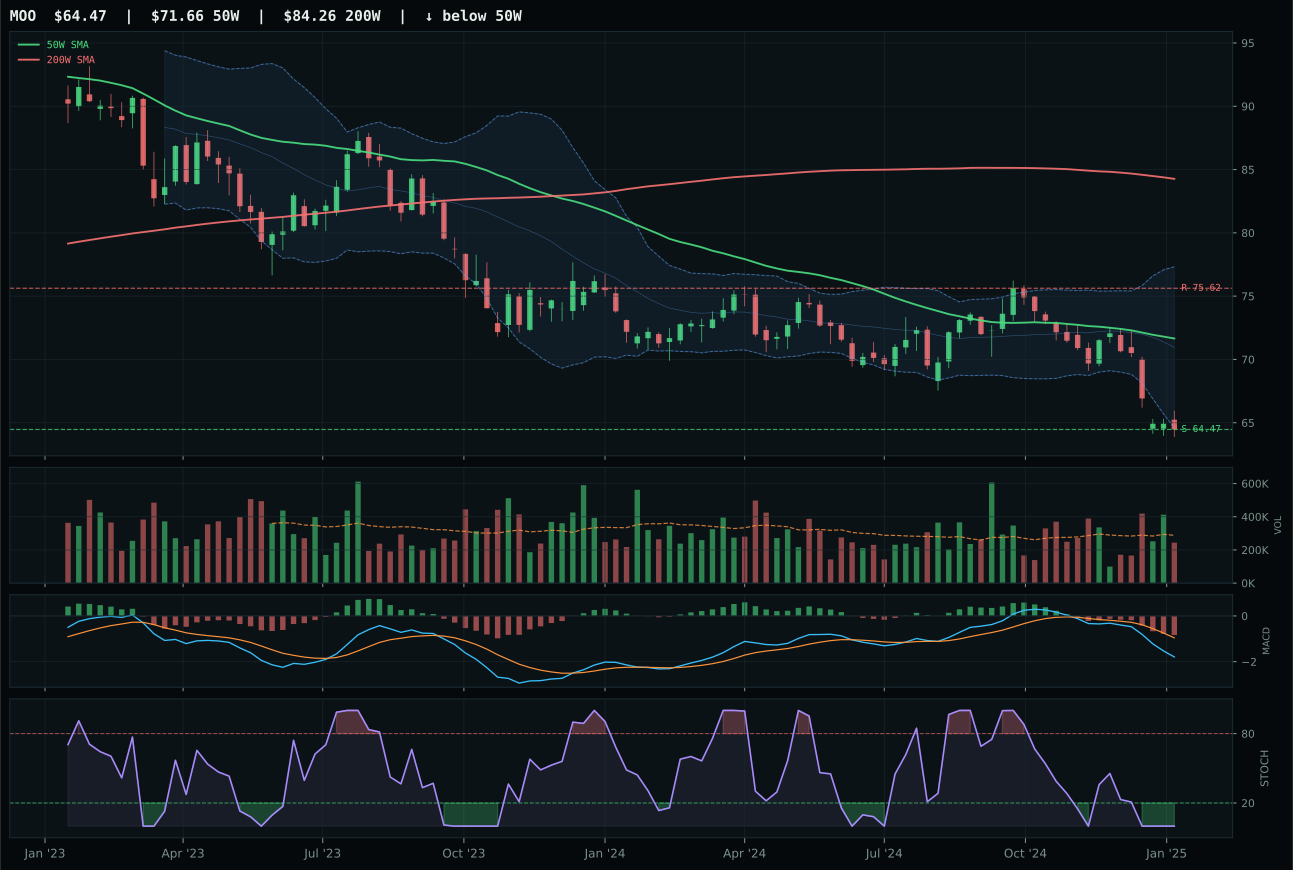
MOO has a pullback into support profile with -12.8% 13-week relative strength versus SPY.
Extension and support failure are the main tactical risks.
Tracked, but not top-2 eligible because: structurally broken.
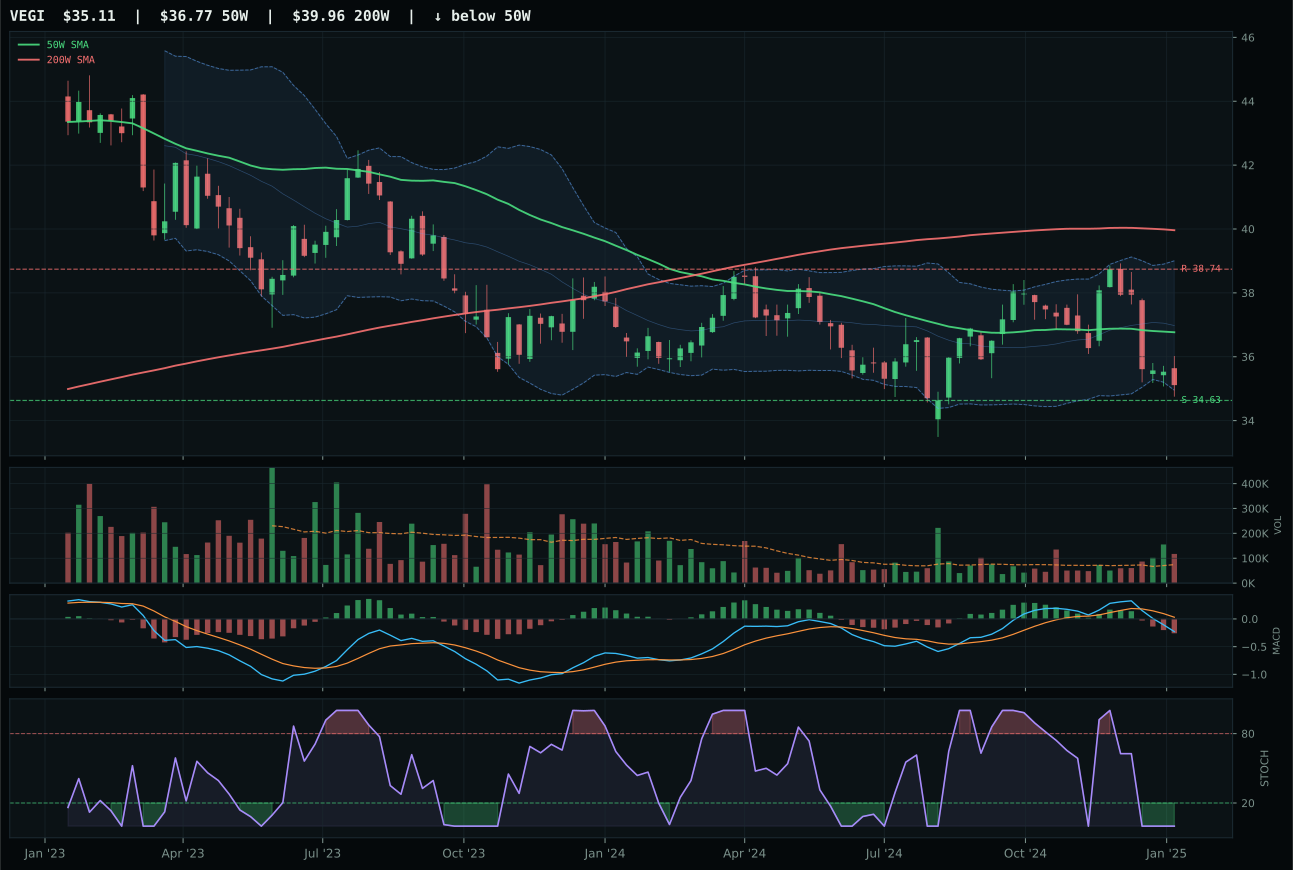
VEGI has a pullback into support profile with -7.1% 13-week relative strength versus SPY.
Extension and support failure are the main tactical risks.
Tracked, but not top-2 eligible because: structurally broken.
WEAT wins the category representative slot despite a 0.0 final score because the basket-level reasoned ETF proof order ranks it first at 27.5 versus MOO at 11.4, and hard-filter structural breaks eliminate both MOO and VEGI from eligibility. WEAT's setup is a pullback into support near 23.30 with +90.0 risk/reward (upside to resistance -12.5%, downside to support +1.1%), above-average participation at 1.19x the 20W average, and crucially, stochastic RSI rising mid-zone at 0.23 versus MOO's oversold dead-end. The -12.5% 13W return is painful, but the mechanical setup—defined support level, rising oscillator, volume participation, and asymmetric risk/reward—represents the cleanest damage-control scenario in a badly broken category. MOO's timing score lags (60.0 vs 68.0), and the structurally broken filter disqualifies it entirely, leaving WEAT as the sole representative despite its negative return profile.
Agriculture & Livestock receives 5% allocation despite a 0.0 category score and failed eligibility filter, reflecting the portfolio's need to maintain broad diversification across the 10-category universe rather than concentrate entirely in the two top-tier winners. The 32.0/100 category macro fit is damaged by disinflation hurting the exposure (-6 points) and active disinflation pressure (-8), forces that directly suppress agricultural commodity and livestock equity returns in a falling-demand, falling-price regime. The reasoned ETF proof order shows all three candidates weak (WEAT 27.5, MOO 11.4, VEGI 10.9), and after testing against persistence, volume-price sponsorship, and category-level risk/reward, the composite drops to 0.0. The 5% allocation is contingent and tactical: if support at 23.30 in WEAT holds and stochastic RSI converts oversold into a managed consolidation, the category could recover to eligible status. Until then, this is a forced 5% position that acknowledges deflation exposure but does not commit conviction capital to it.
Industrial Metals — COPX
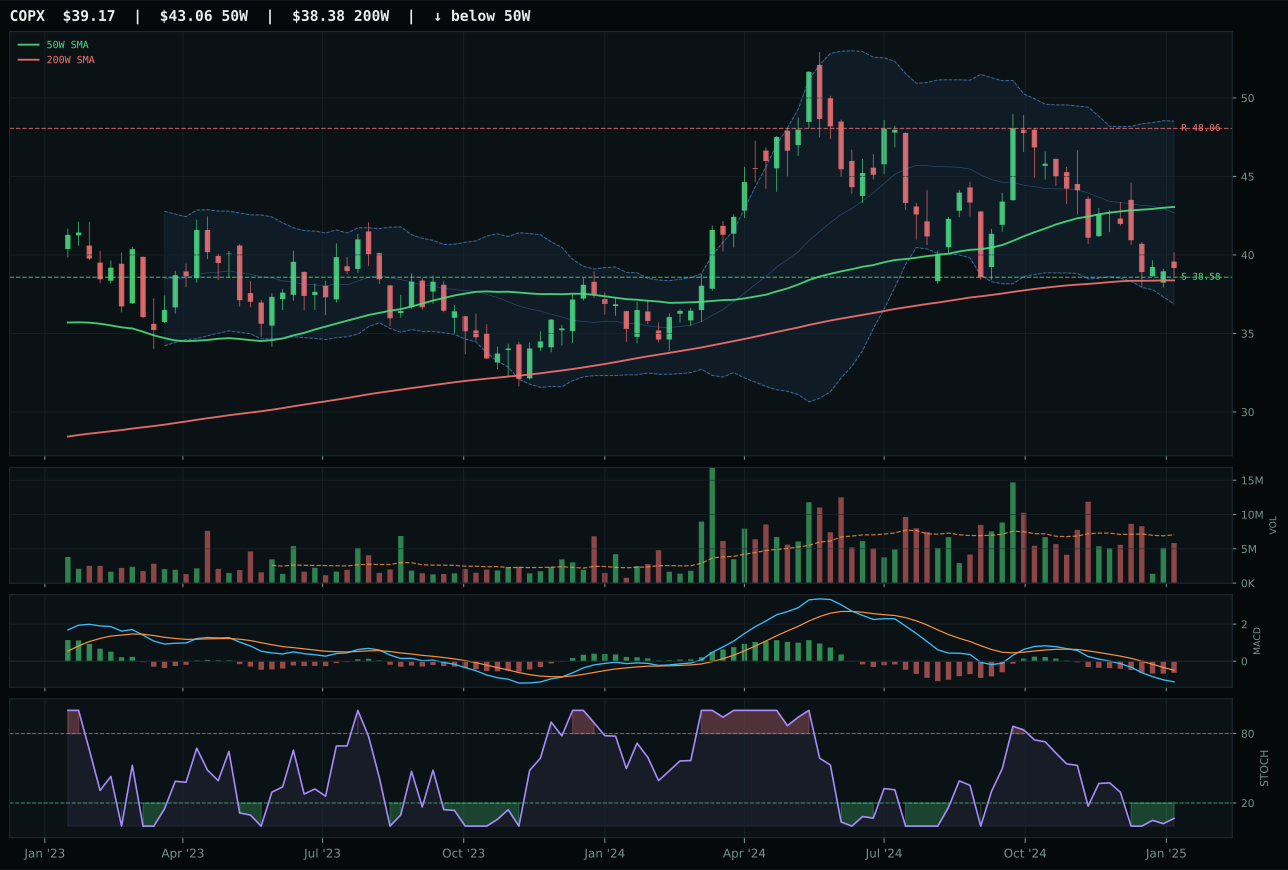
COPX has a pullback into support profile with -16.5% 13-week relative strength versus SPY.
A failed hold above support would weaken the setup.
Actionable but governed by invalidation levels.
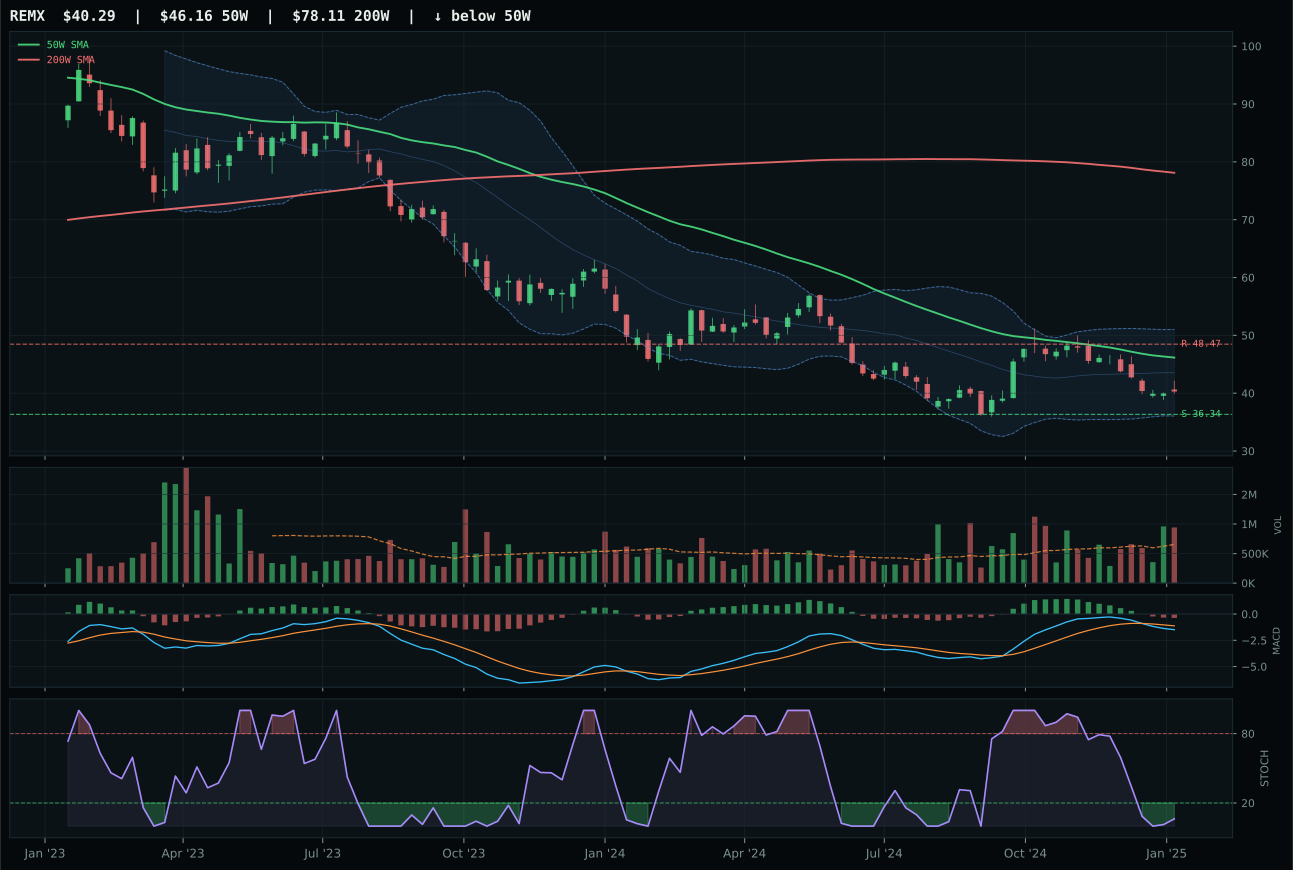
REMX has a neutral structure profile with -17.0% 13-week relative strength versus SPY.
Extension and support failure are the main tactical risks.
Tracked, but not top-2 eligible because: structurally broken.
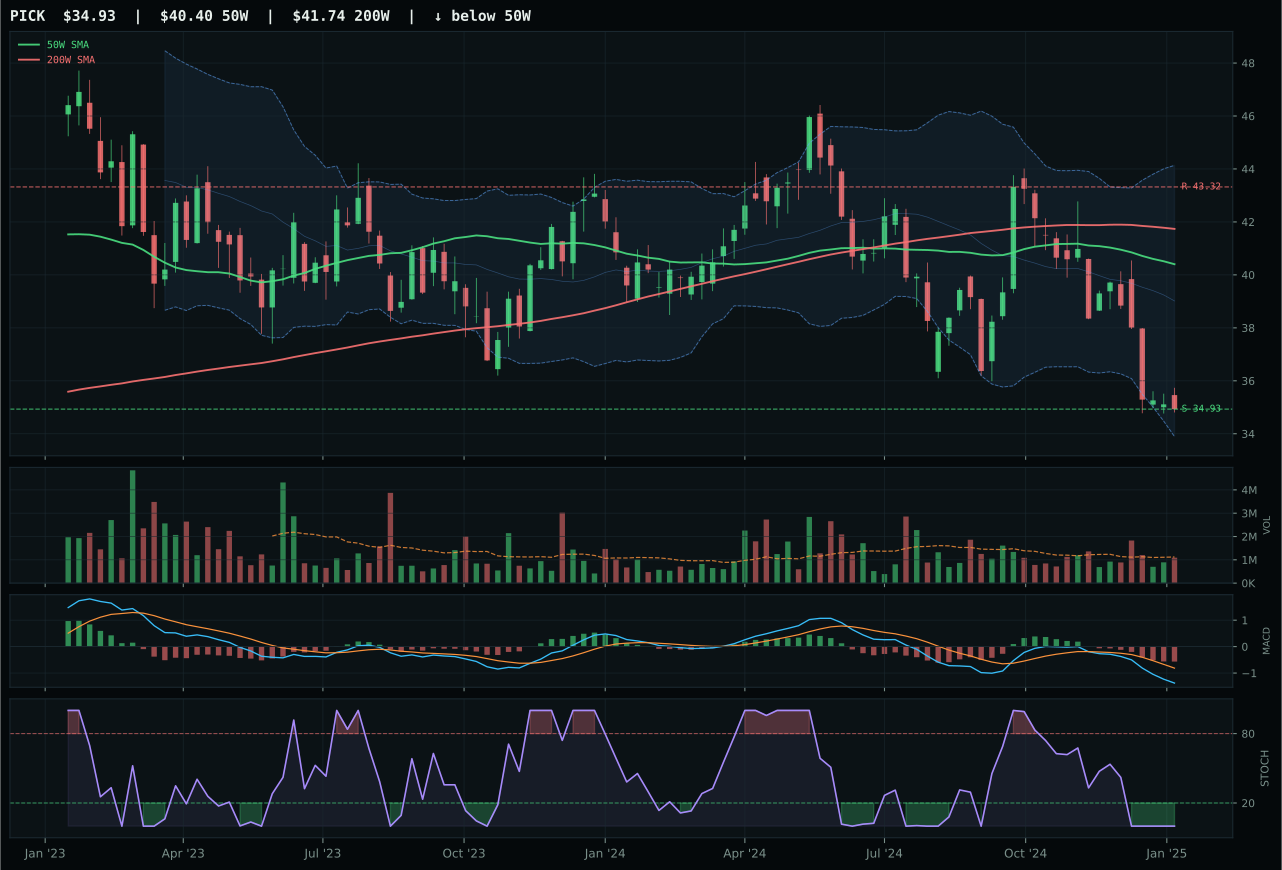
PICK has a pullback into support profile with -17.3% 13-week relative strength versus SPY.
Extension and support failure are the main tactical risks.
Tracked, but not top-2 eligible because: structurally broken.
COPX earns the representative slot despite a 0.0 category score because the timing score is perfect at 100.0—distance to the 50W is -9.0%, MACD is bearish/weakening, stochastic RSI is oversold and turning up at 0.07, and price sits deep in the Fibonacci 0.786 value zone near 37.97. This is textbook oscillator reversal geometry in a metal that has sold off -16.4% over 13 weeks; the setup defines an invalidation level (support at 38.58) and a clear repair structure. REMX's neutral structure at the 52W low (structurally broken hard filter) and PICK's thin volume disqualify them; COPX's pullback into support with rising stochastic and +90.0 risk/reward (downside 1.5%, upside -18.5%) is the only mechanically clean option. The -16.5% SPY relative strength is severe, but momentum confirmation is 0.0 across all three candidates, making the risk/reward calculation the tiebreaker in a deteriorating sector.
Industrial metals receive 5% allocation despite a 0.0 final category score and zero eligibility rating because liquidity stress (-8), credit stress (-7), and dollar pressure (-7) at the macro level, combined with disinflation's -18.3% impact on copper and rare earth thesis, create a category collapse that cannot be voted away. COPX's perfect 100.0 timing score and +90.0 risk/reward offer a defined mean-reversion entry point if deflation fears reverse and credit stabilizes, but the 26.8/100 technical evidence score and 37.0/100 macro fit reflect deep category distress. The reasoned proof order (COPX 28.3, REMX 17.6, PICK 10.0) shows all nominees weak; after composite testing, the category drops to 0.0. The 5% allocation is a forced diversification holding in a portfolio that cannot afford to be 100% long precious metals and utilities. COPX is the sole holding because it offers the cleanest mechanical setup (oversold turn-up with defined support) for a reversal play, but allocation is contingent: if support at 38.58 breaks, the entire category reverts to zero, and that capital redeploys to high-conviction winners.
Emerging Markets — INDA
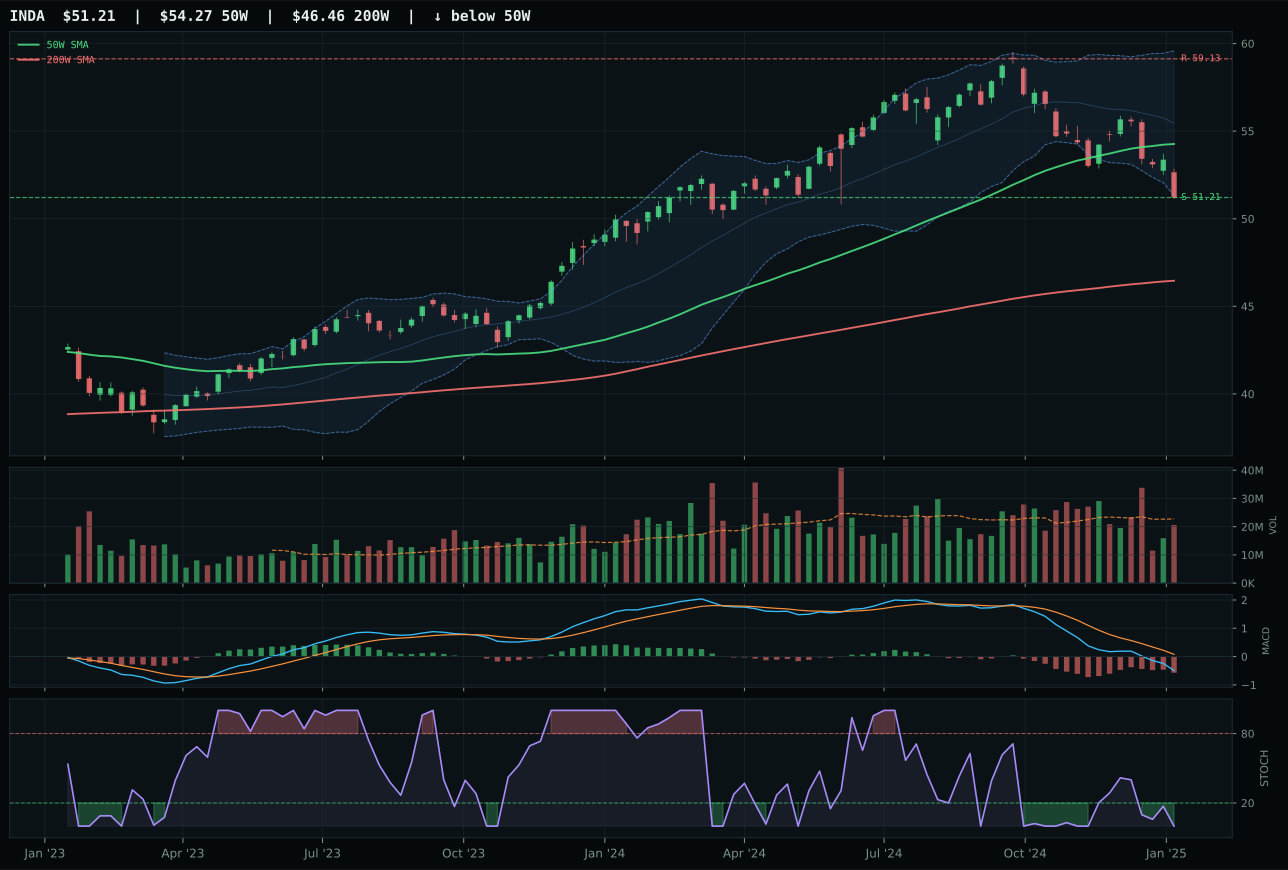
INDA has a pullback into support profile with -10.6% 13-week relative strength versus SPY.
A failed hold above support would weaken the setup.
Actionable but governed by invalidation levels.
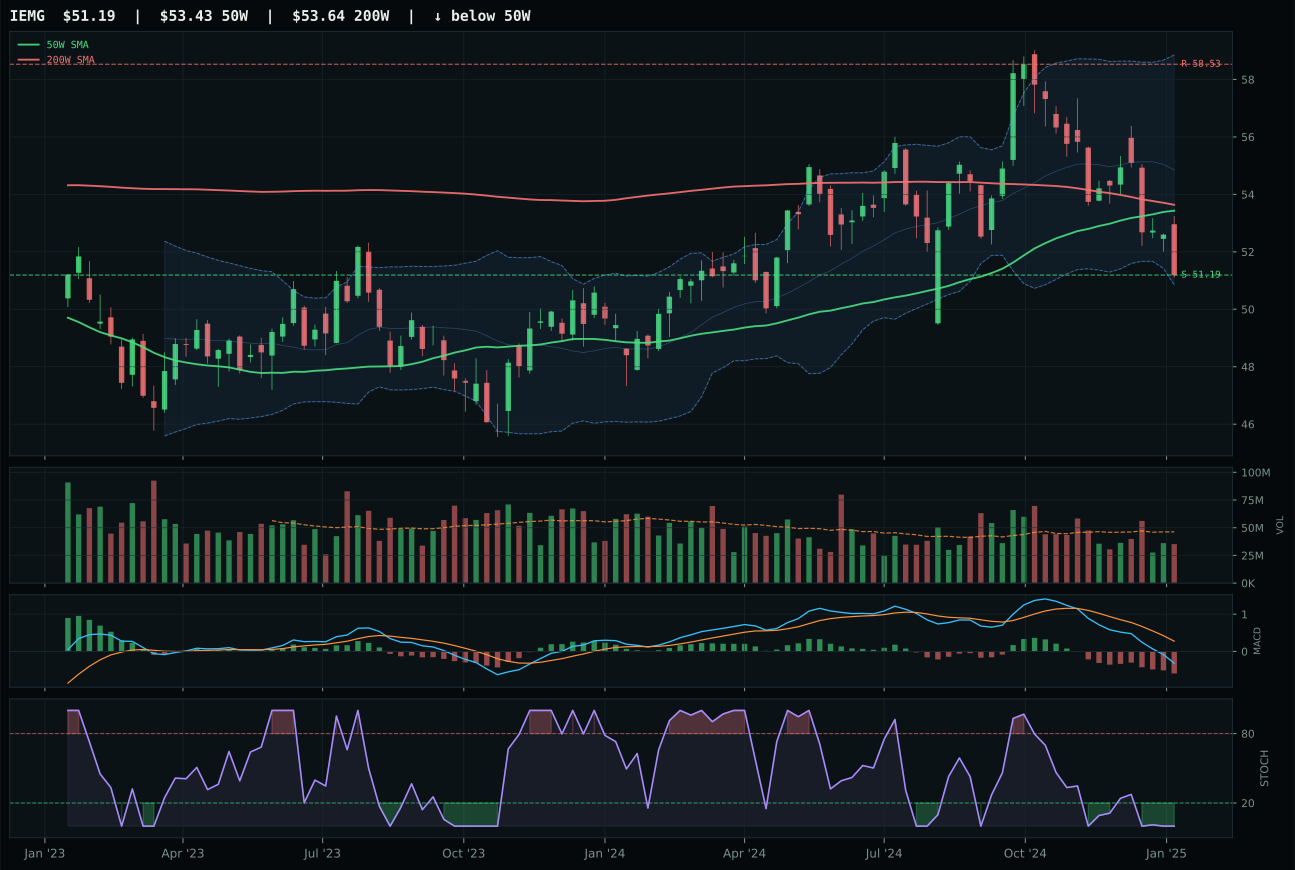
IEMG has a pullback into support profile with -11.6% 13-week relative strength versus SPY.
Extension and support failure are the main tactical risks.
Tracked, but not top-2 eligible because: structurally broken.
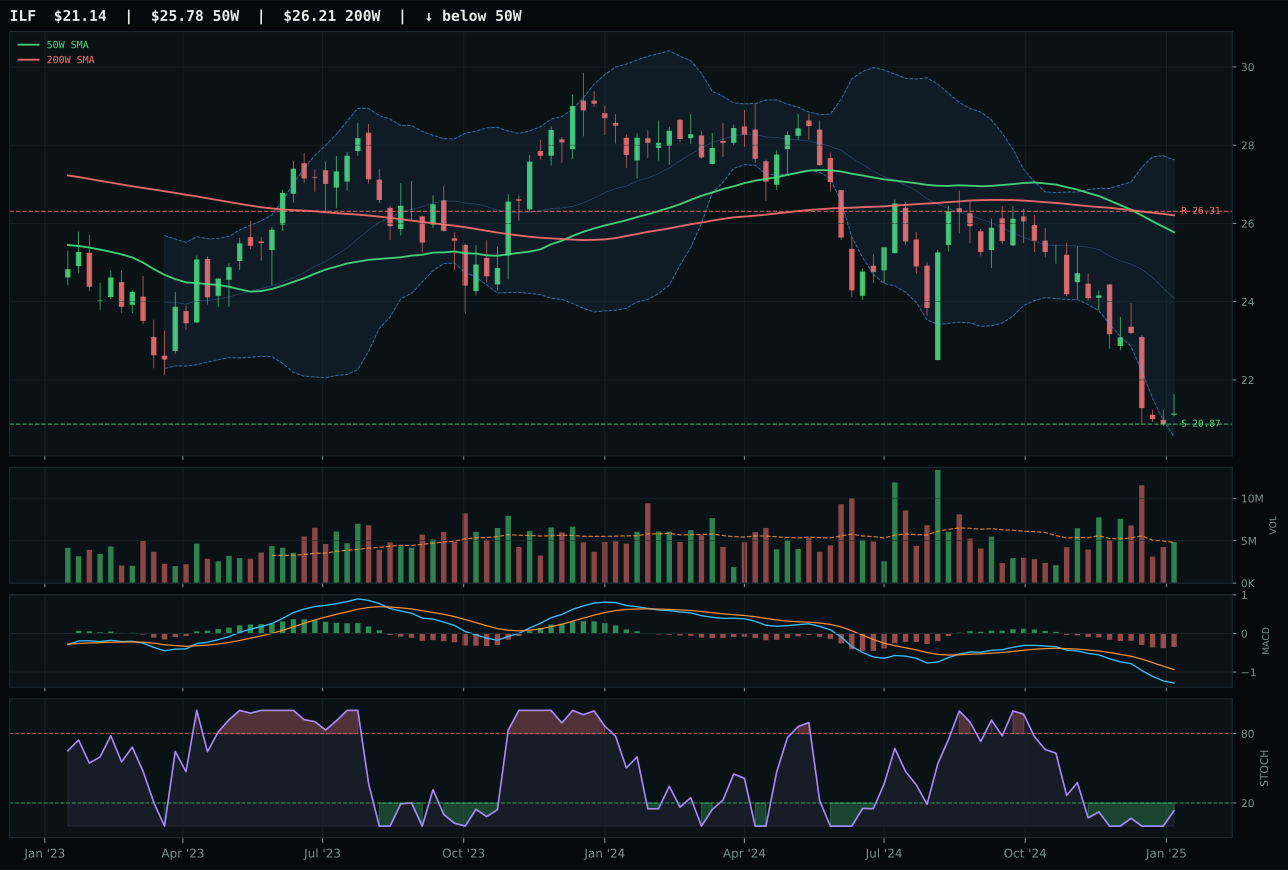
ILF has a pullback into support profile with -17.4% 13-week relative strength versus SPY.
Extension and support failure are the main tactical risks.
Tracked, but not top-2 eligible because: structurally broken.
INDA represents a collapsed emerging-markets category that has failed eligibility entirely, but wins the representative slot by scoring 27.0 in the reasoned proof order versus IEMG's 20.7 and ILF's 4.5. The representative shows +83.1 risk/reward (upside -13.4%, downside 0.0%) and +87.0 timing (pullback into support near 51.21 with oversold stochastic and deep Fib 0.786 zone), creating the most defined technical entry point despite -10.5% 13W return and -10.6% SPY relative strength. IEMG is disqualified by hard filters (structurally broken status), while ILF's -17.4% SPY relative strength and minimal volume place it as a non-candidate. INDA's pullback mechanics are clean—support at 51.21, Fib 0.786 compression, oversold RSI—but the 52.0 trend score (price below the 50W) and 0.0/100 momentum confirmation confirm that India exposure is purely a value repair play, not a growth allocation.
Emerging markets receive 5% allocation despite a 0.0 final category score and failed eligibility because dollar pressure (-14 points), credit stress (-10), liquidity stress (-10), and broad market bear (-9) have crushed the entire category to a 7.0/100 macro fit. INDA's +1.0% category-relative strength and +83.1 risk/reward offer a defined technical entry if support at 51.21 holds, but the -10.5% 13W return and 30.1/100 technical evidence score reveal this is damage control, not conviction. The reasoned proof order (INDA 27.0, IEMG 20.7, ILF 4.5) averages to 21.1; after composite testing against persistence, breadth, and macro fit, it drops to 0.0. The 5% allocation is tactical diversification rather than a conviction bet—portfolio construction requires some emerging-markets exposure, and INDA offers the cleanest mean-reversion setup in the three-candidate basket. This allocation is contingent on support holding and stochastic RSI converting into a recovery signal; if 51.21 breaks, the category reverts to zero immediately.
AI — SMH
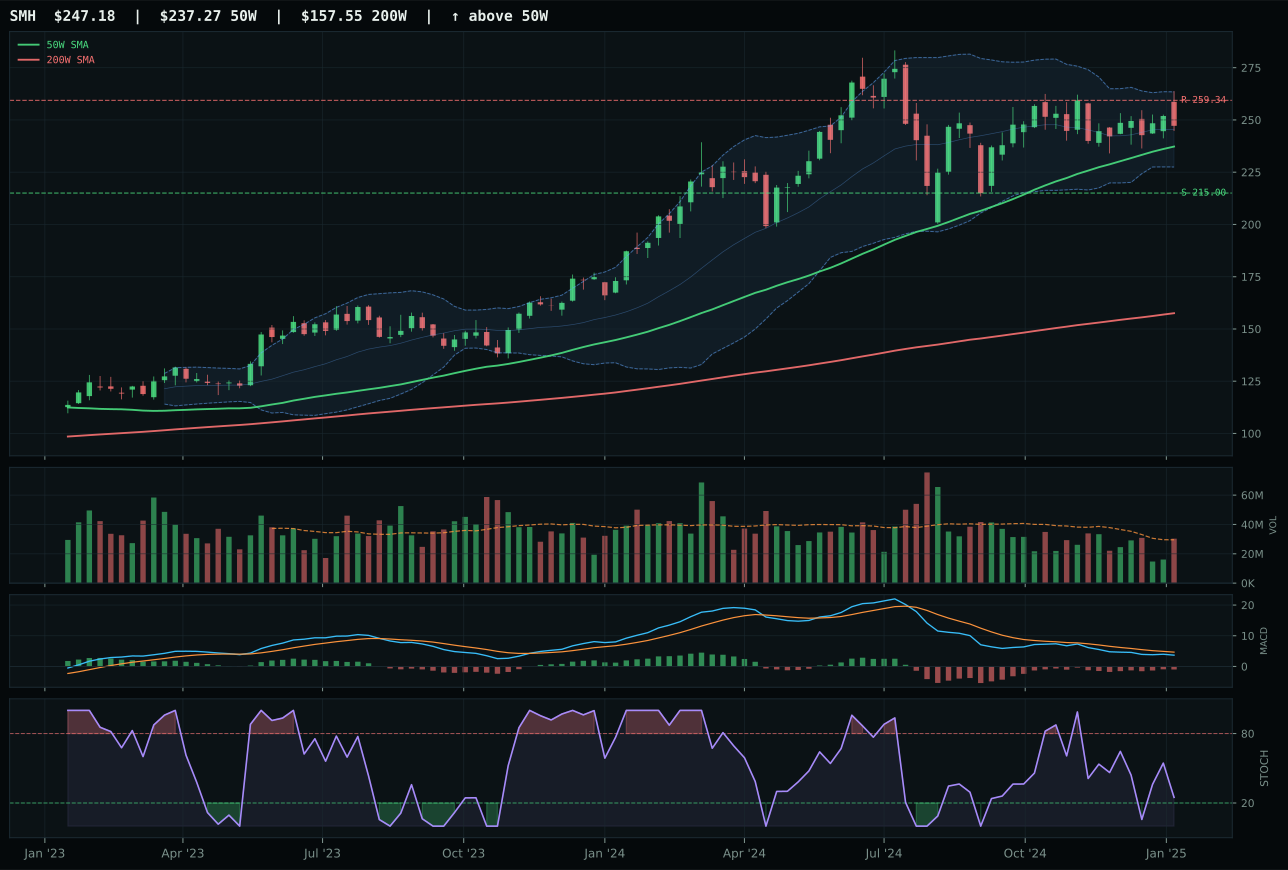
SMH has a neutral structure profile with -3.9% 13-week relative strength versus SPY.
A failed hold above support would weaken the setup.
Actionable but governed by invalidation levels.
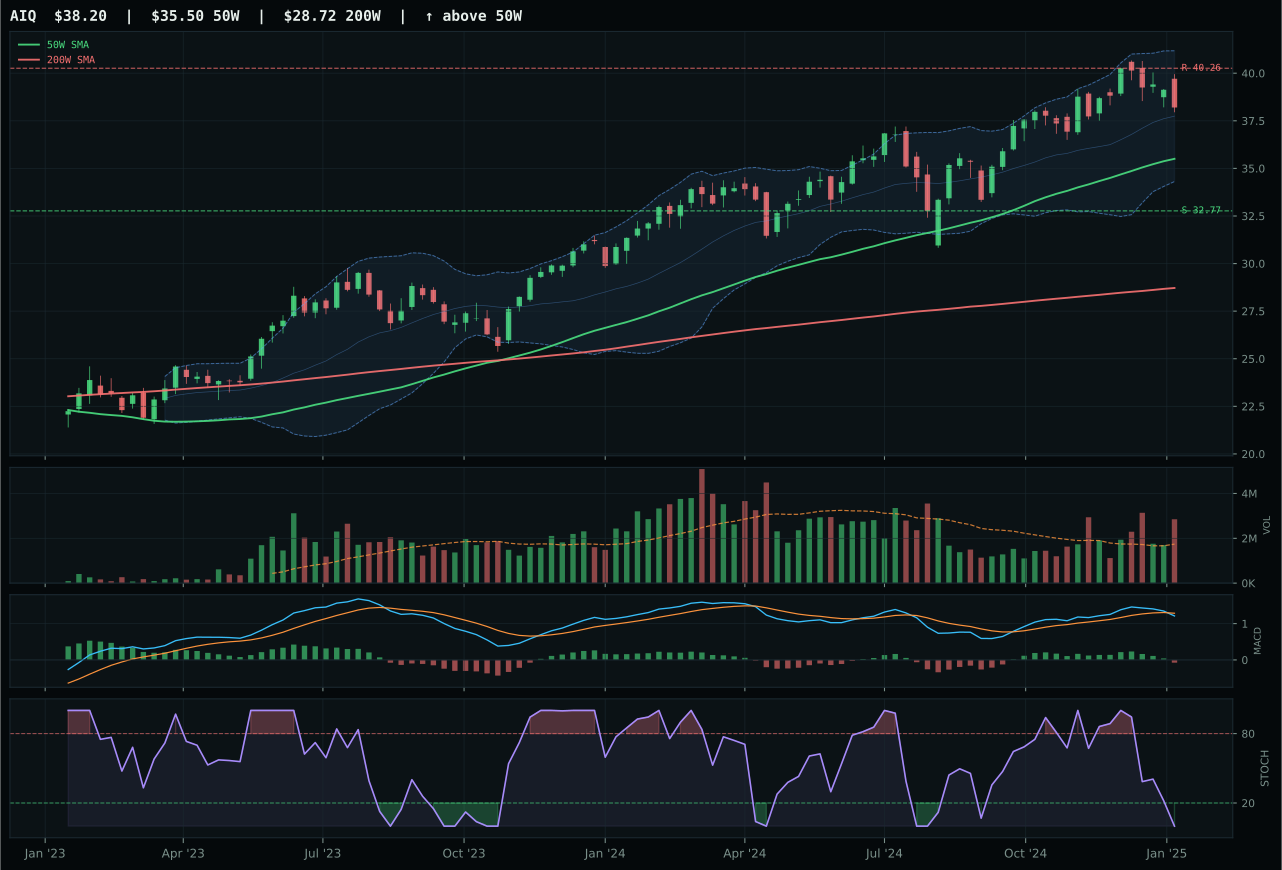
AIQ has a neutral structure profile with 0.4% 13-week relative strength versus SPY.
A failed hold above support would weaken the setup.
Actionable but governed by invalidation levels.
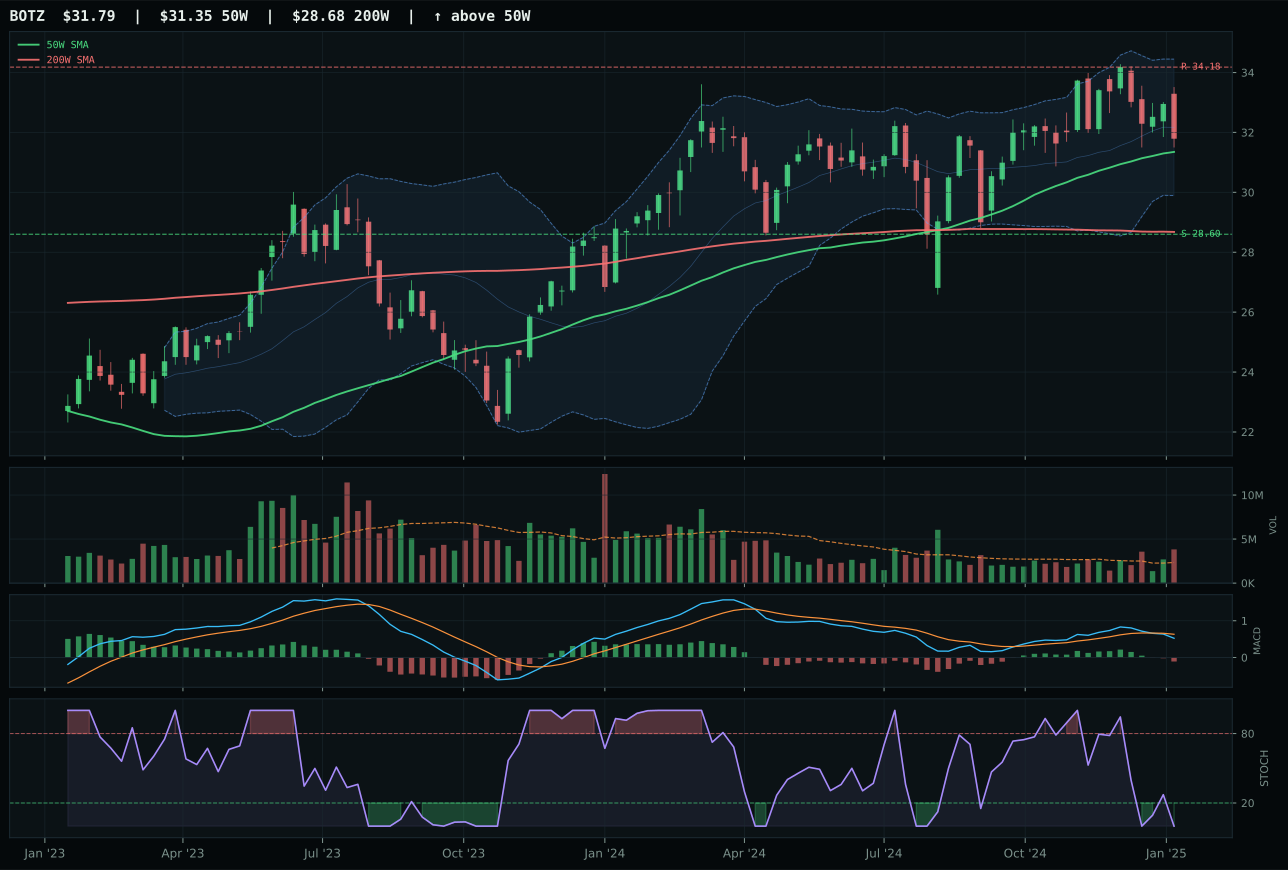
BOTZ has a compression near 50W profile with -1.4% 13-week relative strength versus SPY.
A failed hold above support would weaken the setup.
Actionable but governed by invalidation levels.
SMH wins by a decisive 17.4-point margin over AIQ because timing delivers a clean 98.0 score—MACD is bearish but improving, stochastic RSI sits in the rising mid-zone at 0.25, and price is only 4.2% from the 50W near a Fibonacci retracement inflection. This compression near support with rising momentum divergence is exactly the setup that precedes expansion moves; AIQ's stochastic oversold at 0.00 with bearish/weakening MACD and distribution pressure in volume creates the opposite signal—trapped strength being flushed. SMH's neutral volume at 1.03x the 20W average is clean confirmation that this is not a rally on panic buying; the -3.9% SPY relative strength is a secondary concern when the mechanical setup shows repair rather than deterioration. AIQ's 0.6% 13W return (category-relative +1.9%) cannot overcome the volume rejection and stochastic weakness that mark it as vulnerable to further distribution.
AI is excluded from allocation this week, ranked 9th or 10th with a 11.5 final score and 23.0/100 category macro fit. The disinflation regime, while modestly supportive of growth, is overwhelmed by liquidity stress (-12 points), credit stress (-8), broad market bear (-8), and dollar pressure (-4) that collectively suffocate semiconductor and software demand expectations. SMH's improving MACD is technically constructive but cannot offset macro deterioration: the reasoned ETF proof order shows SMH at 52.5 versus AIQ at 16.9, yet when tested against category-level persistence, sponsorship, and risk/reward in a bear environment, the composite drops to 11.5—below the threshold required to compete for the 5% tier-2 sleeve. This category needs credit stress to ease and liquidity to normalize before earning a portfolio position; technicals alone cannot fight macro headwinds of this magnitude.
Traditional Energy — FCG
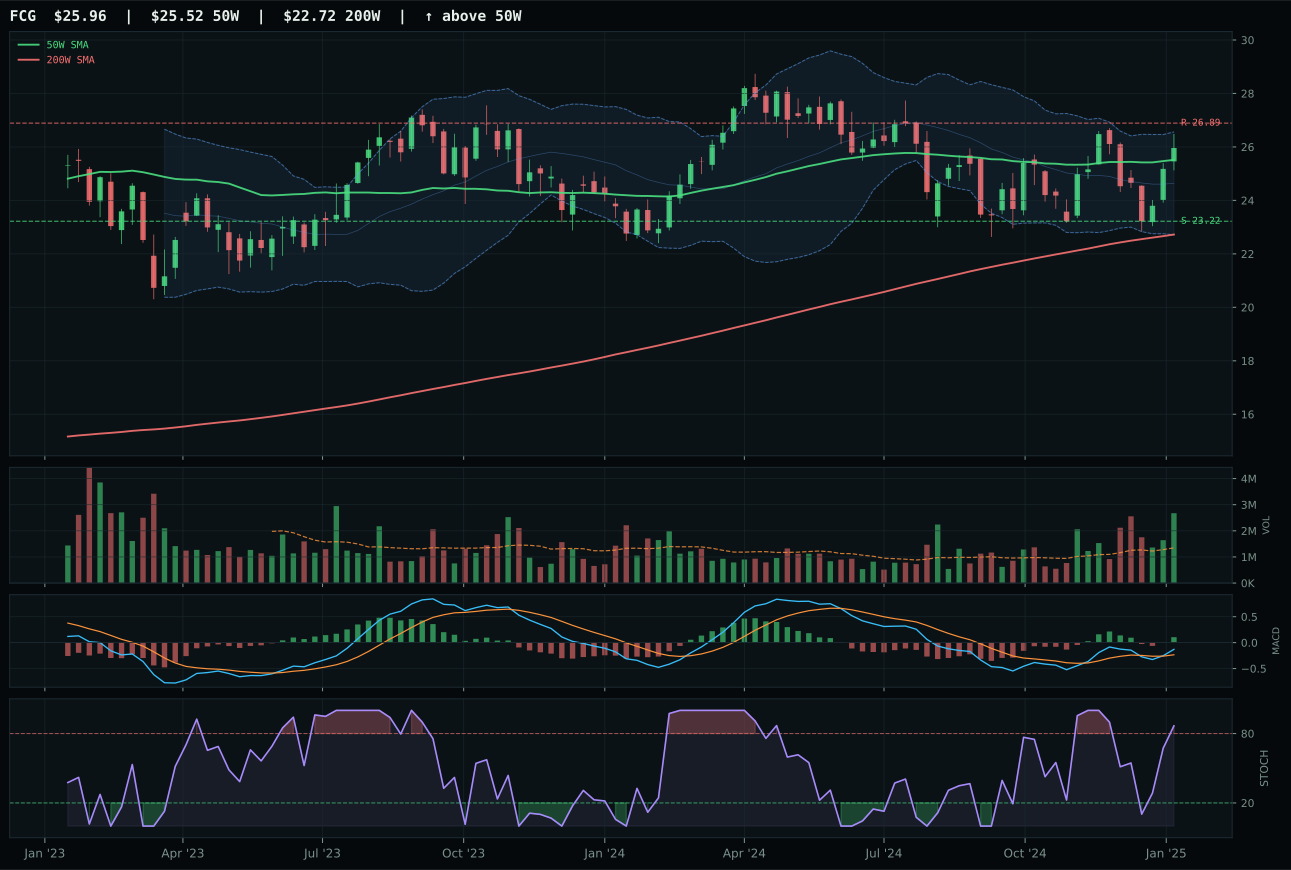
FCG has a compression near 50W profile with 2.3% 13-week relative strength versus SPY.
A failed hold above support would weaken the setup.
Actionable but governed by invalidation levels.
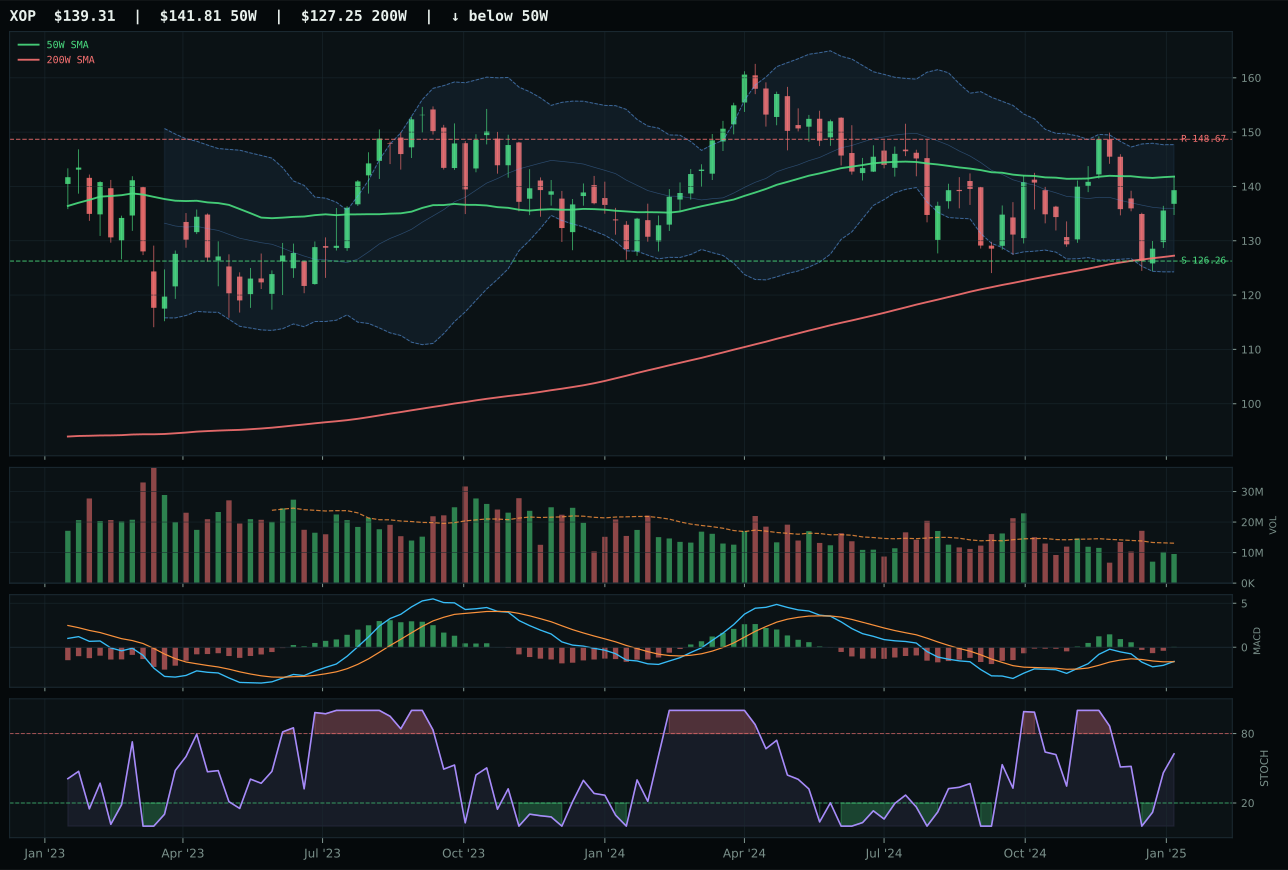
XOP has a compression near 50W profile with -1.2% 13-week relative strength versus SPY.
A failed hold above support would weaken the setup.
Actionable but governed by invalidation levels.
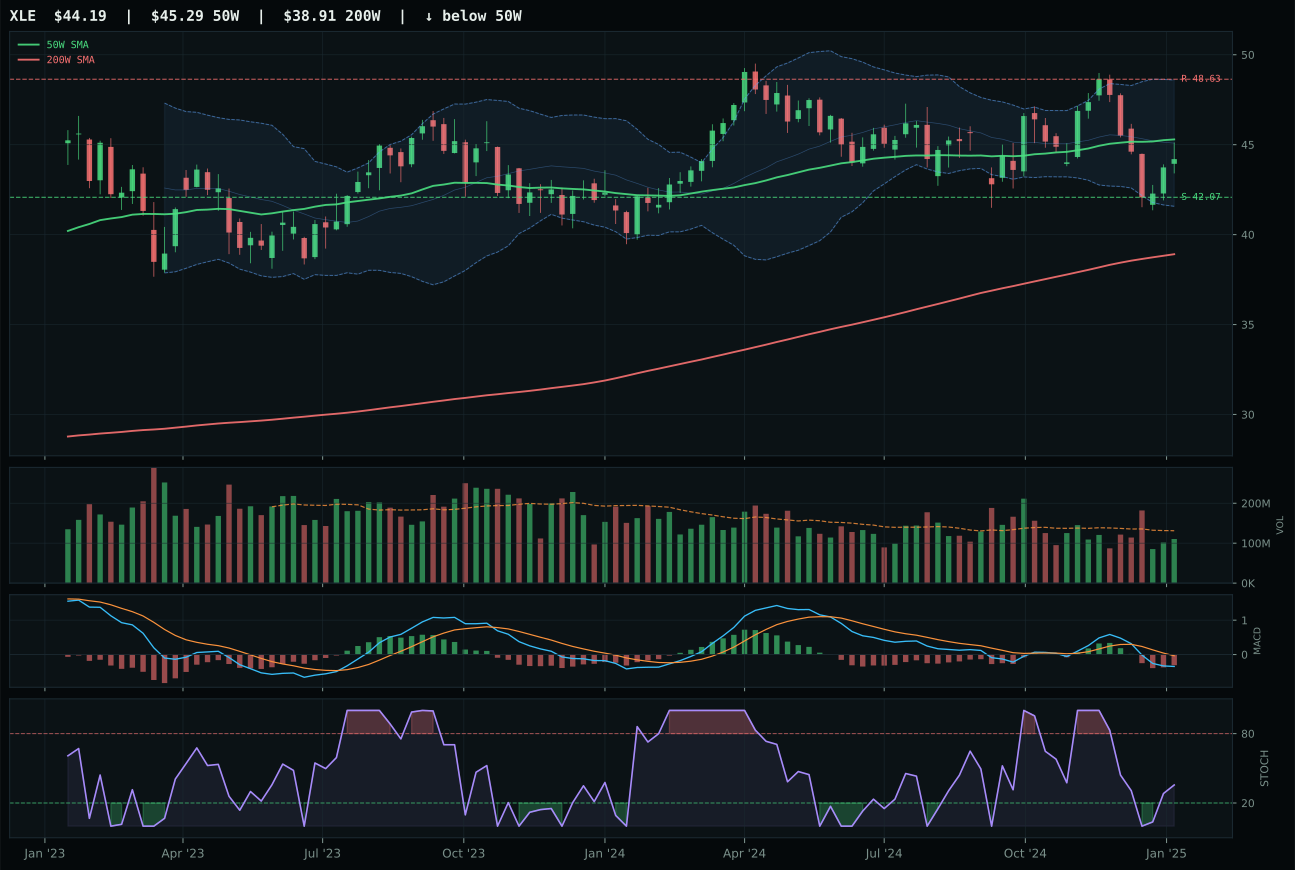
XLE has a compression near 50W profile with -4.9% 13-week relative strength versus SPY.
A failed hold above support would weaken the setup.
Actionable but governed by invalidation levels.
FCG dominates the energy complex with a near-perfect 100.0 trend score and 100.0 timing, delivering +90.8 momentum confirmation against a weak macro that kills the entire category. Price is 1.7% from the 50W in a compression setup; MACD is bullish and improving; stochastic RSI is overbought momentum at 0.87; and volume is 1.98x the 20W average with accumulation/confirmation signature. This is rare evidence of institutional accumulation despite disinflation headwinds, and the +90.2 volume-price confirmation score confirms buyers are showing up with size. XOP's bullish-but-flattening MACD and thin participation lose the mechanical race; XLE's bearish MACD and neutral volume place it last. FCG's +2.3% SPY relative strength and +3.4% category-relative advantage, combined with the perfect technical setup near the 50W decision zone, explain why this representative scores 100.0 on technical evidence—it is clean institutional accumulation in a bearish macro environment.
Traditional energy is excluded from allocation at 0%, ranked 9th or 10th with a 10.7 final score and 16.0/100 category macro fit that is devastated by disinflation hurting the exposure at -10 points and active disinflation pressure at -10. FCG's near-perfect technicals (100.0 trend, 100.0 timing) cannot overcome the reality that energy demand expectations are deflating faster than crude prices are falling; the 3/2/1 weighted basket (FCG 79.4, XOP 54.4, XLE 19.6) averages 61.1 before composite filters, but the category-level macro erosion collapses it to 10.7. This is the clearest example of how macro regime dominates technicals: FCG is showing institutional accumulation and ideal compression setup, yet the entire category is below the allocation threshold because disinflation and demand destruction override supply-side mechanics. The category would need credit stress to ease, dollar pressure to reverse, and disinflation pressure to become neutral before earning a 5% tier-2 slot; until then, the 10.7 composite score reflects a technically sound representative with a fundamentally broken category macro.