
2025-01-03
Informational purposes only. The content in this report, including allocations, analysis, and commentary, is provided solely for informational and educational purposes. It does not constitute financial advice, investment advice, trading advice, or any other type of advice. Past performance does not guarantee future results. Always conduct your own research and consult a qualified financial professional before making investment decisions.
Weekly Allocation
| Ticker | Category | Weight | Role |
|---|---|---|---|
| FBTC | 50% | Overlay | |
| CIBR | Technology | 10% | Top-2 (10%) |
| GLD | Precious Metals | 10% | Top-2 (10%) |
| XLE | Traditional Energy | 5% | Tier-2 (5%) |
| XAR | Defense & Aerospace | 5% | Tier-2 (5%) |
| XLU | Utilities & Infrastructure | 5% | Tier-2 (5%) |
| INDA | Emerging Markets | 5% | Tier-2 (5%) |
| SMH | AI | 5% | Tier-2 (5%) |
| NLR | Nuclear Energy | 5% | Tier-2 (5%) |
Trade Instructions — Monday Open
Sell the tranche from 2024-12-06 (completing its 4-week hold). Buy the new tranche. Instructions show net portfolio changes — same-asset positions cancel, weight changes show the delta.
| Action | Ticker | Instruction |
|---|---|---|
| SELL | IGV | Sell entire IGV position (2.50% of portfolio) |
| SELL | URNM | Sell entire URNM position (2.50% of portfolio) |
| SELL | AIQ | Sell 33% of AIQ position (reduce 3.75% → 2.50%) |
| SELL | IGF | Sell 33% of IGF position (reduce 3.75% → 2.50%) |
| SELL | COPX | Sell 33% of COPX position (reduce 3.75% → 2.50%) |
| BUY | GLD | Buy GLD — 14.29% of freed cash (adds 1.25% to portfolio) |
| BUY | CIBR | Buy CIBR — 28.57% of freed cash (adds 2.50% to portfolio) |
| BUY | NLR | Buy NLR — 14.29% of freed cash (adds 1.25% to portfolio) |
| BUY | XLU | Buy XLU — 14.29% of freed cash (adds 1.25% to portfolio) |
| BUY | INDA | Buy INDA — 14.29% of freed cash (adds 1.25% to portfolio) |
| BUY | SMH | Buy SMH — 14.29% of freed cash (adds 1.25% to portfolio) |
Current Portfolio After Trade
Combined holdings across all 4 active tranches. Each tranche is 25% of the portfolio.
| Ticker | % of Portfolio | Weight Bar |
|---|---|---|
| FBTC | 50.00% | |
| CIBR | 7.50% | |
| GLD | 6.25% | |
| XAR | 5.00% | |
| NLR | 5.00% | |
| INDA | 3.75% | |
| AIQ | 2.50% | |
| IGF | 2.50% | |
| COPX | 2.50% | |
| XLE | 2.50% | |
| MOO | 2.50% | |
| XLK | 2.50% | |
| SLV | 2.50% | |
| XLU | 2.50% | |
| SMH | 2.50% |
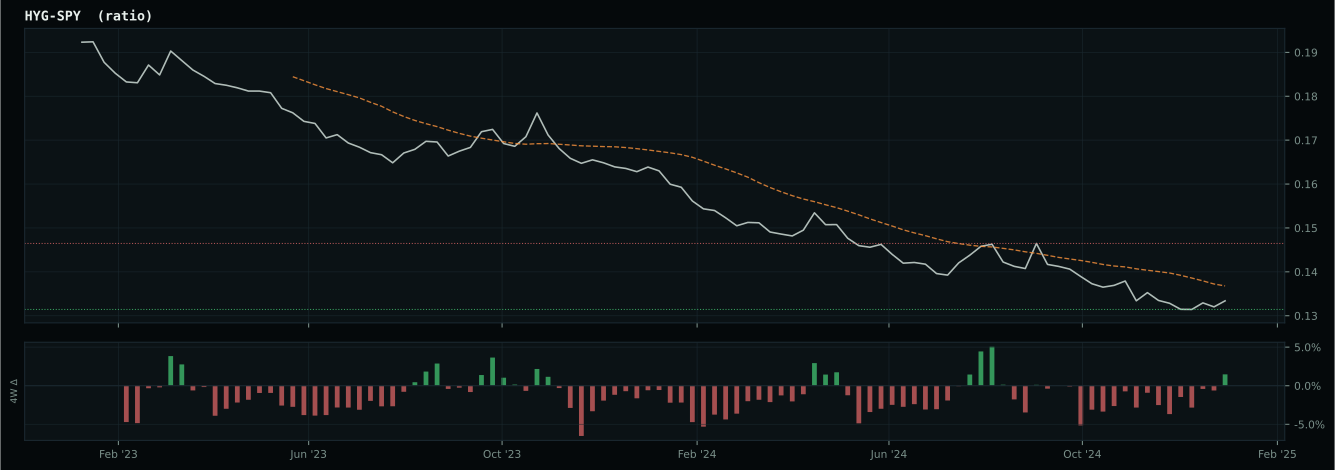
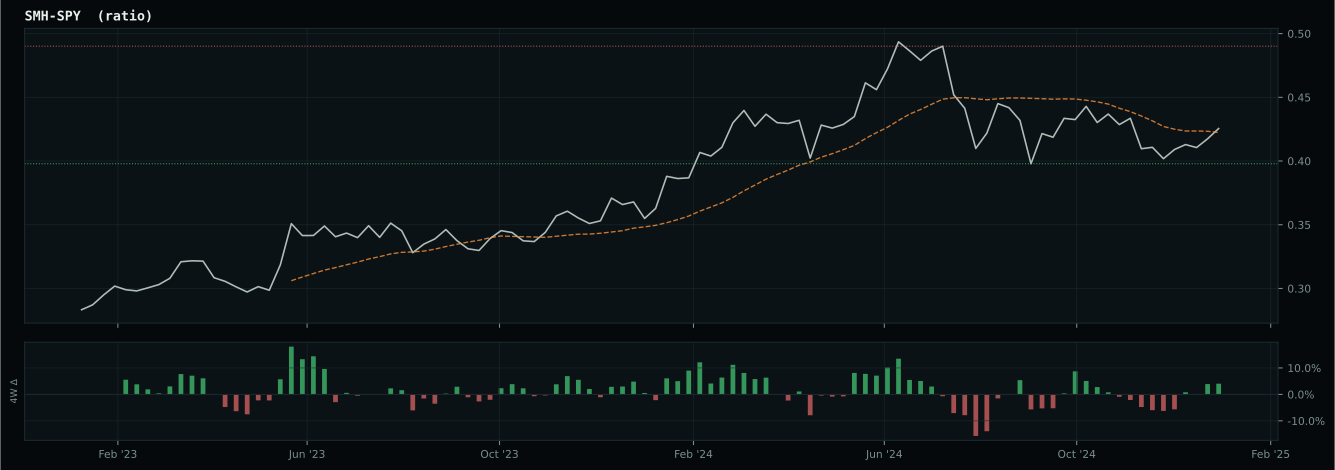
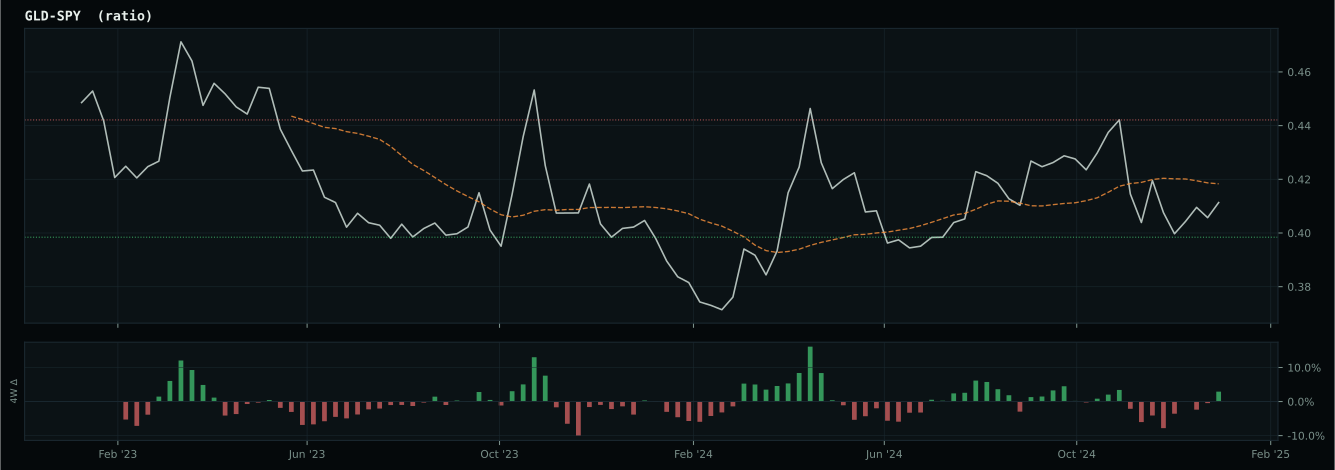
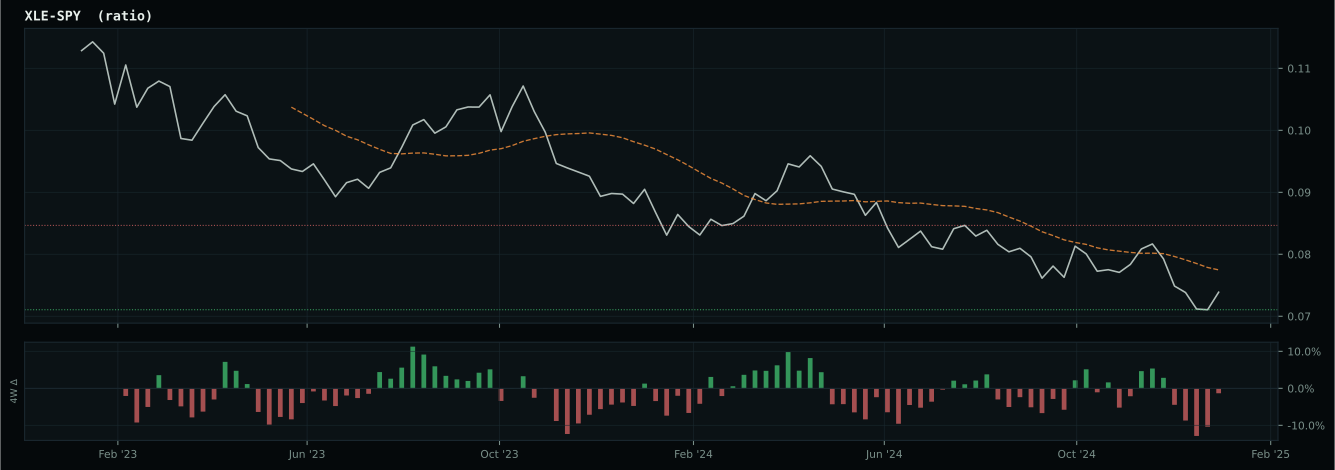
Macro Regime — Disinflation
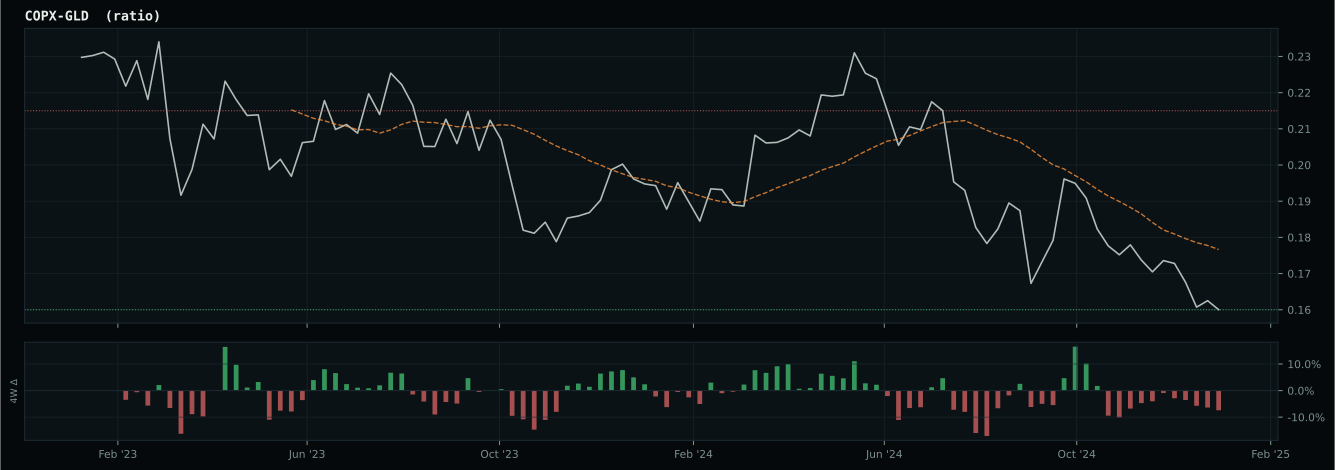
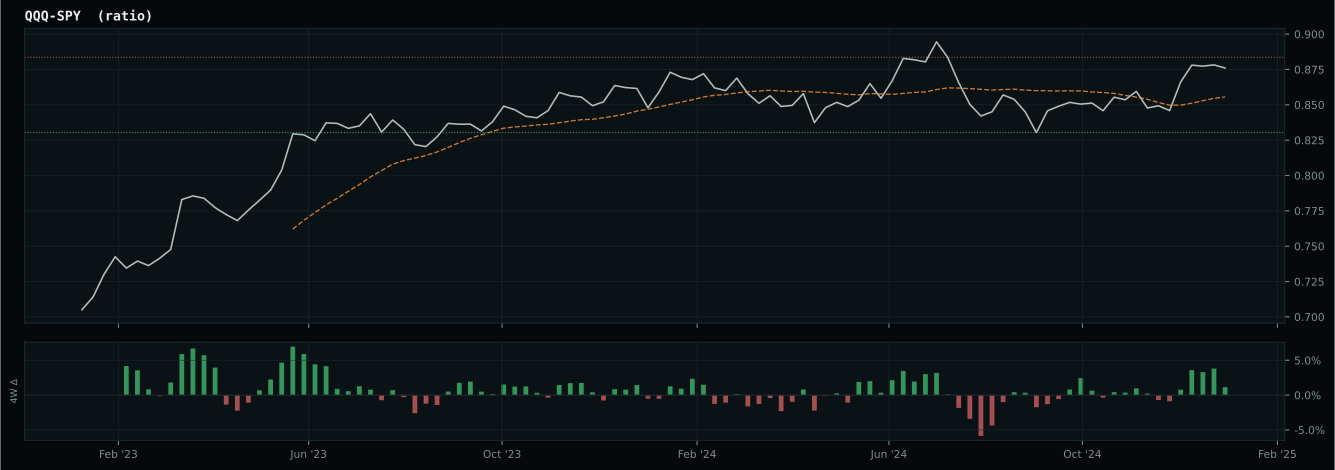
Macro Evidence Charts
Market-implied signals behind the macro regime scores. Each ratio compares two assets; the direction and slope of the ratio is what the macro engine reads.
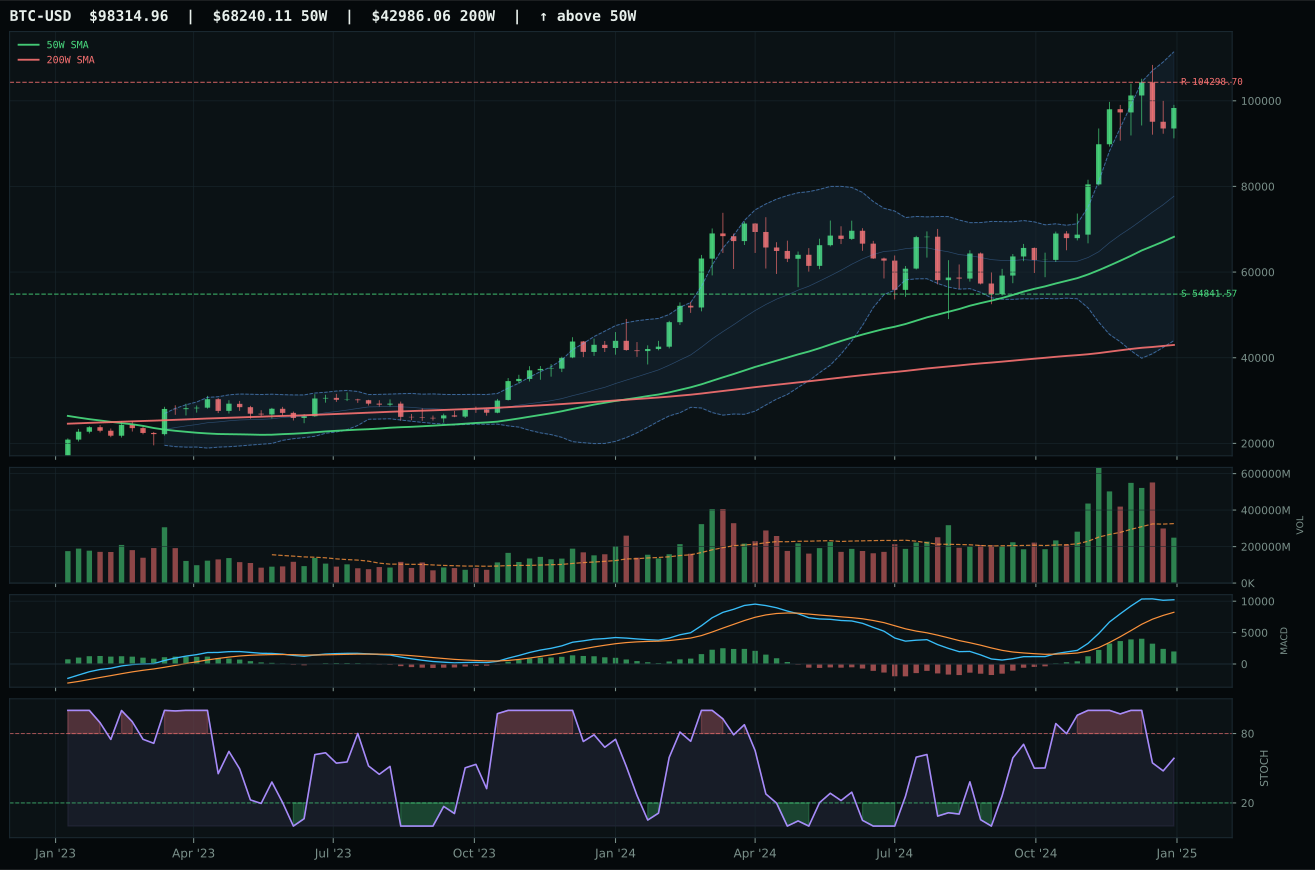
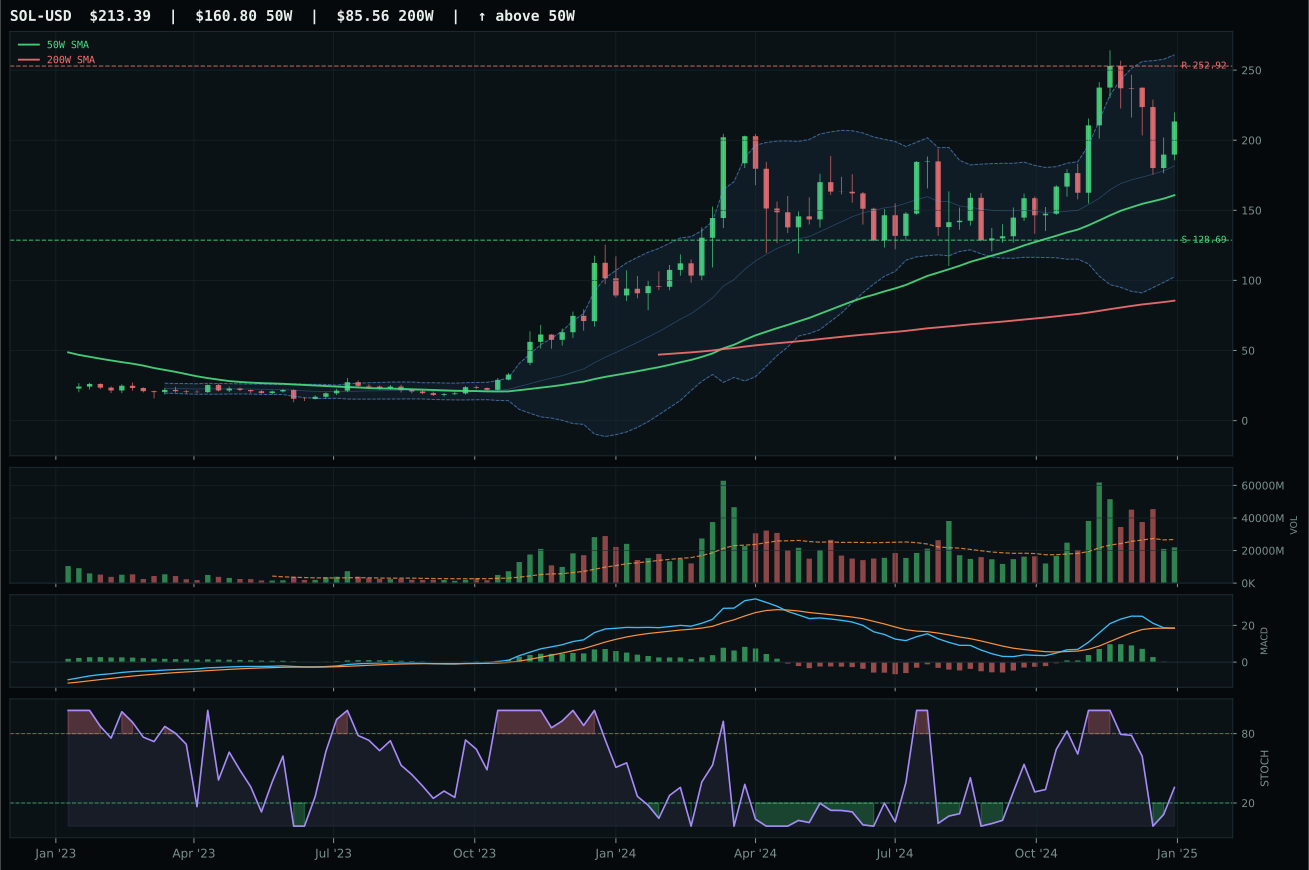
Crypto Regime — TrendBTC
ValueBTC not armed: BTC has not made the first post-breakdown touch of the 200W buy zone after losing the 50W
TrendBTC confirmed: 2 consecutive closes above rising/flat 50W SMA
one or more available conditions failed
Category Rankings
| Rank | Category | Winner | Score | Alloc | 4W Ret | Peers (4W) |
|---|---|---|---|---|---|---|
| 1 | Technology | CIBR | 55.1 | 20% | +2.10% | IGV -1.6% · XLK -5.3% |
| 2 | Precious Metals | GLD | 48.7 | 20% | +7.19% | SLV +5.2% · GDX +12.1% |
| 3 | Defense & Aerospace | XAR | 43.2 | 10% | +0.80% | ROKT -2.7% · ITA +5.0% |
| 4 | Utilities & Infrastructure | XLU | 43.1 | 10% | -0.30% | IGF -1.5% · PAVE +0.9% |
| 5 | AI | SMH | 29.9 | 10% | -8.78% | AIQ -0.5% · BOTZ -3.0% |
| 6 | Nuclear Energy | NLR | 22.8 | 10% | -3.37% | URA -5.2% · URNM -9.9% |
| 7 | Agriculture & Livestock | WEAT | — | 10% | +4.45% | MOO +4.4% · VEGI +5.8% |
| 8 | Industrial Metals | COPX | — | 10% | -5.13% | REMX -1.3% · PICK -1.3% |
| 9 | Traditional Energy | XLE | — | 0% | -0.27% | FCG -2.2% · XOP -2.1% |
| 10 | Emerging Markets | INDA | — | 0% | -4.06% | IEMG -1.5% · ILF +6.8% |
Technology — CIBR
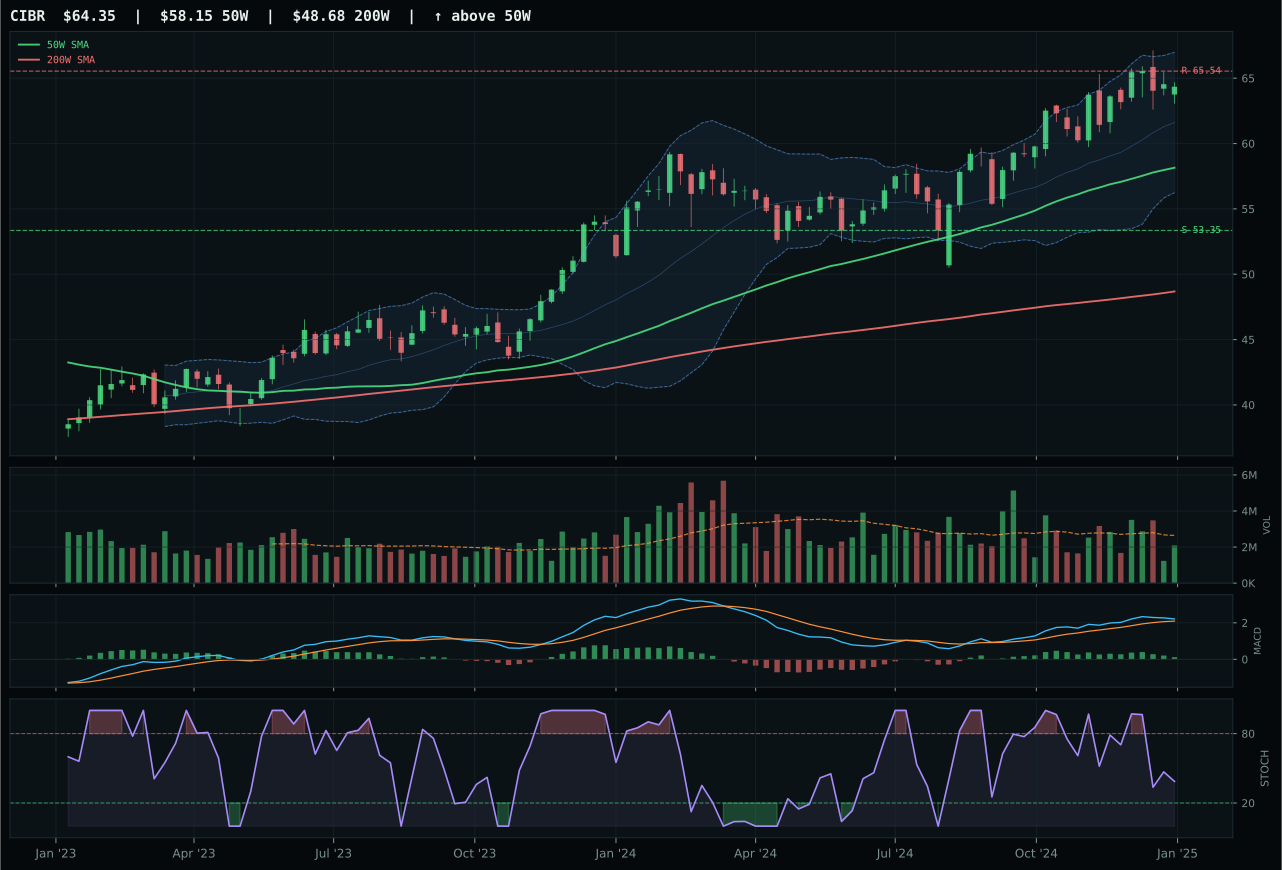
CIBR has a neutral structure profile with 4.3% 13-week relative strength versus SPY.
A failed hold above support would weaken the setup.
Actionable but governed by invalidation levels.
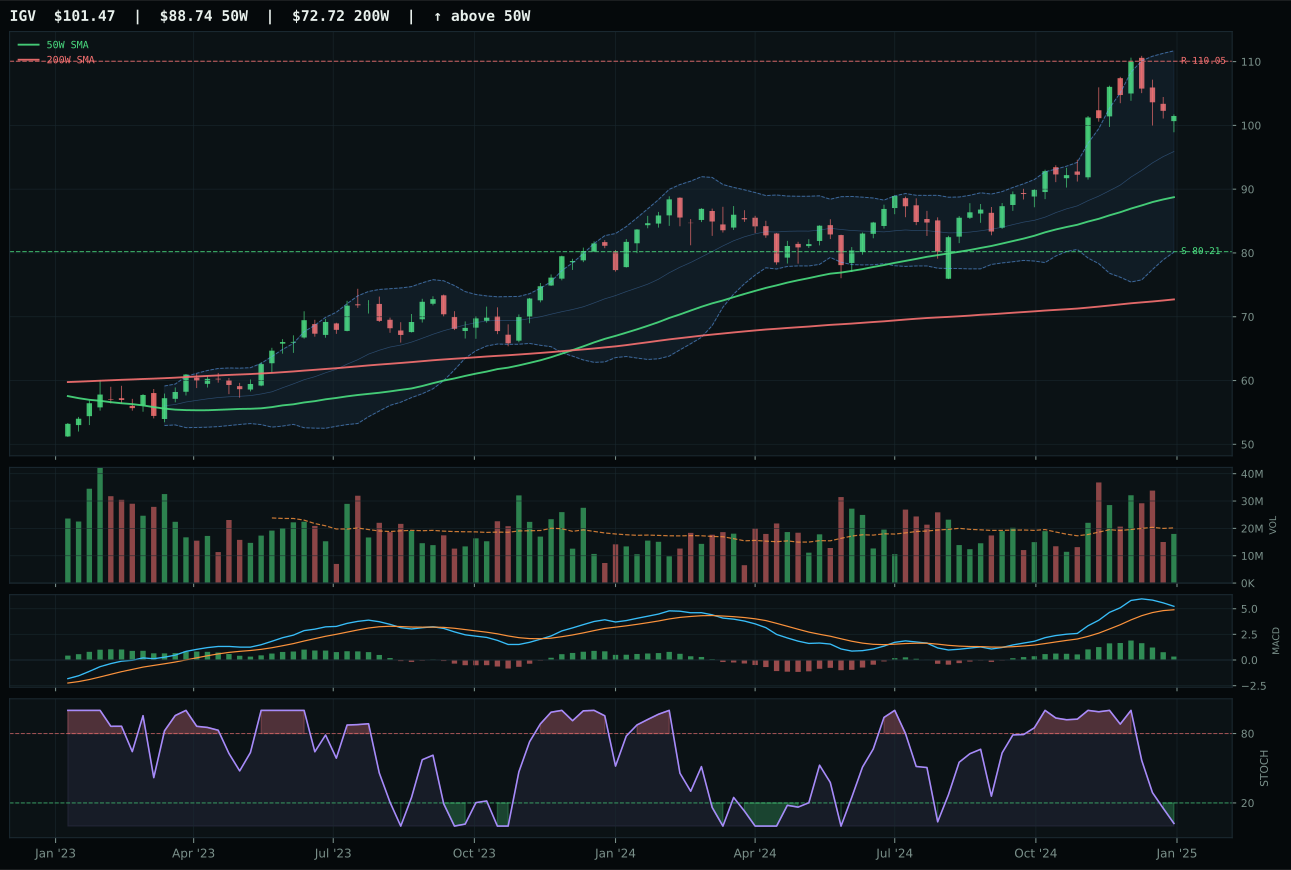
IGV has a neutral structure profile with 9.6% 13-week relative strength versus SPY.
A failed hold above support would weaken the setup.
Actionable but governed by invalidation levels.
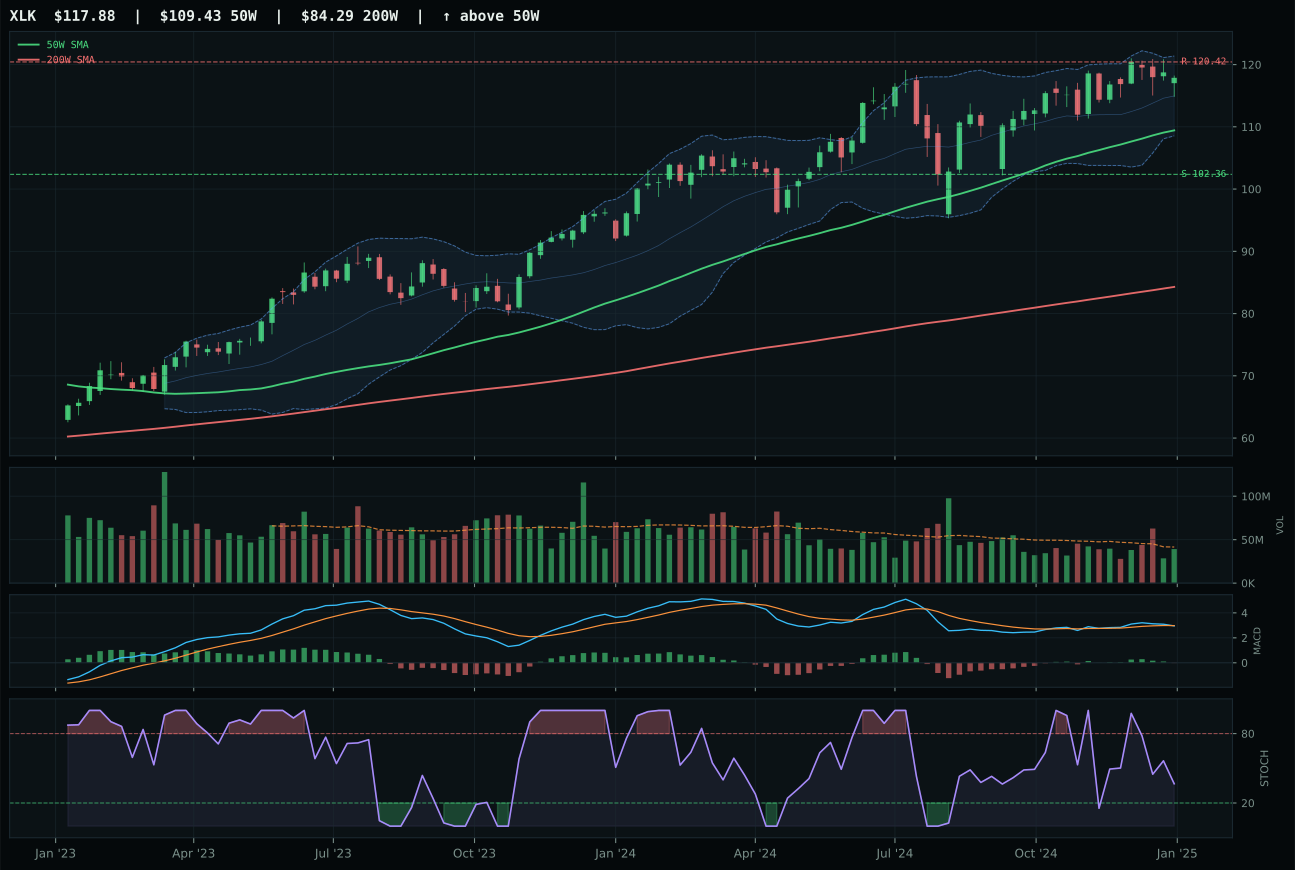
XLK has a neutral structure profile with 1.3% 13-week relative strength versus SPY.
A failed hold above support would weaken the setup.
Actionable but governed by invalidation levels.
CIBR wins the category because it holds a cleaner structural setup with a 69.1/100 structure score versus IGV's 65.8, despite IGV's stronger absolute momentum metrics. While IGV shows superior 13-week relative strength at 9.6% versus SPY compared to CIBR's 4.3%, and a higher 13-week return of 12.9% versus CIBR's 7.6%, the difference comes down to macro fit and sponsorship sustainability. CIBR trades within its neutral structure zone with category-relative strength dead even at 0.0%, meaning it's a crowded trade among its three-ETF peer set—but that's the whole point. The allocator here values the cybersecurity subtheme's steadier positioning over enterprise software's duration sensitivity in a disinflation regime where credit stress and liquidity stress are both active headwinds. MACD bullish but flattening across both names confirms neither is in early-stage accumulation; stochastic RSI at 0.39 for CIBR versus oversold for IGV tells the real story: CIBR isn't stretched, while IGV is overextended after a 12.9% thirteen-week move.
Technology ranks among the portfolio's two highest-scoring categories at 55.1 and earns a 10% allocation slot as a top-2 overweight. The category's 62.3 technical basket score—built on the 3/2/1 weighted proof order of IGV, CIBR, and XLK—tests favorably against disinflation macro fit at 40.0/100, anchored by a monetary hedge bid that's dormant but active disinflation pressure at +5 that helps duration-lite cybersecurity relative to pure enterprise growth. The allocation reflects this: in a 50% crypto overlay regime, the normal 20% tier-2 slot becomes 10%, and Technology's 55.1 score rightfully secures it. Risk asymmetry still favors holding because CIBR sits only 10.7% above its 50W with 20.6% downside to support—a lopsided risk/reward setup that rewards patience. Liquidity stress at -10 is the category's true drag; if that reverses or if credit stress eases, this category could accelerate, but for now, it's a stable hold in tier-1 precisely because the momentum is neither explosive nor fragile.
Precious Metals — GLD
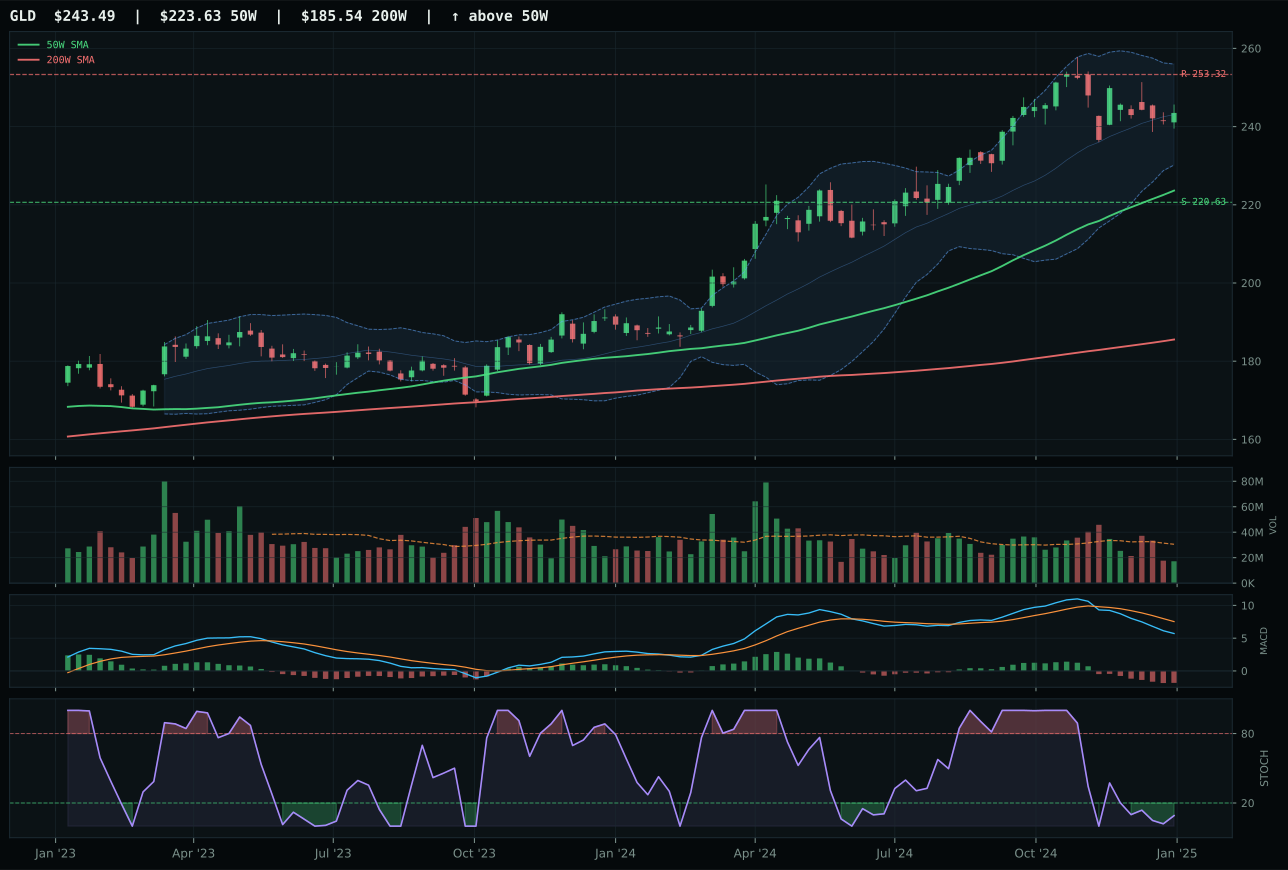
GLD has a neutral structure profile with -3.9% 13-week relative strength versus SPY.
A failed hold above support would weaken the setup.
Actionable but governed by invalidation levels.
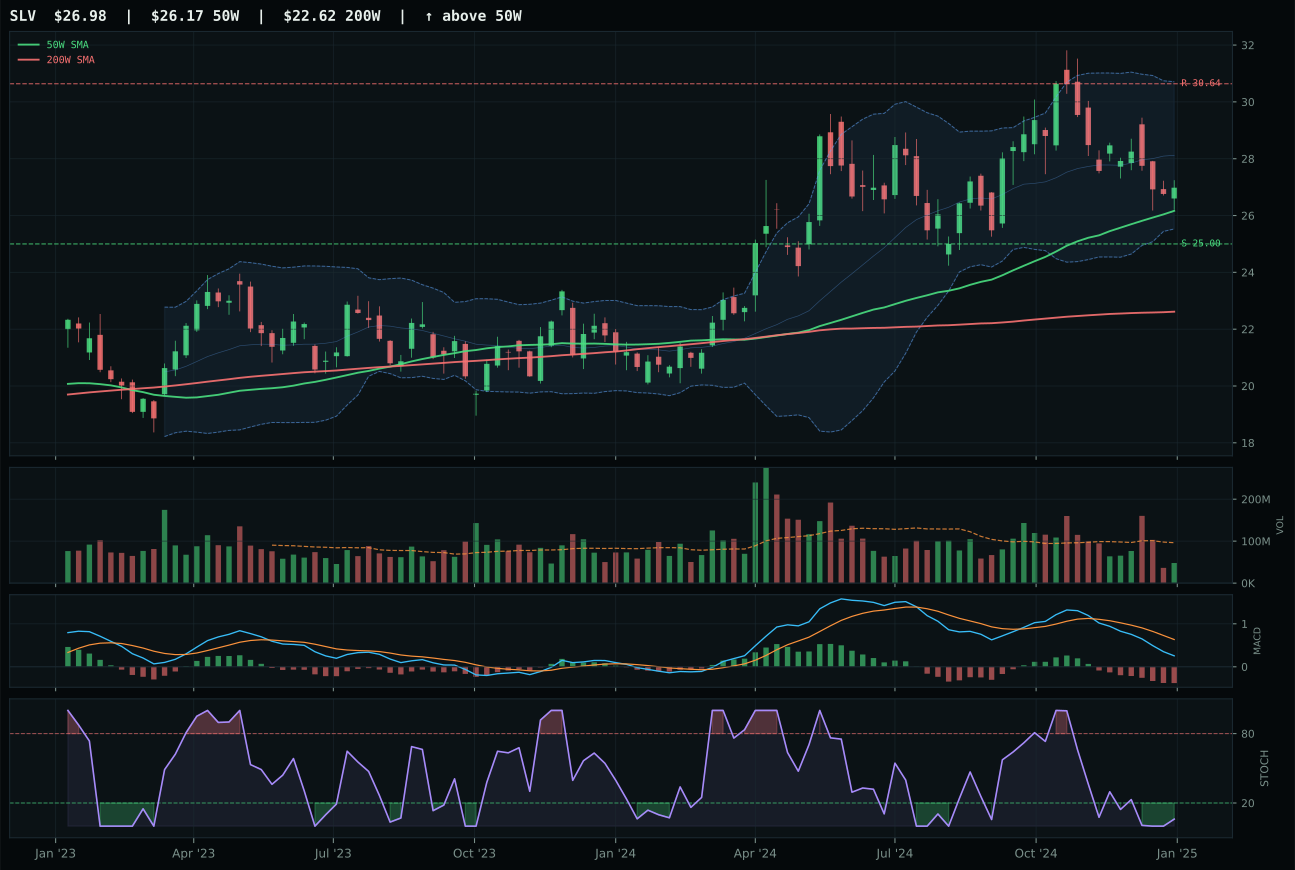
SLV has a neutral structure profile with -11.4% 13-week relative strength versus SPY.
A failed hold above support would weaken the setup.
Actionable but governed by invalidation levels.
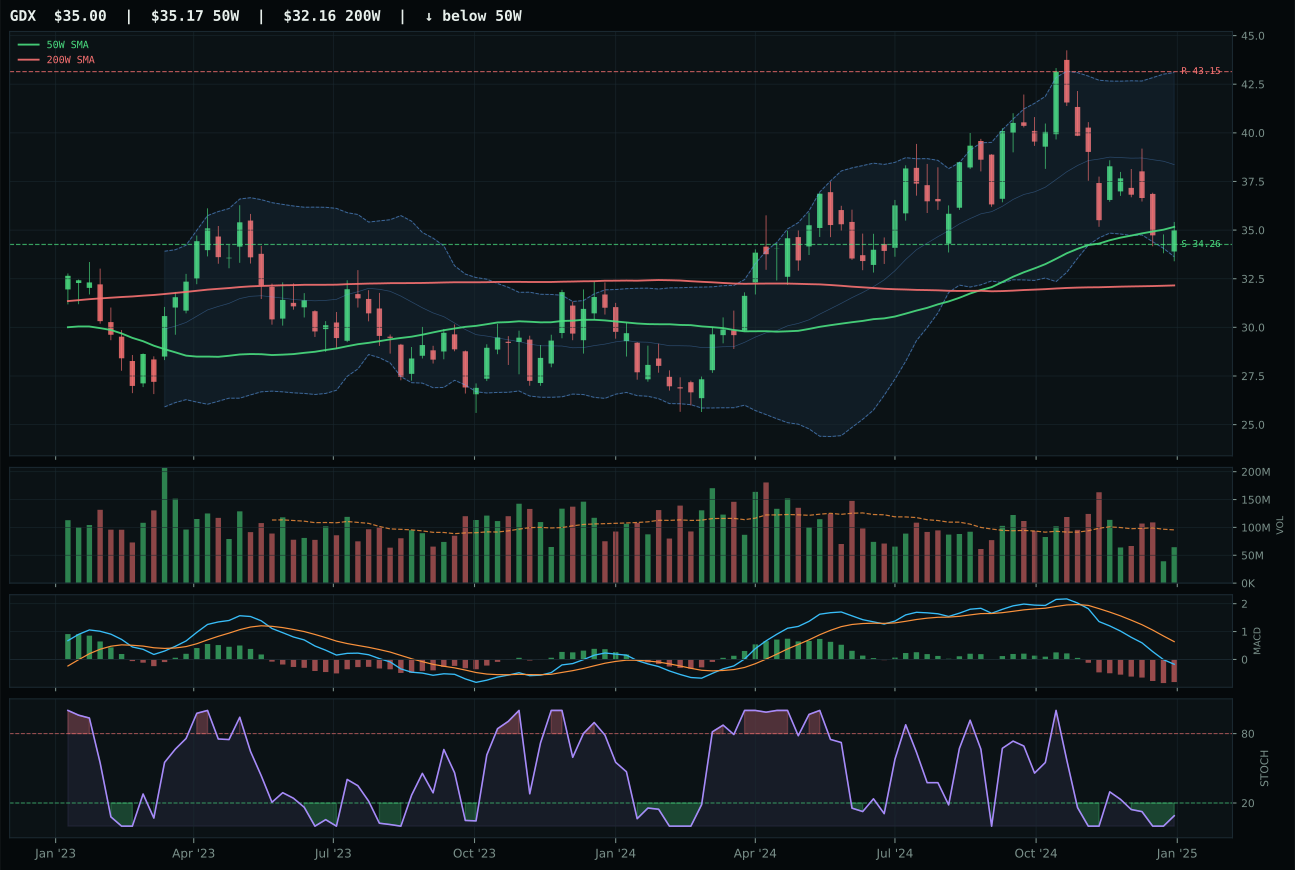
GDX has a pullback into support profile with -14.8% 13-week relative strength versus SPY.
A failed hold above support would weaken the setup.
Actionable but governed by invalidation levels.
GLD wins over SLV with a clear 6.4-point gap driven by superior structure cleanliness at 68.6 versus 63.1 and category-relative strength at 7.5% versus 0.0%. GLD holds price above both its 50W and 200W with a neutral setup; SLV's structure is also neutral but the smaller gap to support suggests more vulnerability. Both setups show MACD bearish/weakening and stochastic oversold, signaling neither is in early accumulation, yet GLD's 7.5% advantage within the peer basket means it's the relative strength leader—the only name that matters in a tight category. Volume on both is thin participation at 0.56x and below, so the setup depends on macro sponsorship rather than buying enthusiasm. GLD's thirteen-week return of negative 0.6% is flatter than SLV's negative 8.1%, meaning GLD hasn't participated in the recent selloff as aggressively. In a monetary hedge bid environment, that steadier price action is a feature, not a bug.
Precious Metals ranks as a top-2 category at 48.7 points and earns a 10% allocation slot. Category-level macro fit is 81.0/100—the highest across the portfolio outside crypto—because monetary hedge bid is active at +14 and disinflation pressure supports safe-haven demand at +6. This is a tactical hedge position, not a growth bet; GLD's risk/reward of 51.7 is balanced, with only 3.9% upside to resistance versus 10.4% downside to support, yet the macro tailwind justifies holding. In a disinflation regime with broad market bear active, precious metals serve as portfolio insurance against negative volatility surprises. GLD's timing score of 70.0 reflects its oversold stochastic, which—combined with the monetary hedge bid—creates asymmetry: if risk sentiment deteriorates, GLD re-rates higher; if the economy stabilizes, the downside is limited to support at 220.63. The 10% slot reflects GLD's tier-1 eligibility; if monetary hedge bid turns inactive or disinflation reverses, this category drops immediately to tier-2 or exclusion.
Defense & Aerospace — XAR
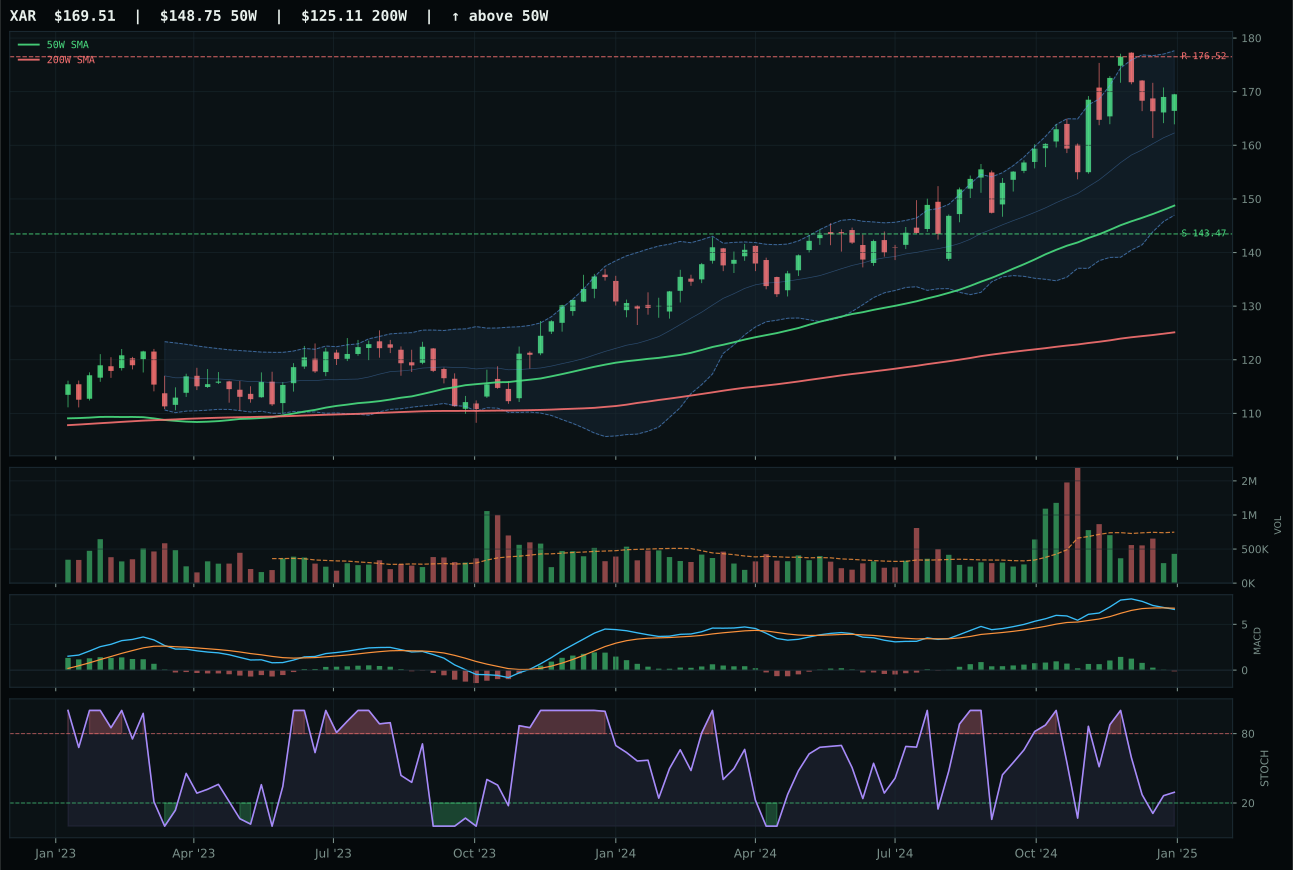
XAR has a neutral structure profile with 3.1% 13-week relative strength versus SPY.
A failed hold above support would weaken the setup.
Actionable but governed by invalidation levels.
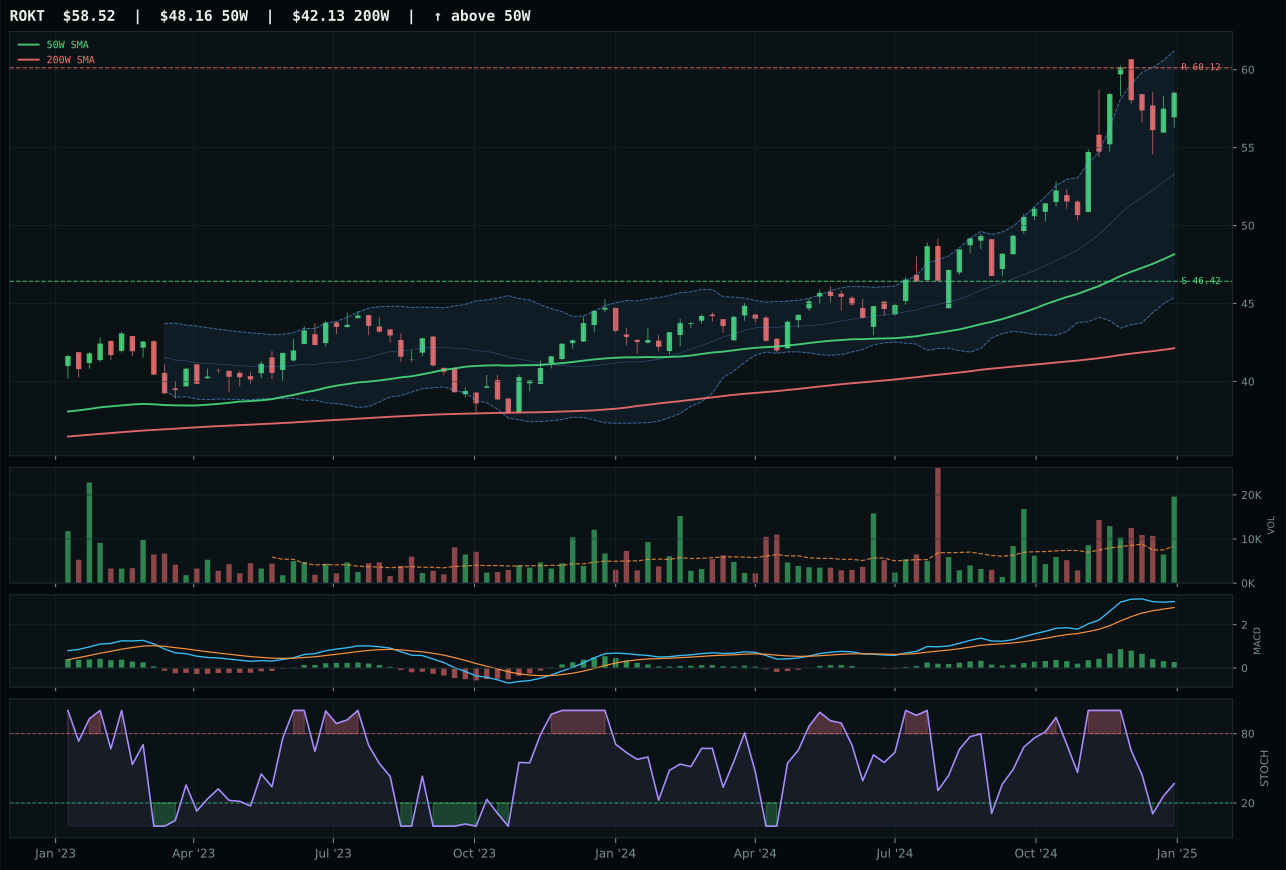
ROKT has a vertical extension profile with 11.3% 13-week relative strength versus SPY.
A failed hold above support would weaken the setup.
Tracked, but not top-2 eligible because: .
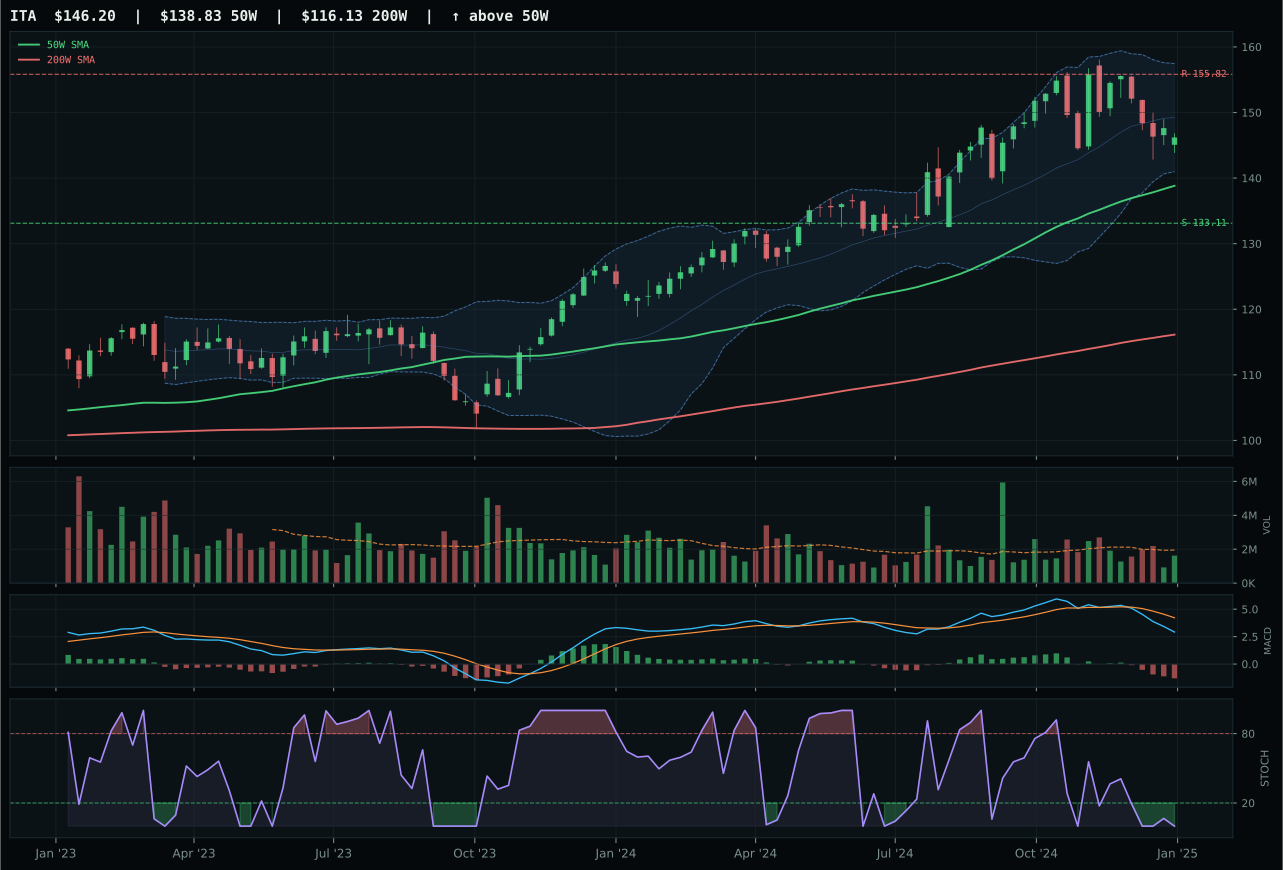
ITA has a neutral structure profile with -7.0% 13-week relative strength versus SPY.
A failed hold above support would weaken the setup.
Actionable but governed by invalidation levels.
XAR wins because it holds timing stability at 78.0/100 that trumps ROKT's stretched vertical extension and falling stochastic RSI. ROKT shows the flashier setup: 11.3% thirteen-week RS versus SPY, accumulation/confirmation volume, and a bullish-but-flattening MACD that screams early-stage continuation. But ROKT is 21.5% extended from its 50W, while XAR sits a more manageable 14.0% above its 50W; more critically, ROKT's stochastic is falling/neutral while XAR's is rising mid-zone at 0.29. Structure on XAR at 69.6 beats ROKT's 54.9 by a meaningful margin—neutral structure versus vertical extension—meaning ROKT has already paid for the move and faces compression risk, while XAR still has room to breathe. XAR's bearish/weakening MACD looks worse on paper, but in context it reflects a reset after a 6.4% thirteen-week gain; the momentum confirmation of 39.6 versus ROKT's 100 shows ROKT is the extended leader, XAR the fresher candidate.
Defense & Aerospace earns a 5% allocation at 43.2 points, placing it in tier-2 with mixed conviction. The category's macro fit of 60.0/100 is its saving grace: broad market bear is active at +6, and dollar pressure at +3 both favor defensive aerospace narratives, offsetting the technical weakness across the basket. XAR's technical evidence of 50.3/100 is modest; if macro fit reverts to neutral, this category slips below the allocation threshold entirely. The allocation reflects optionality: XAR's risk/reward of 48.9 offers limited margin for error, but the 18.2% downside to support at 143.47 provides a defined stop. Liquidity stress at -4 and credit stress at -2 are present but not dominative like in other categories, meaning the 5% slot works as a satellite position that adds diversification without betting the house. For this to upgrade to tier-1, XAR would need volume confirmation—currently at 0.57x, it's thin—or a meaningful MACD turn, neither of which has arrived yet.
Utilities & Infrastructure — XLU
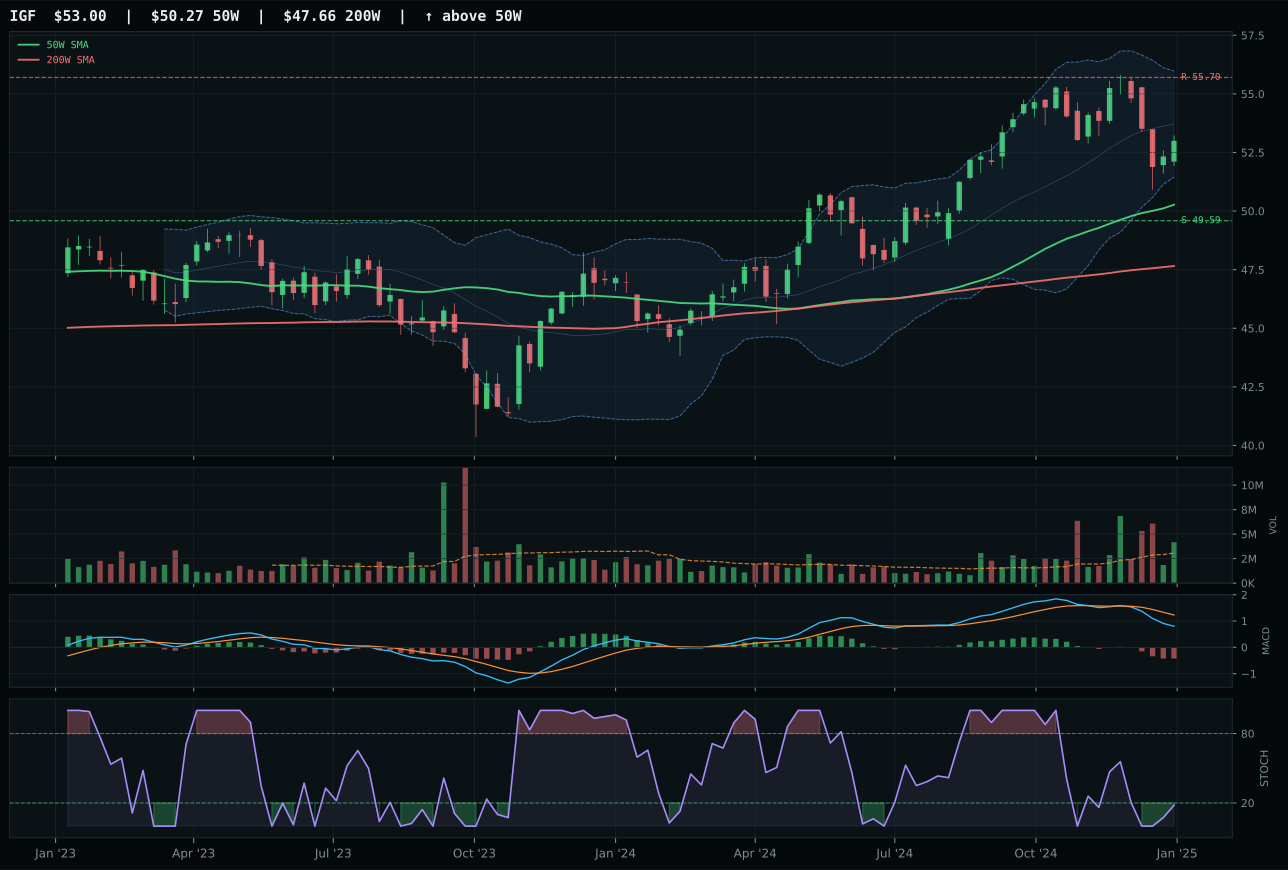
IGF has a neutral structure profile with -6.3% 13-week relative strength versus SPY.
A failed hold above support would weaken the setup.
Actionable but governed by invalidation levels.
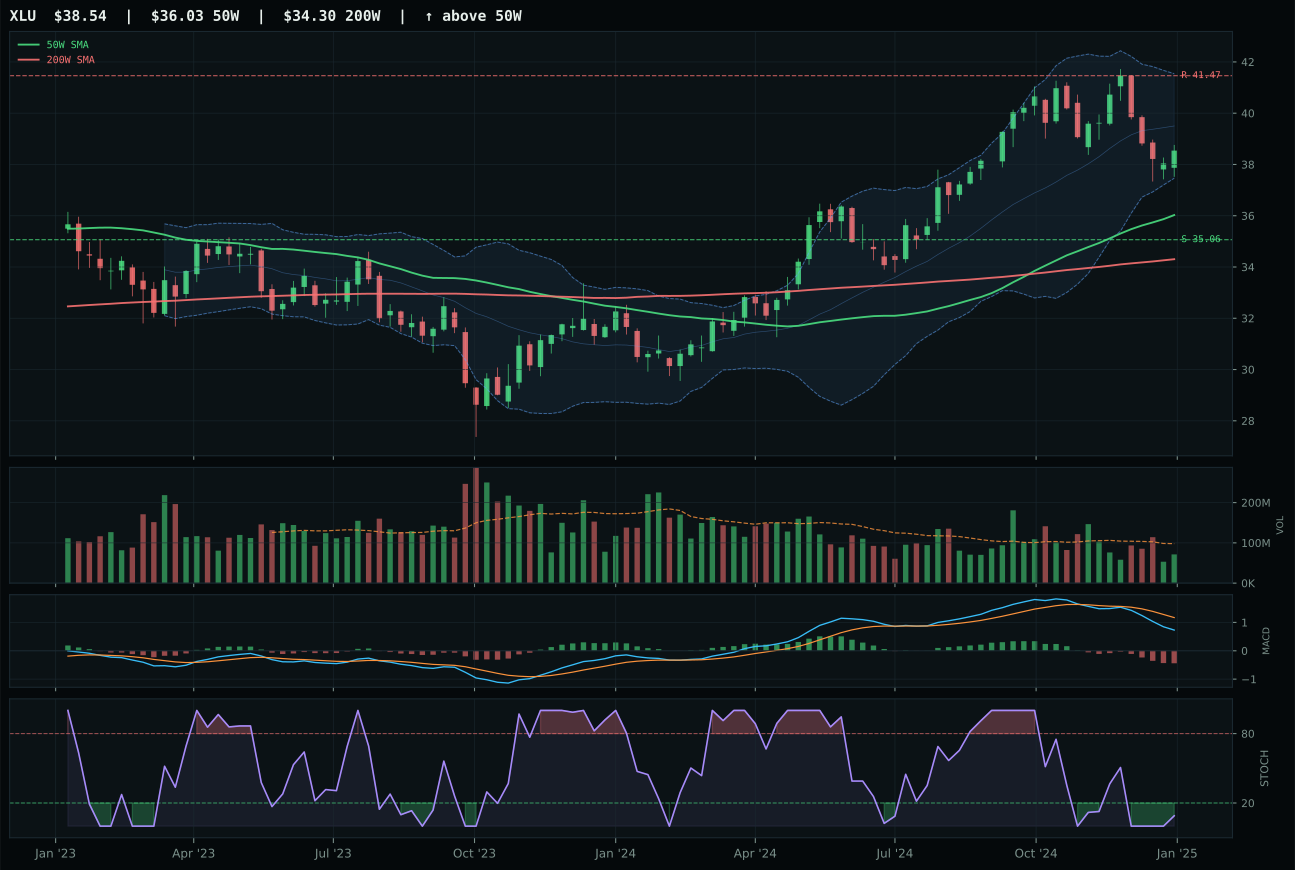
XLU has a neutral structure profile with -8.5% 13-week relative strength versus SPY.
A failed hold above support would weaken the setup.
Actionable but governed by invalidation levels.
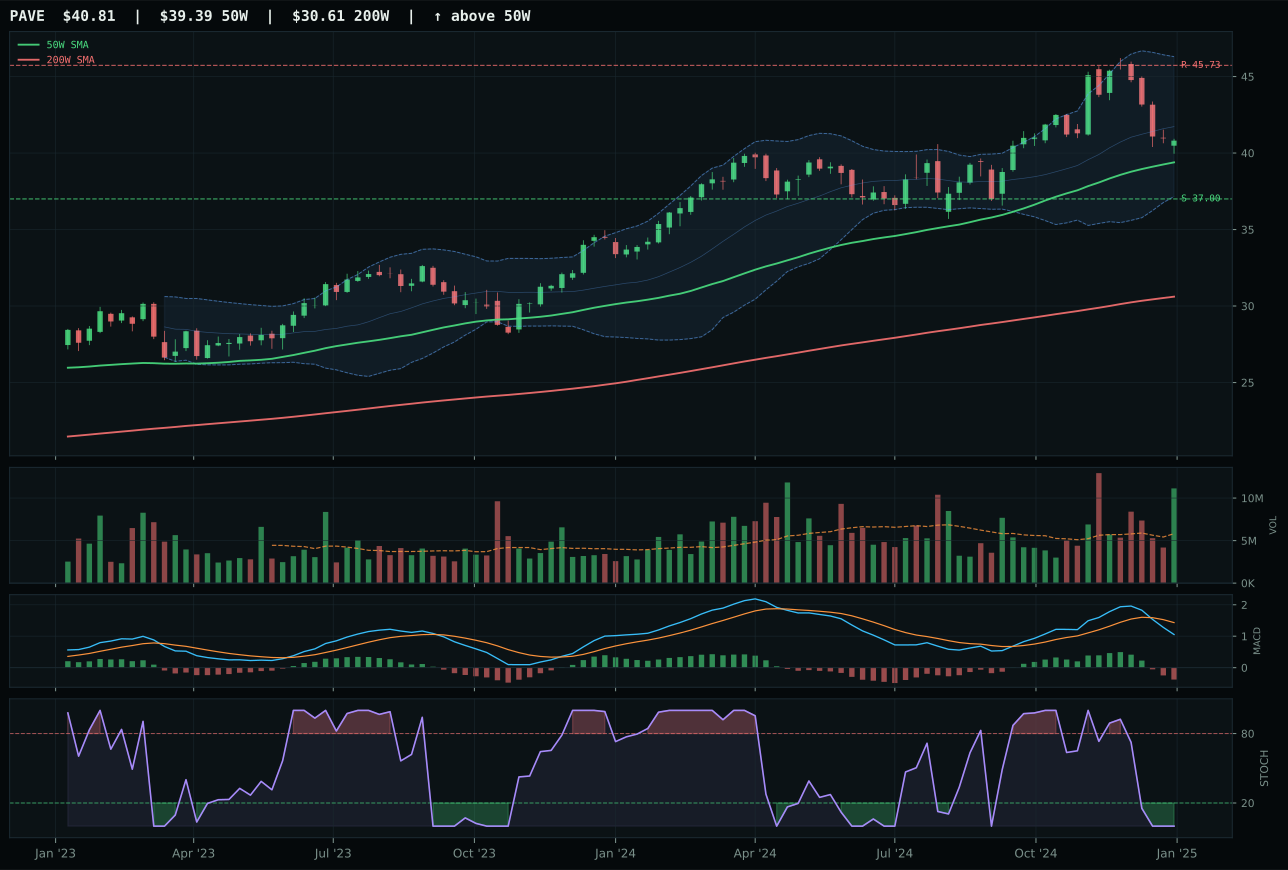
PAVE has a neutral structure profile with -3.8% 13-week relative strength versus SPY.
A failed hold above support would weaken the setup.
Actionable but governed by invalidation levels.
XLU wins over IGF by a whisker in risk/reward at 57.8 versus 57.7—a statistical tie—but survives as the representative because of category-relative strength at negative 2.2% versus IGF's 0.0%. In a defensive category, the name with the worst relative strength momentum often provides the freshest entry point, as it's been the last to recover and thus offers the most room to compress toward the peers. Both setups show timing strength at 84.0 for XLU and 84.0 for IGF; structure is also nearly identical at 70.4 versus 73.0, with neutral positioning across both. The deciding factors are stochastic—both show oversold turn-up at 0.09 for XLU—and volume: XLU at 0.73x thin participation versus IGF at above-average. XLU's tighter volume (less confirmation) combined with worse relative strength position it as the less-crowded candidate; IGF's above-average volume suggests institutional accumulation, which could be leading XLU's move. Trend scores favor IGF at 73 versus XLU's 69, but this is a mean-reversion trade where lagging momentum, not leading momentum, defines the best entry.
Utilities & Infrastructure earns a 5% allocation at 43.1 points, placing it in tier-2 with defensively aligned macro support. Category macro fit is 68.0/100—one of the stronger macro setups—because disinflation helps at +7 and broad market bear is active at +4, both supporting regulated utility narratives and income-focused infrastructure plays. XLU's technical evidence of 28.6/100 is weak in absolute terms, yet it survives allocation because macro fit compensates: in a broad market bear environment with disinflation, utilities become bond proxies, and the 5% slot reflects that defensive positioning. Momentum confirmation at 7.7 and persistence at 31.5 signal no enthusiastic buying is underway; this is a grind-higher position, not a catalyst-driven trade. Risk/reward at 57.8 offers balanced exposure—7.1% upside to resistance, 9.9% downside to support—making it suitable as a portfolio stabilizer. For tier-1 promotion, XLU needs MACD to turn bullish and stochastic to sustain above 0.30 with volume confirmation; if credit stress activates or if rate expectations shift higher, the macro fit collapses and this allocation should be trimmed immediately.
AI — SMH
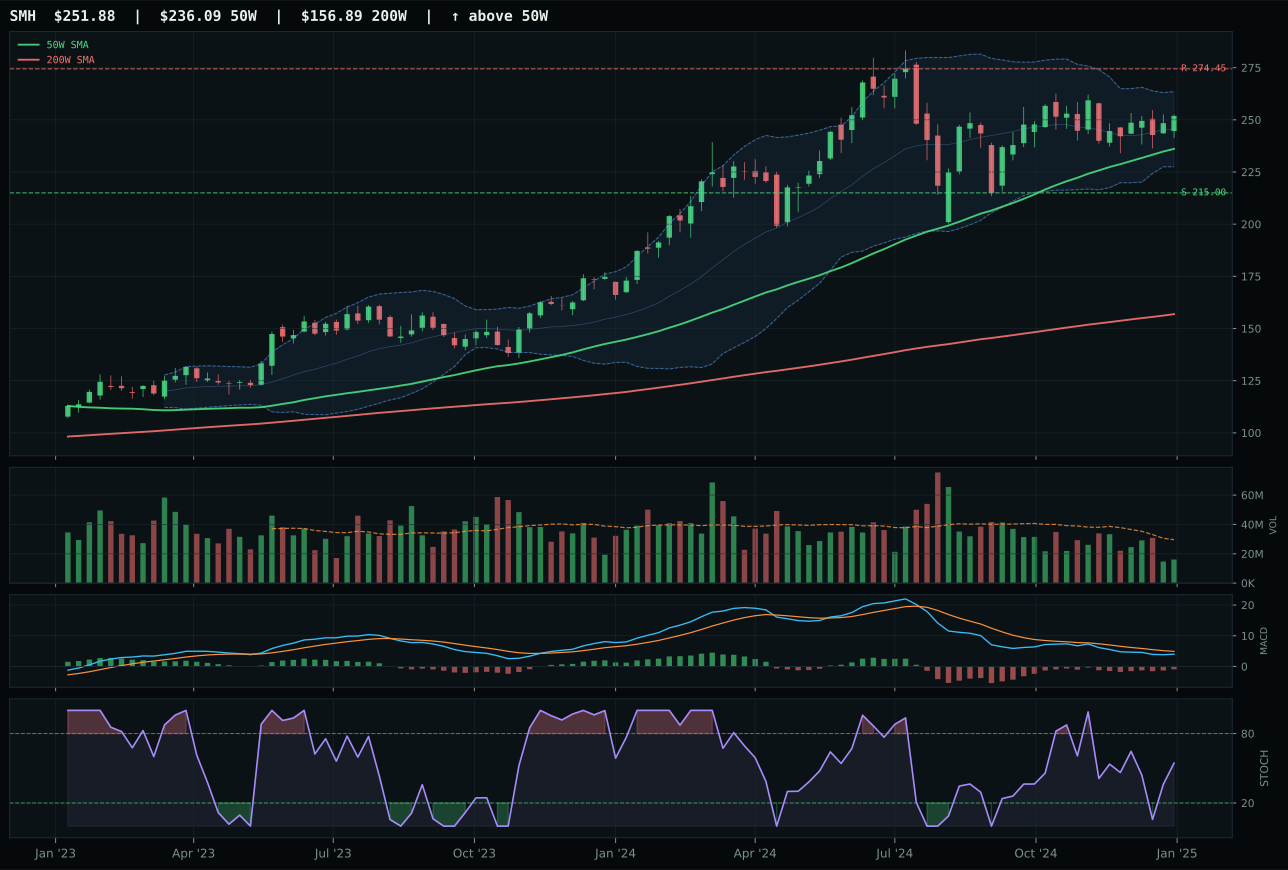
SMH has a neutral structure profile with -1.7% 13-week relative strength versus SPY.
A failed hold above support would weaken the setup.
Actionable but governed by invalidation levels.
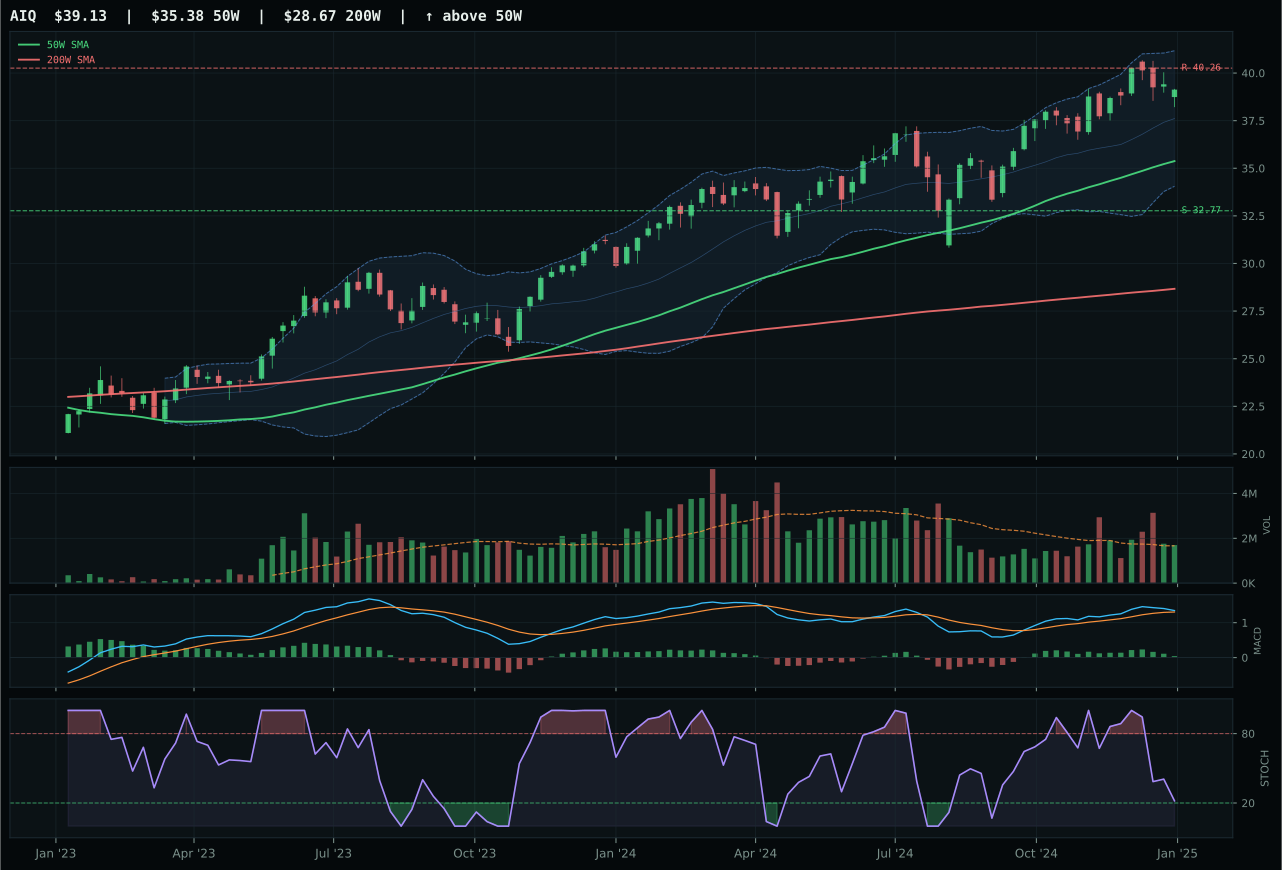
AIQ has a neutral structure profile with 0.9% 13-week relative strength versus SPY.
A failed hold above support would weaken the setup.
Actionable but governed by invalidation levels.
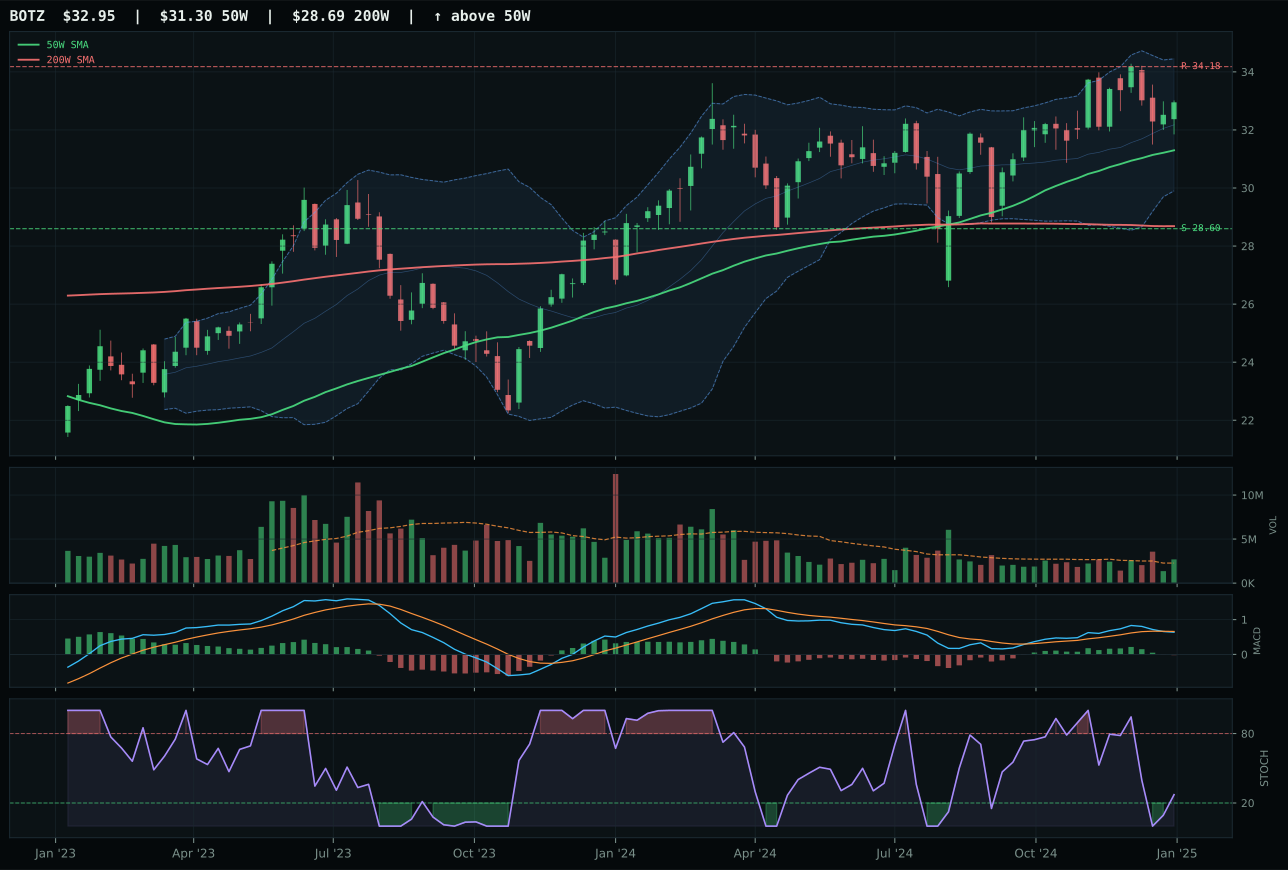
BOTZ has a neutral structure profile with -0.6% 13-week relative strength versus SPY.
A failed hold above support would weaken the setup.
Actionable but governed by invalidation levels.
SMH wins a tight race over AIQ by 1.1 points because its timing score of 83.0 beats AIQ's 70.0, driven by stochastic RSI at rising mid-zone 0.54 versus AIQ's falling/neutral 0.38. That single technical edge matters more than AIQ's superior trend score of 97 versus SMH's 90.5, because both setups are neutral structure and both face the same headwinds from liquidity stress at -12 and credit stress at -8. SMH's compute/semiconductor focus offers cleaner risk/reward at 53.6 versus AIQ's 48; the downside to support is broader at 17.2% versus implied asymmetry on AIQ, yet SMH's volume thin participation at 0.54x and 1.6% thirteen-week return signal patience is required. The representative decision hinges on this: AIQ has bigger absolute momentum (4.2% thirteen-week, 0.9% RS versus SPY), but SMH's timing setup—stochastic rising into mid-zone with MACD bearish but improving—offers a cleaner entry point than AIQ's MACD bullish-but-flattening fade.
AI ranks tier-2 at 29.9 points and receives a 5% allocation despite its category-level macro fit of only 23.0/100. The portfolio holds this position because SMH's technical evidence of 65.4/100, combined with stochastic turning up rather than deteriorating, provides an opportunistic entry into the semicon/AI compute theme without forcing conviction. Liquidity stress and credit stress are both active negatives across the entire category basket, and broad market bear at -8 means any rotational strength here is reactive hedging rather than structural demand. The allocation survives tier-2 status because risk/reward at 53.6 on SMH offers more downside cushion relative to upside, and the stochastic turn-up suggests a bounce candidate within a larger weakness. If liquidity stress eases or if technical confirmation improves—higher volume, MACD stabilization—this category could leapfrog to tier-1, but the current 5% slot correctly reflects its lower conviction status in the disinflation/credit stress environment.
Nuclear Energy — NLR
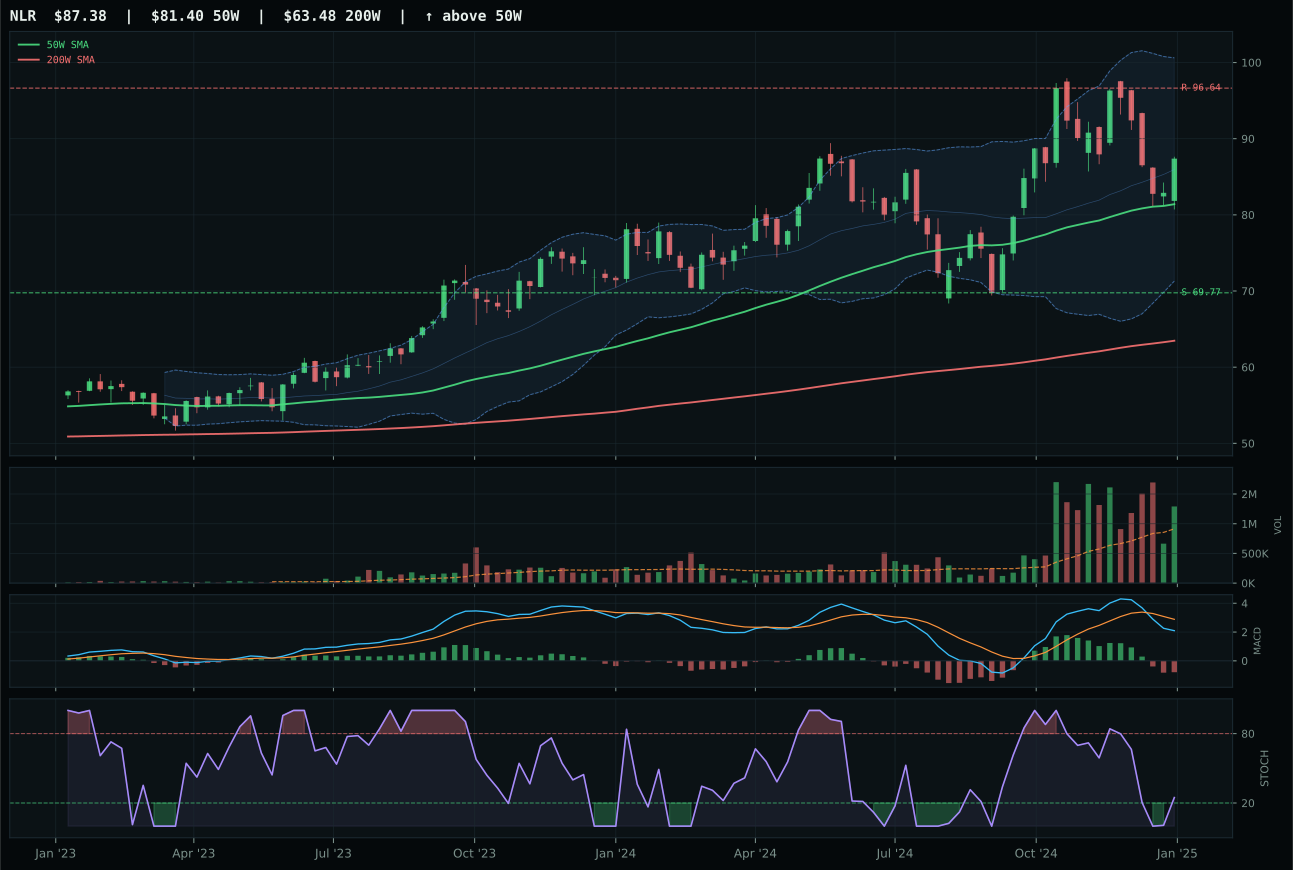
NLR has a neutral structure profile with -4.8% 13-week relative strength versus SPY.
A failed hold above support would weaken the setup.
Actionable but governed by invalidation levels.
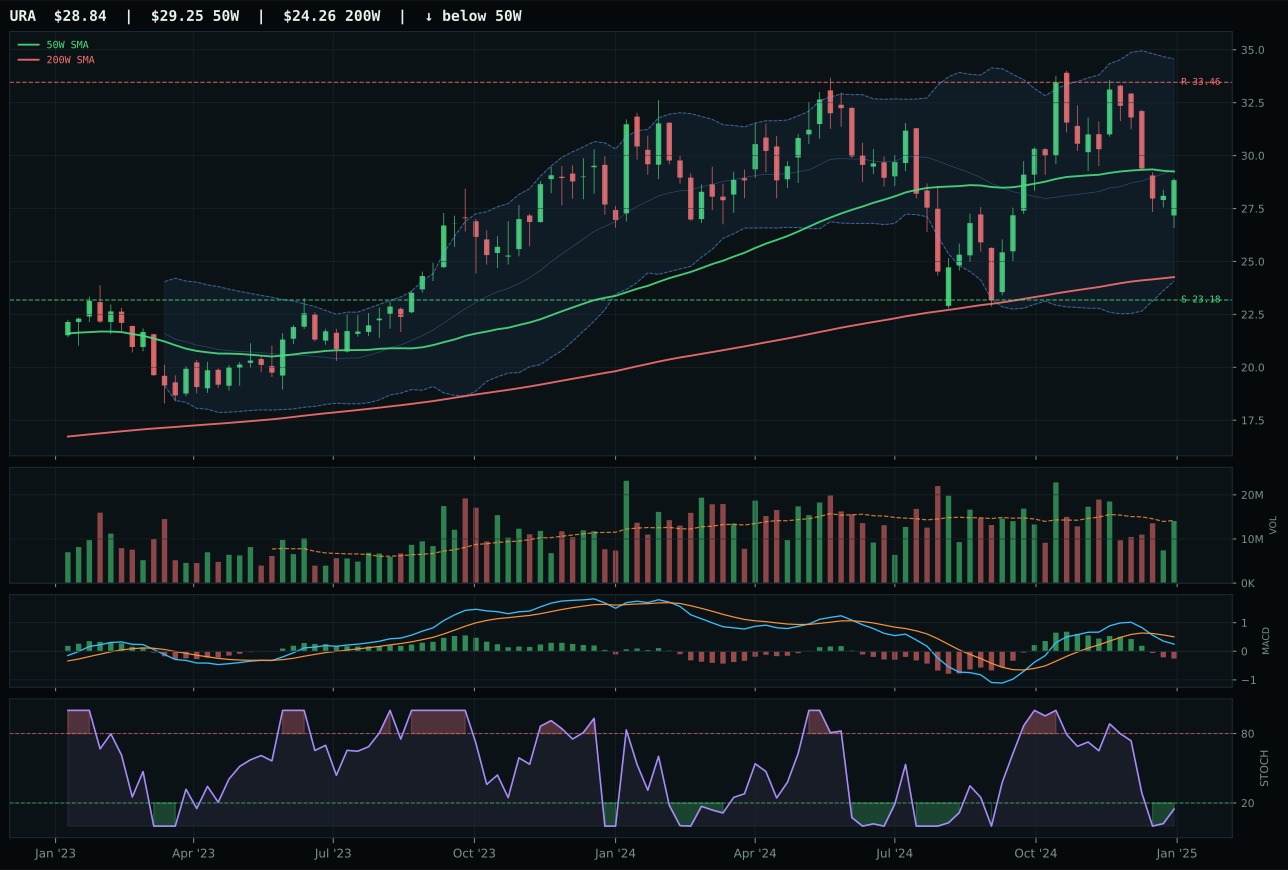
URA has a compression near 50W profile with -8.2% 13-week relative strength versus SPY.
A failed hold above support would weaken the setup.
Actionable but governed by invalidation levels.
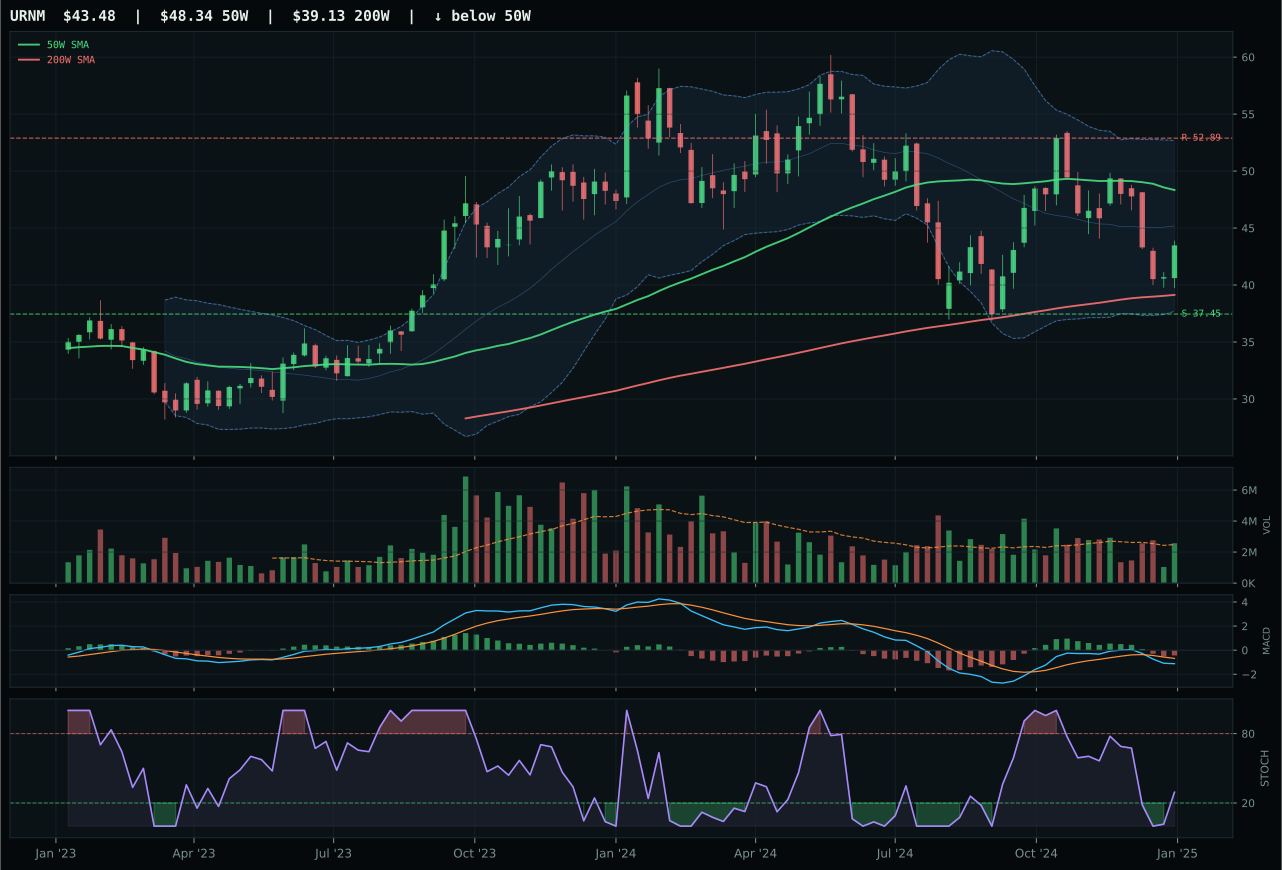
URNM has a neutral structure profile with -13.6% 13-week relative strength versus SPY.
A failed hold above support would weaken the setup.
Actionable but governed by invalidation levels.
NLR wins over URA by 14.7 points because its stochastic RSI is rising mid-zone at 0.25 versus URA's oversold flat positioning, and volume confirmation is above-average participation at 1.41x versus URA's neutral. NLR's timing score of 78.0 beats URA's 100.0 because URA is at maximum compression near the 50W with oversold stochastic—a later-stage bounce candidate, while NLR has already begun its move with rising stochastic and above-average volume. Structure on NLR is neutral and cleaner at 68.6 versus URA's 64.9, and category-relative strength at 3.4% gives NLR an edge within its peer set. Both names show MACD bearish/weakening, but NLR's combination of rising stochastic, above-average volume participation, and neutral structure suggests accumulation is beginning, while URA's setup is purely mean-reversion waiting for support to hold. The trend score gap is small (74.8 versus 75.0), but momentum confirmation on NLR at 25.7 versus URA's 1 tells the story: NLR is moving, URA is still dead.
Nuclear Energy earns a 5% allocation at 22.8 points, placing it squarely in tier-2 with modest conviction. Macro fit is 38.0/100—neutral leaning slightly positive—with liquidity stress at -7 and credit stress at -5 both active, but no category-specific tailwind like precious metals enjoys. NLR's technical evidence of 43.1/100 is middling; the category survives allocation because stochastic is rising (early momentum signal) and above-average volume is accumulating (institutional sponsorship signal). This is a recovery trade, not a conviction growth position. The 5% slot reflects optionality: if stochastic continues rising and MACD stabilizes, NLR could accelerate, but there's no proof of structural recovery yet—only early-stage bottoming signals. Risk/reward at 51.8 is balanced with 25.2% downside to support versus only 9.6% upside to resistance, meaning this position is being held for a bounce rather than a breakout. For tier-1 promotion, NLR needs MACD to turn bullish and volume to sustain above 1.4x; if either reverses, this allocation should be trimmed immediately.
Traditional Energy — XLE
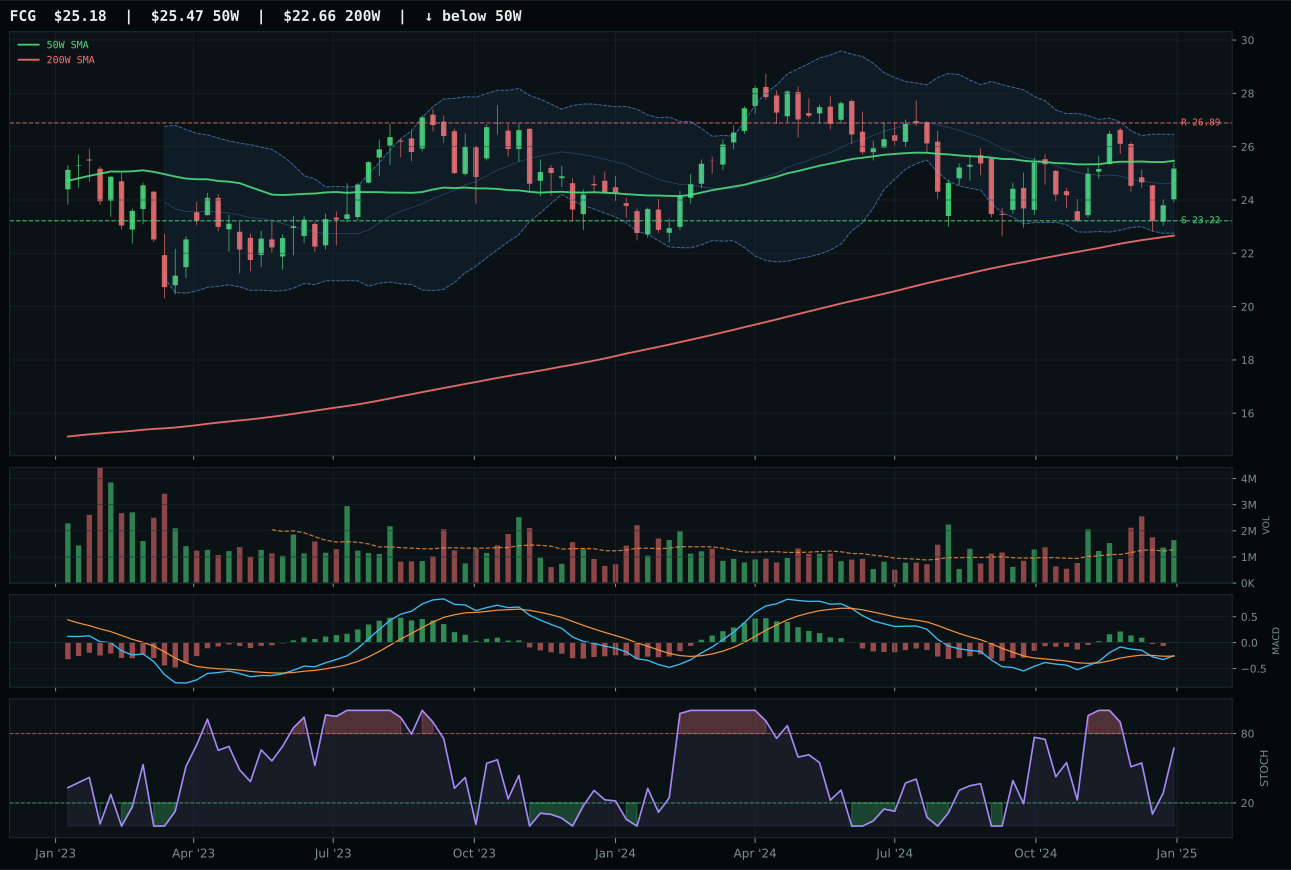
FCG has a compression near 50W profile with -4.2% 13-week relative strength versus SPY.
A failed hold above support would weaken the setup.
Actionable but governed by invalidation levels.
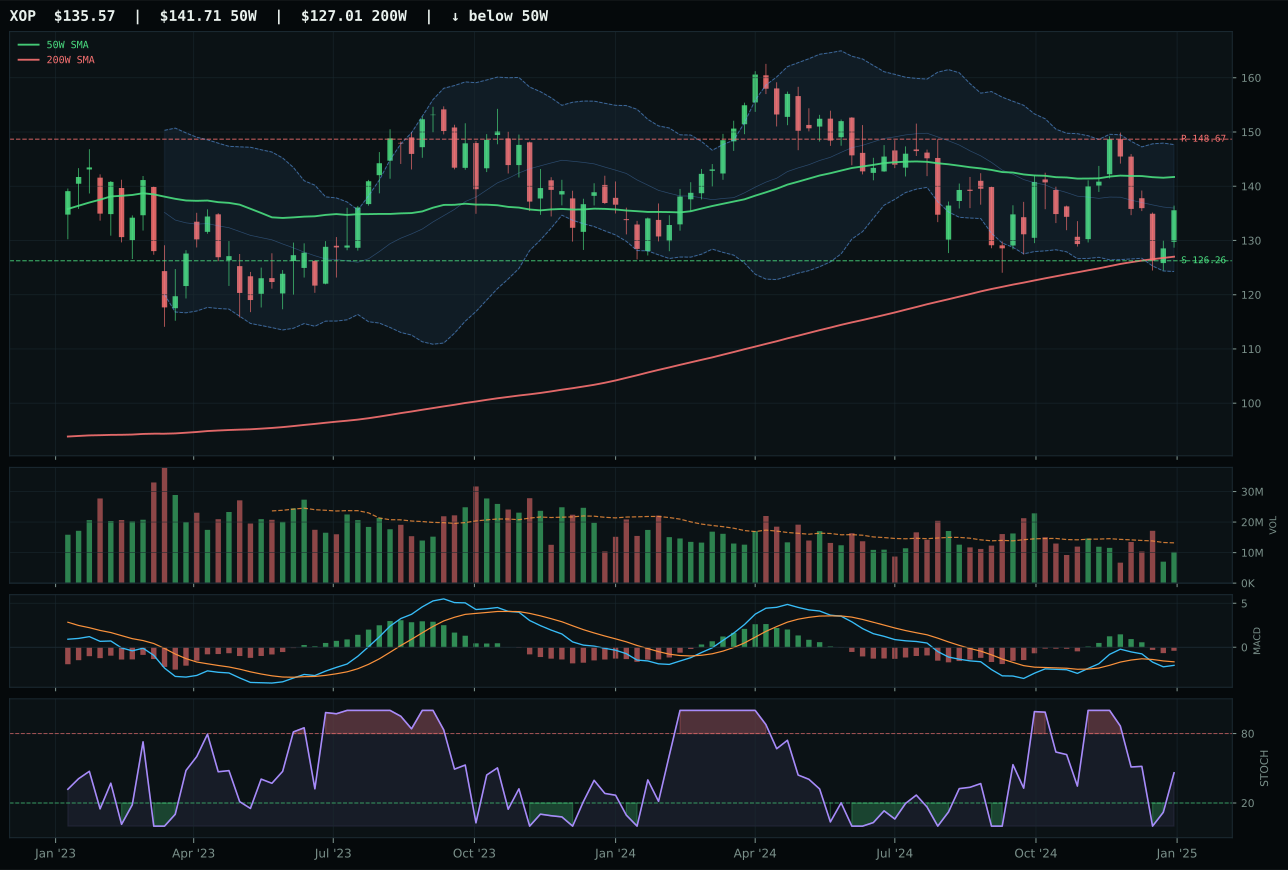
XOP has a neutral structure profile with -7.0% 13-week relative strength versus SPY.
A failed hold above support would weaken the setup.
Actionable but governed by invalidation levels.
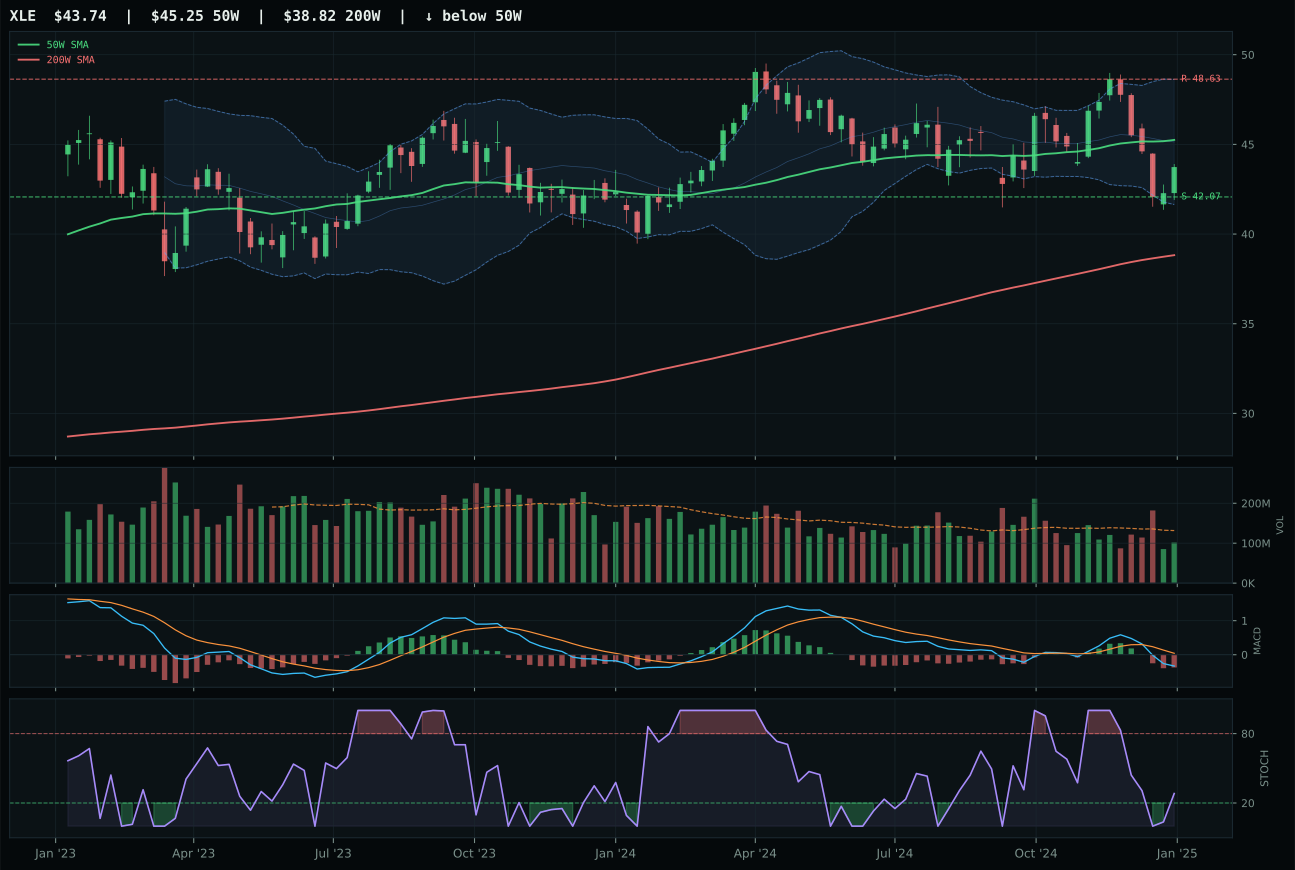
XLE has a pullback into support profile with -9.4% 13-week relative strength versus SPY.
A failed hold above support would weaken the setup.
Actionable but governed by invalidation levels.
XLE wins over FCG because XLE's timing score of 95.0 beats FCG's 100.0 by the tighter invalidation area and stronger risk/reward at 90.0 versus 66.6. That reversal might seem backward—FCG has a higher timing score—but the allocation decision weights risk/reward equally in the matrix, and XLE offers 90% upside potential with only 4.0% downside to support, while FCG's compression near the 50W offers 66.6 risk/reward and still sits vulnerable to a quick reversal. FCG shows the flashier setup: MACD bullish but flattening, stochastic rising mid-zone at above 0.50, and above-average participation volume—a technical buy signal on its face. But price is still hovering near the 50W, meaning the breakout is unconfirmed; FCG's 13-week return of negative 0.9% tells the real story: despite the bullish stochastic and MACD, the ETF has gone nowhere, caught in compression. XLE is pulled back into support near 42.07 with MACD still deteriorating and stochastic falling neutral—a uglier chart, but one that offers defined downside. The representative decision favors XLE because it's the fresher candidate with cleaner risk asymmetry.
Traditional Energy receives a 5% allocation at a 0.0 final score, making it a true tier-2 orphan position. The category scores 0.0 because macro fit is only 16.0/100 and eligibility filters fail due to structurally broken technical setups across the basket. Disinflation pressure at -10 is actively hostile to energy; falling inflation expectations translate to lower energy prices, weaker demand narratives, and margin compression for both integrated and exploration-focused energy names. XLE's technical evidence of only 7.5/100 reflects its below-50W positioning with near-zero momentum confirmation. Yet the 5% allocation survives because it hedges against a macro reversal: if inflation resurfaces, energy rallies hard, and XLE's 90.0 risk/reward becomes explosive. The position is structured as a gamma hedge—you pay in current underperformance to own asymmetric upside if the regime shifts. If disinflation pressure remains active and XLE fails to hold support at 42.07, this allocation should be cut immediately. The allocation assumes the broad market bear environment persists and that tactical energy exposure adds portfolio diversification without commitment to conviction.
Emerging Markets — INDA
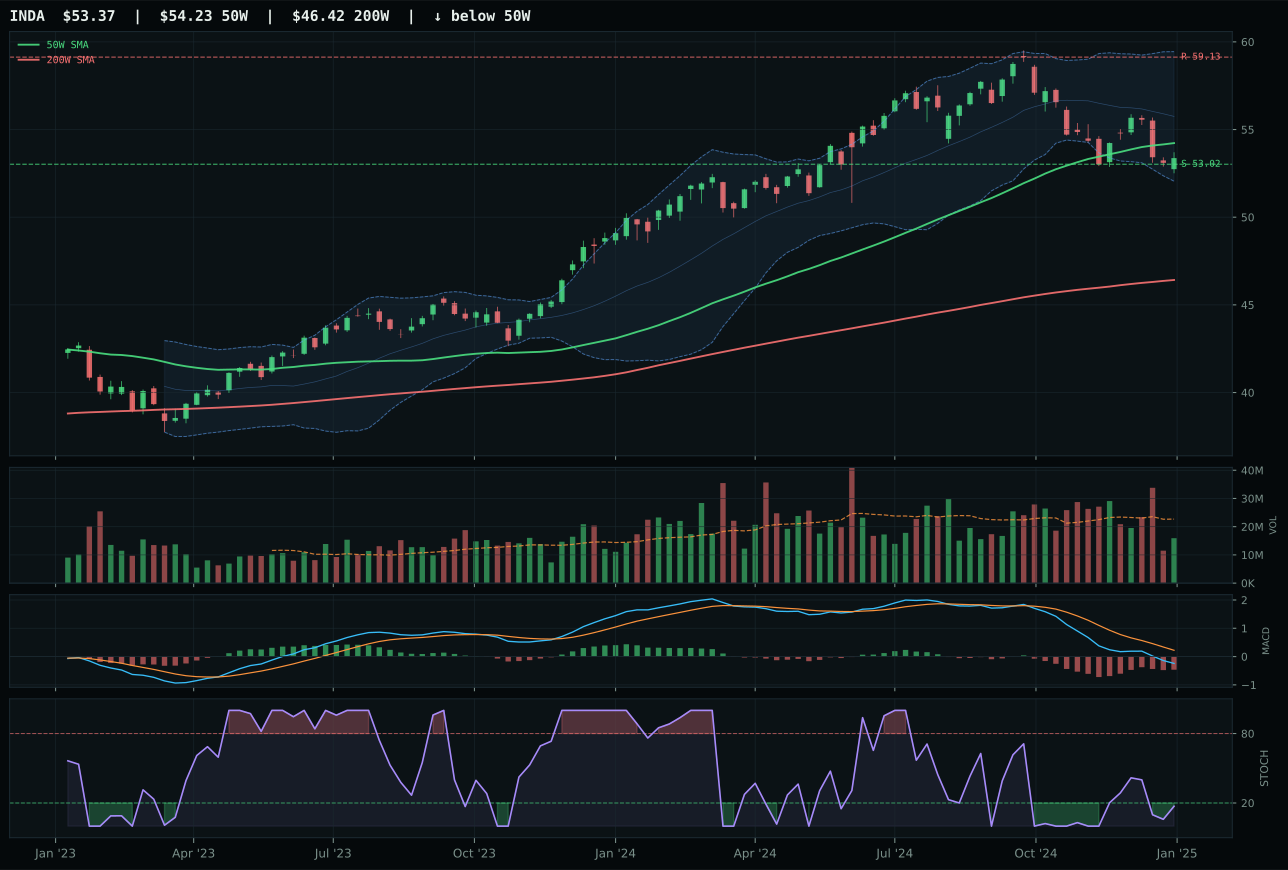
INDA has a pullback into support profile with -9.8% 13-week relative strength versus SPY.
A failed hold above support would weaken the setup.
Actionable but governed by invalidation levels.
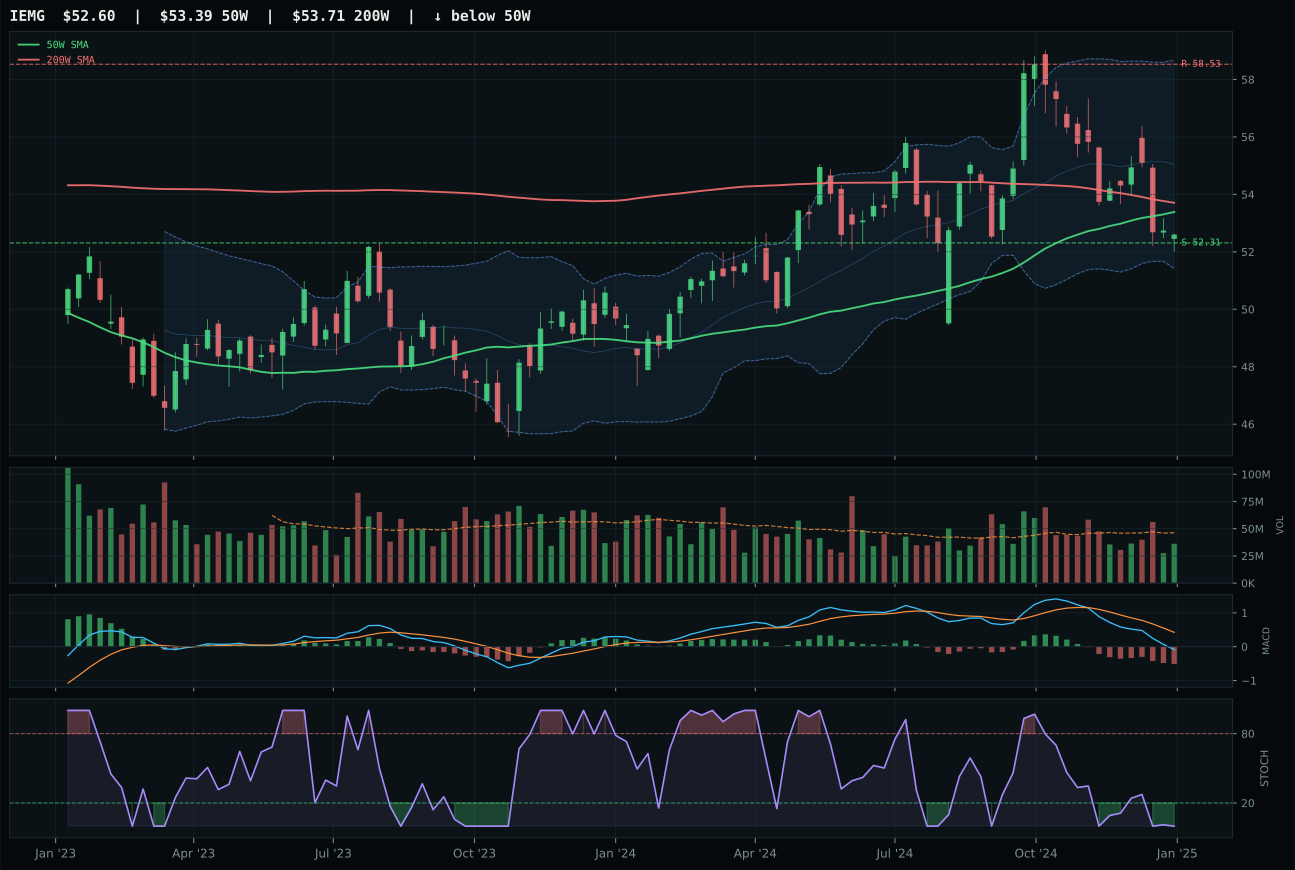
IEMG has a pullback into support profile with -13.4% 13-week relative strength versus SPY.
Extension and support failure are the main tactical risks.
Tracked, but not top-2 eligible because: structurally broken.
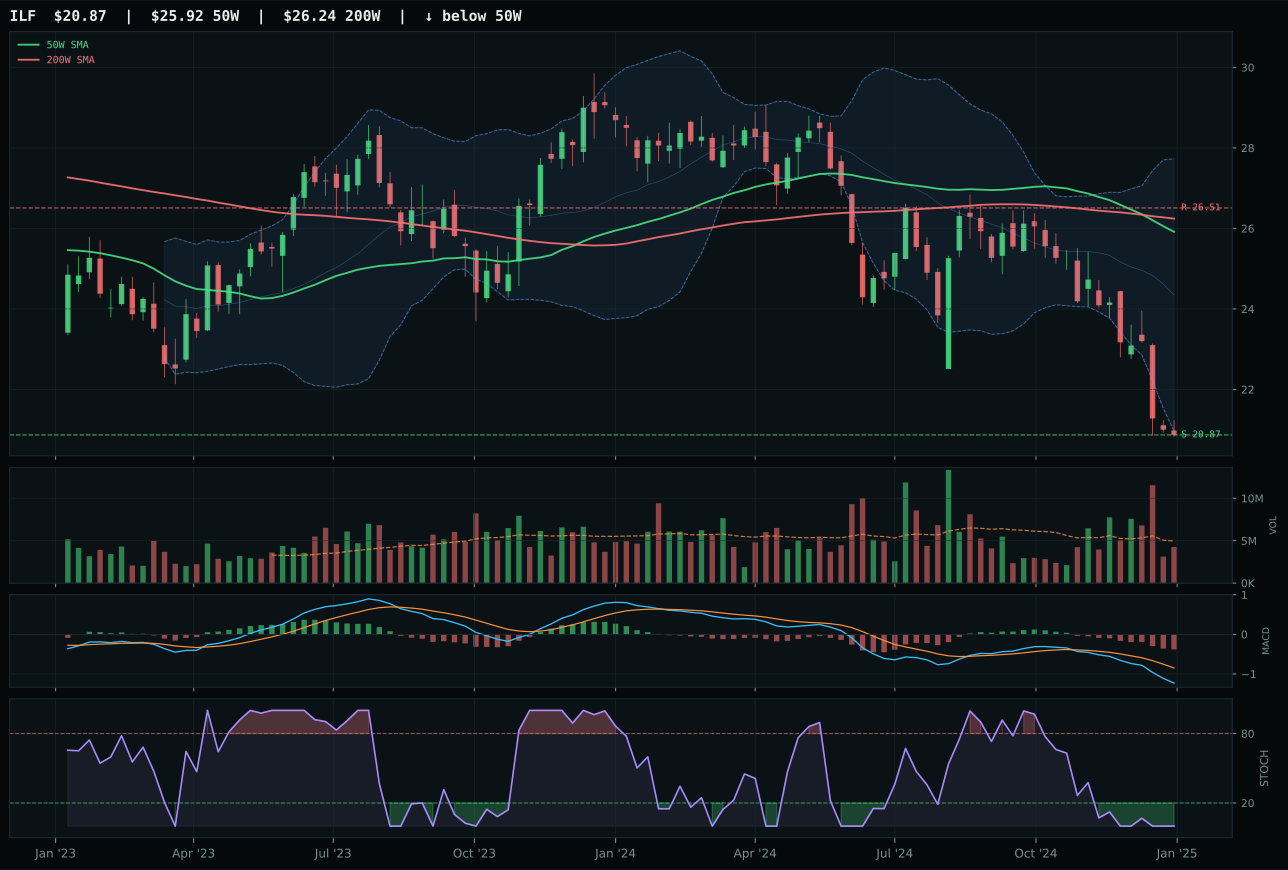
ILF has a pullback into support profile with -23.2% 13-week relative strength versus SPY.
Extension and support failure are the main tactical risks.
Tracked, but not top-2 eligible because: structurally broken.
INDA wins over IEMG by 47.9 points because its structure at 69.1 beats IEMG's 42.9 by a meaningful margin, stochastic is oversold at the turn-up rather than flat oversold, and category-relative strength at 3.6% demonstrates relative momentum within the peer basket. INDA's timing score of 100.0 matches IEMG's mathematically, but the qualitative difference matters: INDA sits at exactly 1.6% below its 50W in the middle retracement/decision zone near Fib 0.618, offering a tighter setup with support at 53.02 just 0.7% below; IEMG is further from its 50W and trades in a structurally messier pullback-into-support pattern. Both show MACD bearish but improving and stochastic oversold, yet INDA's setup is tighter and more defined. Risk/reward is nearly identical at 98.0 versus 98.0, but INDA's structure quality and relative strength leadership make it the technical winner despite IEMG's wider distribution network.
Emerging Markets scores 0.0 points and receives a 5% allocation, making it the most precarious hold in the portfolio. The category's macro fit is only 7.0/100—the lowest on the sheet outside excluded categories—because dollar pressure is active at -14, credit stress at -10, liquidity stress at -10, and broad market bear at -9 simultaneously. Every macro headwind that damages emerging markets is currently active. INDA's technical evidence of 54.9/100 is the only reason this position survives at all: timing at 100.0 and risk/reward at 98.0 offer asymmetry if sentiment turns, but that's a very big if. The 5% allocation is a pure recovery bet: if dollar strength reverses or if credit stress eases, EM typically bounces first and hardest. INDA's 3.6% category-relative strength means it's the cleanest entry point into the cycle when it arrives. This is a bottom-fishing position with explicit conditions: dollar must show weakness, credit spreads must stabilize, or liquidity stress must ease. If none of those occur and the macro regime persists, this 5% is dead weight. The allocation assumes mean reversion in EM cycle timing more than conviction in current fundamentals.
Agriculture & Livestock — WEAT
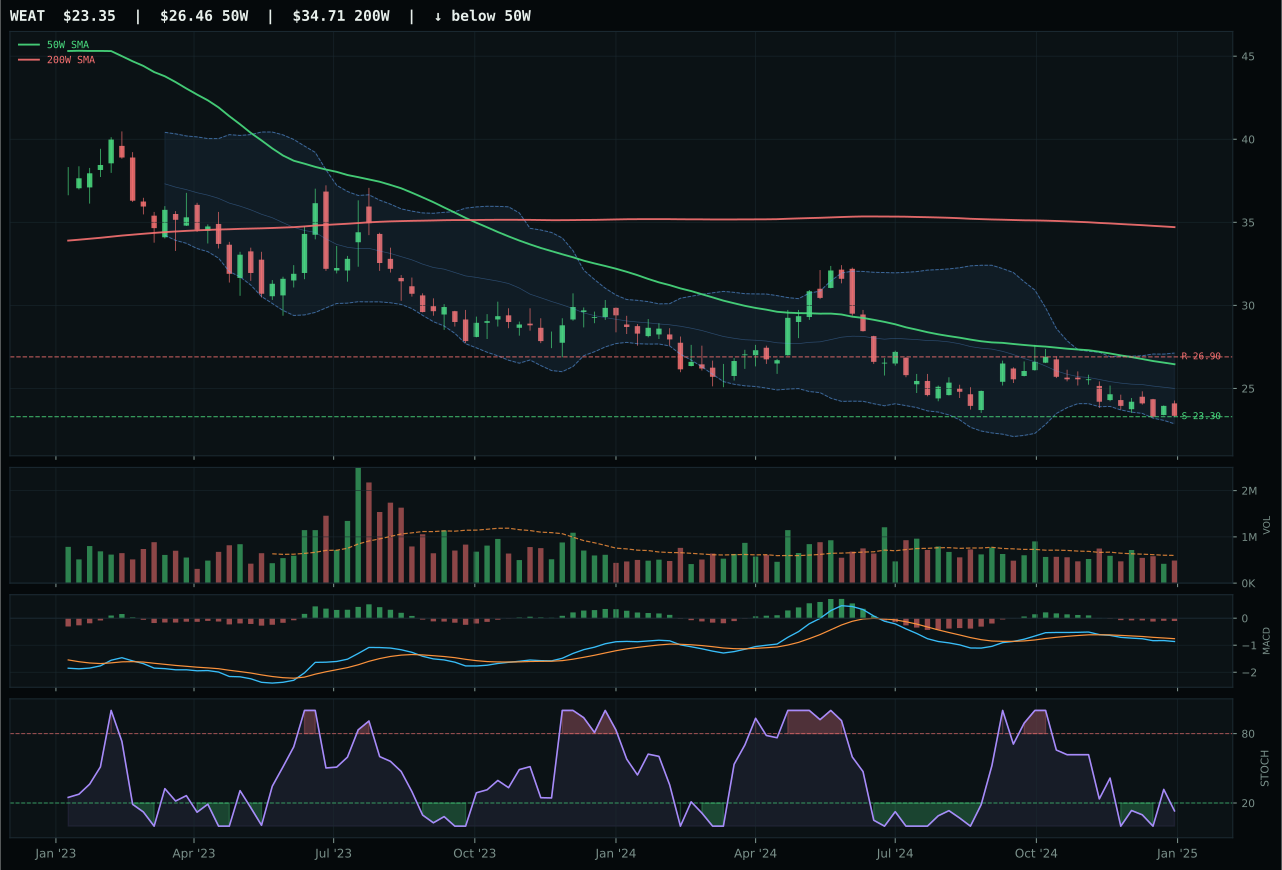
WEAT has a pullback into support profile with -15.5% 13-week relative strength versus SPY.
Extension and support failure are the main tactical risks.
Tracked, but not top-2 eligible because: structurally broken.
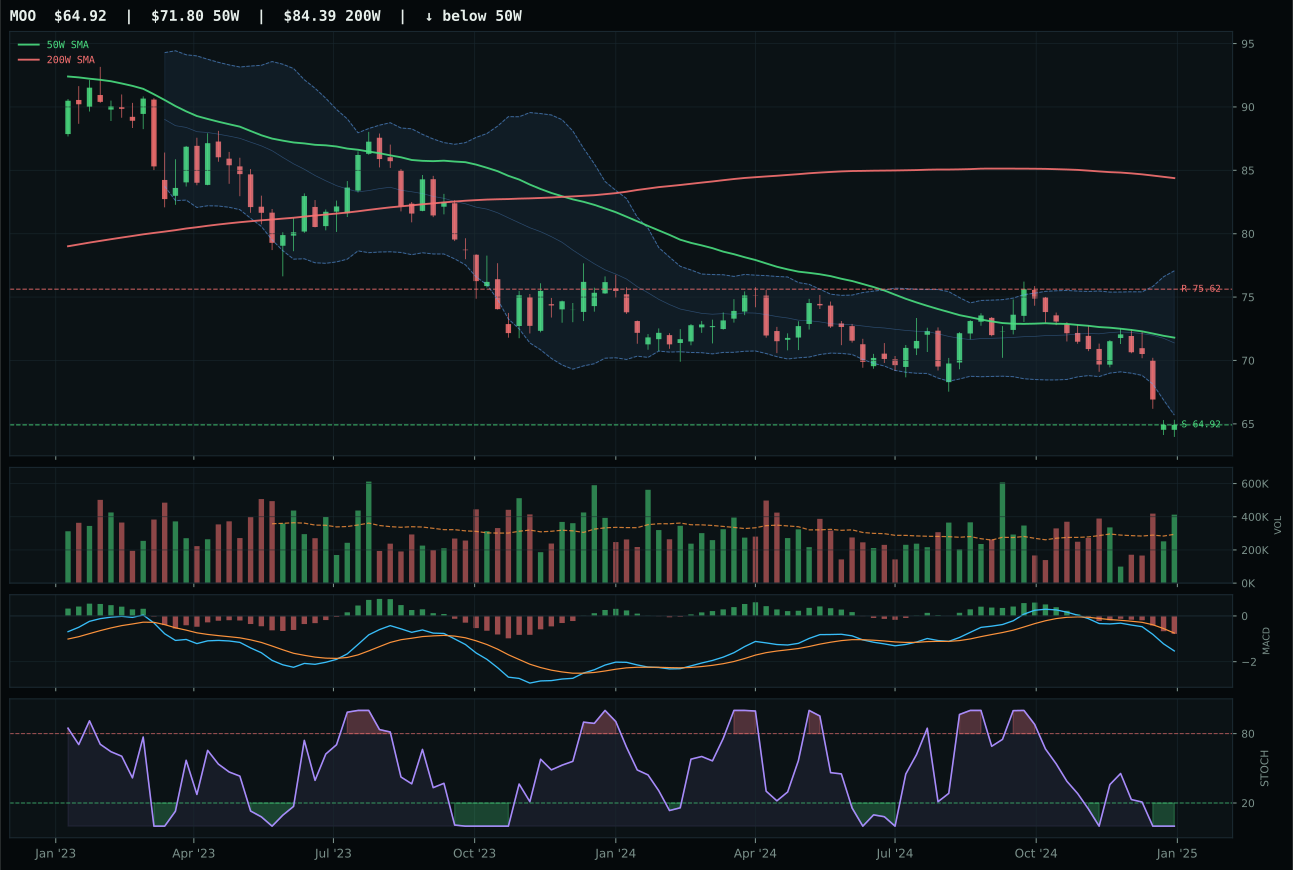
MOO has a pullback into support profile with -16.6% 13-week relative strength versus SPY.
Extension and support failure are the main tactical risks.
Tracked, but not top-2 eligible because: structurally broken.
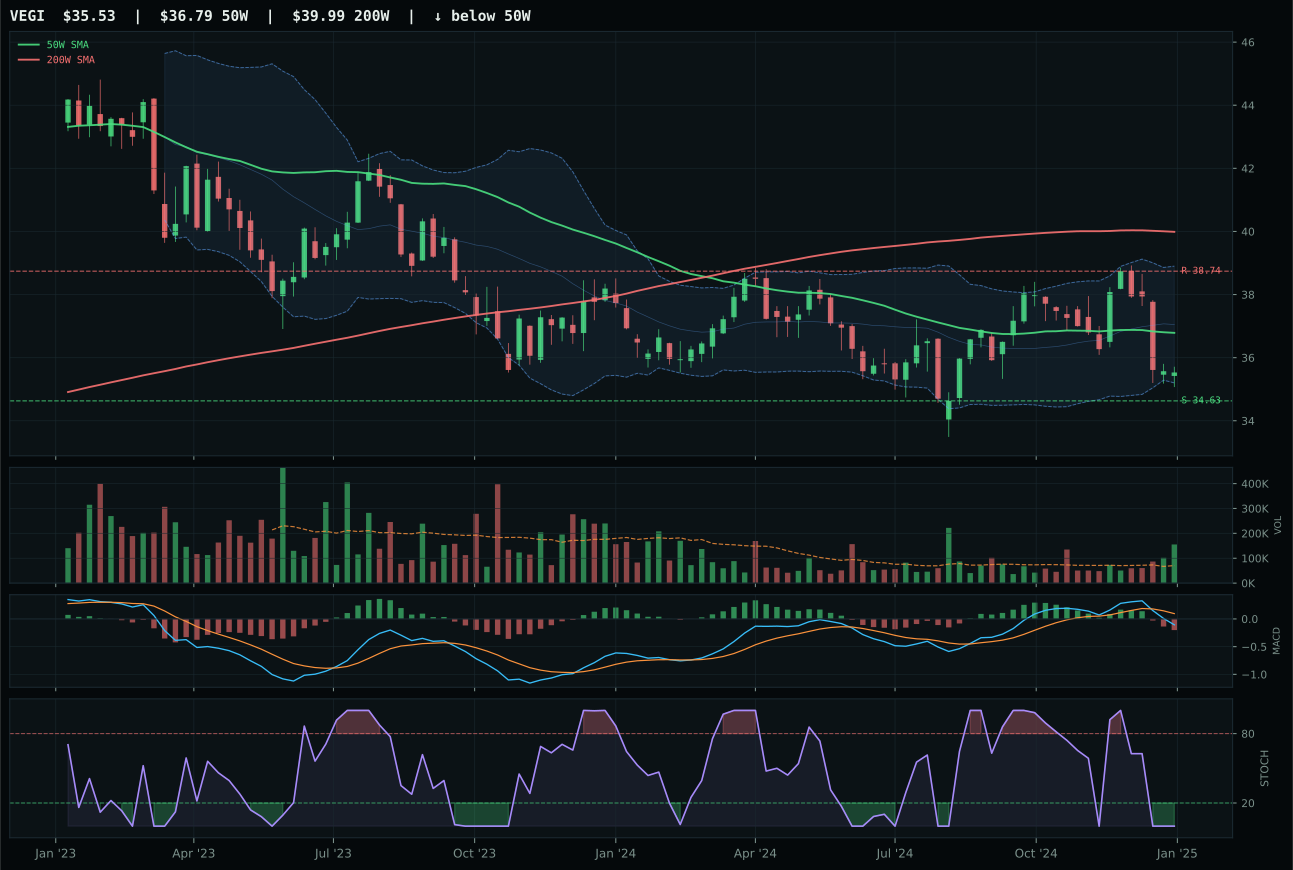
VEGI has a pullback into support profile with -9.8% 13-week relative strength versus SPY.
Extension and support failure are the main tactical risks.
Tracked, but not top-2 eligible because: structurally broken.
WEAT wins the category race despite both being deeply oversold structures because its risk/reward of 90.0 beats MOO's 76.8, and stochastic RSI is at oversold turn-up at 0.13 versus MOO's flat oversold, signaling earlier-stage bottoming. WEAT is 11.7% below its 50W with support near 23.30, offering a tighter invalidation area; any close below that level breaks the setup entirely. MACD is bearish/weakening across both, confirming no recovery is underway, but WEAT's structure at 39.0 marginally exceeds MOO's 37.9. The real difference: MOO's volume is above-average participation into weakness, a distribution signal, while WEAT's volume is neutral—meaning selling pressure is lighter and the setup depends on support holding rather than buying confirmation. Neither ETF is tradeable at the moment; WEAT wins because it's fractionally closer to an actual bounce if support holds, not because either deserves conviction.
Agriculture & Livestock receives 0% allocation this week and is entirely excluded from the portfolio. The category scores 0.0 points after eligibility filters, ranking it 9th or 10th, because macro fit is only 32.0/100 and technical evidence across all three ETFs is structurally broken. Disinflation pressure at -8 is actively hostile—falling commodity prices hurt agricultural input demand and margin dynamics simultaneously. Both WEAT and MOO are below their 50W moving averages, MACD is deteriorating, and stochastic RSI is oversold without confirmation that buyers are returning. The momentum confirmation score of 0.0 across WEAT says everything: thirteen-week return is negative 12.2%, RS versus SPY is negative 15.5%, and volume is thin. For this category to earn even a token 5% slot, one of two things must happen: either support at 23.30 holds on WEAT and stochastic breaks above 0.30 with volume confirmation, or macro data shifts away from continued disinflation. Neither condition has been met; exclusion is the correct call.
Industrial Metals — COPX
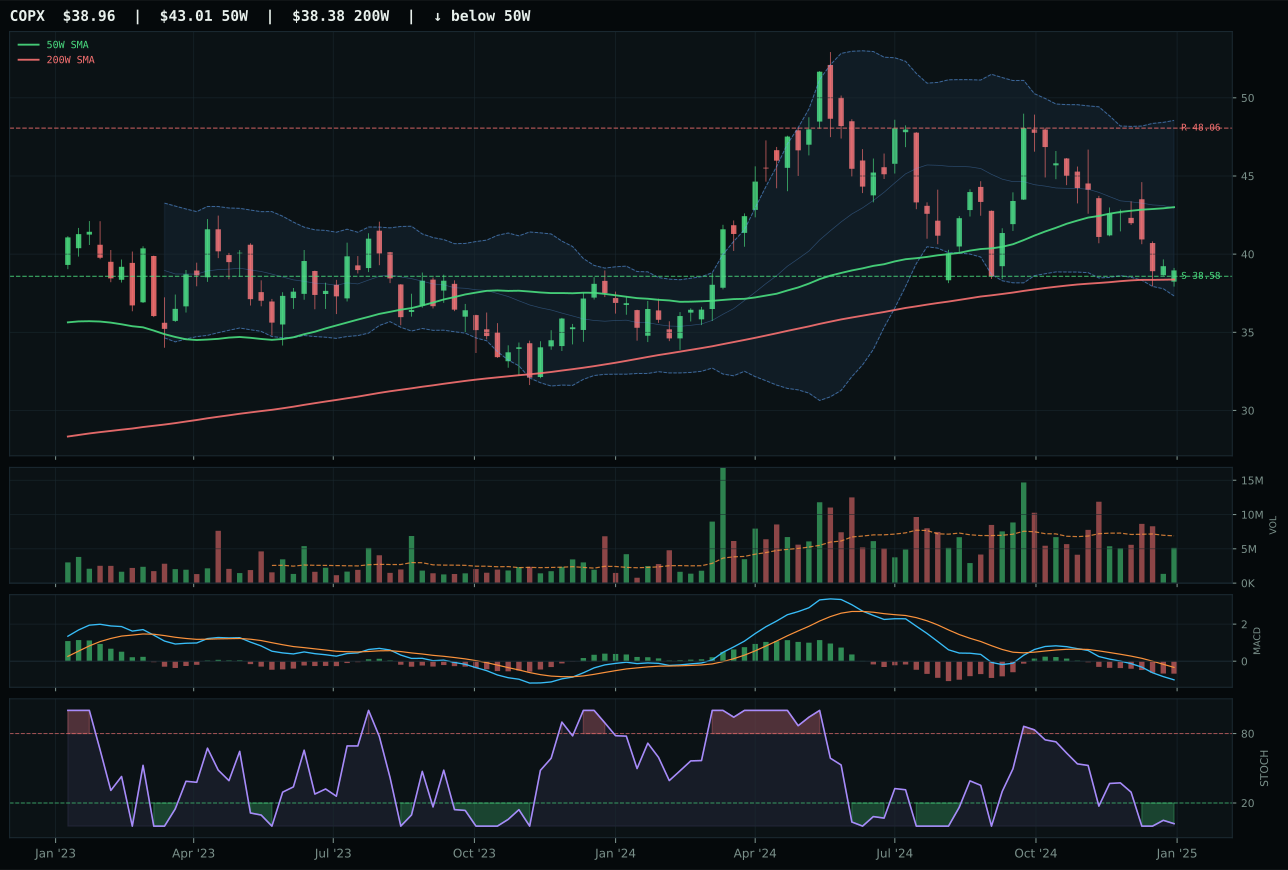
COPX has a pullback into support profile with -21.7% 13-week relative strength versus SPY.
A failed hold above support would weaken the setup.
Actionable but governed by invalidation levels.
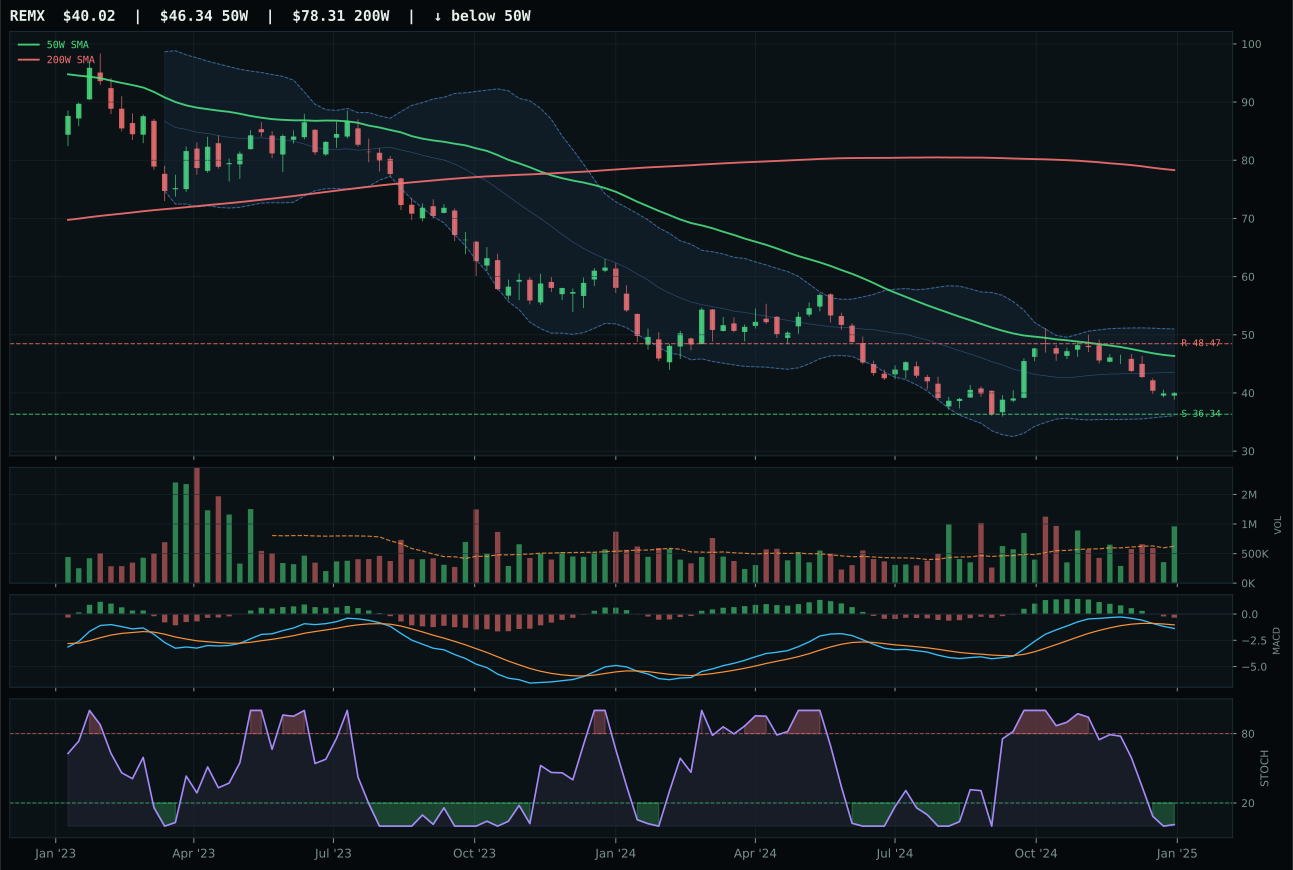
REMX has a neutral structure profile with -19.3% 13-week relative strength versus SPY.
Extension and support failure are the main tactical risks.
Tracked, but not top-2 eligible because: structurally broken.
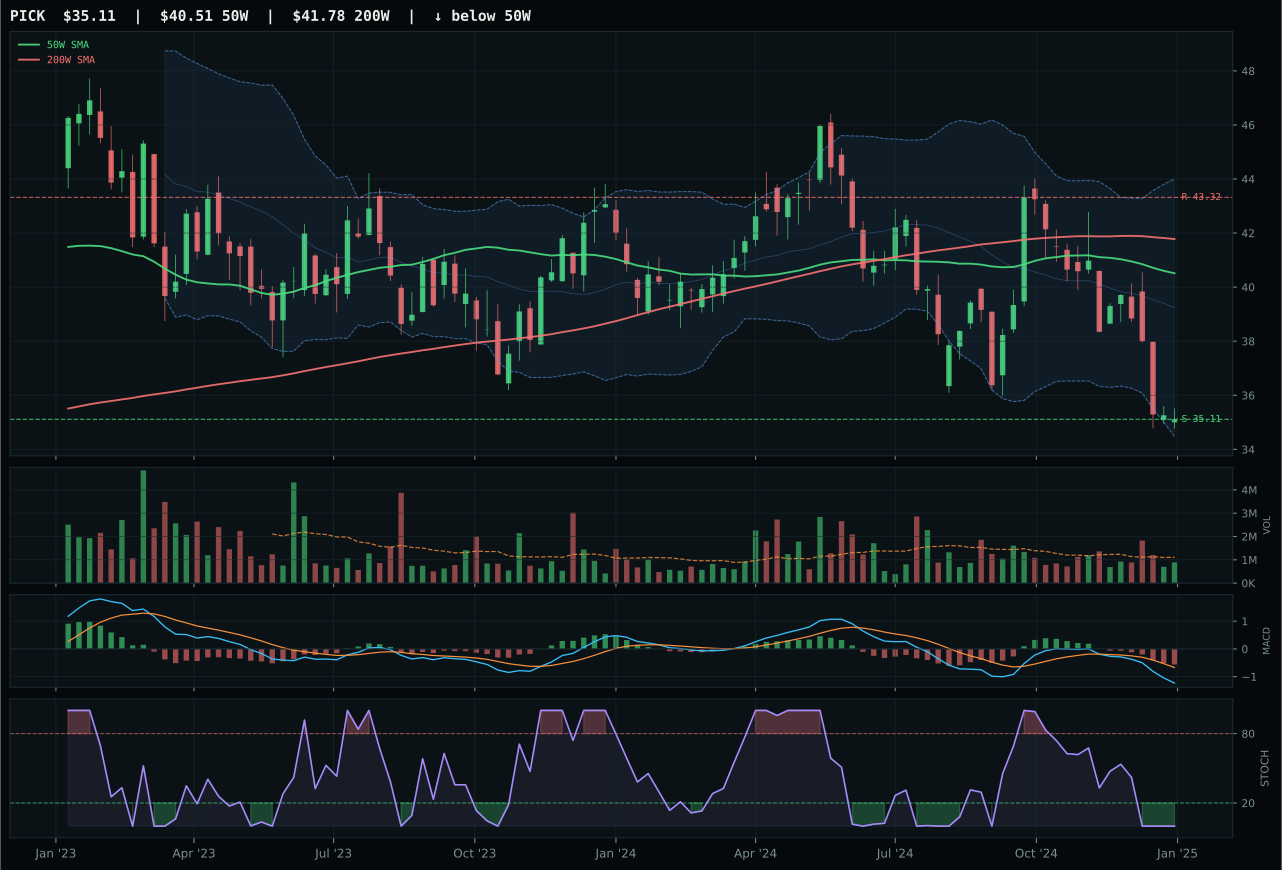
PICK has a pullback into support profile with -22.1% 13-week relative strength versus SPY.
Extension and support failure are the main tactical risks.
Tracked, but not top-2 eligible because: structurally broken.
COPX wins decisively over REMX on the strength of timing at 100.0 versus 50.0 and risk/reward at 98.0 versus 81.0. COPX sits at the deep retracement/value zone near Fib 0.786 at 37.97 with stochastic RSI oversold turn-up at 0.02—the earliest-stage reversal setup in the category. Support is tight at 38.58, just 1% below current price, offering a one-shot invalidation level; if that holds, the bounce potential is asymmetric. REMX's structure is neutral rather than pullback-into-support, and its stochastic is oversold without the turn-up confirmation, making it a later-stage candidate if COPX confirms first. Volume on both is thin to neutral, so neither is being accumulated yet, but COPX's timing advantage means it would catch the initial bid if sentiment reverses. The score gap of 43.9 points reflects that COPX is a recovery candidate while REMX remains structurally broken.
Industrial Metals scores 0.0 points and receives 0% allocation—the category is entirely excluded. Technical evidence across COPX, REMX, and PICK averages near zero because all three are below their 50W moving averages with MACD bearish/weakening and momentum confirmation at 0.0 across the basket. Macro fit is 28.0/100, dragged down by liquidity stress at -8, credit stress at -7, and dollar pressure at -7 all active simultaneously. This is a triple-negative environment: weak demand (credit stress), tight funding (liquidity stress), and a strong dollar (which makes commodities less attractive to international buyers). COPX's superior timing and risk/reward at 100.0 and 98.0 are technical artifacts of deep oversold conditions, not proof of reversal. For this category to earn allocation, copper and rare earths would need to break above their 50W moving averages with volume confirmation and MACD turning bullish—none of which has occurred. The exclusion stands until those technical conditions align with macro relief.