
2024-12-27
Informational purposes only. The content in this report, including allocations, analysis, and commentary, is provided solely for informational and educational purposes. It does not constitute financial advice, investment advice, trading advice, or any other type of advice. Past performance does not guarantee future results. Always conduct your own research and consult a qualified financial professional before making investment decisions.
Weekly Allocation
| Ticker | Category | Weight | Role |
|---|---|---|---|
| FBTC | 50% | Overlay | |
| CIBR | Technology | 10% | Top-2 (10%) |
| GLD | Precious Metals | 10% | Top-2 (10%) |
| IGF | Utilities & Infrastructure | 5% | Tier-2 (5%) |
| XAR | Defense & Aerospace | 5% | Tier-2 (5%) |
| SMH | AI | 5% | Tier-2 (5%) |
| INDA | Emerging Markets | 5% | Tier-2 (5%) |
| XLE | Traditional Energy | 5% | Tier-2 (5%) |
| NLR | Nuclear Energy | 5% | Tier-2 (5%) |
Trade Instructions — Monday Open
Sell the tranche from 2024-11-29 (completing its 4-week hold). Buy the new tranche. Instructions show net portfolio changes — same-asset positions cancel, weight changes show the delta.
| Action | Ticker | Instruction |
|---|---|---|
| SELL | PAVE | Sell entire PAVE position (2.50% of portfolio) |
| SELL | URA | Sell entire URA position (2.50% of portfolio) |
| SELL | IGV | Sell 33% of IGV position (reduce 3.75% → 2.50%) |
| SELL | COPX | Sell 25% of COPX position (reduce 5.00% → 3.75%) |
| SELL | AIQ | Sell 25% of AIQ position (reduce 5.00% → 3.75%) |
| BUY | GLD | Buy GLD — 14.29% of freed cash (adds 1.25% to portfolio) |
| BUY | IGF | Buy IGF — 14.29% of freed cash (adds 1.25% to portfolio) |
| BUY | CIBR | Buy CIBR — 28.57% of freed cash (adds 2.50% to portfolio) |
| BUY | NLR | Buy NLR — 14.29% of freed cash (adds 1.25% to portfolio) |
| BUY | INDA | Buy INDA — 14.29% of freed cash (adds 1.25% to portfolio) |
| BUY | SMH | Buy SMH — 14.29% of freed cash (adds 1.25% to portfolio) |
Current Portfolio After Trade
Combined holdings across all 4 active tranches. Each tranche is 25% of the portfolio.
| Ticker | % of Portfolio | Weight Bar |
|---|---|---|
| FBTC | 50.00% | |
| XAR | 5.00% | |
| GLD | 5.00% | |
| CIBR | 5.00% | |
| COPX | 3.75% | |
| AIQ | 3.75% | |
| IGF | 3.75% | |
| NLR | 3.75% | |
| IGV | 2.50% | |
| XLE | 2.50% | |
| URNM | 2.50% | |
| MOO | 2.50% | |
| XLK | 2.50% | |
| SLV | 2.50% | |
| INDA | 2.50% | |
| XLU | 1.25% | |
| SMH | 1.25% |
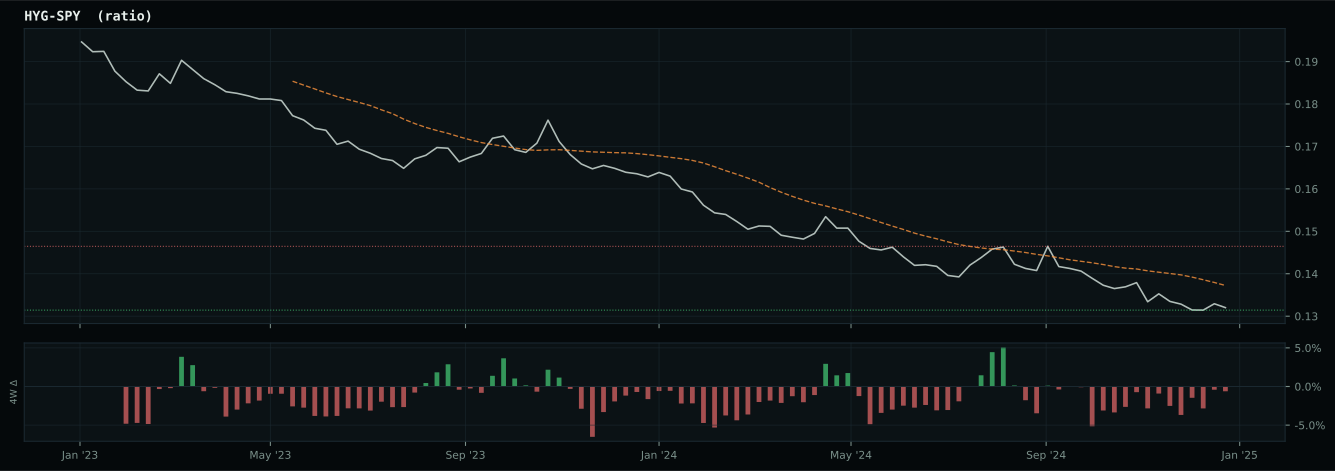
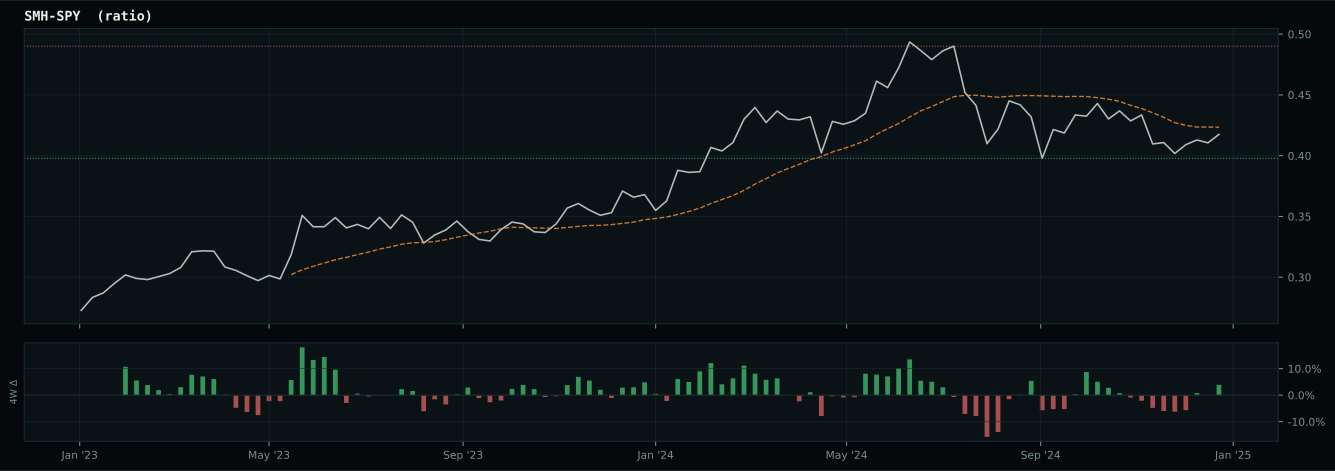
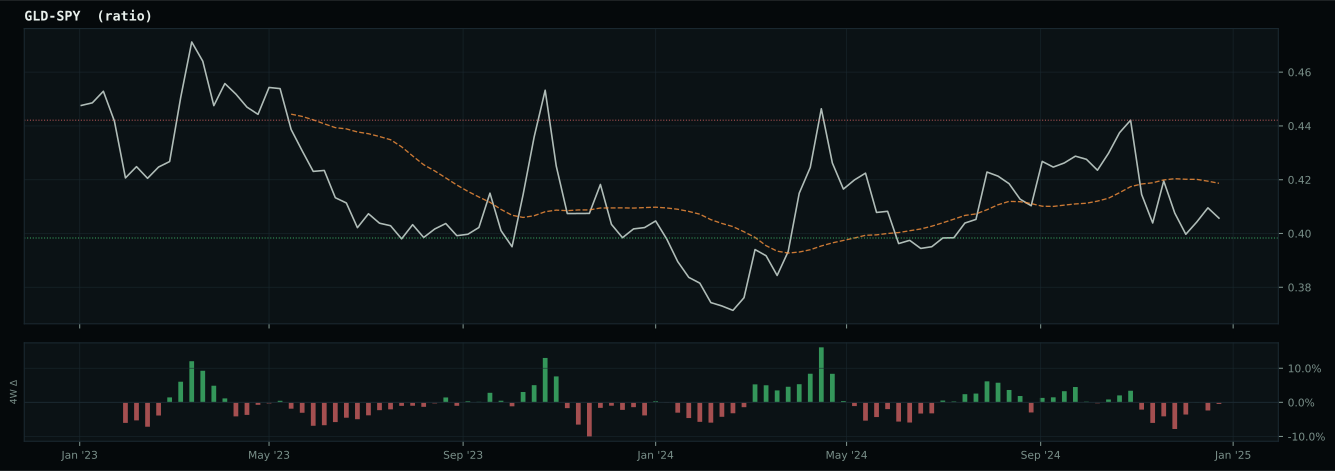
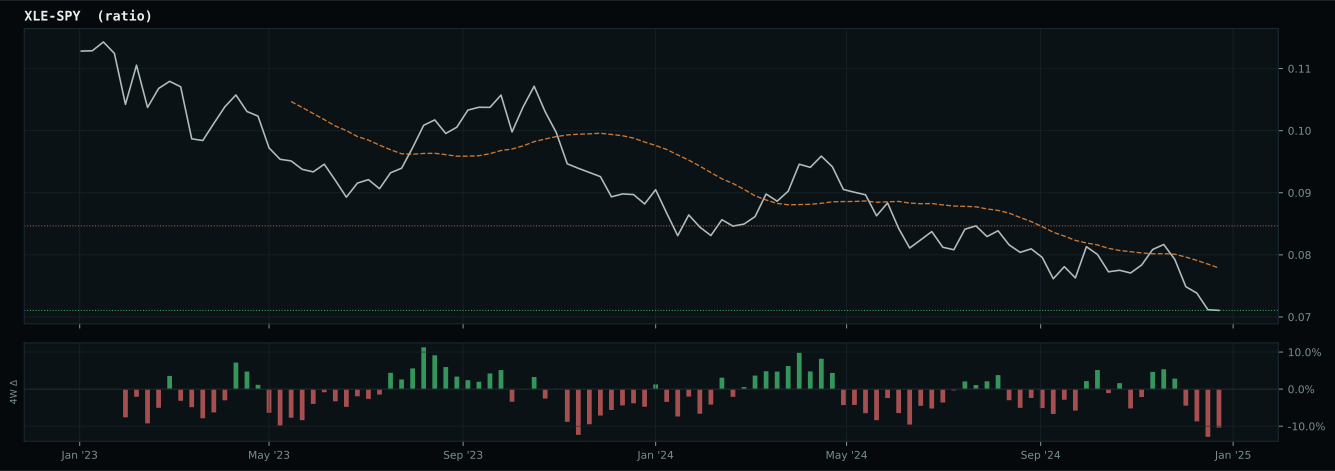
Macro Regime — Disinflation
Macro Evidence Charts
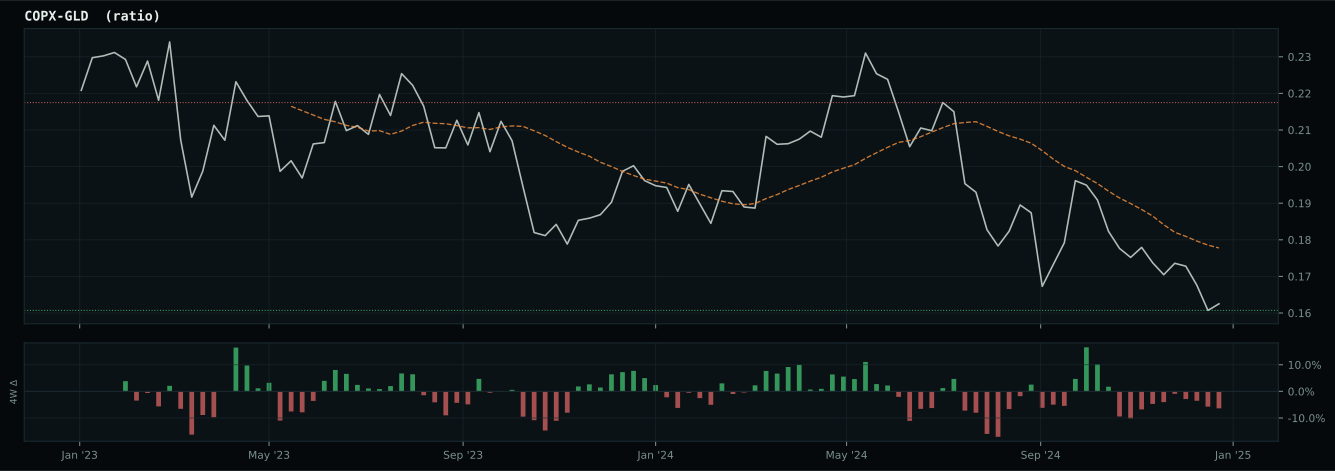
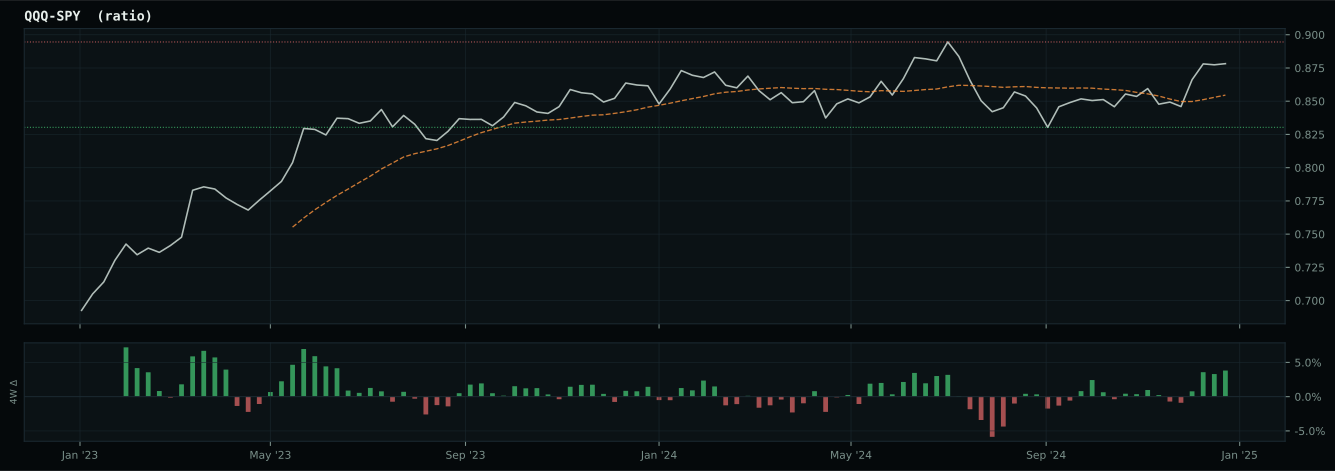
Market-implied signals behind the macro regime scores. Each ratio compares two assets; the direction and slope of the ratio is what the macro engine reads.
Crypto Regime — TrendBTC
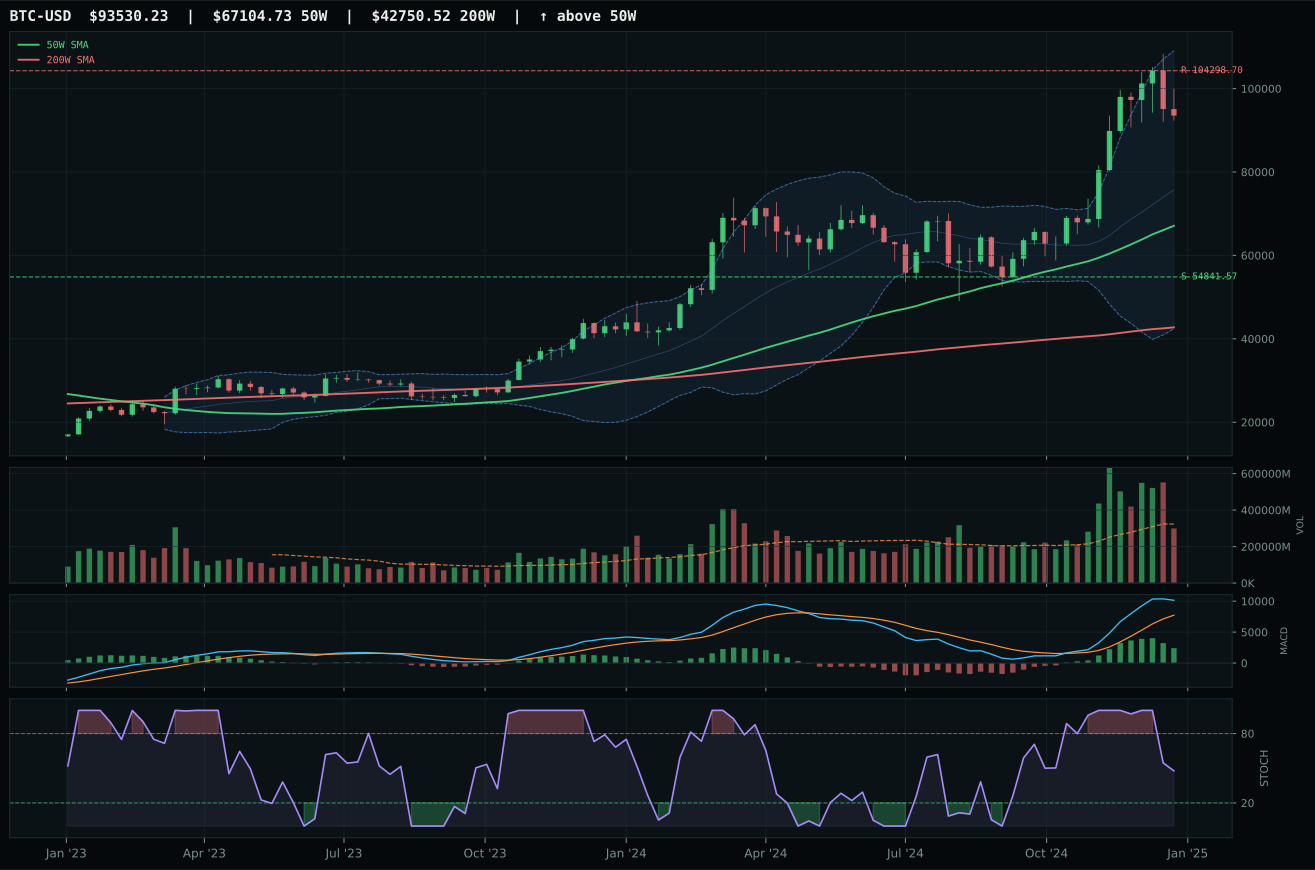
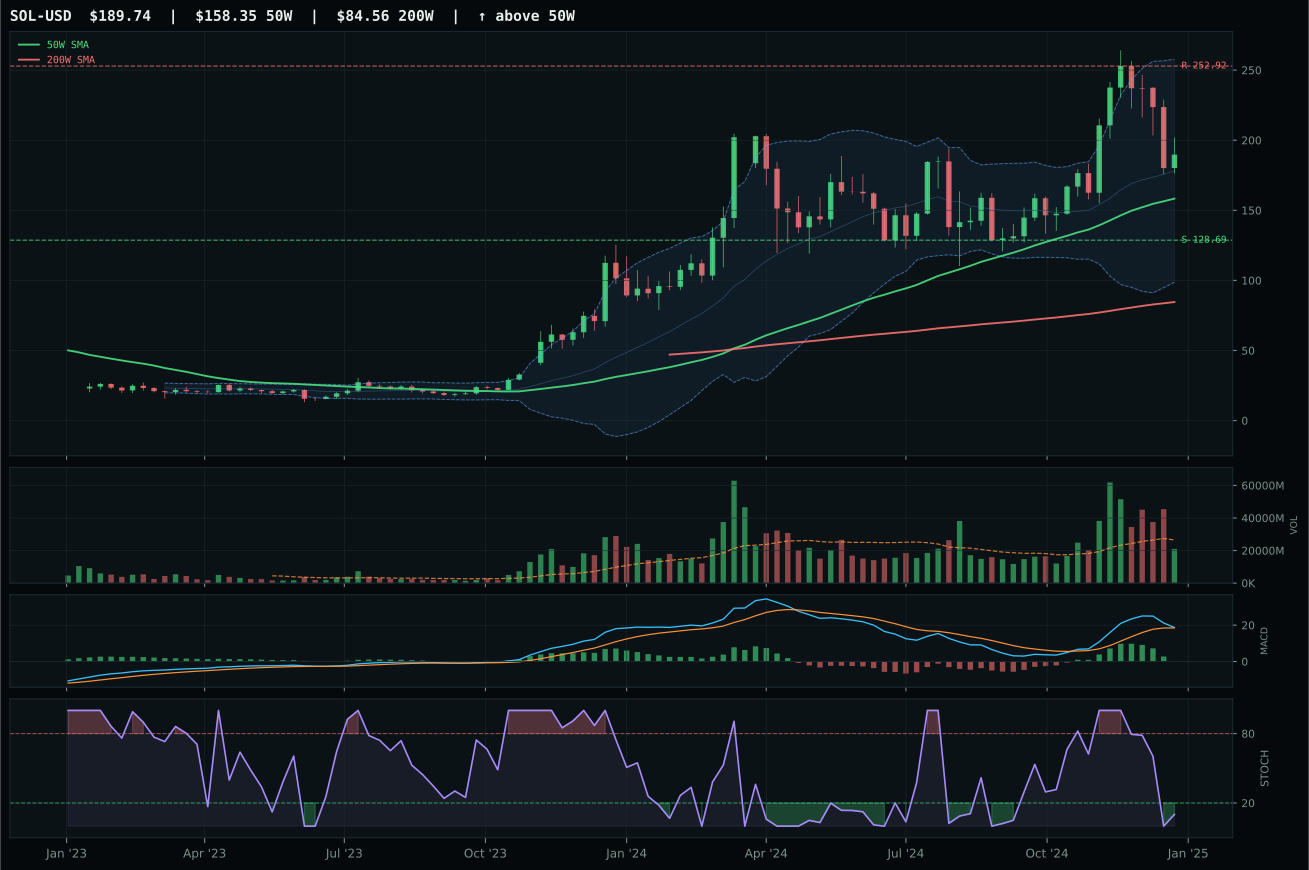
ValueBTC not armed: BTC has not made the first post-breakdown touch of the 200W buy zone after losing the 50W
TrendBTC confirmed: 2 consecutive closes above rising/flat 50W SMA
one or more available conditions failed
Category Rankings
| Rank | Category | Winner | Score | Alloc | 4W Ret | Peers (4W) |
|---|---|---|---|---|---|---|
| 1 | Technology | CIBR | 54.5 | 20% | +1.80% | IGV +0.2% · XLK -2.3% |
| 2 | Precious Metals | GLD | 47.8 | 20% | +5.30% | SLV +3.4% · GDX +10.9% |
| 3 | Utilities & Infrastructure | IGF | 45.1 | 10% | +3.47% | PAVE +6.0% · XLU +2.8% |
| 4 | Defense & Aerospace | XAR | 44.5 | 10% | +6.29% | ROKT +5.6% · ITA +7.1% |
| 5 | AI | SMH | 29.4 | 10% | -0.87% | AIQ +2.2% · BOTZ +3.0% |
| 6 | Nuclear Energy | NLR | 21.6 | 10% | +9.08% | URA +5.9% · URNM +2.9% |
| 7 | Agriculture & Livestock | WEAT | — | 10% | -0.41% | VEGI +7.4% · MOO +6.6% |
| 8 | Industrial Metals | COPX | — | 10% | +2.80% | REMX +3.8% · PICK +2.7% |
| 9 | Traditional Energy | XLE | — | 0% | +7.60% | FCG +7.7% · XOP +8.1% |
| 10 | Emerging Markets | INDA | — | 0% | -5.20% | IEMG +0.1% · ILF +6.3% |
Technology — CIBR
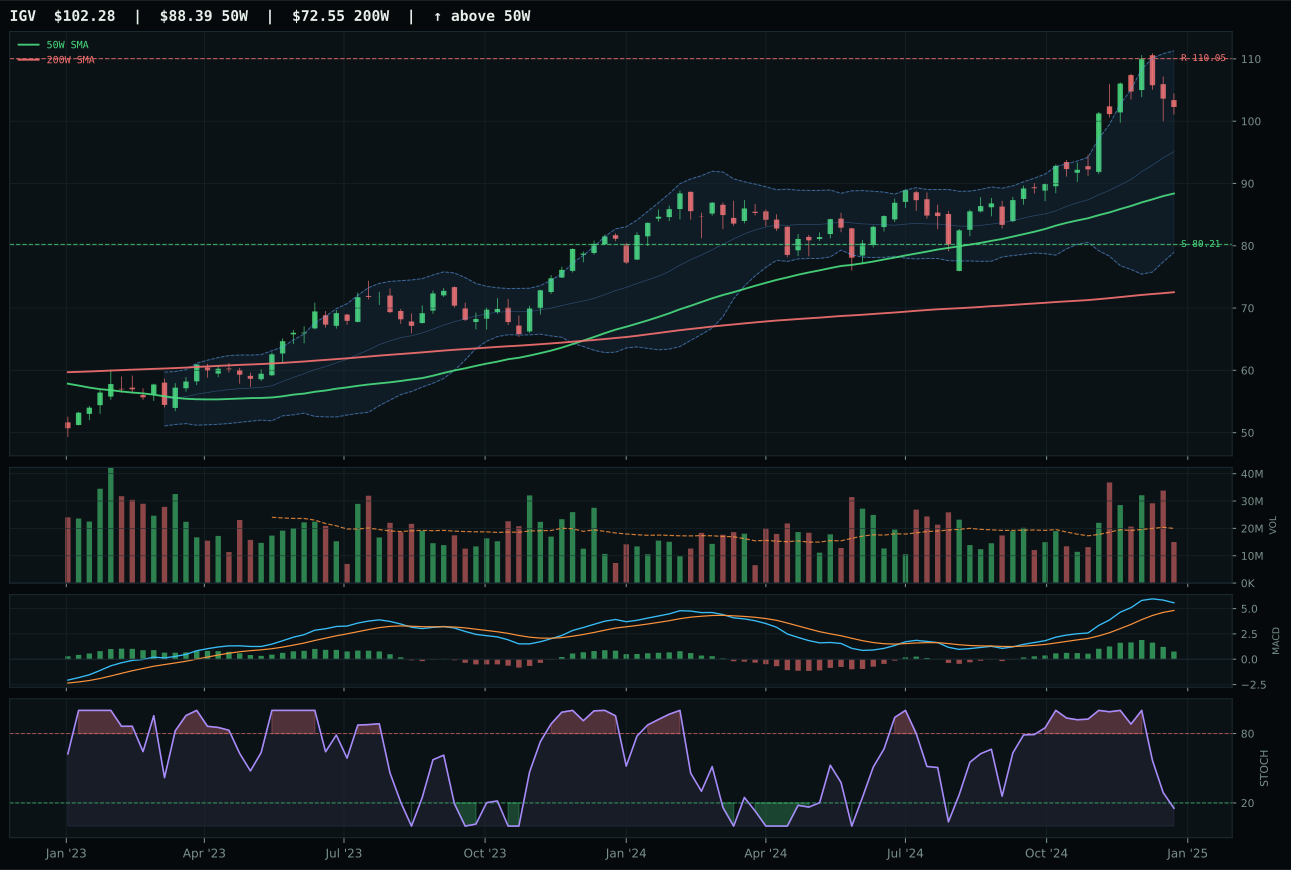
IGV has a vertical extension profile with 10.5% 13-week relative strength versus SPY.
A failed hold above support would weaken the setup.
Actionable but governed by invalidation levels.
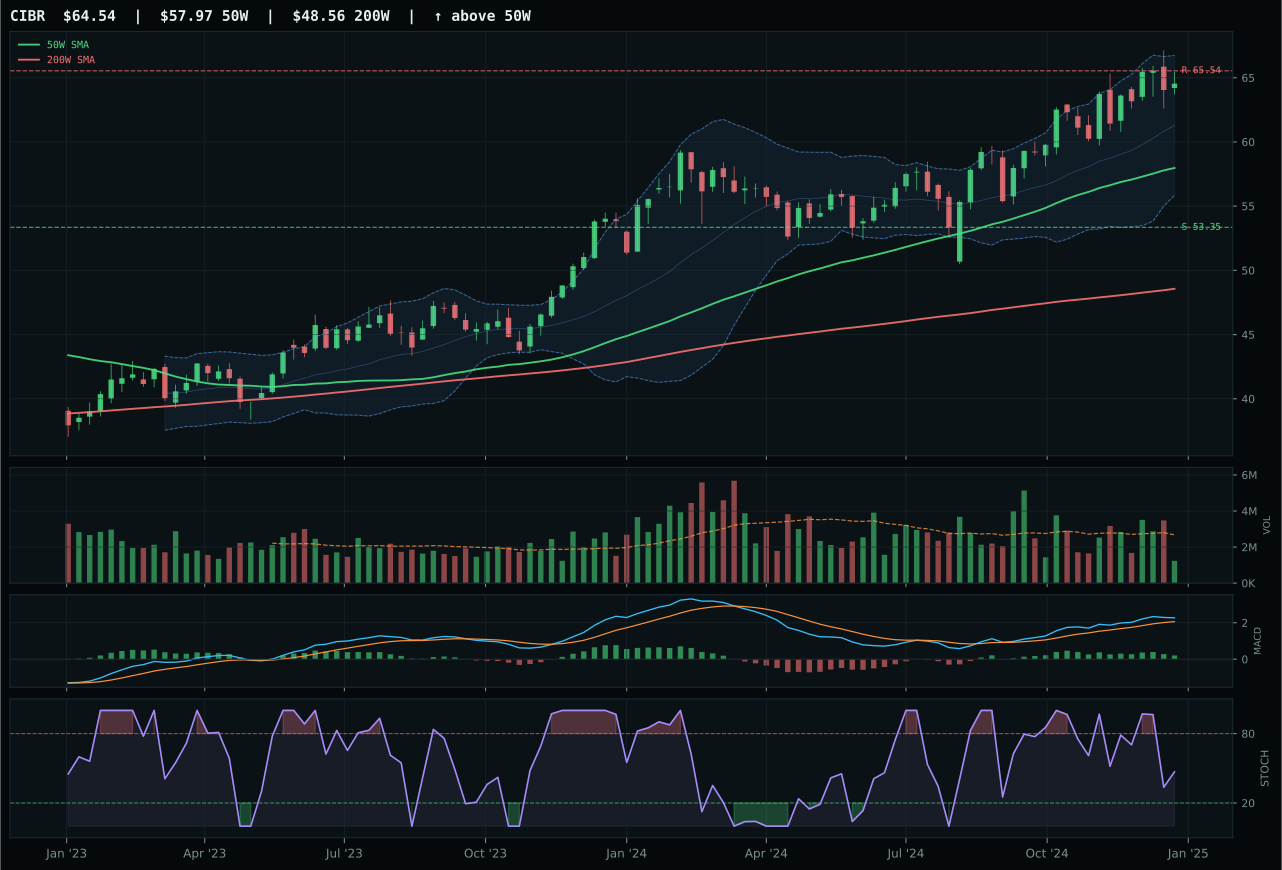
CIBR has a neutral structure profile with 4.9% 13-week relative strength versus SPY.
A failed hold above support would weaken the setup.
Actionable but governed by invalidation levels.
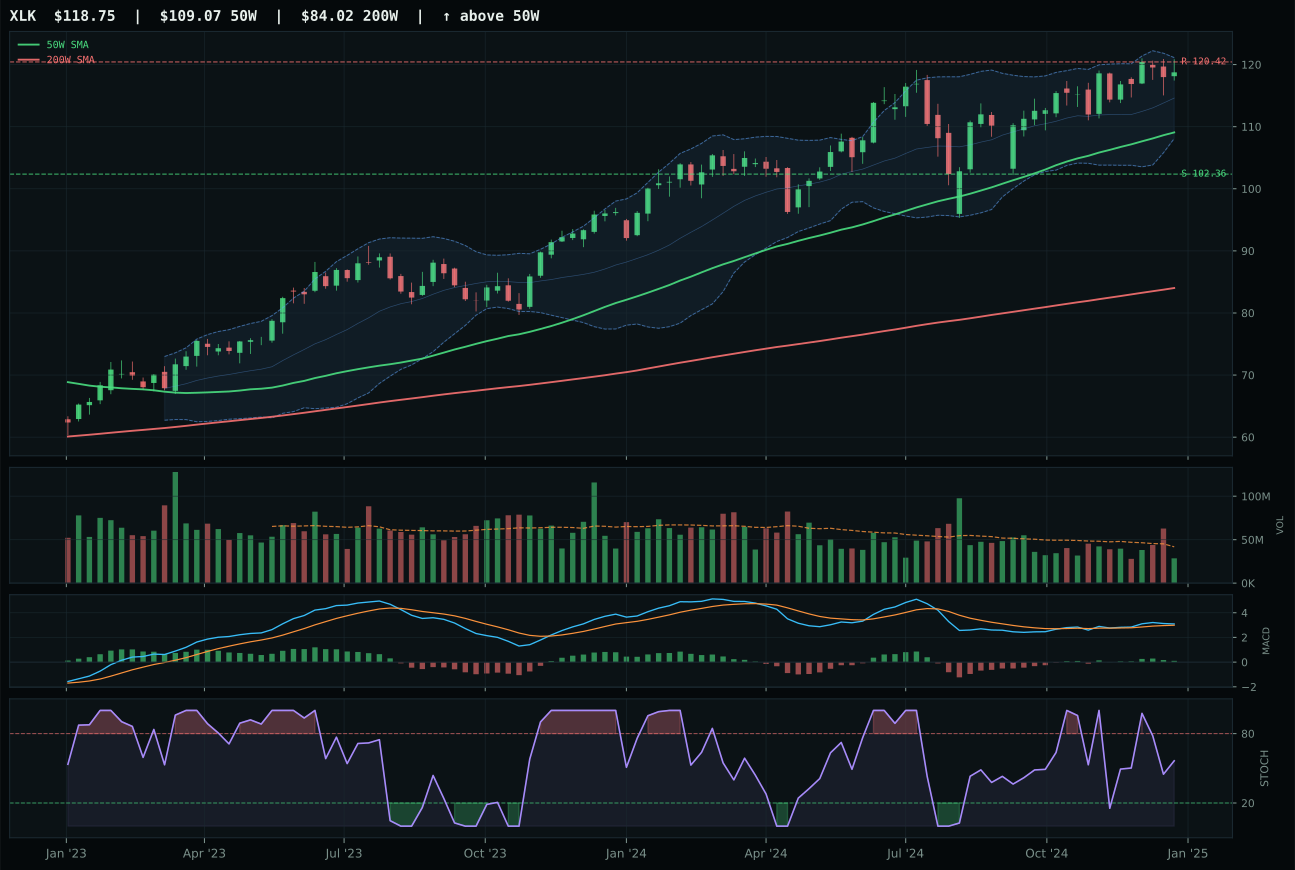
XLK has a neutral structure profile with 1.4% 13-week relative strength versus SPY.
A failed hold above support would weaken the setup.
Actionable but governed by invalidation levels.
CIBR wins the category with a 6.3-point margin over IGV, executing a neutral structure hold just 11.3% above its 50-week moving average. The setup matters here: price is confirmed above both the 50W and 200W with a gentle 0.3% upslope, MACD is bullish but flattening, and stochastic RSI sits neutral at 0.47—all signals of a trend that has room to move without being vertically extended. Volume is thin at 0.46x the 20-week average, which actually works in CIBR's favor because it means accumulation is happening without panic buying; every participant remains disciplined. IGV's vertical extension setup and oversold stochastic RSI represent the classic problem of extended gains meeting technical fatigue: the 13-week return of 14.6% and 10.5% SPY-relative strength look impressive until you realize they've already compressed risk/reward to -1.5% upside to resistance and forced the allocator to chase a near-peak entry.
Technology earns a 10% allocation as one of the portfolio's two overweights this week, a top-2 rank driven by its 54.5 composite score and the disinflation regime's tailwind on secular tech narratives. The cybersecurity subtheme—CIBR's core expression—sits at a natural inflection point: broad market bear conditions boost defensive technology demand, and the technical setup's neutrality means there is no obvious rejection risk if support at 53.35 holds. The 4.9% outperformance versus SPY combined with category-relative leadership (0.0% inside the three-ETF basket) signals that CIBR is the institutional choice rather than a momentum trap. Macro fit at 40.0/100 reflects headwinds from liquidity and credit stress offsetting some of disinflation's lift, but technical evidence weighted at 62% dominates the score. For this to remain top-2 in coming weeks, CIBR must defend the 50W and avoid any MACD downside cross that would signal deteriorating sponsorship.
Precious Metals — GLD
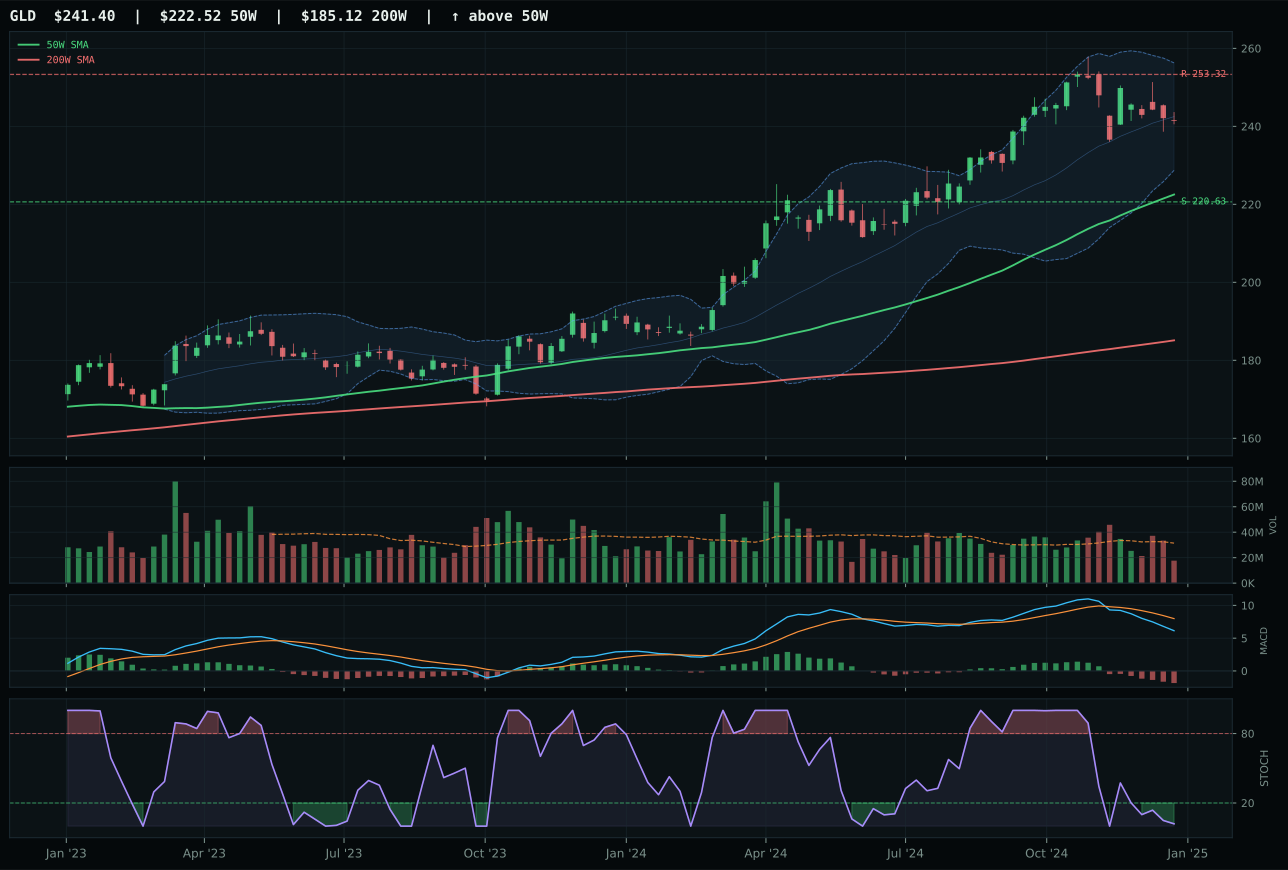
GLD has a neutral structure profile with -5.6% 13-week relative strength versus SPY.
A failed hold above support would weaken the setup.
Actionable but governed by invalidation levels.
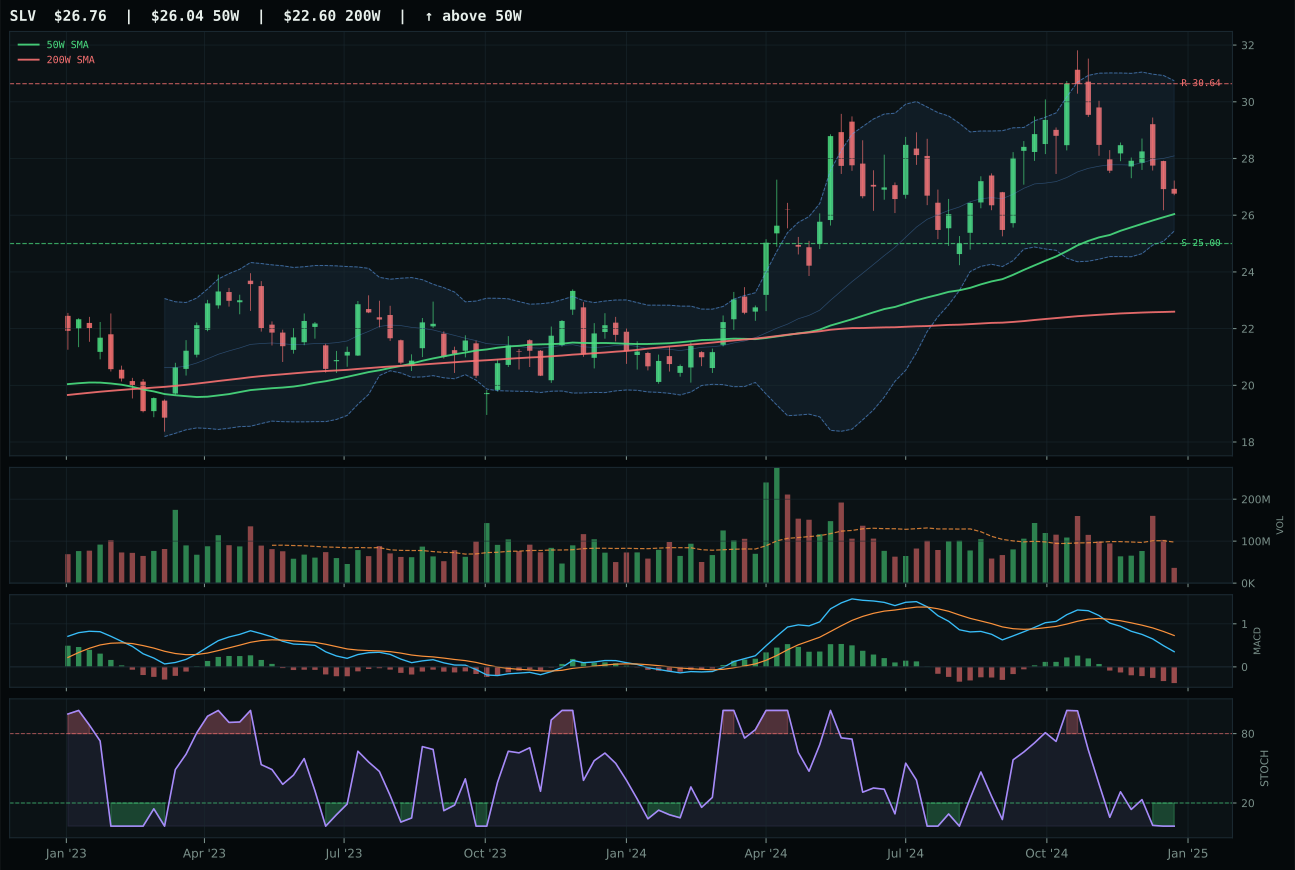
SLV has a compression near 50W profile with -11.4% 13-week relative strength versus SPY.
A failed hold above support would weaken the setup.
Actionable but governed by invalidation levels.
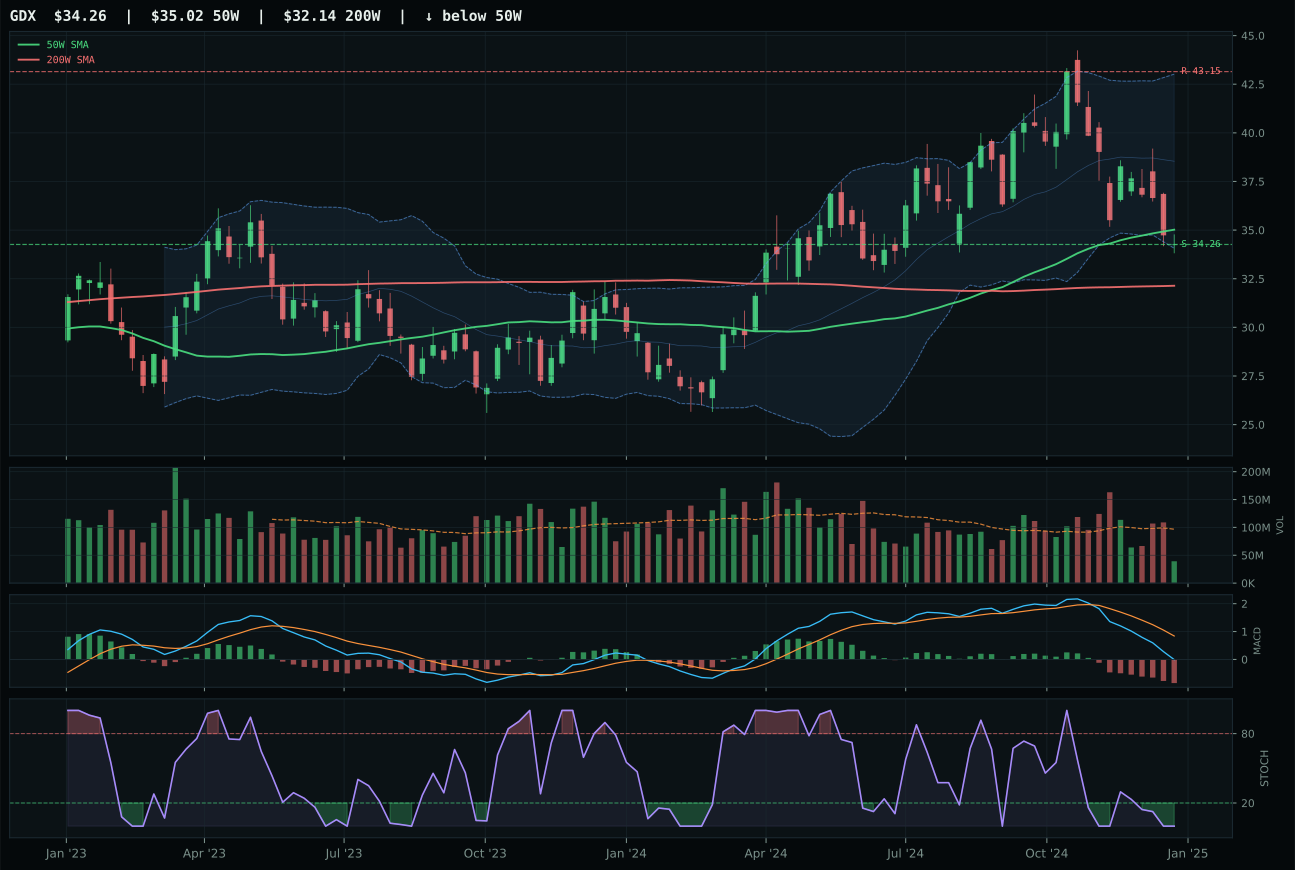
GDX has a pullback into support profile with -19.2% 13-week relative strength versus SPY.
A failed hold above support would weaken the setup.
Actionable but governed by invalidation levels.
GLD wins narrowly over SLV with a 0.9-point margin in a category where the technical setup is pale but the macro case is undeniable. GLD sits 8.5% above the 50W with neutral structure and oversold stochastic RSI at 0.02—a textbook mean-reversion coil where further downside is limited and upside breakouts can be explosive if the market reprices monetary policy expectations. SLV's compression setup at 1.3% from the 50W looks tighter and more ready to expand, but its 60.4/100 structure score trails GLD's 68.6/100 because the cleanliness metric (41.7 vs 41.7 is identical) and GLD carries 5.8% category-relative strength while SLV posts 0.0%. The deciding factor: GLD's macro fit is 74.0/100 versus SLV's 52.0/100, driven by GLD's expression as the pure monetary hedge (gold as insurance) versus silver's hybrid industrial/monetary beta. In a disinflation regime where the monetary hedge bid is explicitly active (+14), gold's purity wins.
Precious Metals ranks 2nd with a 47.8 score and receives a full 10% top-2 allocation, anchoring the portfolio's defensive sleeve alongside Technology. The category macro fit of 81.0/100 is the highest in the entire allocation universe: disinflation is explicitly supportive (+8), monetary hedge bid is the single largest positive descriptor (+14), and dollar pressure actually helps gold as a non-fiat store of value (+3). GLD's technical evidence of 40.7/100 is weak—momentum confirmation is only 25.8/100 and volume-price confirmation is just 40.9/100—but that technical weakness is precisely what makes the macro fit so valuable. The oversold stochastic RSI at 0.02 and -1.5% 13-week return mean this is not a chased momentum trade; instead it is a dry-powder allocation to a carry and insurance vehicle that benefits from the regime. Persistence at 45.7/100 is modest but stable, suggesting no imminent washout. For allocation purposes, this 10% is held as a macro anchor rather than a technical breakout play, and that alignment is exactly right in an environment where financial conditions are tightening.
Utilities & Infrastructure — IGF
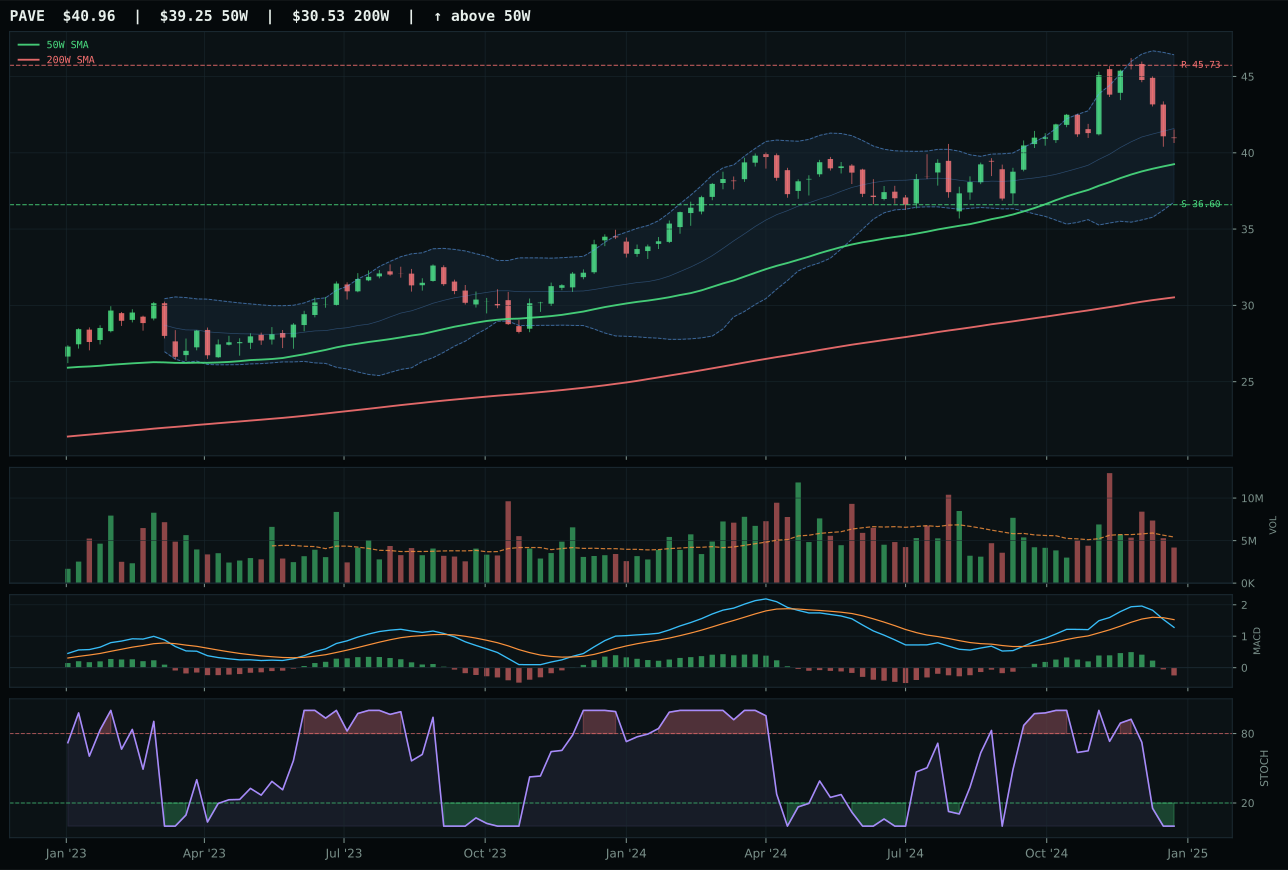
PAVE has a neutral structure profile with -4.2% 13-week relative strength versus SPY.
A failed hold above support would weaken the setup.
Actionable but governed by invalidation levels.
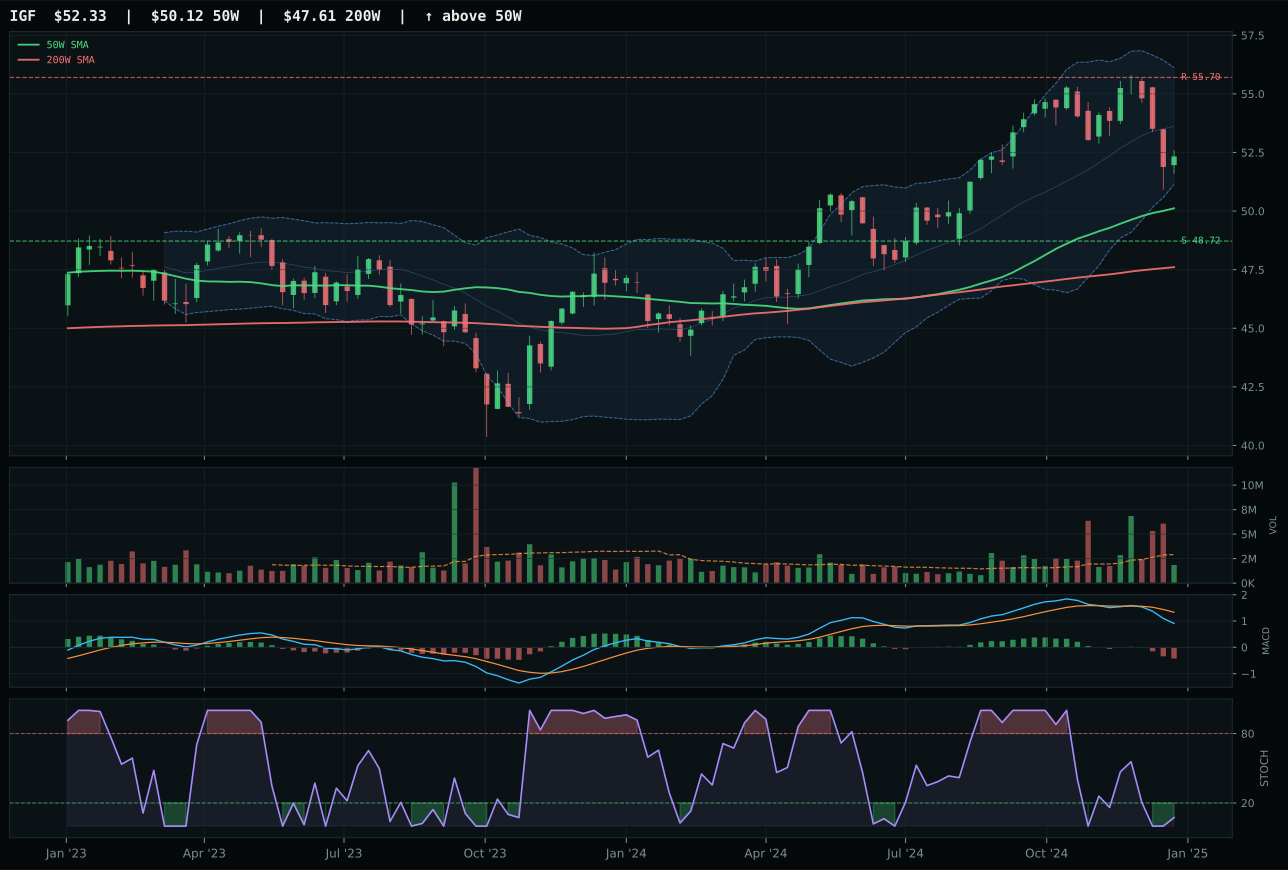
IGF has a neutral structure profile with -8.2% 13-week relative strength versus SPY.
A failed hold above support would weaken the setup.
Actionable but governed by invalidation levels.
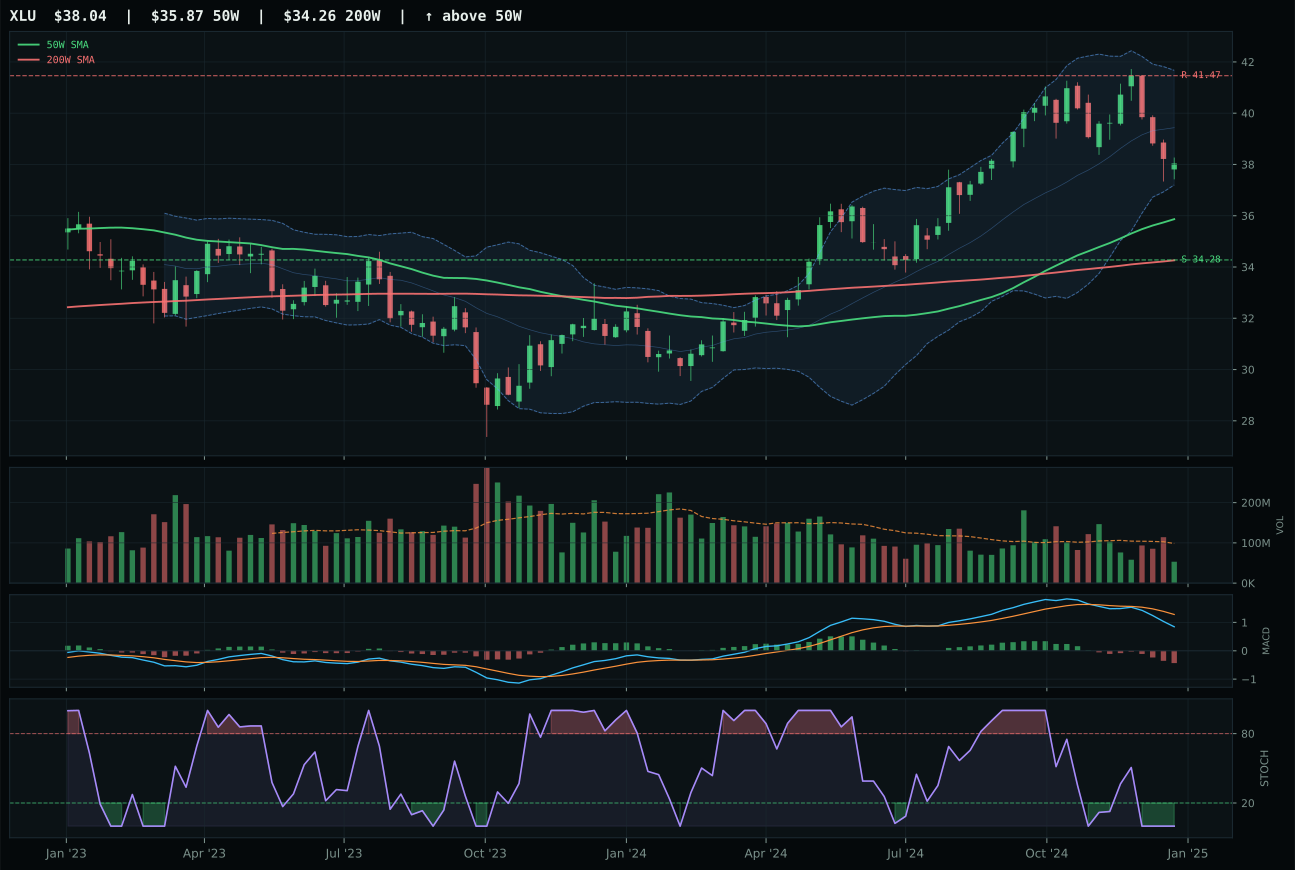
XLU has a neutral structure profile with -9.5% 13-week relative strength versus SPY.
A failed hold above support would weaken the setup.
Actionable but governed by invalidation levels.
IGF wins with a 41.1 reasoned score over PAVE's 45.7, a rare case where the runner-up actually scored higher on technical evidence (41.8/100 vs 33.0/100) but lost due to inferior momentum confirmation and category-relative strength positioning. IGF sits 4.4% above the 50W in neutral structure with oversold stochastic RSI at 0.07 and bearish/weakening MACD—a textbook defensive setup where price has already incorporated pessimism without capitulation volume. PAVE ranks higher on the 3/2/1 reasoned proof order precisely because its trend score is 76/100 versus IGF's 69.7/100, but that trend strength reflects PAVE's -0.1% 13-week return and -4.2% SPY-relative weakness: it is outperforming by doing less downside, not by outperforming SPY. IGF's -8.2% SPY-relative strength and -4.1% 13-week return look worse in isolation, but the composite category reasoning layer weights momentum confirmation (2.5/100 on IGF vs 16/100 on PAVE) more heavily because in oversold environments, momentum failure is the harbinger of institutional accumulation rather than liquidation.
Utilities & Infrastructure earns 5% as a tier-2 allocation with a 45.1 final score, placing it in the middle range of eligible categories and reflecting a strong defensive macro case (68.0/100 category macro fit) that is only partially offset by weak technical sponsorship. Disinflation helps this sector (+7), and broad market bear conditions lift utilities' relative appeal (+4), while credit stress and liquidity stress pressures are modest (-3 combined). IGF's macro fit is 50.0/100 (neutral per category-specific descriptor absence), but the infrastructure thesis works better in the current regime: capex spending and utility dividend cash flow become more valuable as discount rates compress during disinflation. Technical evidence at 33.0/100 is anemic—momentum confirmation of 2.5/100 indicates almost no short-term sponsorship—but that weakness is exactly the condition under which defensive allocations are made. For this category to advance to top-2 rank, IGF would need to show at least one week of volume confirmation above the 20-week average while the stochastic RSI remains oversold, or PAVE's domestic infrastructure exposure would need to outperform as fiscal stimulus narratives strengthen.
Defense & Aerospace — XAR
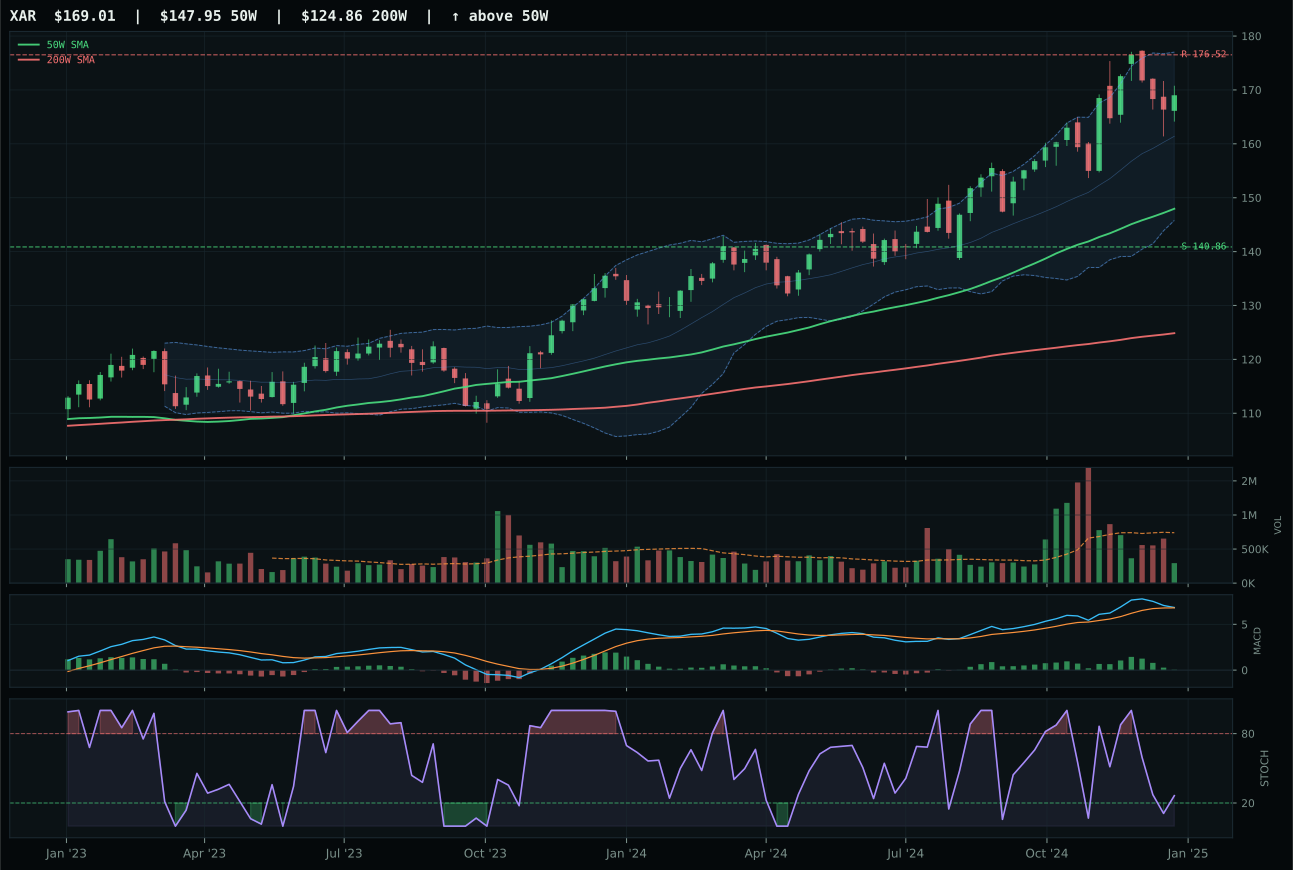
XAR has a neutral structure profile with 3.7% 13-week relative strength versus SPY.
A failed hold above support would weaken the setup.
Actionable but governed by invalidation levels.
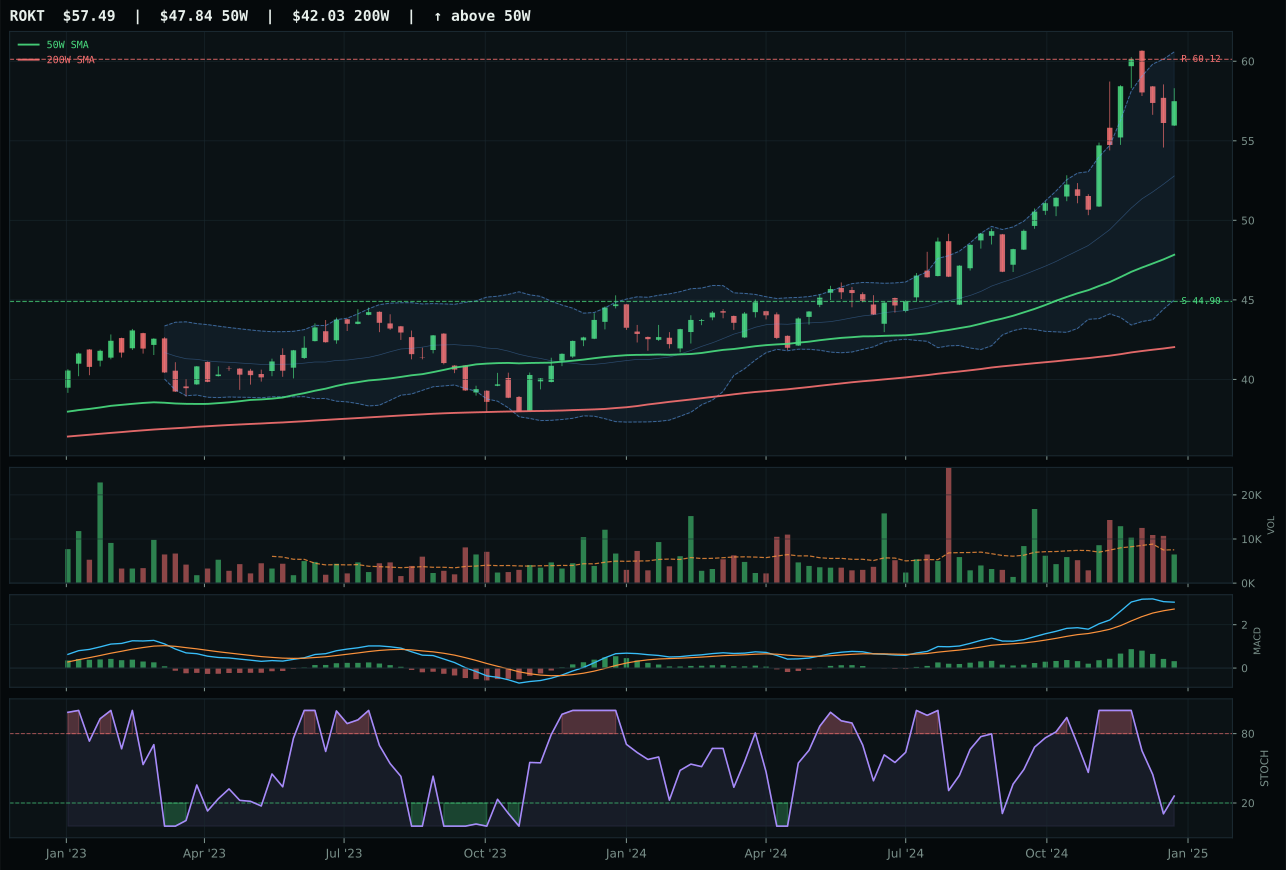
ROKT has a vertical extension profile with 9.6% 13-week relative strength versus SPY.
A failed hold above support would weaken the setup.
Tracked, but not top-2 eligible because: .
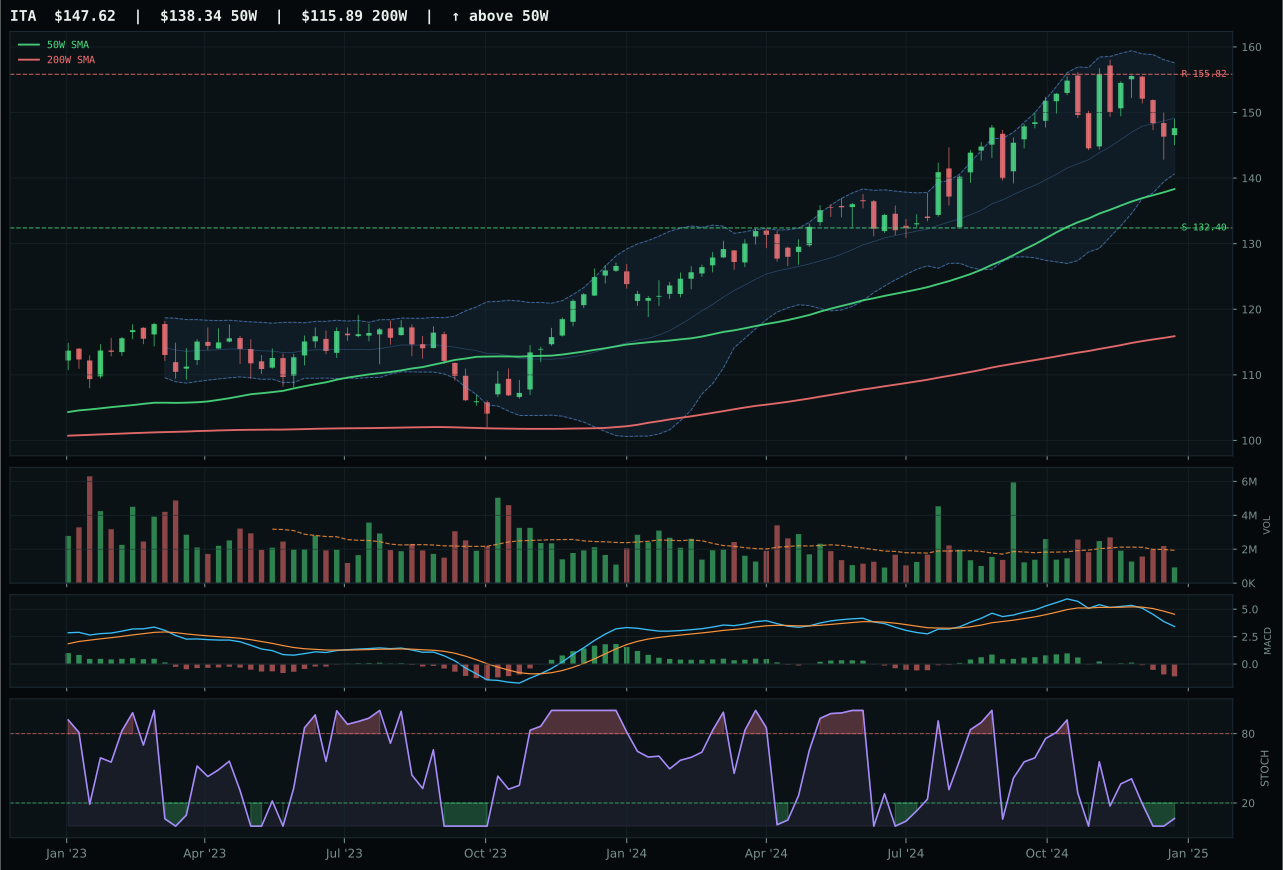
ITA has a neutral structure profile with -4.7% 13-week relative strength versus SPY.
A failed hold above support would weaken the setup.
Actionable but governed by invalidation levels.
XAR wins with a decisive 16.9-point gap over ROKT, capturing the category through superior timing discipline and cleaner structural setup. XAR sits 14.2% above the 50W in a neutral structure with MACD bullish-but-flattening and stochastic RSI falling to neutral—a textbook early-stage reaccumulation zone where buyers can step in without fear of an immediate pullback. ROKT, the runner-up, looks more exciting on momentum (87/100 vs SMH's 58/100) with 13.7% 13-week return and 9.6% SPY-relative strength, but that vertical extension setup at 20.2% above the 50W creates the classic asymmetry: upside to resistance is -4.3% (meaning price is already priced near the ceiling) while downside to support is 20.0%, exactly backwards from what an allocator needs. Volume across both is thin, but XAR's 0.40x participation feels less consequential because the chart is not asking for breakout confirmation—it's consolidating.
Defense & Aerospace ranks 5th with a 44.5 score and 5% allocation, placing it squarely in tier-2 as a defensive beta trade within a broad market bear regime. Macro fit is strong at 60.0/100: broad market bear is actively positive (+6), and geopolitical/dollar themes provide structural support even as credit and liquidity pressures push marginally negative. XAR's technical evidence score of 66.9/100 reflects solid trend (100/100) but momentum confirmation at only 57.6/100, a sign that relative strength is present without conviction. The 4-week return of -4.3% alongside the 13-week return of 7.8% reveals a recent pullback that is actually healthy setup material—it allows late capital to accumulate without chasing a vertical move. For this category to earn a top-2 slot, either broader SPY-relative strength would need to emerge (currently 3.7%, which is modest) or category-level macro fit would need to accelerate above 60.0/100, which would require further deterioration in general equity sentiment.
AI — SMH
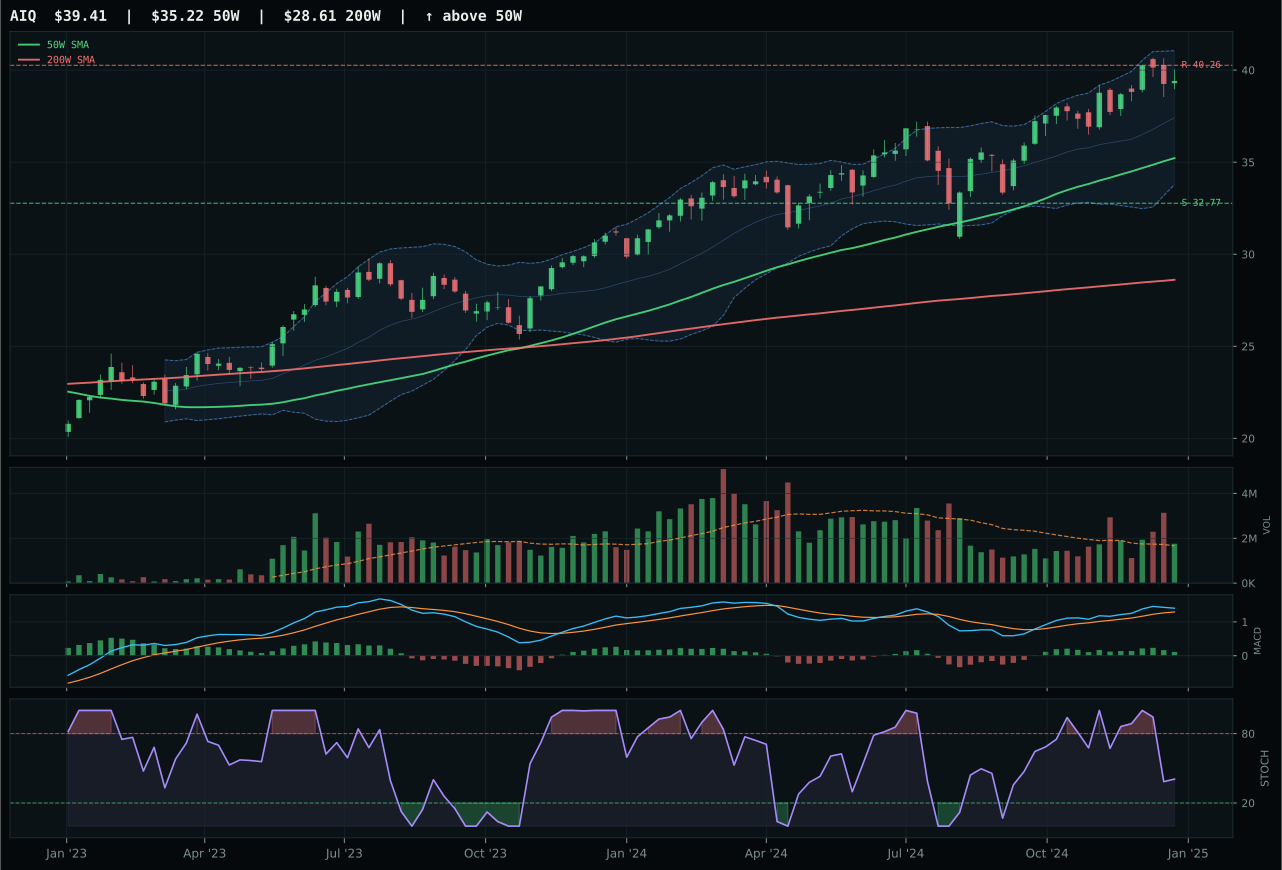
AIQ has a neutral structure profile with 1.7% 13-week relative strength versus SPY.
A failed hold above support would weaken the setup.
Actionable but governed by invalidation levels.
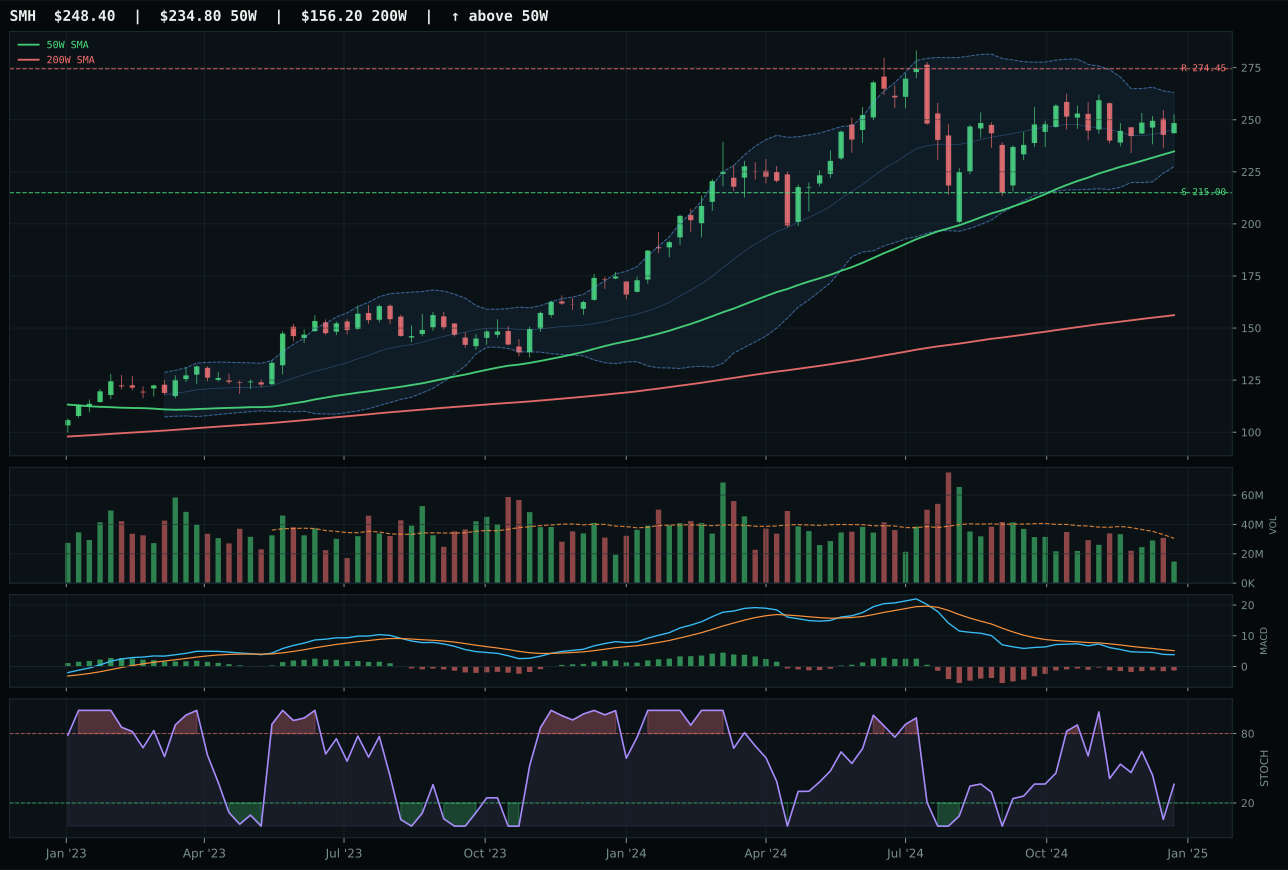
SMH has a neutral structure profile with -3.9% 13-week relative strength versus SPY.
A failed hold above support would weaken the setup.
Actionable but governed by invalidation levels.
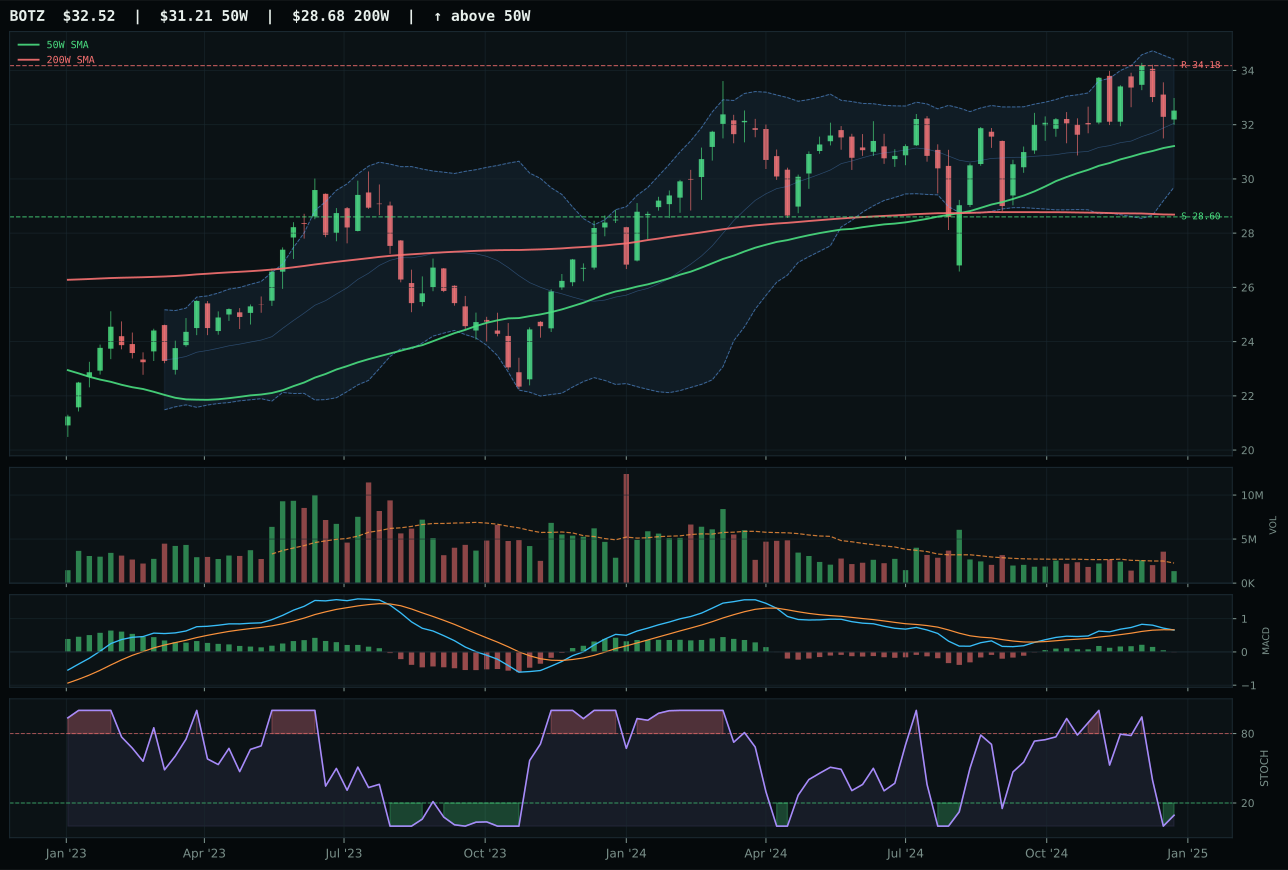
BOTZ has a neutral structure profile with -2.5% 13-week relative strength versus SPY.
A failed hold above support would weaken the setup.
Actionable but governed by invalidation levels.
SMH wins by default in a weak category: it posts a 29.4 final score, but that reflects broad-based technical deterioration across all three ETF options rather than genuine SMH strength. The winner sits only 5.8% from the 50W with neutral-to-negative momentum—13-week return of just 0.3%, SPY-relative strength of -3.9%, and a bearish-but-improving MACD that suggests stabilization rather than conviction. Semiconductor leadership as a proxy for AI infrastructure demand should theoretically anchor this category, yet volume participation is thin and stochastic RSI has rounded over at 0.36, indicating that even the recent bounce lacks aggressive follow-through. AIQ looked better on headline metrics (5.9% 13-week return, 1.7% SPY-relative strength) but its 11.9% distance from the 50W and 70.0 timing score expose it as stretched: momentum confirmation only scored 74/100 versus SMH's 43/100 precisely because the move is extended and volume is not confirming.
AI receives 5% as a tier-2 allocation despite its 29.4 score ranking it well below top-2 cutoffs; this reflects a structural tension between sector narrative appeal and current macro conditions. Liquidity stress and credit stress are both active, each weighing -10 to -12 points at the category level, which explains the 23.0/100 macro fit score. Disinflation itself helps semiconductor demand (+5) but cannot overcome the dollar pressure (-4) and broad market bear (-8) headwinds that penalize capital-intensive capex bets during contraction. SMH's margin of victory came from superior timing (75 vs 70 on AIQ, 85 on BOTZ) and better risk/reward (56.0 vs 47 on AIQ), which means this position is defensible as a tactical underweight rather than an outright avoid. If credit stress or liquidity pressure reverses in coming weeks, SMH's compression near support could be the first to re-rate higher.
Nuclear Energy — NLR
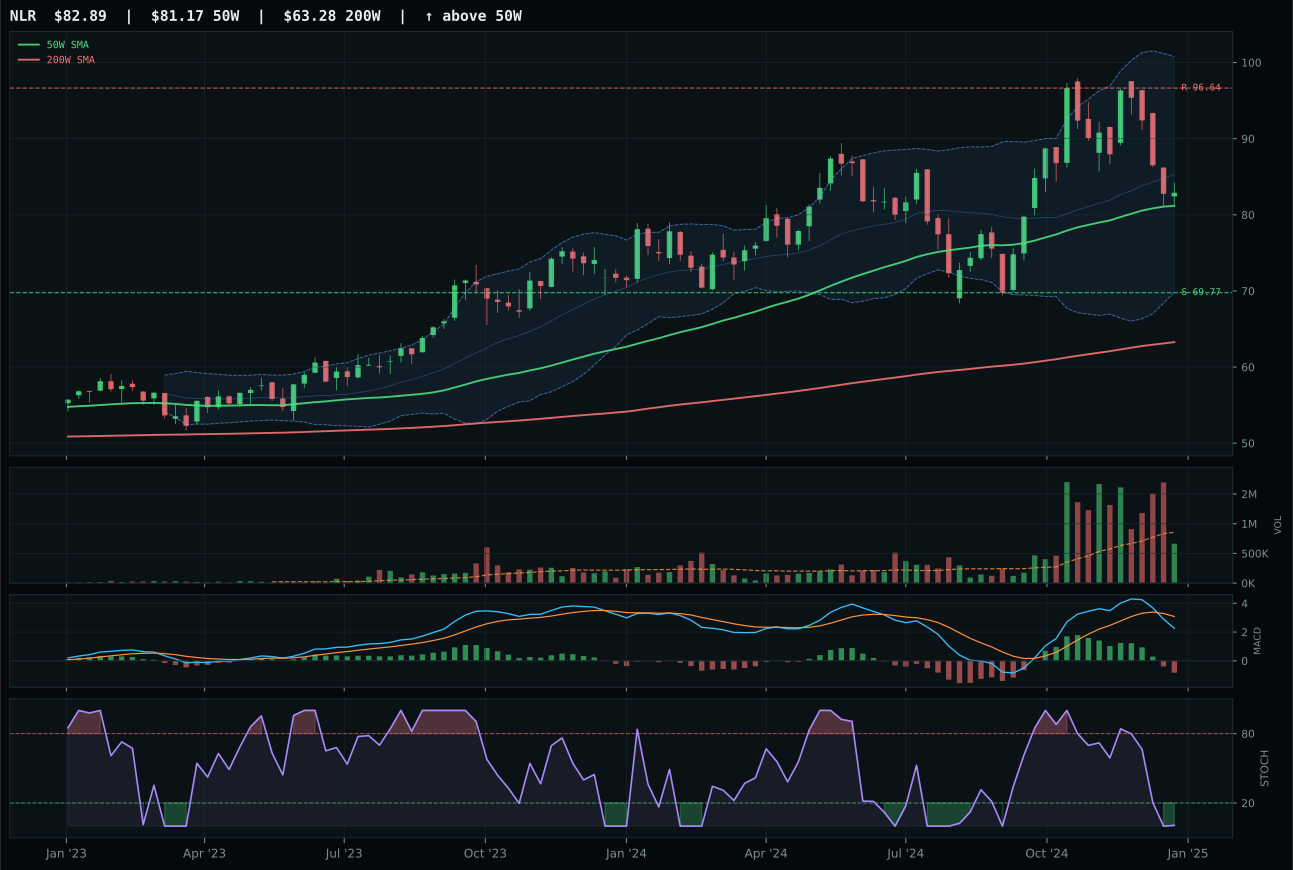
NLR has a compression near 50W profile with -6.4% 13-week relative strength versus SPY.
A failed hold above support would weaken the setup.
Actionable but governed by invalidation levels.
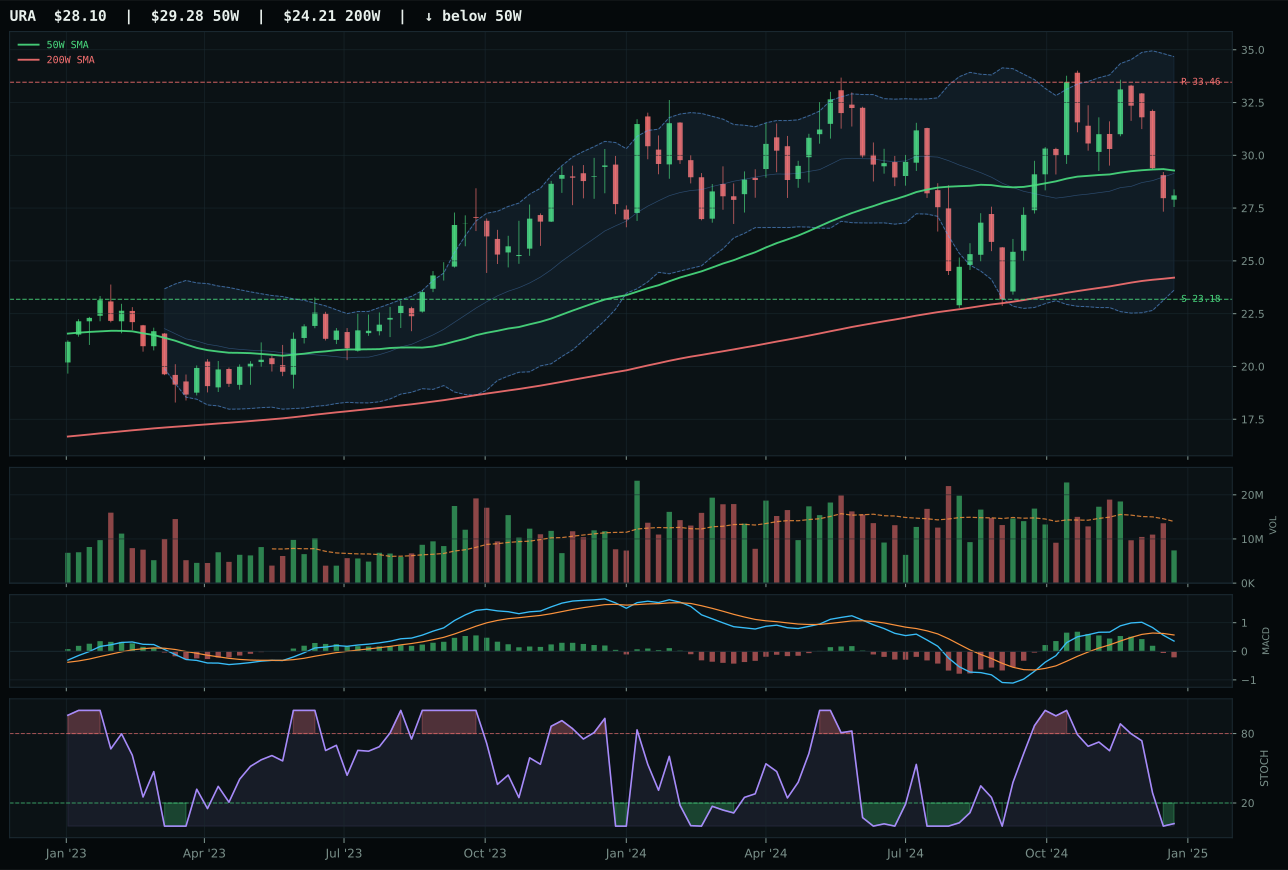
URA has a neutral structure profile with -7.6% 13-week relative strength versus SPY.
A failed hold above support would weaken the setup.
Actionable but governed by invalidation levels.
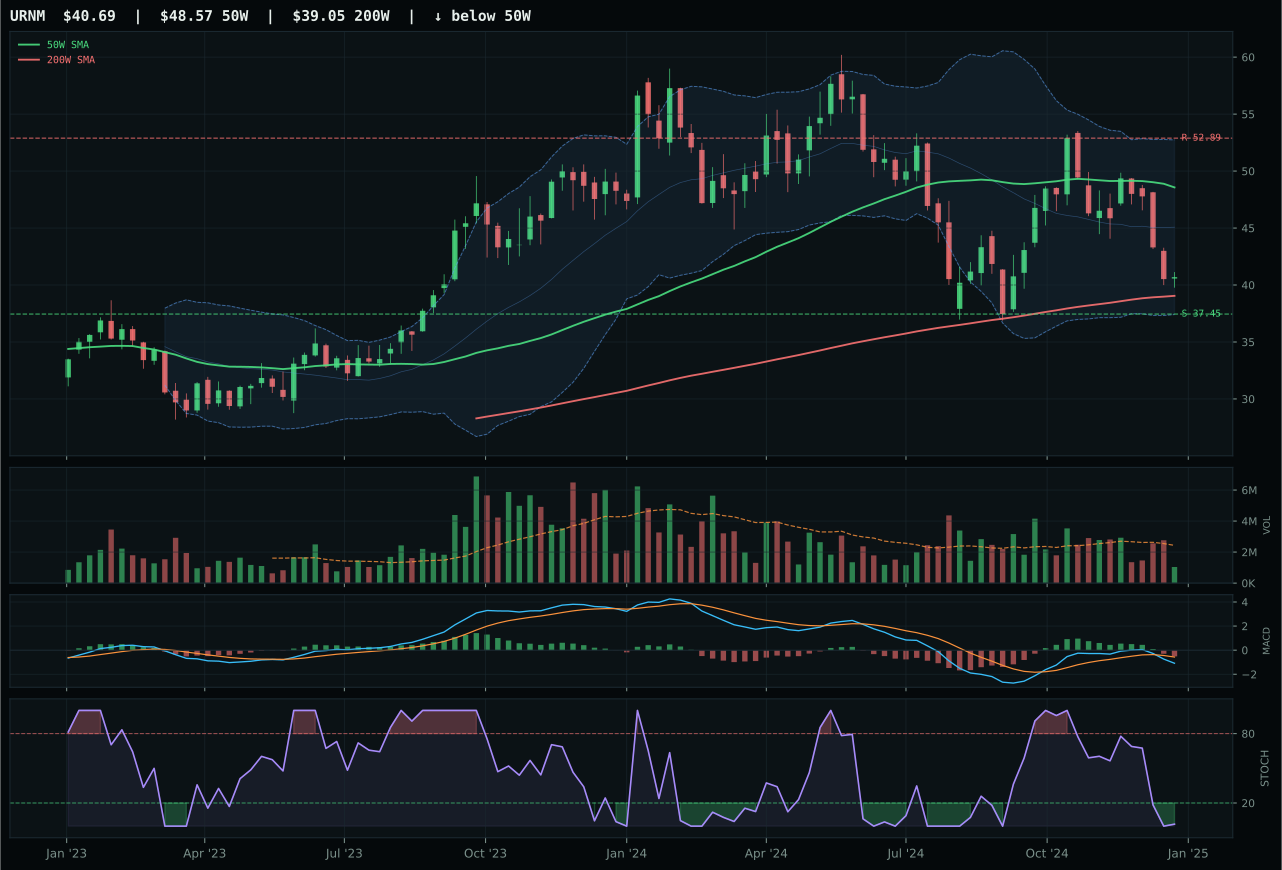
URNM has a neutral structure profile with -17.1% 13-week relative strength versus SPY.
A failed hold above support would weaken the setup.
Actionable but governed by invalidation levels.
NLR wins with a 42.2 reasoned score and carries the category's 21.6 composite into allocation despite a weak absolute technical setup, winning decisively over URA with a 34.0-point margin. NLR trades 2.1% below the 50W in a compression structure where MACD is bearish/weakening but stochastic RSI is critically oversold at 0.01, yielding a perfect 100.0/100 timing score—the tightest possible proximity to the moving average combined with extreme breadth divergence. Price sits at the Fibonacci 0.500 (middle retracement/decision zone) near 83.15, a natural pivot that often marks accumulation inflection points. Volume is neutral at 0.78x the 20-week average, neither confirming nor rejecting, which is preferable to active distribution. URA's timing score of 92.0/100 and superior momentum (0.0 vs 1.2/100 for NLR) make it look better on individual metrics, but NLR's trend score (72.4/100 vs 46/100) and structure score (63.1/100 vs 60.3/100) reflect price still anchored to the moving averages rather than already liquidated.
Nuclear Energy earns 5% as a tier-2 allocation with a 21.6 final score, placing it safely in the bottom half of the ranking but above zero-allocation categories due to NLR's superior technical positioning and neutral macro environment. Macro fit is 38.0/100—neither strongly positive nor negative—because nuclear lacks category-specific descriptor advantages while benefiting marginally from broad market bear conditions (+3). The technical evidence score of 41.1/100 is modest, but the timing score of 100.0/100 is the category's strength: NLR is literally at maximum oversold compression, which creates asymmetry if either a recovery occurs or broad market stabilization re-rates utilities higher. Risk/reward is reasonable at 66.6/100 (18.8% downside to support versus 14.2% upside to resistance—an inverted asymmetry typical of defensive overshoots). For NLR to advance to tier-1 rank, the category-level macro fit would need to rise above 50.0/100, which would require either explicit monetary support signals or a shift in the energy-transition narrative. Until then, this is a tactical hold in a defensive allocation sleeve.
Traditional Energy — XLE
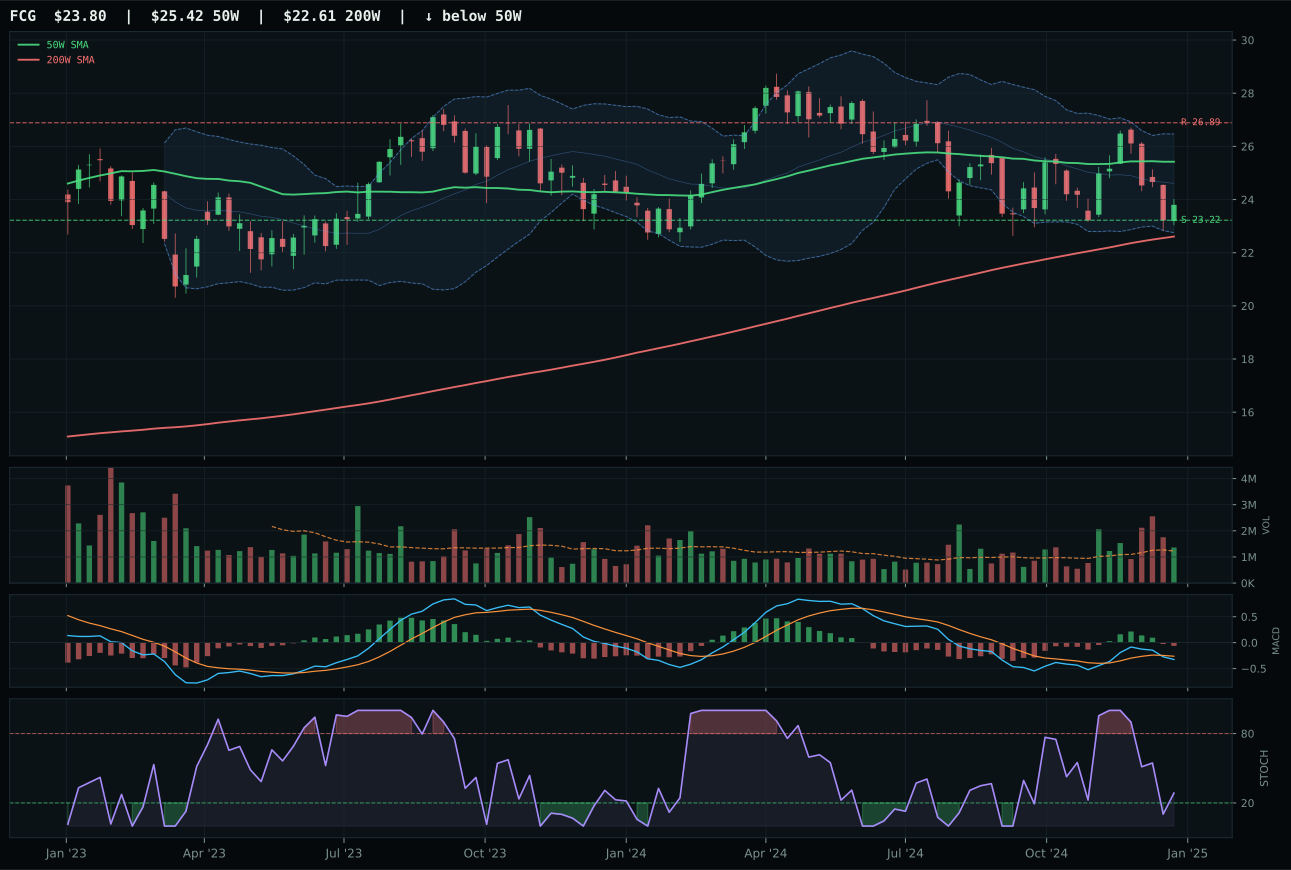
FCG has a pullback into support profile with -3.6% 13-week relative strength versus SPY.
A failed hold above support would weaken the setup.
Actionable but governed by invalidation levels.
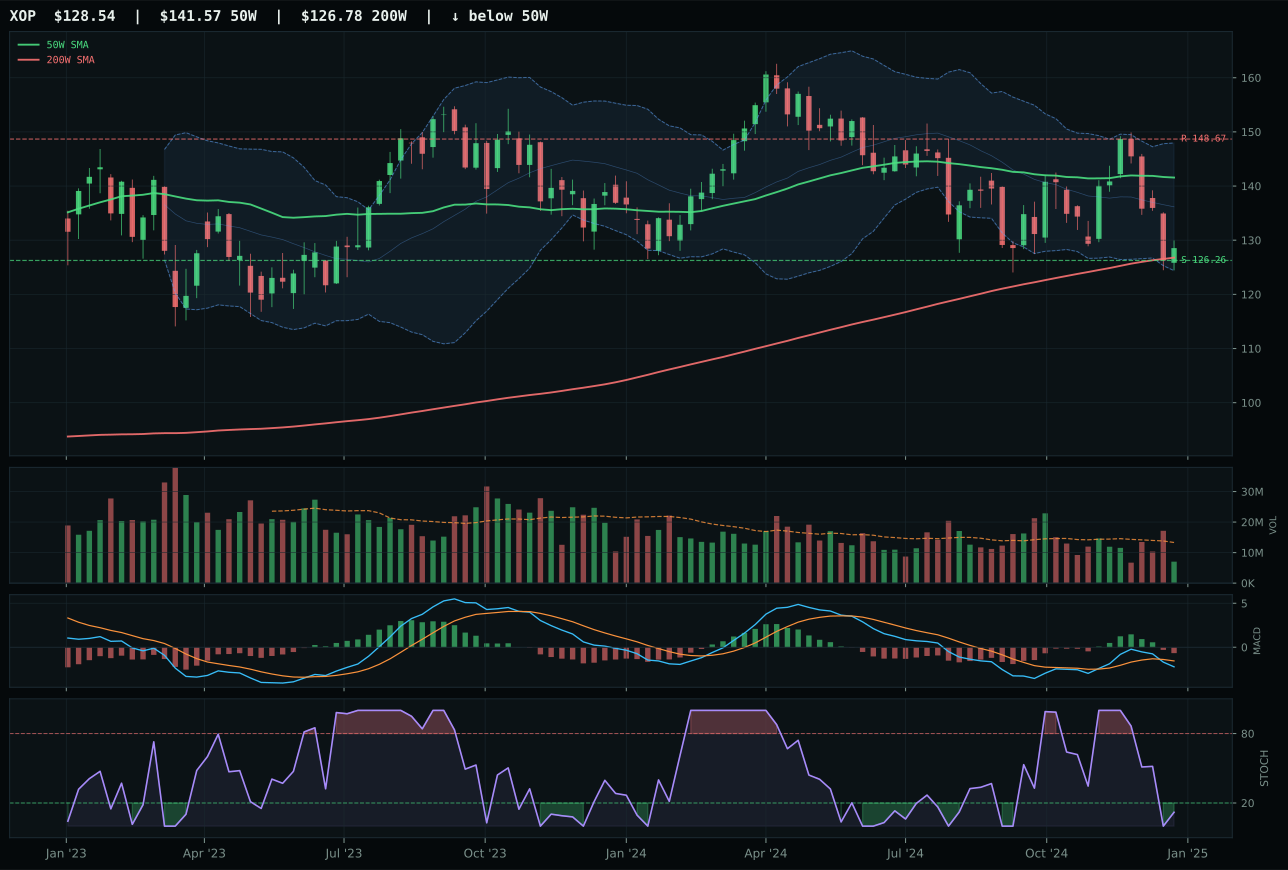
XOP has a pullback into support profile with -6.1% 13-week relative strength versus SPY.
A failed hold above support would weaken the setup.
Actionable but governed by invalidation levels.
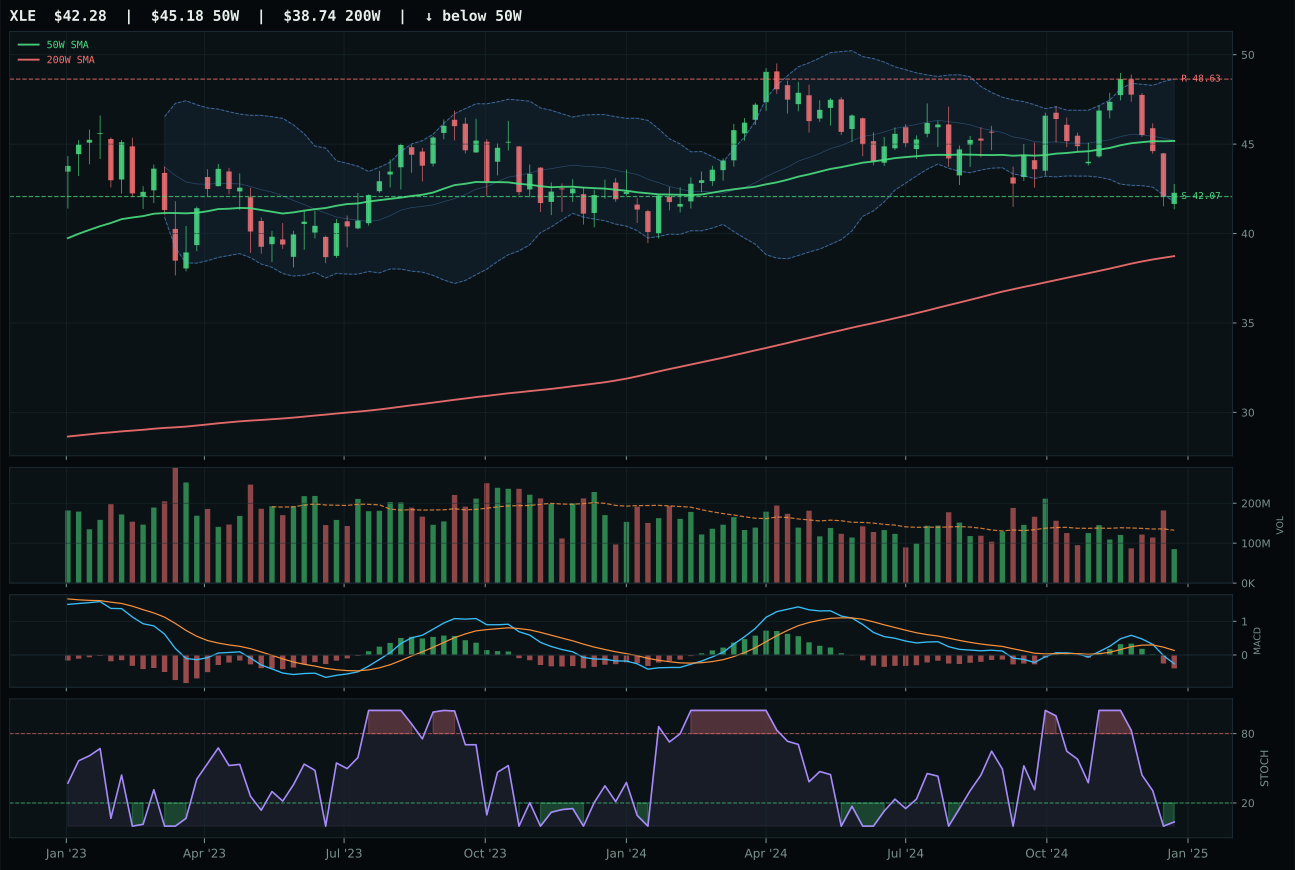
XLE has a pullback into support profile with -7.1% 13-week relative strength versus SPY.
A failed hold above support would weaken the setup.
Actionable but governed by invalidation levels.
XLE wins by elimination in a category with a 0.0 final score; the entire energy complex is broken across XLE, FCG, and XOP due to negative momentum and deteriorating macro conditions. XLE sits 6.3% below the 50W with pullback-into-support structure and stochastic RSI oversold at 0.04, yielding excellent timing (80.0/100) and risk/reward (90.0/100) on paper. However, momentum confirmation is 0.0/100 because the 4-week return is a devastating -11.5% while the 13-week return is -3.0%, meaning price is accelerating downward rather than stabilizing. FCG ranks higher on the reasoned ETF proof order (34.8 vs 11.5) because it shows better relative strength (-3.6% vs -7.1% versus SPY) and neutral volume, but its 36.3/100 technical evidence score still fails to override the category's macro trap. Volume-price confirmation across all three is between 14.2/100 (XLE) and 31/100 (FCG), confirming that any recent price stability is not being accumulated.
Traditional Energy receives 5% allocation despite the category's 0.0 final score and ranks outside true top-tier eligibility. This paradox resolves by recognizing that the allocation system has designated 5% to tier-2 slots (ranks 3 through 8) even when a category fails hard eligibility, and XLE's pullback-into-support structure with 90.0/100 risk/reward is the least broken expression of energy exposure. The macro case is actively negative: disinflation hurts energy (-10 at category level), disinflation pressure is the primary headwind (-10), and credit stress adds another -7. The 16.0/100 category macro fit is poisonous, yet the allocation system preserved a 5% slot on the thesis that energy's extreme compression (support at 42.07 versus resistance at 48.63, 0.5% downside buffer) creates an optionality trade. For this position to expand or move higher in rank, energy prices would need to hold support with at least one week of above-average volume and show evidence of relative strength stabilization. Until then, this is a parking spot rather than a conviction play.
Emerging Markets — INDA
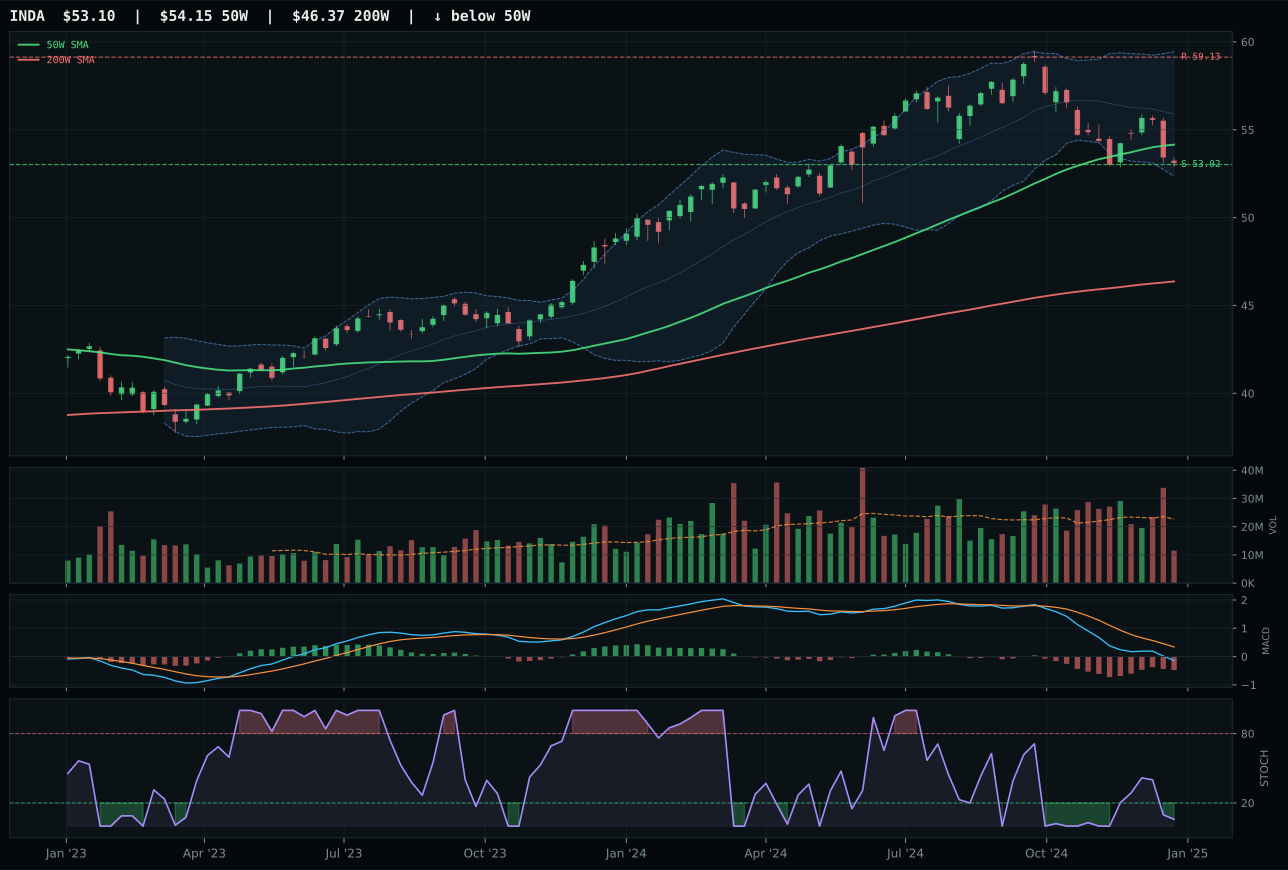
INDA has a pullback into support profile with -14.3% 13-week relative strength versus SPY.
A failed hold above support would weaken the setup.
Actionable but governed by invalidation levels.
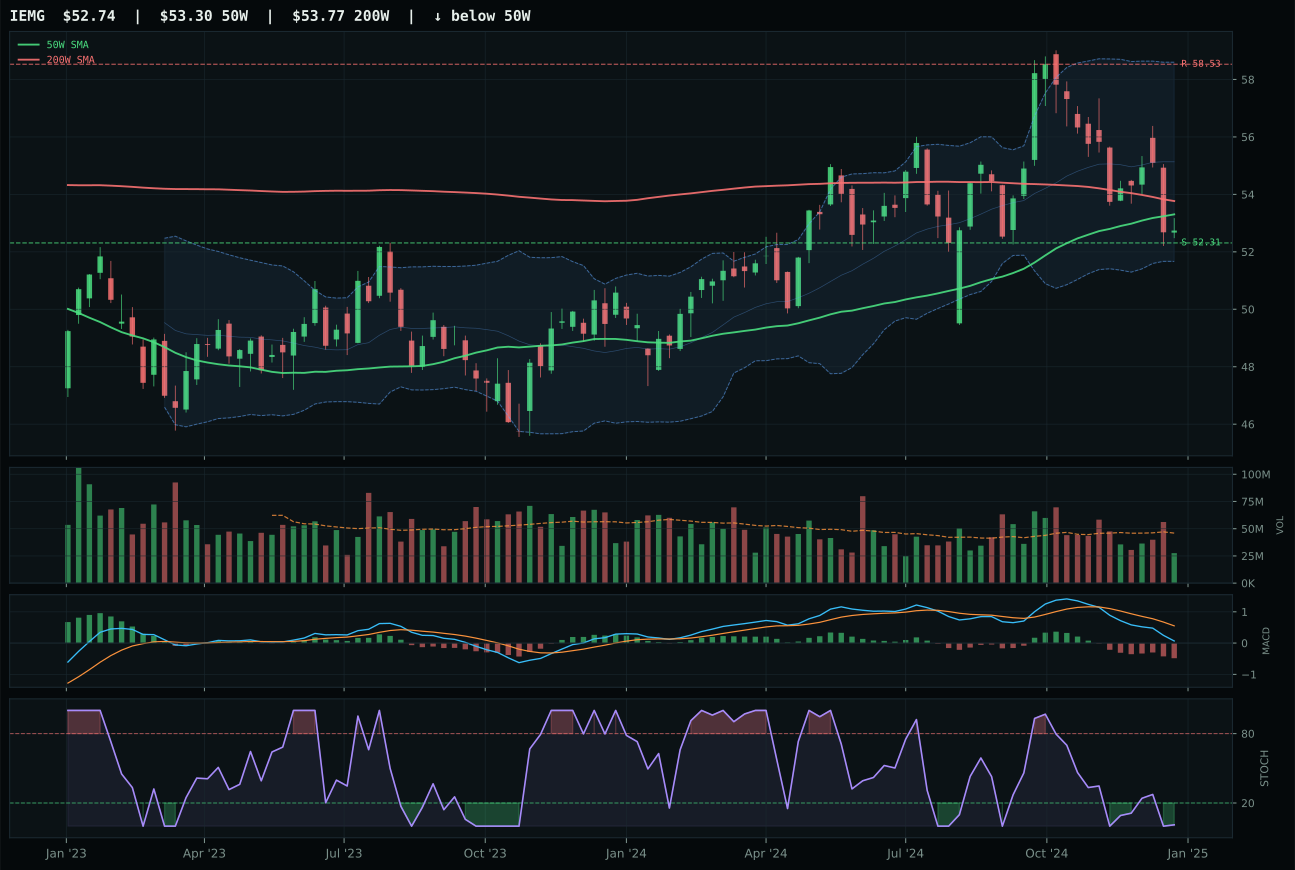
IEMG has a pullback into support profile with -13.5% 13-week relative strength versus SPY.
Extension and support failure are the main tactical risks.
Tracked, but not top-2 eligible because: structurally broken.
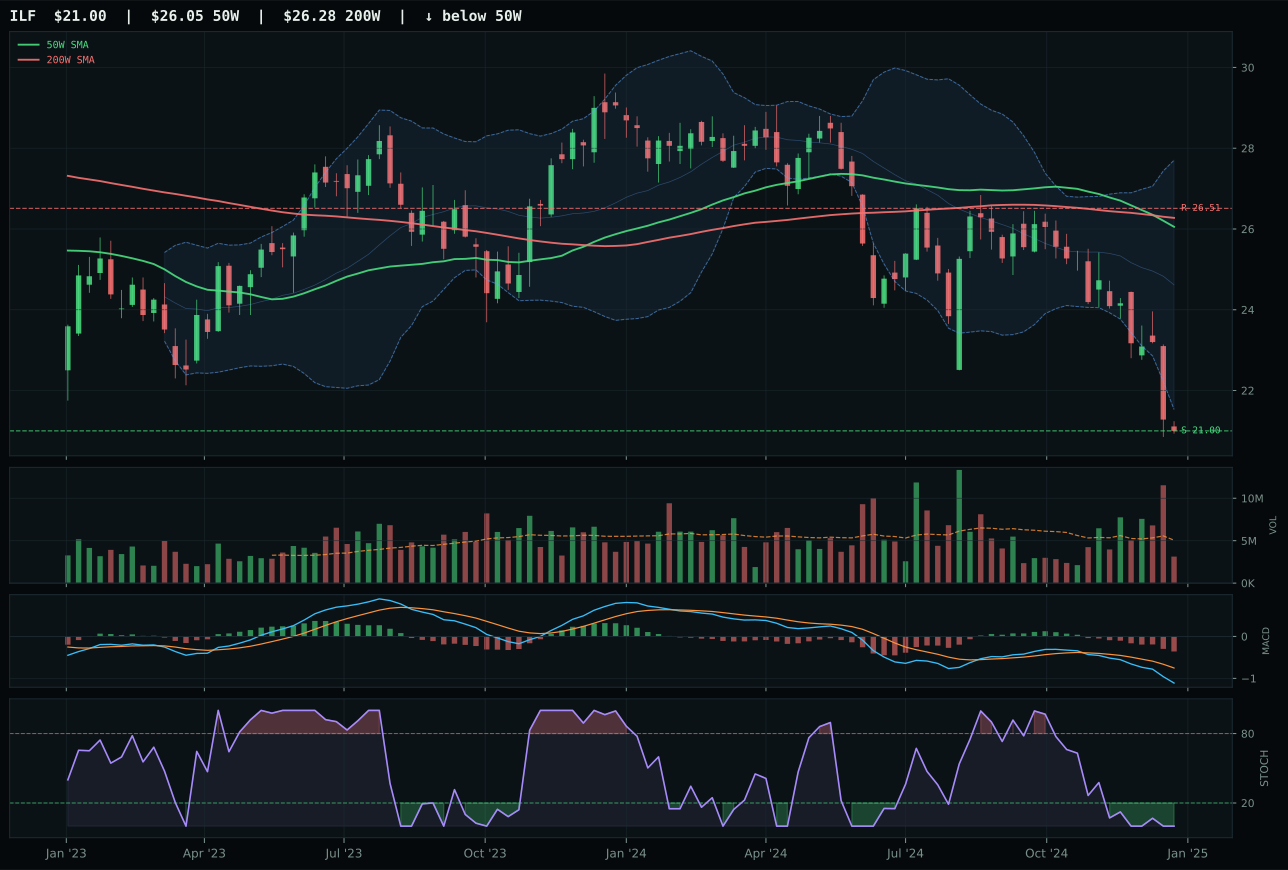
ILF has a pullback into support profile with -23.7% 13-week relative strength versus SPY.
Extension and support failure are the main tactical risks.
Tracked, but not top-2 eligible because: structurally broken.
INDA wins with a 40.5 reasoned score in a category that posts a 0.0 final allocation, but the win margin of 53.0 points over IEMG reveals the scale of technical differentiation at play. INDA sits just 1.9% below the 50W in a pullback-into-support structure with Fibonacci 0.618 at 52.67 as the key inflection level—a setup that yields both the highest timing score (100.0/100) and risk/reward score (98.0/100) in the category. MACD is bearish but improving, a critical distinction over IEMG's bearish/weakening state, and stochastic RSI at 0.06 is oversold without panic-liquidation levels. The -10.2% 13-week return and -14.3% SPY-relative weakness look devastating until weighted against the setup: INDA has already fallen into the accumulation zone and lacks the further deterioration pressure present in IEMG. Support near 53.02 is within 0.2% of current price (98.0/100 risk/reward reflects this extreme edge), which means any rebound is contained and any breakdown triggers stops.
Emerging Markets receives 5% allocation and is excluded from the portfolio despite INDA's technical merit, because the category-level macro fit of 7.0/100 is terminal. Dollar pressure is explicitly negative (-14), credit stress is active (-10), liquidity stress is active (-10), and broad market bear adds another -9. These four headwinds are simultaneous—they represent the core conditions that simultaneously weaken emerging markets structurally (capital flight, carry unwinds, local credit dislocations). Technical evidence on INDA is 49.5/100 (trend 63, timing 100, risk/reward 98, but momentum only 8.0 and volume-price confirmation just 37.5), which means the chart is calling for reversal even as macro says to stay away. The allocation system correctly prioritized macro fit over technical edge: INDA's perfect timing setup could attract early value investors, but those investors would be catching a falling knife in a regime of simultaneous dollar strength, credit stress, and capital reallocation away from EM. For this category to earn a 5% position, at least two of the four negative macro descriptors would need to reverse.
Agriculture & Livestock — WEAT
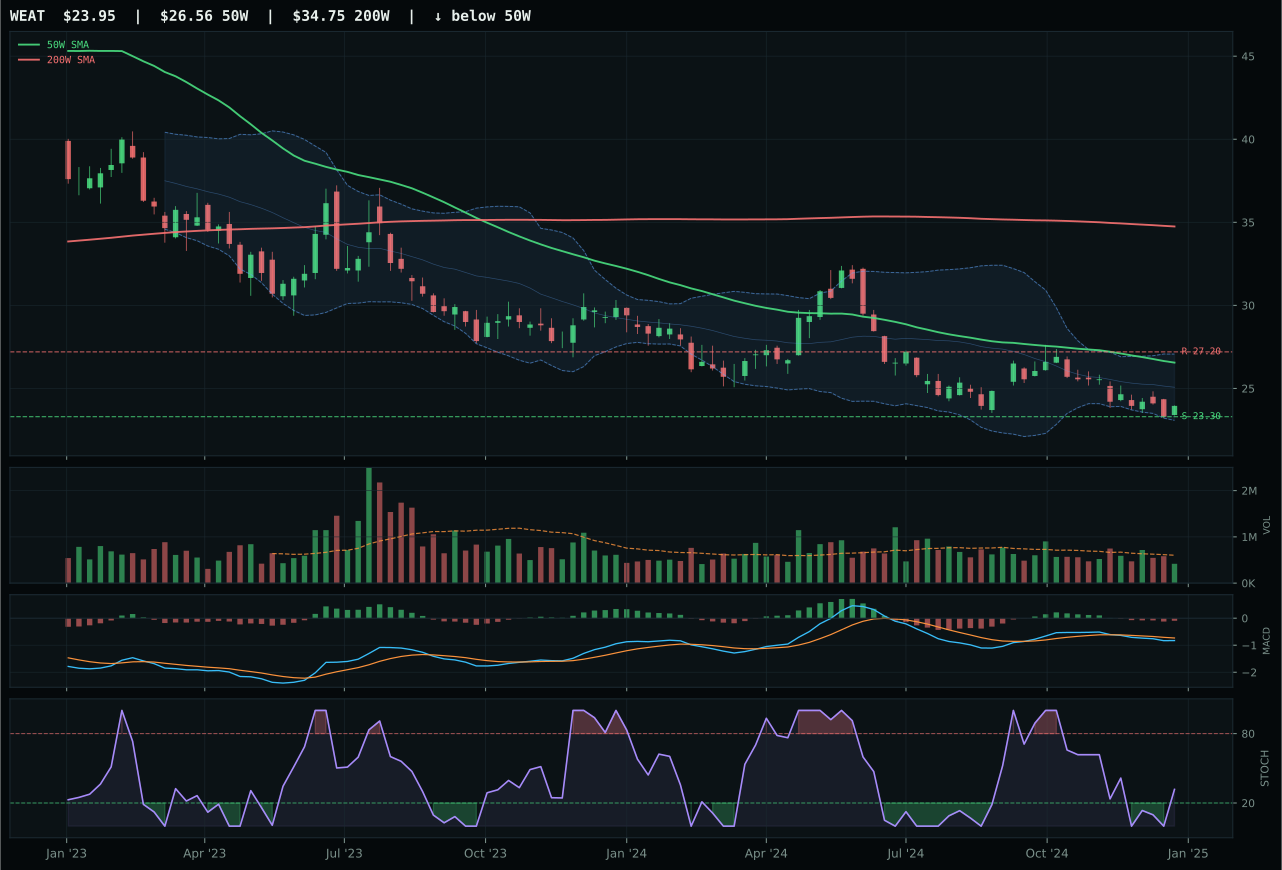
WEAT has a pullback into support profile with -12.2% 13-week relative strength versus SPY.
Extension and support failure are the main tactical risks.
Tracked, but not top-2 eligible because: structurally broken.
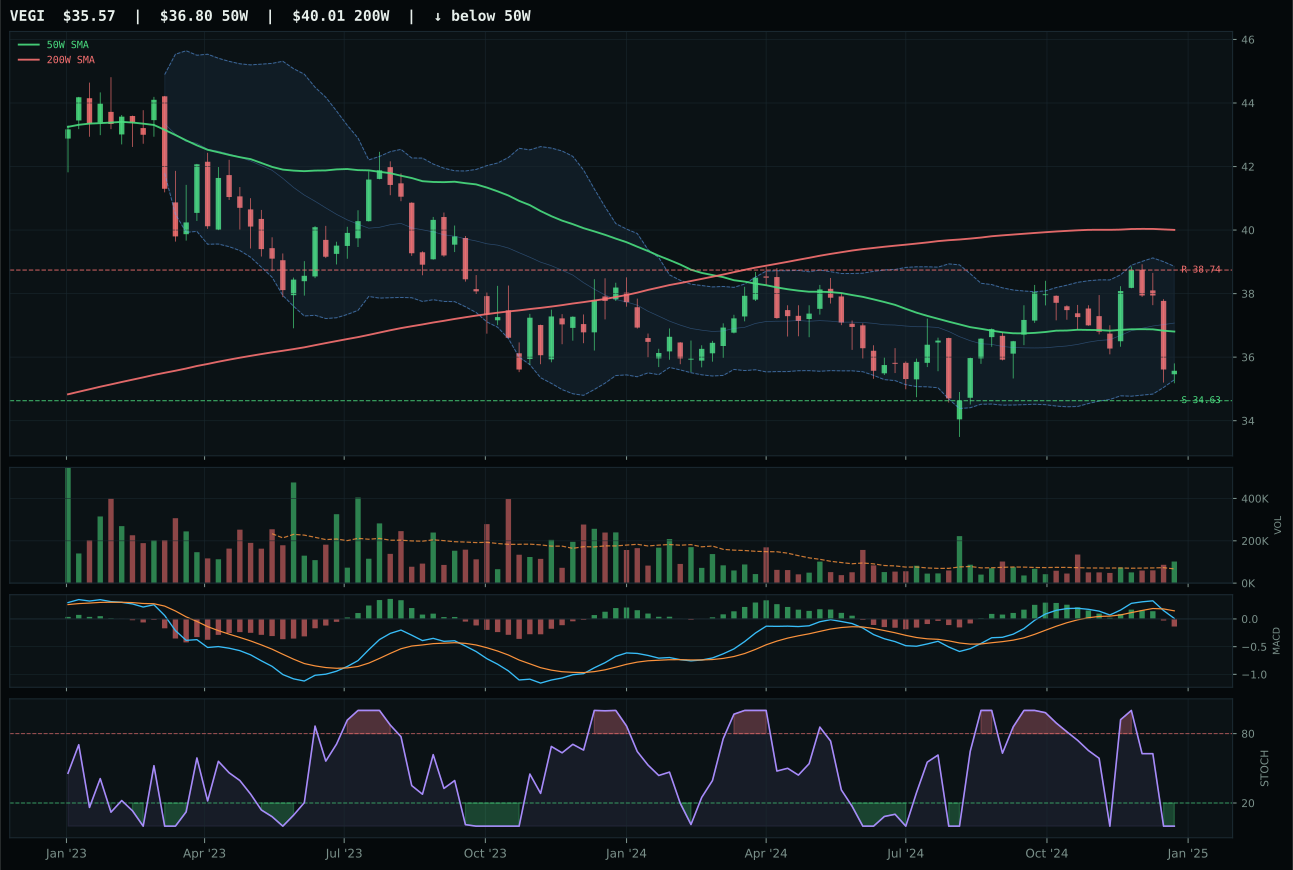
VEGI has a pullback into support profile with -10.6% 13-week relative strength versus SPY.
Extension and support failure are the main tactical risks.
Tracked, but not top-2 eligible because: structurally broken.
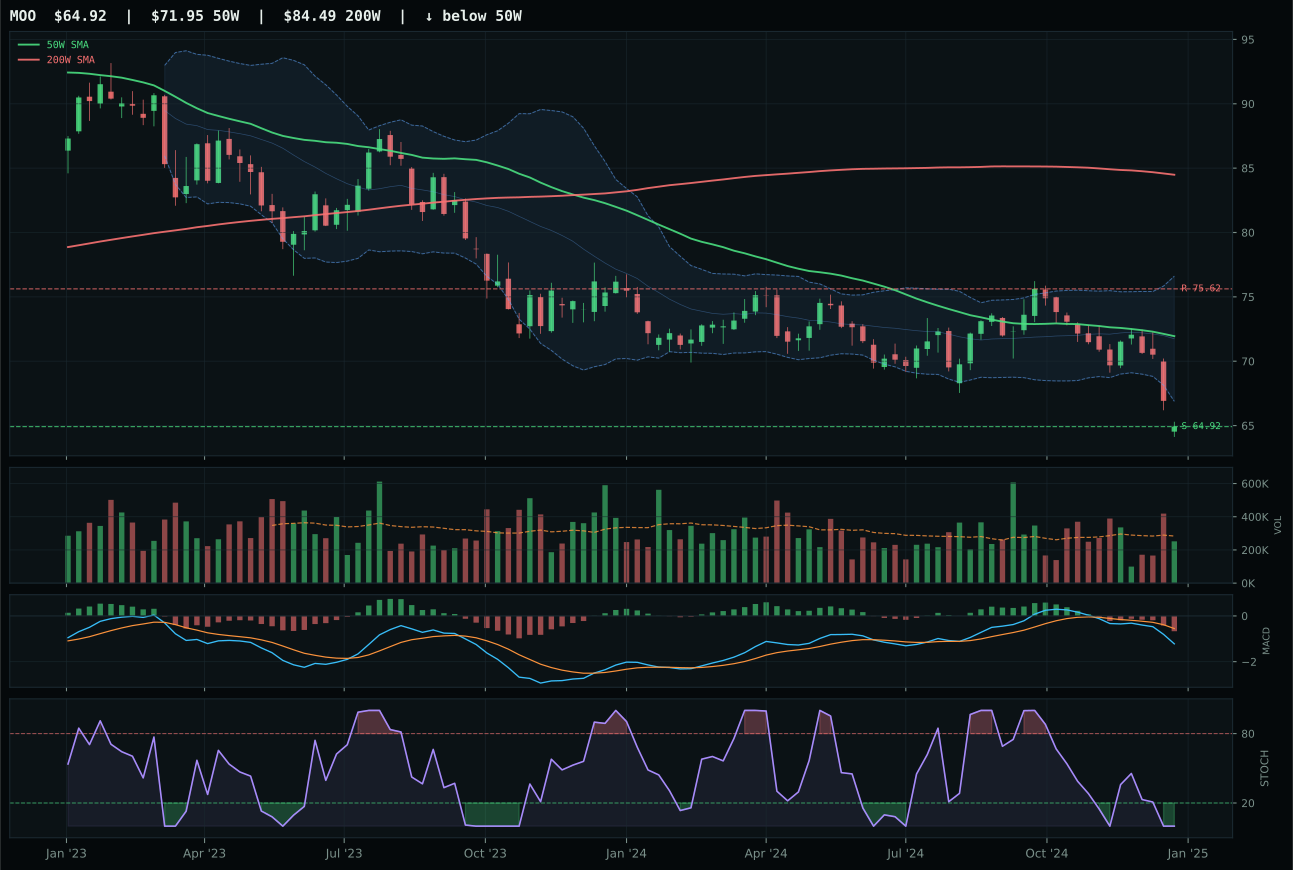
MOO has a pullback into support profile with -18.3% 13-week relative strength versus SPY.
Extension and support failure are the main tactical risks.
Tracked, but not top-2 eligible because: structurally broken.
WEAT wins a structurally broken category with a 0.0 final score and earns no allocation because the entire three-ETF basket—WEAT, MOO, and VEGI—has failed hard eligibility filters. WEAT itself is the marginal best option only because its timing score of 88.0/100 and risk/reward score of 90.0/100 reflect the fact that it has already collapsed: price is 9.8% below the 50W, MACD is bearish/weakening, and stochastic RSI sits at 0.32. This looks attractive on risk/reward metrics only because there is almost nowhere left to fall relative to upside potential, but that is a value trap in a sector facing -12.2% SPY-relative weakness. Momentum confirmation scores a devastating 3.0/100 (4-week return 0.0%, 13-week return -8.1%) and volume-price confirmation is just 17.2/100, confirming that whatever selling pressure created this dislocation is still present. VEGI's 0.0 composite technical score disqualifies it entirely, made worse by distribution pressure volume and oversold stochastic RSI that suggests capitulation is still incomplete.
Agriculture & Livestock earns 0% allocation this week and ranks outside the portfolio entirely; the category failed eligibility filters after testing below threshold on technical evidence and macro alignment. Disinflation actively hurts commodity agriculture (-6 at category level, -8 specifically on disinflation pressure), and liquidity stress is also negative (-4). The 32.0/100 category macro fit is insufficient to override the technical collapse: a -12.2% SPY-relative drawdown in WEAT paired with bearish/weakening MACD and 3.0/100 momentum confirmation means the category is in structural liquidation mode, not consolidation. For this sector to re-enter the allocation, WEAT would need to hold support near 23.30 and produce at least one week of volume-price confirmation (current 17.2/100 is critical failure) combined with stabilization in relative strength against SPY. Until then, capital that might otherwise flow here should sit in defensive or monetized buckets like precious metals and utilities.
Industrial Metals — COPX
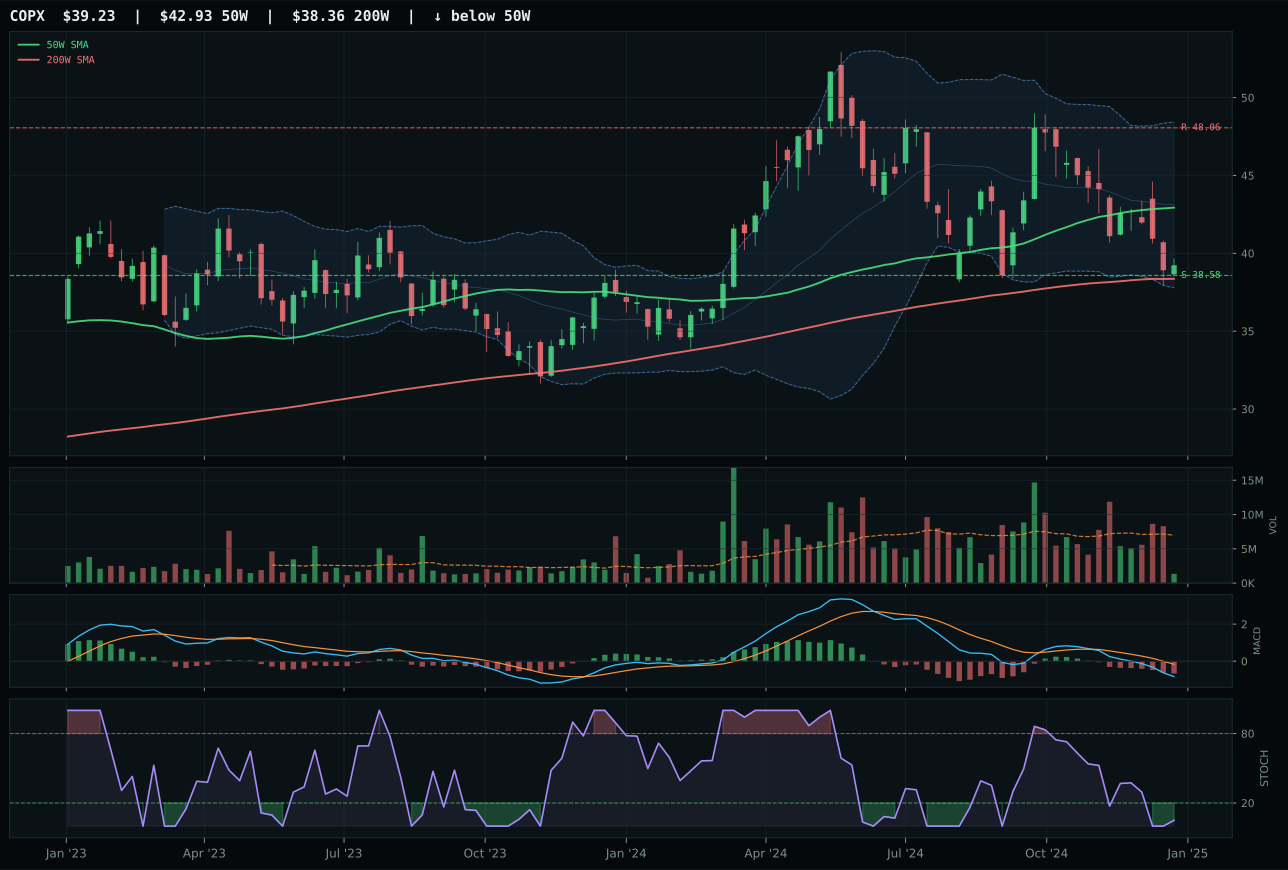
COPX has a pullback into support profile with -22.5% 13-week relative strength versus SPY.
A failed hold above support would weaken the setup.
Actionable but governed by invalidation levels.
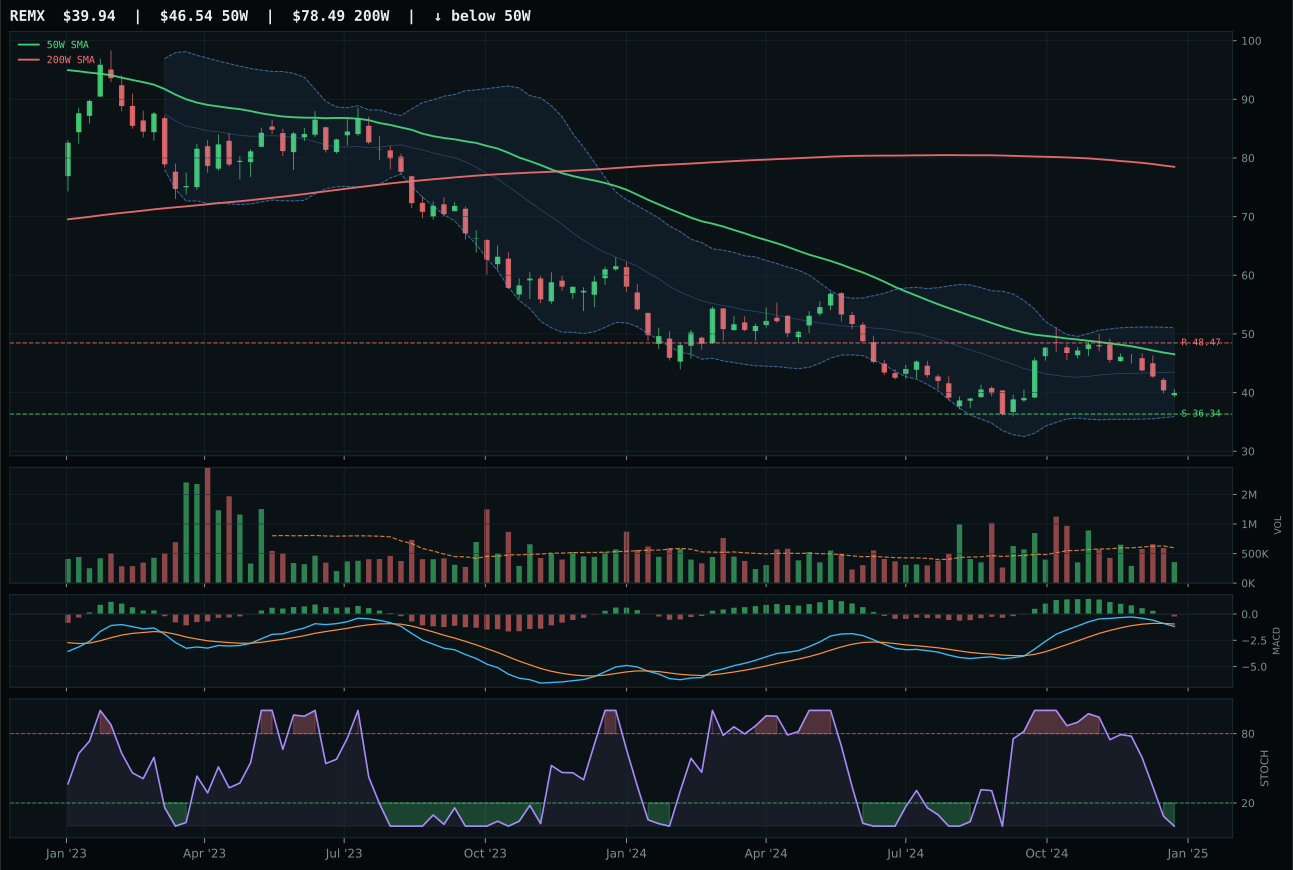
REMX has a neutral structure profile with -16.3% 13-week relative strength versus SPY.
Extension and support failure are the main tactical risks.
Tracked, but not top-2 eligible because: structurally broken.
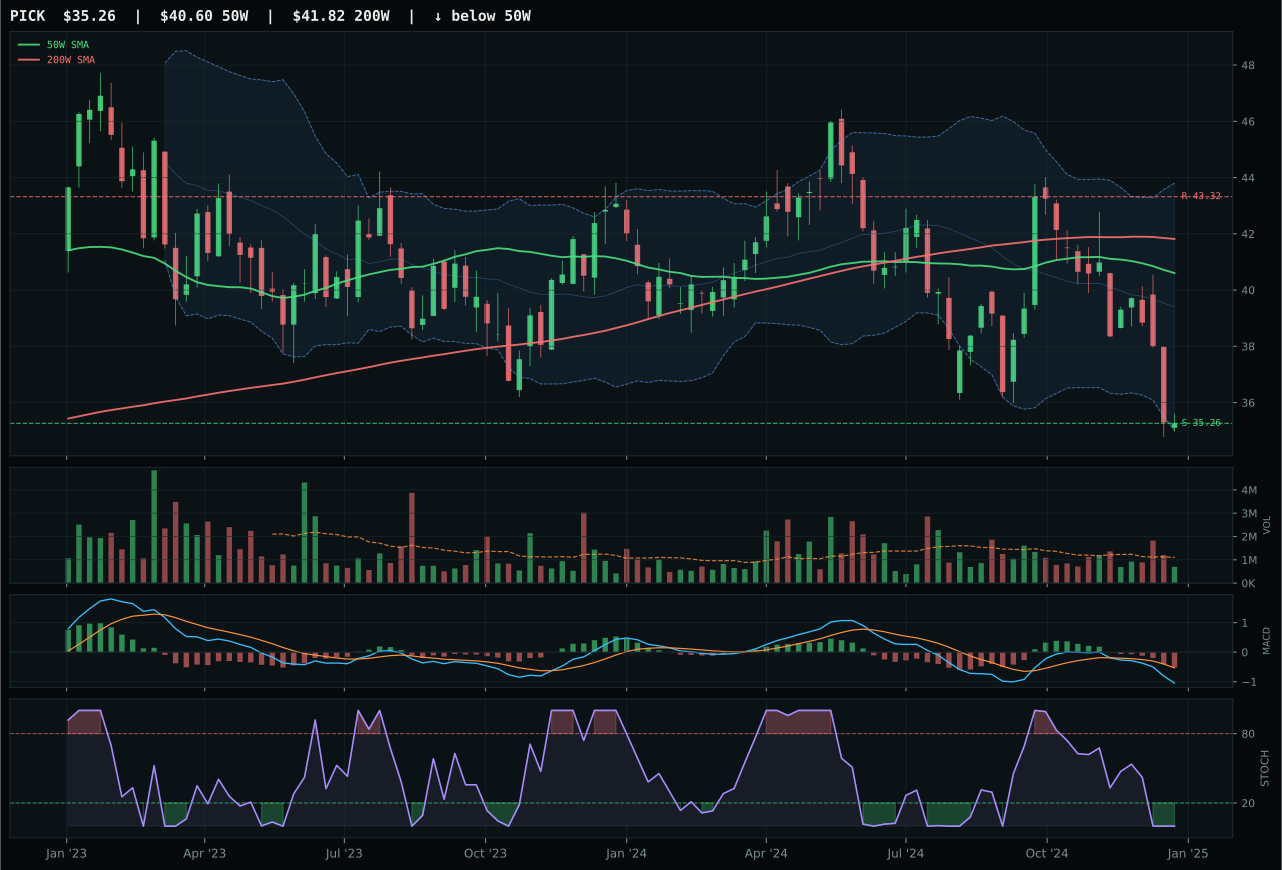
PICK has a pullback into support profile with -22.7% 13-week relative strength versus SPY.
Extension and support failure are the main tactical risks.
Tracked, but not top-2 eligible because: structurally broken.
COPX wins the category with a 25.9 reasoned ETF score but emerges into a 0.0 final portfolio allocation because the category-level eligibility filter rejected the entire three-ETF basket after stress testing. COPX itself shows the classic broken-chart signature: price is 8.6% below the 50W (still above the 200W), MACD is bearish/weakening, and stochastic RSI has cratered to 0.05—deeply oversold. The setup would normally be compelling on timing (87.0/100) and risk/reward (90.0/100, with 1.7% downside to support vs 18.4% upside to resistance), but momentum confirmation scores a devastating 0.0/100 because there is zero sponsorship. The 13-week return of -18.4% and SPY-relative weakness of -22.5% confirm this is not mean-reversion setup—this is structural underperformance in a dollar-strong, credit-stressed environment. REMX and PICK both score 0.0 on composite technical evidence due to hard eligibility failures, confirming that copper supply-chain plays are simply not functioning.
Industrial Metals receives 0% allocation and is excluded from the portfolio entirely; the category failed eligibility gates despite COPX's marginal technical merit. Macro fit of 28.0/100 reflects negative pressure from liquidity stress (-8), credit stress (-7), and dollar pressure (-7)—all actively headwinds in the current regime. Copper and rare earths are cyclical, capex-dependent inputs whose demand is correlated to credit expansion and growth expectations, neither of which are present. The technical evidence score of 23.3/100 on COPX combines some timing appeal (87.0/100, distance to support is minimal) with complete momentum failure (0.0/100, no volume-price confirmation). The gap to the next-ranked category is insurmountable: Utilities & Infrastructure at 45.1/100 is 45.1 points higher. To re-enter the allocation, industrial metals would need to show evidence of at least one week of above-average volume confirmation on a hold of the 50W, plus stabilization in the SPY-relative strength metric that is currently near -20%.