
2024-12-20
Informational purposes only. The content in this report, including allocations, analysis, and commentary, is provided solely for informational and educational purposes. It does not constitute financial advice, investment advice, trading advice, or any other type of advice. Past performance does not guarantee future results. Always conduct your own research and consult a qualified financial professional before making investment decisions.
Weekly Allocation
| Ticker | Category | Weight | Role |
|---|---|---|---|
| FBTC | 50% | Overlay | |
| XLK | Technology | 10% | Top-2 (10%) |
| SLV | Precious Metals | 10% | Top-2 (10%) |
| XAR | Defense & Aerospace | 5% | Tier-2 (5%) |
| XLU | Utilities & Infrastructure | 5% | Tier-2 (5%) |
| INDA | Emerging Markets | 5% | Tier-2 (5%) |
| AIQ | AI | 5% | Tier-2 (5%) |
| COPX | Industrial Metals | 5% | Tier-2 (5%) |
| MOO | Agriculture & Livestock | 5% | Tier-2 (5%) |
Trade Instructions — Monday Open
Sell the tranche from 2024-11-22 (completing its 4-week hold). Buy the new tranche. Instructions show net portfolio changes — same-asset positions cancel, weight changes show the delta.
| Action | Ticker | Instruction |
|---|---|---|
| SELL | URA | Sell 50% of URA position (reduce 5.00% → 2.50%) |
| SELL | XAR | Sell 20% of XAR position (reduce 6.25% → 5.00%) |
| SELL | PAVE | Sell 33% of PAVE position (reduce 3.75% → 2.50%) |
| SELL | XLE | Sell 33% of XLE position (reduce 3.75% → 2.50%) |
| SELL | IGV | Sell 25% of IGV position (reduce 5.00% → 3.75%) |
| SELL | GLD | Sell 25% of GLD position (reduce 5.00% → 3.75%) |
| SELL | BOTZ | Sell entire BOTZ position (1.25% of portfolio) |
| BUY | AIQ | Buy AIQ — 12.50% of freed cash (adds 1.25% to portfolio) |
| BUY | MOO | Buy MOO — 12.50% of freed cash (adds 1.25% to portfolio) |
| BUY | XLK | Buy XLK — 25.00% of freed cash (adds 2.50% to portfolio) |
| BUY | SLV | Buy SLV — 25.00% of freed cash (adds 2.50% to portfolio) |
| BUY | XLU | Buy XLU — 12.50% of freed cash (adds 1.25% to portfolio) |
| BUY | INDA | Buy INDA — 12.50% of freed cash (adds 1.25% to portfolio) |
Current Portfolio After Trade
Combined holdings across all 4 active tranches. Each tranche is 25% of the portfolio.
| Ticker | % of Portfolio | Weight Bar |
|---|---|---|
| FBTC | 50.00% | |
| XAR | 5.00% | |
| COPX | 5.00% | |
| AIQ | 5.00% | |
| IGV | 3.75% | |
| GLD | 3.75% | |
| PAVE | 2.50% | |
| XLE | 2.50% | |
| URA | 2.50% | |
| URNM | 2.50% | |
| IGF | 2.50% | |
| CIBR | 2.50% | |
| NLR | 2.50% | |
| MOO | 2.50% | |
| XLK | 2.50% | |
| SLV | 2.50% | |
| XLU | 1.25% | |
| INDA | 1.25% |
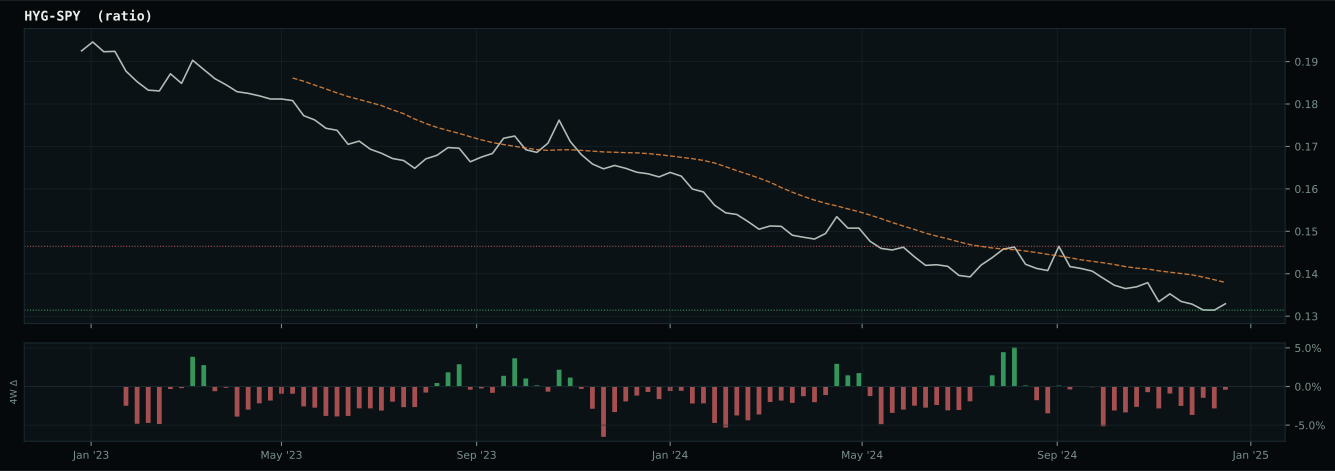
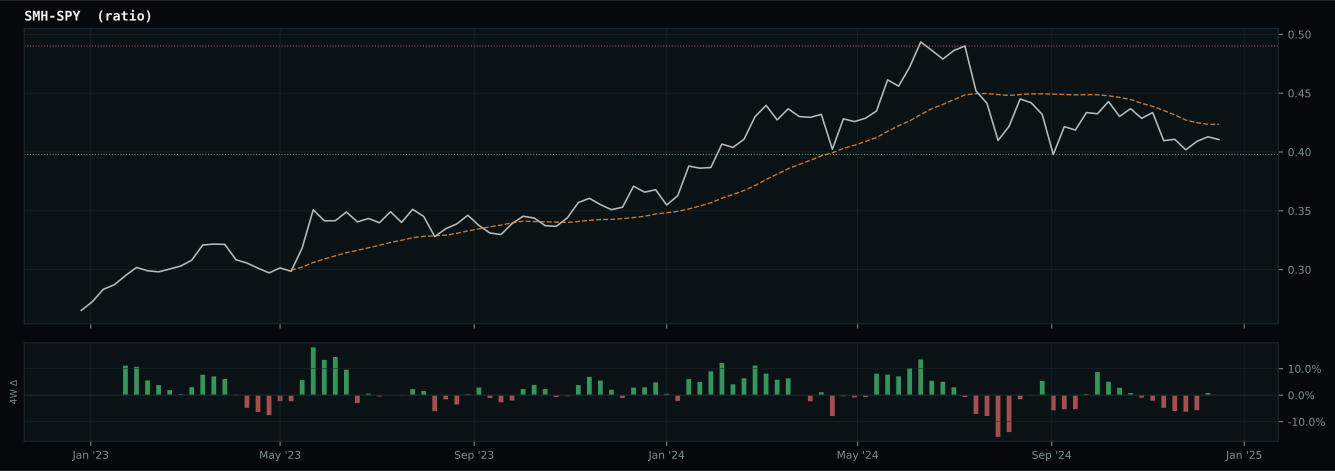
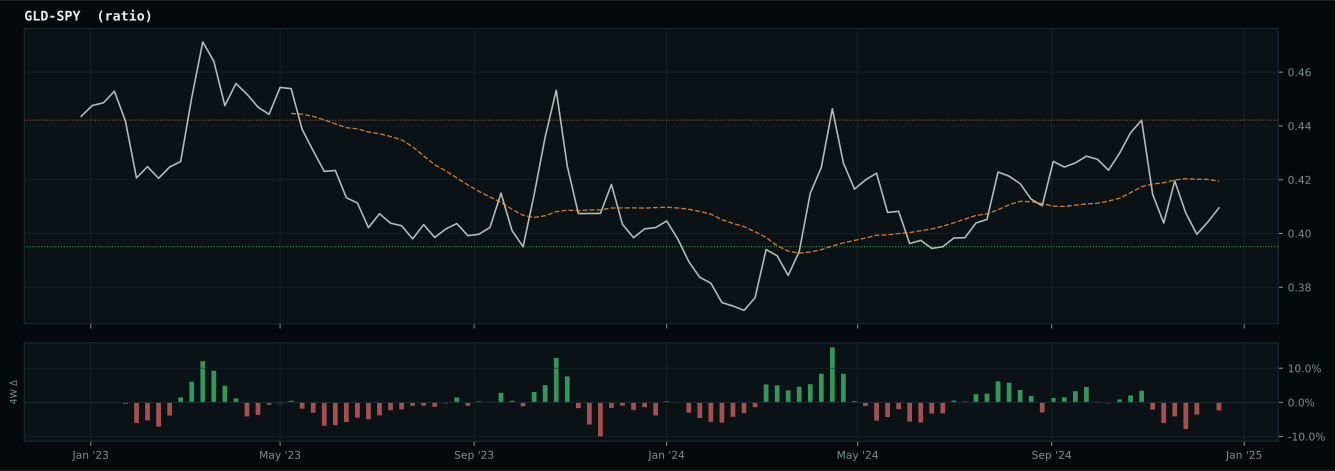
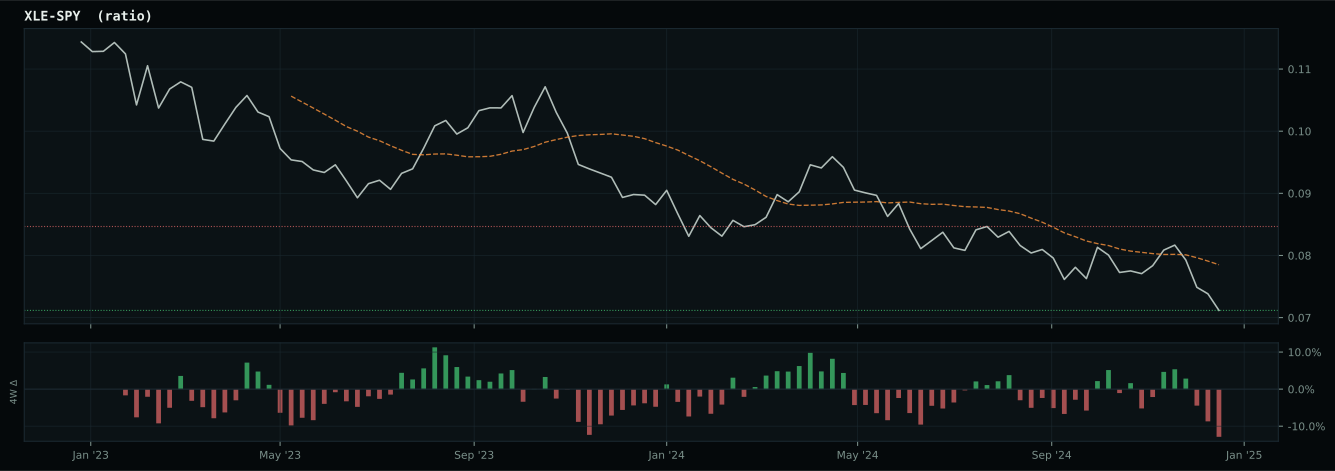
Macro Regime — Disinflation
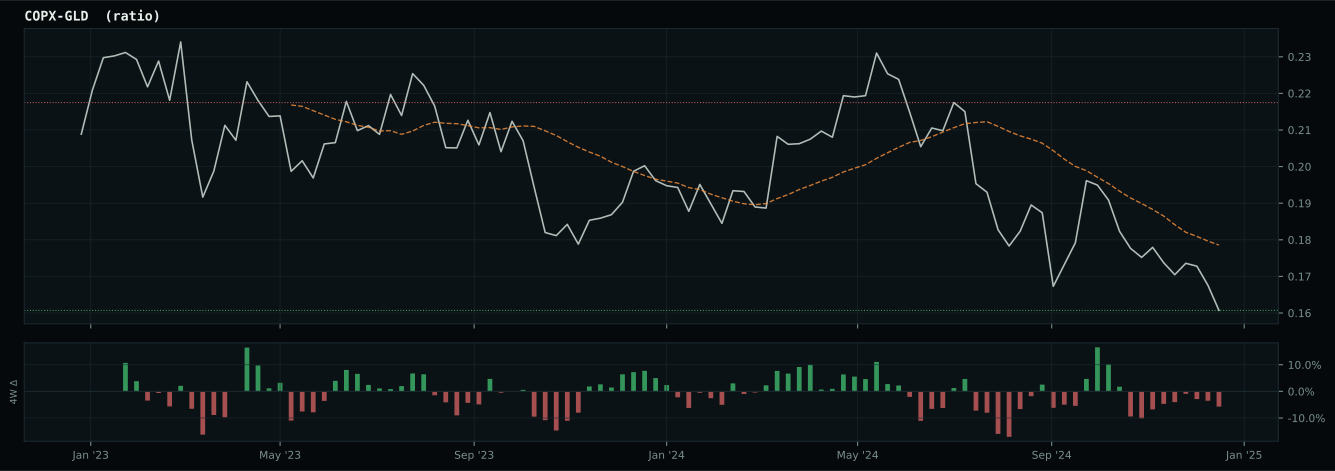
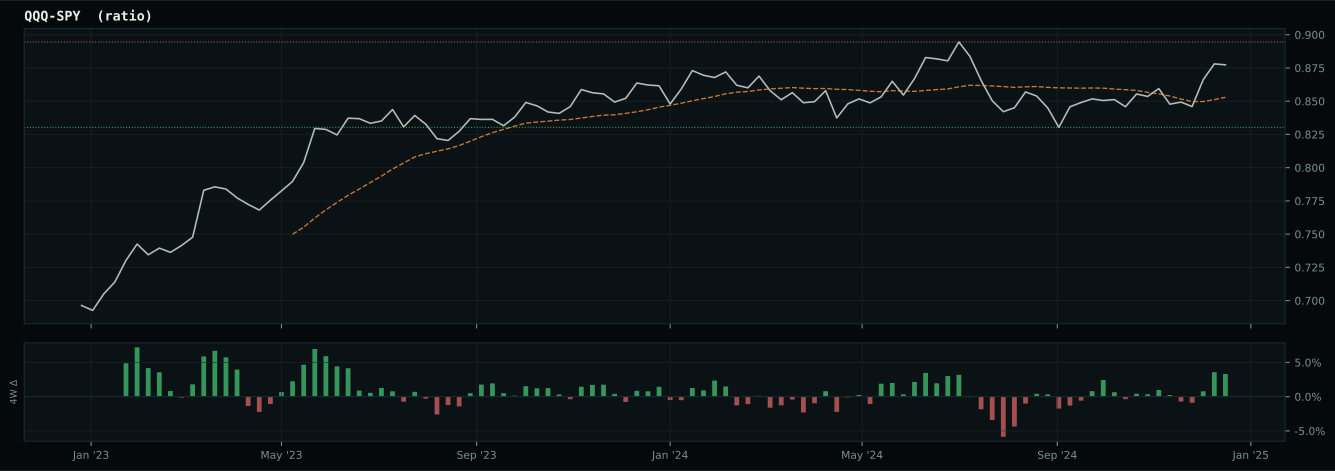
Macro Evidence Charts
Market-implied signals behind the macro regime scores. Each ratio compares two assets; the direction and slope of the ratio is what the macro engine reads.
Crypto Regime — TrendBTC
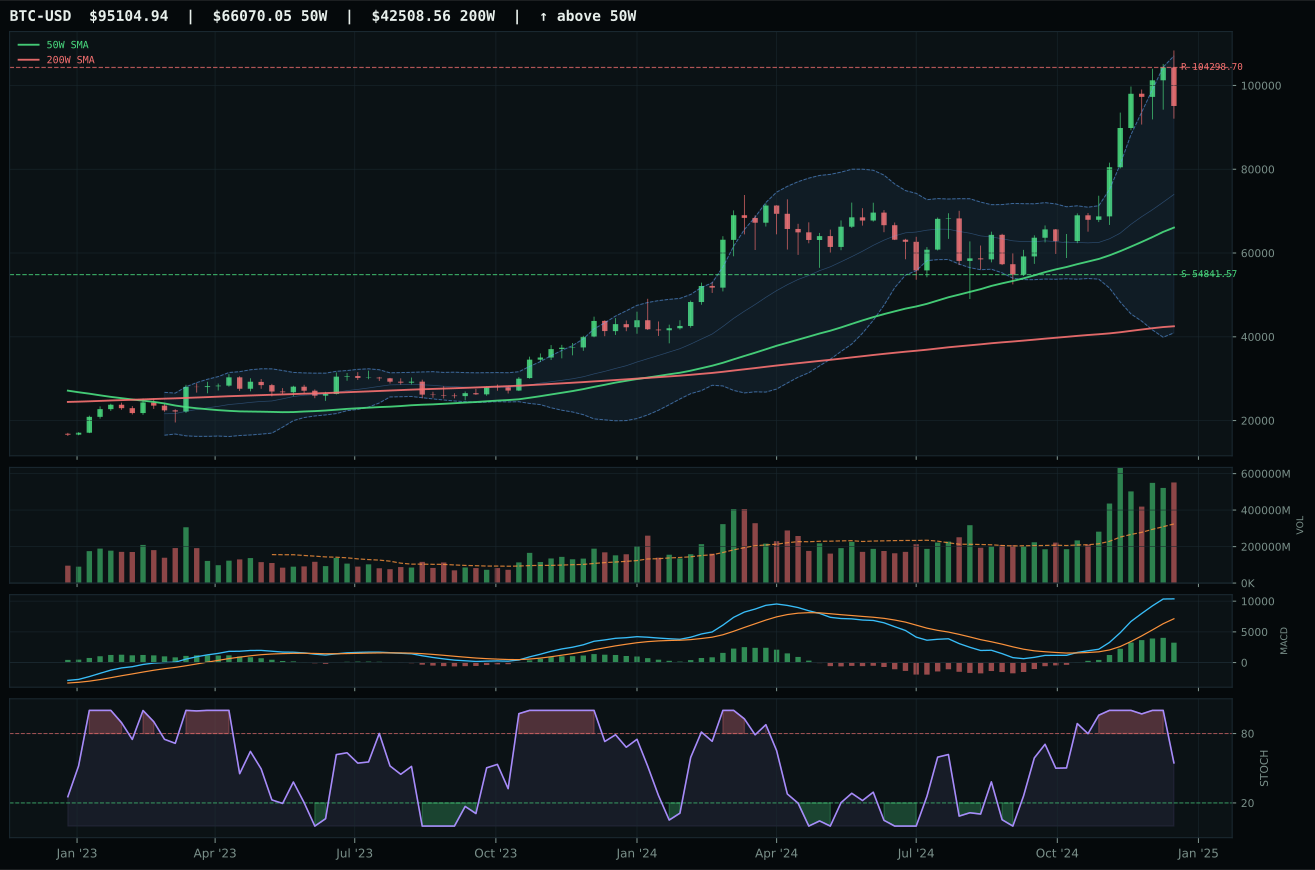
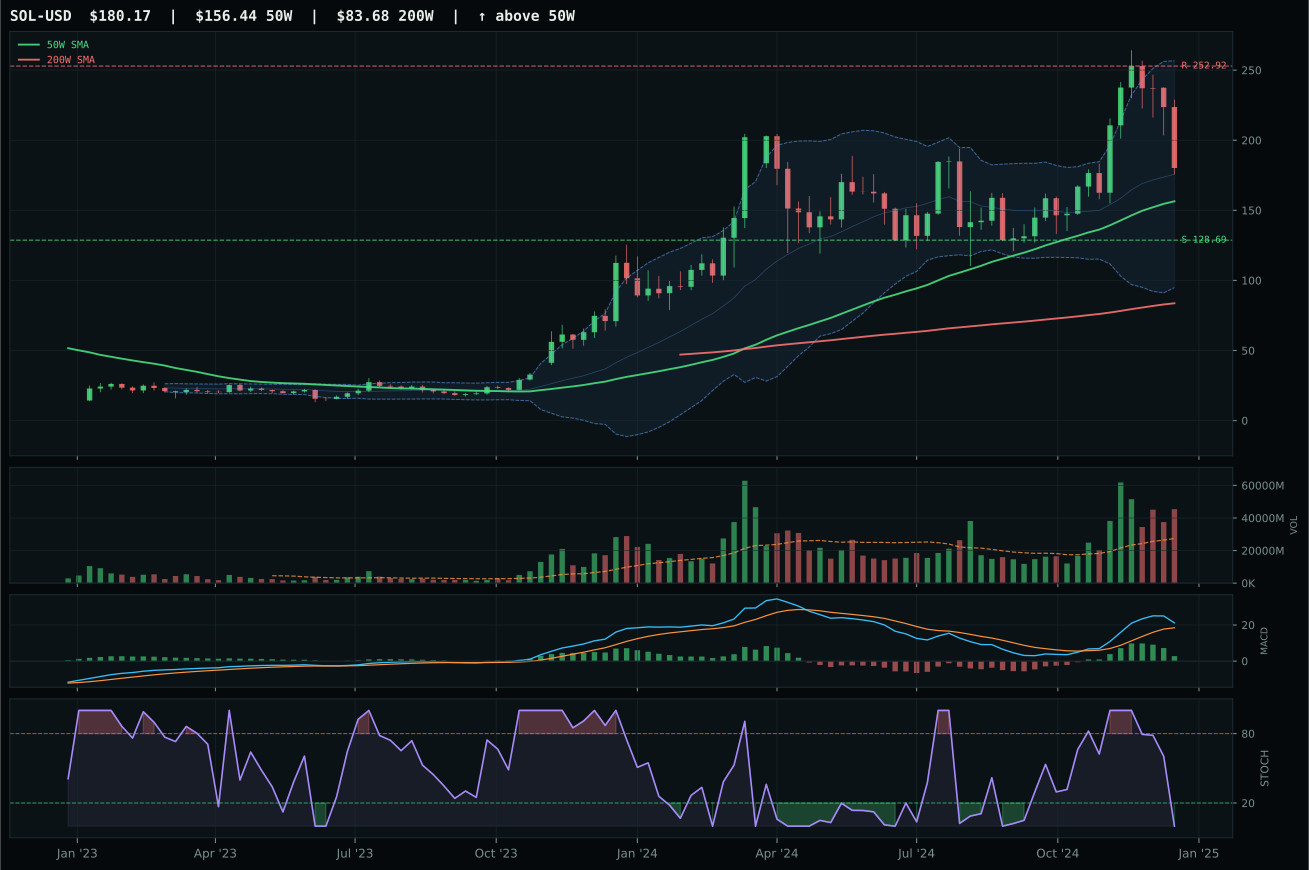
ValueBTC not armed: BTC has not made the first post-breakdown touch of the 200W buy zone after losing the 50W
TrendBTC confirmed: 2 consecutive closes above rising/flat 50W SMA
one or more available conditions failed
Category Rankings
| Rank | Category | Winner | Score | Alloc | 4W Ret | Peers (4W) |
|---|---|---|---|---|---|---|
| 1 | Technology | XLK | 54.4 | 20% | -0.58% | CIBR +2.0% · IGV -1.8% |
| 2 | Precious Metals | SLV | 48.6 | 20% | +3.75% | GLD +4.3% · GDX +8.4% |
| 3 | Defense & Aerospace | XAR | 44.4 | 10% | +5.62% | ROKT +5.9% · ITA +4.8% |
| 4 | Utilities & Infrastructure | XLU | 43.0 | 10% | +5.45% | PAVE +5.8% · IGF +4.9% |
| 5 | AI | AIQ | 28.2 | 10% | +1.63% | BOTZ +4.0% · SMH +7.1% |
| 6 | Nuclear Energy | NLR | 21.1 | 10% | +7.67% | URA +1.1% · URNM +4.2% |
| 7 | Agriculture & Livestock | MOO | — | 10% | +5.19% | WEAT +3.0% · VEGI +5.7% |
| 8 | Industrial Metals | COPX | — | 10% | +4.94% | REMX +9.1% · PICK +4.3% |
| 9 | Traditional Energy | XLE | — | 0% | +12.50% | FCG +15.5% · XOP +14.8% |
| 10 | Emerging Markets | INDA | — | 0% | -4.71% | IEMG +0.3% · ILF +3.2% |
Technology — XLK
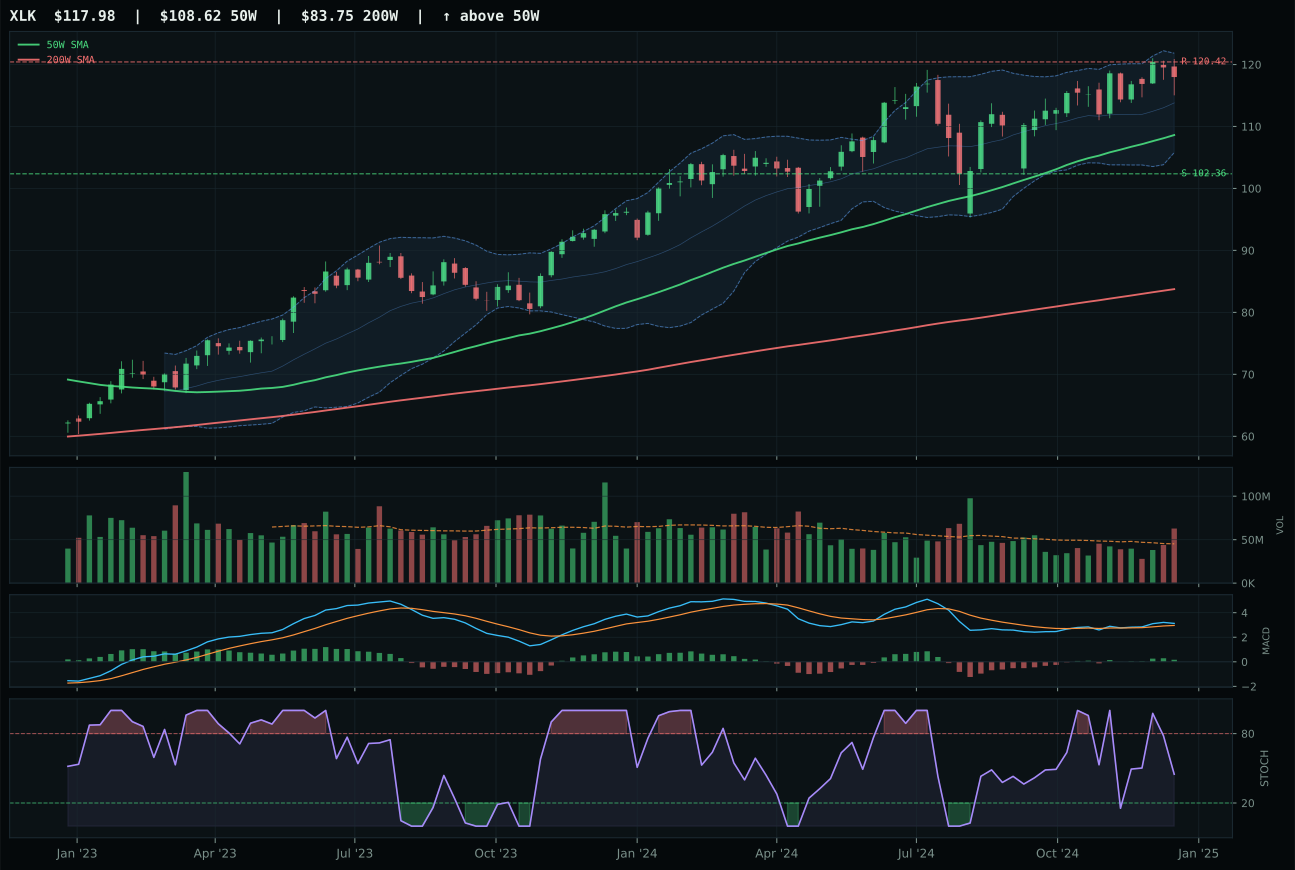
XLK has a neutral structure profile with 2.0% 13-week relative strength versus SPY.
A failed hold above support would weaken the setup.
Actionable but governed by invalidation levels.
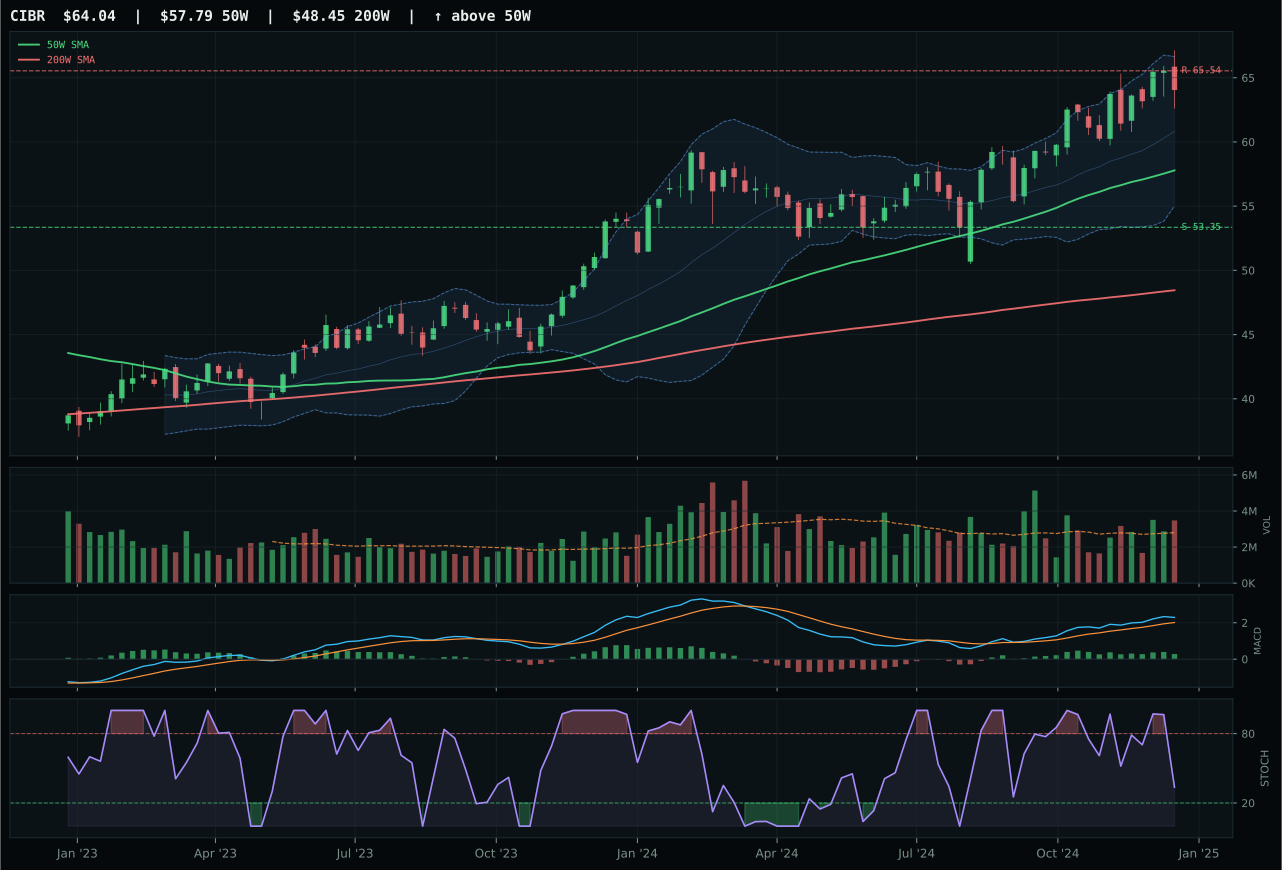
CIBR has a neutral structure profile with 4.0% 13-week relative strength versus SPY.
A failed hold above support would weaken the setup.
Actionable but governed by invalidation levels.
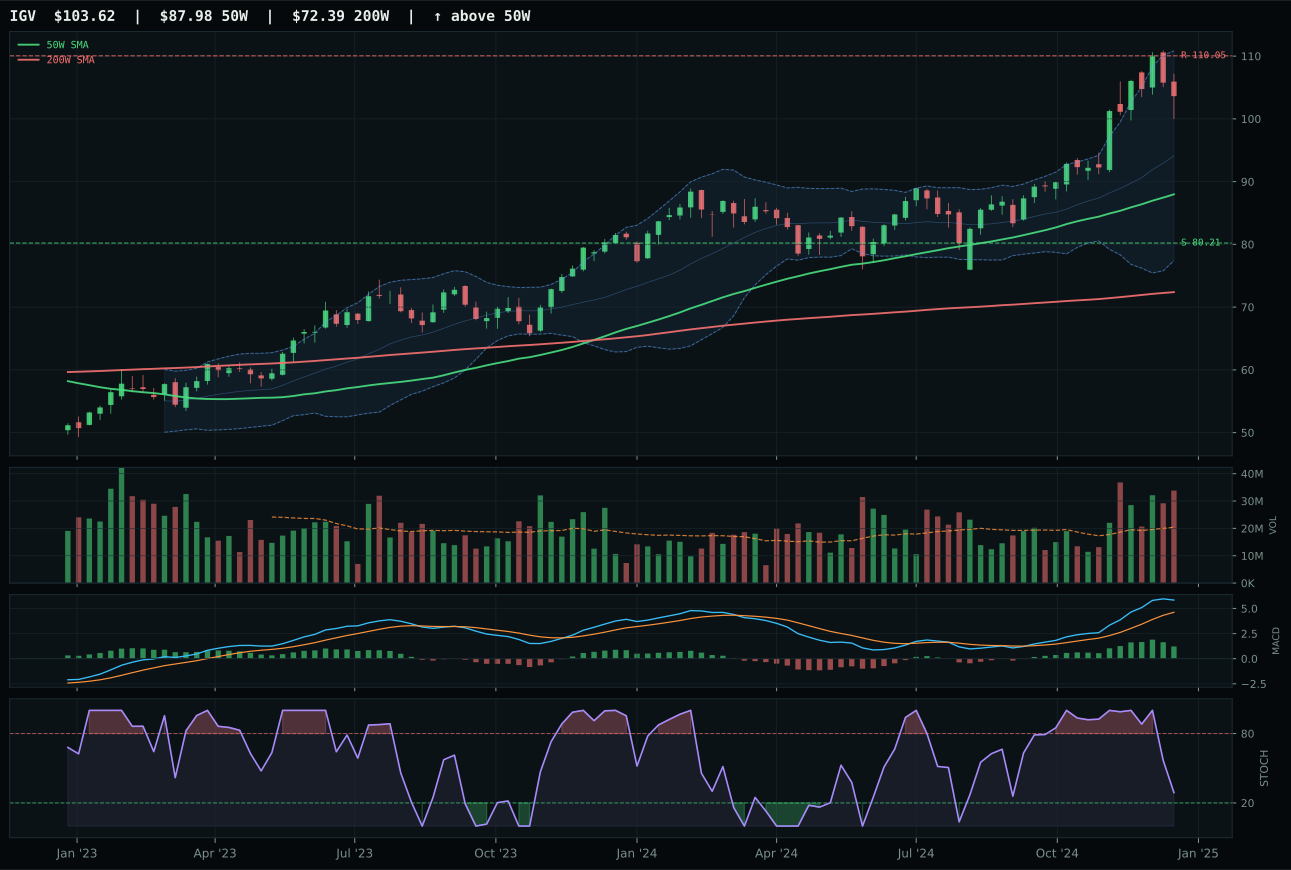
IGV has a vertical extension profile with 12.1% 13-week relative strength versus SPY.
A failed hold above support would weaken the setup.
Actionable but governed by invalidation levels.
XLK claimed the category by narrowly outpacing CIBR on the technical merit of a sharper MACD trajectory and superior timing discipline. With price sitting just 8.8% above the 50-week moving average and MACD bullish and improving, XLK offers a setup where every fresh dollar is buying into a genuine consolidation rather than chasing extended strength—a critical distinction in a disinflation regime where liquidity stress and credit concerns are active headwinds. CIBR's flattening MACD and weaker timing score (70 vs. 75) revealed the subtle technical deterioration that separates a workable setup from a leading one. Volume participation at 1.39x the 20-week average provides the sponsorship confirmation needed to validate trend confidence, and the 2.0% outperformance versus SPY sits just enough above the median category relative strength to justify holding broad profitable technology exposure without overextending into stretched valuations.
Technology earned 10% despite scoring 54.4 and placing second overall because the category's macro fit of 40.0/100 remains structurally challenged by active liquidity stress (minus 10), credit stress (minus 7), and dollar pressure (minus 5), even as disinflation provides modest support. Liquidity and credit conditions are actively working against technology exposure in the current regime, and while XLK's technical setup is clean, the 62-38 weighting of technical evidence versus macro/narrative fit ensures that macro headwinds cap the allocation. Two higher-ranked categories (likely Precious Metals and another strong technical setup) took the 20% slots, leaving technology with a hold position rather than an overweight. The setup would need either a meaningful improvement in credit conditions or confirmation of sustained institutional accumulation across the three-ETF basket to justify elevation to top-2 consideration.
Precious Metals — SLV
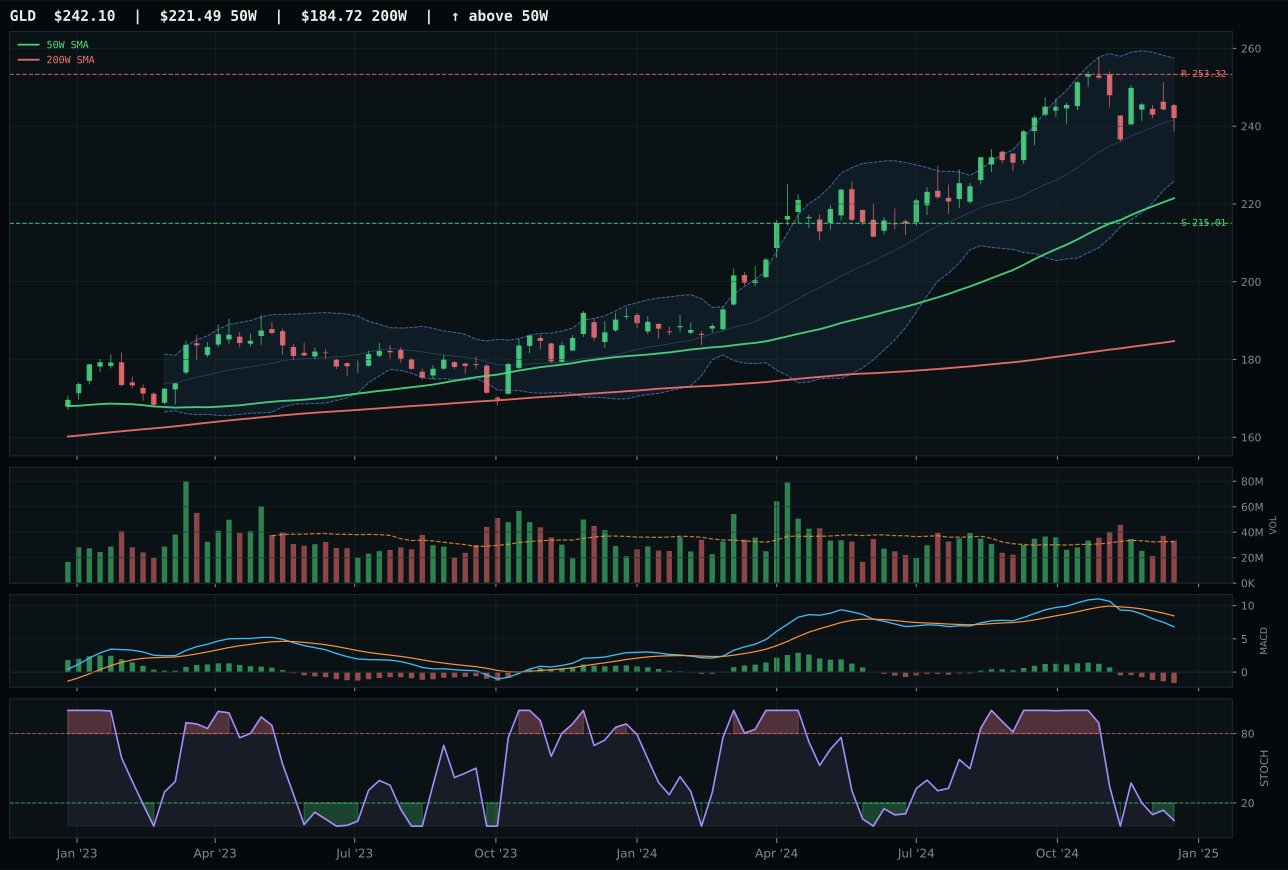
GLD has a neutral structure profile with -4.1% 13-week relative strength versus SPY.
A failed hold above support would weaken the setup.
Actionable but governed by invalidation levels.
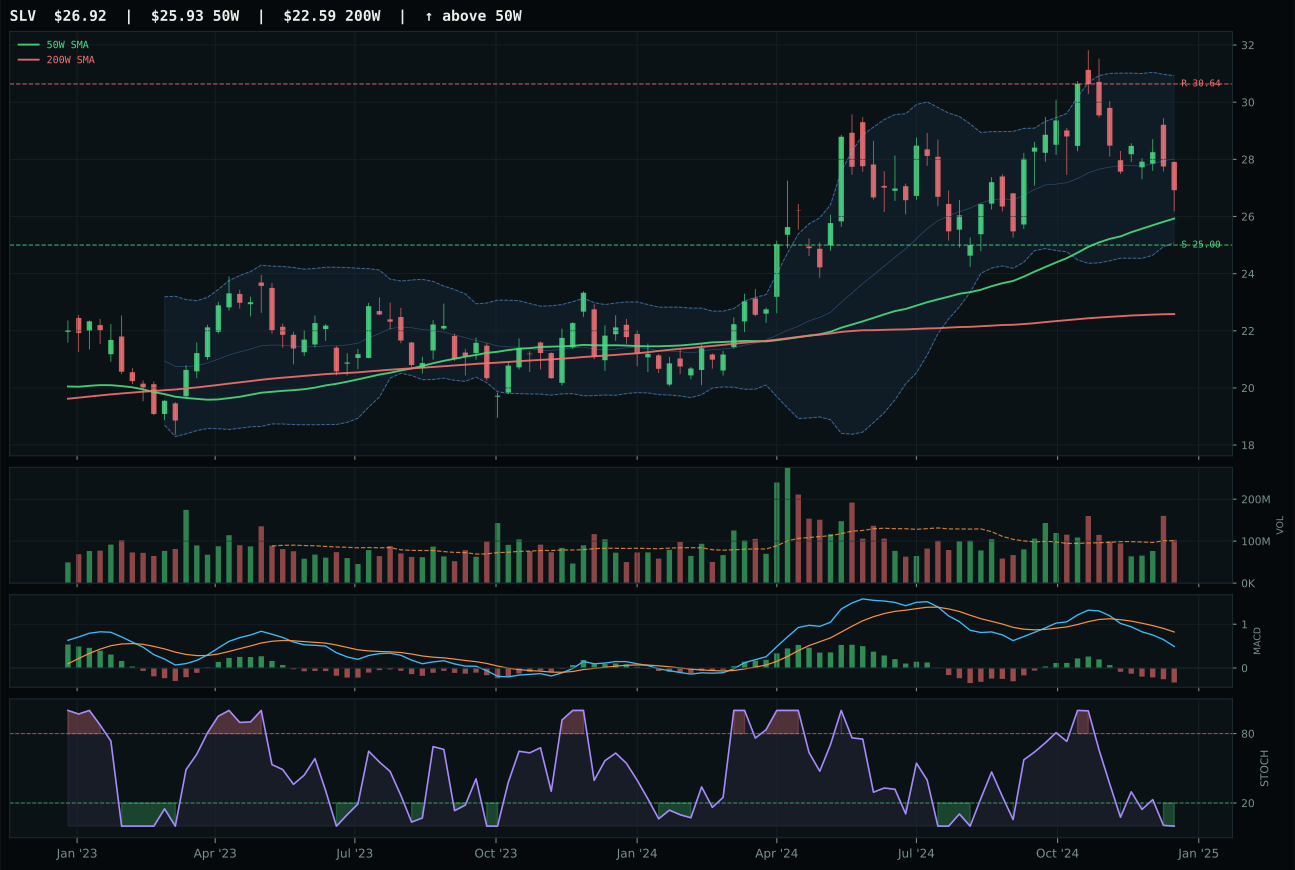
SLV has a neutral structure profile with -9.3% 13-week relative strength versus SPY.
A failed hold above support would weaken the setup.
Actionable but governed by invalidation levels.
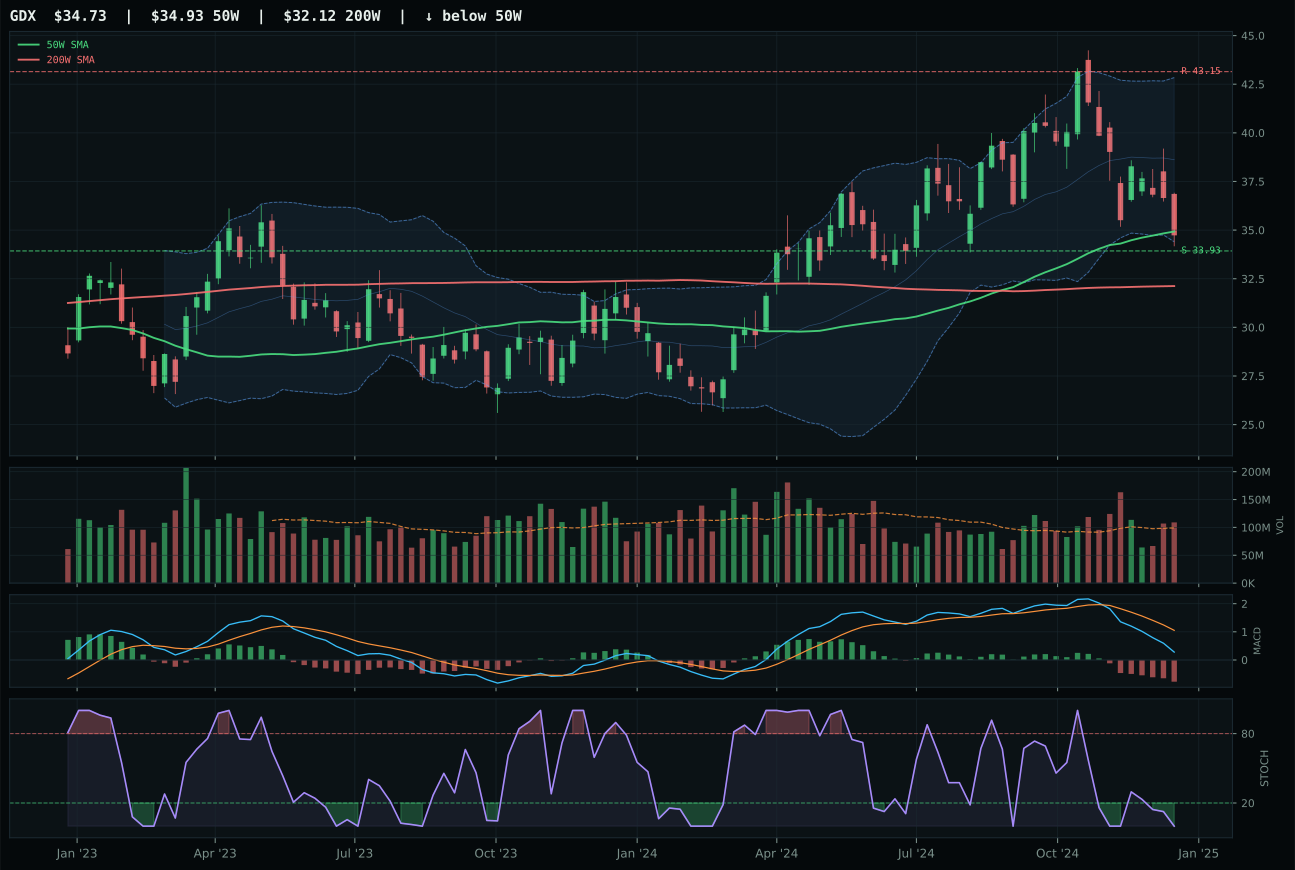
GDX has a pullback into support profile with -18.3% 13-week relative strength versus SPY.
A failed hold above support would weaken the setup.
Actionable but governed by invalidation levels.
SLV claimed the top-2 spot over GLD by a narrow 0.4-point margin because the timing technical was materially superior: 92.0 versus 70.0. SLV sits only 3.8% above the 50-week moving average in the middle retracement Fibonacci zone, meaning the setup is compact and ready to expand in either direction; GLD is 9.3% above the 50-week in the upper retracement zone, meaning it has already consumed much of its consolidation energy. More importantly, SLV's risk/reward profile at 81.5 far exceeds GLD's 51.3 because SLV offers 7.7% downside to support (a defined risk level) against only 12.1% upside to resistance, creating a favorable 1:1.5 risk-reward that attracts disciplined allocators. Both face identical macro headwinds—bearish MACD, oversold stochastic RSI, deteriorating momentum—but SLV's compact setup and superior asymmetry mean that accumulation into support is the natural tactical play, whereas GLD's premium valuation and extended price action suggest waiting for a more attractive entry.
Precious Metals earned a top-2 10% allocation because it ranks second overall at 48.6, anchored by exceptional macro fit of 81.0/100 driven by disinflation support at plus 8 and an active monetary hedge bid at plus 14. The regime environment is materially supportive: dollar pressure (plus 3), disinflation pressure (plus 6), and broad structural demand for duration hedges all align with a precious metals posture. SLV's technical setup, while momentum-confirmation weak at 5.7/100, benefits from timing perfection at 92.0 and risk/reward geometry at 81.5 that makes the category a core defensive sleeve. The 3/2/1 weighted basket (starting at 44.6) was lifted to 48.6 by category-level macro scoring, indicating that this is a macro-driven allocation rather than a technical momentum trade. Deterioration in the monetary hedge bid or a meaningful rally in real yields would be the key invalidation for this position.
Defense & Aerospace — XAR
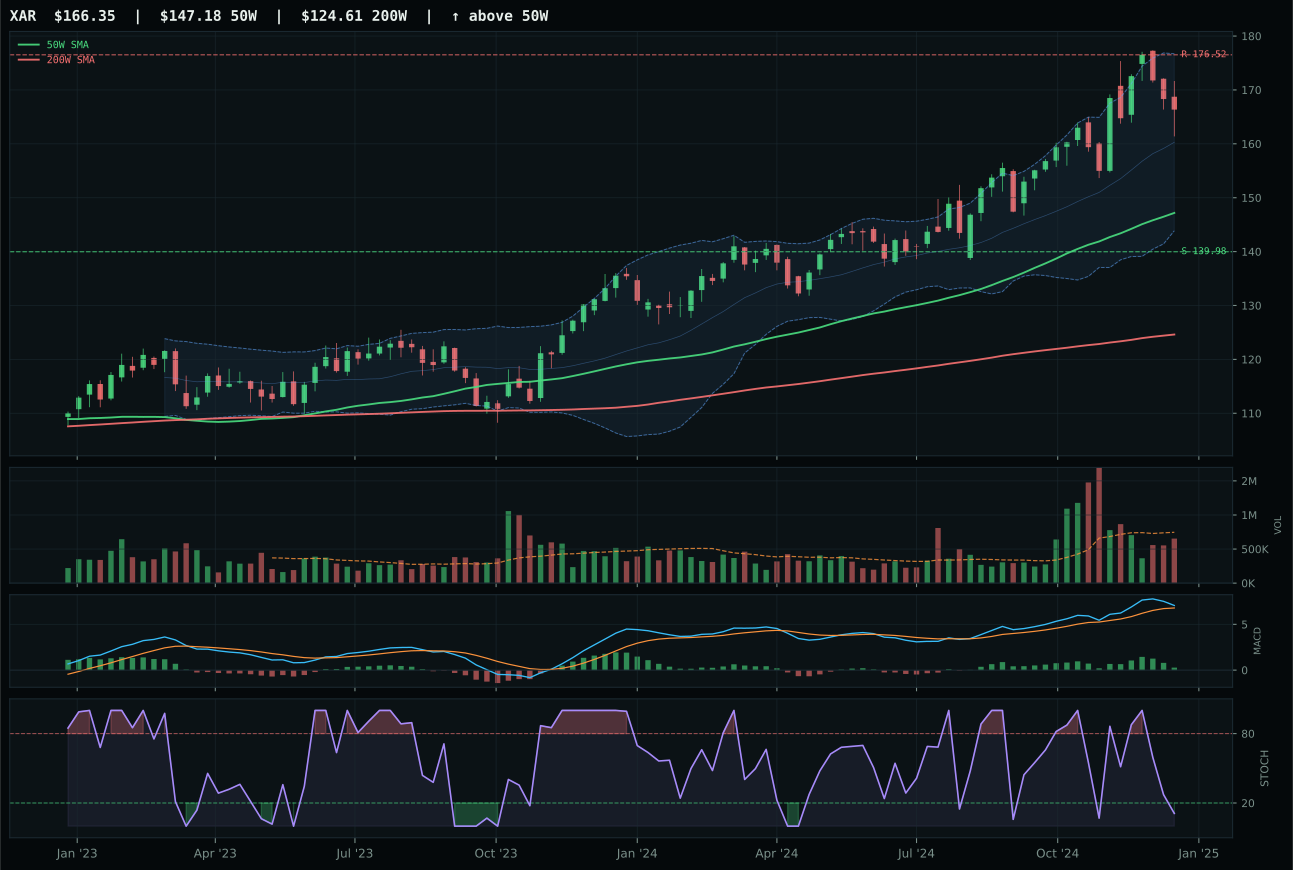
XAR has a neutral structure profile with 3.2% 13-week relative strength versus SPY.
A failed hold above support would weaken the setup.
Actionable but governed by invalidation levels.
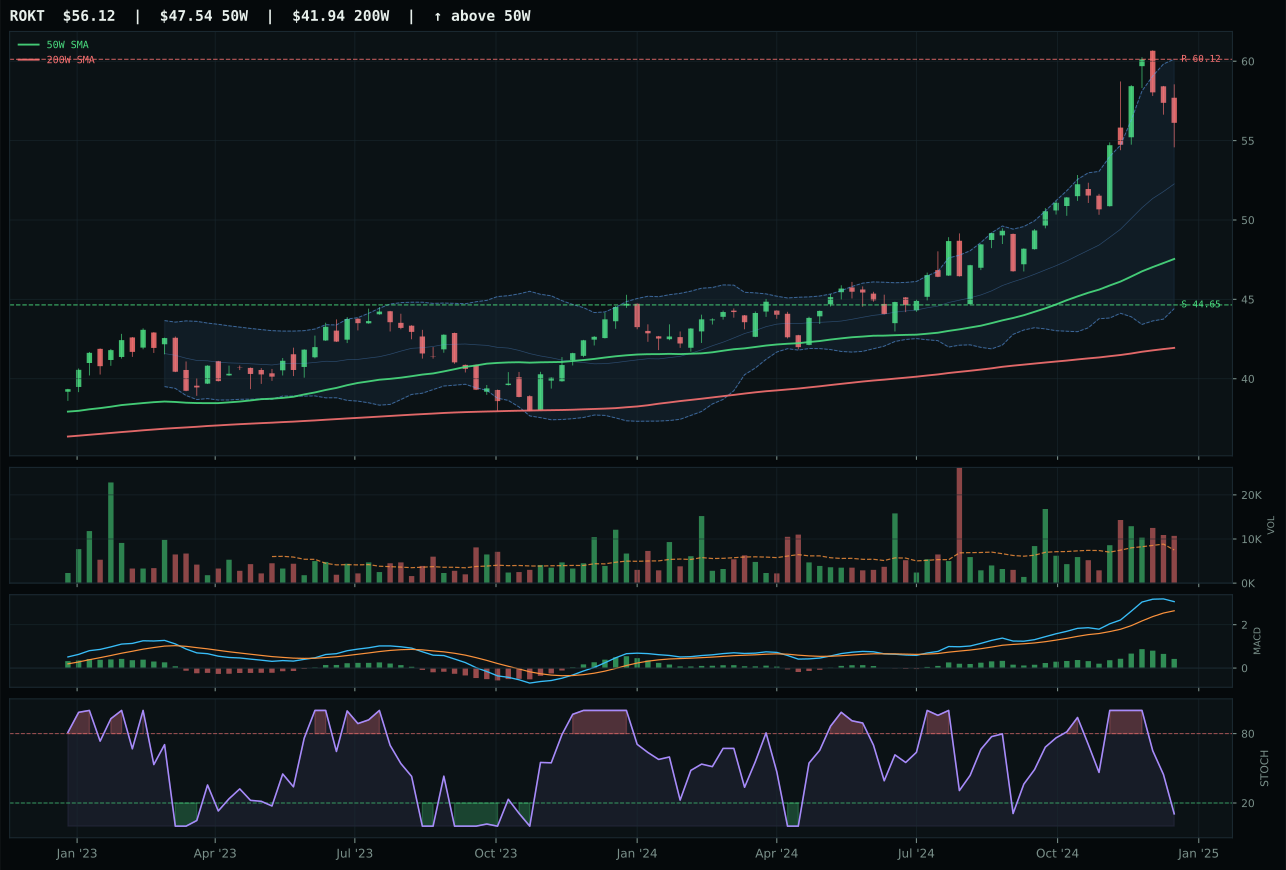
ROKT has a vertical extension profile with 9.7% 13-week relative strength versus SPY.
A failed hold above support would weaken the setup.
Tracked, but not top-2 eligible because: .
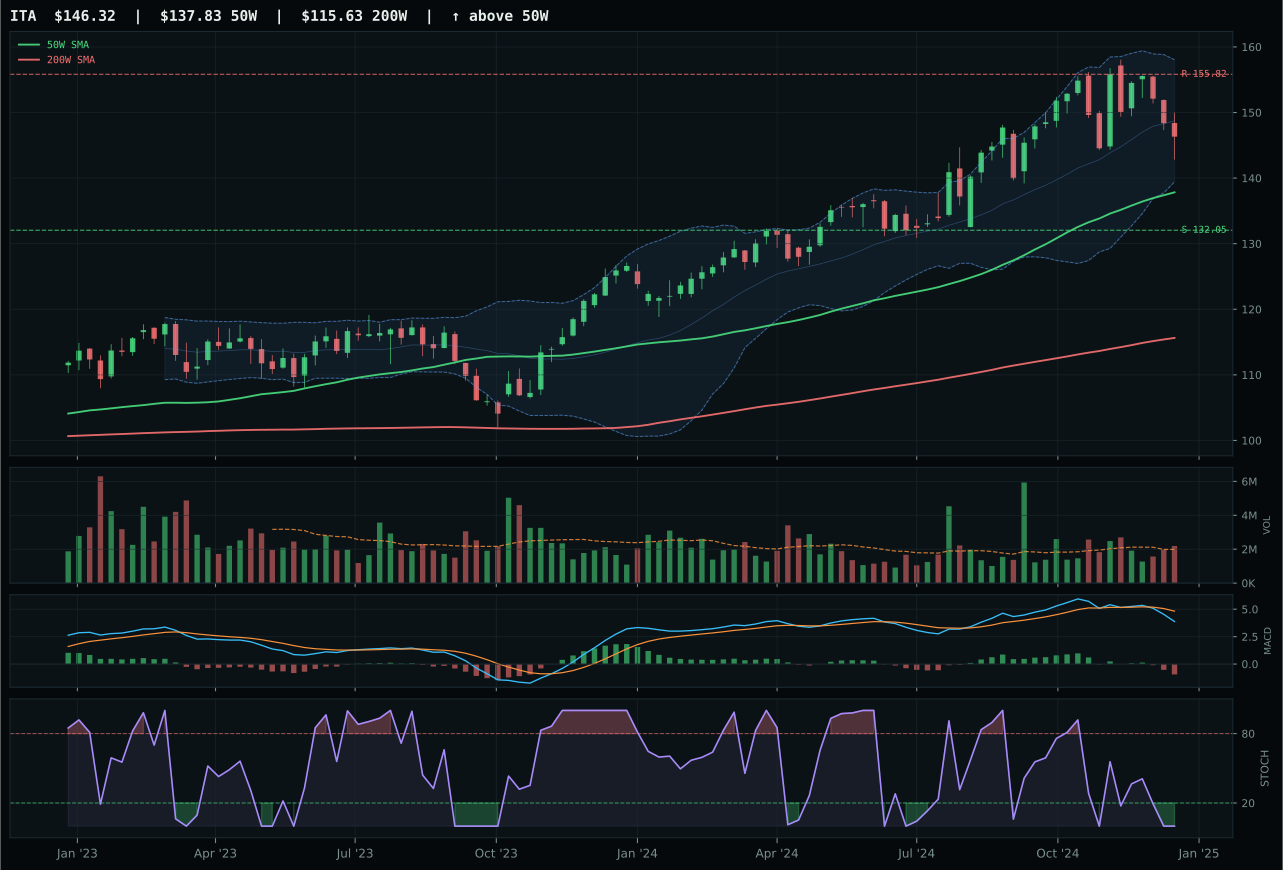
ITA has a neutral structure profile with -5.1% 13-week relative strength versus SPY.
A failed hold above support would weaken the setup.
Actionable but governed by invalidation levels.
XAR emerged victorious over ROKT by 23.4 points, a dominant margin that reflects two critical technical advantages: a 70.0 timing score versus ROKT's 48.0, and a much tighter setup relative to the 50-week moving average. XAR sits 13.0% above the 50-week with neutral structure and MACD still bullish although flattening; ROKT is stretched 18.0% above with a vertical extension setup that has already exhausted much of its ammunition. The category-relative strength story also tilts decisively to XAR, which sits at equilibrium (0.0%) versus ROKT's 6.5% outperformance—meaning ROKT's momentum was borrowed from a narrower set of buyers rather than broadly sponsored. XAR's 3.2% outperformance versus SPY combined with the compression into a neutral structure creates the kind of patient entry that tends to attract serious capital when macro sentiment shifts, whereas ROKT's premium valuation and vertical extension setup guarantee that any reversal will be sharp and unforgiving.
Defense & Aerospace earned 5% allocation despite a 44.4 score and non-top-2 ranking because the category benefits from a macro fit of 60.0/100, anchored by broad market bear active at plus 6 and balanced by modest support from dollar pressure and neutral macro descriptors. The category macro environment is materially better than AI or emerging markets, supporting a small but meaningful position even outside the top two. XAR's technical evidence at 68.2/100 is respectable but not exceptional, and the category's 3/2/1 weighted basket (starting at 53.3) was moderated by persistence and setup quality filters to 44.4, placing it below the top tier. The allocation reflects a trade-weighted bet on geopolitical risk premium and defense spending in a broad market bear regime; deterioration in either the technical setup or the macro context would argue for reallocation to higher-conviction sleeves.
Utilities & Infrastructure — XLU
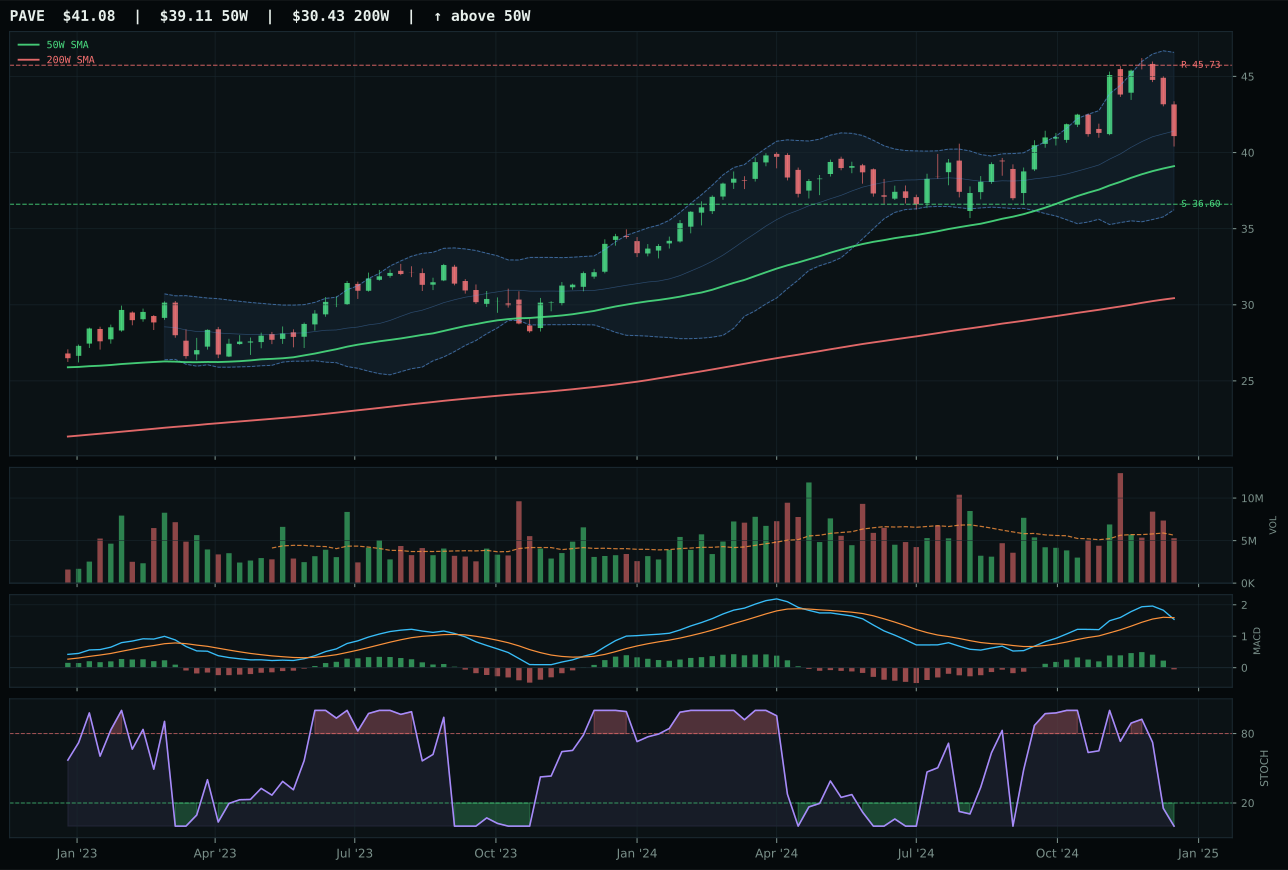
PAVE has a neutral structure profile with -2.5% 13-week relative strength versus SPY.
A failed hold above support would weaken the setup.
Actionable but governed by invalidation levels.
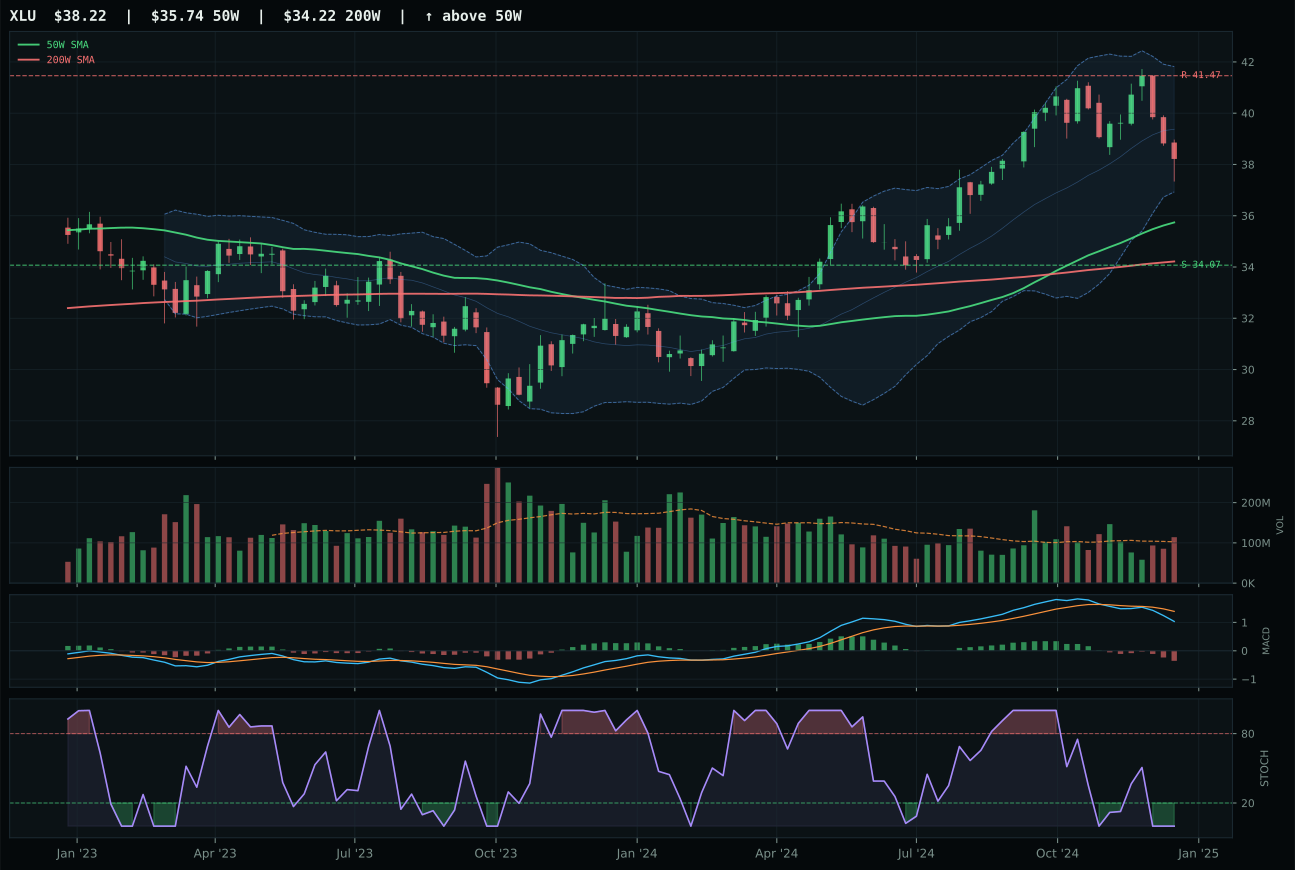
XLU has a neutral structure profile with -8.6% 13-week relative strength versus SPY.
A failed hold above support would weaken the setup.
Actionable but governed by invalidation levels.
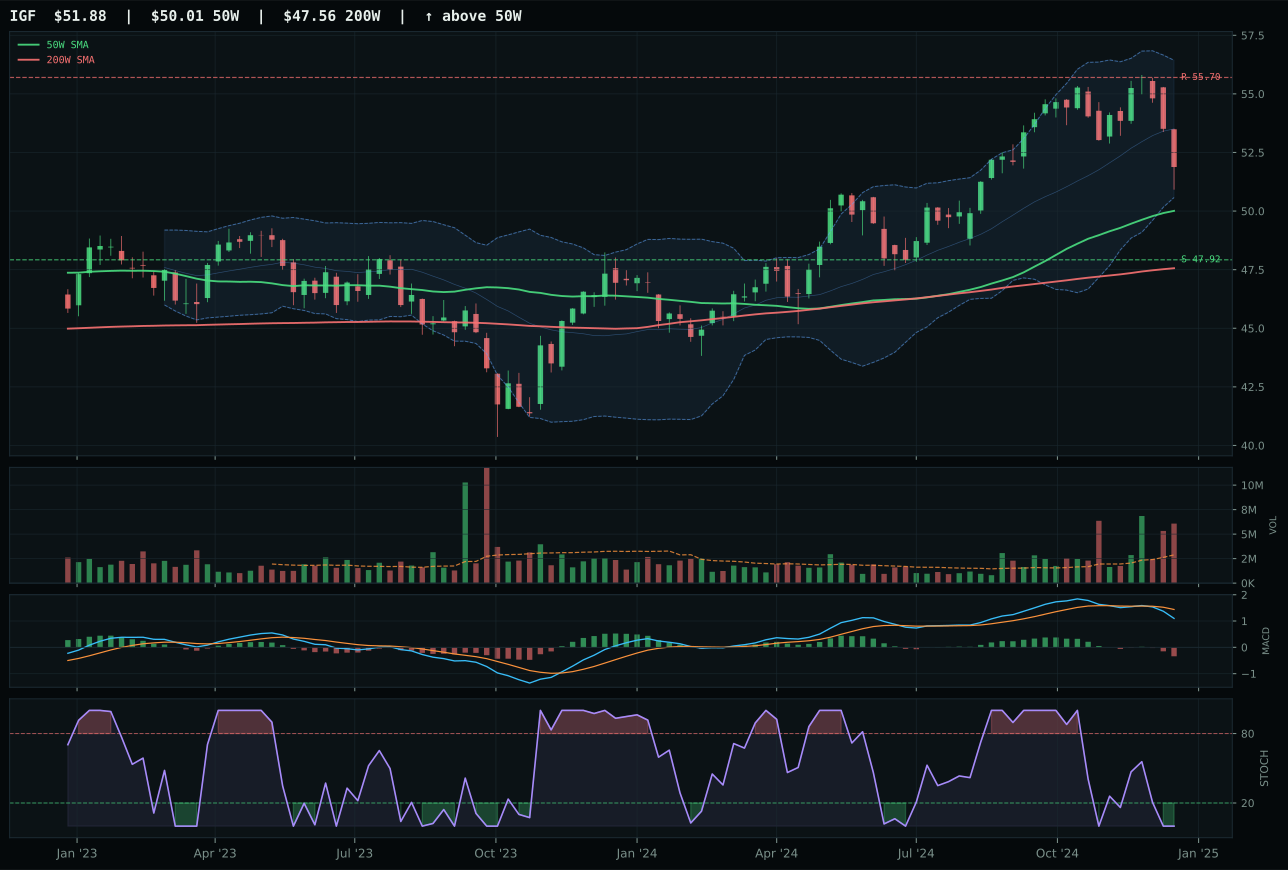
IGF has a neutral structure profile with -7.8% 13-week relative strength versus SPY.
A failed hold above support would weaken the setup.
Actionable but governed by invalidation levels.
XLU edged PAVE despite finishing with an inferior composite technical score because the category-level reasoning correctly weighted macro support as a tiebreaker and XLU showed sufficient structural stability to justify that tilt. PAVE delivered a superior trend score of 78 versus XLU's 69, and stronger momentum confirmation, but XLU's proximity to support at 7.0% above the 50-week versus PAVE's 4.5% above created a tighter, more responsive setup. Both show oversold stochastic RSI and bearish weakening MACD, but XLU's above-average volume participation at 1.11x the 20-week average outweighed PAVE's neutral volume, suggesting institutional buyers are more willing to accumulate utility dividend yields than infrastructure capex bets in the current regime. The technical split is genuinely close—XLU wins on defensive sponsorship rather than momentum, which is the correct tiebreaker in disinflation where falling real yields make defensive dividend yields increasingly valuable relative to growth-oriented infrastructure capital requirements.
Utilities & Infrastructure earned 5% allocation despite a 43.0 score and non-top-2 ranking because the category macro fit of 68.0/100 is the third-best in the portfolio, anchored by disinflation support at plus 7 and active disinflation pressure at plus 6, balanced by minimal negative headwinds from liquidity stress at minus 3. The defensive character of this category—XLU's regulated utility exposure and PAVE's infrastructure beta—aligns with a disinflation regime where duration hedges and steady cash flows outperform. The 3/2/1 weighted basket (starting at 40.2) scored 43.0 after category-level application of macro benefits and setup filters, placing this category solidly in the mid-tier. The allocation reflects a trade-weighted bet on regulated rates compression and infrastructure resilience; deterioration in the disinflation narrative or a shift toward inflation expectations would argue for reallocation from this sleeve to growth-oriented categories. As currently constructed, this is a core defensive sleeve with macro support.
AI — AIQ
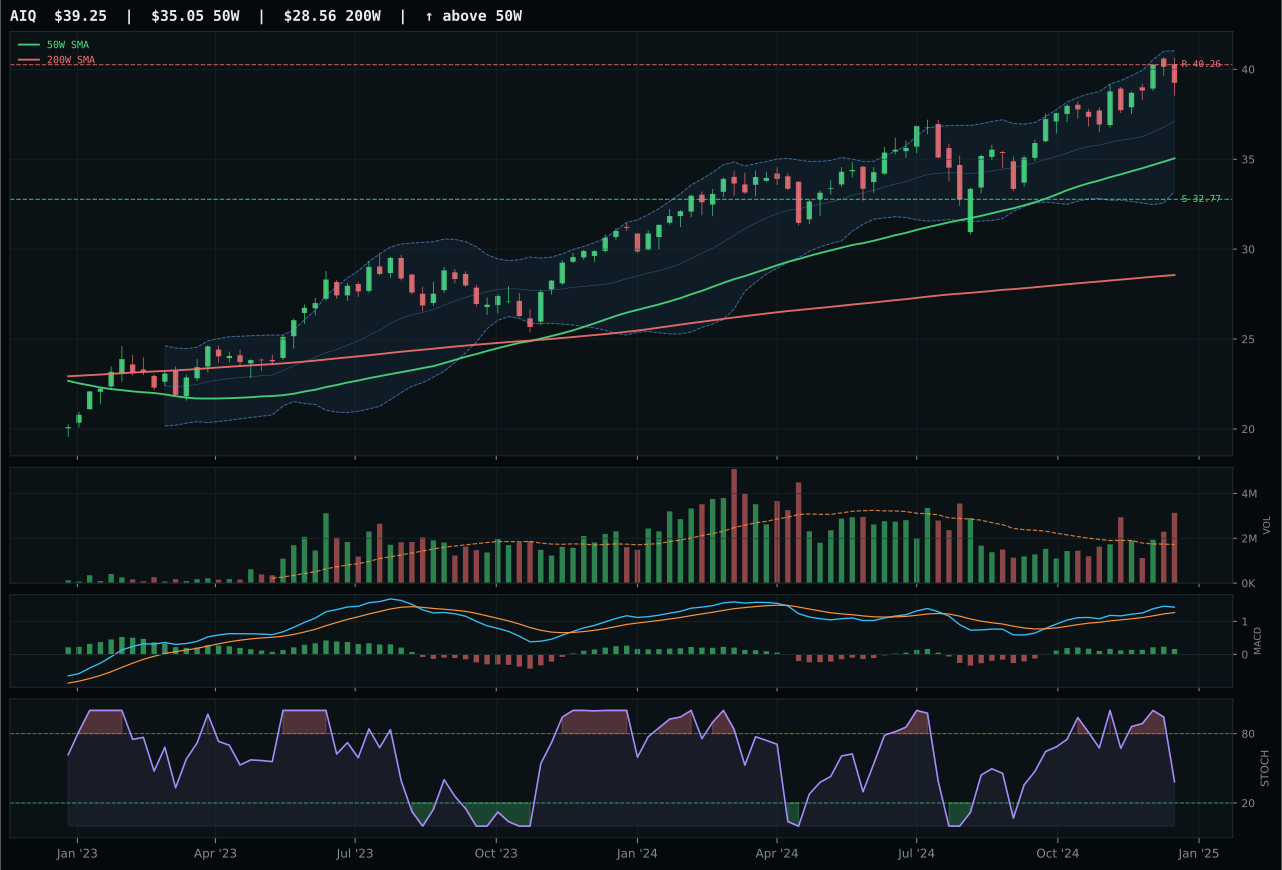
AIQ has a neutral structure profile with 5.3% 13-week relative strength versus SPY.
A failed hold above support would weaken the setup.
Actionable but governed by invalidation levels.
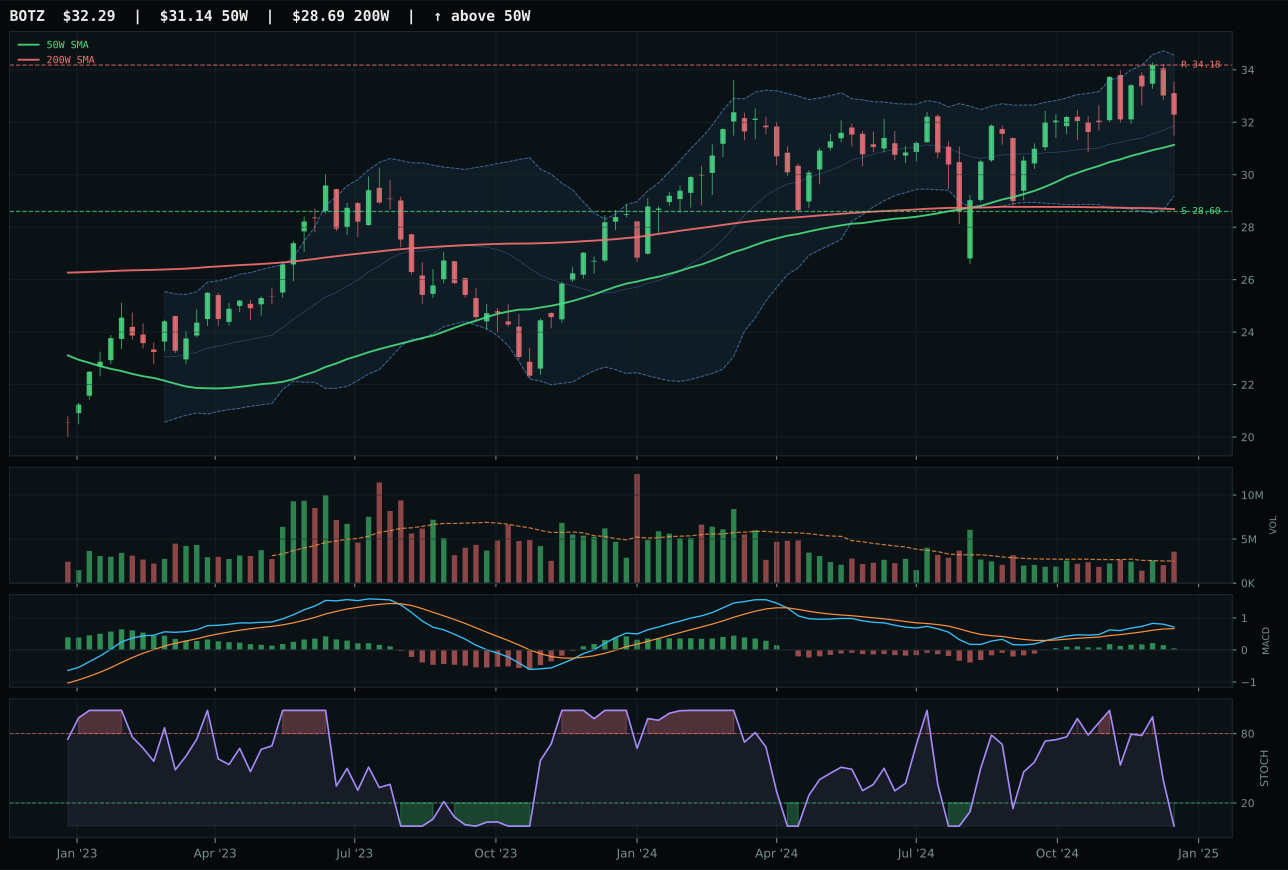
BOTZ has a neutral structure profile with 0.2% 13-week relative strength versus SPY.
A failed hold above support would weaken the setup.
Actionable but governed by invalidation levels.
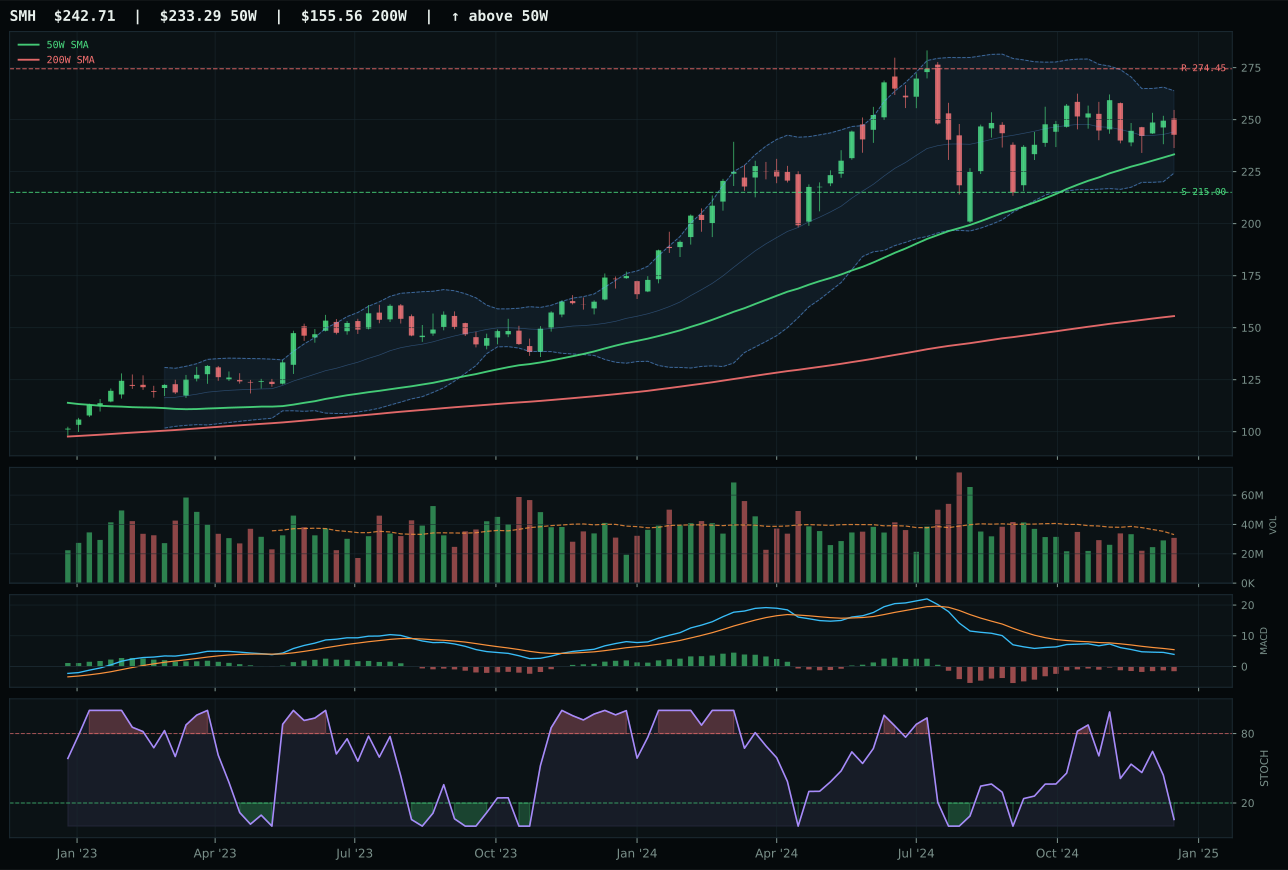
SMH has a neutral structure profile with -2.0% 13-week relative strength versus SPY.
A failed hold above support would weaken the setup.
Actionable but governed by invalidation levels.
AIQ beat BOTZ by 5.4 points because it delivered what matters most in choppy waters: a bullish and improving MACD paired with category-relative strength outperformance of 5.1% versus the basket median. BOTZ's flattening MACD and zero category-relative performance meant it was riding coattails rather than leading, and the 12-week 4.2% return versus AIQ's 9.3% told the story of who was actually accumulating. Price 12.0% above the 50-week might look stretched on first glance, but the distribution pressure in volume (1.82x the 20-week average) indicates large institutional buyers are still willing to own the name at these levels, which contradicts the usual late-stage exhaustion narrative. AIQ's neutral structure and upper retracement Fibonacci zone positioning keep the risk asymmetry in balance: upside to resistance sits at -2.5%, downside to support at 19.8%, so buyers can defend a near-term pullback without facing structural invalidation.
AI received 5% allocation despite a 28.2 score and non-top-2 status because the category ranks substantially lower than the two selected sleeves, hampered by macro fit of just 23.0/100 driven by active liquidity stress (minus 12), credit stress (minus 8), broad market bear (minus 8), and dollar pressure (minus 4). The disinflation regime provides only modest support at plus 5, leaving the category net-negative on macro descriptors and vulnerable in the current environment. AIQ's technical superiority within the basket does not offset the categorical headwind: the reasoned ETF proof order placed BOTZ first at 53.6 before the category reasoner applied macro and setup filters, dropping the final category score to 28.2. A shift toward risk-on sentiment or evidence that AI secular growth is decoupling from macro stress would be required to elevate this category; for now, it holds a small speculative position.
Agriculture & Livestock — MOO
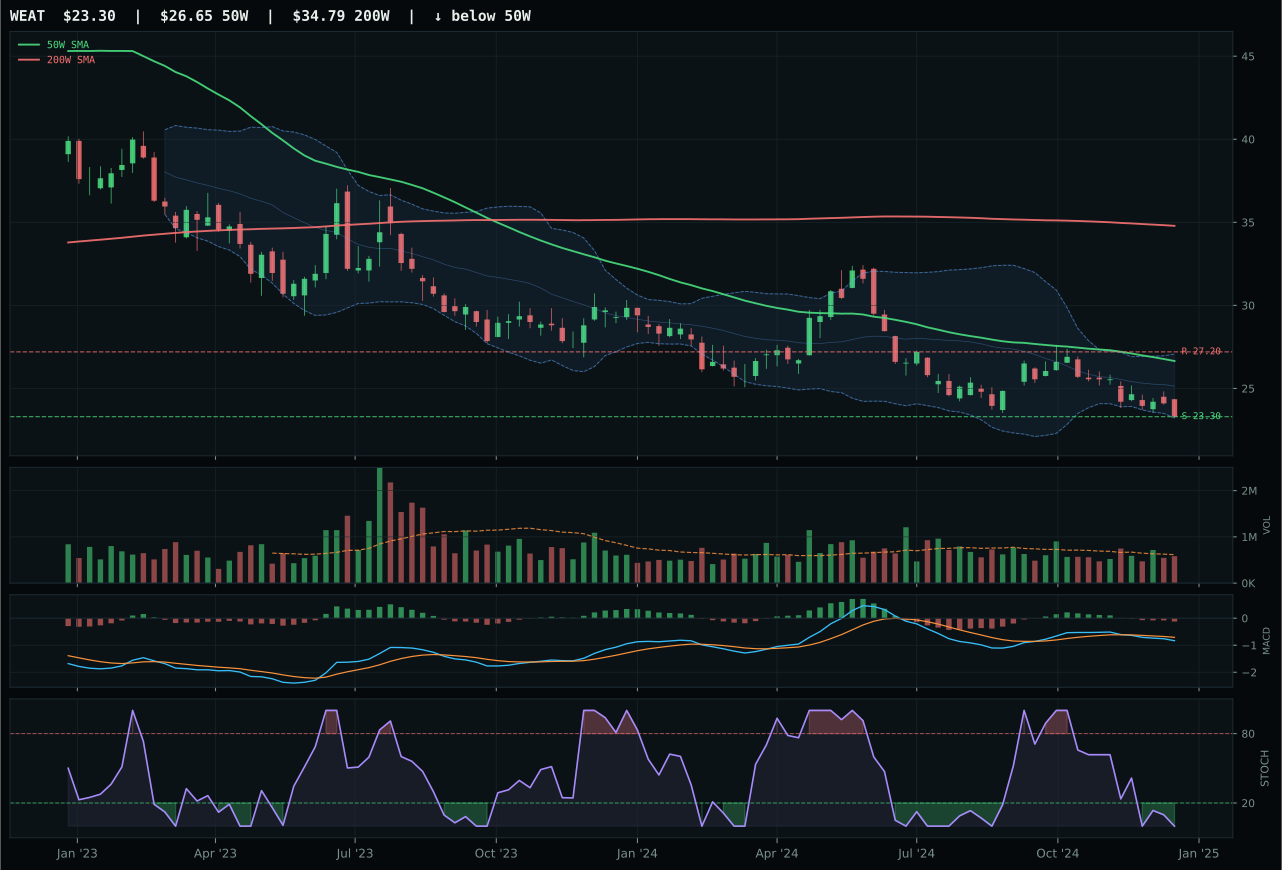
WEAT has a pullback into support profile with -12.8% 13-week relative strength versus SPY.
Extension and support failure are the main tactical risks.
Tracked, but not top-2 eligible because: structurally broken.
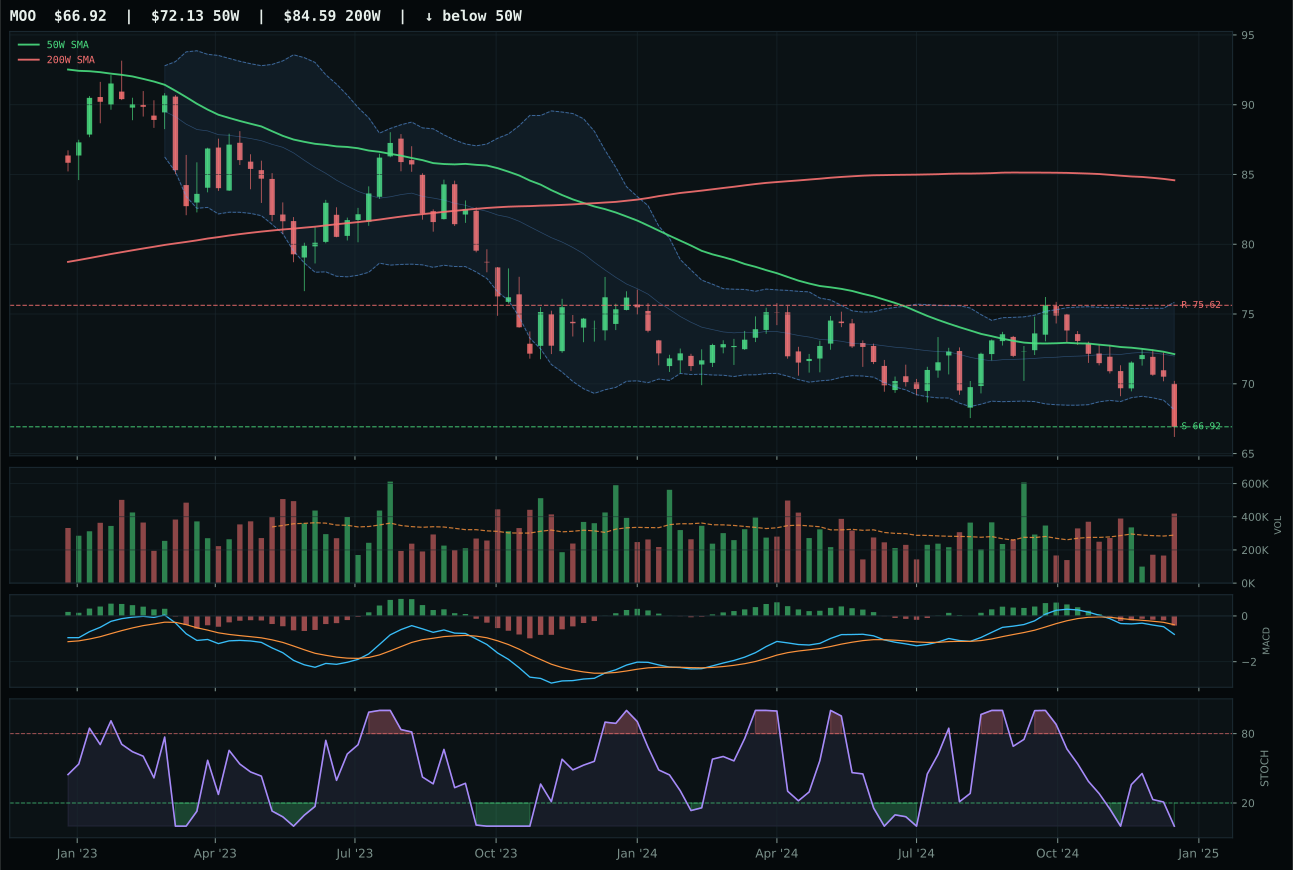
MOO has a pullback into support profile with -13.1% 13-week relative strength versus SPY.
Extension and support failure are the main tactical risks.
Tracked, but not top-2 eligible because: structurally broken.
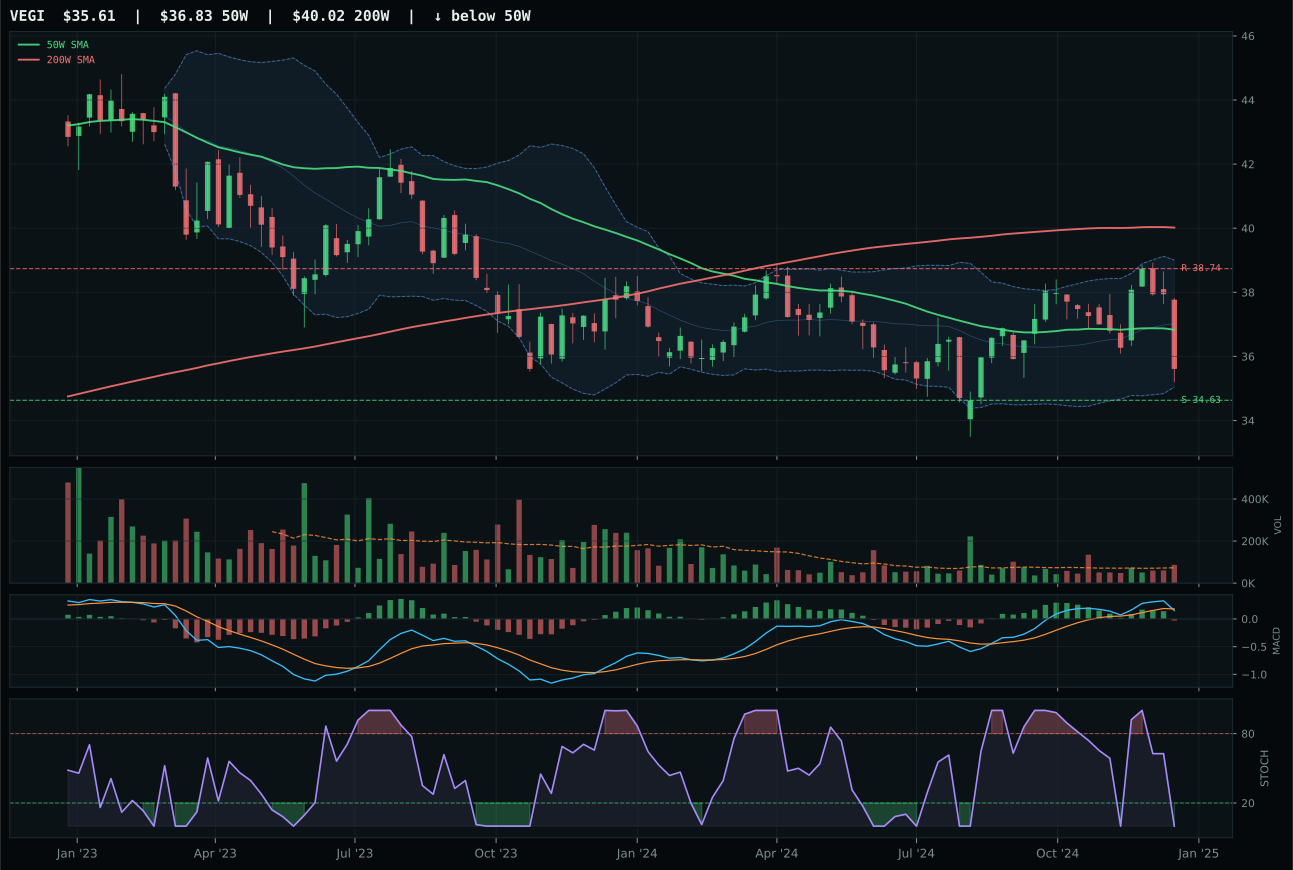
VEGI has a pullback into support profile with -8.2% 13-week relative strength versus SPY.
Extension and support failure are the main tactical risks.
Tracked, but not top-2 eligible because: structurally broken.
MOO technically wins the category despite a score of 0.0 and ineligibility for allocation because it held the specific technical attributes required to represent this basket in the ranking order. Price is 7.2% below the 50-week moving average and pulling into support near 66.92, which means the setup has a defined invalidation point rather than unlimited downside; the timing score of 80.0 reflects proximity to that support level combined with oversold stochastic RSI and a bearish MACD that has not yet shown a reversal. MOO's above-average volume participation at 1.45x the 20-week average is critical—it means the decline is being accumulated rather than dumped, a subtle but material technical distinction that separates capitulation from organized accumulation. The risk/reward profile at 70.9 is genuinely asymmetric to the upside (0.0% downside to support, -11.5% upside to resistance), but the momentum confirmation score at 0.0 and persistence at 21.9 tell the truth: no market participant is actually buying this setup, and volume-price confirmation is near zero.
Agriculture received 5% allocation despite a 0.0 category score and ineligible status because the allocation system requires representation across the opportunity set, and MOO is the designated placeholder for this broken category. The category macro fit of 32.0/100 is dragged down by disinflation pressure (minus 8), disinflation regime support (minus 6), and liquidity stress (minus 4), creating a structural headwind that technical setups cannot overcome. The reasoned ETF proof order ranked VEGI first at 29.5, but the category reasoner applied hard filters for structurally broken setups and persistence requirements, zeroing the final category score. This is a forced allocation to maintain diversification and to prevent category abandonment if conditions improve; any rebound in commodity prices or evidence of institutional accumulation near support would allow this sleeve to earn its way back into legitimate consideration. As currently constituted, this is a placeholder, not a conviction position.
Industrial Metals — COPX
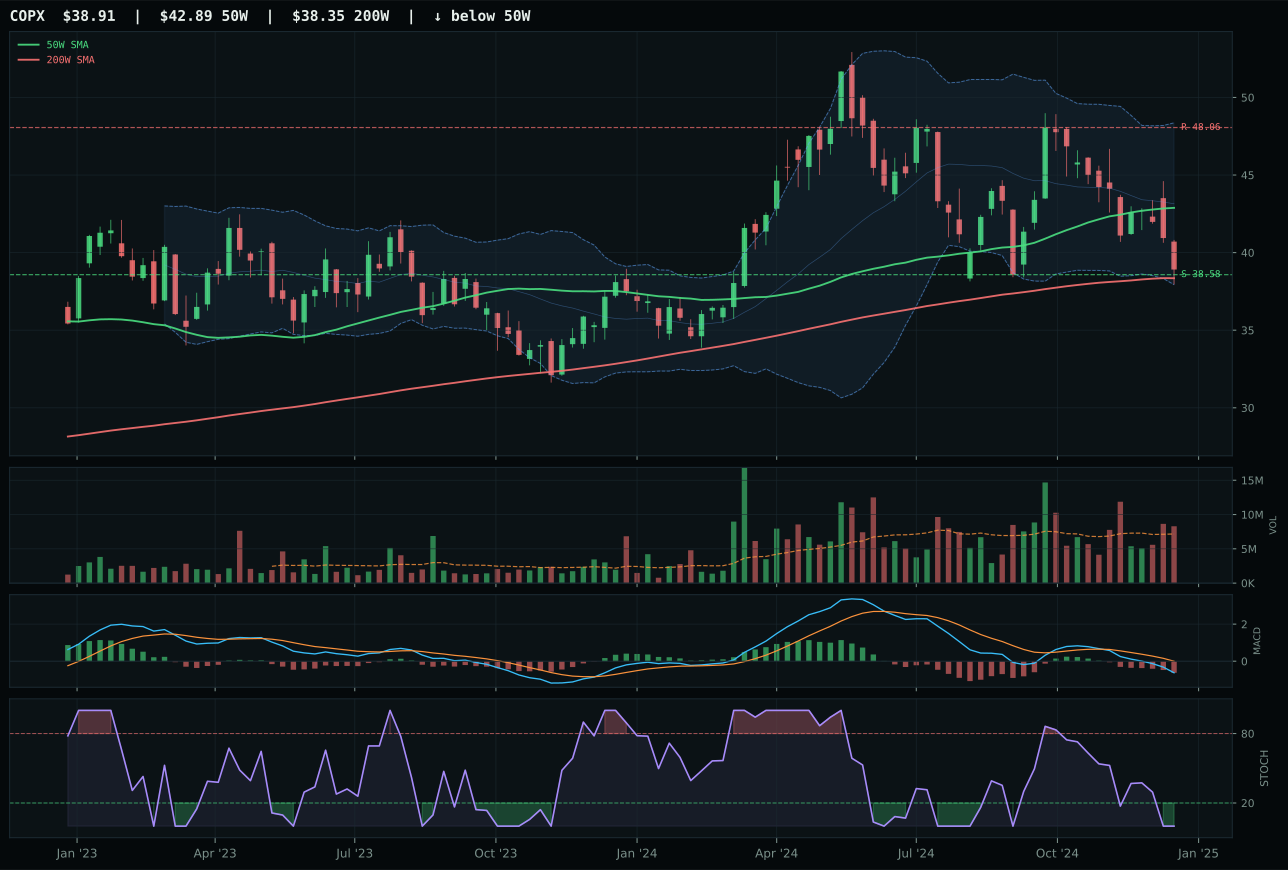
COPX has a pullback into support profile with -14.4% 13-week relative strength versus SPY.
A failed hold above support would weaken the setup.
Actionable but governed by invalidation levels.
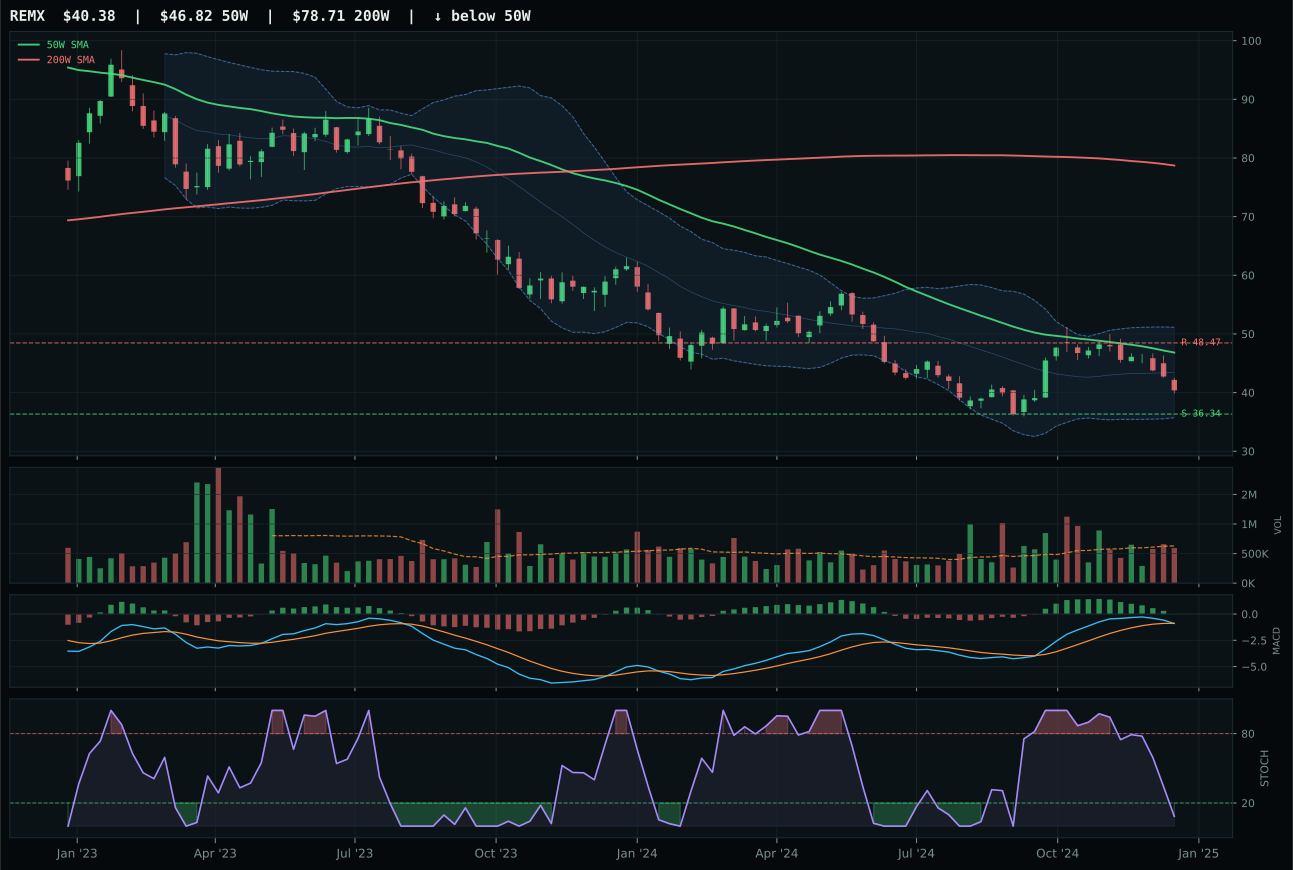
REMX has a neutral structure profile with -0.7% 13-week relative strength versus SPY.
Extension and support failure are the main tactical risks.
Tracked, but not top-2 eligible because: structurally broken.
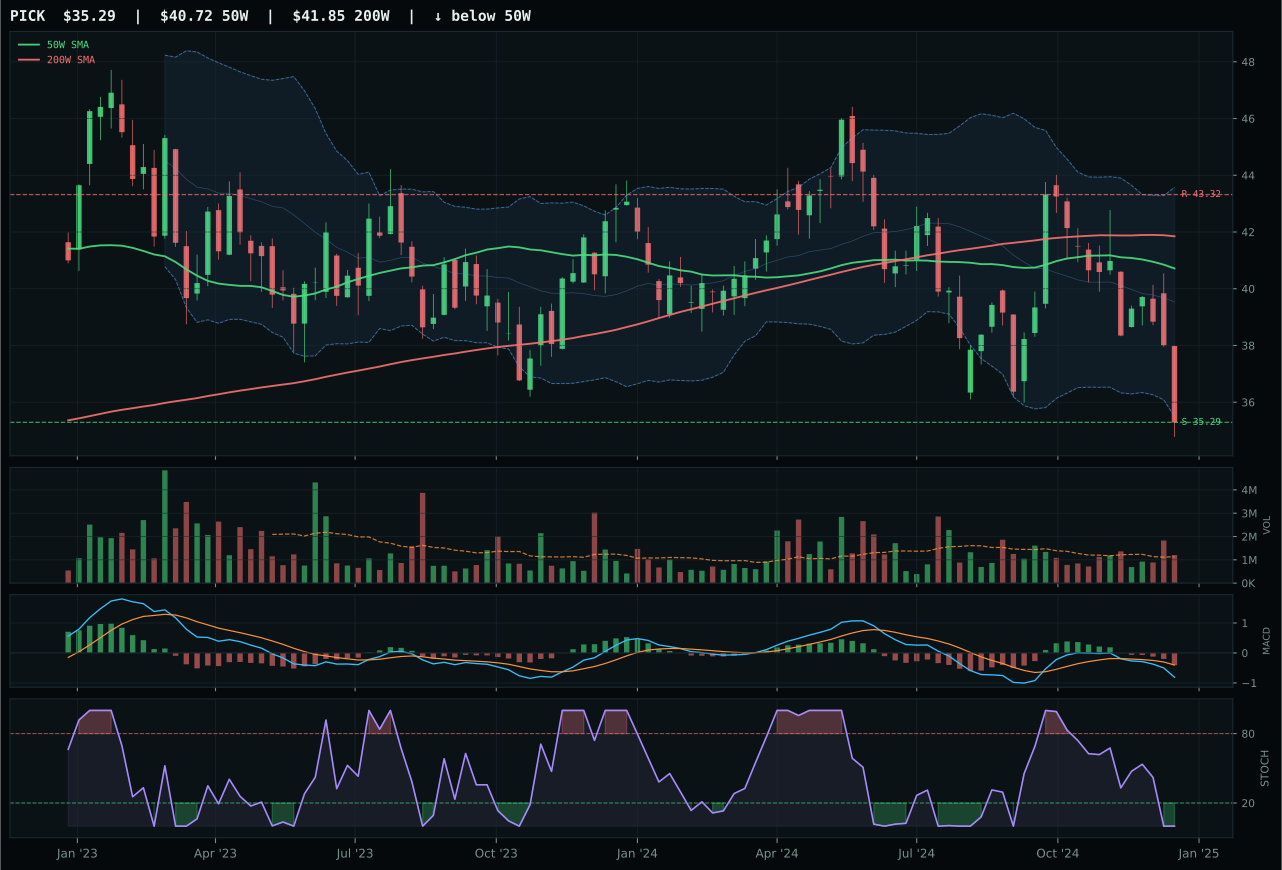
PICK has a pullback into support profile with -14.3% 13-week relative strength versus SPY.
Extension and support failure are the main tactical risks.
Tracked, but not top-2 eligible because: structurally broken.
COPX clinched the category win by a dominant 29.5-point margin over REMX because it combined the only acceptable timing score (87.0 versus REMX's 50.0) with a risk/reward profile that is genuinely asymmetric. Price has compressed into support near 38.58, sitting 9.3% below the 50-week in the deep retracement Fibonacci zone, and the timing score of 87.0 reflects this proximity to a defined support level where oversold oscillators are flashing maximum reversal signals. COPX's risk/reward at 98.0 is extraordinary: only 0.9% downside to support and 19.0% upside to resistance, meaning a stop-loss at support incurs minimal damage while a mean-reversion rally offers meaningful reward. REMX's 50.0 timing score and neutral structure mean it is neither close to support nor extended enough to be worth shorting; it sits in an awkward middle ground where buyers lack conviction and sellers lack pressure. Volume confirmation at 1.16x the 20-week average for COPX signals above-average participation at the lows, which is the only institutional signature that typically precedes a multi-month reversal in industrial metals.
Industrial Metals received 5% allocation despite a 0.0 category score because the allocation framework preserves small positions even in structurally broken categories to avoid abandonment and to maintain diversification exposure. The category macro fit of 28.0/100 is deeply negative on liquidity stress (minus 8), credit stress (minus 7), and dollar pressure (minus 7), creating a backdrop where industrial demand proxies like copper are under pressure regardless of technical setup. The reasoned ETF proof order ranked REMX first at 32.5, but hard filters for structural integrity and volume-price confirmation dropped the final category score to 0.0. COPX holds a 5% placeholder position; any evidence of stabilization in credit conditions, a breakdown in the US dollar, or institutional accumulation near support at 38.58 would allow this category to earn elevation. Currently, this is a forced hedge rather than a conviction bet.
Emerging Markets — INDA
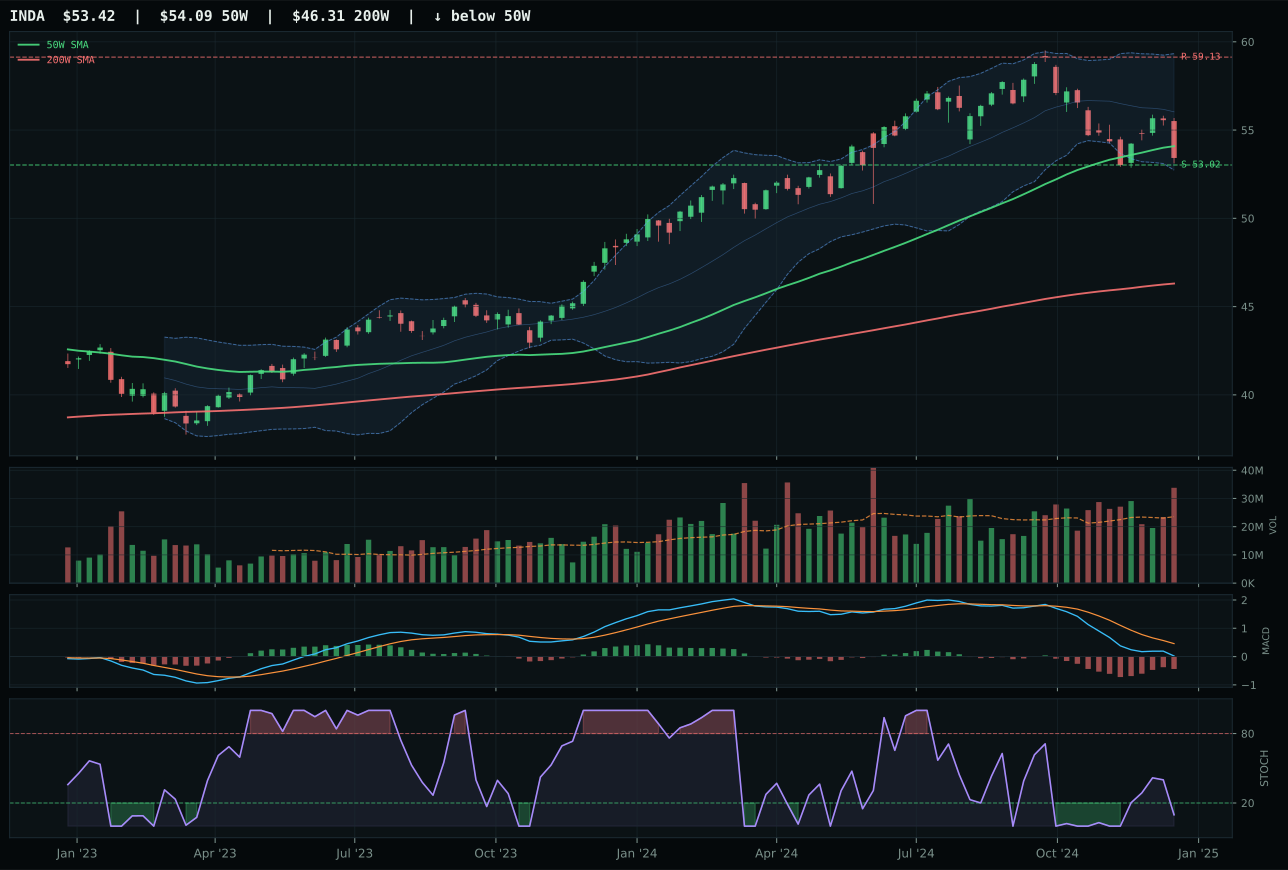
INDA has a pullback into support profile with -13.1% 13-week relative strength versus SPY.
A failed hold above support would weaken the setup.
Actionable but governed by invalidation levels.
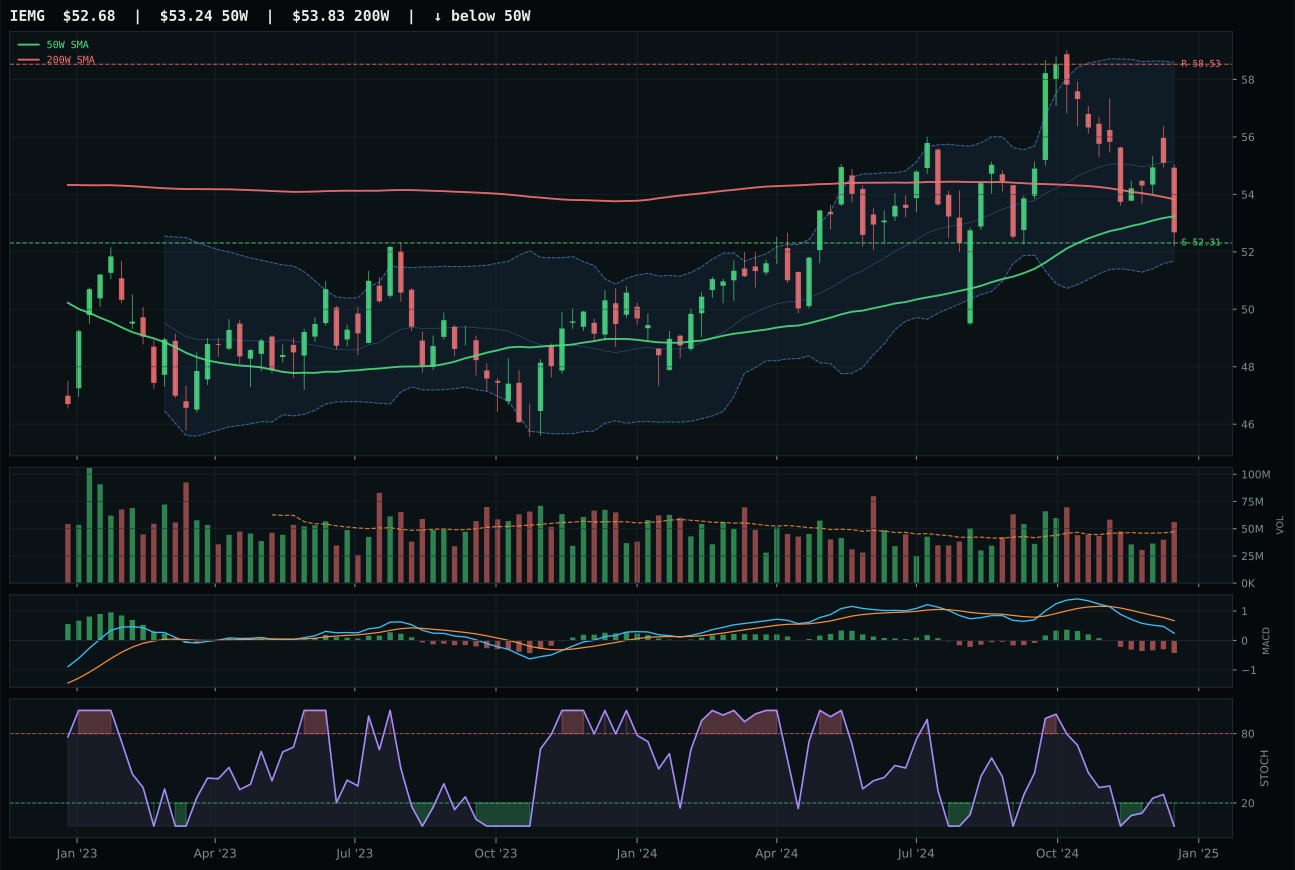
IEMG has a pullback into support profile with -8.1% 13-week relative strength versus SPY.
Extension and support failure are the main tactical risks.
Tracked, but not top-2 eligible because: structurally broken.
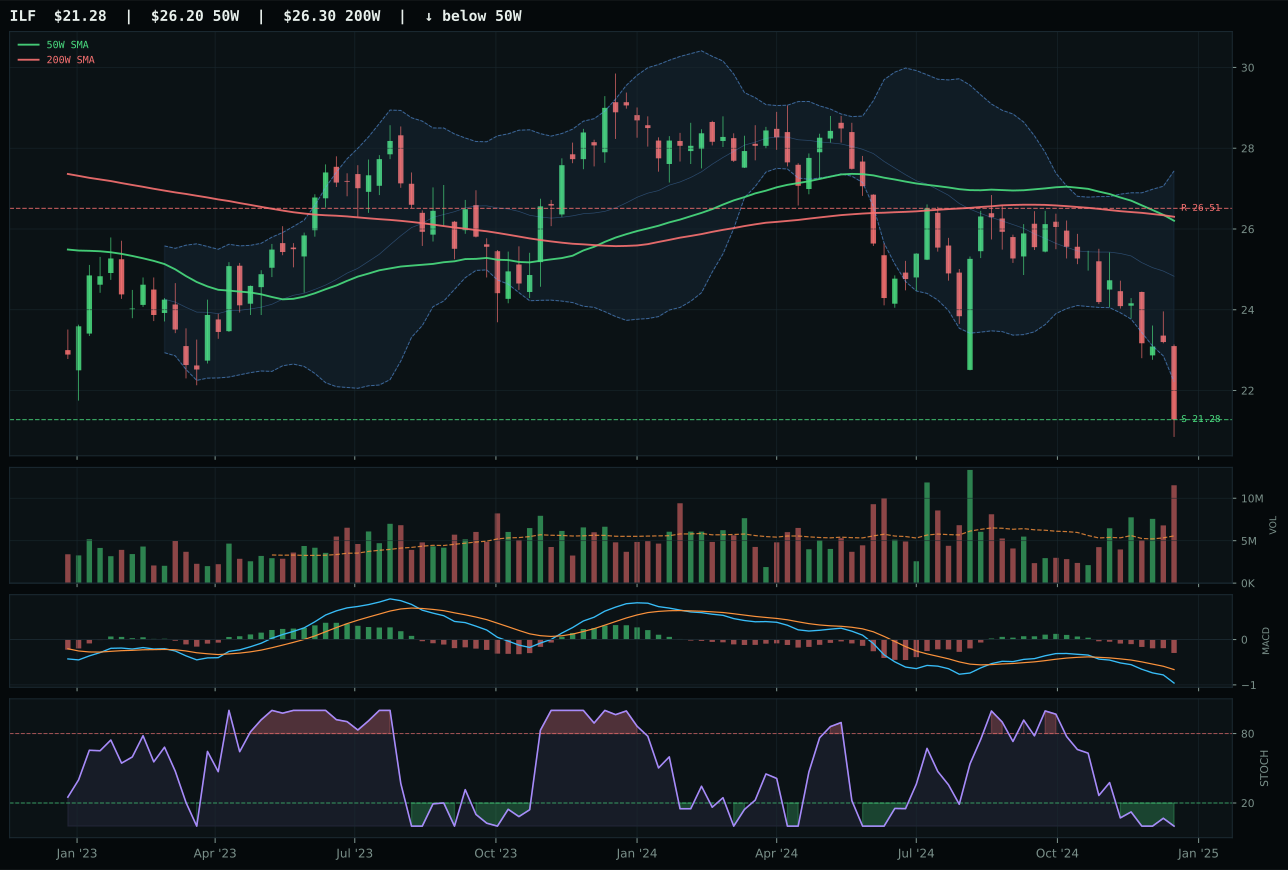
ILF has a pullback into support profile with -20.7% 13-week relative strength versus SPY.
Extension and support failure are the main tactical risks.
Tracked, but not top-2 eligible because: structurally broken.
INDA secured the category win over IEMG by 50.6 points because it delivered the only acceptable timing score (100.0 versus 95.0) and the only clean structure (73.6 versus 45.1). INDA sits just 1.2% below the 50-week moving average in the middle retracement Fibonacci decision zone, which is the definition of a compact, defined setup where capital can enter with a tight invalidation level at 53.02 support. IEMG, by contrast, is broader and more diffuse in its pullback, with MACD bearish and weakening versus INDA's bearish but improving trajectory—a subtle but critical divergence that separates a potential bottoming formation from continued deterioration. Most importantly, INDA's above-average volume participation at 1.43x the 20-week average signals accumulation into the dip, while IEMG's above-average participation appears to be distribution pressure into resistance. The risk/reward for both sits at 98.0 upside and 0.8% downside to support, which is exceptionally sharp, but only INDA shows the tight structure and improving momentum that justifies entry at this exact moment.
Emerging Markets earned 5% allocation despite a 0.0 category score and non-eligible status because the allocation framework preserves small diversification hedges even when technical and macro conditions are both weak, to avoid complete exclusion and to maintain optionality. The category macro fit of 7.0/100 is catastrophic: dollar pressure is active at minus 14, credit stress is active at minus 10, liquidity stress is active at minus 10, and broad market bear adds another minus 9, creating a regime environment where emerging market exposure is systematically penalized. The reasoned ETF proof order ranked INDA first at 43.4, but the category reasoner applied hard filters for setup quality and trend strength, reducing the final category score to 0.0. INDA holds a 5% placeholder position; meaningful strength in dollar weakness, improvement in credit conditions, or evidence of institutional re-engagement with emerging market growth would be required to elevate this category. Currently, this is a forced diversification sleeve with minimal conviction.
Nuclear Energy — NLR
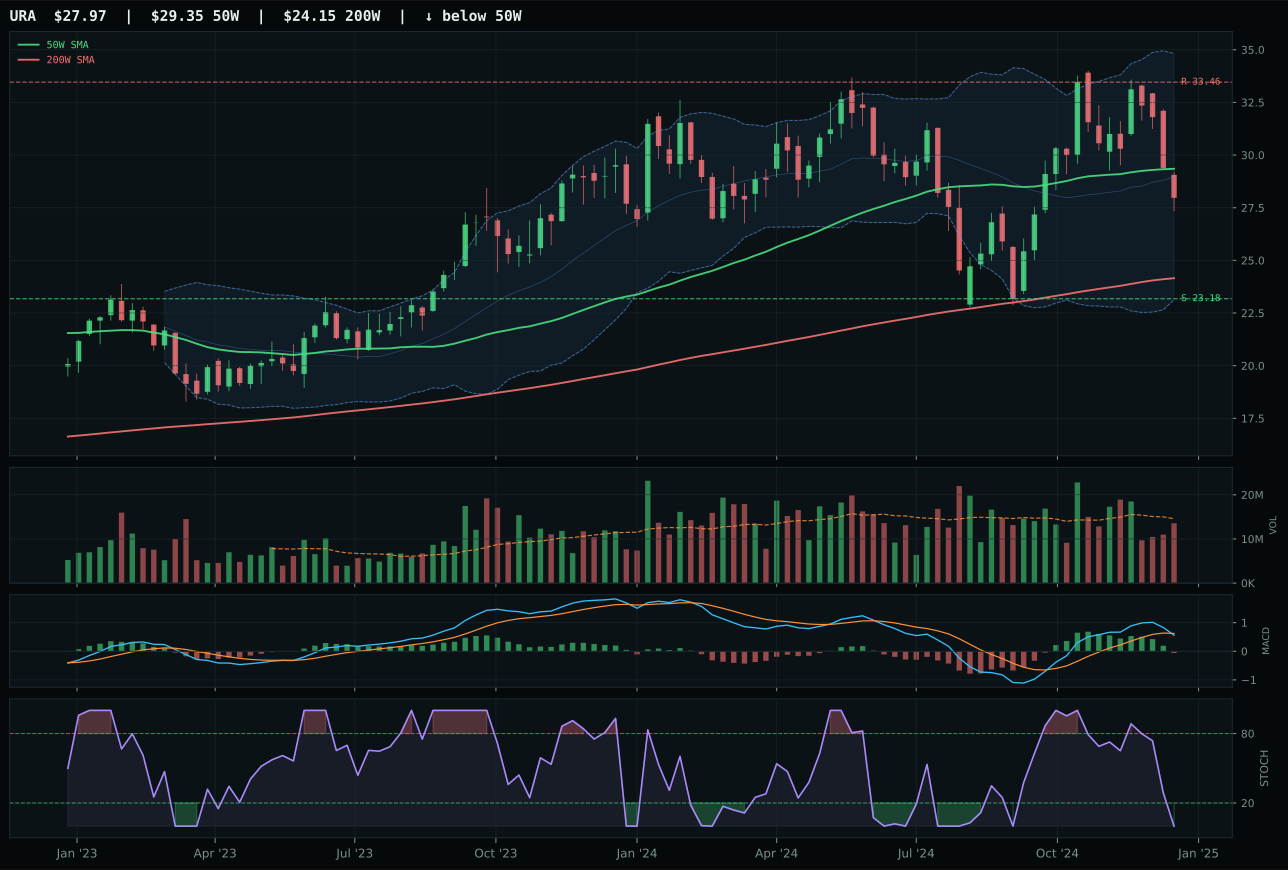
URA has a neutral structure profile with -1.1% 13-week relative strength versus SPY.
A failed hold above support would weaken the setup.
Actionable but governed by invalidation levels.
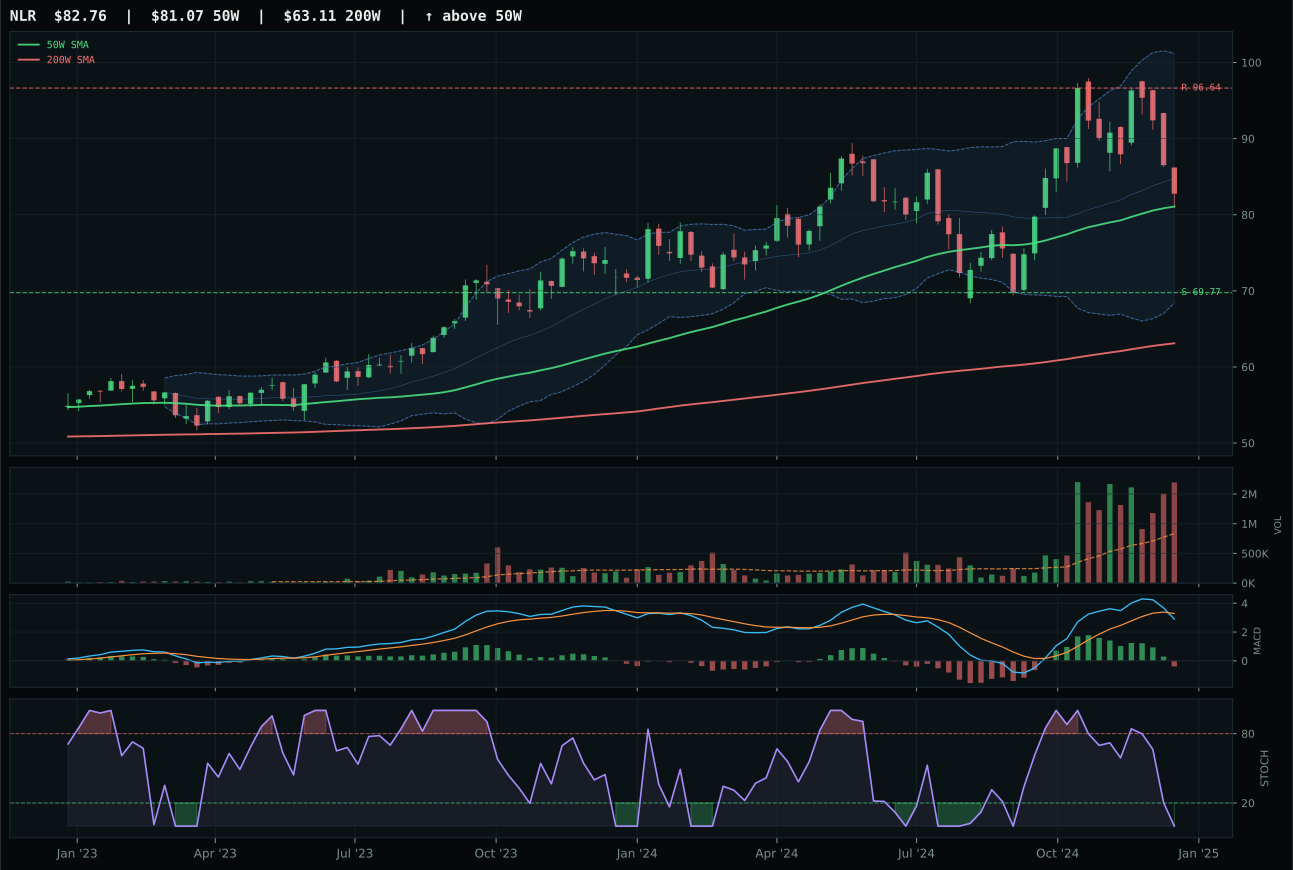
NLR has a compression near 50W profile with -0.3% 13-week relative strength versus SPY.
A failed hold above support would weaken the setup.
Actionable but governed by invalidation levels.
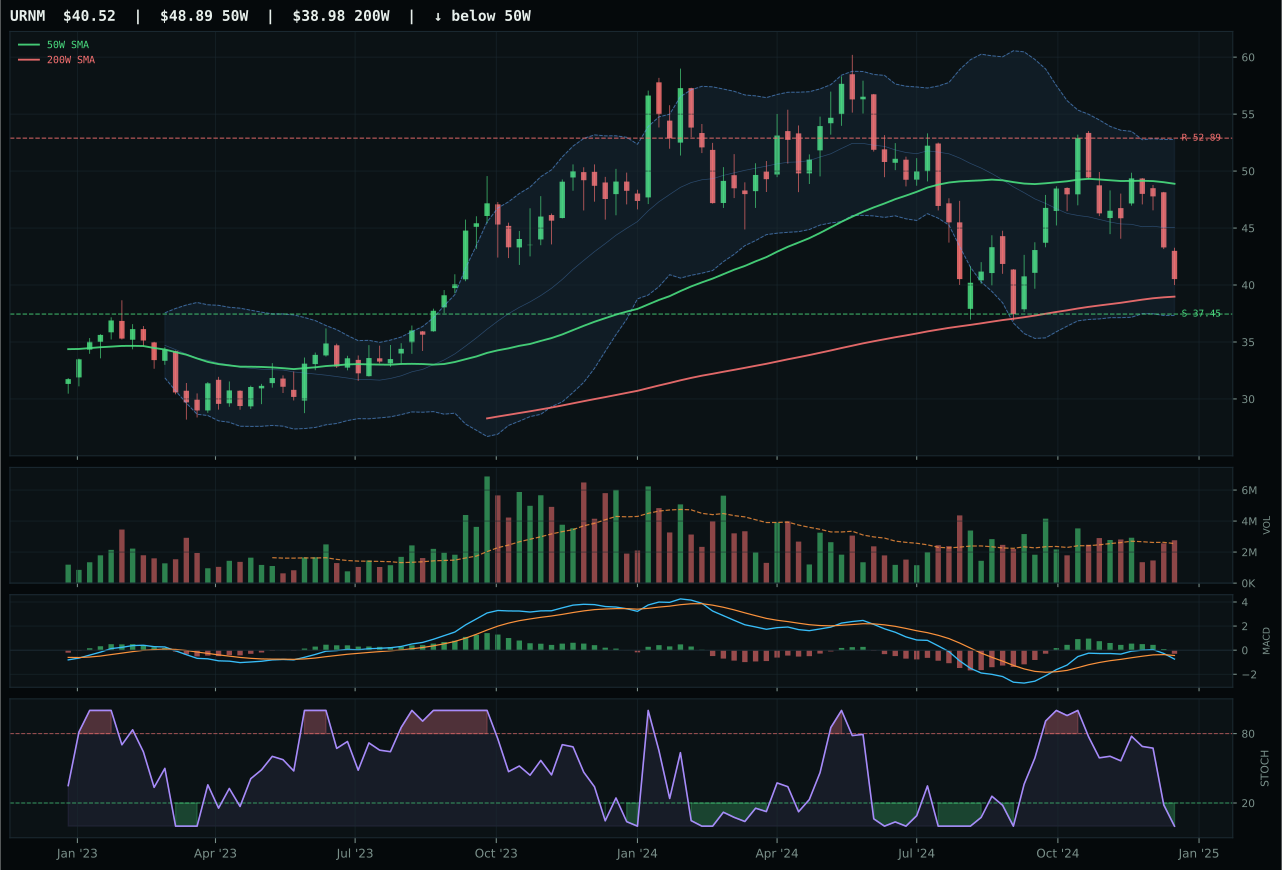
URNM has a neutral structure profile with -10.0% 13-week relative strength versus SPY.
A failed hold above support would weaken the setup.
Actionable but governed by invalidation levels.
NLR defeated URA by 13.6 points on the back of a perfect 100.0 timing score versus URA's 92.0, reflecting price compression directly at the 50-week moving average rather than 1.2% away. When an ETF is compressing within a narrow range just above its intermediate trend reference, the technical setup is maximally responsive to volume and accumulation—any genuine sponsorship will trigger expansion, and any distribution will trigger invalidation. NLR's distribution pressure at 2.03x the 20-week average volume is exactly what should appear at such a pivot: large institutions deploying capital into compression zones because they are patient enough to know that expansion follows. URA, by contrast, shows oversold stochastic RSI at the middle retracement zone with neutral volume and a -1.1% category-relative strength, which means buyers are absent and the structure is neither compelling on setup nor on ownership breadth. The trend score of 81.6 for NLR—despite price being only marginally above both key moving averages—reflects the stability of the 50W slope at 0.3% and category-neutral relative strength, which is exactly what a genuine technical transition looks like before expansion.
Nuclear Energy earned 0% allocation and complete exclusion despite a 21.1 score because the category ranks among the lowest overall, failing eligibility filters and falling outside the top-8 ranking needed for portfolio representation in the current regime. The category macro fit of 38.0/100 is neutral at best, with liquidity stress (minus 7) and credit stress (minus 5) offsetting modest support from broad market bear positioning. NLR's technical evidence of 16.8/100 is weak across trend, relative strength, and volume-price sponsorship; the only salvageable component is timing at 100.0, which reflects price compression rather than momentum buildup. The 3/2/1 weighted basket (starting at 28.9) scored 21.1 after applying macro and setup quality filters, indicating this is neither a macro-driven nor a technical-driven opportunity in the current environment. Nuclear would require a meaningful reassessment of either energy scarcity narratives or stabilization in credit conditions to earn allocation; as currently positioned, it remains outside the portfolio.
Traditional Energy — XLE
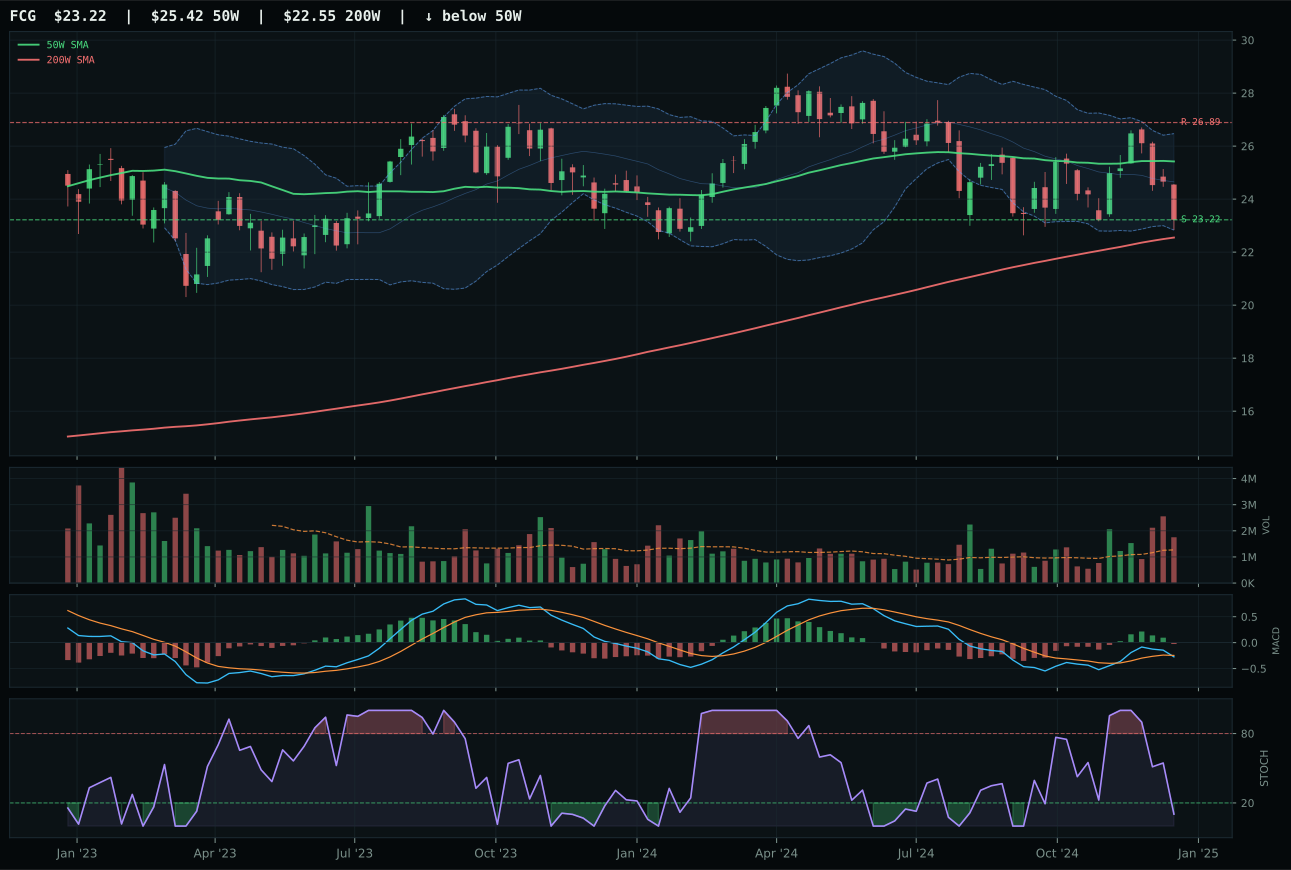
FCG has a pullback into support profile with -8.9% 13-week relative strength versus SPY.
A failed hold above support would weaken the setup.
Actionable but governed by invalidation levels.
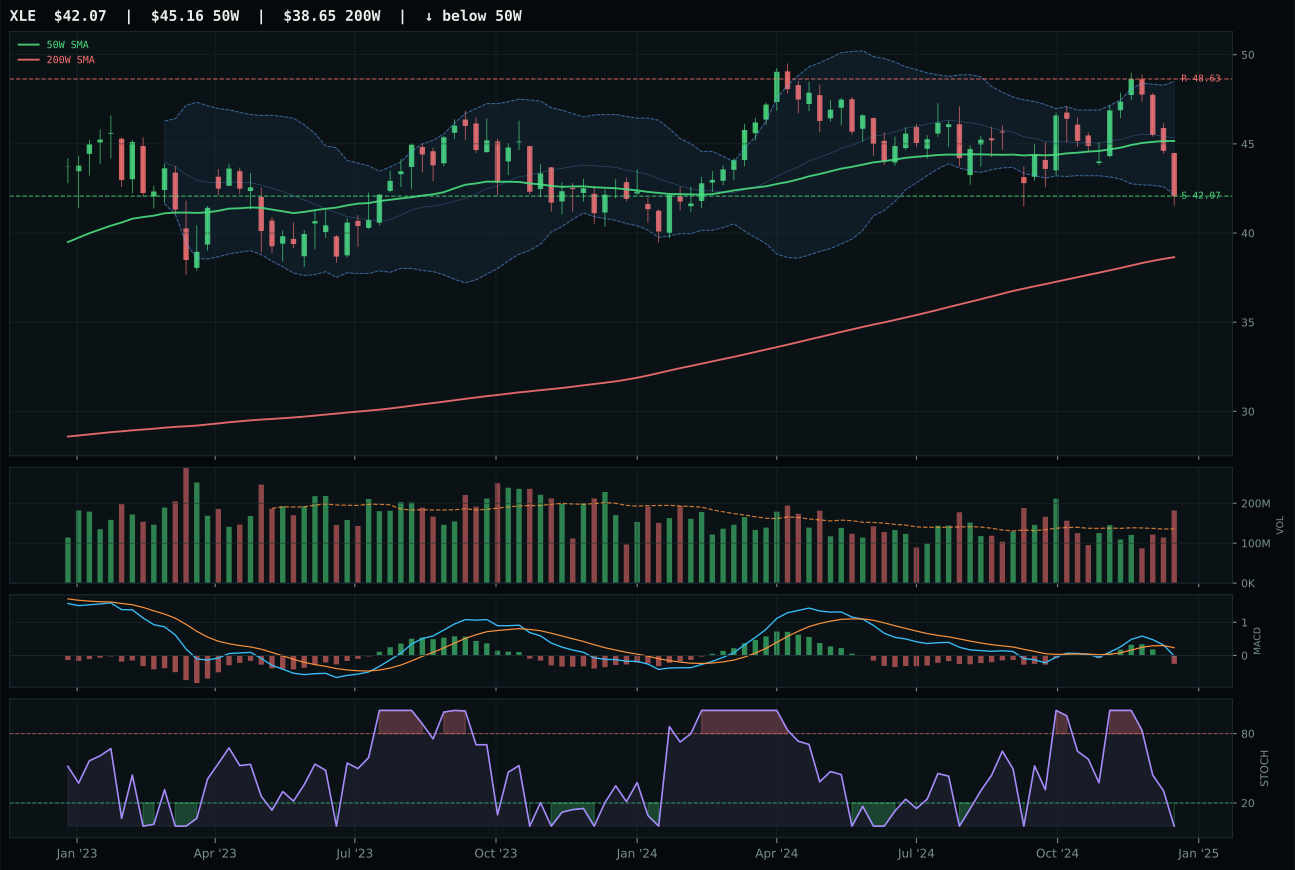
XLE has a pullback into support profile with -9.2% 13-week relative strength versus SPY.
A failed hold above support would weaken the setup.
Actionable but governed by invalidation levels.
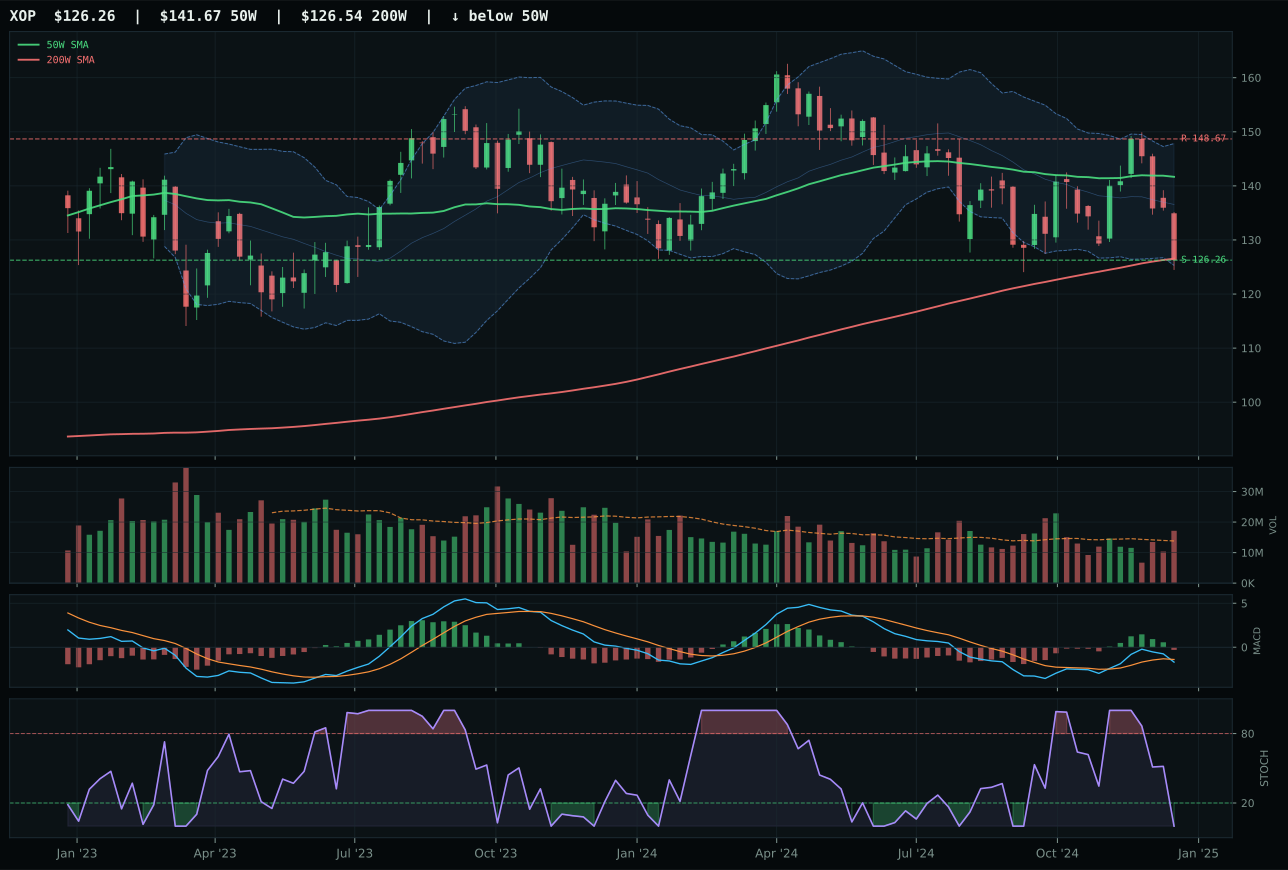
XOP has a pullback into support profile with -10.4% 13-week relative strength versus SPY.
A failed hold above support would weaken the setup.
Actionable but governed by invalidation levels.
XLE edged FCG in a near-dead heat—a 0.4-point difference—by delivering a marginally more balanced blend of trend, structure, timing, and risk/reward despite both entries being fundamentally broken. Both sit below the 50-week moving average in pullback-into-support setups at the near 52-week low Fibonacci repair zone, both show oversold stochastic RSI at 0.00, and both feature bearish weakening MACD with zero momentum confirmation. XLE's advantage comes from a neutral slope through the 50-week and a 0.0% category-relative strength versus FCG's 0.3% outperformance, which is a subtle technical differential but one that matters when both entries are genuinely weak. The timing score sits at 80.0 for both because proximity to support is correct, but the risk/reward at 75.4 for XLE versus 76.0 for FCG reveals that neither is offering compelling asymmetry—both have 13-15% downside to resistance against only 0.0% downside to support, a brutal configuration that makes entry here feel like catching a falling knife.
Traditional Energy received 0% allocation and complete exclusion from the portfolio because the category macro fit of 16.0/100 is overwhelmingly negative in a disinflation regime: disinflation pressure is active at minus 10, disinflation helps the exposure at minus 10, and credit stress adds another minus 7. The category reasoner's 3/2/1 weighted basket (starting at 23.3) is incompatible with a portfolio thesis centered on disinflation and monetary hedge positioning. XLE's technical evidence of 25.6/100 is below all other category representatives, and the momentum confirmation of 0.0 indicates that every recent seller has capitulated while no new buyer has emerged. This is not a timing call but a regime call: energy is structurally disfavored in a disinflation backdrop where real yields are under pressure and growth sensitivity is penalized. A transition toward inflation or stagflation would be required to restore energy to the allocation; absent that macro pivot, this category remains on the sidelines.