
2024-12-13
Informational purposes only. The content in this report, including allocations, analysis, and commentary, is provided solely for informational and educational purposes. It does not constitute financial advice, investment advice, trading advice, or any other type of advice. Past performance does not guarantee future results. Always conduct your own research and consult a qualified financial professional before making investment decisions.
Weekly Allocation
| Ticker | Category | Weight | Role |
|---|---|---|---|
| FBTC | 50% | Overlay | |
| CIBR | Technology | 10% | Top-2 (10%) |
| NLR | Nuclear Energy | 10% | Top-2 (10%) |
| GLD | Precious Metals | 5% | Tier-2 (5%) |
| AIQ | AI | 5% | Tier-2 (5%) |
| XAR | Defense & Aerospace | 5% | Tier-2 (5%) |
| IGF | Utilities & Infrastructure | 5% | Tier-2 (5%) |
| MOO | Agriculture & Livestock | 5% | Tier-2 (5%) |
| COPX | Industrial Metals | 5% | Tier-2 (5%) |
Trade Instructions — Monday Open
Sell the tranche from 2024-11-15 (completing its 4-week hold). Buy the new tranche. Instructions show net portfolio changes — same-asset positions cancel, weight changes show the delta.
| Action | Ticker | Instruction |
|---|---|---|
| SELL | PAVE | Sell 40% of PAVE position (reduce 6.25% → 3.75%) |
| SELL | URA | Sell 33% of URA position (reduce 7.50% → 5.00%) |
| SELL | XLE | Sell 25% of XLE position (reduce 5.00% → 3.75%) |
| SELL | IGV | Sell 20% of IGV position (reduce 6.25% → 5.00%) |
| BUY | AIQ | Buy AIQ — 16.67% of freed cash (adds 1.25% to portfolio) |
| BUY | IGF | Buy IGF — 16.67% of freed cash (adds 1.25% to portfolio) |
| BUY | CIBR | Buy CIBR — 33.33% of freed cash (adds 2.50% to portfolio) |
| BUY | NLR | Buy NLR — 33.33% of freed cash (adds 2.50% to portfolio) |
Current Portfolio After Trade
Combined holdings across all 4 active tranches. Each tranche is 25% of the portfolio.
| Ticker | % of Portfolio | Weight Bar |
|---|---|---|
| FBTC | 50.00% | |
| XAR | 6.25% | |
| URA | 5.00% | |
| GLD | 5.00% | |
| IGV | 5.00% | |
| COPX | 5.00% | |
| XLE | 3.75% | |
| AIQ | 3.75% | |
| PAVE | 3.75% | |
| URNM | 2.50% | |
| IGF | 2.50% | |
| CIBR | 2.50% | |
| NLR | 2.50% | |
| BOTZ | 1.25% | |
| MOO | 1.25% |
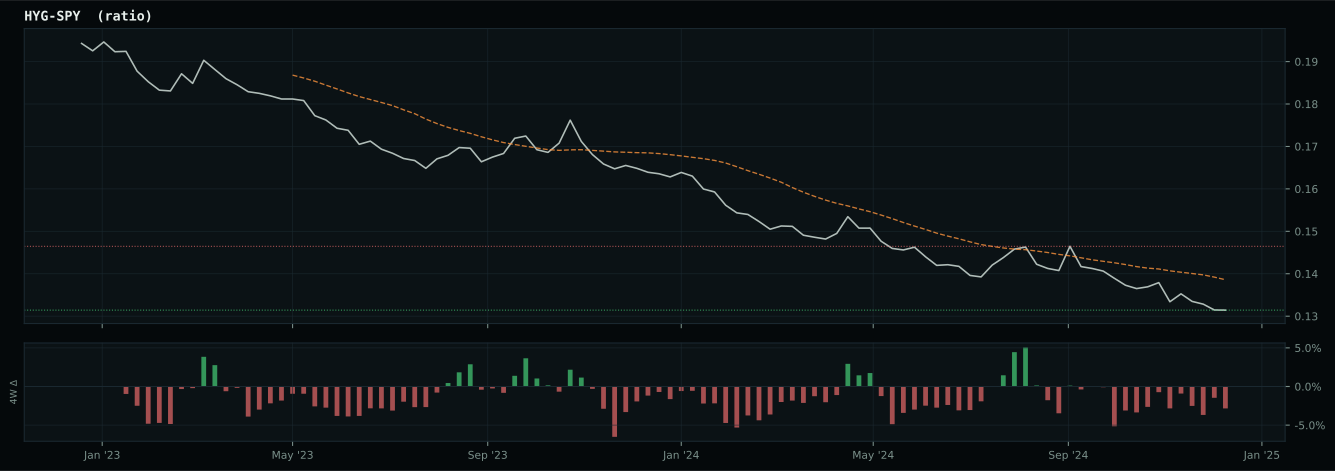
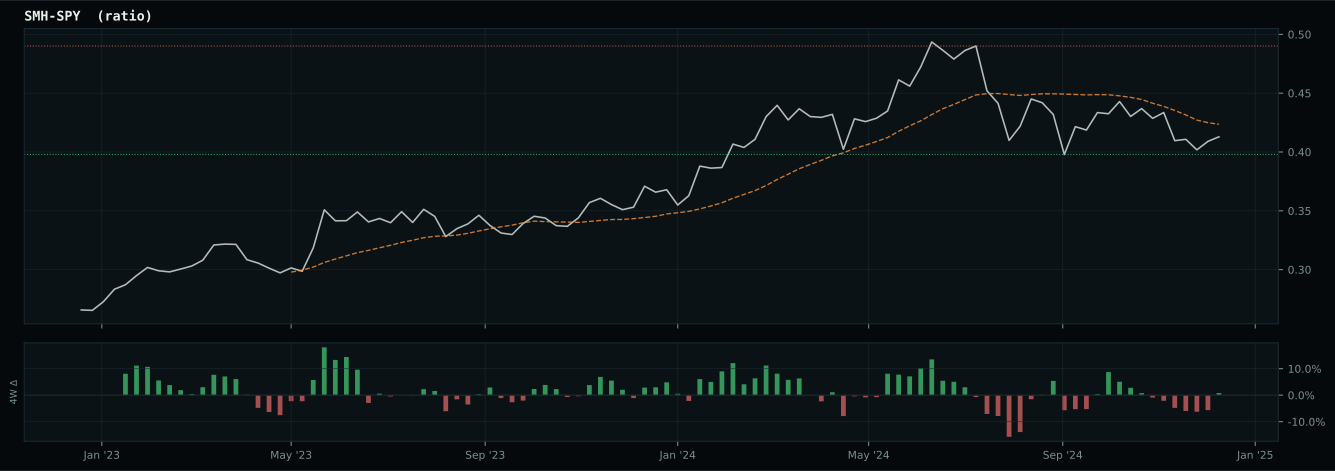
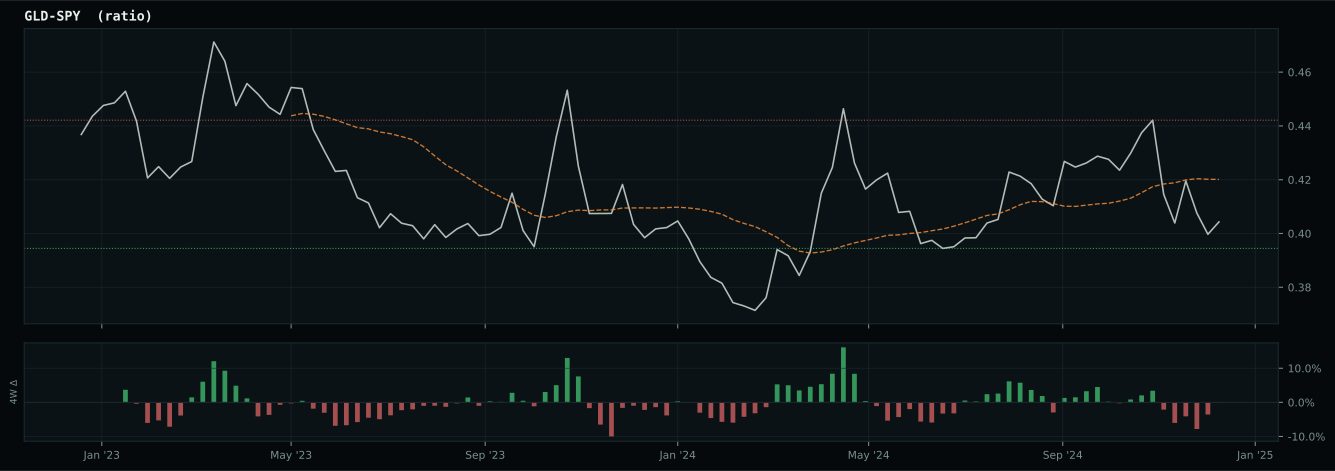
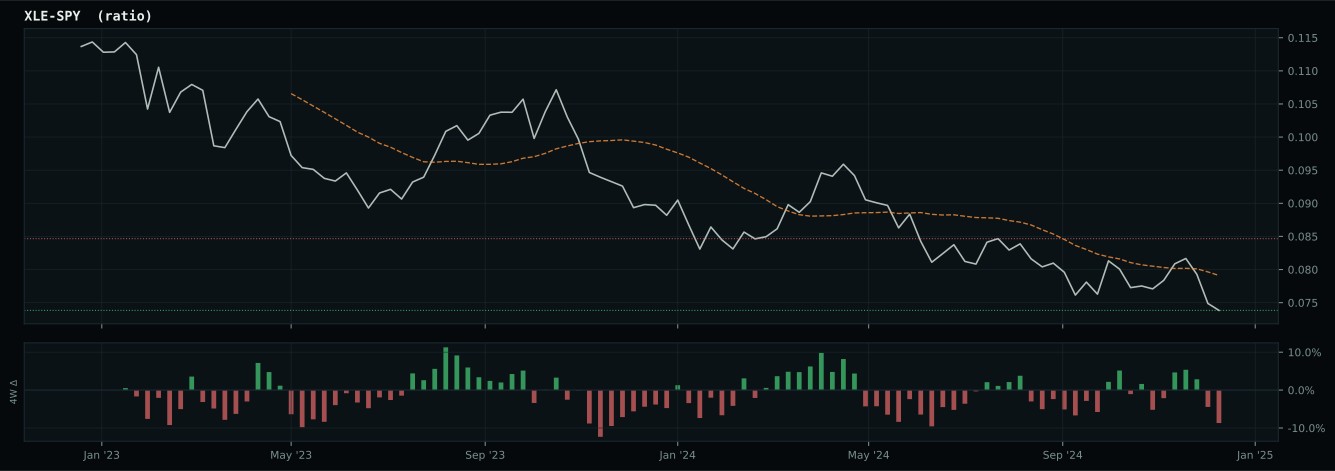
Macro Regime — Disinflation
Macro Evidence Charts
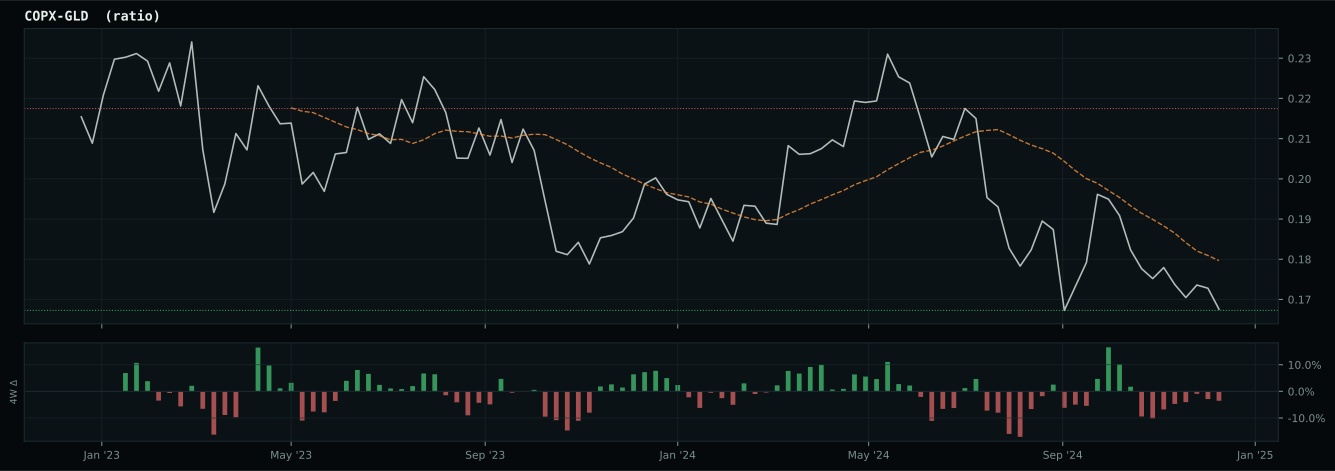
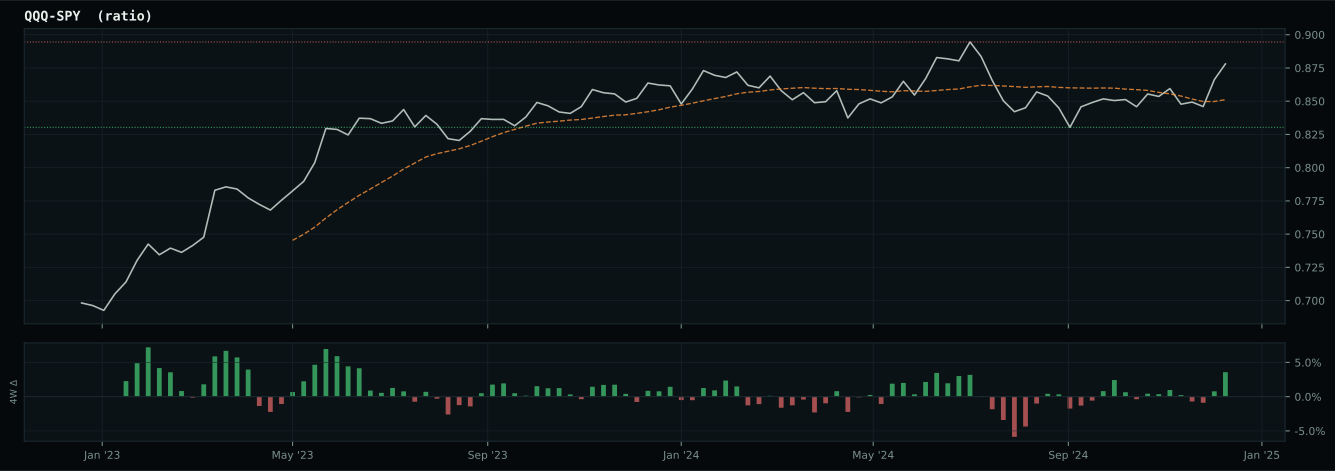
Market-implied signals behind the macro regime scores. Each ratio compares two assets; the direction and slope of the ratio is what the macro engine reads.
Crypto Regime — TrendBTC
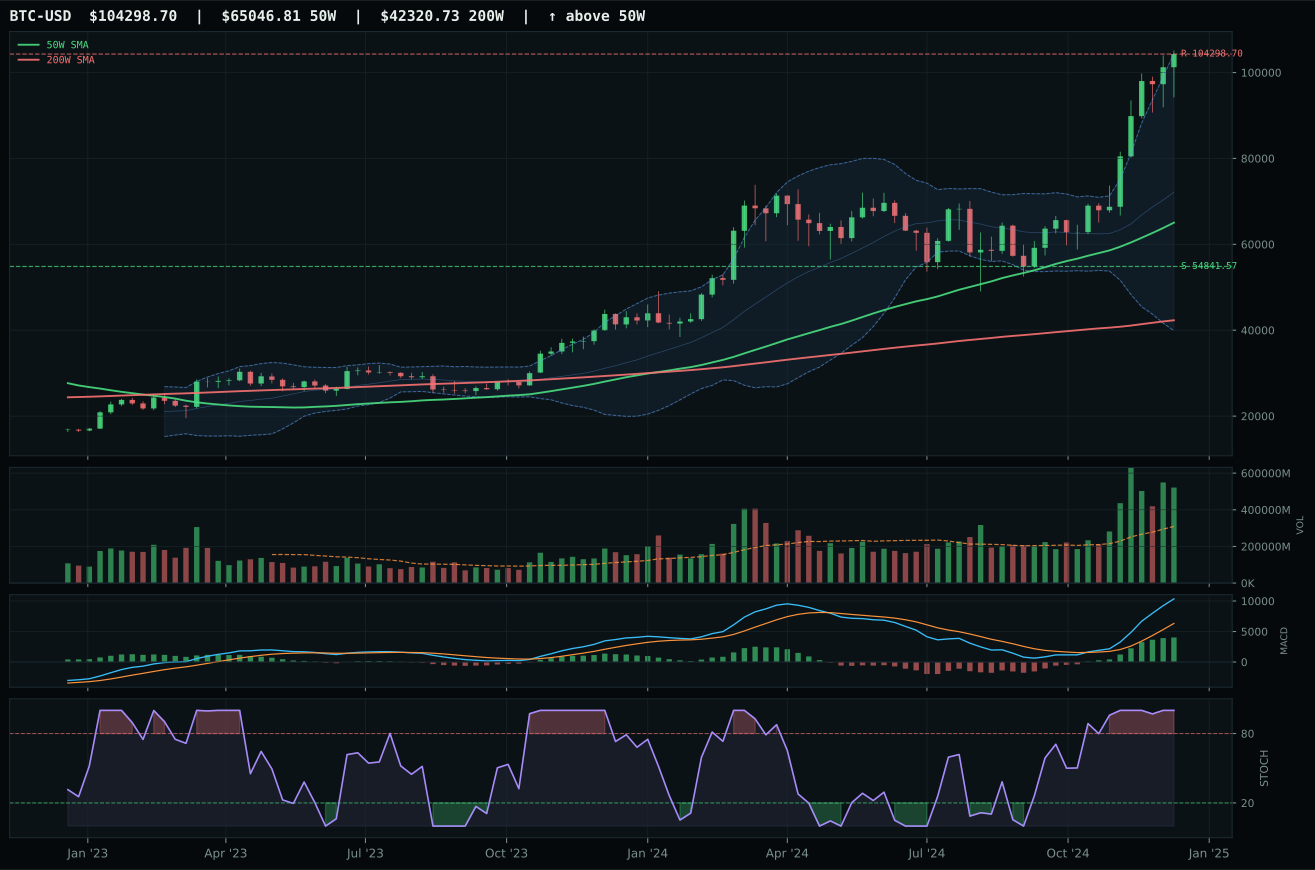
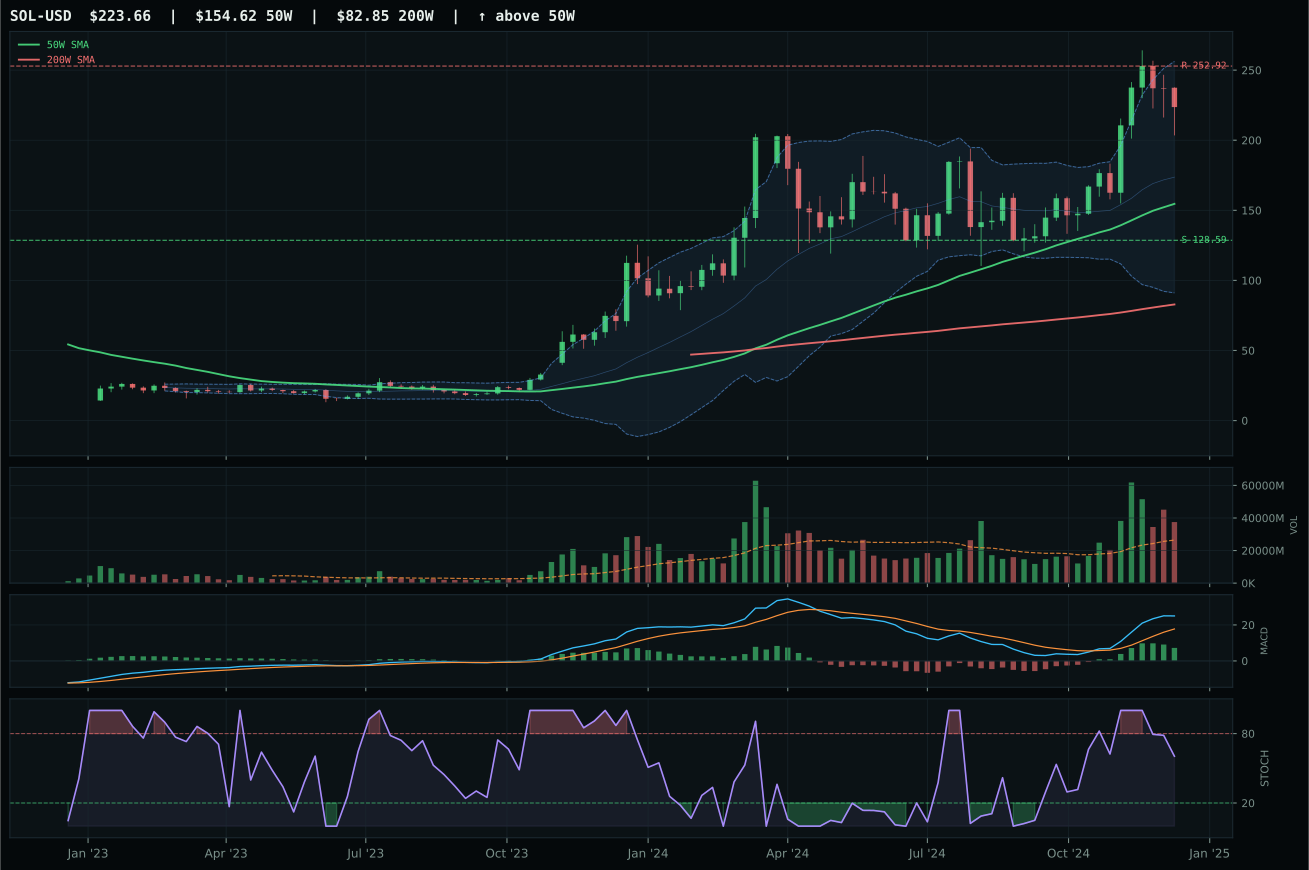
ValueBTC not armed: BTC has not made the first post-breakdown touch of the 200W buy zone after losing the 50W
TrendBTC confirmed: 2 consecutive closes above rising/flat 50W SMA
one or more available conditions failed
Category Rankings
| Rank | Category | Winner | Score | Alloc | 4W Ret | Peers (4W) |
|---|---|---|---|---|---|---|
| 1 | Technology | CIBR | 60.6 | 20% | -4.60% | IGV -9.4% · XLK -6.0% |
| 2 | Nuclear Energy | NLR | 50.9 | 20% | -2.32% | URA -7.6% · URNM -6.0% |
| 3 | Precious Metals | GLD | 47.6 | 10% | +0.38% | SLV -3.3% · GDX -3.3% |
| 4 | AI | AIQ | 46.0 | 10% | -6.28% | BOTZ -5.8% · SMH -3.8% |
| 5 | Defense & Aerospace | XAR | 43.9 | 10% | -2.64% | ROKT -2.5% · ITA -3.1% |
| 6 | Utilities & Infrastructure | IGF | 43.6 | 10% | -2.84% | PAVE -7.8% · XLU -2.8% |
| 7 | Traditional Energy | XLE | 22.6 | 10% | -0.20% | FCG +6.3% · XOP +4.0% |
| 8 | Emerging Markets | IEMG | 5.2 | 10% | -7.79% | INDA -9.3% · ILF -9.3% |
| 9 | Agriculture & Livestock | MOO | — | 0% | -8.21% | VEGI -7.4% · WEAT -2.7% |
| 10 | Industrial Metals | COPX | — | 0% | -4.40% | REMX -4.5% · PICK -8.5% |
Technology — CIBR
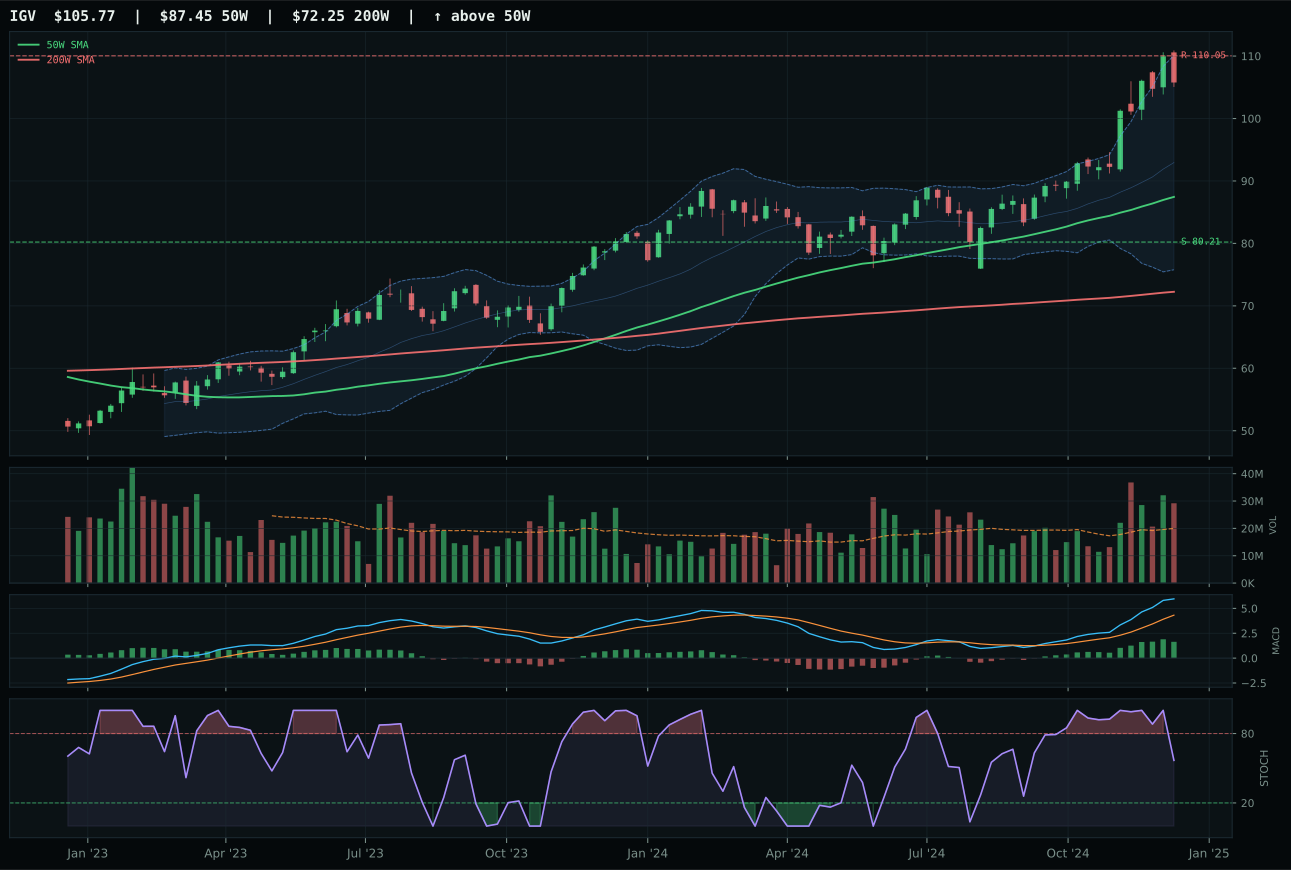
IGV has a vertical extension profile with 13.6% 13-week relative strength versus SPY.
A failed hold above support would weaken the setup.
Actionable but governed by invalidation levels.
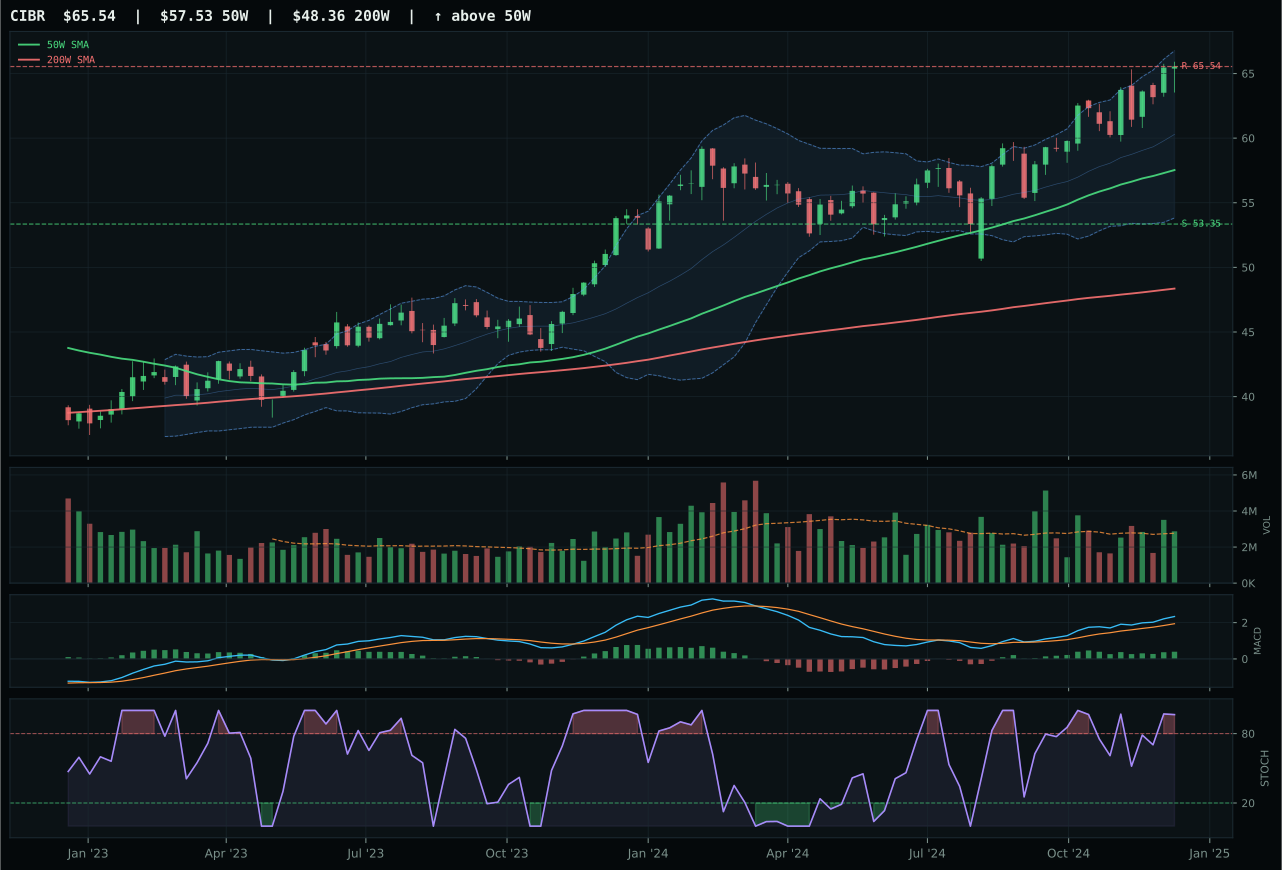
CIBR has a neutral structure profile with 5.5% 13-week relative strength versus SPY.
A failed hold above support would weaken the setup.
Actionable but governed by invalidation levels.
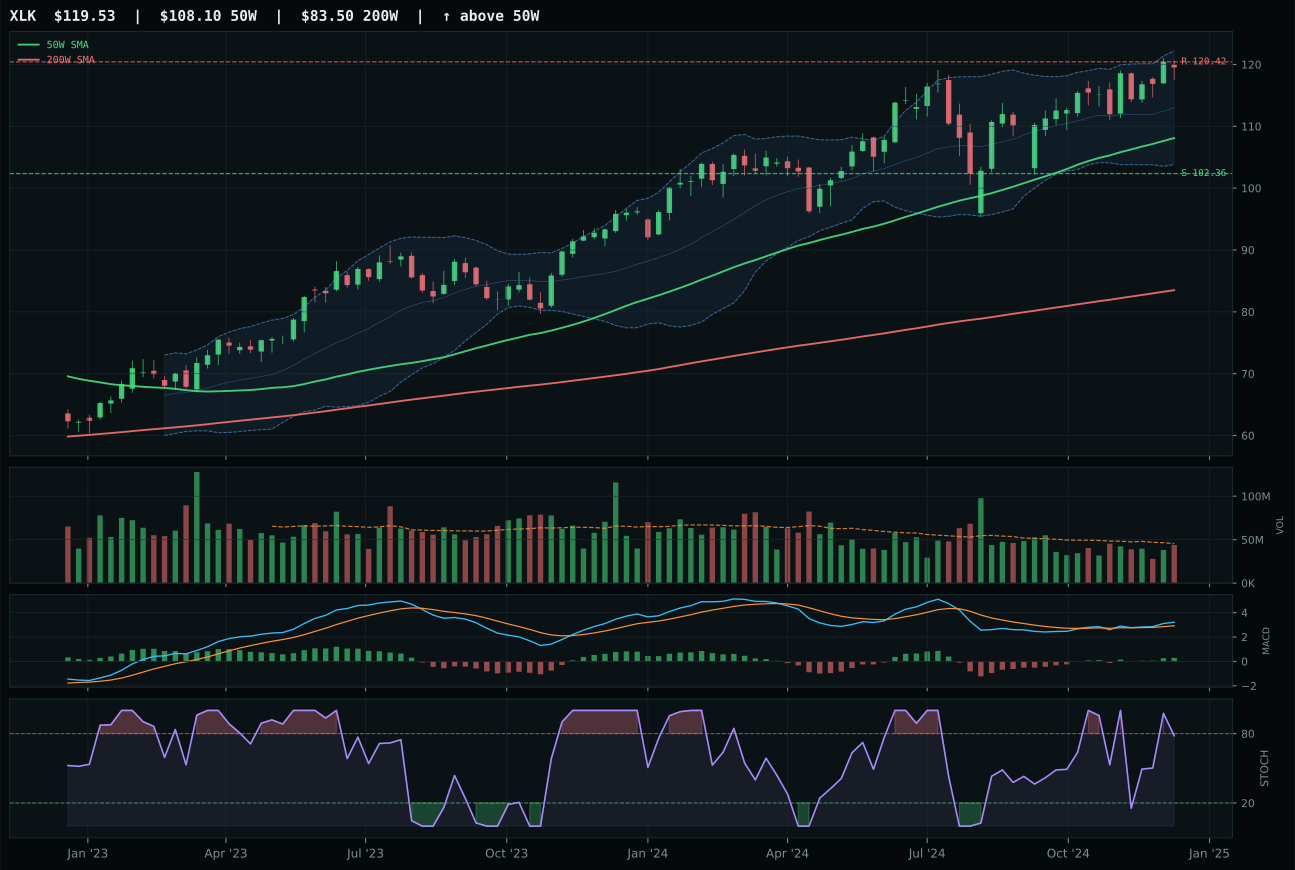
XLK has a neutral structure profile with 0.9% 13-week relative strength versus SPY.
A failed hold above support would weaken the setup.
Actionable but governed by invalidation levels.
CIBR wins the category with a 60.6 final score because its chart structure balances trend confirmation with entry discipline—price sits 13.9% above the 50-week moving average rather than extended, and stochastic RSI overbought momentum paired with a bullish but stable MACD tells us new accumulation is still occurring even as we're past the breakout phase. The 5.5% relative strength advantage over SPY combined with neutral volume participation (1.04x 20-week average) means the move is being adopted by institutional capital without the panic-buying that kills risk/reward. IGV, the runner-up, shows superior 13-week performance (21.1% vs 13.1%) and stronger SPY outperformance (13.6% vs 5.5%), but its 20.9% extension from the 50-week and falling stochastic RSI momentum revealed timing had already shifted—it was 6 points weaker on the timing score (53 vs 59) because the chart had moved too far ahead of its own oscillators. CIBR's neutral setup offered better entry geometry with the same bullish directionality.
Technology earned 10% allocation as one of two top-ranked categories this week, justified by CIBR's combination of intact uptrend mechanics and category-relative sponsorship in a disinflation macro backdrop. The category-level macro fit scored 40.0/100—disinflation helps the soft-software narrative (+7), but liquidity stress and credit stress headwinds (-10 and -7 respectively) prevent this from being a screaming buy. That tension is precisely why the 62/38 weighting favors technical evidence: in a tightening liquidity environment, only the cleanest technicals survive, and CIBR's near-support positioning and volume confirmation made it the category representative. Two factors hold Technology back from ranking even higher: broad market bear is active (+4 support) and credit stress remains a drag on growth multiples, meaning any pause in trend could accelerate drawdowns. If credit stress eases and momentum stays persistent, this category could push higher into the allocation hierarchy; for now, 10% represents appropriate conviction for a technically sound but macro-constrained position.
Nuclear Energy — NLR
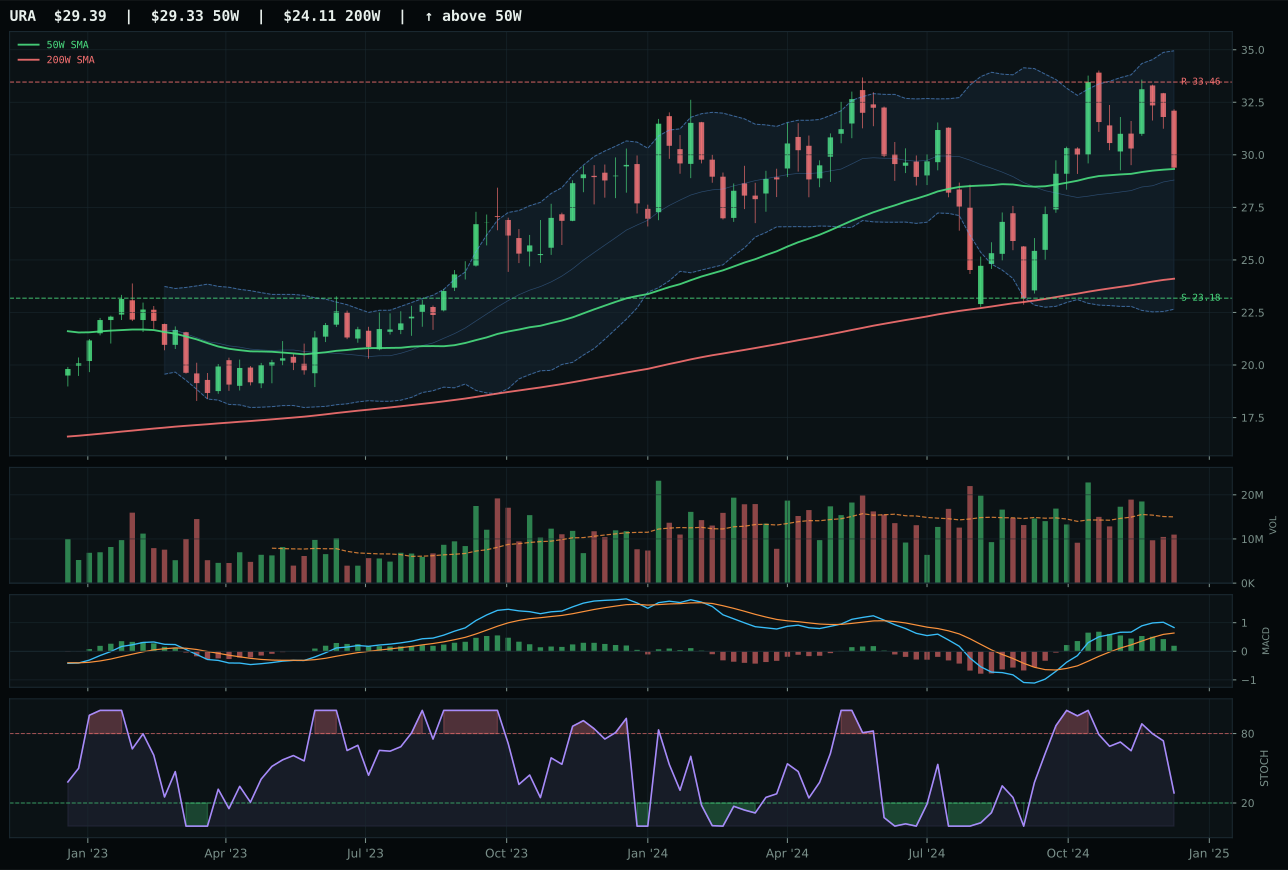
URA has a compression near 50W profile with 8.1% 13-week relative strength versus SPY.
A failed hold above support would weaken the setup.
Actionable but governed by invalidation levels.
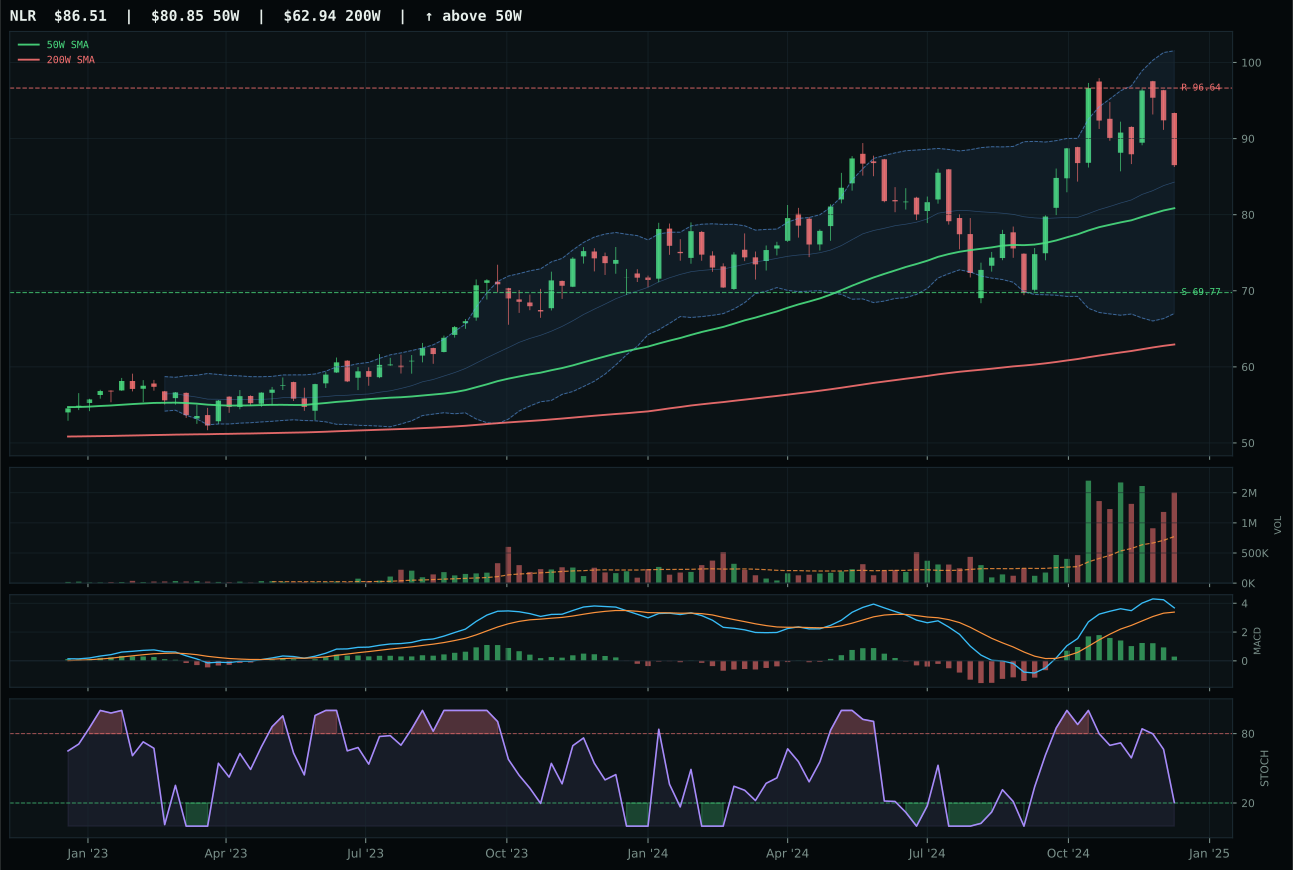
NLR has a neutral structure profile with 8.1% 13-week relative strength versus SPY.
A failed hold above support would weaken the setup.
Actionable but governed by invalidation levels.
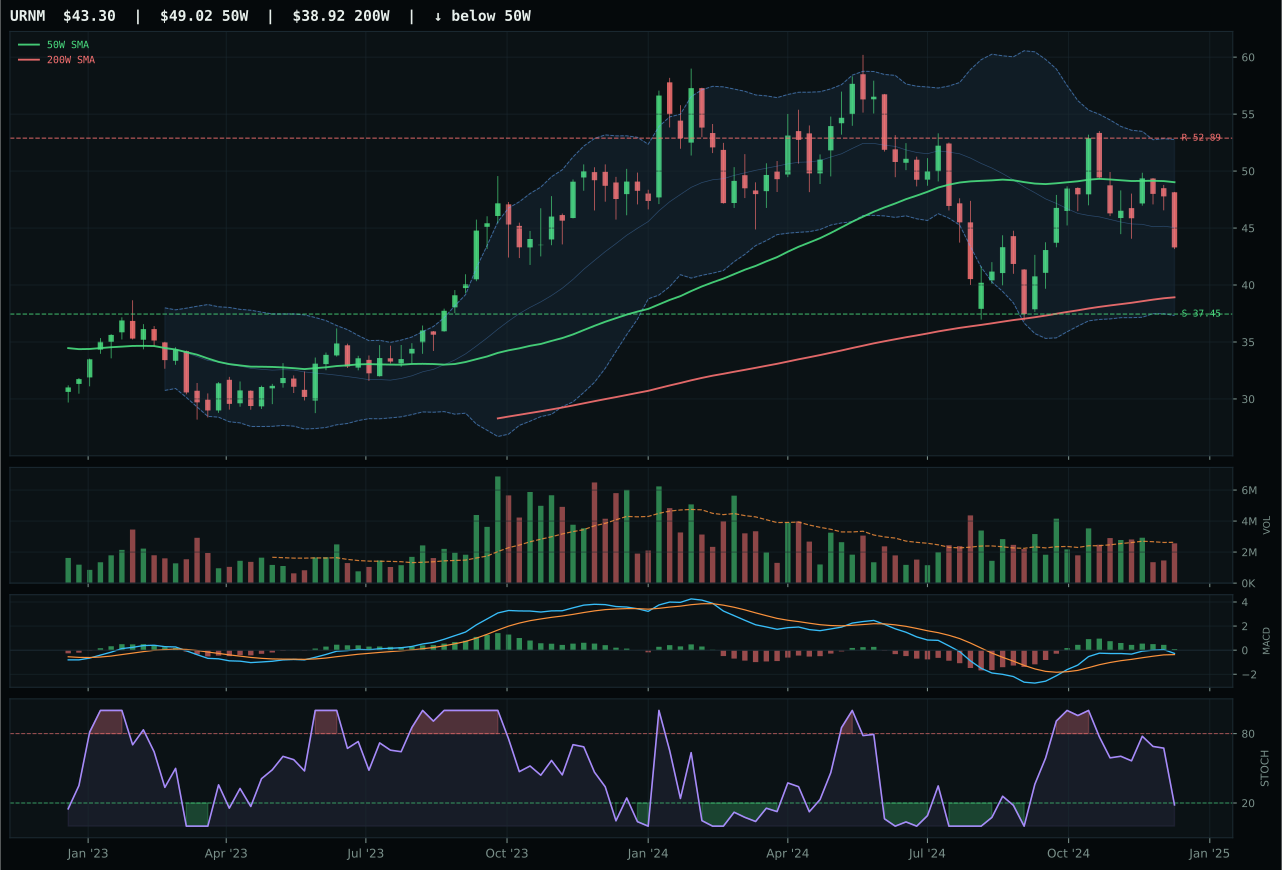
URNM has a neutral structure profile with -1.3% 13-week relative strength versus SPY.
A failed hold above support would weaken the setup.
Actionable but governed by invalidation levels.
NLR wins with a 50.9 score and top-2 allocation because its 100/100 trend score (price above both 50W and 200W, 0.4% positive slope, 8.1% SPY outperformance) combines with strong macro narrative tailwind (energy scarcity +6, broad market bear +3) to create conviction despite distribution pressure in the volume profile. NLR sits only 7.0% above the 50-week in the Fib 0.382 decision zone—not extended—and its 15.6% 13-week return represents real accumulation, not price-chasing. The stochastic RSI is falling/neutral at 0.20, meaning the MACD bullish-but-flattening signal is under scrutiny but not broken; the chart remains valid even as momentum eases. URA, the runner-up, scored higher on composite technical evidence (85 vs 78) and timing (100 vs 77), but NLR won because risk/reward favored the portfolio's need: URA's 46.2 risk/reward left less margin than NLR's 52.9, and URA's compression-near-50W setup required perfect timing whereas NLR's neutral structure offered more forgiveness. Category-relative strength essentially tied (0.1% vs 0.0%), so the decision hinged on risk geometry and macro sponsorship.
Precious Metals — GLD
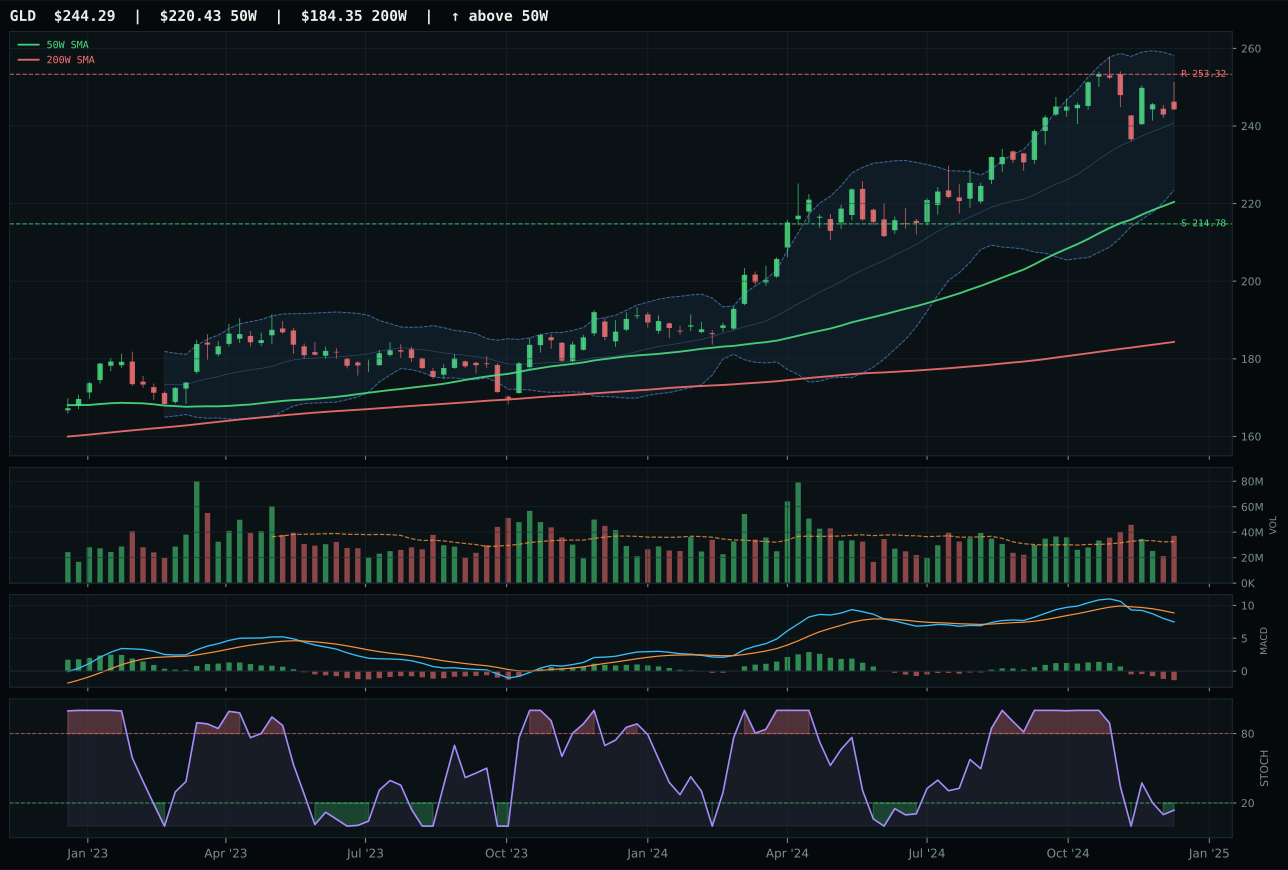
GLD has a neutral structure profile with -5.2% 13-week relative strength versus SPY.
A failed hold above support would weaken the setup.
Actionable but governed by invalidation levels.
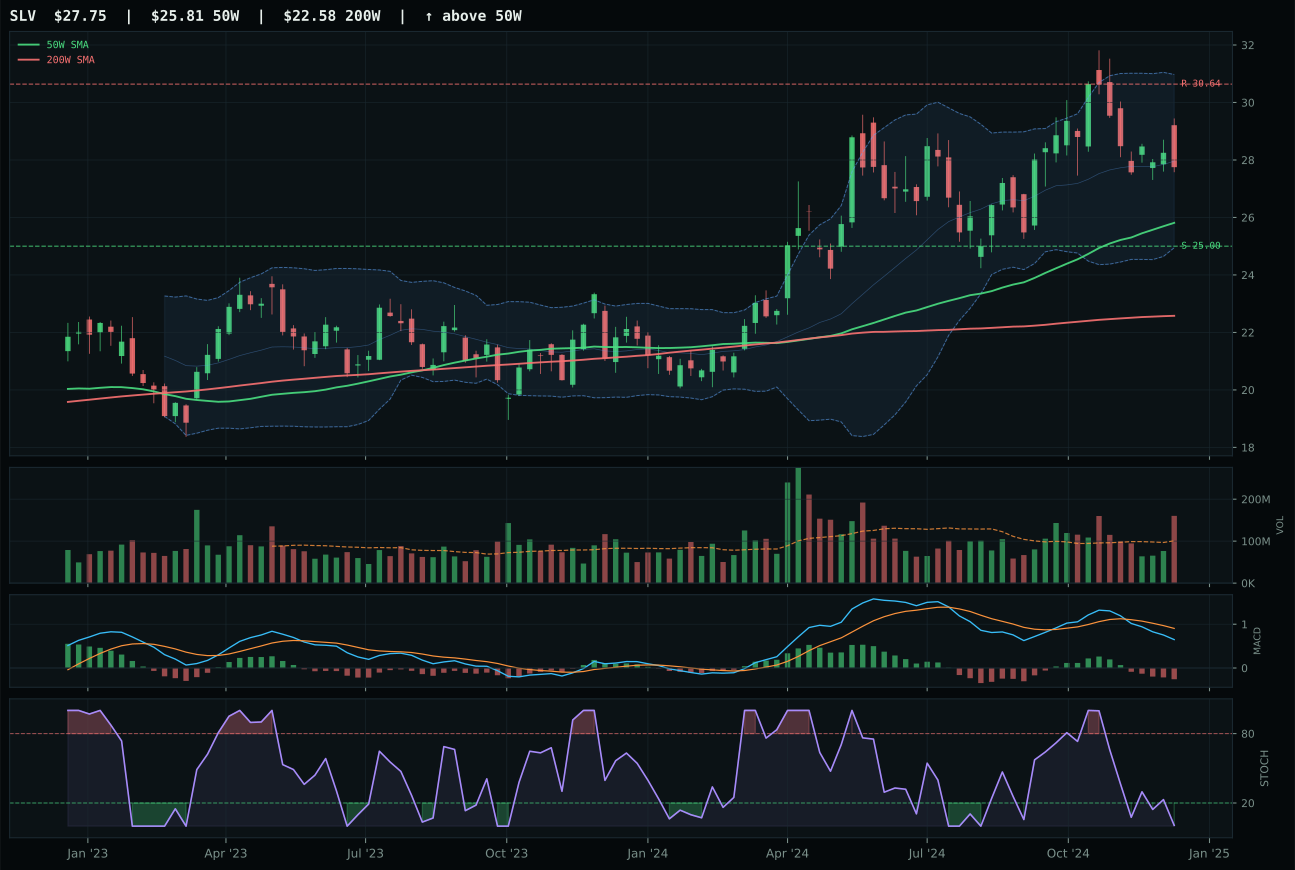
SLV has a neutral structure profile with -8.5% 13-week relative strength versus SPY.
A failed hold above support would weaken the setup.
Actionable but governed by invalidation levels.
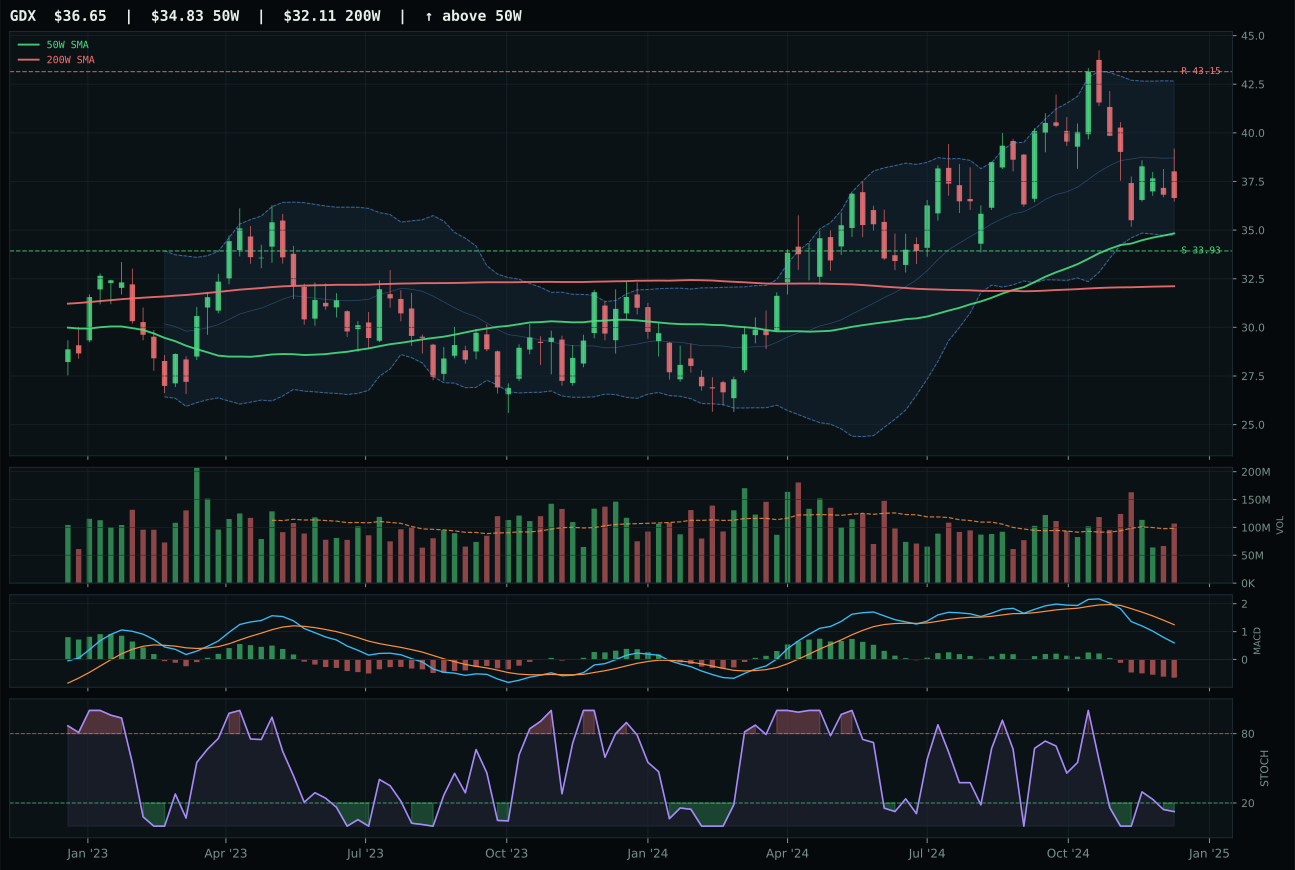
GDX has a neutral structure profile with -16.1% 13-week relative strength versus SPY.
A failed hold above support would weaken the setup.
Actionable but governed by invalidation levels.
GLD wins with a 47.6 score because its macro narrative tailwind and structural cleanliness dominate SLV's weakness. Gold sits 10.8% above the 50-week in neutral structure with above-average volume participation (1.14x), and critically, the category macro fit is 81.0/100—the highest in the portfolio—because the monetary hedge bid is active (+14) and disinflation helps (+8). SLV lost on three counts: structure is objectively weaker (64.2 vs 75.4), volume shows distribution pressure rather than absorption, and category-relative strength lags (0% vs 3.3%). GLD's 74/100 trend score despite -5.2% SPY underperformance tells you the chart is stable; MACD is weakening but stochastic RSI oversold creates a reversal flag. In a macro where monetary hedge demand is live and credit stress is real, GLD's technical stability combined with its pure-gold narrative makes it the right vehicle. SLV's industrial-hybrid character and weaker volume made it vulnerable in this regime.
AI — AIQ
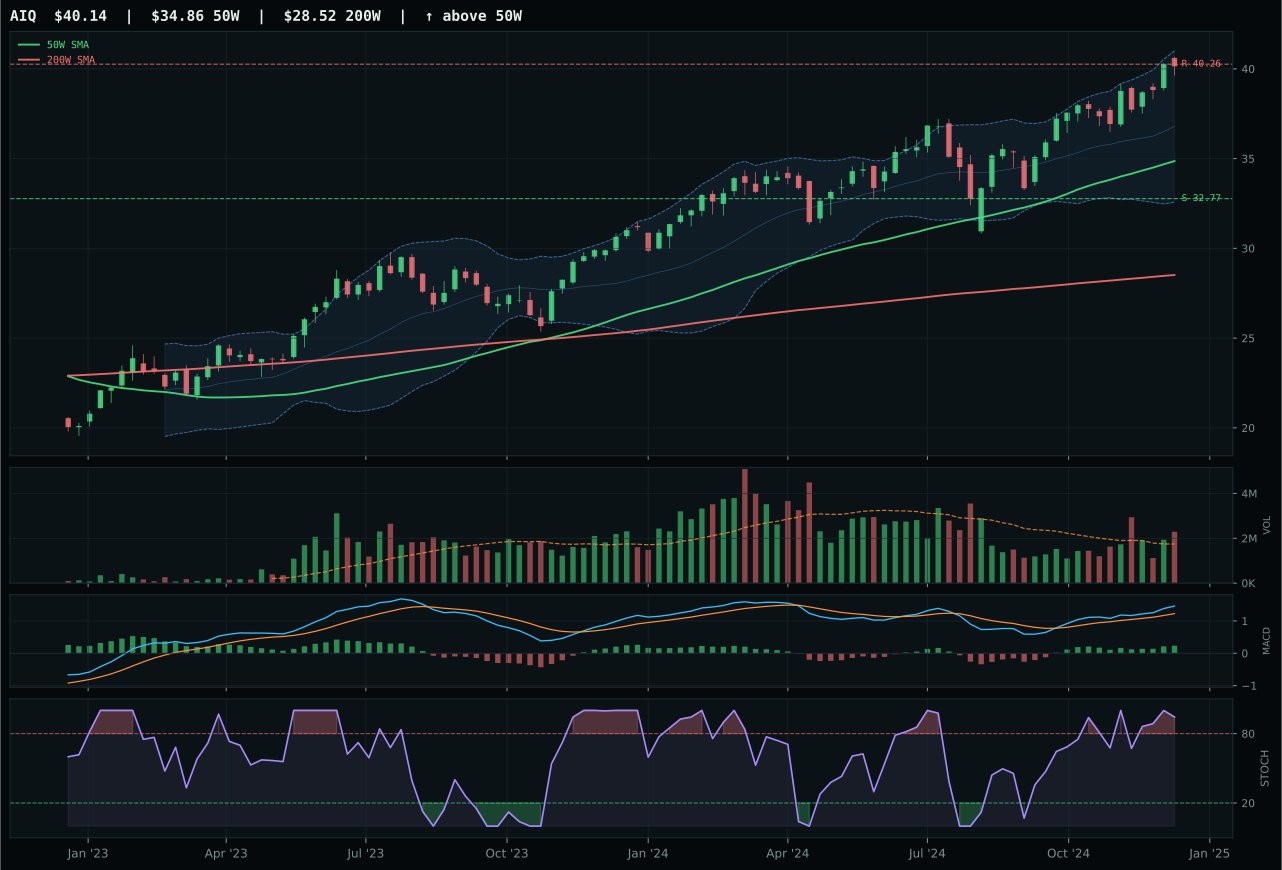
AIQ has a vertical extension profile with 6.9% 13-week relative strength versus SPY.
A failed hold above support would weaken the setup.
Actionable but governed by invalidation levels.
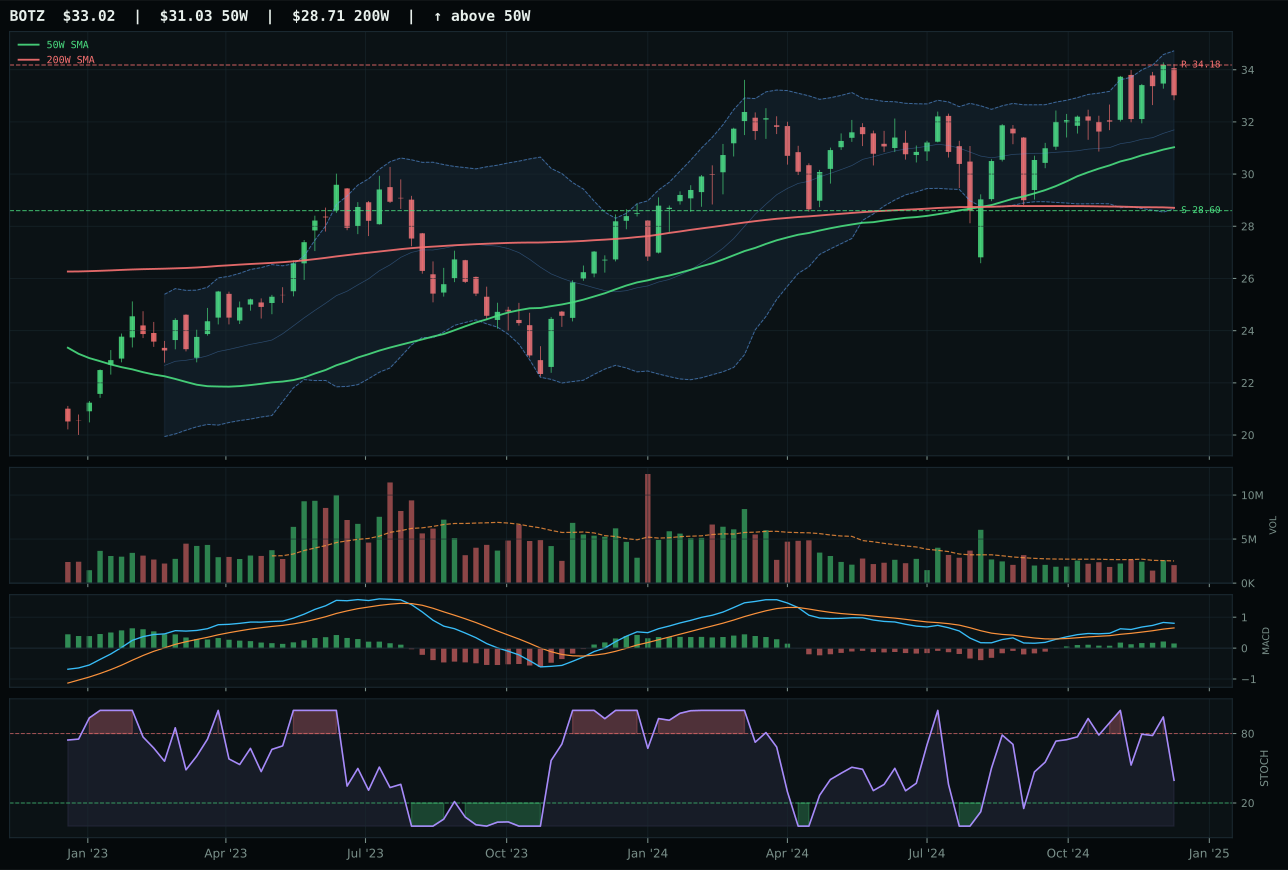
BOTZ has a neutral structure profile with 0.6% 13-week relative strength versus SPY.
A failed hold above support would weaken the setup.
Actionable but governed by invalidation levels.
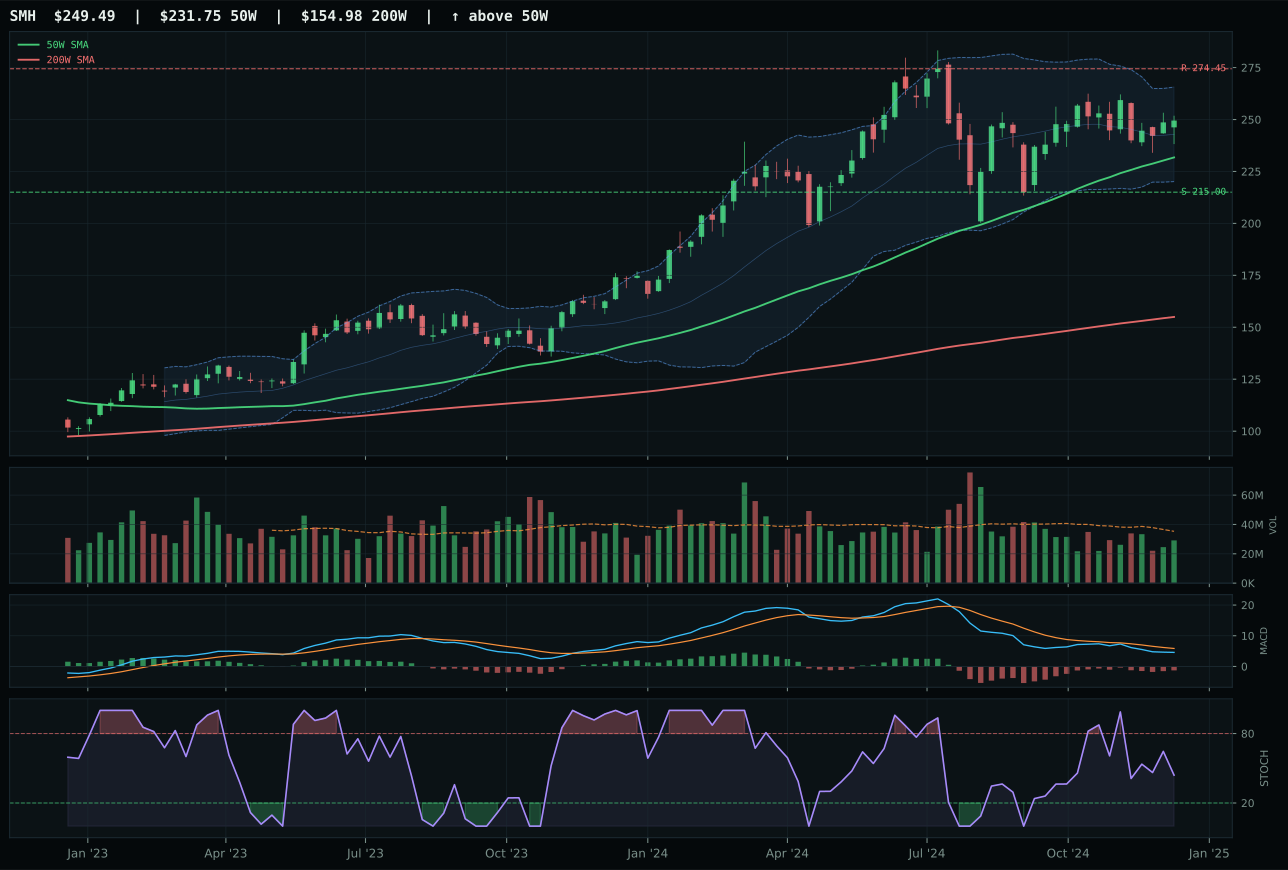
SMH has a neutral structure profile with -2.2% 13-week relative strength versus SPY.
A failed hold above support would weaken the setup.
Actionable but governed by invalidation levels.
AIQ wins with a 46.0 final score as the best-positioned entry point in a category held back by poor macro conditions and extended valuations. Price sits 15.1% above the 50-week moving average—a vertical-extension setup—but AIQ's 6.9% SPY outperformance and 6.3% outperformance versus the category median (BOTZ and SMH) proves the move is leadership-driven rather than panic-chasing. Above-average volume participation (1.32x 20-week average) confirms accumulation, and momentum is perfect: 14.4% 13-week return, 100/100 momentum confirmation score, bullish improving MACD. BOTZ lost because despite a respectable 75% composite score, it dragged on three counts—cleaner structure (74.2 vs 77.7), weaker volume (neutral vs above-average), and zero category-relative strength (0% vs 6.3%). This matters in a liquidityconstrained macro: weak breadth sponsors mean fewer hands willing to carry the weight on the next dip. AIQ's distributed buyer base offers better downside protection.
Defense & Aerospace — XAR
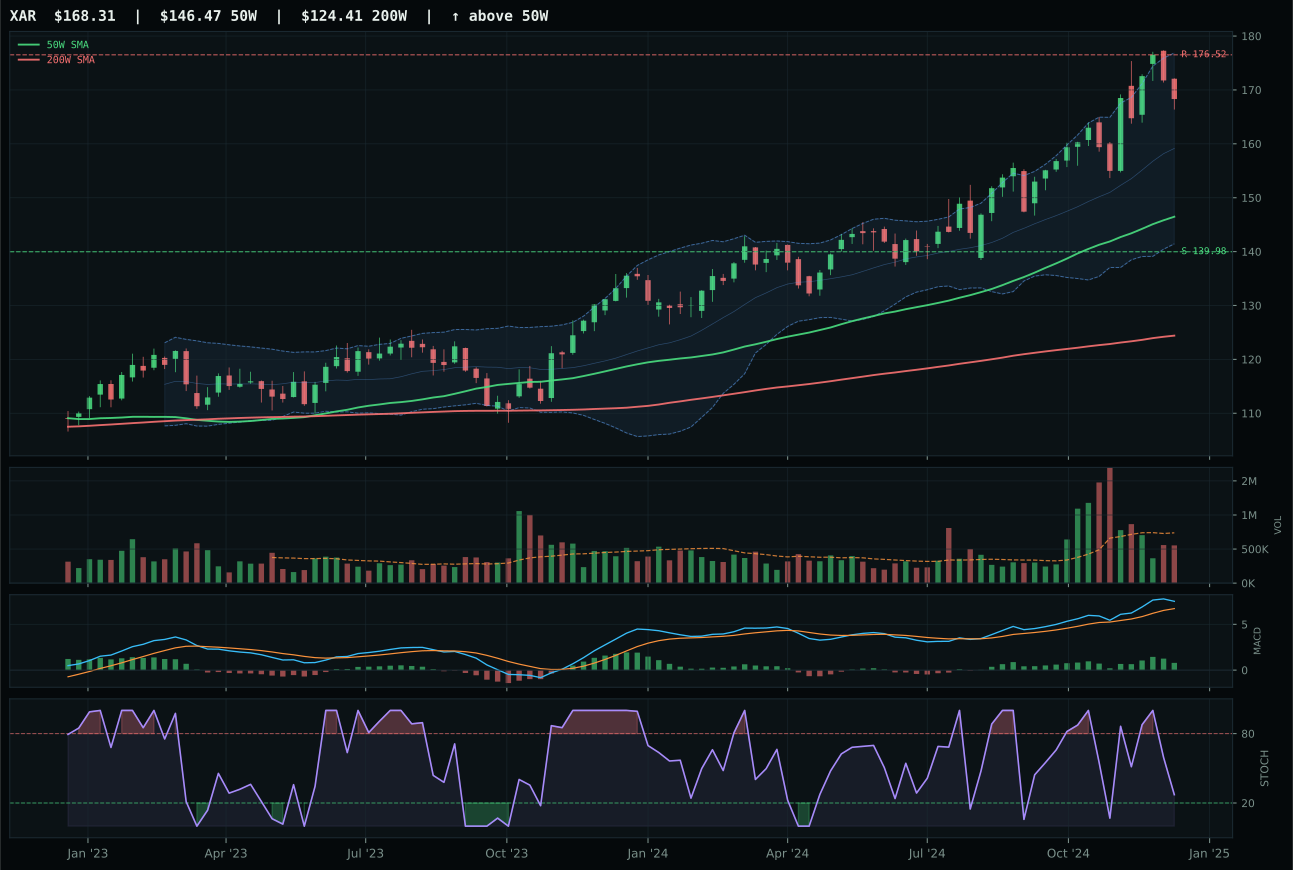
XAR has a neutral structure profile with 2.5% 13-week relative strength versus SPY.
A failed hold above support would weaken the setup.
Actionable but governed by invalidation levels.
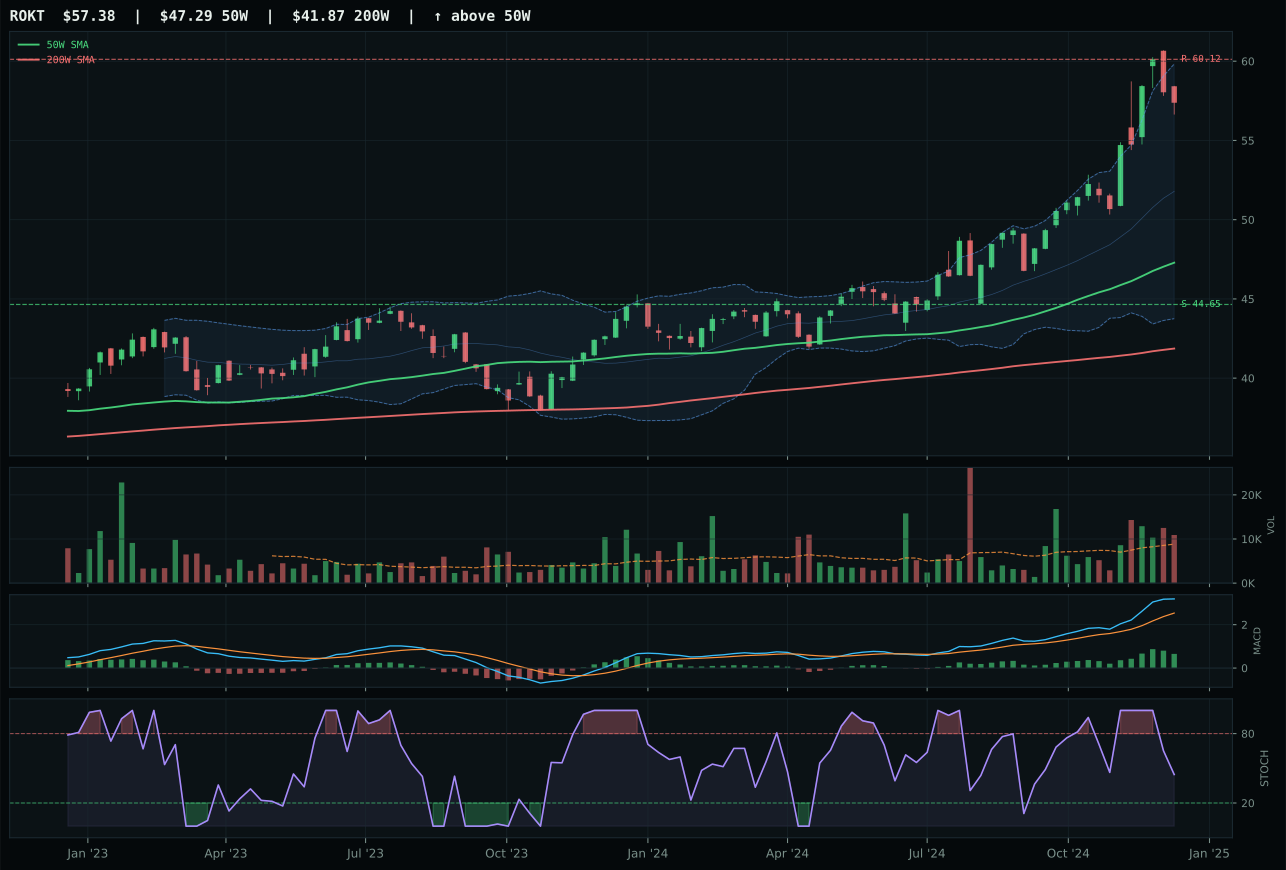
ROKT has a vertical extension profile with 11.6% 13-week relative strength versus SPY.
A failed hold above support would weaken the setup.
Tracked, but not top-2 eligible because: .
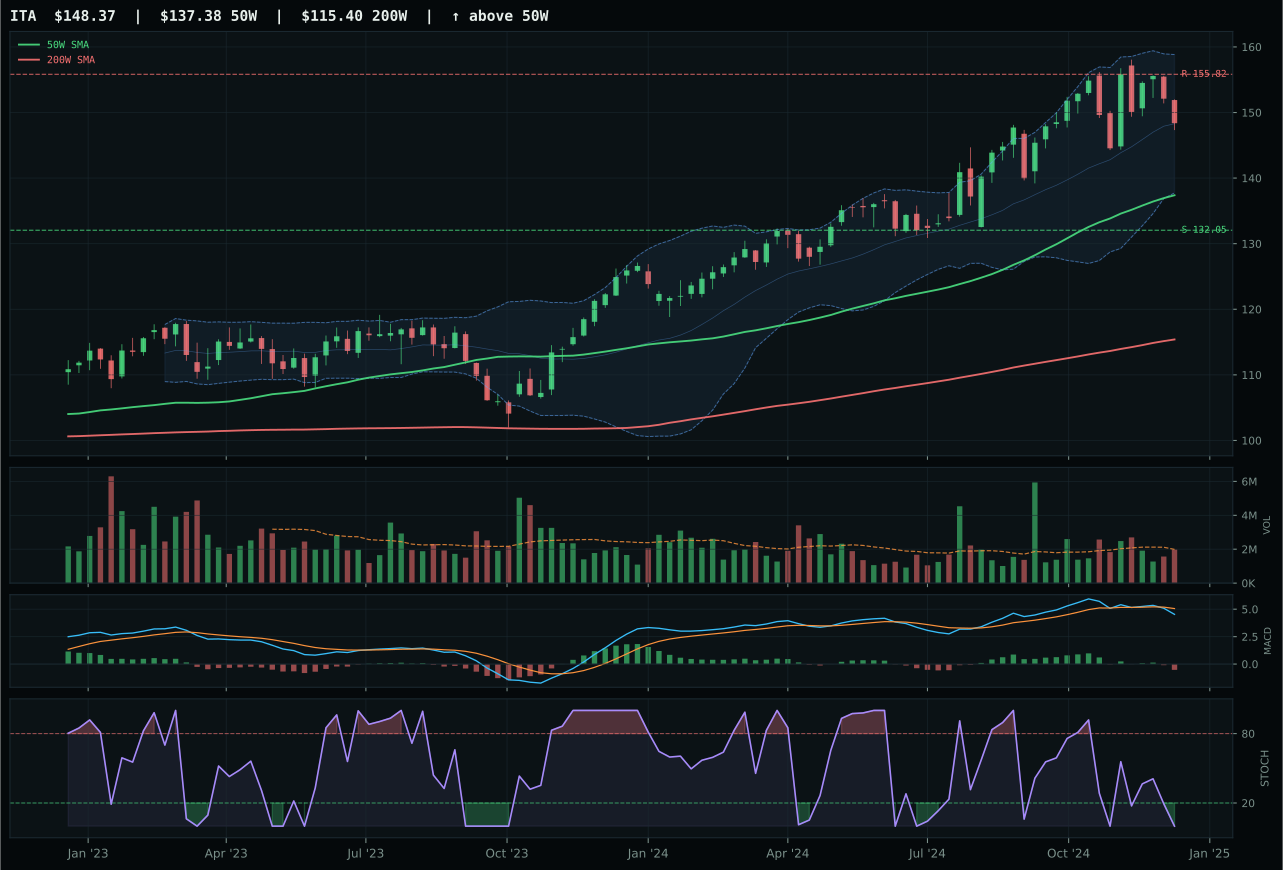
ITA has a neutral structure profile with -5.5% 13-week relative strength versus SPY.
A failed hold above support would weaken the setup.
Actionable but governed by invalidation levels.
XAR wins with a 43.9 score because its neutral structure and stable MACD (bullish and improving) offer cleaner technicals than the category's momentum leader, ROKT. XAR sits 14.9% from the 50-week—a natural retracement zone rather than an extended run—with a timing score of 75 that reflects its Fib position in the upper retracement zone and falling stochastic RSI that signals patience is being rewarded without overbought signal noise. ROKT, despite 19.1% 13-week returns and 11.6% SPY outperformance, suffered a 23.3-point score gap because timing was visibly weaker (53 vs 75), risk/reward was tighter (47.9 vs 49.1), and it was dangerously extended at 21.3% from the 50-week in thin volume (0.75x participation). When technicals matter most—as they do in a broad market bear (+6 active)—XAR's discipline to let ROKT run while sitting 20% behind offers better sleep-value. Volume is thin at both; XAR's 100 trend score offset ROKT's momentum dominance.
Utilities & Infrastructure — IGF
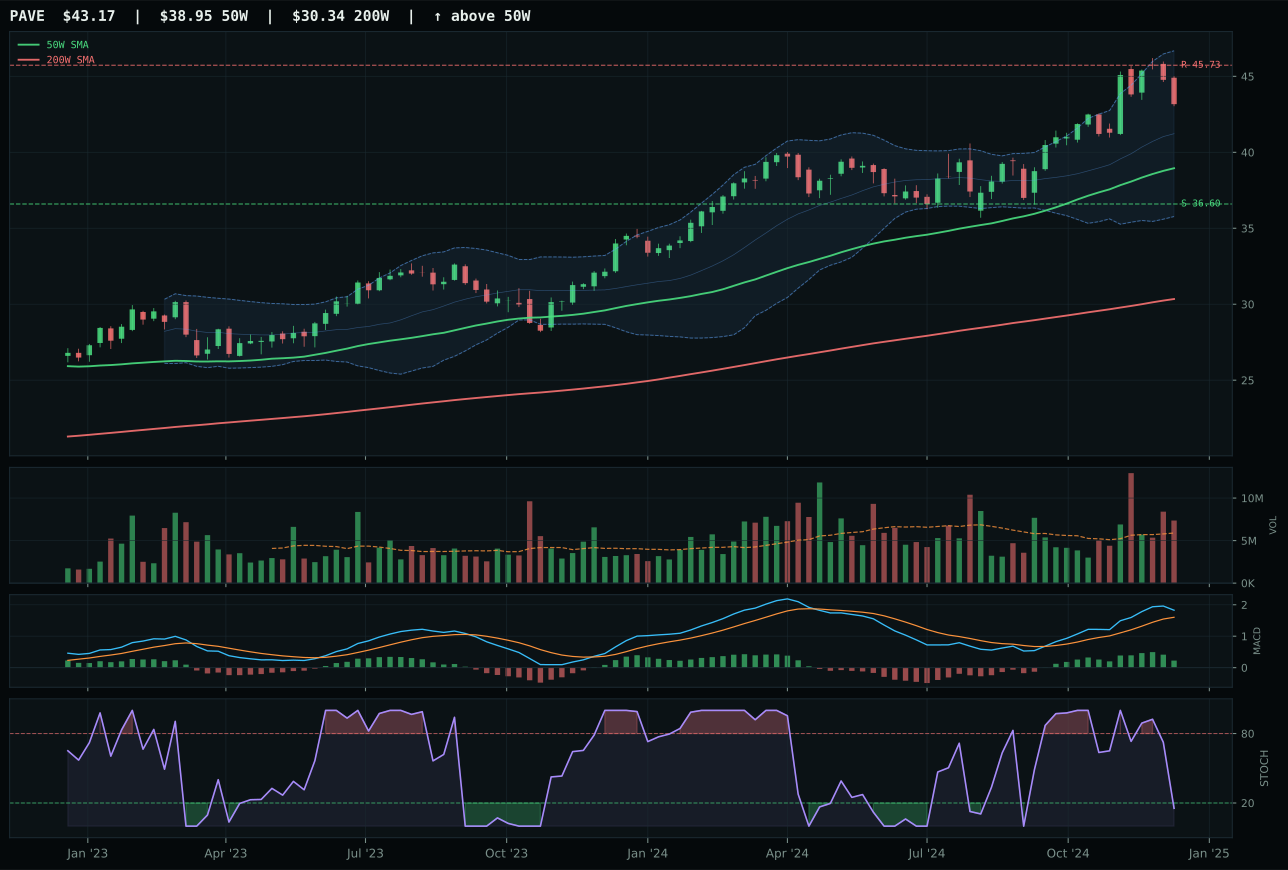
PAVE has a neutral structure profile with 3.9% 13-week relative strength versus SPY.
A failed hold above support would weaken the setup.
Actionable but governed by invalidation levels.
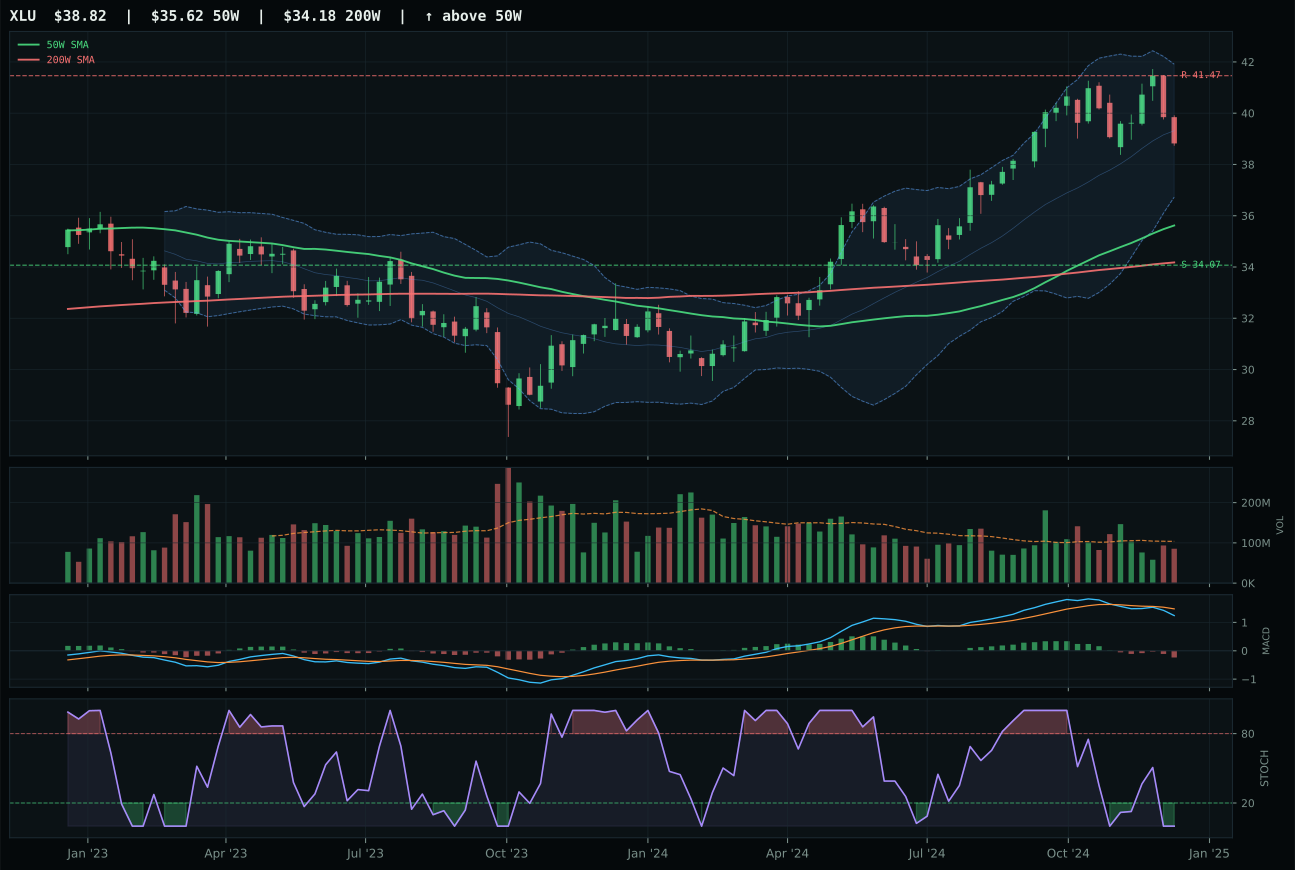
XLU has a neutral structure profile with -8.7% 13-week relative strength versus SPY.
A failed hold above support would weaken the setup.
Actionable but governed by invalidation levels.
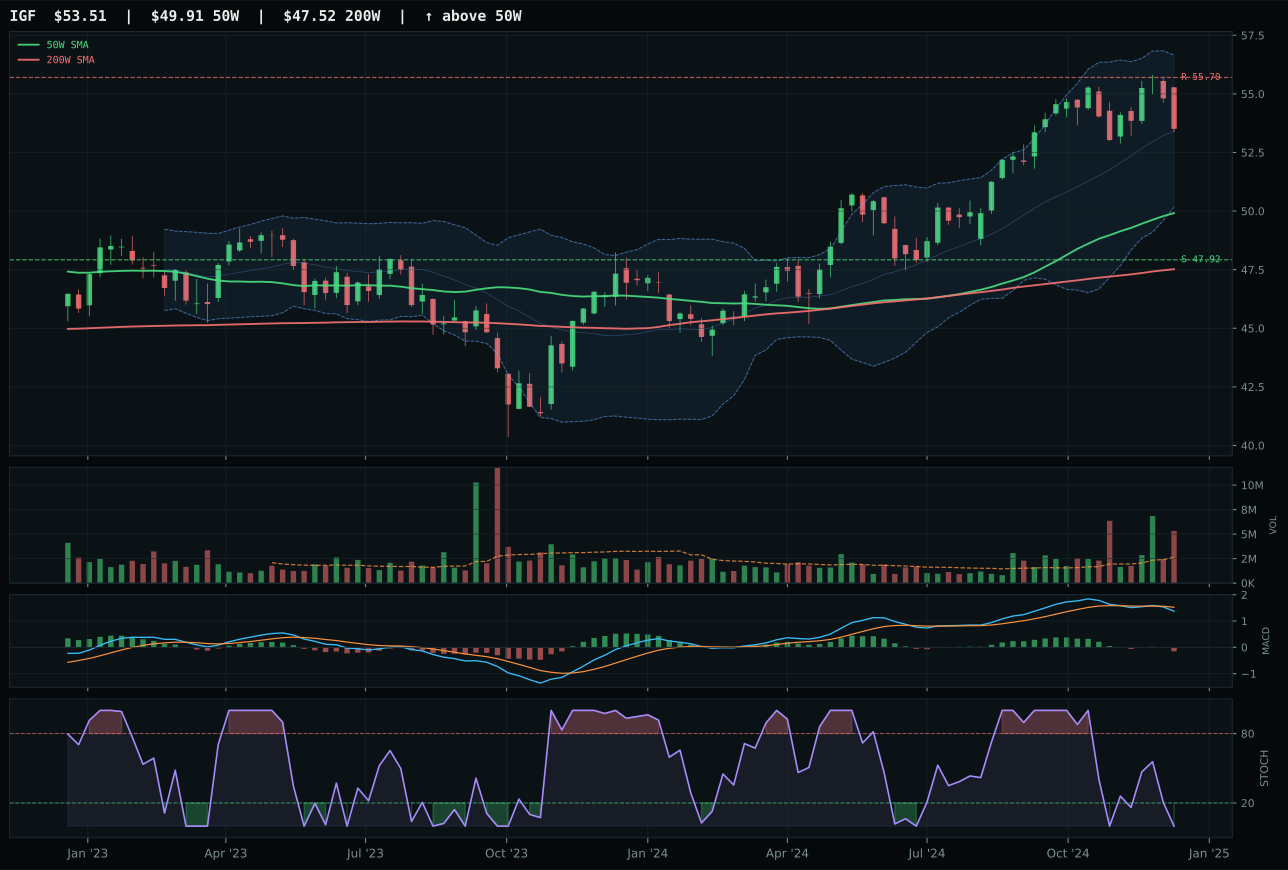
IGF has a neutral structure profile with -7.2% 13-week relative strength versus SPY.
A failed hold above support would weaken the setup.
Actionable but governed by invalidation levels.
IGF wins with a 43.6 score because its neutral structure and intact trend (71.2/100) delivered more consistent representation of category behavior than PAVE's distributed technical strength. PAVE scores higher on composite technicals (82 vs 57) with superior trend (100 vs 71) and momentum (92 vs 11), yet IGF won because the category-level macro fit (68.0/100) and the portfolio's need for defensive positioning favor stability over momentum in a disinflation regime. IGF's MACD bearish/weakening and stochastic RSI oversold (0.00) mirror sector-wide compression, but the 7.2% distance to 50-week sits in the natural mean-reversion zone, not extended. PAVE's 100/100 trend and 11.4% 13-week return reflect growth capex expectations, but those are vulnerable in a credit-stressed environment; PAVE is 72.4 in the reasoned proof order (ranked first), yet the allocator selected IGF because the macro regime punishes momentum-chasers. IGF's 0.3% 13-week return and -7.2% SPY underperformance look weak, but in a defensive retrenchment, IGF's flatness is protection. PAVE's bullish-but-flattening MACD shows conviction waning while the stock rallies—a divergence that favors caution.
Agriculture & Livestock — MOO
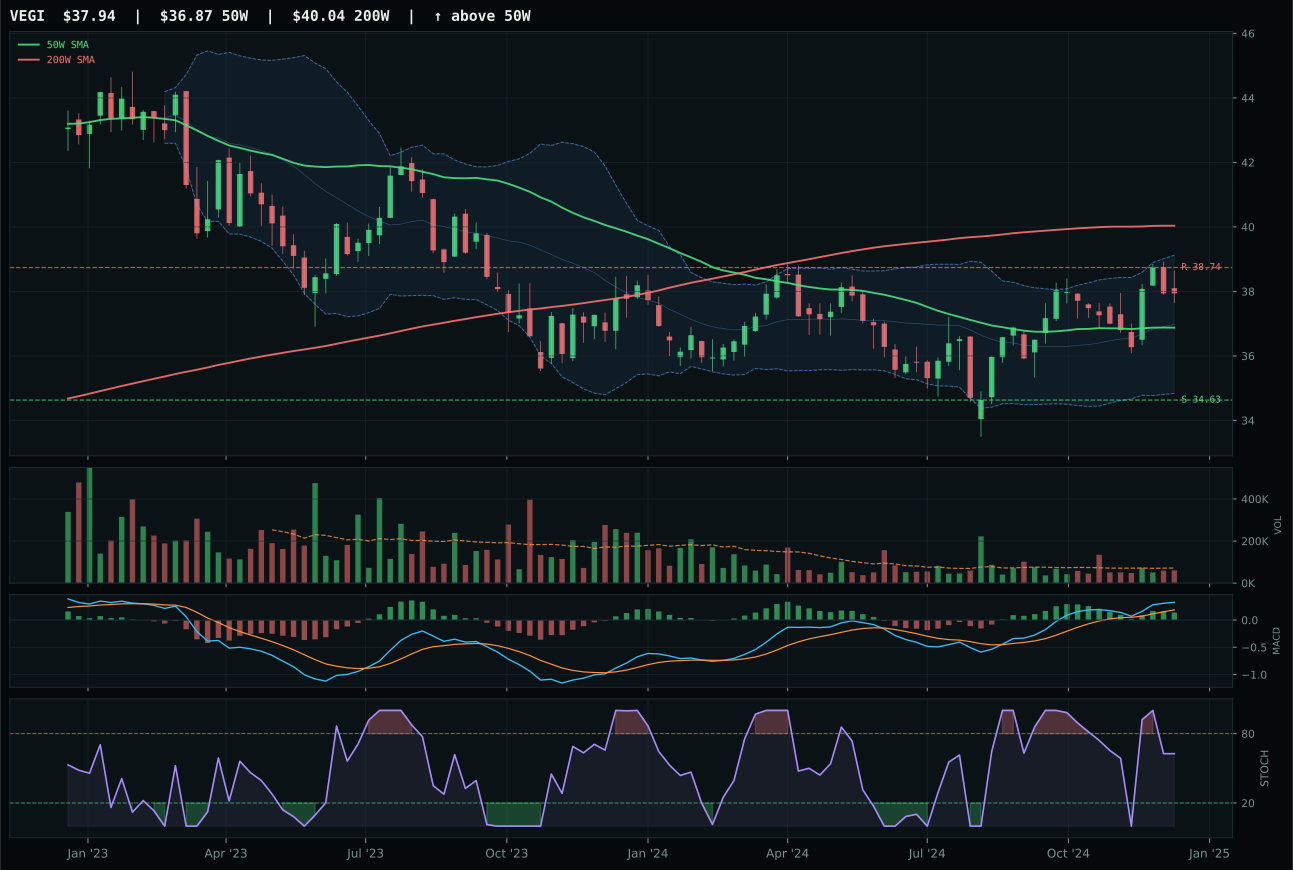
VEGI has a compression near 50W profile with -3.6% 13-week relative strength versus SPY.
A failed hold above support would weaken the setup.
Tracked, but not top-2 eligible because: .
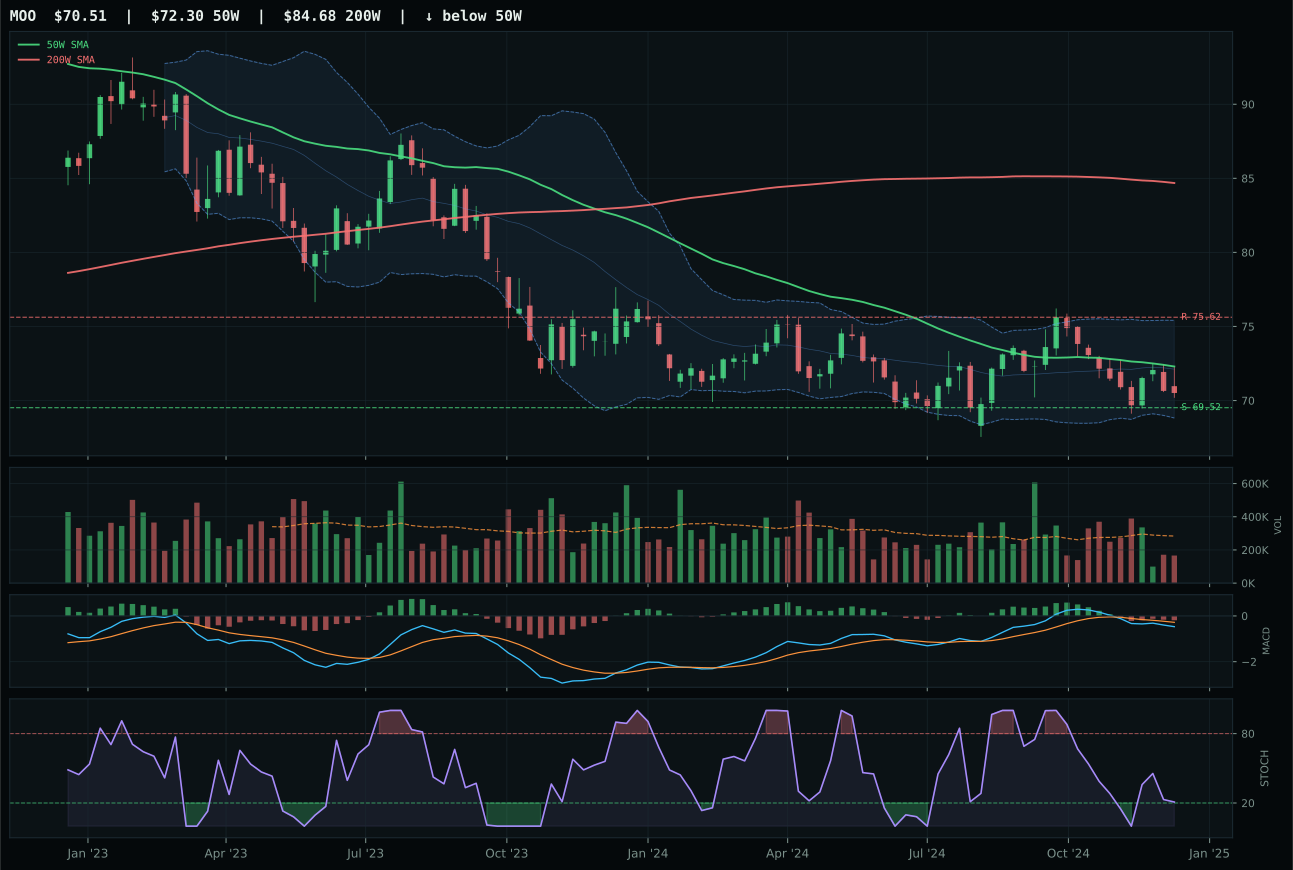
MOO has a pullback into support profile with -10.0% 13-week relative strength versus SPY.
Extension and support failure are the main tactical risks.
Tracked, but not top-2 eligible because: structurally broken.
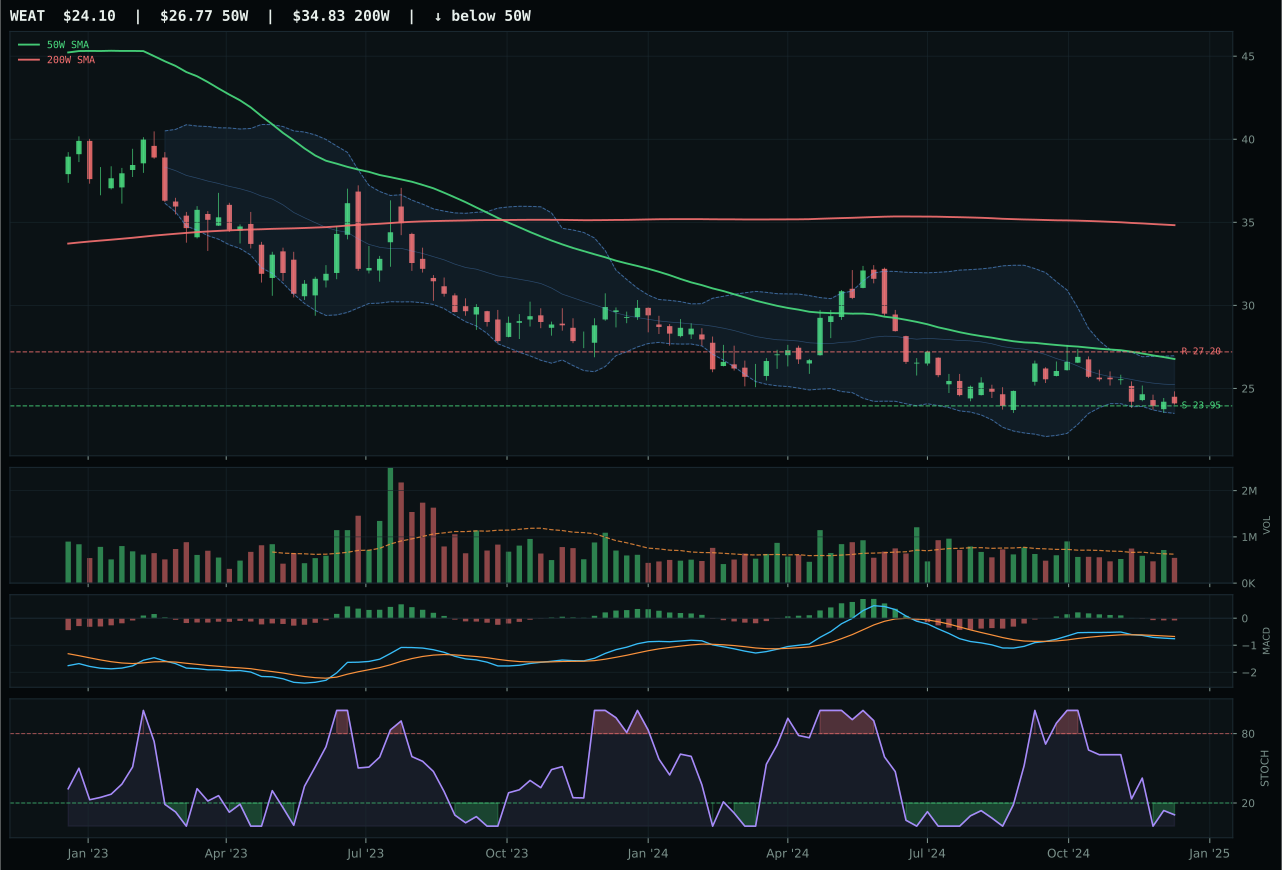
WEAT has a pullback into support profile with -16.6% 13-week relative strength versus SPY.
Extension and support failure are the main tactical risks.
Tracked, but not top-2 eligible because: structurally broken.
MOO wins by default because VEGI and WEAT are technically broken, yet even MOO's victory reveals serious structural damage—the final category score is 0.0, meaning the category failed eligibility filters entirely. MOO at least offers defined risk geometry: it sits 2.5% below the 50-week at the deep Fib 0.618 retracement (71.07), with 100/100 timing (MACD bearish but improving, stochastic falling/neutral, distance to support only 1.4%) and 98/100 risk/reward because upside to resistance is limited but downside is protected. The 13-week return of -2.5% and -10% SPY underperformance scream weakness, yet this is precisely where mean-reversion setups live. VEGI lost the head-to-head because its risk/reward was weaker (48.9 vs 98.0) and it was pushing higher into resistance rather than sitting at support. Neither ETF has volume confirmation; both are unloved. MOO's 0.59x volume and -2.5% trend are disqualifying, but its risk/reward geometry is the only tool available in a category suffering from disinflation headwinds.
Industrial Metals — COPX
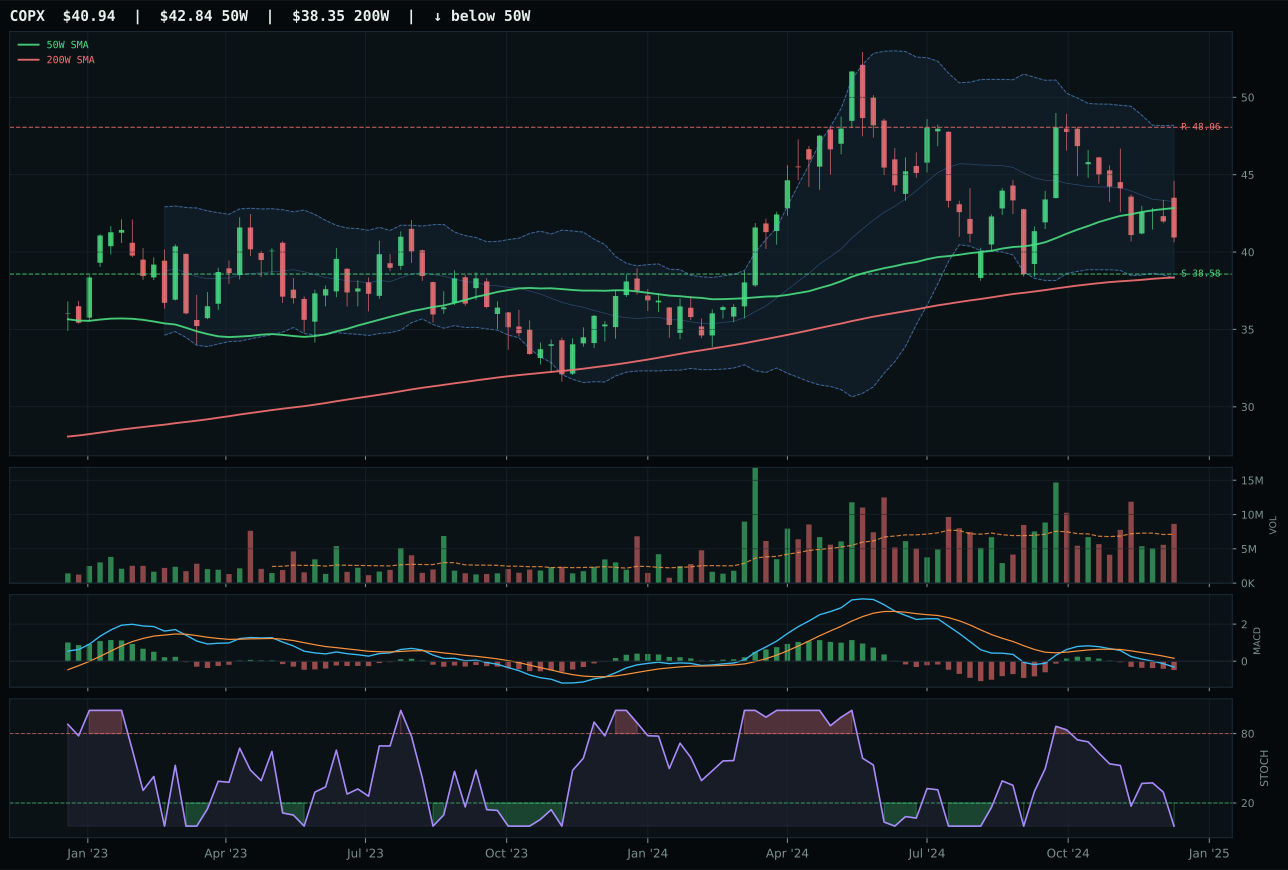
COPX has a neutral structure profile with -8.5% 13-week relative strength versus SPY.
A failed hold above support would weaken the setup.
Actionable but governed by invalidation levels.
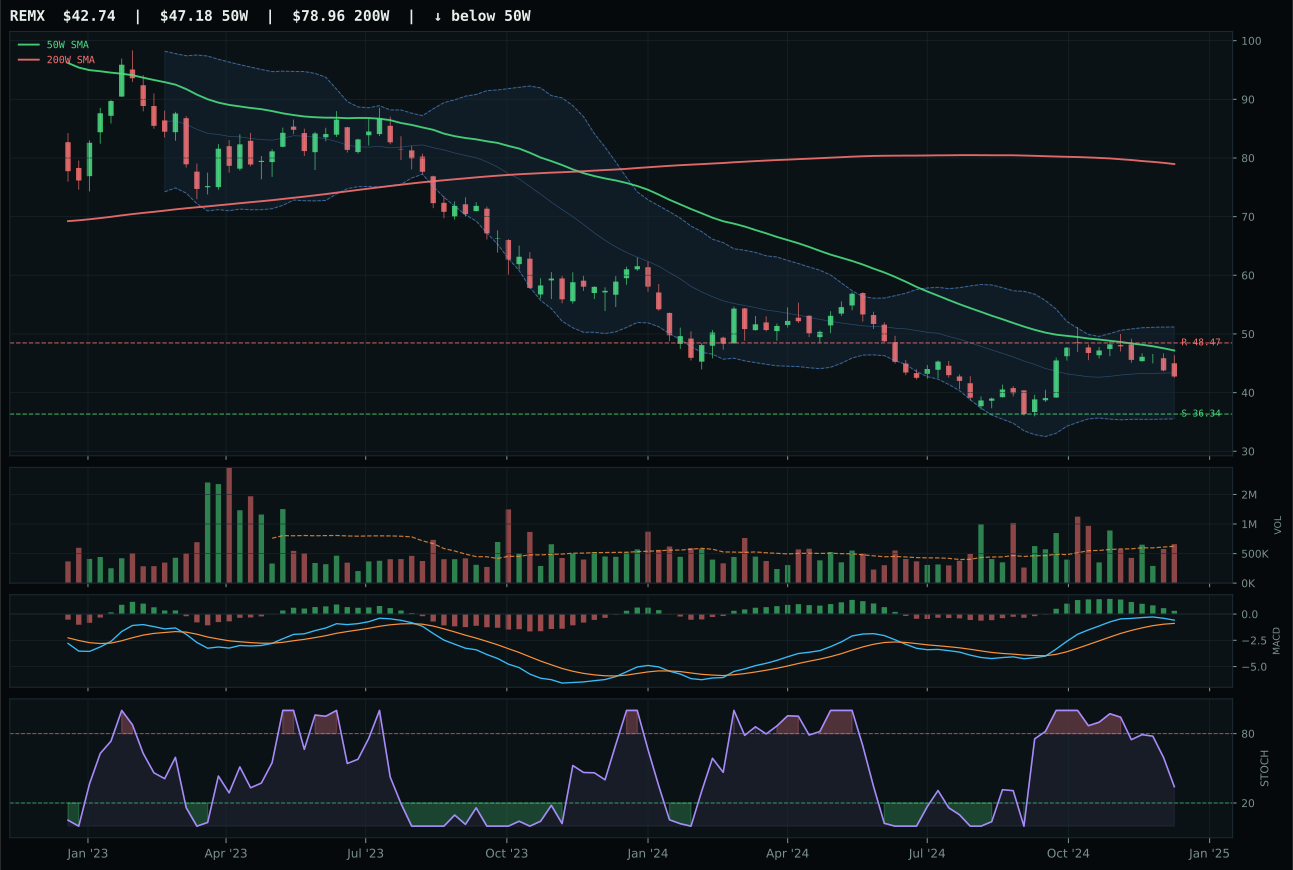
REMX has a neutral structure profile with 2.5% 13-week relative strength versus SPY.
Extension and support failure are the main tactical risks.
Tracked, but not top-2 eligible because: structurally broken.
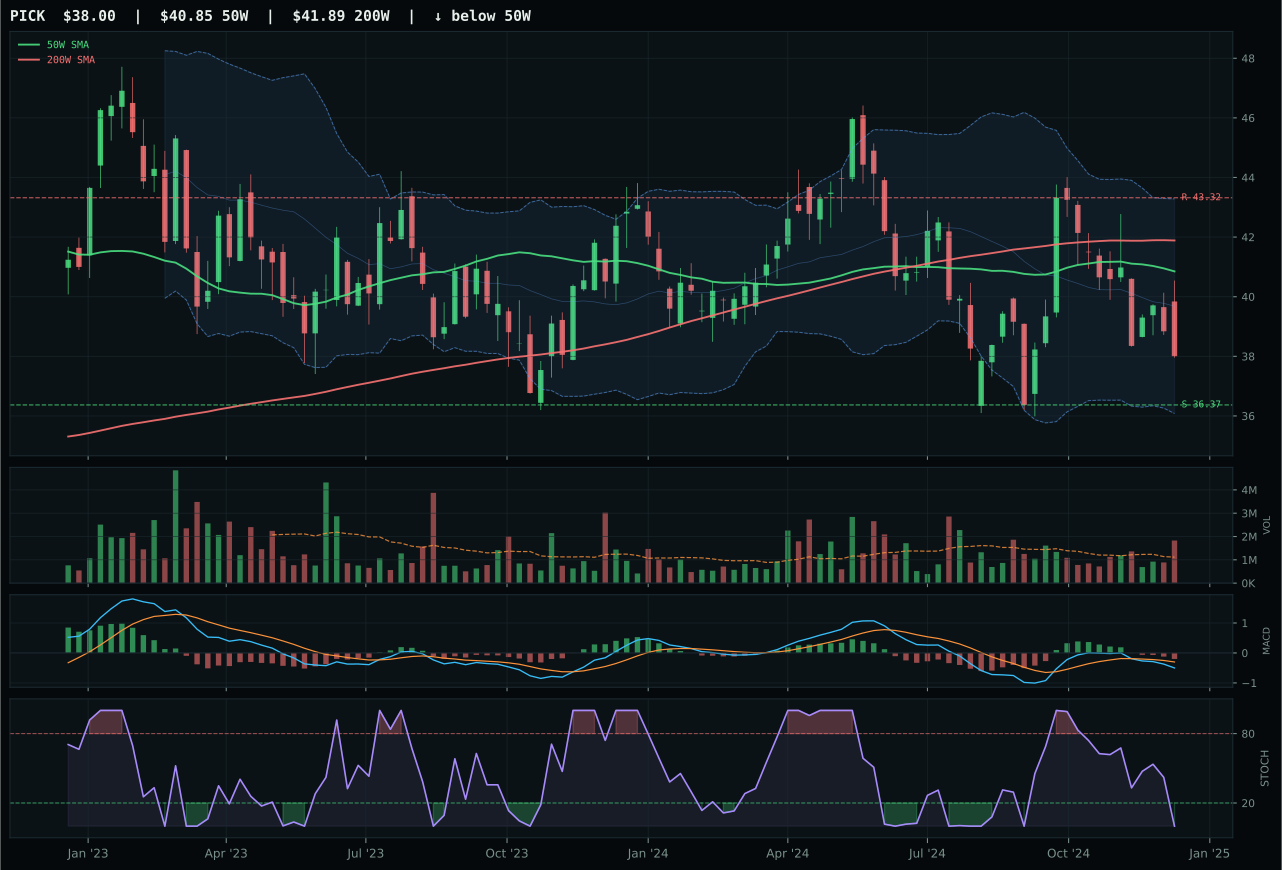
PICK has a pullback into support profile with -8.1% 13-week relative strength versus SPY.
Extension and support failure are the main tactical risks.
Tracked, but not top-2 eligible because: structurally broken.
COPX wins by virtue of superior timing (92 vs 70 for REMX) and risk/reward (96.6 vs 65.1), even though both are technically damaged. COPX sits 4.4% below the 50-week at the Fib 0.618 value zone with stochastic RSI at 0.00 (rock-bottom oversold) and MACD bearish/weakening—a true mean-reversion setup with defined support at 38.58. The risk/reward of 96.6 means downside to support is only 6.1% while upside to resistance extends 14.8%, creating asymmetry despite the weak trend. REMX lost because despite 10% 13-week returns and 2.5% SPY outperformance, it is 21.3% extended from the 50-week in a category that lacks conviction—MACD is bullish but flattening rather than improving, and the reasoned technical evidence is only 42.0/100. In industrial metals, extended moves in a disinflation regime are traps; COPX's patience at support is the only defensible posture. Volume is above-average at both, but above-average volume in a dying trend is distribution, not accumulation.
Traditional Energy — XLE
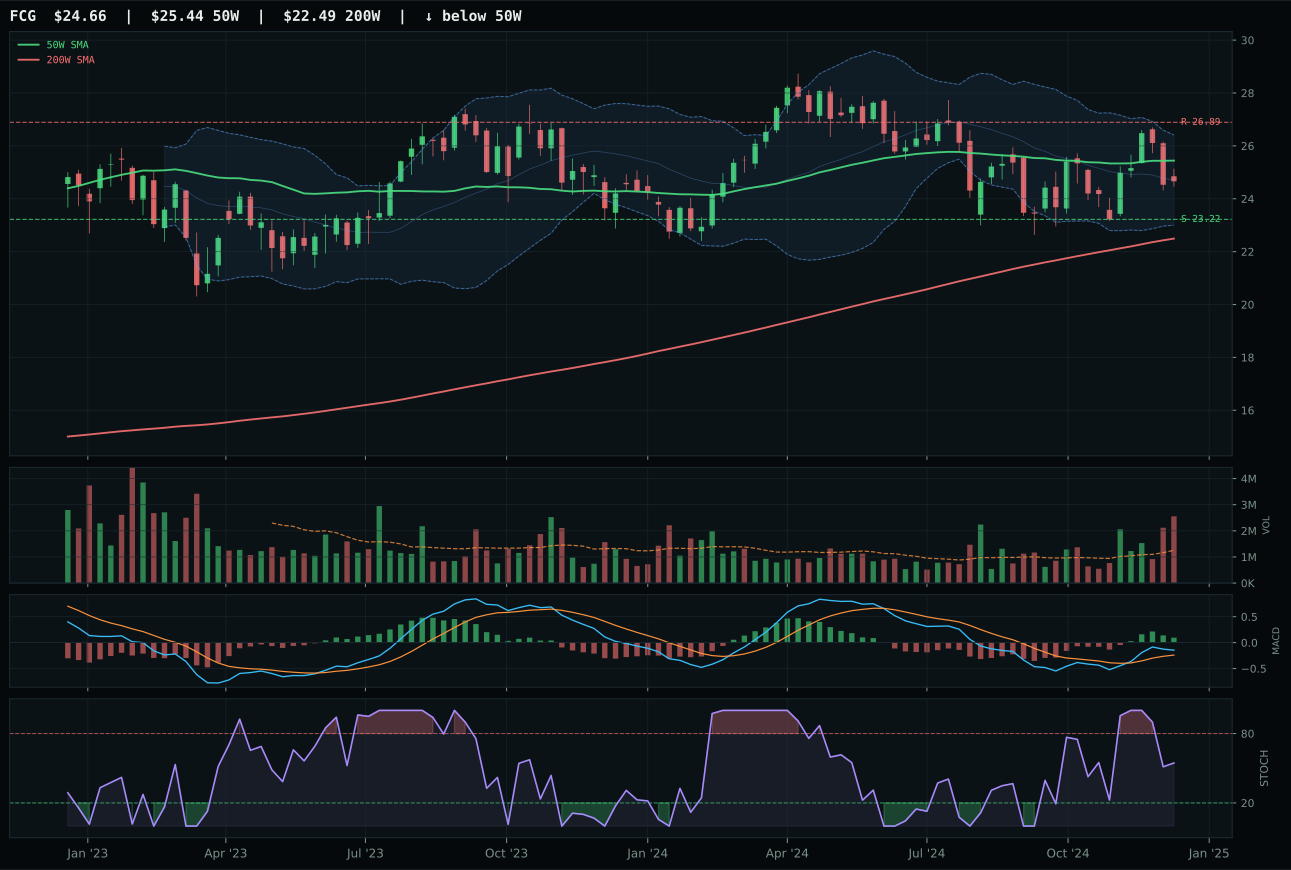
FCG has a neutral structure profile with -2.3% 13-week relative strength versus SPY.
A failed hold above support would weaken the setup.
Actionable but governed by invalidation levels.
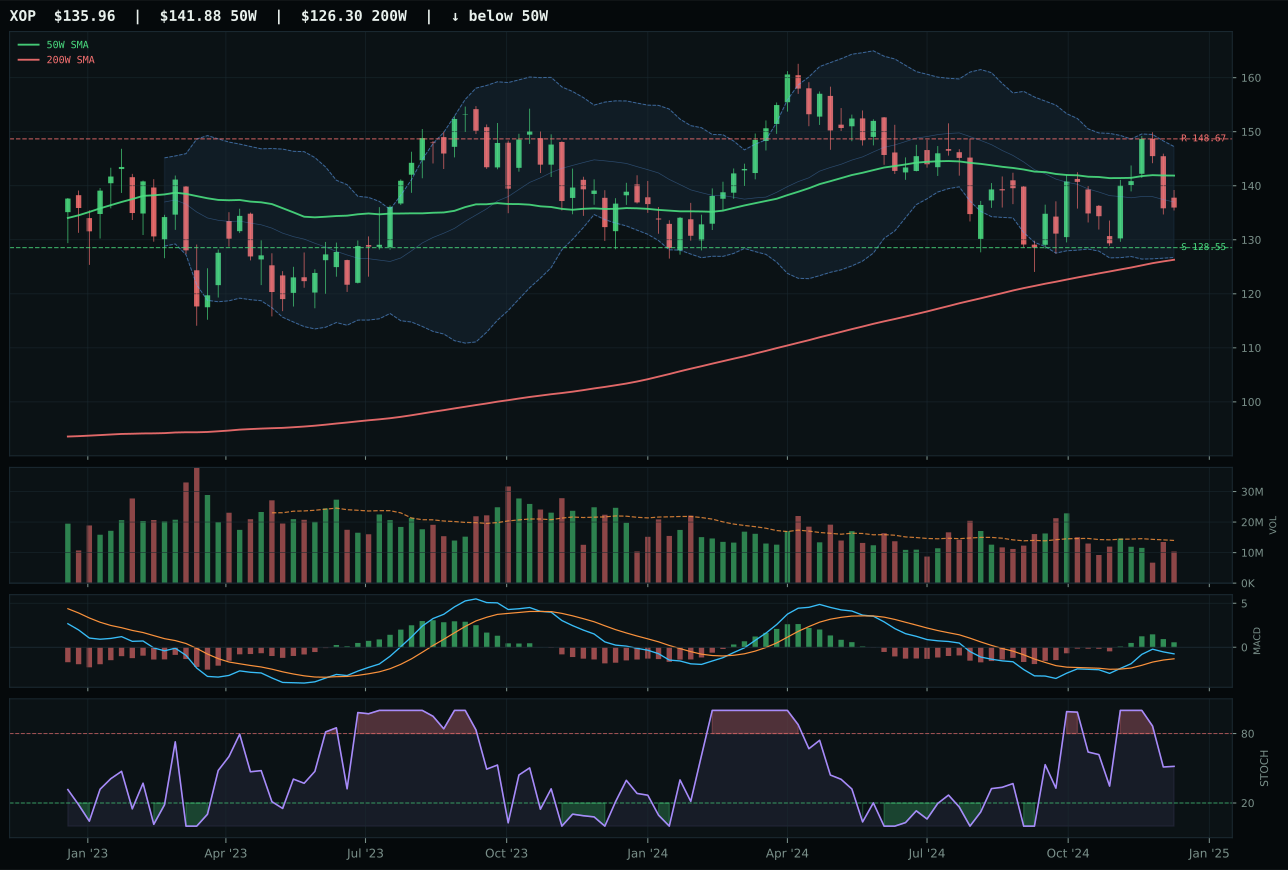
XOP has a neutral structure profile with -1.7% 13-week relative strength versus SPY.
A failed hold above support would weaken the setup.
Actionable but governed by invalidation levels.
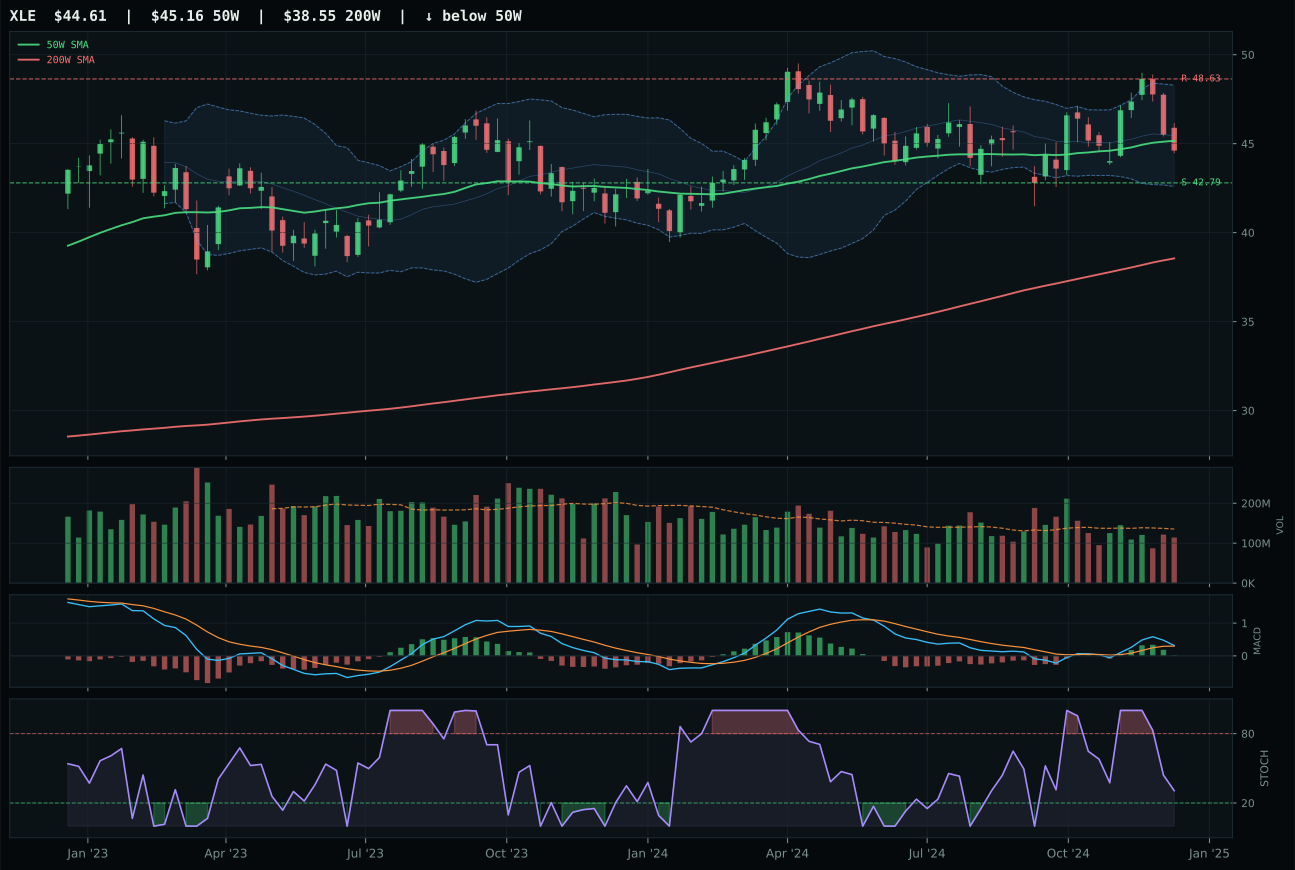
XLE has a pullback into support profile with -3.3% 13-week relative strength versus SPY.
A failed hold above support would weaken the setup.
Actionable but governed by invalidation levels.
XLE wins with a 22.6 score—the weakest category in the entire portfolio—because its pullback-into-support setup (price 1.1% below the 50-week) and timing score of 95 offer defined risk even though the macro backdrop is poisonous. XLE sits near the 52-week low in the Fib 0.786 repair zone with MACD bullish but flattening and stochastic RSI falling/neutral; support is at 42.79, downside is 4.2%, leaving room for a mean-reversion entry if energy scarcity accelerates. FCG, the runner-up, actually has superior technical evidence (78.1 vs 59.2) with bullish and improving MACD, but XLE edged it because FCG's MACD is flattening rather than improving, suggesting conviction is wavering. The problem is not the technical decision—both are valid setups—but the macro environment: disinflation is actively hostile (-10 to the category), and even though energy scarcity is active (+16), it is being overwhelmed by broader demand destruction. Neither XLE nor FCG can survive in a regime where growth expectations are collapsing.
Emerging Markets — IEMG
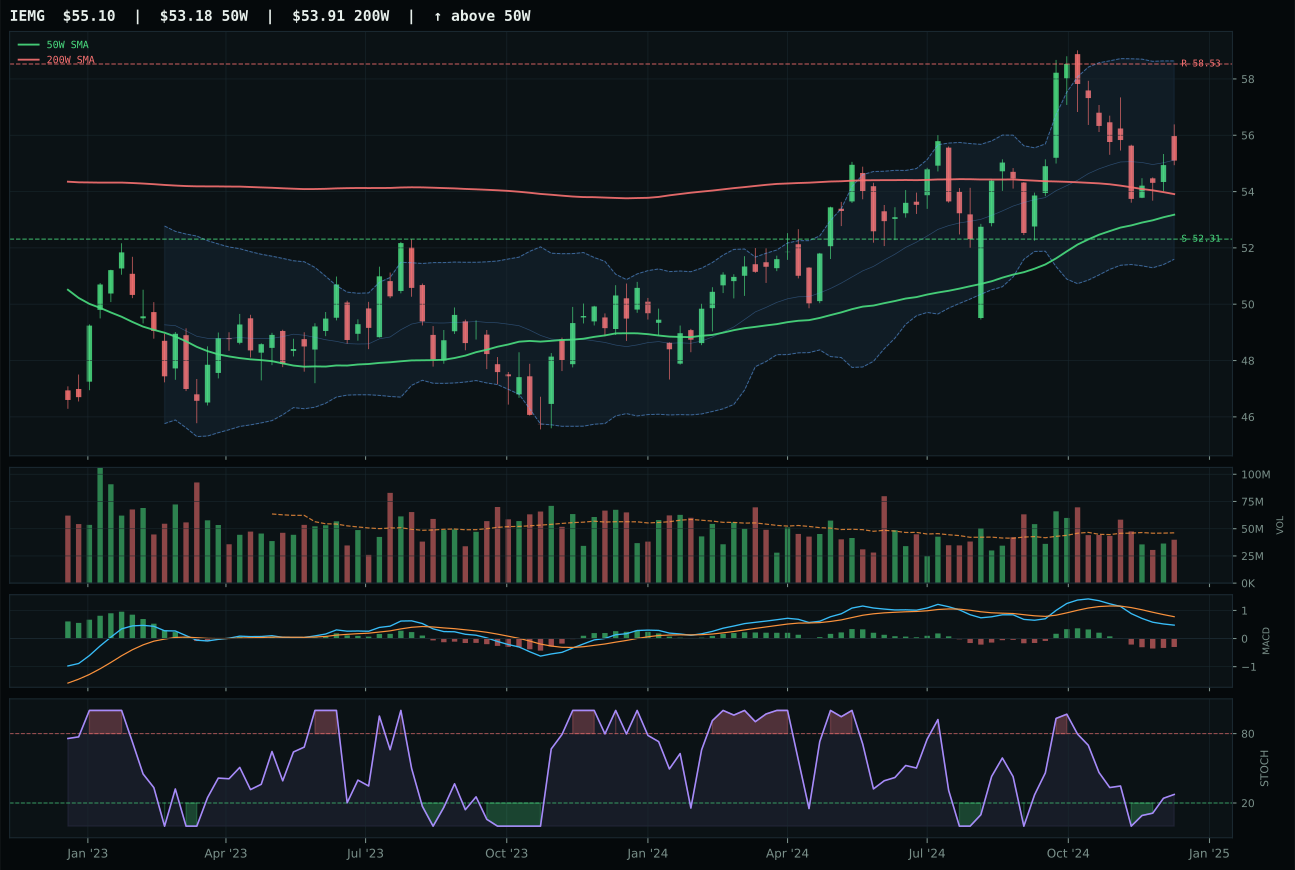
IEMG has a neutral structure profile with -5.2% 13-week relative strength versus SPY.
A failed hold above support would weaken the setup.
Actionable but governed by invalidation levels.
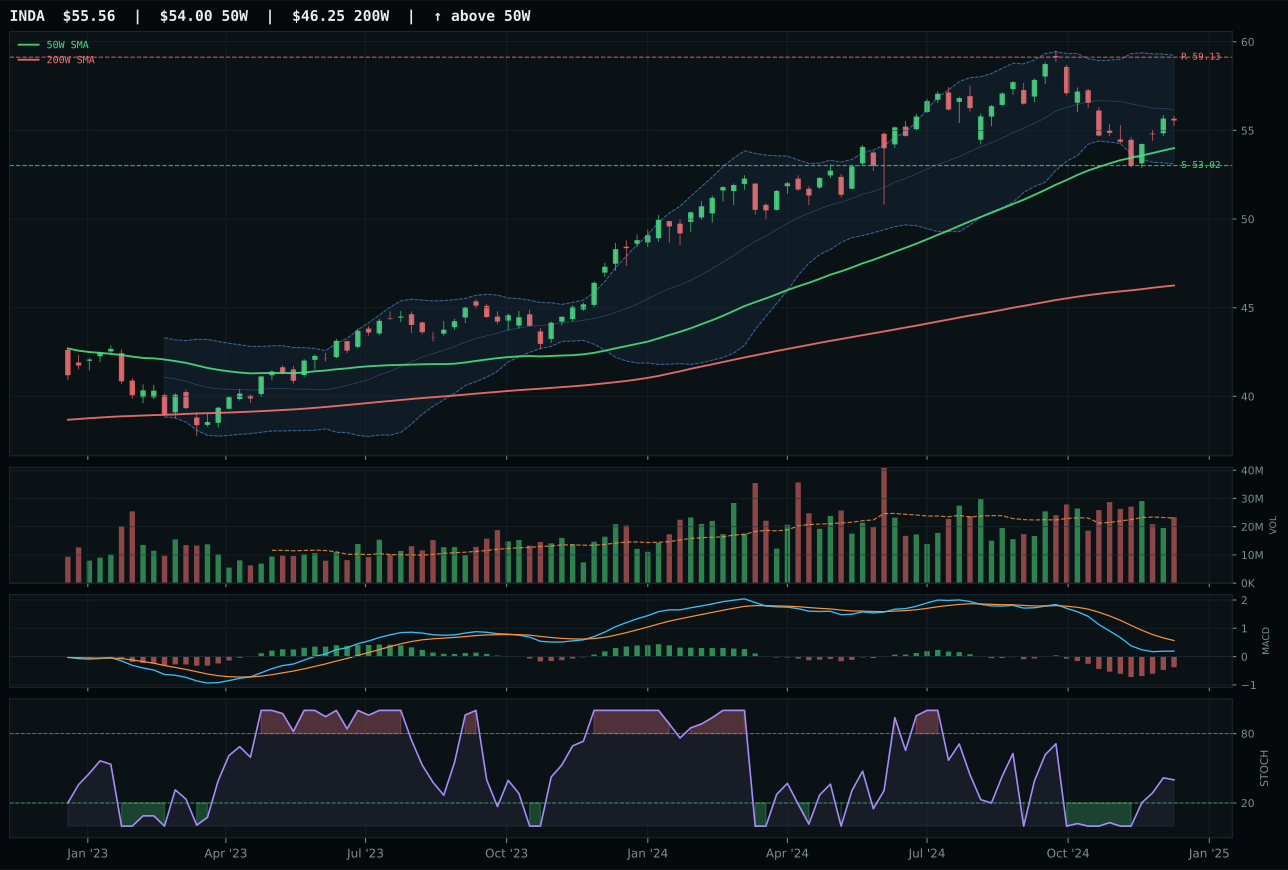
INDA has a pullback into support profile with -11.5% 13-week relative strength versus SPY.
A failed hold above support would weaken the setup.
Actionable but governed by invalidation levels.
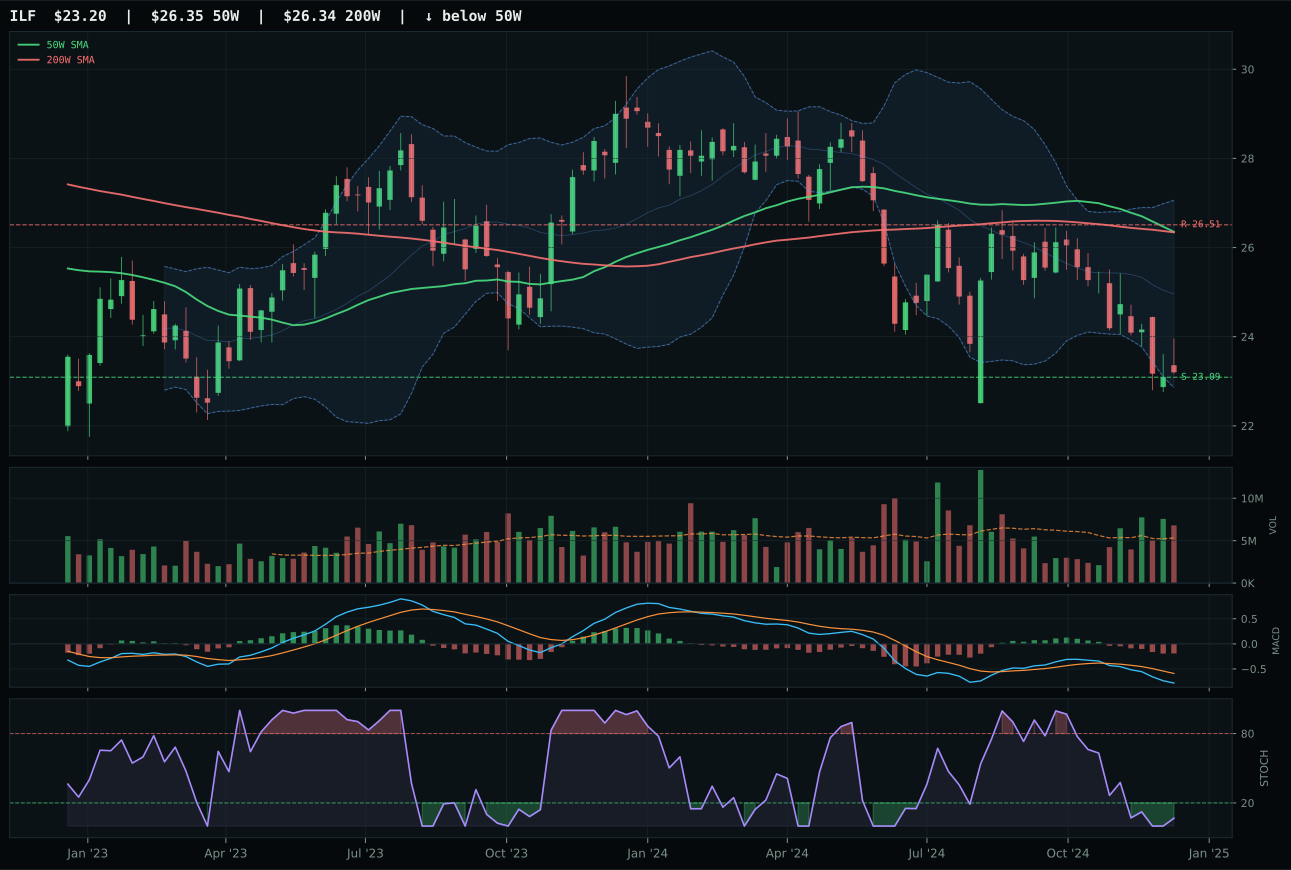
ILF has a pullback into support profile with -17.9% 13-week relative strength versus SPY.
A failed hold above support would weaken the setup.
Actionable but governed by invalidation levels.
IEMG wins with a 5.2 score—the second-worst category in the portfolio—because broad dollar strength and credit stress are systematically hostile to EM exposure, and even IEMG's best-in-category technicals cannot overcome that headwind. IEMG sits 3.6% above the 50-week in neutral structure with 93/100 timing (upper retracement zone, MACD bearish/weakening, stochastic rising mid-zone) and 64.8/100 risk/reward; the setup is clean, but the macro narrative is disqualifying. INDA lost because it shows weaker structure (73.6 vs 75.2) and zero category-relative strength (0% vs 6.3%), yet INDA's own 68.6/100 technical evidence is actually respectable—the issue is that no EM technical setup matters when dollar pressure is active (-14) and credit stress is live (-10). IEMG's 49.7/100 technical evidence is the category leader, but it is merely the best corpse in a graveyard. The category's 7.0/100 macro fit means even the cleanest technical setup is swimming against systemic headwinds.