
2024-12-06
Informational purposes only. The content in this report, including allocations, analysis, and commentary, is provided solely for informational and educational purposes. It does not constitute financial advice, investment advice, trading advice, or any other type of advice. Past performance does not guarantee future results. Always conduct your own research and consult a qualified financial professional before making investment decisions.
Weekly Allocation
| Ticker | Category | Weight | Role |
|---|---|---|---|
| FBTC | 50% | Overlay | |
| IGV | Technology | 10% | Top-2 (10%) |
| URNM | Nuclear Energy | 10% | Top-2 (10%) |
| AIQ | AI | 5% | Tier-2 (5%) |
| IGF | Utilities & Infrastructure | 5% | Tier-2 (5%) |
| GLD | Precious Metals | 5% | Tier-2 (5%) |
| XAR | Defense & Aerospace | 5% | Tier-2 (5%) |
| XLE | Traditional Energy | 5% | Tier-2 (5%) |
| COPX | Industrial Metals | 5% | Tier-2 (5%) |
Trade Instructions — Monday Open
Sell the tranche from 2024-11-08 (completing its 4-week hold). Buy the new tranche. Instructions show net portfolio changes — same-asset positions cancel, weight changes show the delta.
| Action | Ticker | Instruction |
|---|---|---|
| SELL | PAVE | Sell 29% of PAVE position (reduce 8.75% → 6.25%) |
| SELL | GLD | Sell 20% of GLD position (reduce 6.25% → 5.00%) |
| SELL | NLR | Sell entire NLR position (1.25% of portfolio) |
| SELL | BOTZ | Sell 50% of BOTZ position (reduce 2.50% → 1.25%) |
| SELL | MOO | Sell 50% of MOO position (reduce 2.50% → 1.25%) |
| BUY | IGV | Buy IGV — 16.67% of freed cash (adds 1.25% to portfolio) |
| BUY | XLE | Buy XLE — 16.67% of freed cash (adds 1.25% to portfolio) |
| BUY | AIQ | Buy AIQ — 16.67% of freed cash (adds 1.25% to portfolio) |
| BUY | URNM | Buy URNM — 33.33% of freed cash (adds 2.50% to portfolio) |
| BUY | IGF | Buy IGF — 16.67% of freed cash (adds 1.25% to portfolio) |
Current Portfolio After Trade
Combined holdings across all 4 active tranches. Each tranche is 25% of the portfolio.
| Ticker | % of Portfolio | Weight Bar |
|---|---|---|
| FBTC | 50.00% | |
| URA | 7.50% | |
| IGV | 6.25% | |
| XAR | 6.25% | |
| PAVE | 6.25% | |
| GLD | 5.00% | |
| COPX | 5.00% | |
| XLE | 5.00% | |
| AIQ | 2.50% | |
| URNM | 2.50% | |
| BOTZ | 1.25% | |
| MOO | 1.25% | |
| IGF | 1.25% |
Macro Regime — Transition / Mixed
Macro Evidence Charts
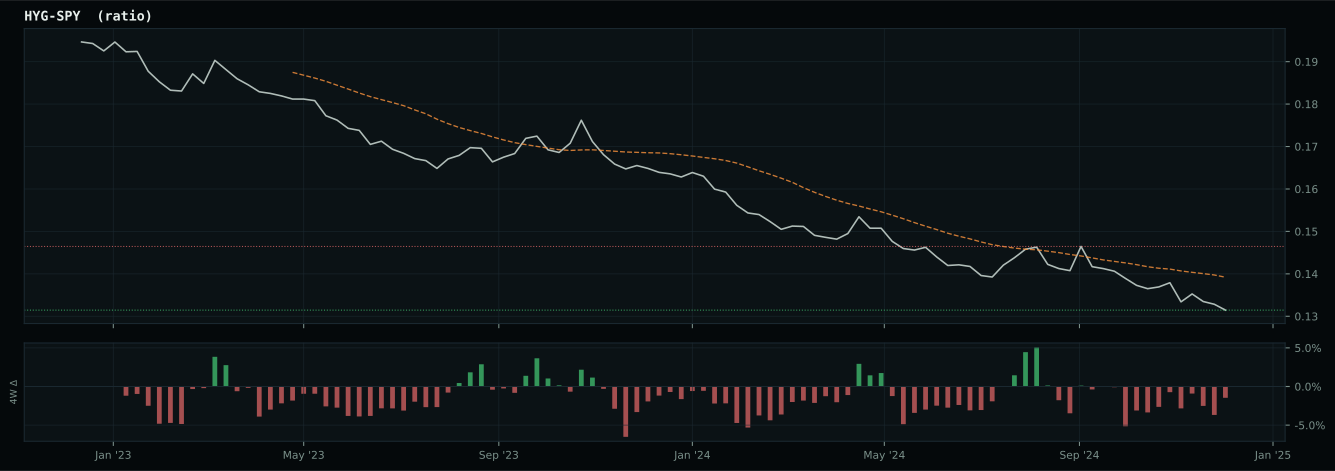
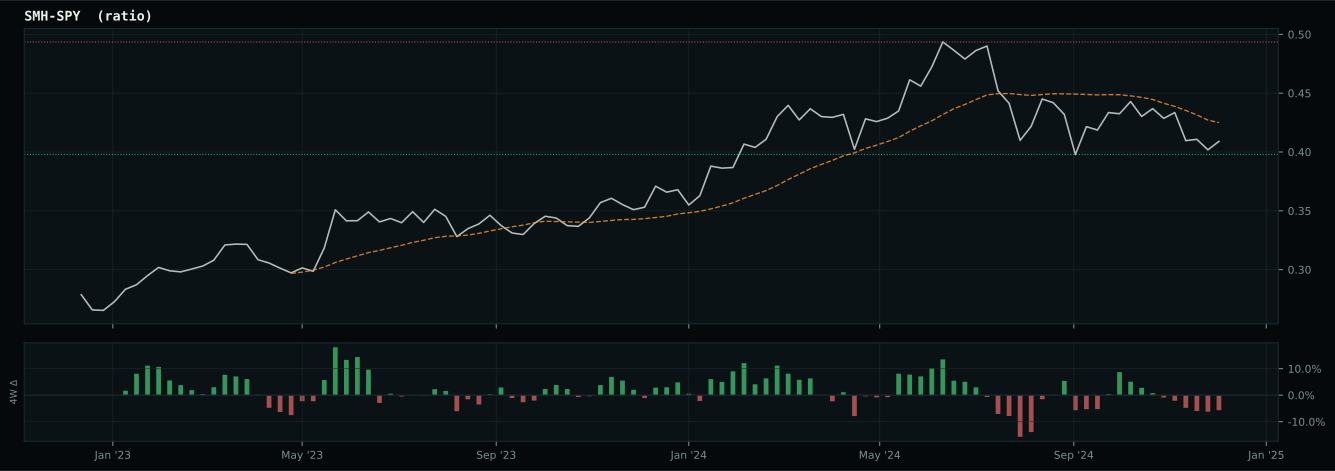
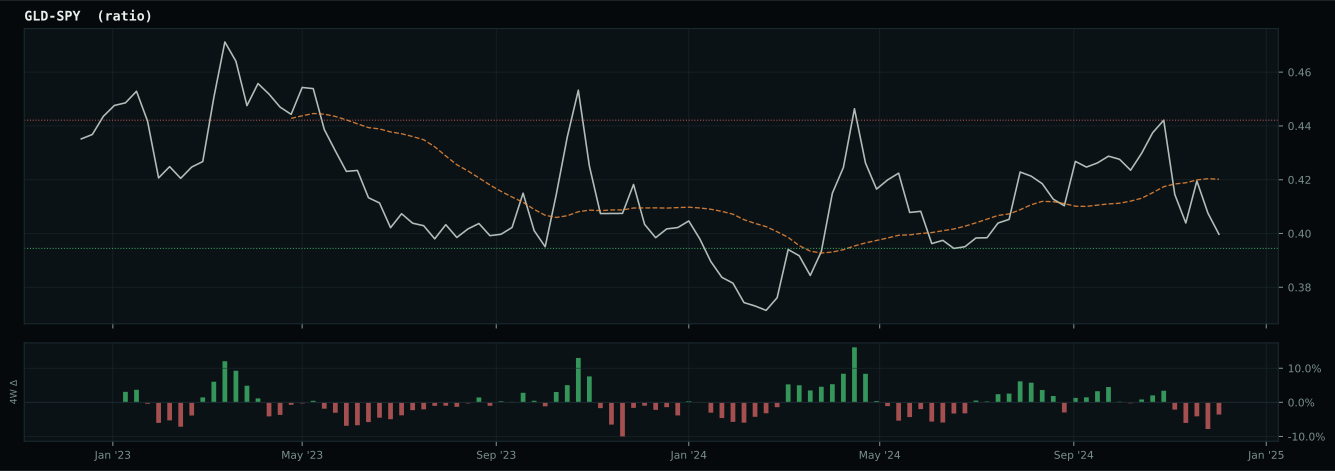
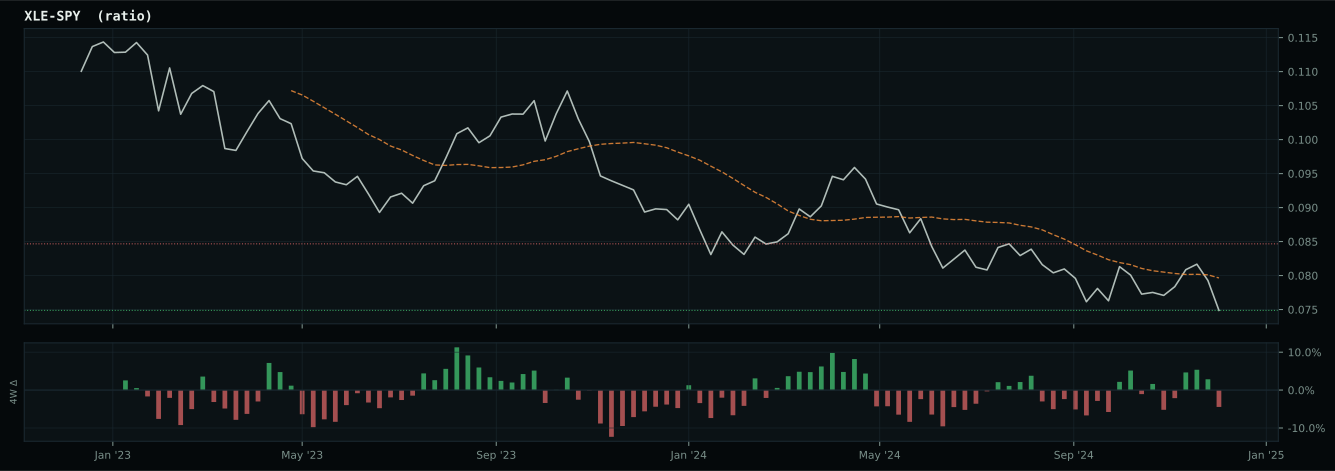
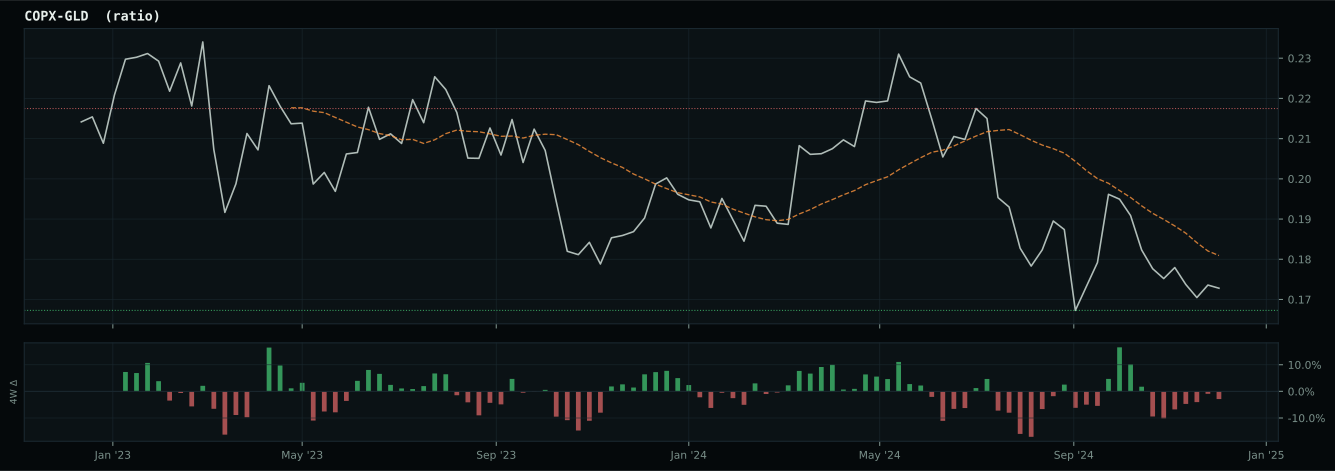
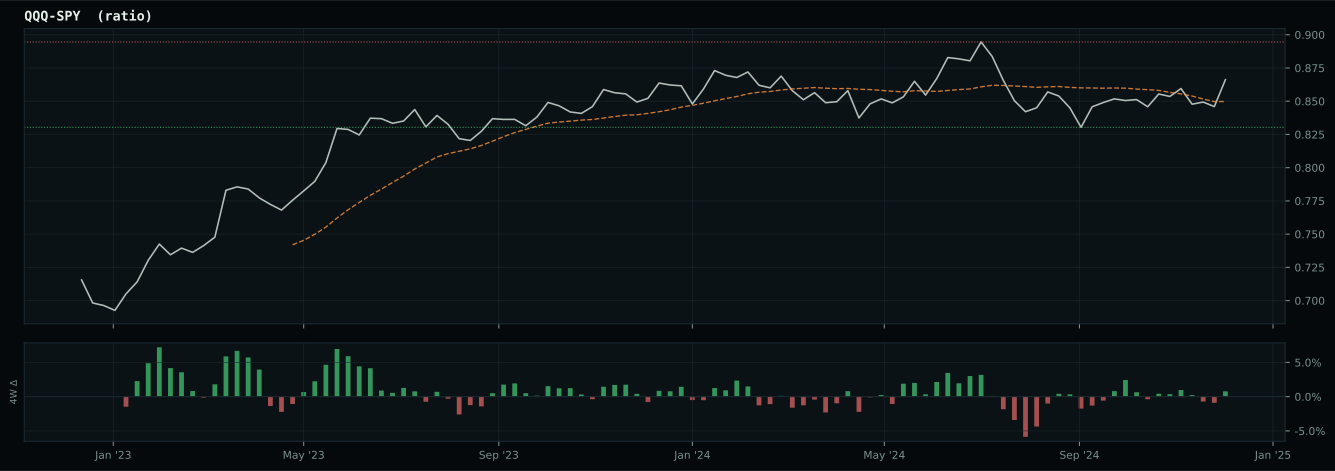
Market-implied signals behind the macro regime scores. Each ratio compares two assets; the direction and slope of the ratio is what the macro engine reads.
Crypto Regime — TrendBTC
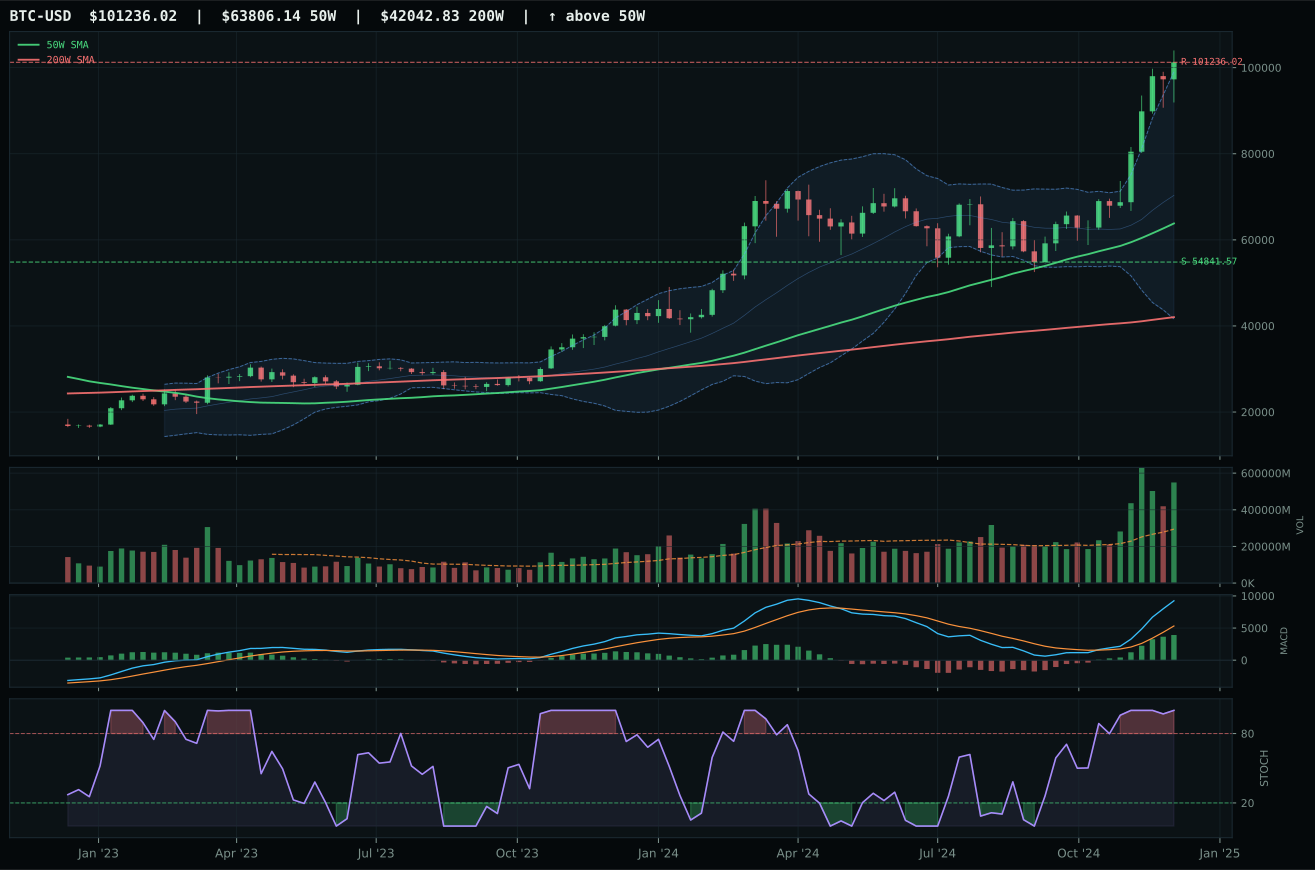
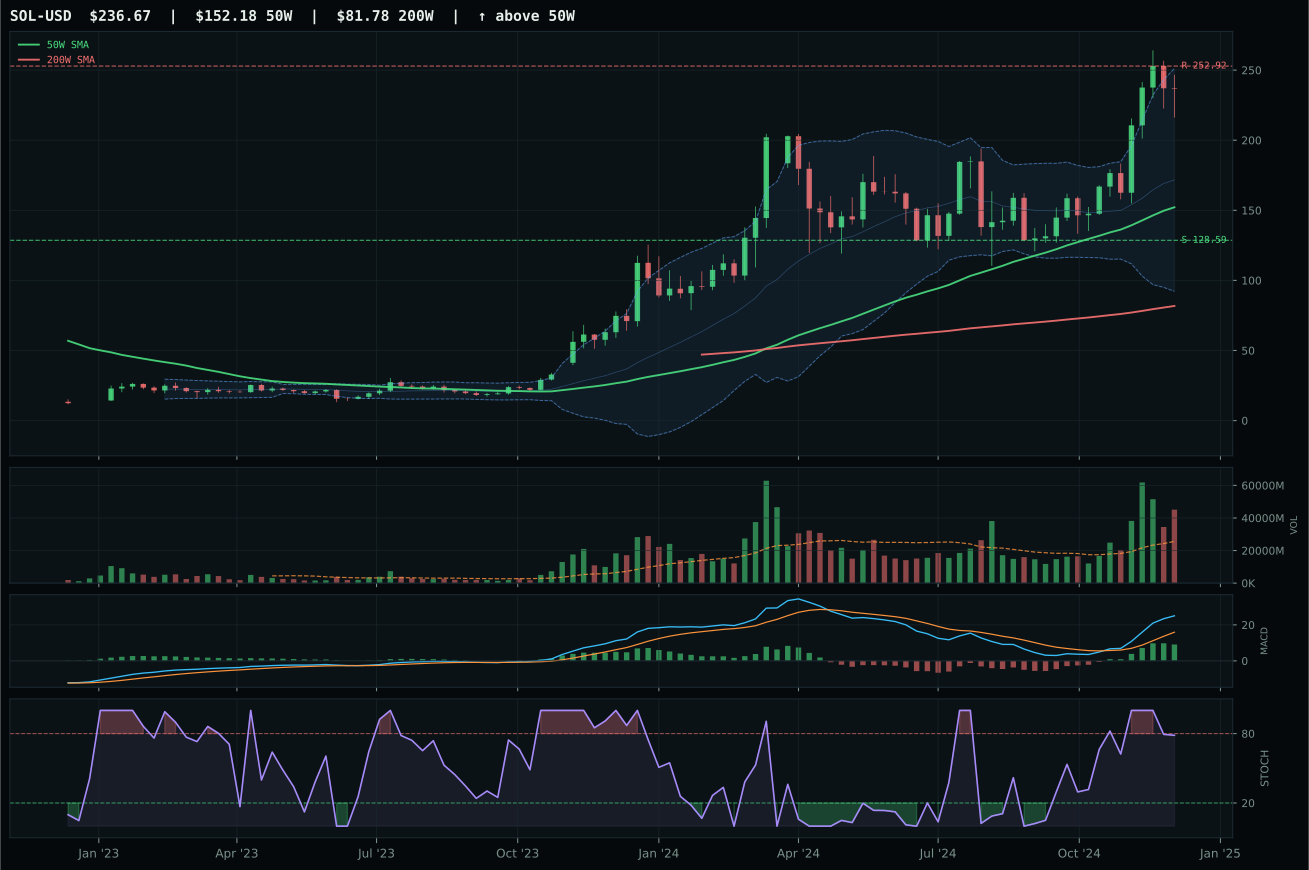
ValueBTC not armed: BTC has not made the first post-breakdown touch of the 200W buy zone after losing the 50W
TrendBTC confirmed: 2 consecutive closes above rising/flat 50W SMA
one or more available conditions failed
Category Rankings
| Rank | Category | Winner | Score | Alloc | 4W Ret | Peers (4W) |
|---|---|---|---|---|---|---|
| 1 | Technology | IGV | 62.7 | 20% | -7.43% | XLK -0.6% · CIBR -0.7% |
| 2 | Nuclear Energy | URNM | 59.5 | 20% | -8.72% | URA -9.3% · NLR -4.6% |
| 3 | AI | AIQ | 57.6 | 10% | -2.19% | BOTZ -2.3% · SMH +5.1% |
| 4 | Utilities & Infrastructure | IGF | 47.2 | 10% | -3.53% | PAVE -8.4% · XLU -3.3% |
| 5 | Precious Metals | GLD | 46.0 | 10% | -1.60% | SLV -7.1% · GDX -7.9% |
| 6 | Defense & Aerospace | XAR | 45.0 | 10% | -0.78% | ITA -3.1% · ROKT +1.2% |
| 7 | Traditional Energy | XLE | 18.8 | 10% | -4.26% | XOP -0.7% · FCG +2.5% |
| 8 | Industrial Metals | COPX | 15.9 | 10% | -9.03% | PICK -11.0% · REMX -9.7% |
| 9 | Emerging Markets | IEMG | 8.1 | 0% | -5.38% | INDA -5.4% · ILF -9.6% |
| 10 | Agriculture & Livestock | MOO | 5.3 | 0% | -8.07% | VEGI -6.5% · WEAT -3.7% |
Technology — IGV
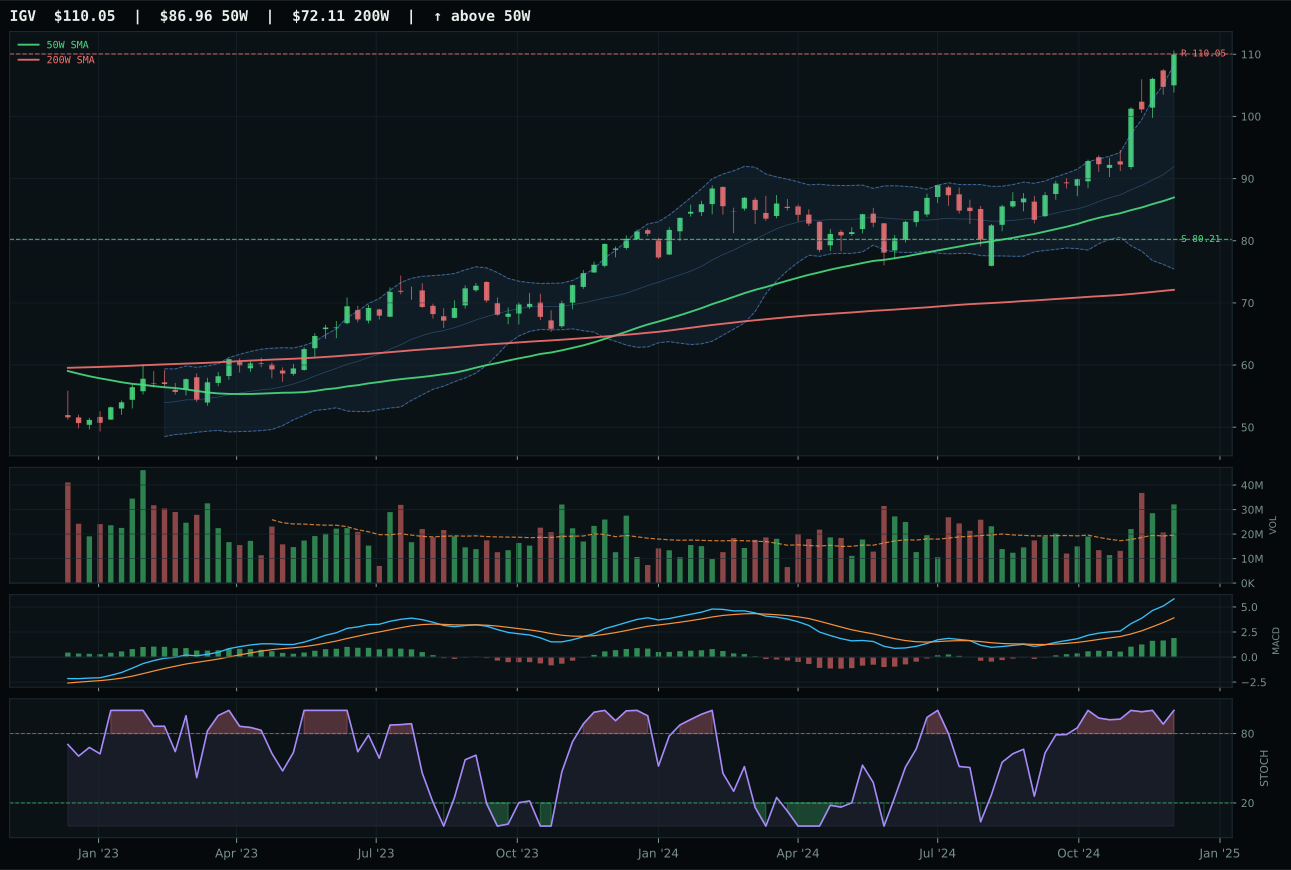
IGV has a vertical extension profile with 19.5% 13-week relative strength versus SPY.
A failed hold above support would weaken the setup.
Actionable but governed by invalidation levels.
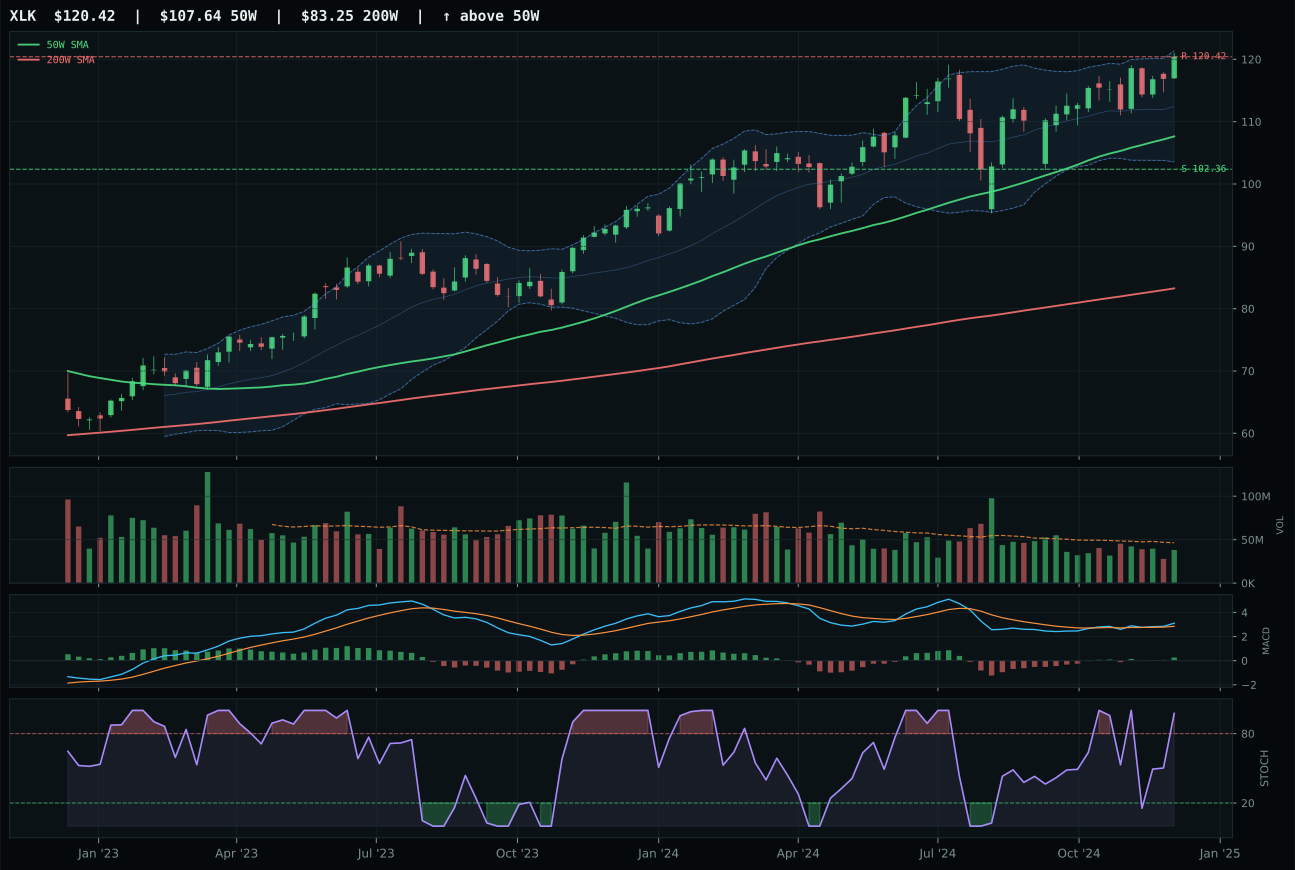
XLK has a neutral structure profile with 5.6% 13-week relative strength versus SPY.
A failed hold above support would weaken the setup.
Actionable but governed by invalidation levels.
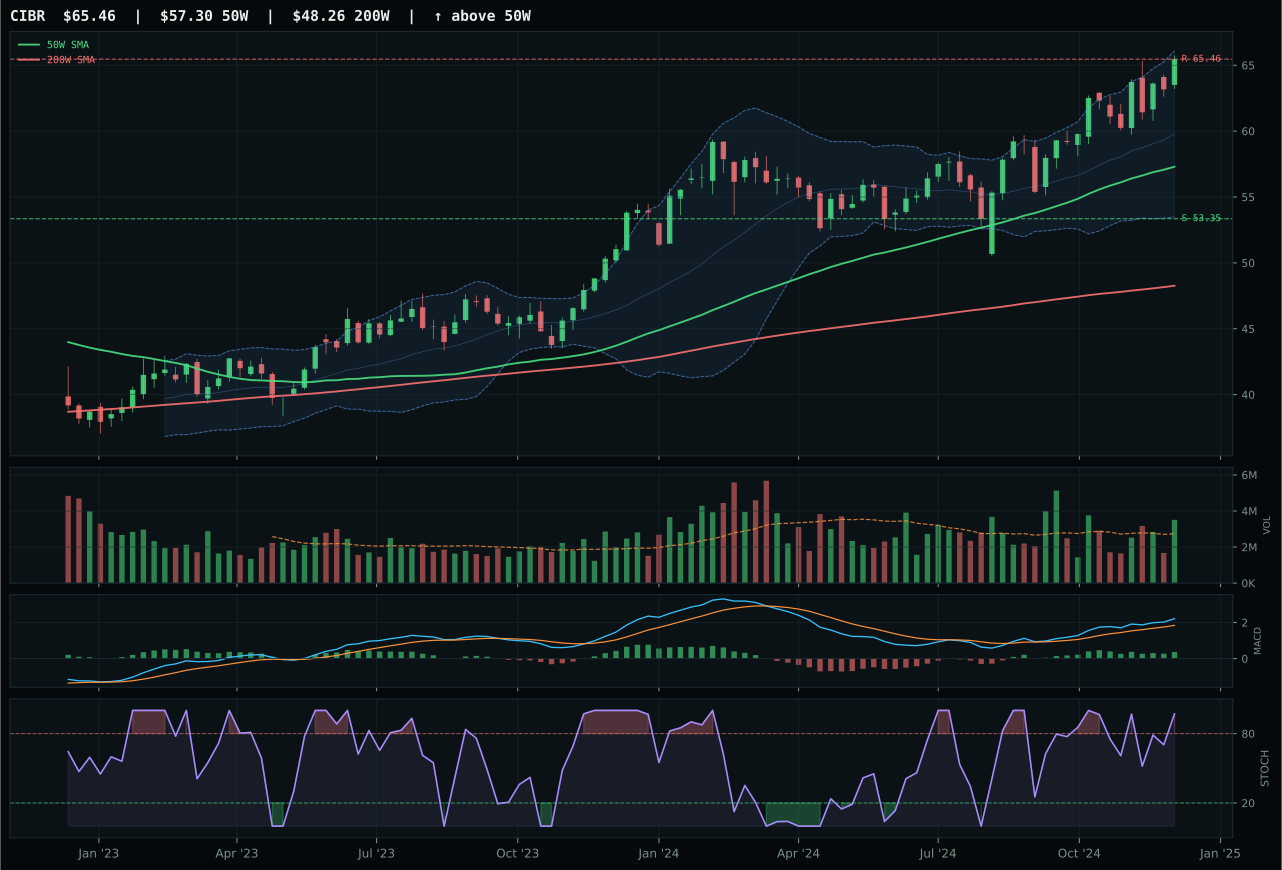
CIBR has a neutral structure profile with 5.7% 13-week relative strength versus SPY.
A failed hold above support would weaken the setup.
Actionable but governed by invalidation levels.
IGV claimed the category decisively by combining confirmed uptrend structure with the strongest relative strength in the group. Price sits 26.6% above its 50-week moving average with a clean 0.7% positive slope, paired with 19.5% outperformance versus SPY and 13.8% outperformance versus category median—a signal that institutional flows are actively rotating into enterprise software rather than rotating out. Volume has stepped up to 1.64x its 20-week average, confirming accumulation rather than distribution into an extended move. XLK lost here not on trend (both are above their 50W and 200W) but on the quality of the sponsorship: its category-relative strength is negative at -0.1%, its 13-week return trails at 18.1% versus IGV's 32.0%, and its volume sits neutral rather than accumulation. The risk/reward gap is material—IGV's downside cushion of 37.2% to support provides real definition for a pullback scenario, while XLK's shallower structure (38.0 vs 45.9) left it vulnerable to the extended timing penalty.
Technology earned 10% allocation despite scoring 63.6 and ranking below the top-2 threshold, reflecting a deliberate hold of exposure rather than aggressive pursuit. The category's macro fit sits at 43.0/100—constrained by active liquidity stress, credit stress, and dollar pressure headwinds that collectively subtract 22 points—offsetting the positive from risk appetite. In a transition regime where mixed signals dominate, Technology's 62% technical weight overpowers its weak 38% macro weight, making the category a tactical keep rather than a conviction buy. IGV's momentum (100.0/100) and trend strength (100.0/100) are undeniable, but the extended entry point and lack of macro sponsorship mean this position should hold steady without expansion. Any deterioration in MACD confirmation or volume would immediately push this below the allocation threshold.
Nuclear Energy — URNM
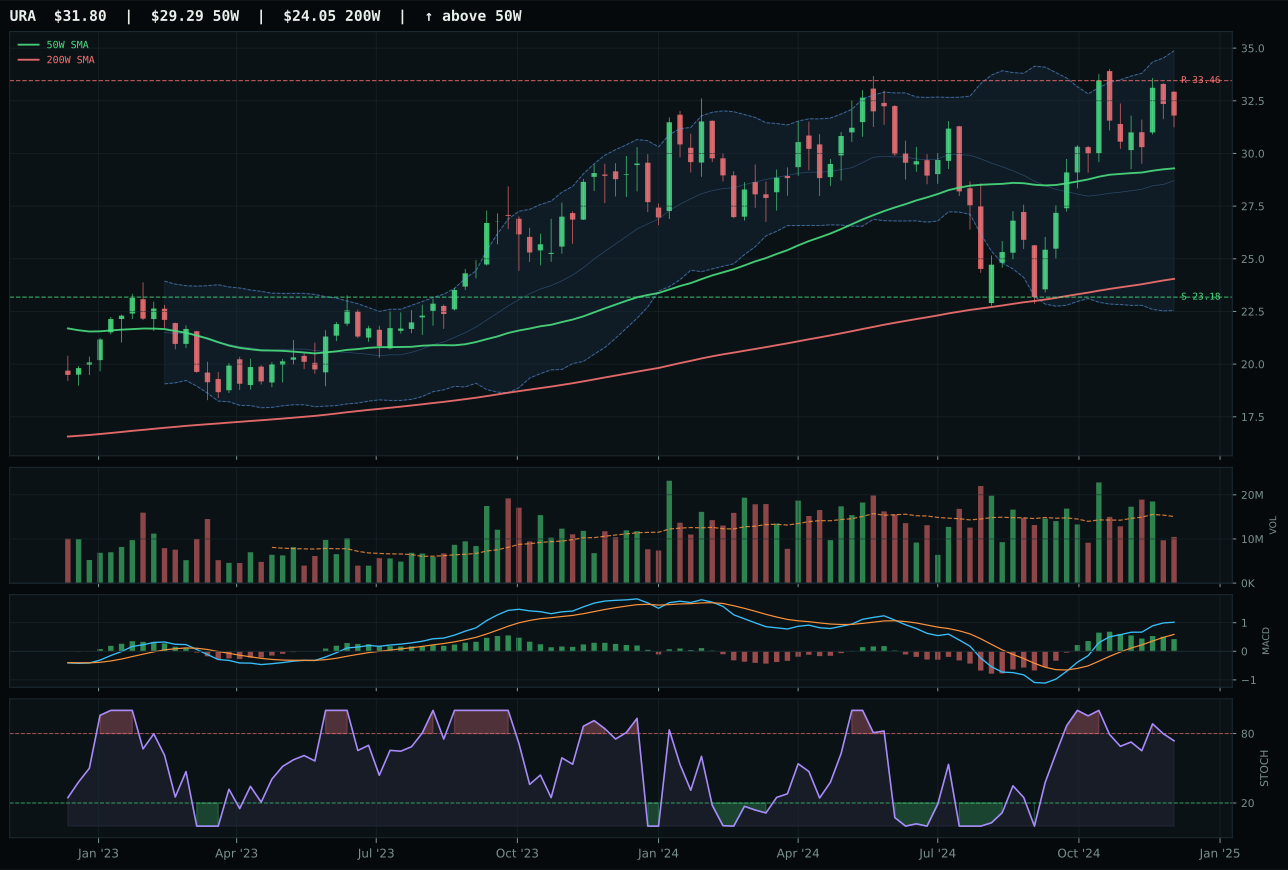
URA has a neutral structure profile with 24.7% 13-week relative strength versus SPY.
A failed hold above support would weaken the setup.
Actionable but governed by invalidation levels.
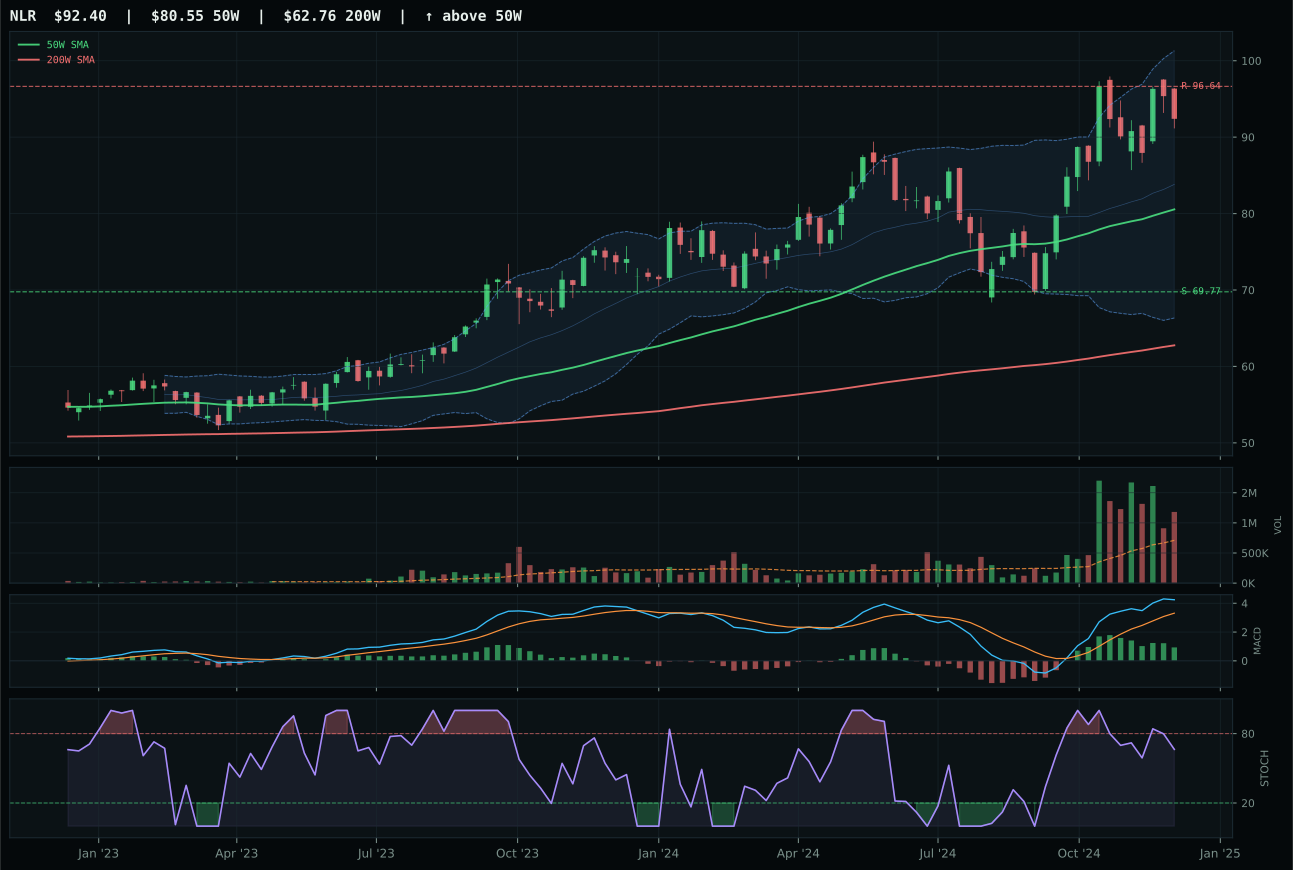
NLR has a neutral structure profile with 20.0% 13-week relative strength versus SPY.
A failed hold above support would weaken the setup.
Actionable but governed by invalidation levels.
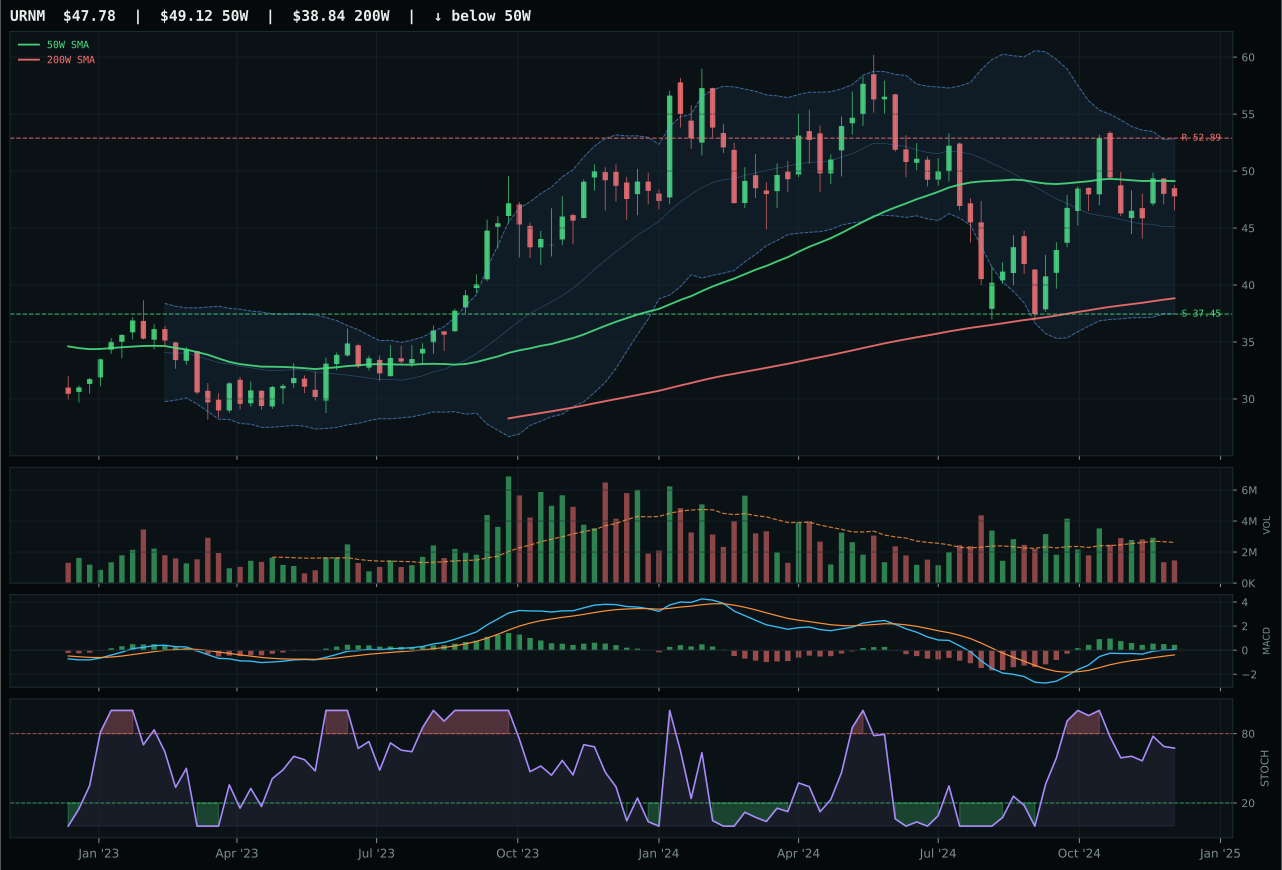
URNM has a compression near 50W profile with 15.1% 13-week relative strength versus SPY.
A failed hold above support would weaken the setup.
Actionable but governed by invalidation levels.
URNM claimed top-2 status by offering the tightest entry geometry in an otherwise stretched category. Price sits 2.7% below the 50W but well above the 200W, with compression at the 0.500 Fibonacci level (48.54) creating a defined inflection point for accumulation. The thirteen-week return of 27.6% is exceptional and paired with 15.1% relative strength to SPY—a signal that uranium-miner beta has attracted genuine institutional interest despite thin volume (0.56x). Stochastic RSI at 0.67 (rising mid-zone) and MACD bullish but flattening suggest early confirmation without overbought extension, giving URNM both momentum and timing definition. URA lost despite stronger absolute momentum (37.2% thirteen-week return and 24.7% SPY relative strength) because it sits 8.6% extended from the 50W in neutral structure—a setup that asks new buyers to pay full extension prices rather than defend a level. The timing gap is decisive: URNM's 100.0 timing score versus URA's 78.0 reflects that compression near 50W is worth more than 9% extra thirteen-week return.
Nuclear Energy earned 10% allocation and top-2 category status by posting a 59.5 score, the second-highest rated category in this week's framework. URNM's compression setup with 100.0/100 timing combined with 100.0/100 momentum confirmation (27.6% 13-week return) created the rare technical profile where both entry timing and directional momentum align. Category macro fit of 43.0/100 provides modest support through AI growth sponsorship at +5 points, offsetting liquidity and credit stress headwinds. The allocation to 10% reflects URNM's dual role: tactical reset-to-recovery entry in a uranium sector fueled by AI power demand narrative, plus strategic hedge to the broader energy allocation (XLE at 5%). URNM's thin volume (0.56x average) is acceptable here because the trend is fresh—accumulation hasn't yet materialized, but the setup invites it. This is a conviction top-2 category because technical precision (timing + momentum + trend) overpowered the thin macro fit; uranium scarcity is narratively dormant but price action is confirming the technical thesis independently.
AI — AIQ
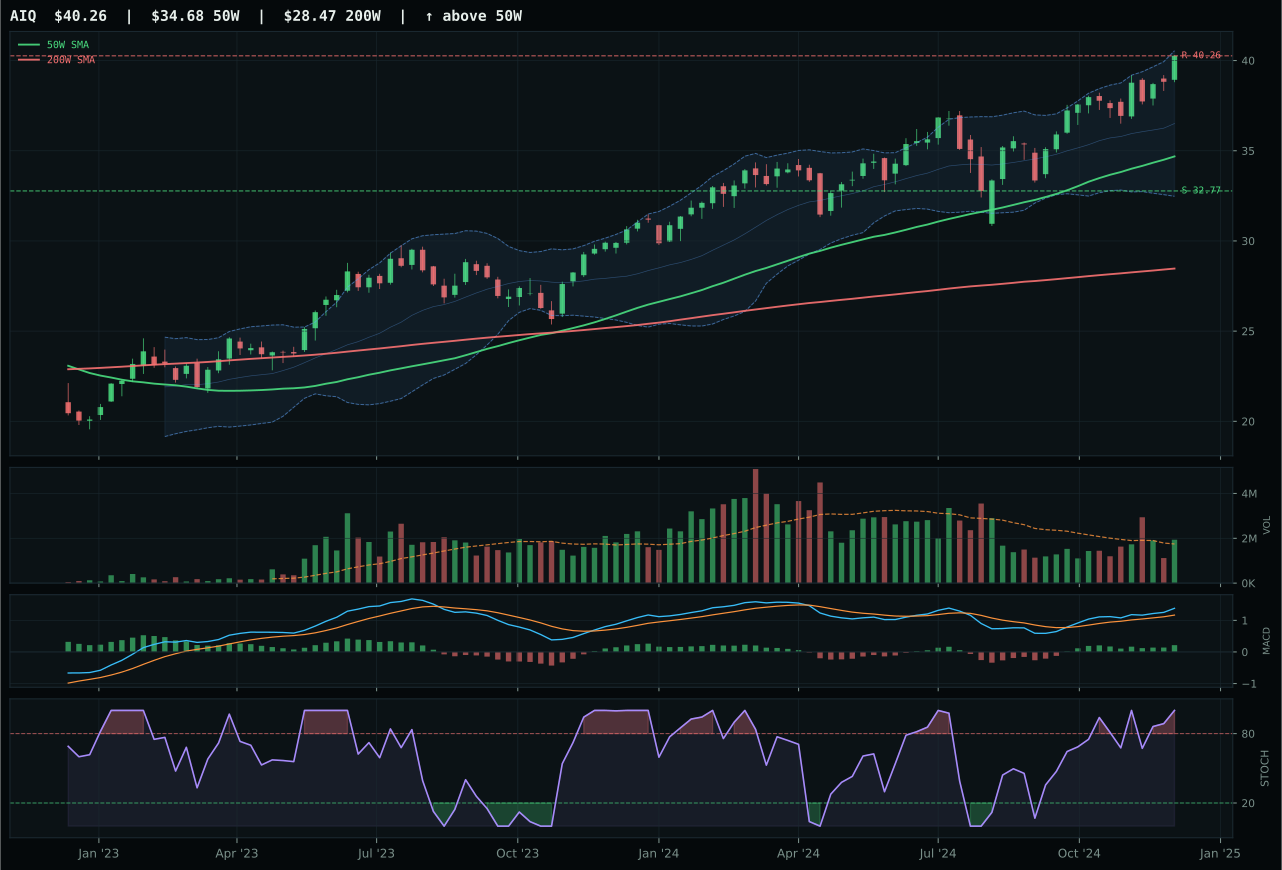
AIQ has a vertical extension profile with 8.2% 13-week relative strength versus SPY.
A failed hold above support would weaken the setup.
Actionable but governed by invalidation levels.
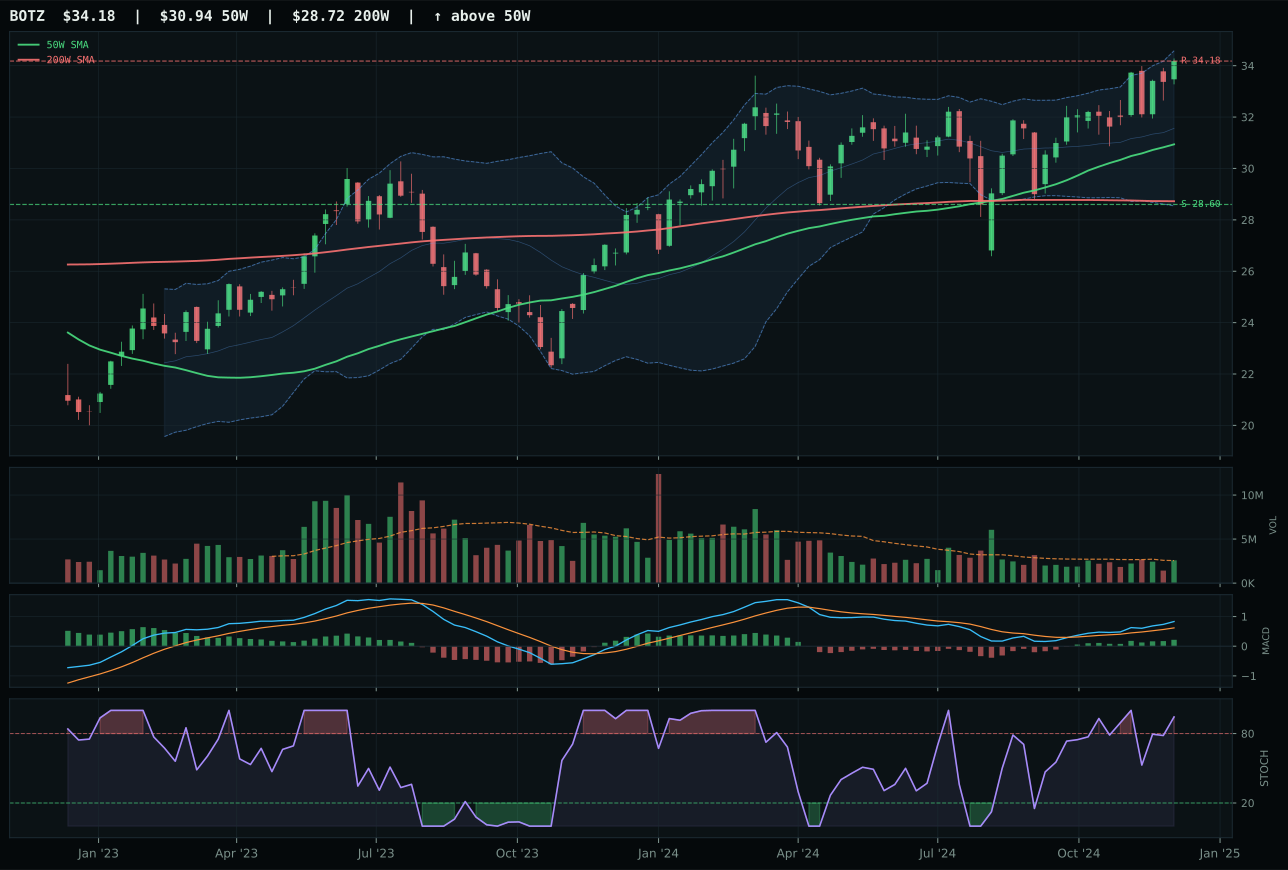
BOTZ has a neutral structure profile with 5.4% 13-week relative strength versus SPY.
A failed hold above support would weaken the setup.
Actionable but governed by invalidation levels.
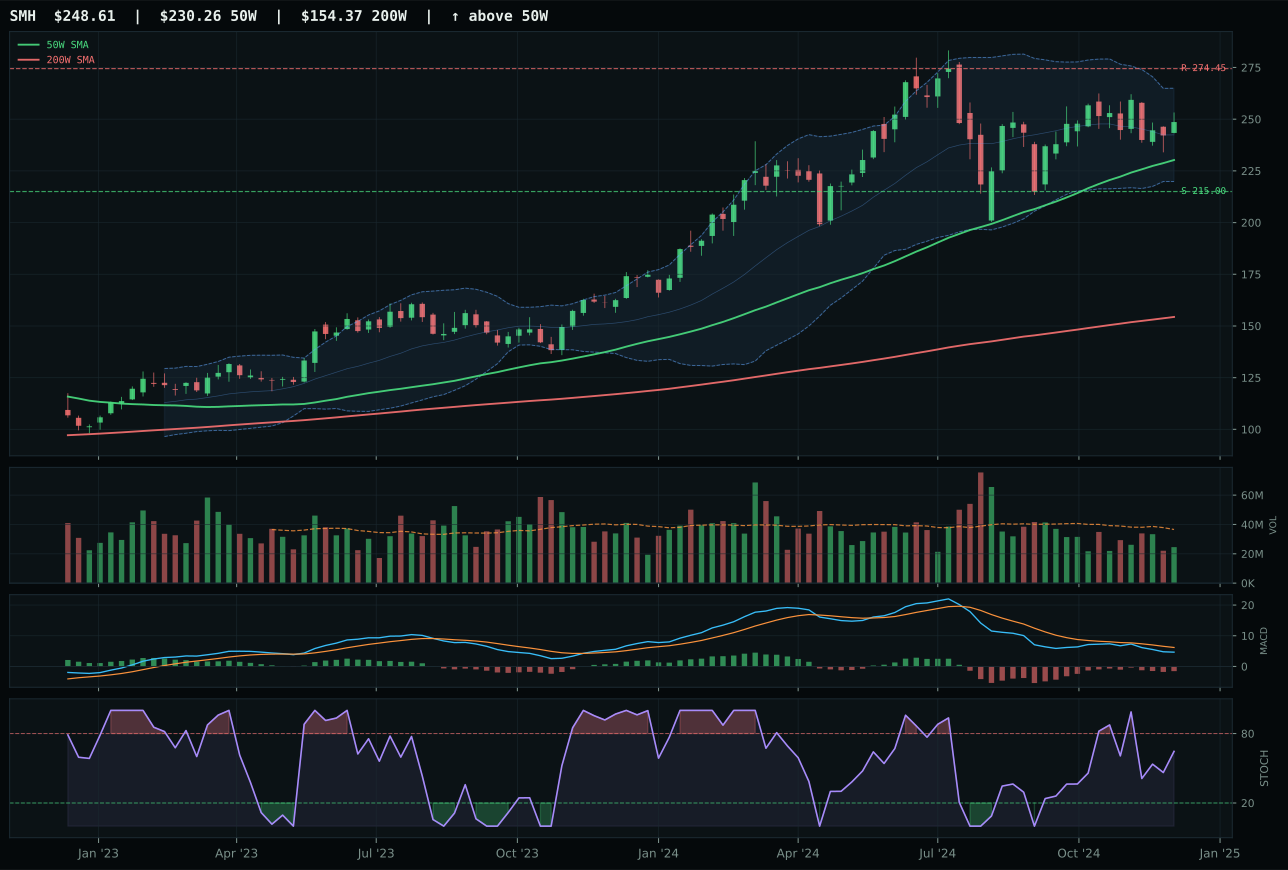
SMH has a neutral structure profile with 3.2% 13-week relative strength versus SPY.
A failed hold above support would weaken the setup.
Actionable but governed by invalidation levels.
AIQ won the category by defending cleaner structure and maintaining volume confirmation where BOTZ's setup had deteriorated. Price extends 16.1% above the 50-week average in a vertical setup, but AIQ's 80.0 structure score (versus BOTZ's 76.6) reflects sharper compression and superior Fibonacci alignment—the difference between a coiling spring and a stretched rubber band. Relative strength to SPY sits at 8.2% with above-average volume participation at 1.11x, suggesting professional accumulation in AI software breadth. BOTZ matched AIQ on momentum (both at 90+) and trend, yet lost 4.5 points because volume confirmation evaporated to neutral while its category-relative strength lagged at 0.0%—a signal that robotics cyclicality failed to attract new money despite a bullish technical backdrop. The gap matters: AIQ's setup is vertical extension with genuine sponsorship; BOTZ's is neutral structure with hope.
AI received 5% allocation despite a 57.6 score and rank outside the top-2, a targeted position that acknowledges the category's technical strength while respecting its macro fragility. Category-level macro fit of 42.0/100 masks a split: risk appetite positive and AI growth sponsorship inject +24 points of support, but liquidity stress, credit stress, and broad market bear constraints subtract -28 points, creating a razor-thin margin. At 62% technical weight driving the scoring, AIQ's 87.6 technical evidence carries significant load, but the 5% sleeve signals this is a prove-it position. Should URA or another uranium-driven rotation accelerate, or if credit stress eases, AI could graduate to a top-2 category; for now, it holds as a specialty bet rather than core allocation.
Utilities & Infrastructure — IGF
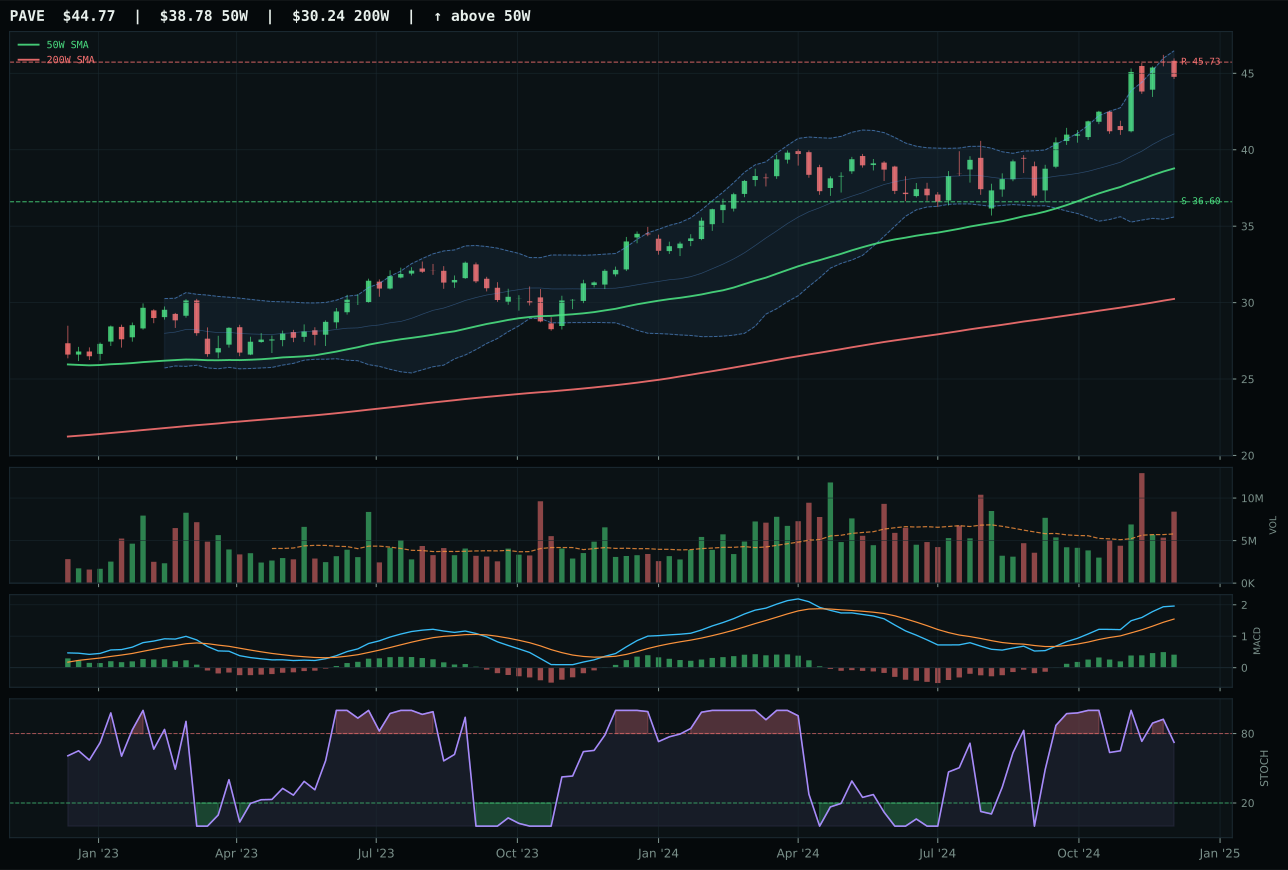
PAVE has a vertical extension profile with 8.5% 13-week relative strength versus SPY.
A failed hold above support would weaken the setup.
Actionable but governed by invalidation levels.
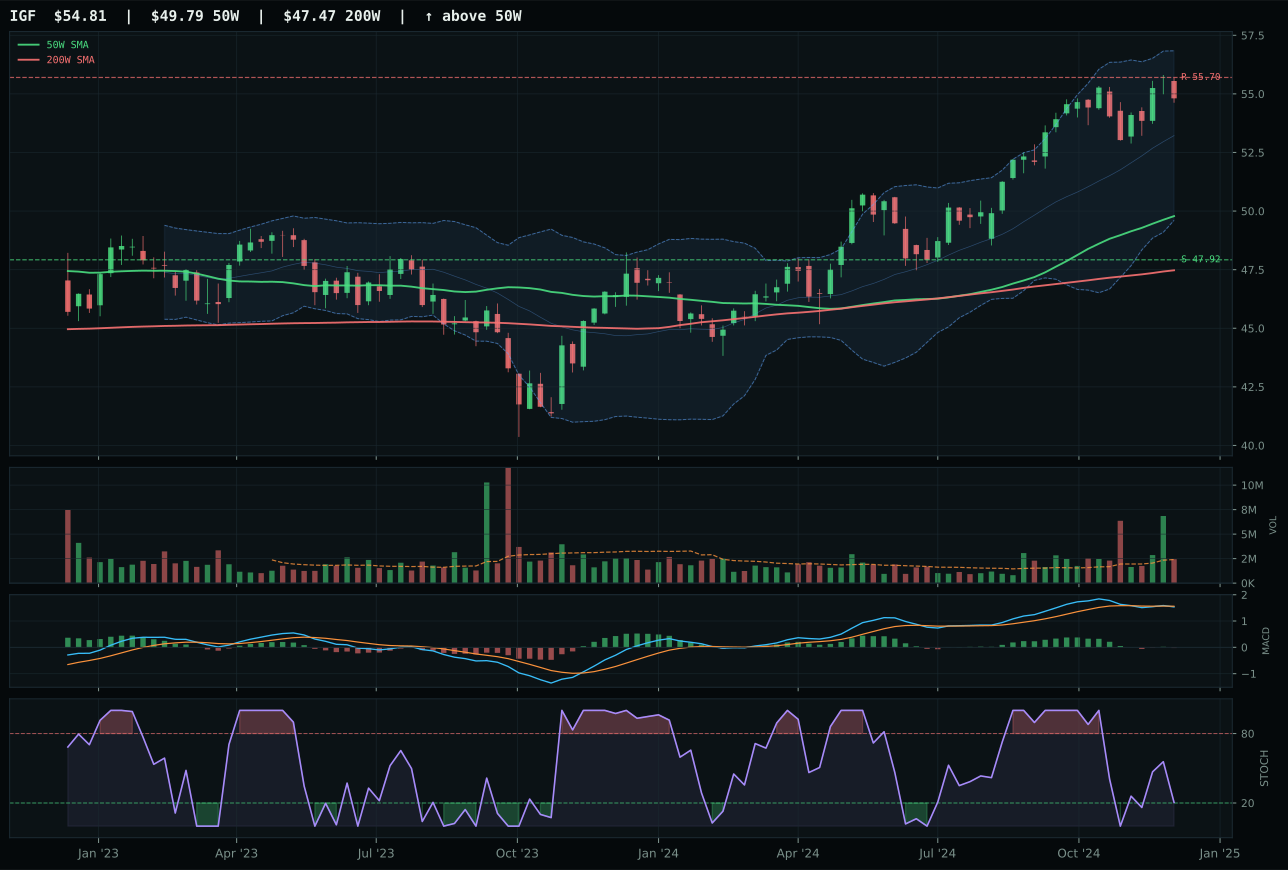
IGF has a neutral structure profile with -7.3% 13-week relative strength versus SPY.
A failed hold above support would weaken the setup.
Actionable but governed by invalidation levels.
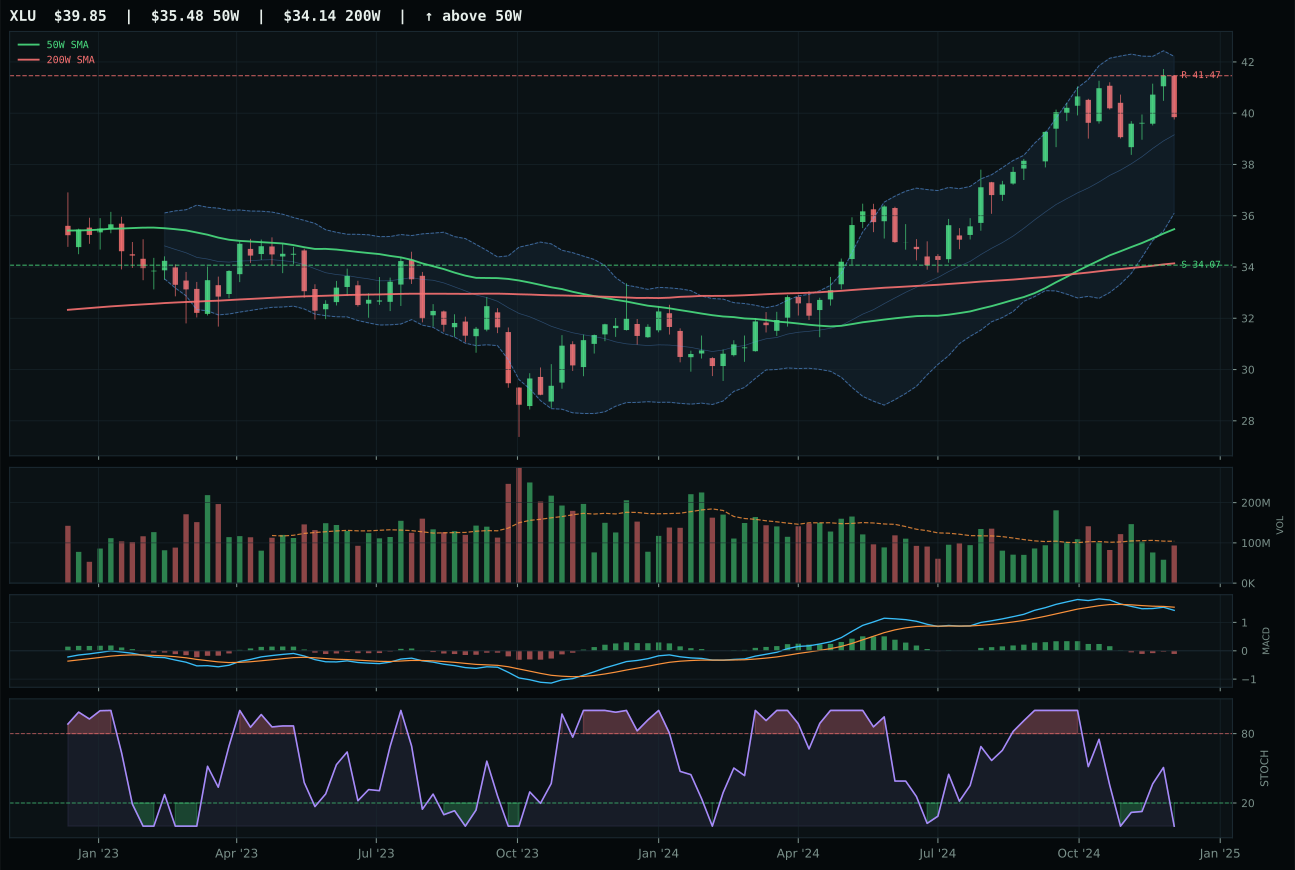
XLU has a neutral structure profile with -7.5% 13-week relative strength versus SPY.
A failed hold above support would weaken the setup.
Actionable but governed by invalidation levels.
IGF won a category where technical quality is weak across the board by default-to-the-least-broken logic. Price sits 10.1% above the 50W in neutral structure with MACD bearish/weakening and stochastic RSI rising mid-zone (0.21)—not a compelling setup, but more defensible than PAVE's 15.4% extension into vertical structure where stochastic RSI has already fallen to neutral (0.53), suggesting momentum is reversing. IGF's timing score of 70.0 beats PAVE's 53.0 because proximity to the 50W (10.1% vs 15.4%) leaves room for pullback without breaking critical support, whereas PAVE is already extended and vulnerable to profit-taking. Relative strength splits: PAVE leads on SPY comparison (8.5% vs -7.3%) but that only amplifies timing risk—stronger absolute performance paired with stretched positioning creates a breakdown scenario. IGF's five-week return of 1.3% is modest, yet it avoids PAVE's 21.0% thirteen-week return that now looks like a near-term exhaustion marker rather than momentum continuation.
Utilities & Infrastructure earned 5% allocation despite a 47.3 score outside top-2, a position that anchors the defensive sleeve alongside Precious Metals as portfolio insurance against growth volatility. Category macro fit of 53.0/100 benefits from transition regime support at +4 points and broad market bear sponsorship at +4 points, offsetting modest headwinds. IGF's 42.5 technical evidence is modest, but global infrastructure income provides yield stability irrespective of momentum conditions. This 5% position is structural rather than tactical: when Technology (10%, extended setup) and AI (5%, thin participation) roll over or when credit stress intensifies, Utilities & Infrastructure tends to outperform on relative-value grounds and dividend safety. IGF's MACD bearish/weakening and thin accumulation (neutral volume) mean this is not a fresh entry point; it is a held position pending either break above resistance at 55.70 or a 10%+ drawdown to create fresh entry on volume. Monitor PAVE's extension carefully—if PAVE breaks above 45.73, it may graduate to a category upgrade; if IGF breaks below support, a full rotation to PAVE would be warranted.
Precious Metals — GLD
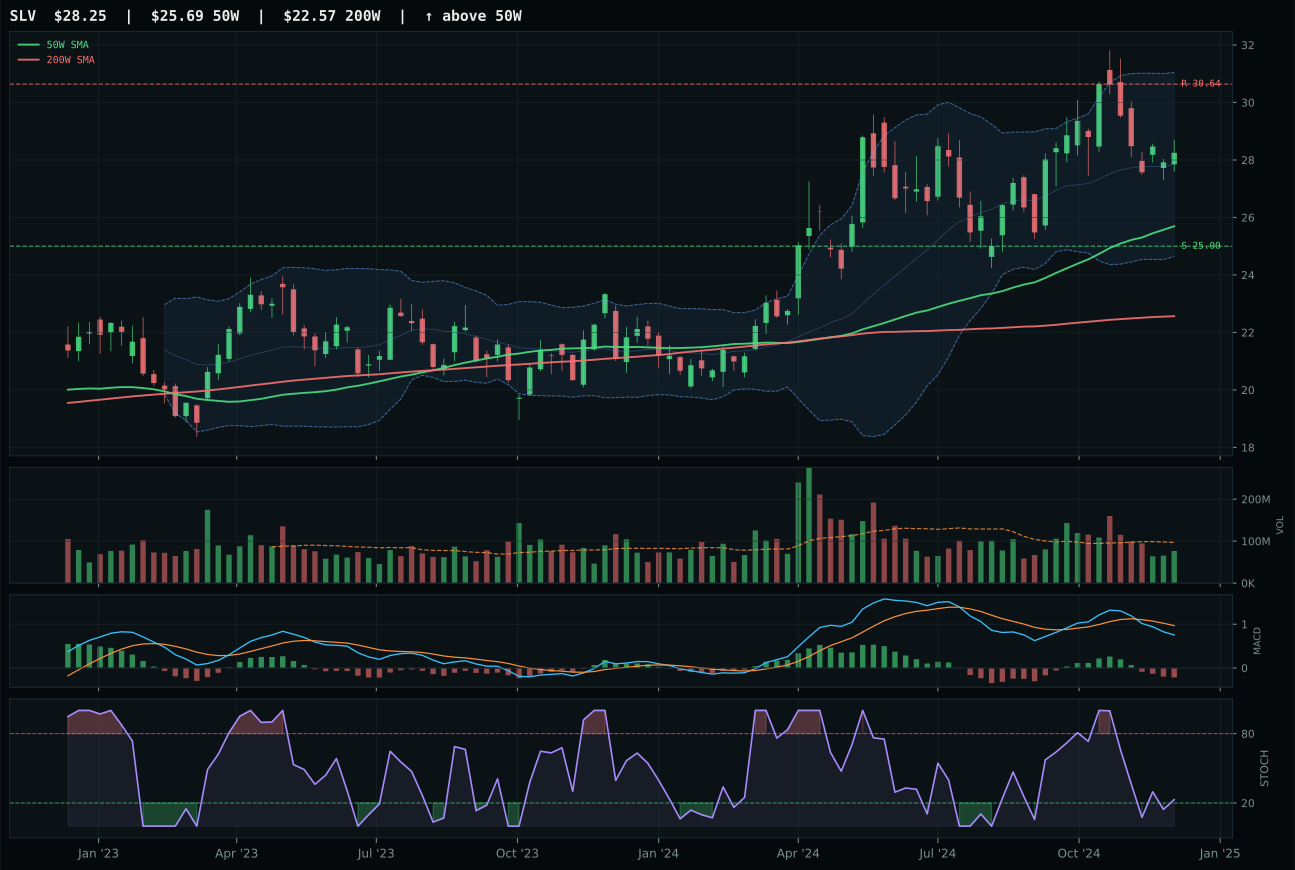
SLV has a neutral structure profile with -1.6% 13-week relative strength versus SPY.
A failed hold above support would weaken the setup.
Actionable but governed by invalidation levels.
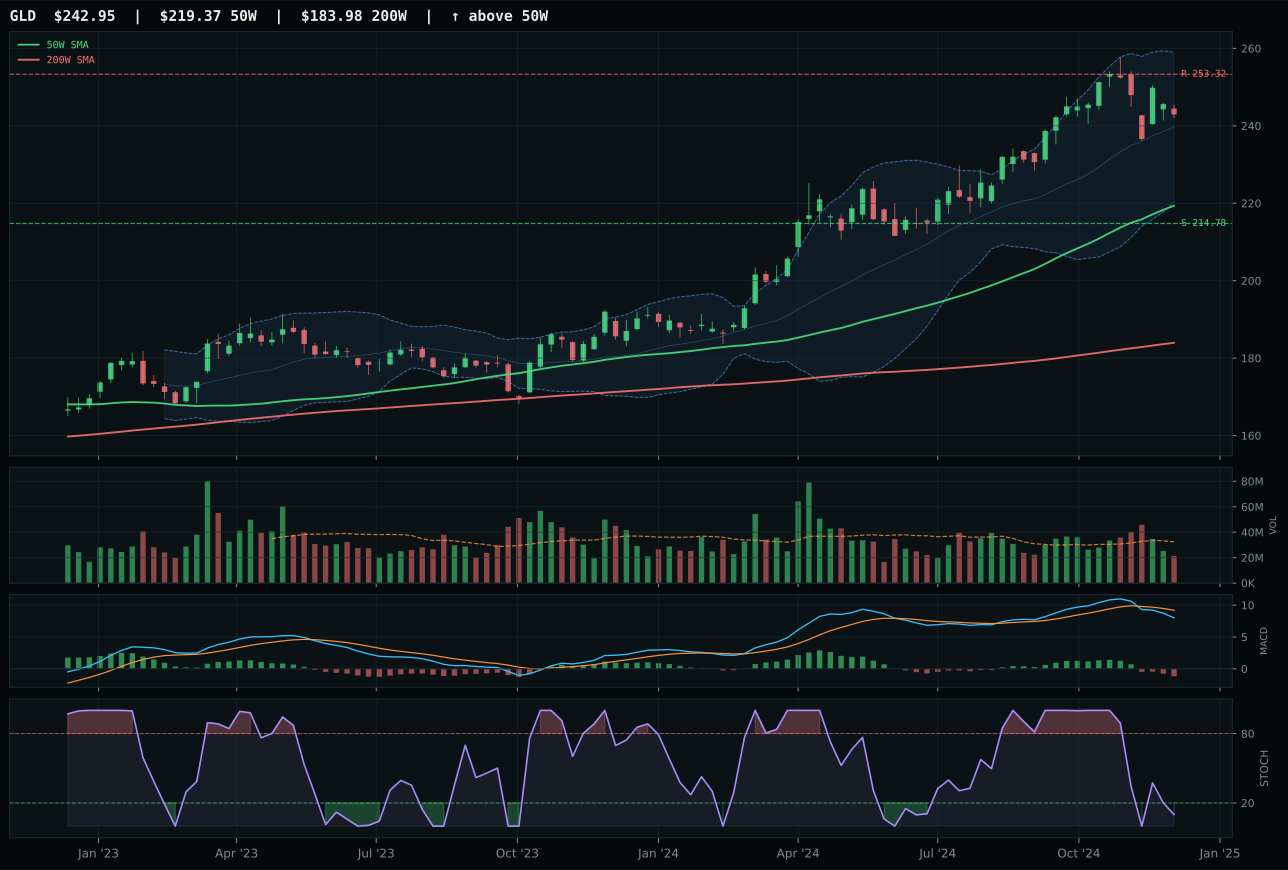
GLD has a neutral structure profile with -7.1% 13-week relative strength versus SPY.
A failed hold above support would weaken the setup.
Actionable but governed by invalidation levels.
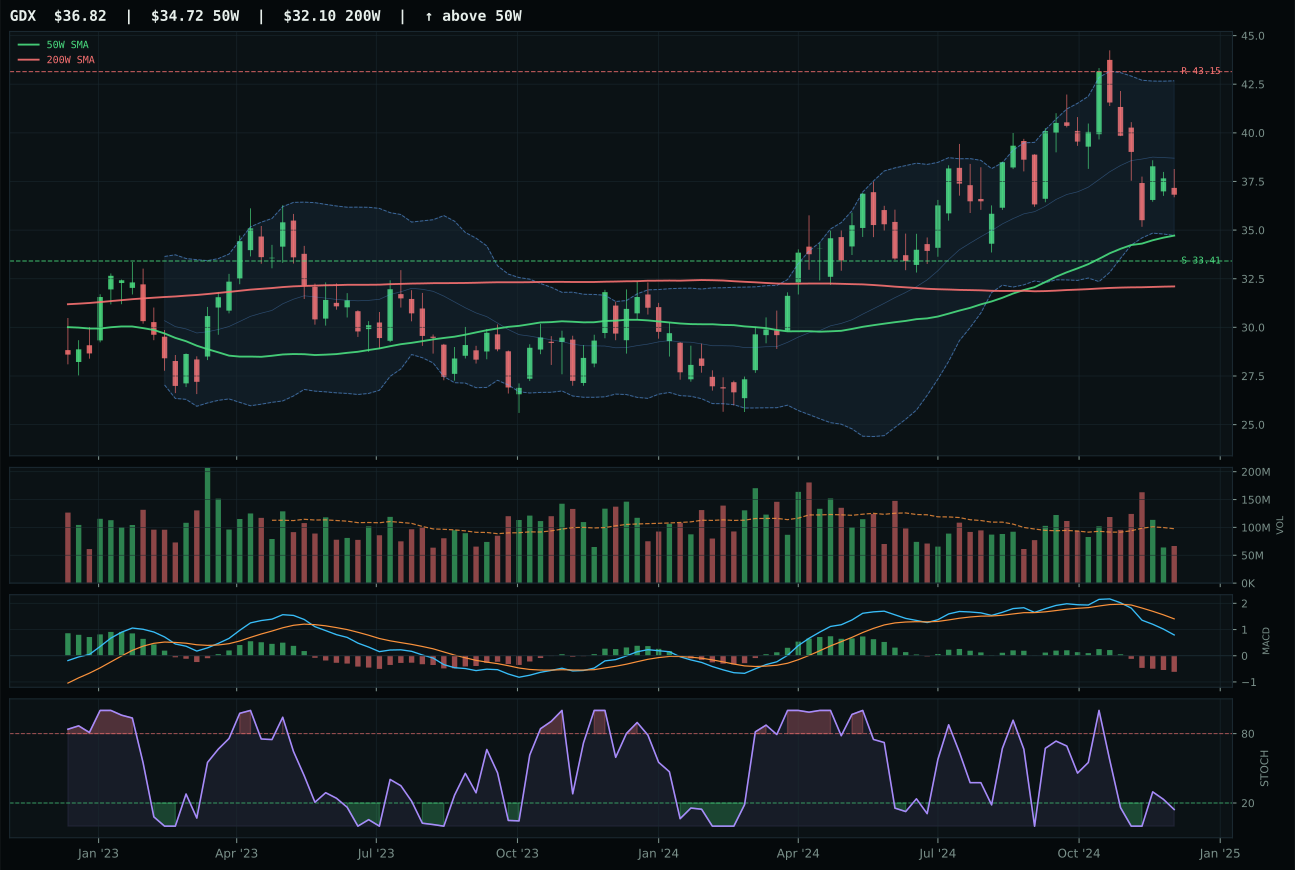
GDX has a neutral structure profile with -11.1% 13-week relative strength versus SPY.
A failed hold above support would weaken the setup.
Actionable but governed by invalidation levels.
GLD edged SLV by capturing better timing and stochastic positioning despite both carrying negative momentum. Price extends 10.7% above the 50W in a neutral structure where MACD is bearish/weakening on both ETFs, but GLD's stochastic RSI at 0.10 (oversold turn up) positions it ahead of SLV's 0.43 (rising mid-zone)—a critical difference when neither ETF is delivering positive thirteen-week returns (GLD: 5.3%, SLV: 10.9%). Volume sits thin on both (0.66x and neutral respectively), so the category represents a defensive monetary-hedge allocation rather than momentum thrust. GLD's timing score of 84.0 versus SLV's 78.0 reflects better Fibonacci alignment to the deep retracement zone and earlier positioning in the oversold-to-recovery sequence. The one-point swing in structure (71.0 vs 69.6) edges toward gold's benefit, though the real margin is in the stochastic interpretation—GLD is closer to a defined bounce point.
Precious Metals earned 5% allocation despite a 46.0 score outside the top-2, a position justified entirely by macro fit of 63.0/100—the strongest category-level macro support in the entire portfolio. The monetary hedge bid descriptor active at +14 points, combined with dollar pressure at +3 and metals scarcity at +7, creates a 24-point macro boost that compensates for weak technical evidence (38.8 for GLD). In a transition regime with mixed signals, this is the leveraged-yield and tail-risk hedge sleeve that performs when growth stalls or credit stress accelerates. GLD's technical weakness (MACD bearish, stochastic oversold, volume thin at 0.66x average) is actually a feature in this role—the metal doesn't need to outpace equities, only hold value and provide volatility diversification. The 5% position should be monitored for volume confirmation of any bottoming pattern; without it, GLD remains a strategic macro hedge rather than a technical conviction.
Defense & Aerospace — XAR
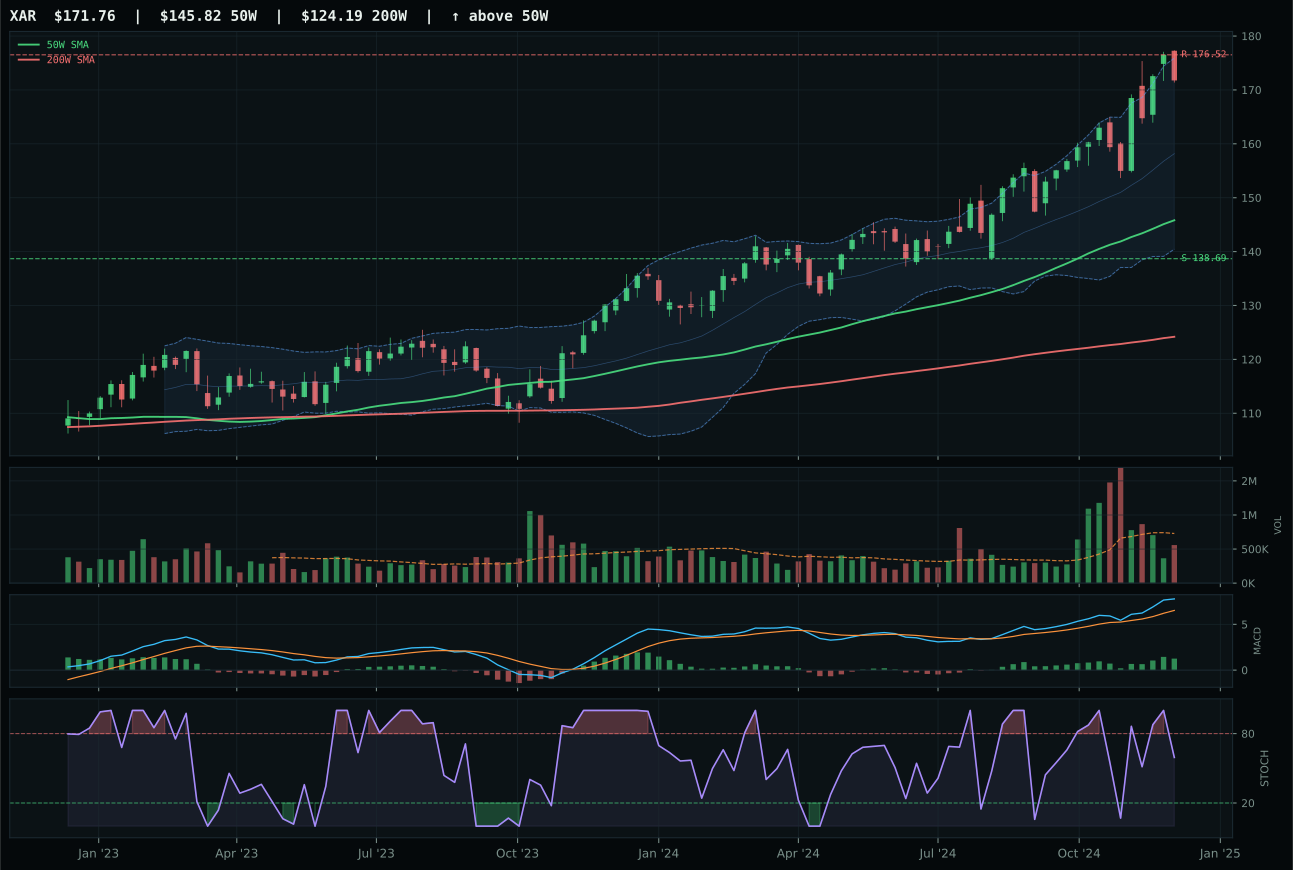
XAR has a vertical extension profile with 4.0% 13-week relative strength versus SPY.
A failed hold above support would weaken the setup.
Actionable but governed by invalidation levels.
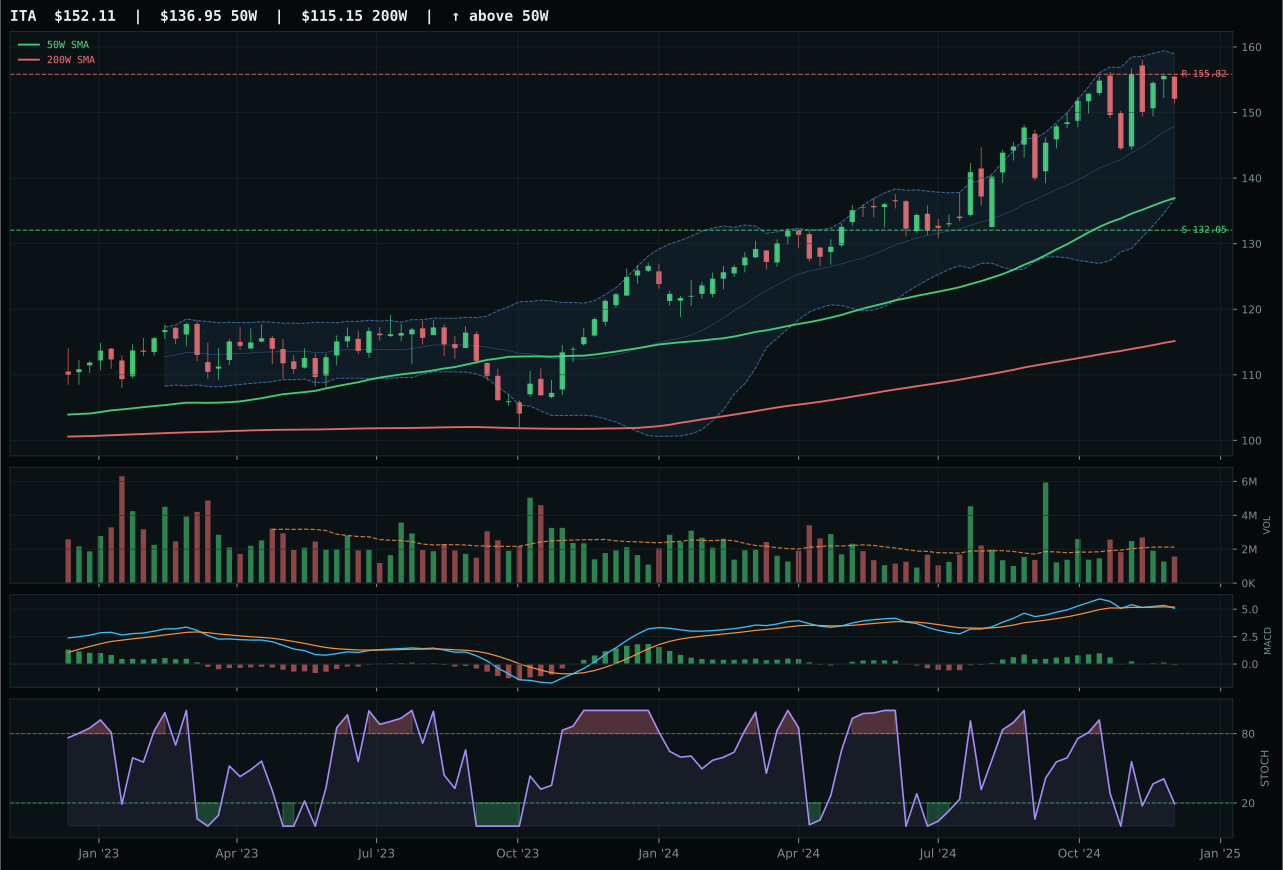
ITA has a neutral structure profile with -3.8% 13-week relative strength versus SPY.
A failed hold above support would weaken the setup.
Actionable but governed by invalidation levels.
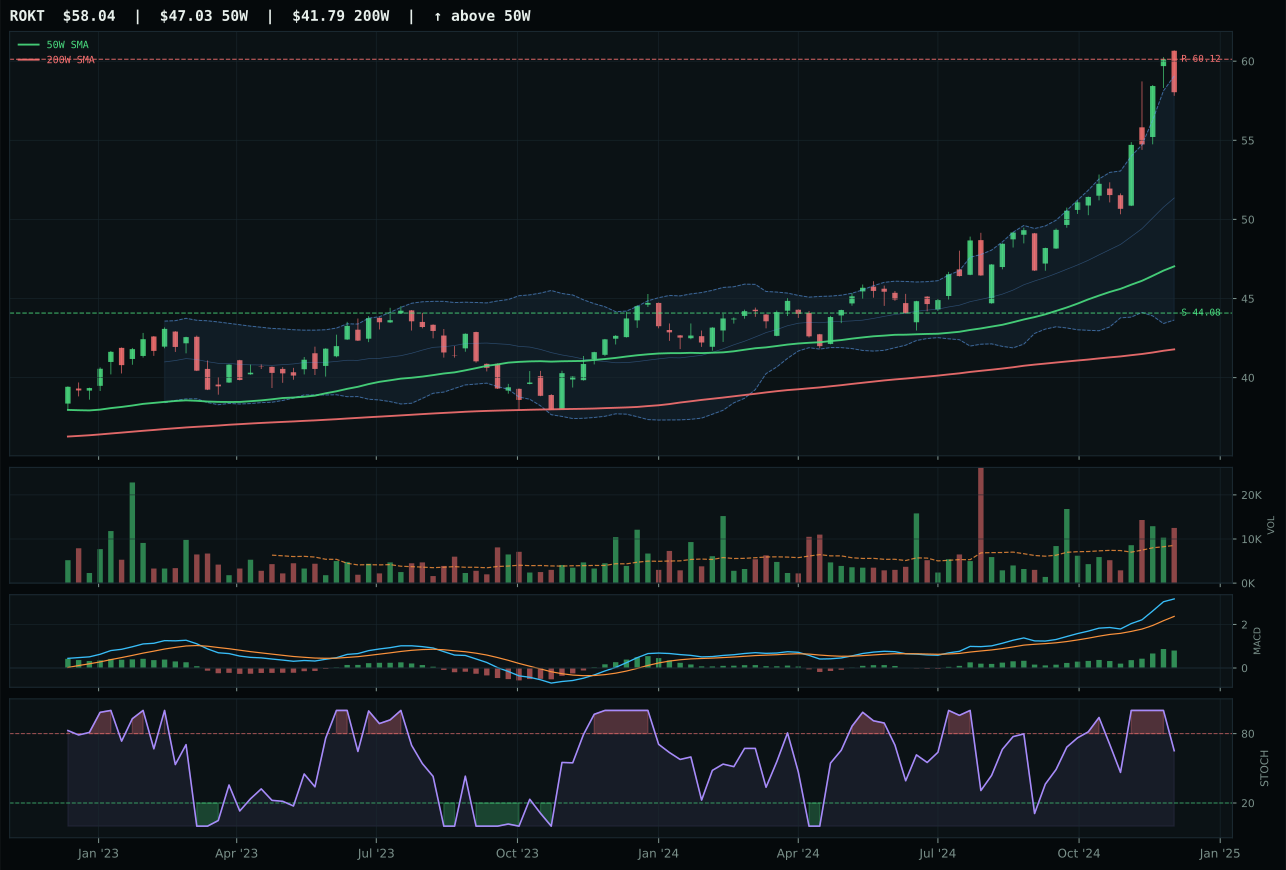
ROKT has a vertical extension profile with 11.6% 13-week relative strength versus SPY.
A failed hold above support would weaken the setup.
Tracked, but not top-2 eligible because: .
XAR secured category leadership by maintaining the only bullish MACD divergence while preserving reasonable entry geometry. Price sits 17.8% extended from the 50-week average in a vertical setup, but the stochastic RSI at 0.59 (rising mid-zone rather than overbought) gives XAR a timing advantage over ITA's oversold turn-up setup that suggests mean reversion rather than continuation. Relative strength is flat at 4.0% versus SPY, yet XAR's MACD is bullish and improving while ITA's has deteriorated to bearish/weakening—a meaningful divergence that separates conviction from bounce. Volume sits neutral on both, so the spread comes down to momentum confirmation and structural integrity: XAR's 16.5% thirteen-week return with positive MACD trajectory beats ITA's 8.7% return paired with broken technicals. The 9.1-point gap reflects category-wide weakness, not category selection uncertainty.
Defense & Aerospace earned 5% despite a 45.0 score and no top-2 eligibility, a positioning that reflects macro tailwinds barely offsetting technical softness. The category's 60.0/100 macro fit benefits from transition regime support, broad market bear sponsorship, and dollar pressure positivity—a rare alignment where geopolitical and currency shifts favor defense spending. Yet technical ETF evidence drives only 75.9/100 for the representative (XAR), a material constraint when macro can't compensate. At 45.0 final category score, this is ranked in the lower half, suggesting the 5% sleeve is primarily a macro hedge against recession or escalation scenarios. The setup lacks conviction: XAR is extended but not strongly accumulated, and timing is neither optimally oversold nor freshly broken out. This position should be monitored for accumulation volume or a fresh breakdown below support; without either, it remains a small macro-based reserve rather than a technical conviction.
Traditional Energy — XLE
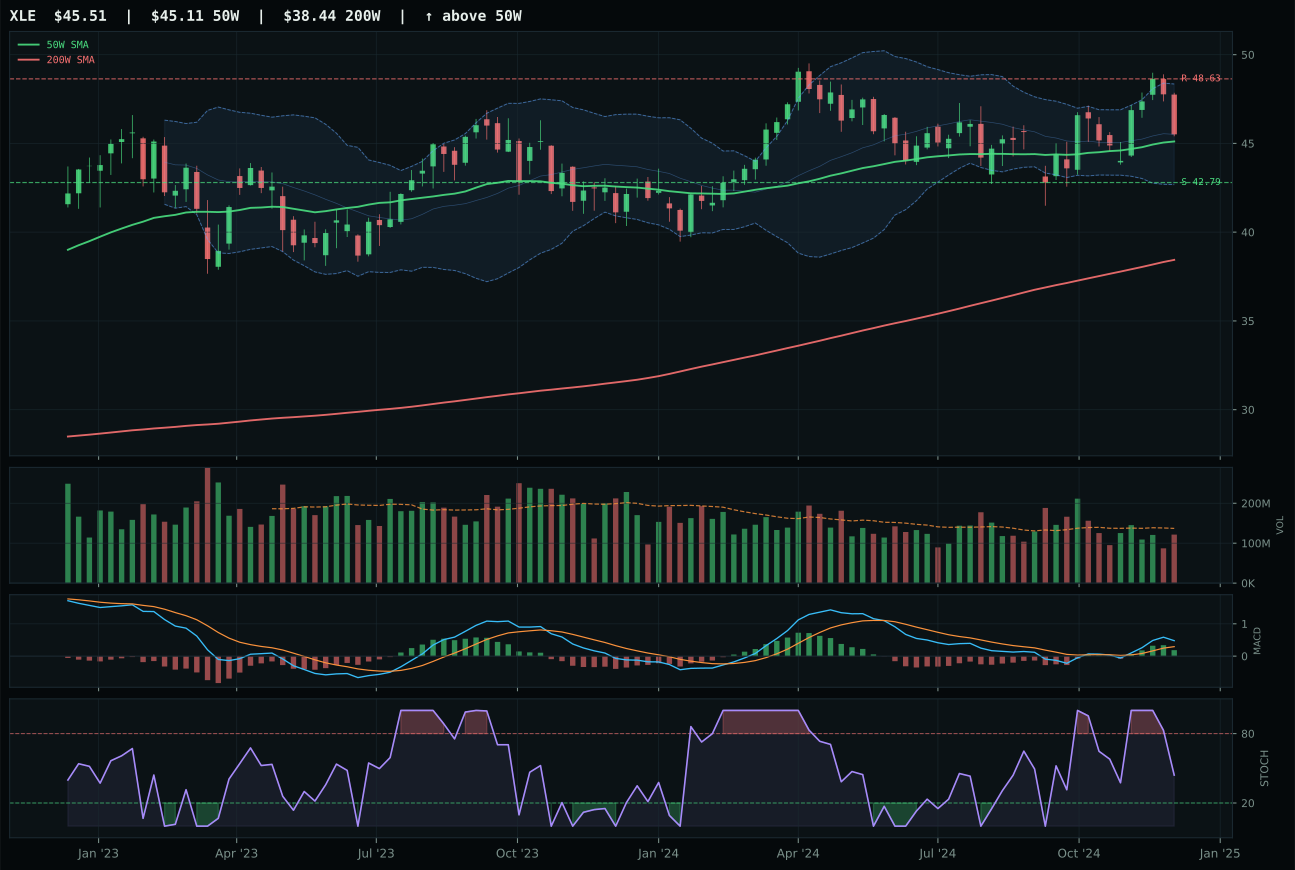
XLE has a compression near 50W profile with -6.7% 13-week relative strength versus SPY.
A failed hold above support would weaken the setup.
Actionable but governed by invalidation levels.
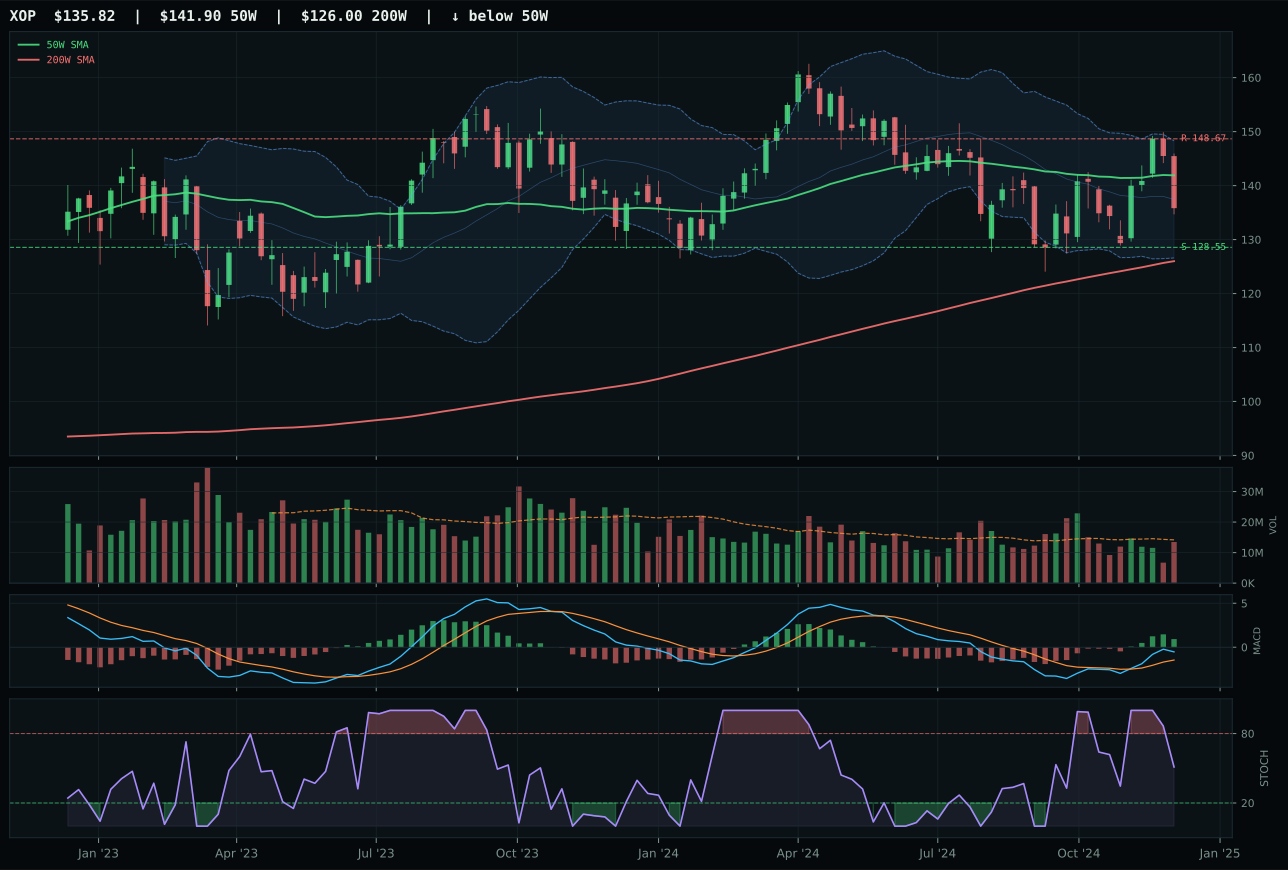
XOP has a neutral structure profile with -7.3% 13-week relative strength versus SPY.
A failed hold above support would weaken the setup.
Actionable but governed by invalidation levels.
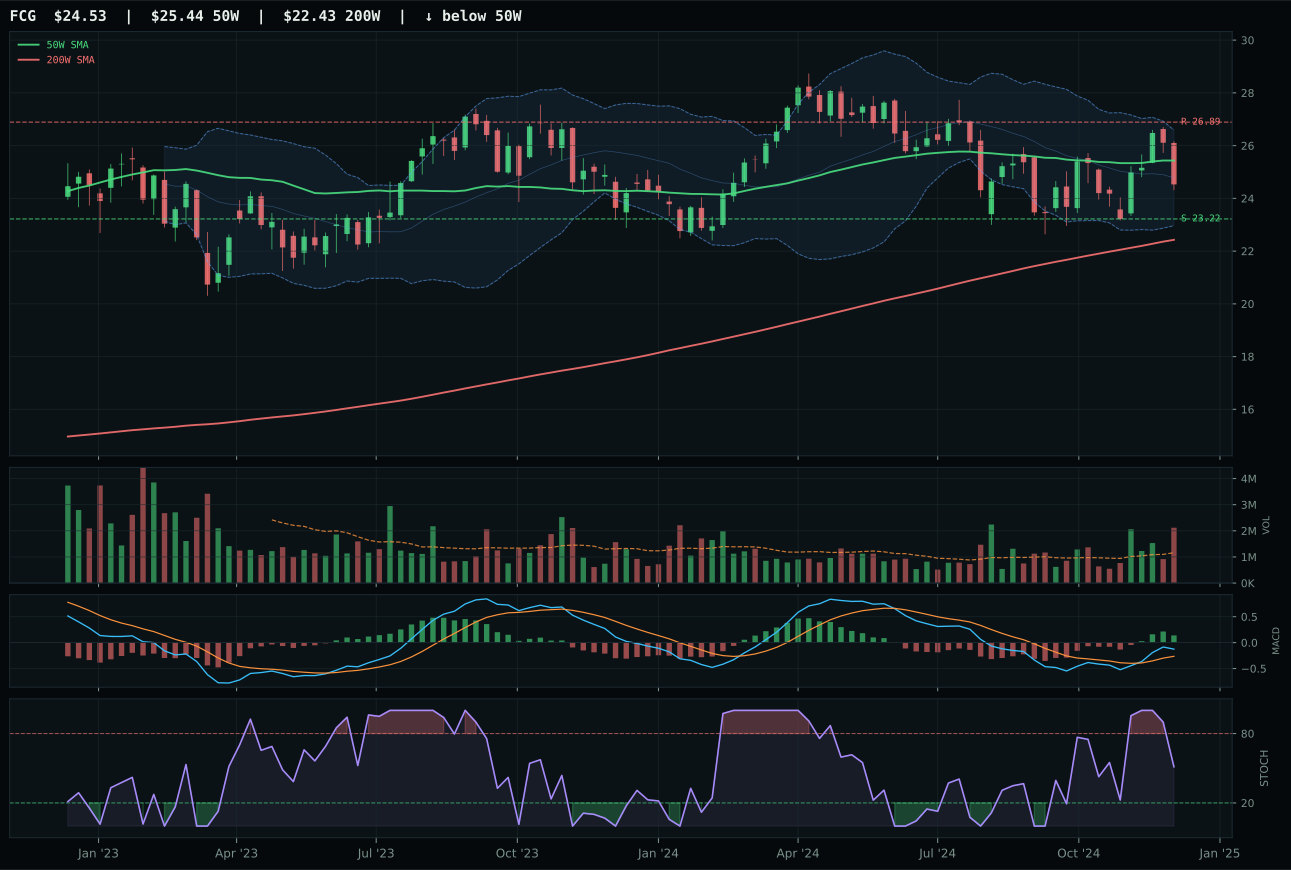
FCG has a neutral structure profile with -8.0% 13-week relative strength versus SPY.
A failed hold above support would weaken the setup.
Actionable but governed by invalidation levels.
XLE defeated XOP by compressing near the 50W while preserving bullish MACD confirmation, a setup that appeals to institutions seeking defined entry risk in a macro regime of energy weakness. Price is only 1.0% above the 50W with volume at 0.89x (neutral), yet this proximity to trend reference is precisely what XLE uses to justify its 100.0 timing score—buyers are not extending; they are waiting for a tight-setup breakout. MACD is bullish and improving, stochastic RSI is falling/neutral at 0.43, and support/resistance (42.79/48.63) creates a narrow coil where breakout volume would signal genuine accumulation. XOP's setup is neutral structure at 8.6% from the 50W with timing score only 97.0 (slightly weaker on distance), meaning XOP asks the allocator to pay for stretch rather than wait for compression. Both have negative SPY relative strength (-6.7% and -7.3%), but XLE's category-relative edge of 0.6% (vs 0.0%) reflects that integrated cash-flow defense is finding modest rotation.
Traditional Energy earned 5% allocation despite ranking 19.6 (outside top-2) because it provides portfolio ballast in a transition regime where oil demand and dollar dynamics remain unpredictable. Category macro fit of 36.0/100 is weak—credit stress and liquidity stress each subtract -7 points with no offsetting descriptor support—so this allocation rests almost entirely on technical merit and portfolio construction logic. XLE's 78.5 technical evidence is solid, placing energy above the absolute floor, but the category's 62% technical / 38% macro weighting means the weak macro fit is a consistent drag. The real justification is that 5% in defensive, cash-generating energy (XLE's integrated upstream/downstream model) provides portfolio stability when growth allocations (AI, Technology) prove volatile. XLE trades near the 50W with bullish MACD and compression structure—a hold rather than a buy, a position that should be monitored for break below 42.79 support or accumulation above 48.63 resistance. Any deterioration in crude prices or demand signals would justify immediate reduction.
Industrial Metals — COPX
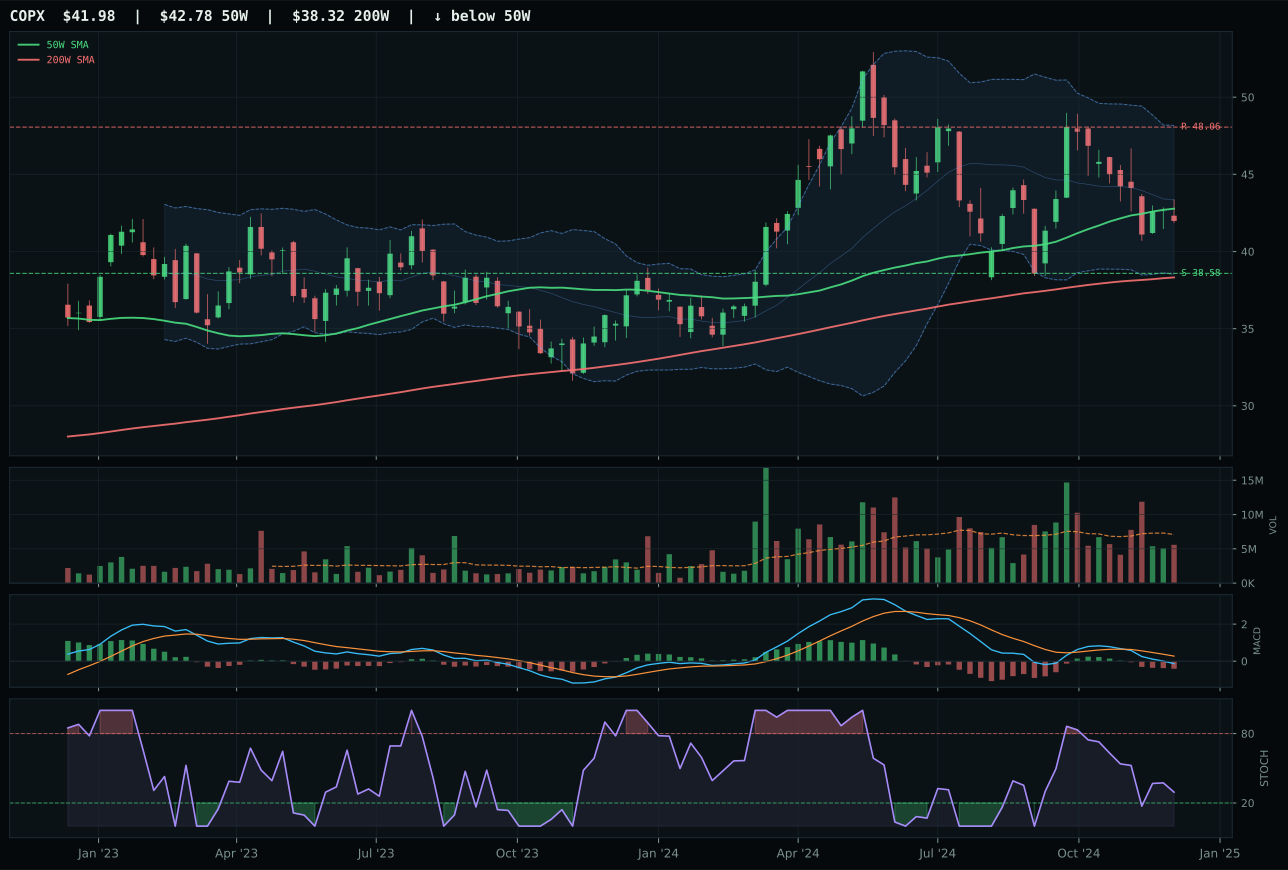
COPX has a compression near 50W profile with -3.7% 13-week relative strength versus SPY.
A failed hold above support would weaken the setup.
Actionable but governed by invalidation levels.
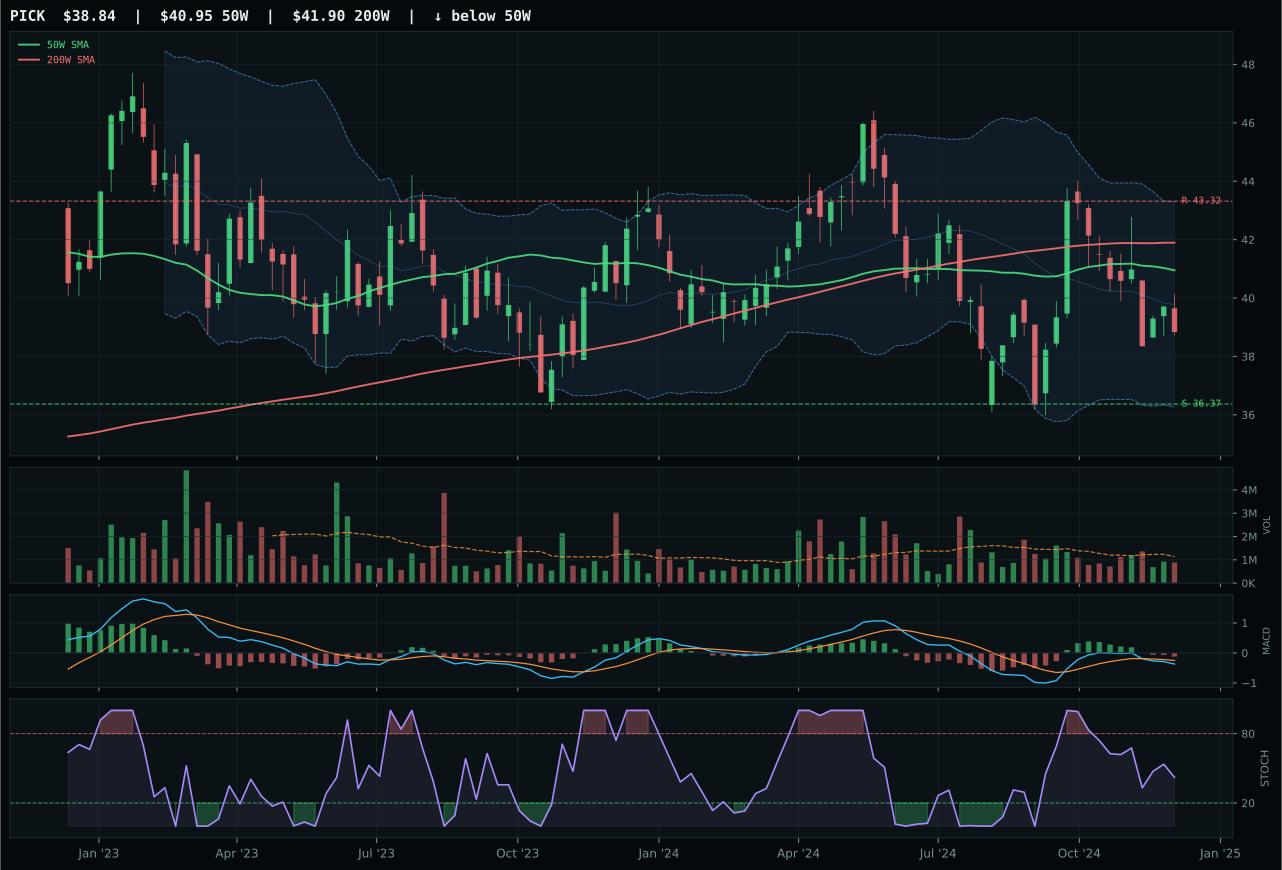
PICK has a neutral structure profile with -5.7% 13-week relative strength versus SPY.
Extension and support failure are the main tactical risks.
Tracked, but not top-2 eligible because: structurally broken.
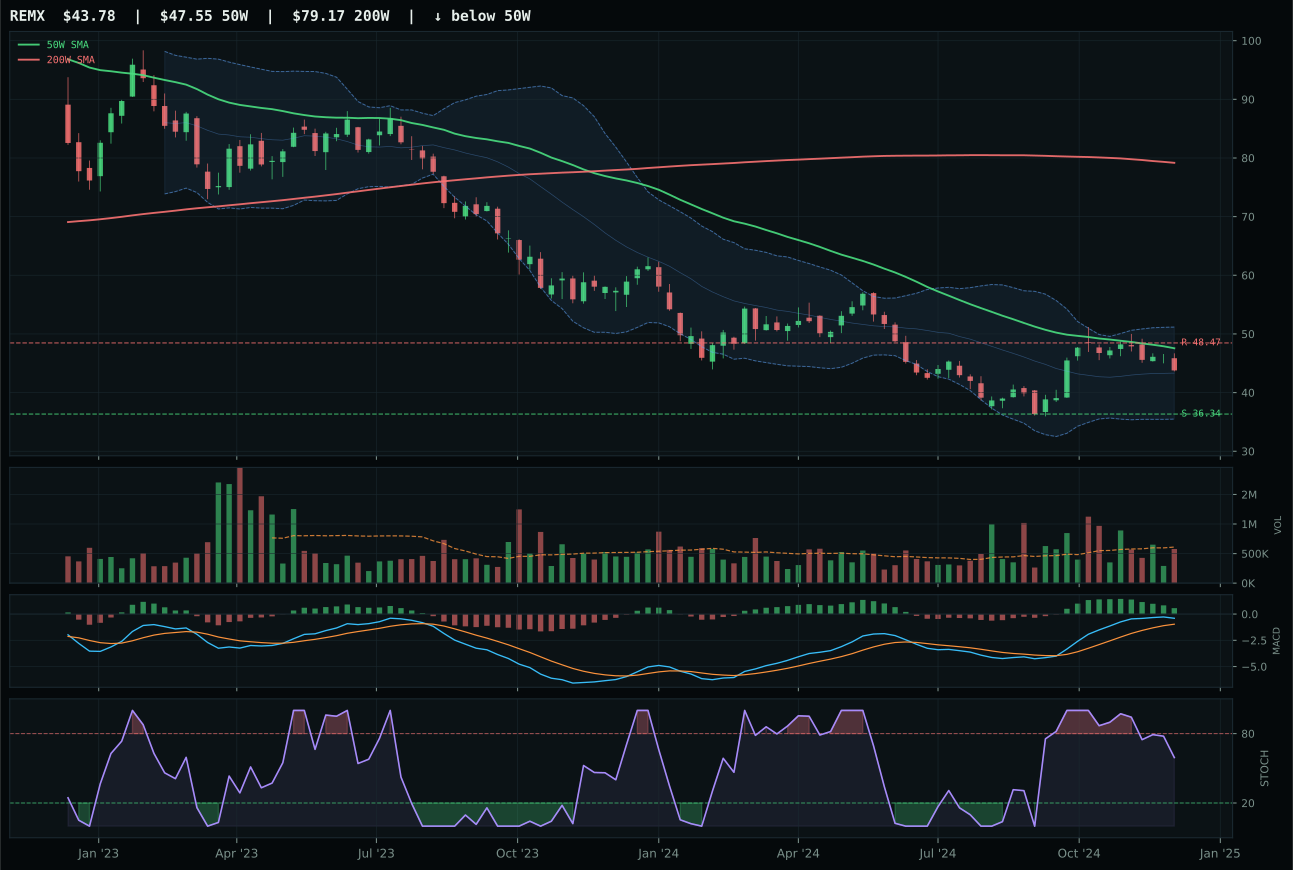
REMX has a neutral structure profile with 8.0% 13-week relative strength versus SPY.
Extension and support failure are the main tactical risks.
Tracked, but not top-2 eligible because: structurally broken.
COPX won by offering the only compression setup in a field of structurally damaged charts. Price sits 1.9% below the 50W yet remains above the 200W, creating a reset scenario where support at 38.58 is defined and Fibonacci 0.500 at 41.16 provides a target zone for bounce confirmation. The timing score is perfect at 100.0 because distance to 50W (-1.9%) combined with stochastic RSI rising mid-zone (0.29) and MACD bearish/weakening positions COPX at the inflection point of mean reversion. Thirteen-week return is positive at 8.8% despite negative relative strength to SPY (-3.7%), suggesting that copper scarcity (active macro descriptor +12) is driving flows independent of broad market direction. PICK and REMX both fail harder—PICK is structurally broken with neutral setup and -2.0% category-relative weakness, while REMX's 20.5% thirteen-week return creates valuation tension that its rising mid-zone stochastic cannot resolve.
Industrial Metals earned 5% allocation despite a 15.9 category score, the lowest-ranked allocated category, because it anchors the metals scarcity macro theme alongside Precious Metals and Nuclear. Category macro fit of 42.0/100 benefits from active metals scarcity descriptor at +14 points, but liquidity stress (-8), credit stress (-7), and dollar pressure (-7) create net headwinds that macro alone cannot overcome. COPX's 44.2 technical evidence and 49.0 ETF-level macro fit combine to produce a portfolio role as a secondary metals positioning, not a conviction trade. The 5% sleeve operates as a hedge to GLD—gold as pure monetary protection, copper as industrial recession insurance tied to scarcity narratives. The setup is not elegant: COPX is compressed near the 50W with neutral volume, meaning expansion would require active accumulation that hasn't yet materialized. This position should be exited or expanded based on volume patterns at support; as it stands, it is a conditional hold pending clearer directional commitment.
Emerging Markets — IEMG
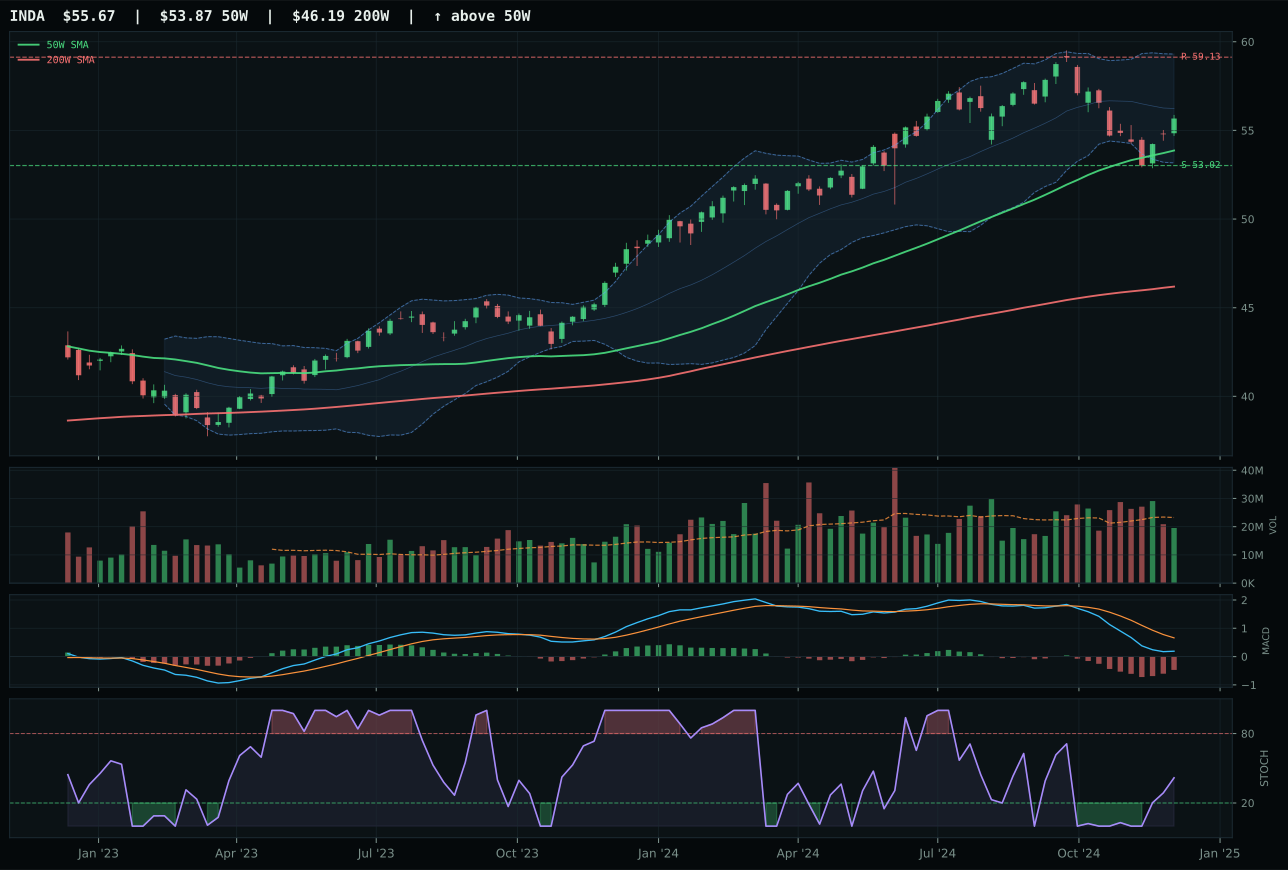
INDA has a pullback into support profile with -14.0% 13-week relative strength versus SPY.
A failed hold above support would weaken the setup.
Actionable but governed by invalidation levels.
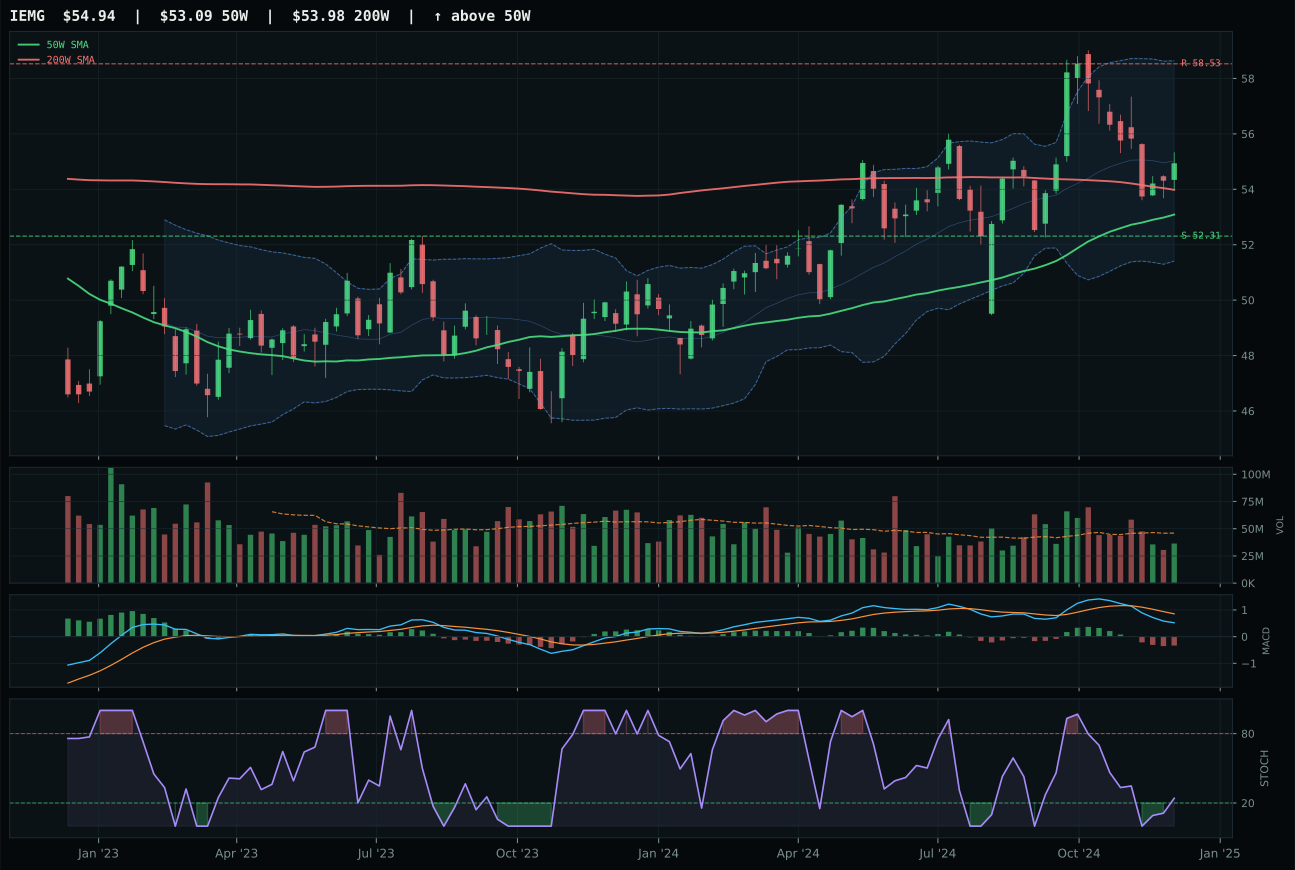
IEMG has a neutral structure profile with -7.9% 13-week relative strength versus SPY.
A failed hold above support would weaken the setup.
Actionable but governed by invalidation levels.
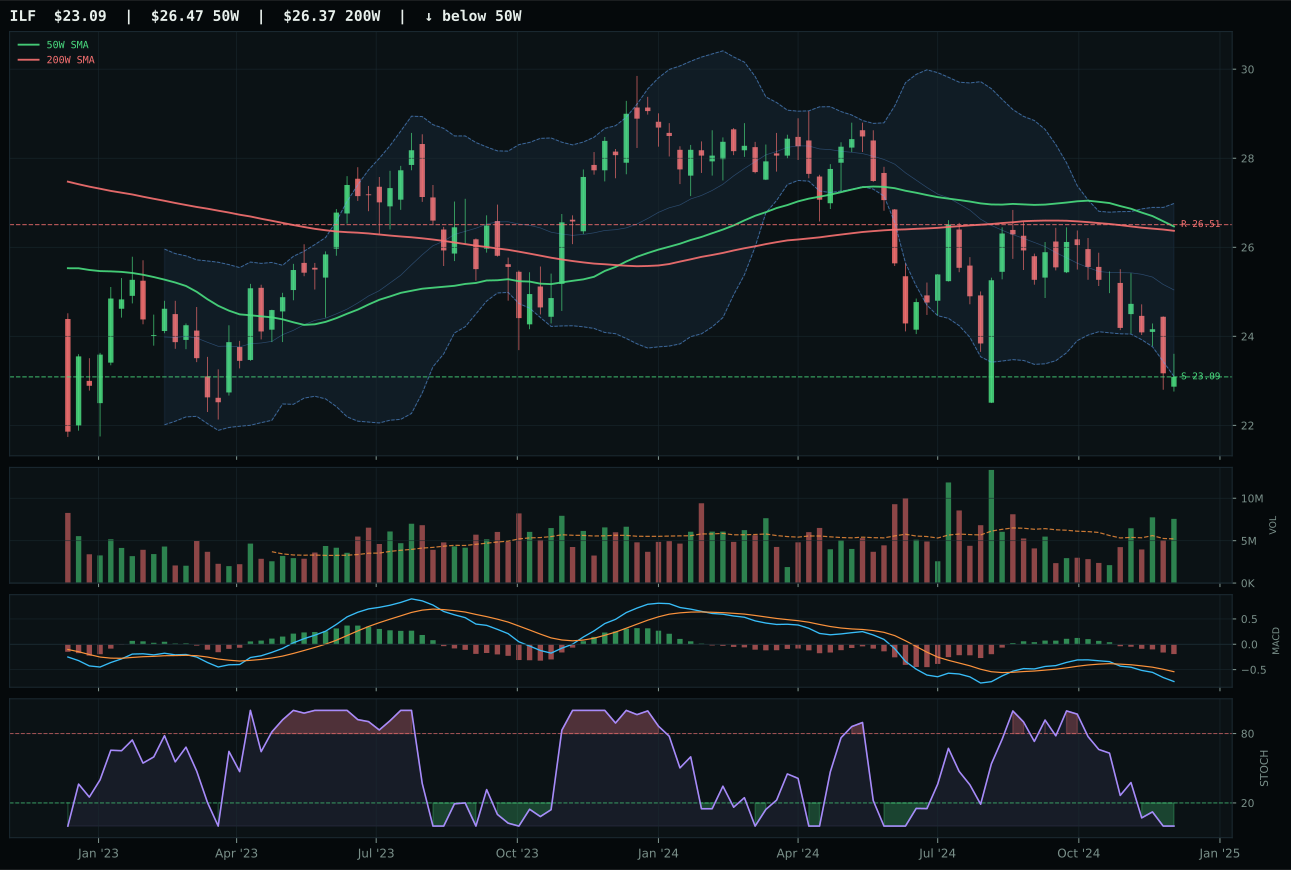
ILF has a pullback into support profile with -21.1% 13-week relative strength versus SPY.
A failed hold above support would weaken the setup.
Actionable but governed by invalidation levels.
IEMG narrowly won a deeply challenged category by offering neutral structure with defensive positioning rather than broken setup repair. Price extends 3.5% above the 50W in neutral structure with timing score 93.0 (excellent), yet thirteen-week return is only 4.6%, relative strength to SPY is negative at -7.9%, and momentum confirmation is weak at 33.0—a combination that says defensive valuation without growth sponsorship. INDA loses despite stronger fundamental positioning (India quality-growth) because it trades 14.0% below SPY performance and carries pullback-into-support setup (less liquid entry) paired with negative thirteen-week return of -1.5%. IEMG's 6.1% category-relative strength edge matters in a field where every ETF carries deep SPY underperformance—relative strength within the category is the only positive signal available. Both carry bearish or weak MACD structures, thin volume, and rising mid-zone stochastic RSI (recovery bounce setup), confirming this category represents tactical reversion rather than conviction momentum.
Emerging Markets received 0% allocation (ranked 9th or 10th) because the 8.1 category score and ineligible status reflect the category's complete macro misalignment with the current environment. Macro fit of 15.0/100 is the most severe penalty in the portfolio: dollar pressure at -14 points, credit stress at -10, liquidity stress at -10, risk appetite positive at +8 (insufficient to offset), and broad market bear at -9 create a -35 point macro headwind. Technical evidence for IEMG at 46.8/100 is below allocation threshold even with favorable weighting; the category cannot succeed on technicals alone. IEMG's 4.6% 13-week return with -7.9% SPY-relative performance is treading water in a regime where dollar strength and risk-off positioning penalize emerging-market beta systematically. Re-entry requires a macro shift: either dollar pressure becoming inactive (Fed pivot or Treasury yield compression) or risk appetite moving decisively positive, combined with a technical fresh setup below recent lows with volume confirmation. This is an exclusion, not a pause—the structural headwinds are too severe for tactical holds.
Agriculture & Livestock — MOO
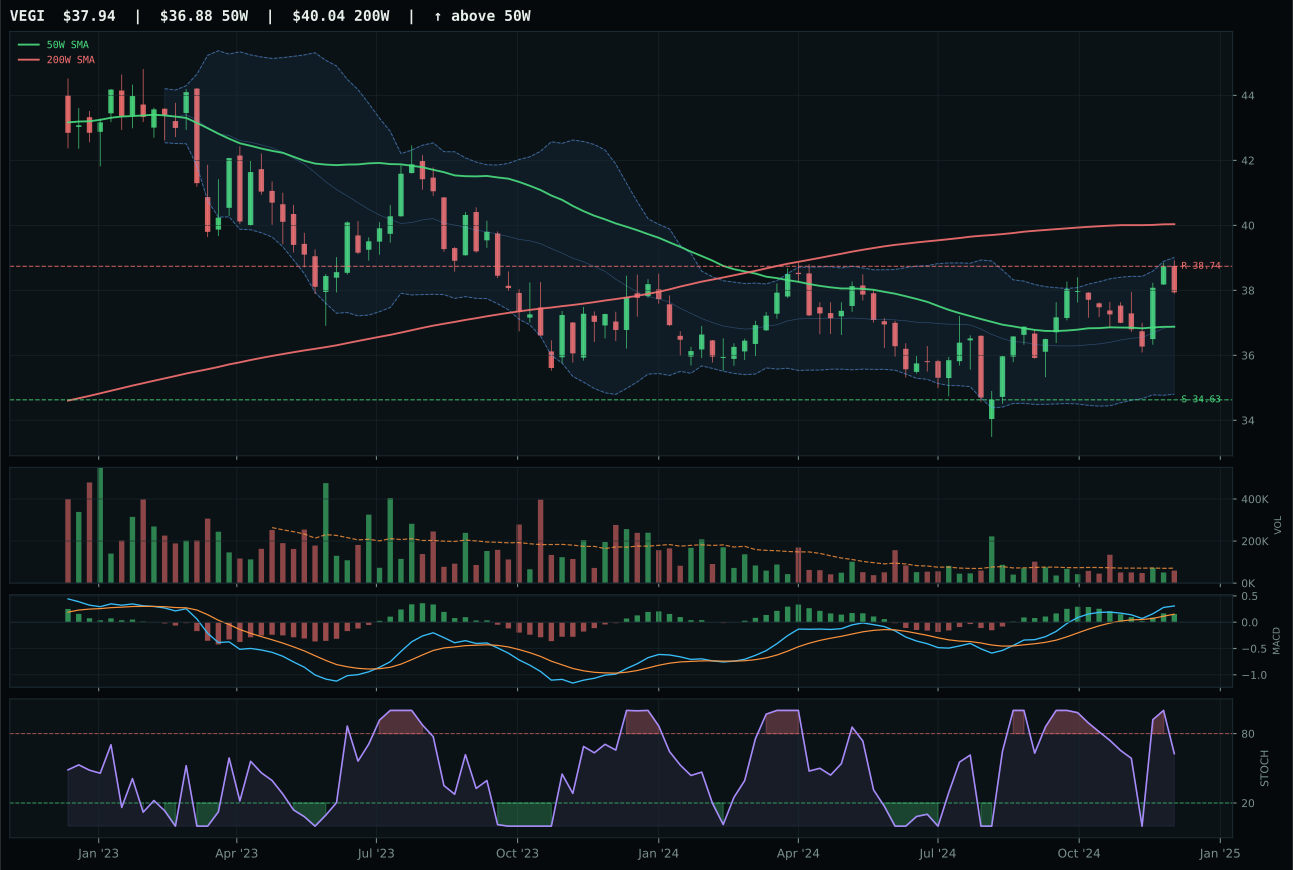
VEGI has a compression near 50W profile with -6.9% 13-week relative strength versus SPY.
A failed hold above support would weaken the setup.
Tracked, but not top-2 eligible because: .
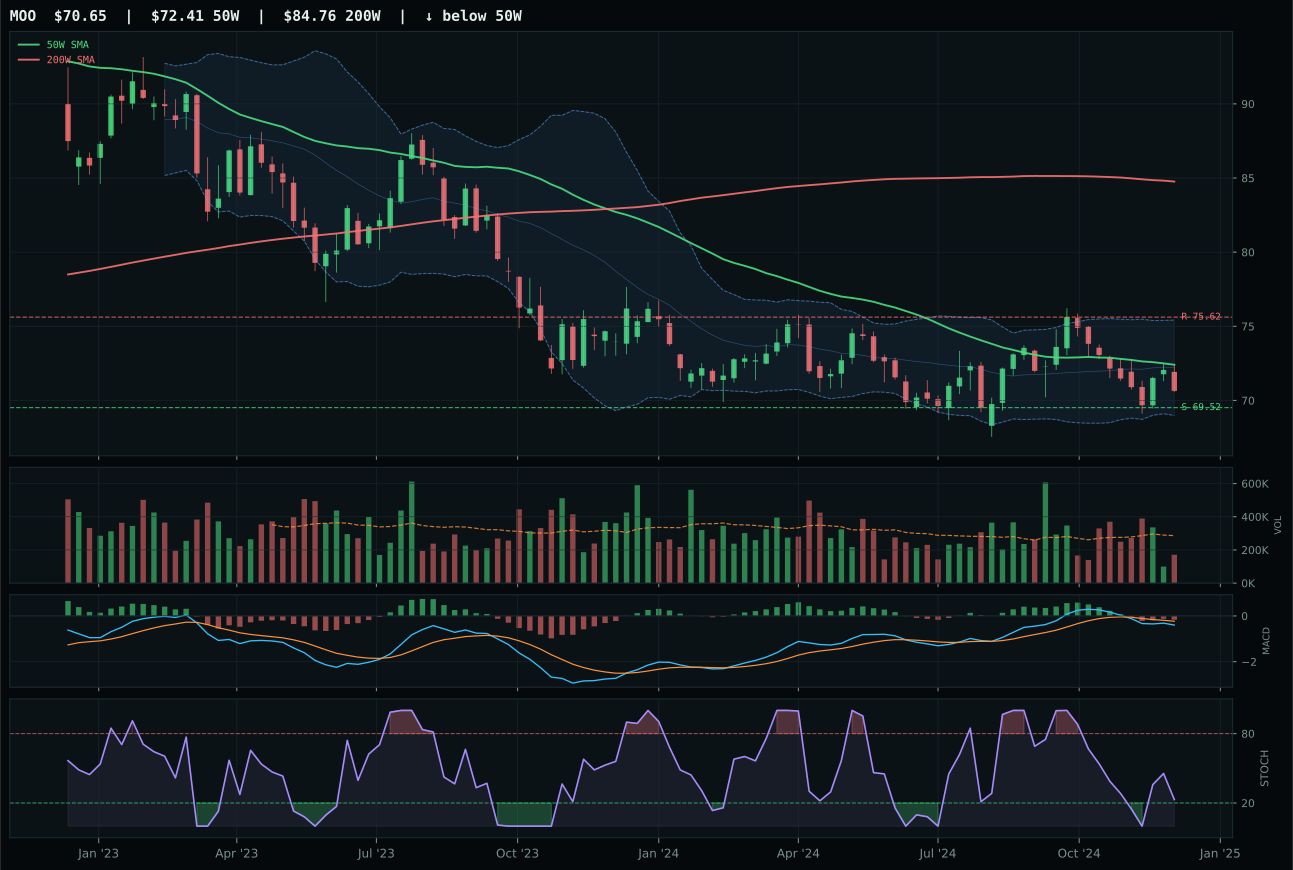
MOO has a pullback into support profile with -14.4% 13-week relative strength versus SPY.
Extension and support failure are the main tactical risks.
Tracked, but not top-2 eligible because: structurally broken.
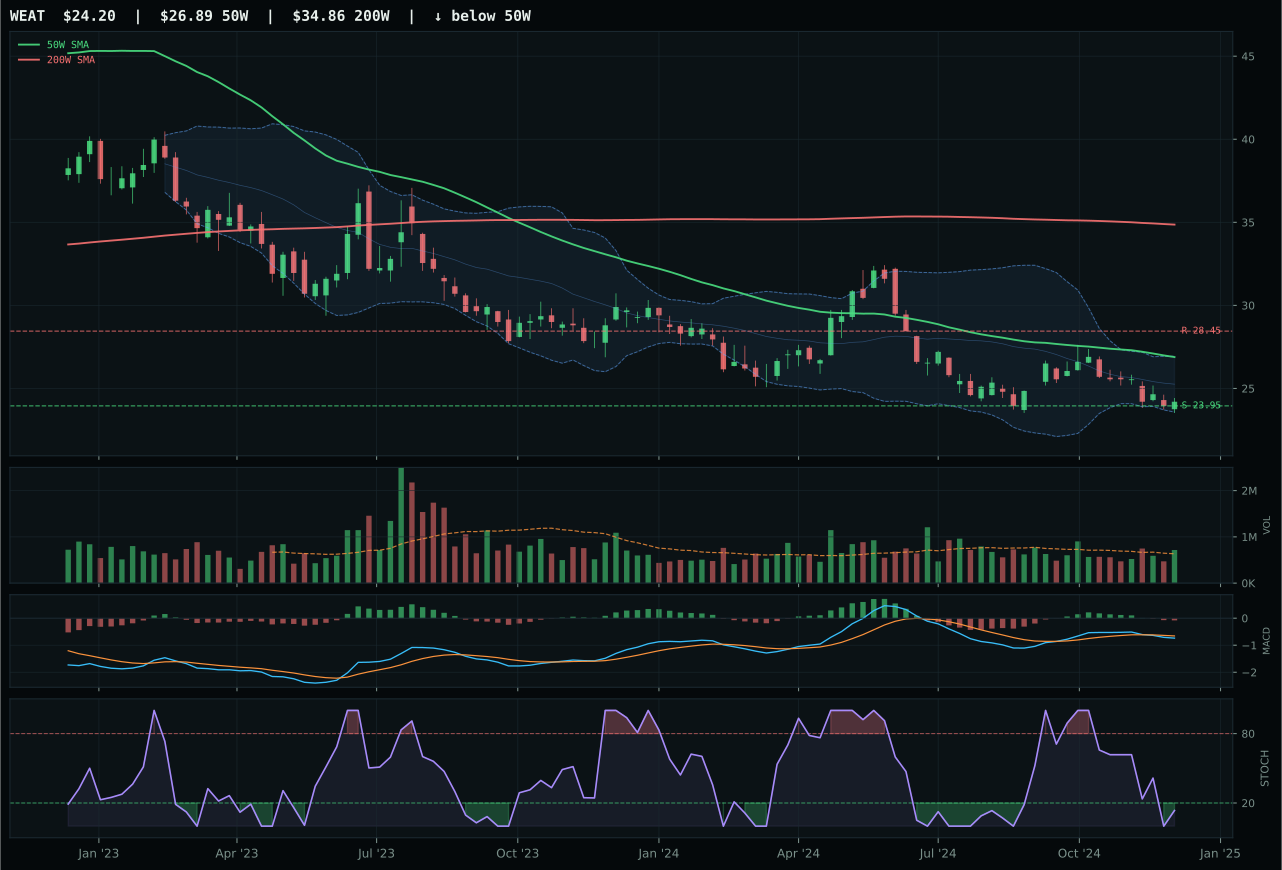
WEAT has a pullback into support profile with -17.2% 13-week relative strength versus SPY.
Extension and support failure are the main tactical risks.
Tracked, but not top-2 eligible because: structurally broken.
MOO won a deeply compromised category by defaulting to the least offensive setup when all choices are poor. Price sits 2.4% below the 50-week average pulling into defined support at 69.52, which creates a clear invalidation point—if support breaks, downside to the 200W is only 1.6%, giving MOO the best risk/reward in the basket at 98.0. The thirteen-week return is negative at -1.9% and MACD is bearish/weakening, yet the stochastic RSI is in rising mid-zone (0.23) and positioned for potential bounce confirmation. VEGI lost because it sits 2.9% above the 50W in compression (not pullback), offering far worse risk/reward (48.9 vs 98.0) and zero upside definition—a setup that asks the allocator to chase into crowded space. This is a category where the winner is determined by who has the most defensive setup, not who has positive conviction.
Agriculture & Livestock received 0% allocation (ranked 9th or 10th) because the 5.3 category score is ineligible and represents structural breakdown rather than temporary weakness. Macro fit of 46.0/100 provides zero support: no descriptor strongly favors or penalizes the sector, meaning the category must rise on technical evidence alone. Instead, it collapsed to 25.9 technical for MOO, a technical ETF evidence score that fails the basic threshold for capital commitment. The category-level basket (VEGI, MOO, WEAT) produced only 35.7 weighted score before the final reasoner applied eligibility filters and marked the representative ineligible. Liquidity stress drags the entire sector, and dollar strength further penalizes commodity exposure. This is not a hold—it is an exclusion. For re-entry, the category would need a stochastic RSI reset-to-recovery in multiple components, volume confirmation of a support hold, and macro descriptor change (either metals scarcity or monetary hedge bid activation) before allocation would be justified.