
2024-11-29
Informational purposes only. The content in this report, including allocations, analysis, and commentary, is provided solely for informational and educational purposes. It does not constitute financial advice, investment advice, trading advice, or any other type of advice. Past performance does not guarantee future results. Always conduct your own research and consult a qualified financial professional before making investment decisions.
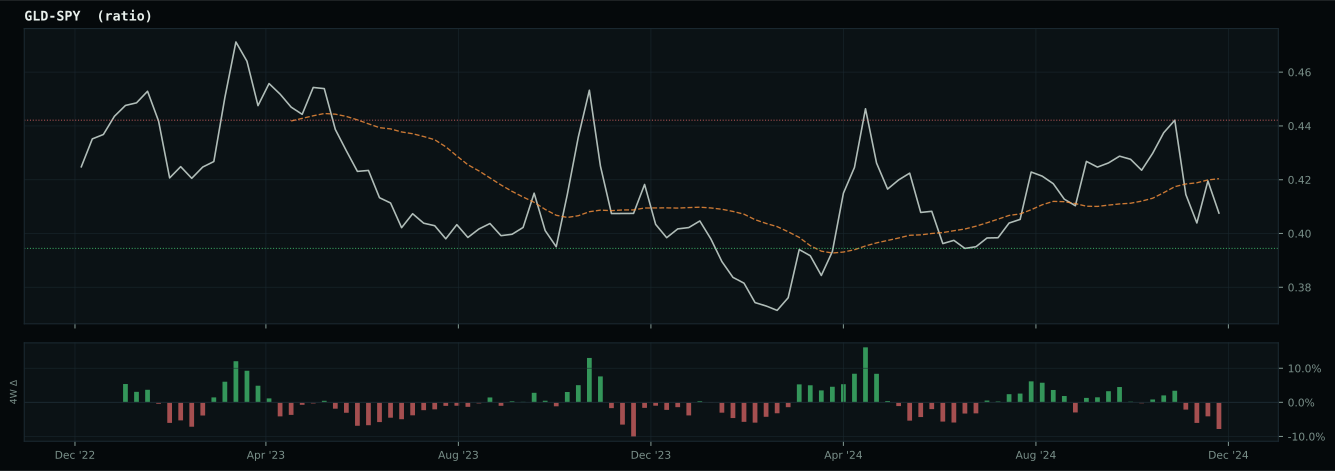
GLD defensive overlay excluded: price is below its 8W SMA. Cause selector will use cash alternative.
Slow macro Defensive trigger is active (Transition Defense), but crypto-cycle exposure has priority for this run.
Weekly Allocation
| Ticker | Category | Weight | Role |
|---|---|---|---|
| FBTC | 50% | Overlay | |
| PAVE | Utilities & Infrastructure | 10% | Top-2 (10%) |
| URA | Nuclear Energy | 10% | Top-2 (10%) |
| IGV | Technology | 5% | Tier-2 (5%) |
| XAR | Defense & Aerospace | 5% | Tier-2 (5%) |
| GLD | Precious Metals | 5% | Tier-2 (5%) |
| COPX | Industrial Metals | 5% | Tier-2 (5%) |
| AIQ | AI | 5% | Tier-2 (5%) |
| XLE | Traditional Energy | 5% | Tier-2 (5%) |
Trade Instructions — Monday Open
Sell the tranche from 2024-11-01 (completing its 4-week hold). Buy the new tranche. Instructions show net portfolio changes — same-asset positions cancel, weight changes show the delta.
| Action | Ticker | Instruction |
|---|---|---|
| SELL | GLD | Sell 17% of GLD position (reduce 7.50% → 6.25%) |
| SELL | IGV | Sell 20% of IGV position (reduce 6.25% → 5.00%) |
| SELL | BOTZ | Sell 33% of BOTZ position (reduce 3.75% → 2.50%) |
| SELL | NLR | Sell 50% of NLR position (reduce 2.50% → 1.25%) |
| SELL | MOO | Sell 33% of MOO position (reduce 3.75% → 2.50%) |
| BUY | PAVE | Buy PAVE — 20.00% of freed cash (adds 1.25% to portfolio) |
| BUY | URA | Buy URA — 40.00% of freed cash (adds 2.50% to portfolio) |
| BUY | XLE | Buy XLE — 20.00% of freed cash (adds 1.25% to portfolio) |
| BUY | AIQ | Buy AIQ — 20.00% of freed cash (adds 1.25% to portfolio) |
Current Portfolio After Trade
Combined holdings across all 4 active tranches. Each tranche is 25% of the portfolio.
| Ticker | % of Portfolio | Weight Bar |
|---|---|---|
| FBTC | 50.00% | |
| PAVE | 8.75% | |
| URA | 7.50% | |
| GLD | 6.25% | |
| XAR | 6.25% | |
| IGV | 5.00% | |
| COPX | 5.00% | |
| XLE | 3.75% | |
| BOTZ | 2.50% | |
| MOO | 2.50% | |
| NLR | 1.25% | |
| AIQ | 1.25% |
Macro Regime — Disinflation
growth data is not confirming the weak market-implied risk appetite signal
Defensive overlay cause is not singular enough to concentrate: the sleeve diversifies across liquidity, monetary defense, and defensive equity exposure while the market resolves the next regime.
Macro Evidence Charts
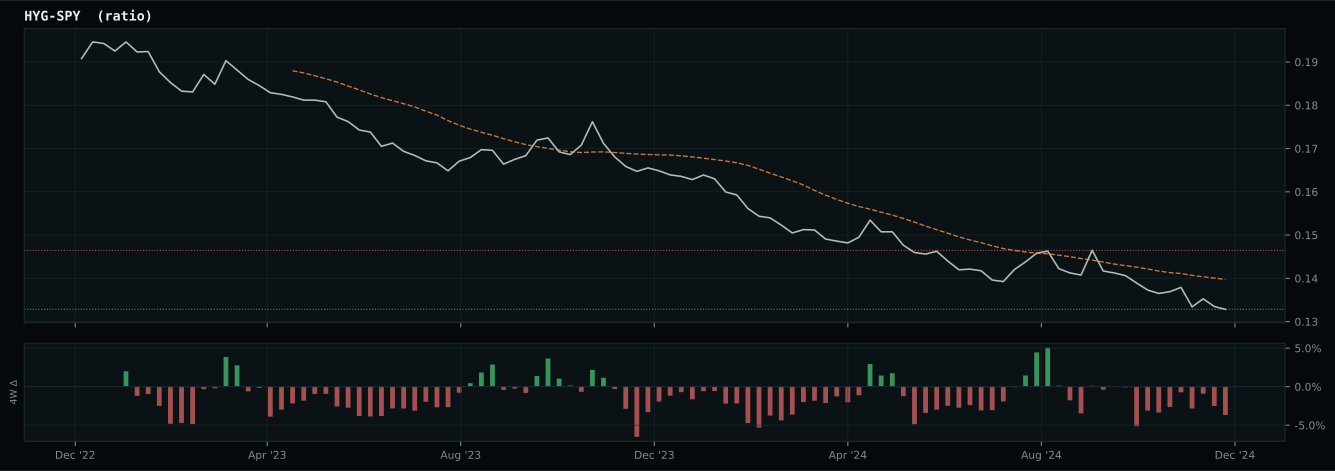
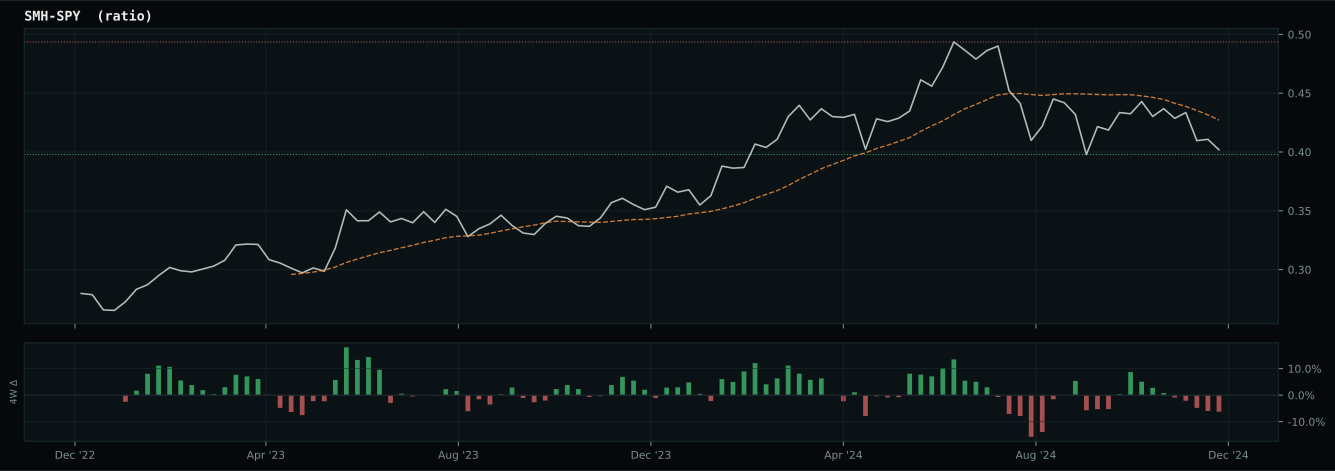
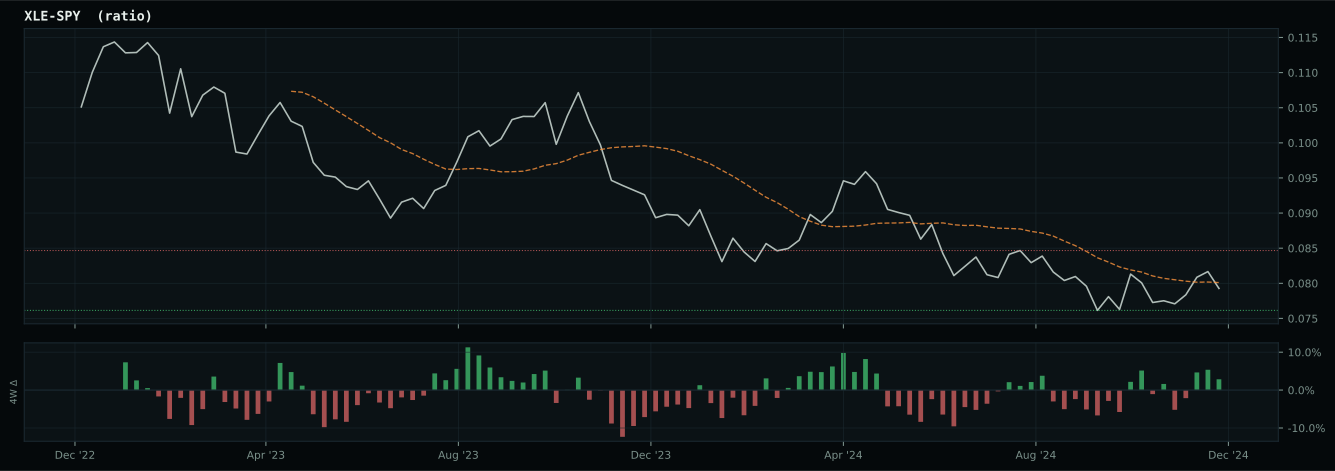
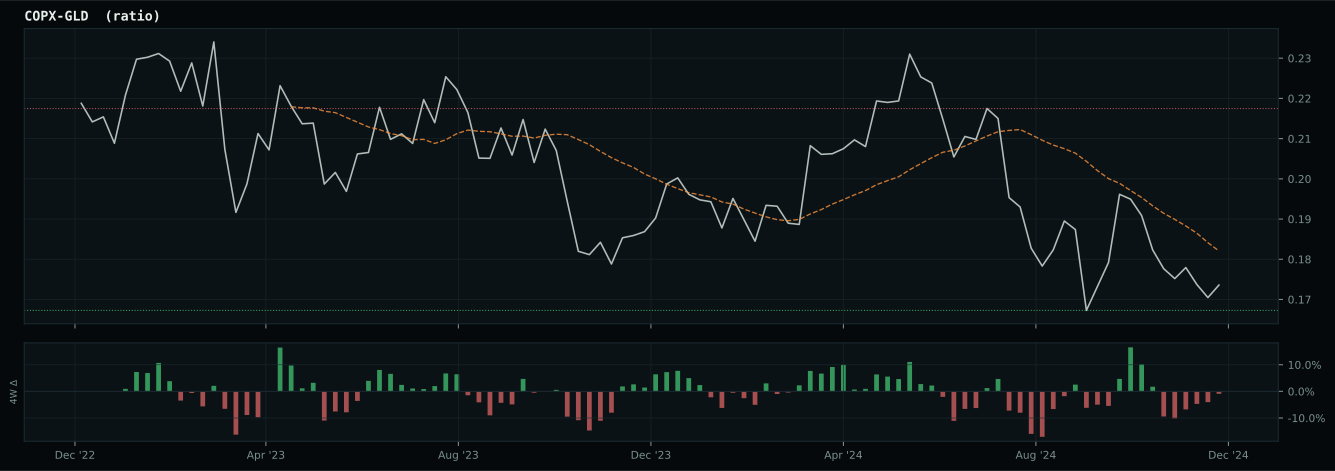
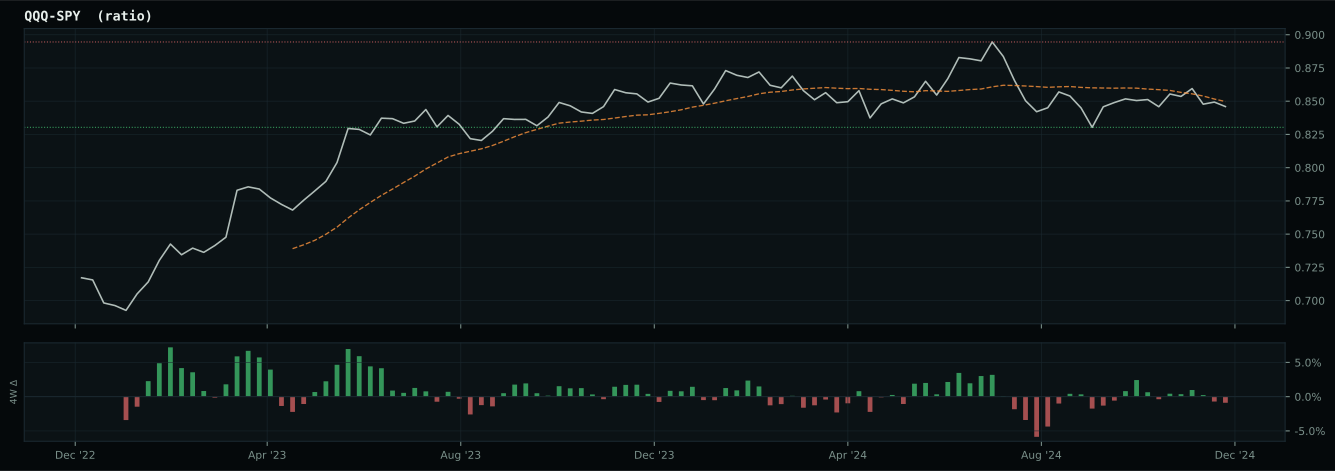
Market-implied signals behind the macro regime scores. Each ratio compares two assets; the direction and slope of the ratio is what the macro engine reads.
Crypto Regime — TrendBTC
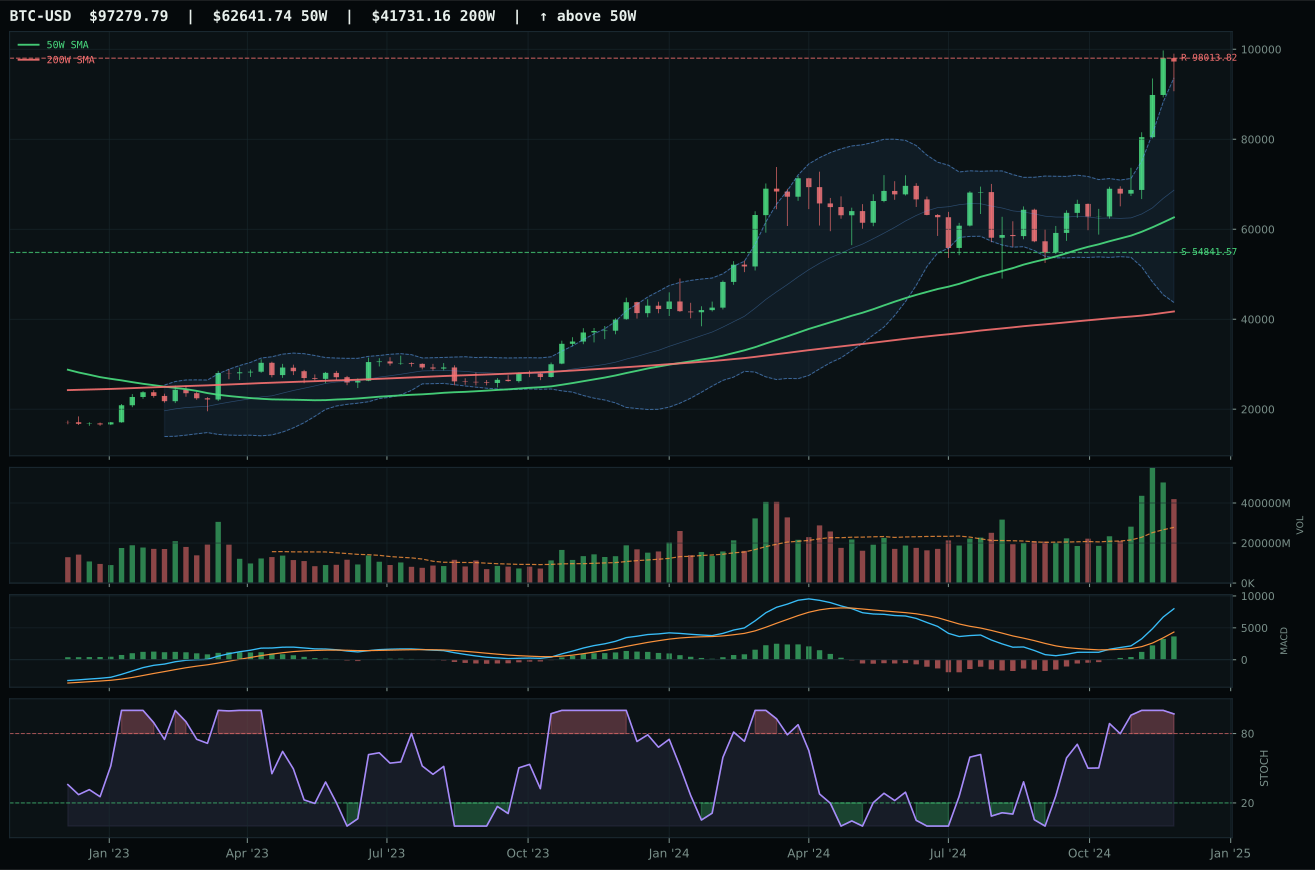
ValueBTC not armed: BTC has not made the first post-breakdown touch of the 200W buy zone after losing the 50W
TrendBTC confirmed: 2 consecutive closes above rising/flat 50W SMA
one or more available conditions failed
Category Rankings
| Rank | Category | Winner | Score | Alloc | 4W Ret | Peers (4W) |
|---|---|---|---|---|---|---|
| 1 | Utilities & Infrastructure | PAVE | 72.8 | 20% | -11.65% | IGF -6.2% · XLU -8.7% |
| 2 | Nuclear Energy | URA | 59.9 | 20% | -17.49% | NLR -15.1% · URNM -16.3% |
| 3 | Technology | IGV | 54.0 | 10% | -4.12% | CIBR +0.4% · XLK +0.1% |
| 4 | Defense & Aerospace | XAR | 53.6 | 10% | -6.12% | ITA -6.7% · ROKT -6.1% |
| 5 | Precious Metals | GLD | 50.0 | 10% | -1.38% | SLV -4.5% · GDX -8.8% |
| 6 | Industrial Metals | COPX | 27.6 | 10% | -9.64% | PICK -11.7% · REMX -13.8% |
| 7 | AI | AIQ | 27.3 | 10% | -0.49% | BOTZ -3.3% · SMH +0.5% |
| 8 | Traditional Energy | XLE | 20.6 | 10% | -11.45% | FCG -8.0% · XOP -10.8% |
| 9 | Agriculture & Livestock | MOO | 6.4 | 0% | -10.29% | VEGI -8.6% · WEAT +1.5% |
| 10 | Emerging Markets | IEMG | 1.6 | 0% | -3.48% | INDA -3.8% · ILF -8.3% |
Utilities & Infrastructure — PAVE
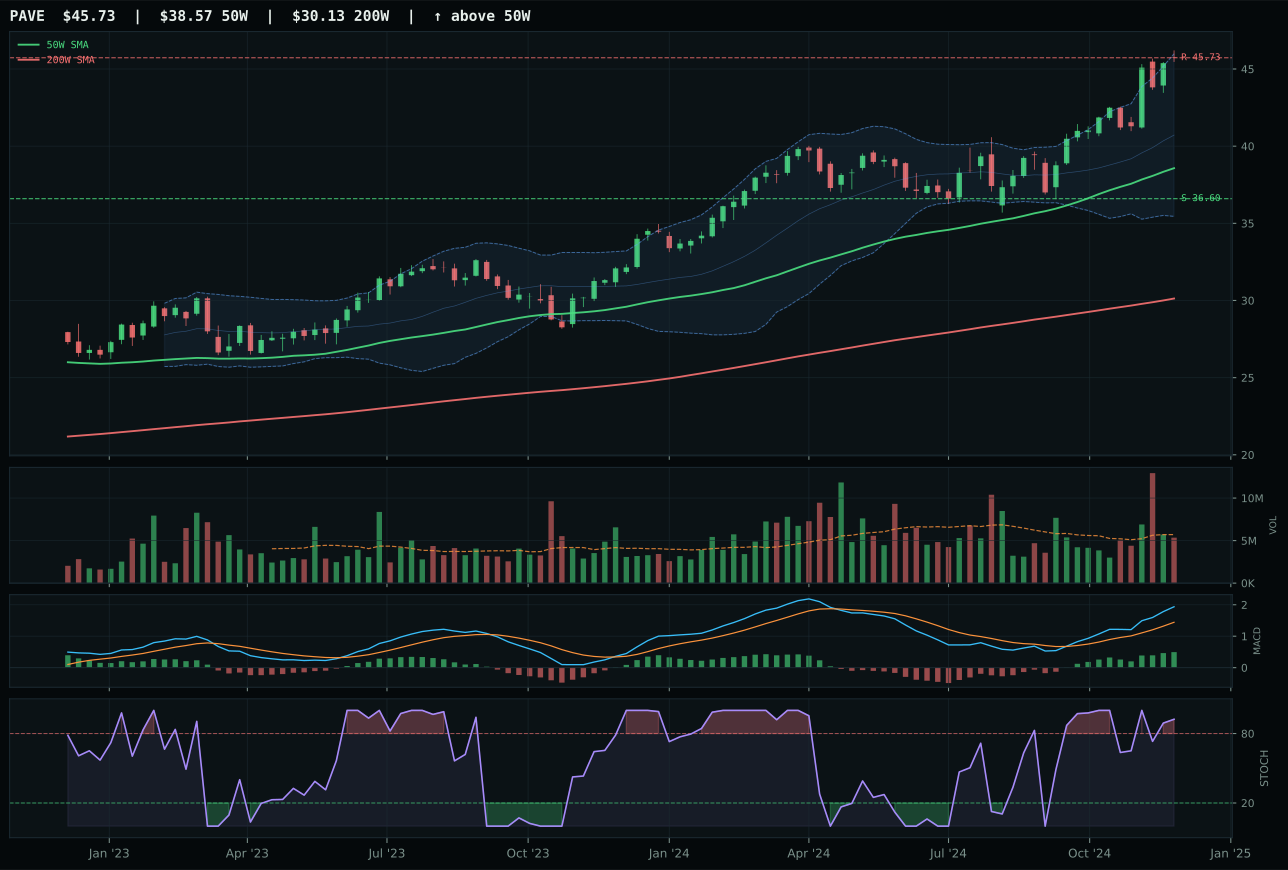
PAVE has a vertical extension profile with 9.1% 13-week relative strength versus SPY.
A failed hold above support would weaken the setup.
Actionable but governed by invalidation levels.
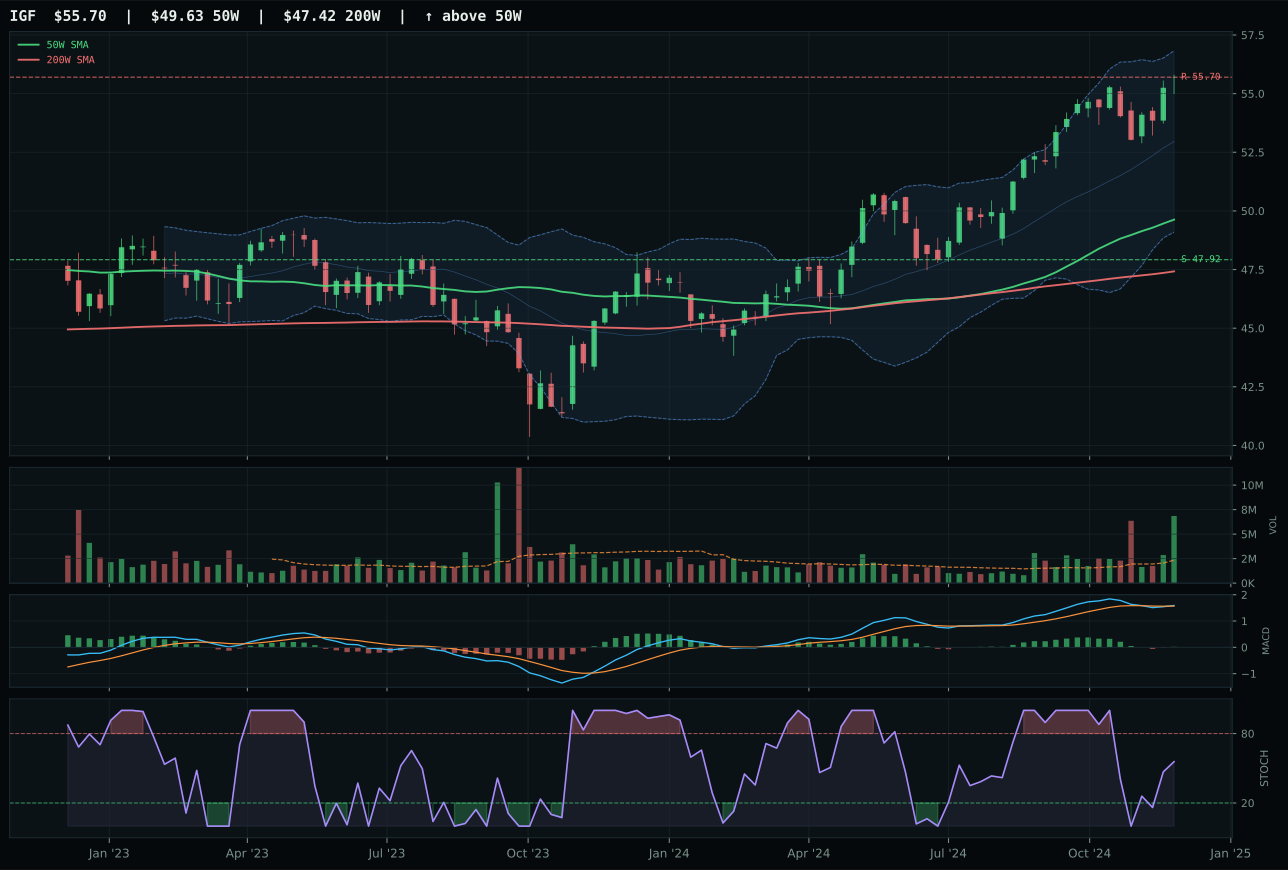
IGF has a neutral structure profile with -0.5% 13-week relative strength versus SPY.
A failed hold above support would weaken the setup.
Actionable but governed by invalidation levels.
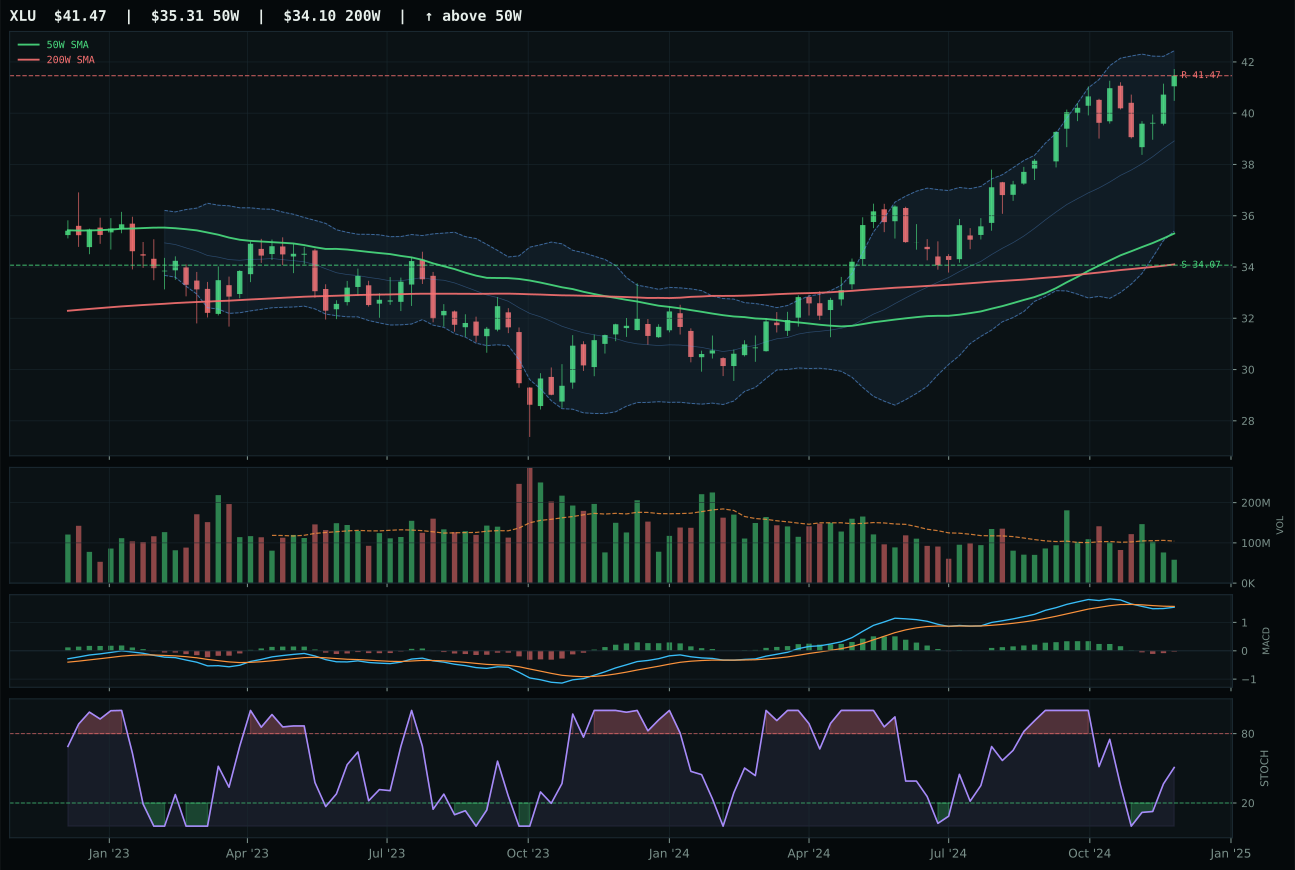
XLU has a vertical extension profile with 1.8% 13-week relative strength versus SPY.
A failed hold above support would weaken the setup.
Actionable but governed by invalidation levels.
PAVE secured top-2 selection by defeating IGF (6.9 points) on MACD and category-relative strength, despite IGF's superior technical evidence of 86.9 versus 64.5. PAVE's 16.0% thirteen-week return and 9.1% SPY-relative strength represent genuine outperformance, yet the margin is driven by MACD bullish and improving (versus IGF's bullish but flattening) and category-relative strength at 7.3% versus -2.3%. Both setups are extended—PAVE at 18.6%, IGF at neutral structure—yet PAVE's vertical extension with 83.3% cleanliness reflects a crisper trend structure. IGF's higher technical score is offset by slower momentum confirmation and weaker peer positioning. The category-relative advantage signals that domestic infrastructure (PAVE) is outcompeting global infrastructure (IGF) in the current macro regime, likely due to tariff-driven re-shoring expectations.
Utilities & Infrastructure earned 10% top-2 allocation based on the highest category macro fit in the portfolio at 80.0. Disinflation helps this exposure at +7, defensive rotation is active at +12, broad market bear concern adds +4, and disinflation pressure contributes +6, creating a four-pillar macro thesis. PAVE's 64.5 technical evidence is respectable but not dominant; the allocation is driven by macro alignment, not technical momentum. At 72.8 category score, this ranks as the second-highest category alongside Nuclear Energy, justified by the defensive macro regime and capex tailwinds embedded in infrastructure policy. PAVE's extended setup (18.6% above 50W) is the allocation's primary weakness: entry risk is real, and a mean reversion to support at 36.60 would constitute a 19.8% drawdown. The portfolio holds PAVE as a core defensive position benefiting from rate cuts and fiscal stimulus expectations, not as a trading vehicle. The allocation requires the 50W slope to remain positive and MACD to hold above zero to justify carrying the extended setup into year-end.
Nuclear Energy — URA
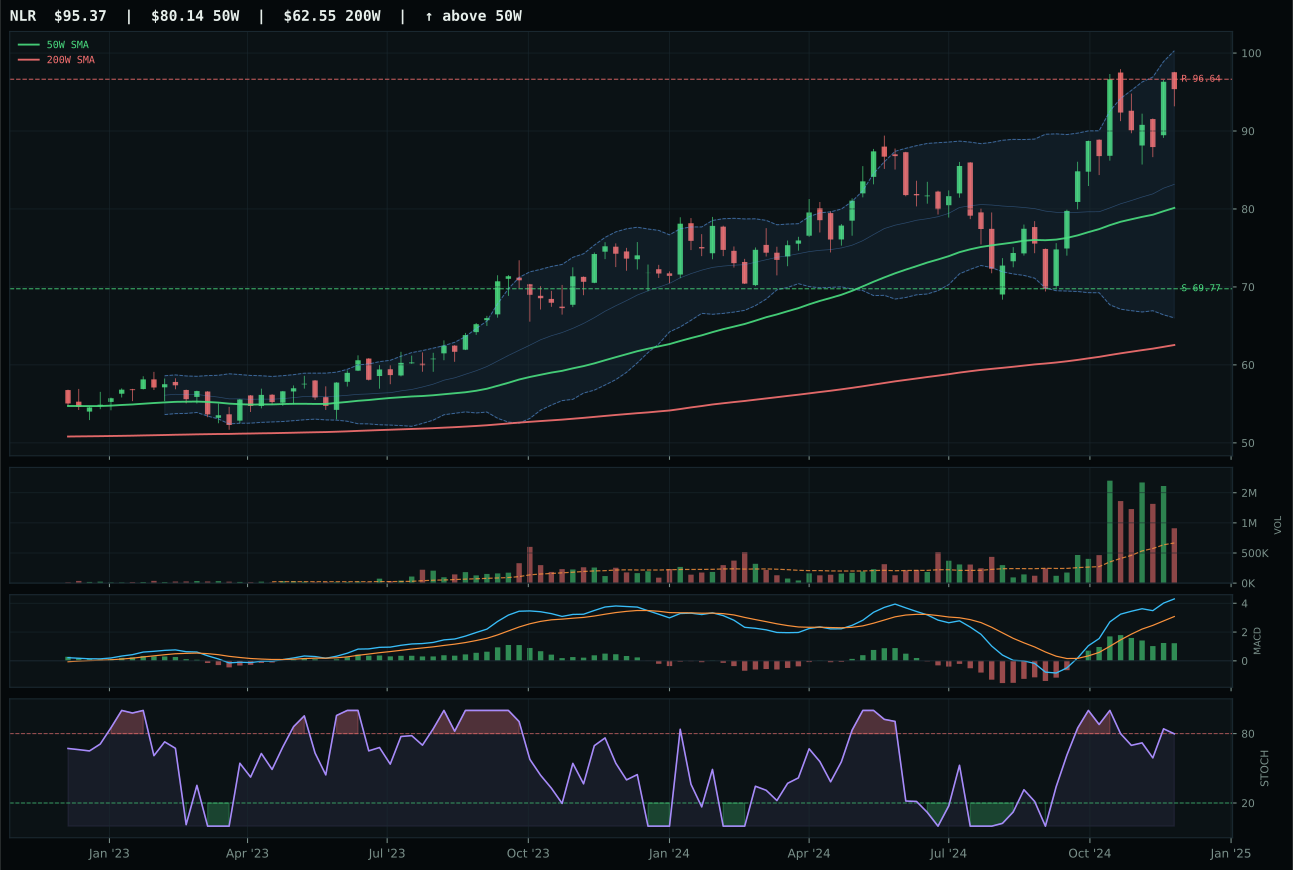
NLR has a vertical extension profile with 19.3% 13-week relative strength versus SPY.
A failed hold above support would weaken the setup.
Actionable but governed by invalidation levels.
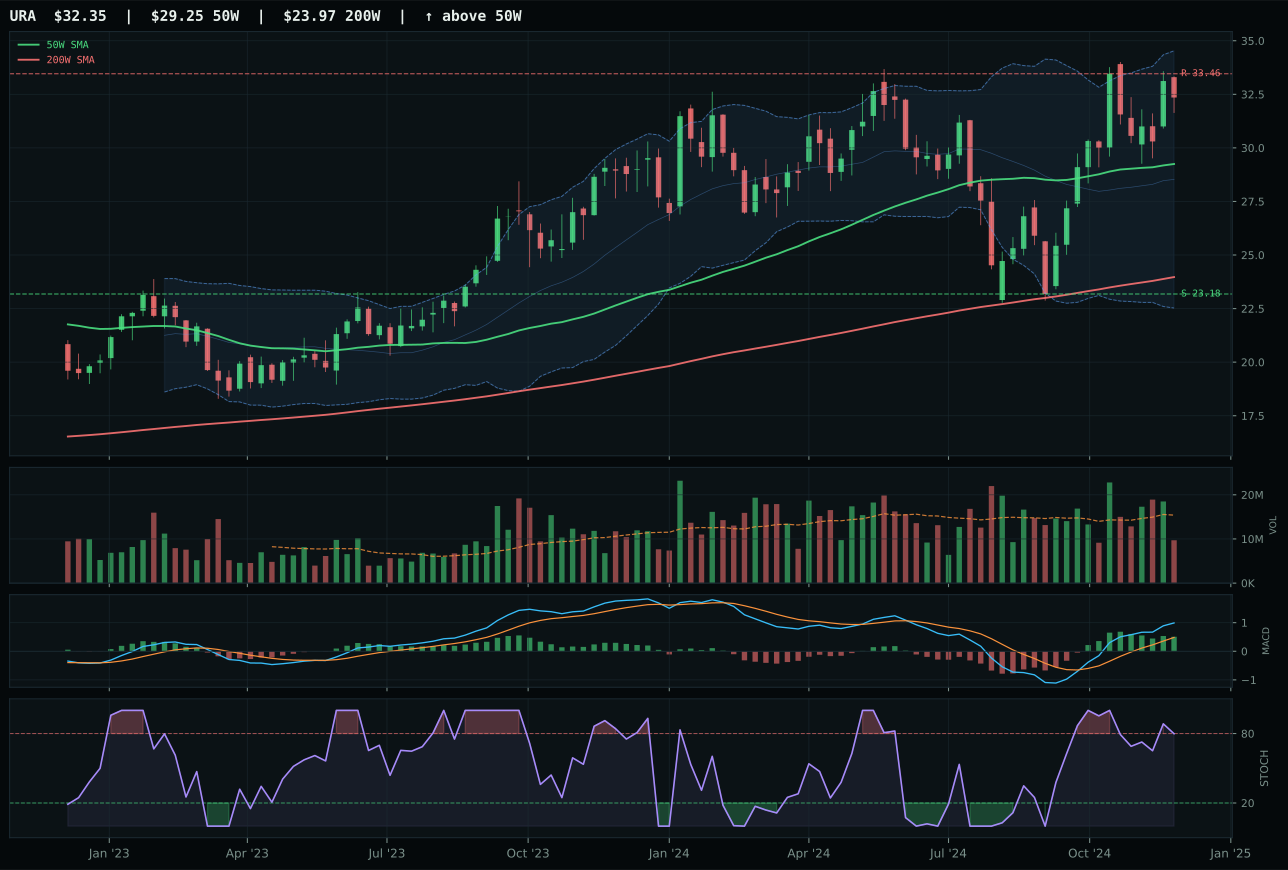
URA has a neutral structure profile with 18.0% 13-week relative strength versus SPY.
A failed hold above support would weaken the setup.
Actionable but governed by invalidation levels.
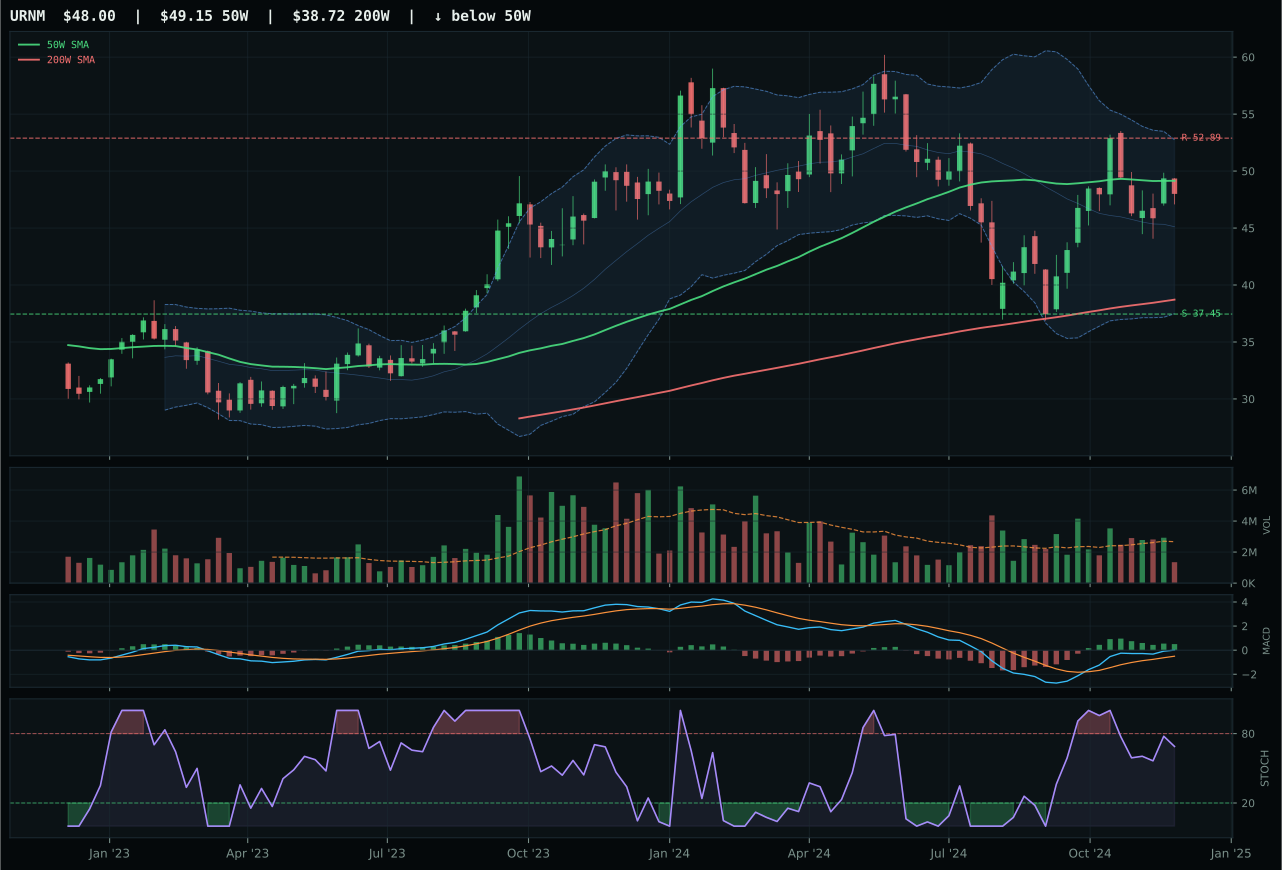
URNM has a compression near 50W profile with 7.8% 13-week relative strength versus SPY.
A failed hold above support would weaken the setup.
Actionable but governed by invalidation levels.
URA claimed top-2 selection over higher-ranked NLR on timing and risk-reward efficiency, demonstrating that category leadership does not guarantee portfolio allocation. URA's neutral structure with 10.6% distance from the 50W offers a cleaner entry than NLR's 19.0% extension above the 50W, which has exhausted most of its easy upside. Both show bullish but flattening MACD and rising stochastic RSI, yet URA's setup is less extended and therefore less vulnerable to the next mean reversion. NLR's 26.2% thirteen-week return and 19.3% SPY-relative strength appear dominant, but they come with 76 volume score and above-average participation—signs that the move has attracted institutional attention and faces profit-taking risk. URA's 24.9% thirteen-week return is nearly identical with only 63 volume, meaning participation is still healing and the trend has further to run without attracting destabilizing capital.
Nuclear Energy earned 10% top-2 allocation based on category score 59.9 and strong technical-to-macro balance. Technical evidence of 75.6/100 anchors the decision: URA's perfect 100.0 trend score and 100.0 momentum confirmation are complemented by 78.0 timing that reflects the sweet spot between committed uptrend and non-extended entry. Macro fit is neutral at 50.0, which is actually a strength in a disinflation regime—nuclear is neither a deflation hedge nor a growth story, making it a pure energy security play. The 41.0 category macro fit reflects real asset sponsorship at +7 offset by liquidity stress (-7) and credit stress (-5), creating a balanced macro profile. In the overlay regime, 10% allocation provides 5% net capital committed, making this a top-2 conviction position driven by technical leadership rather than macro tailwinds. URA would remain top-2 as long as the trend above the 23.18 support holds and MACD maintains its bullish slope.
Technology — IGV
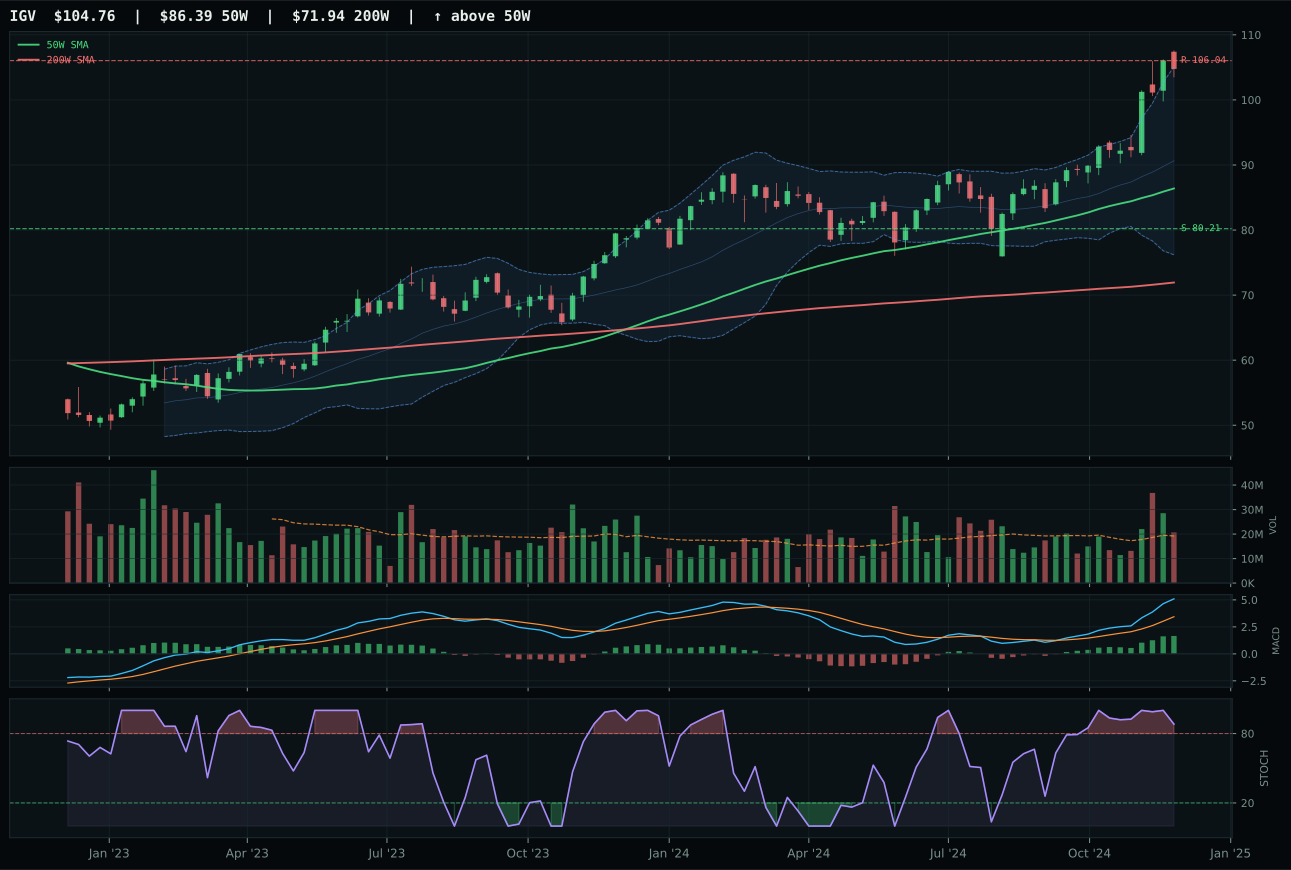
IGV has a vertical extension profile with 13.8% 13-week relative strength versus SPY.
A failed hold above support would weaken the setup.
Actionable but governed by invalidation levels.
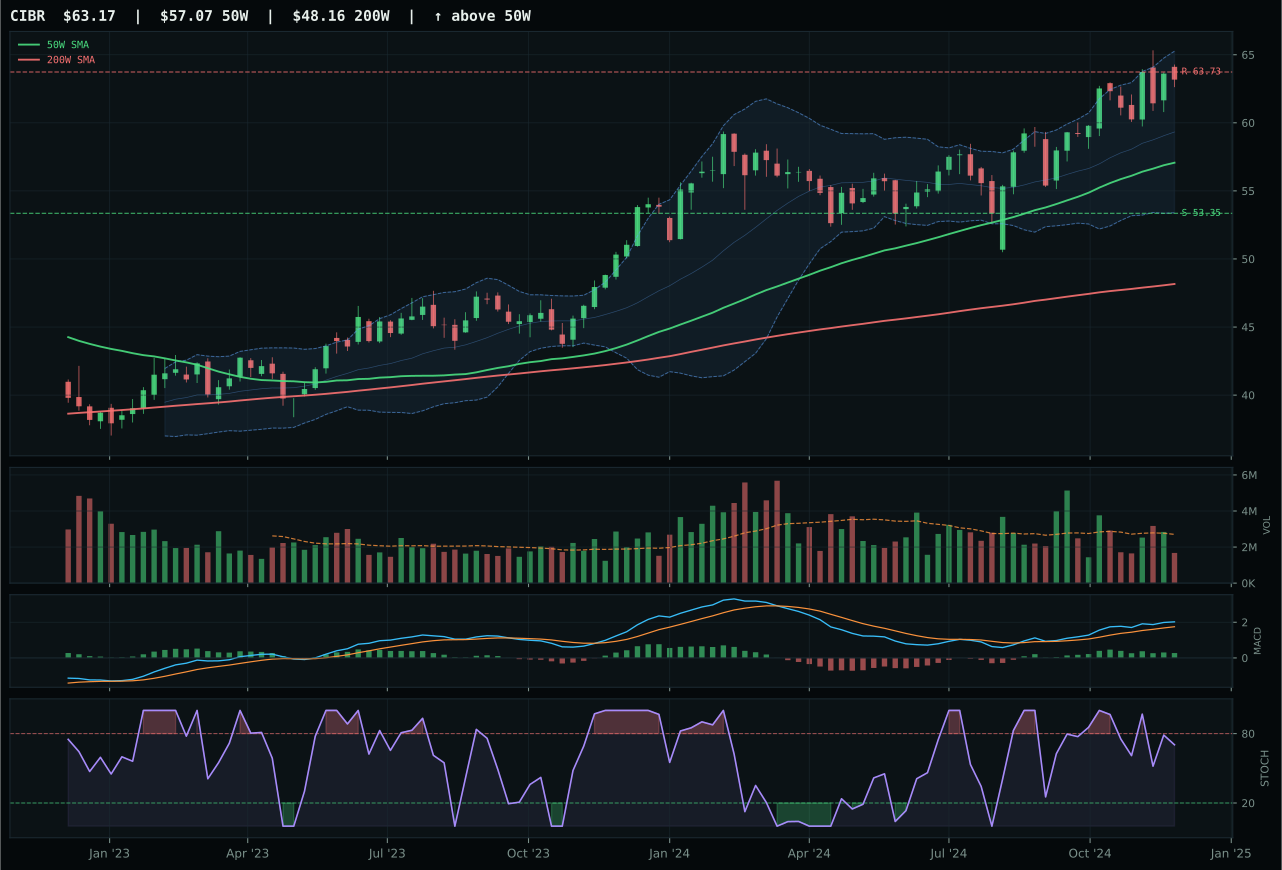
CIBR has a neutral structure profile with -0.4% 13-week relative strength versus SPY.
A failed hold above support would weaken the setup.
Actionable but governed by invalidation levels.
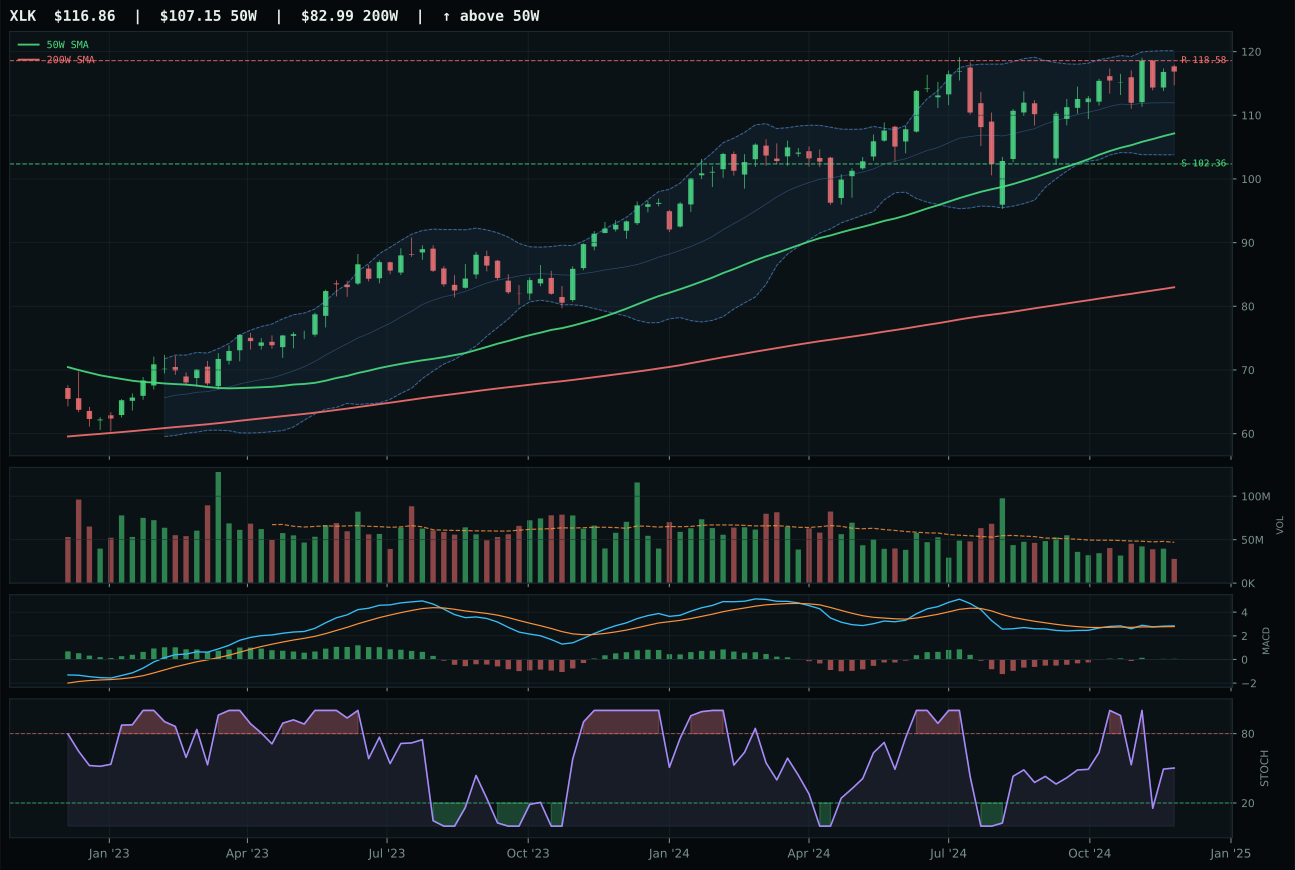
XLK has a neutral structure profile with -0.8% 13-week relative strength versus SPY.
A failed hold above support would weaken the setup.
Actionable but governed by invalidation levels.
IGV claimed the category on the strength of its relative strength advantage and clean momentum setup, beating CIBR by 6.4 points despite both showing bullish MACD confirmation. The key differentiator was category-relative strength: IGV posted 14.2% against its peers while CIBR registered 0.0%, signaling that capital is rotating into enterprise software over cybersecurity in the current disinflation regime. IGV's vertical extension setup—21.3% above the 50W with overbought stochastic RSI rolling over—is clearly stretched, but neutral volume participation at 1.07x the 20-day average proves new money is still defending the trend rather than dumping into momentum exhaustion. CIBR's structure deteriorated relative to IGV on nearly every axis: weaker volume confirmation, missing category leadership, and a falling stochastic versus IGV's rollover pattern that preserves upside optionality.
Technology earned 5% allocation as a tier-2 category, ranked below PAVE and URA but inside the top eight. The category score of 54.0 reflects technical strength undermined by macro headwinds: disinflation helps the narrative, but active liquidity stress, credit stress, and dollar pressure drag down the risk profile. IGV's 100.0 trend score cannot overcome a 27.0 timing score—the setup is extended and late, meaning every new buyer faces asymmetric downside to the 50W support at 80.21. In a 50% overlay week, the 5% allocation becomes 2.5% capital committed, positioning technology as a satellite conviction rather than core exposure. The category would need either a cleaner entry point below the 50W or a meaningful improvement in credit and liquidity conditions to graduate into the top-2 tier.
Defense & Aerospace — XAR
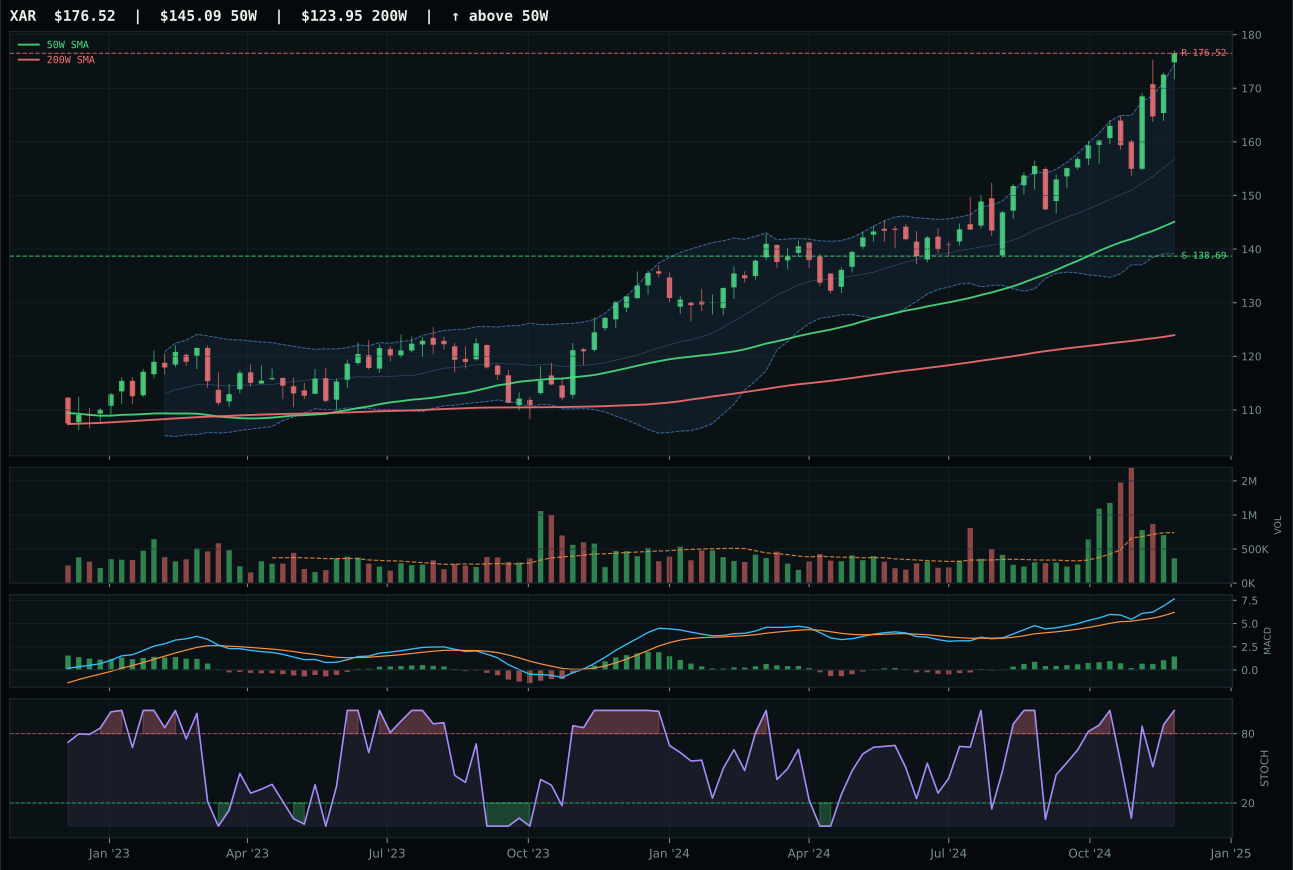
XAR has a vertical extension profile with 6.6% 13-week relative strength versus SPY.
A failed hold above support would weaken the setup.
Actionable but governed by invalidation levels.
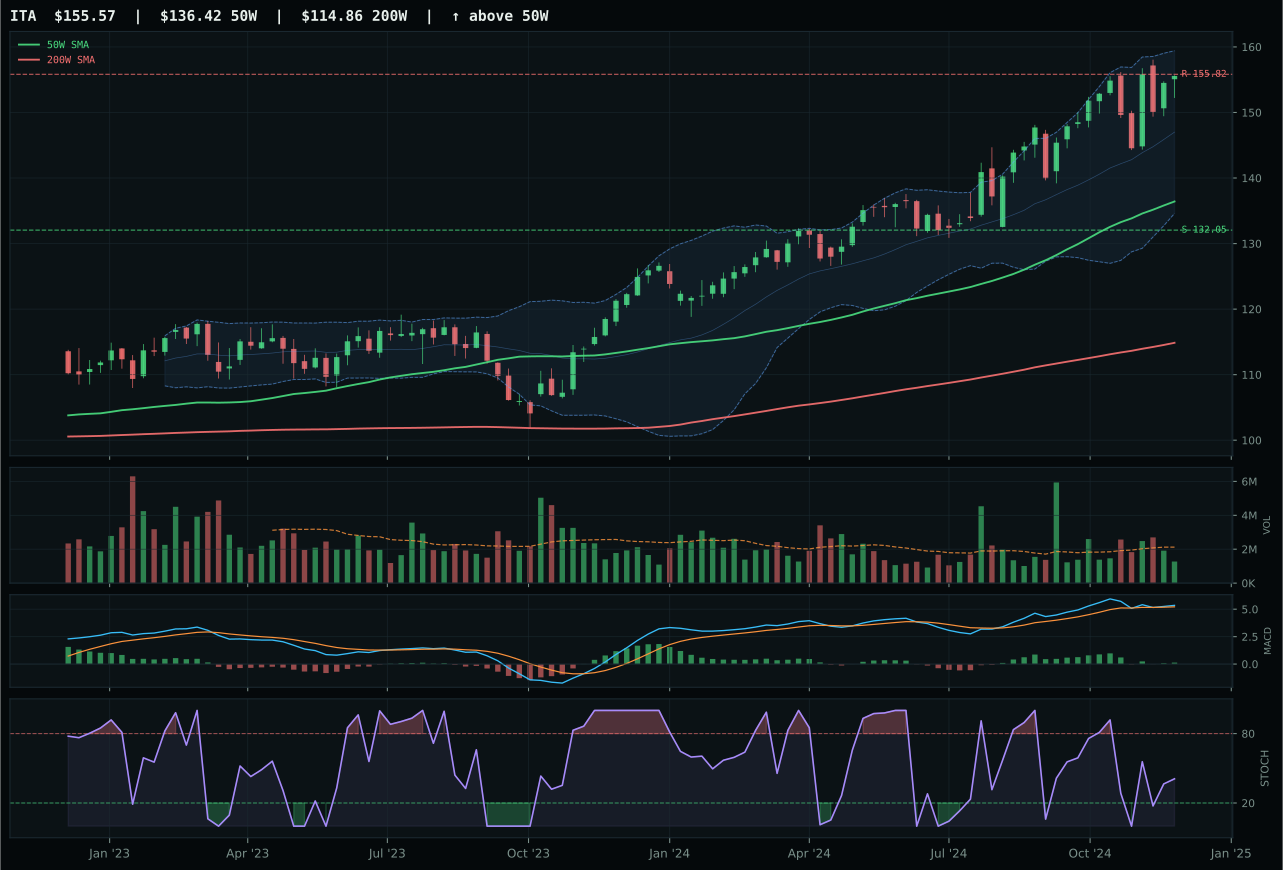
ITA has a neutral structure profile with -1.6% 13-week relative strength versus SPY.
A failed hold above support would weaken the setup.
Actionable but governed by invalidation levels.
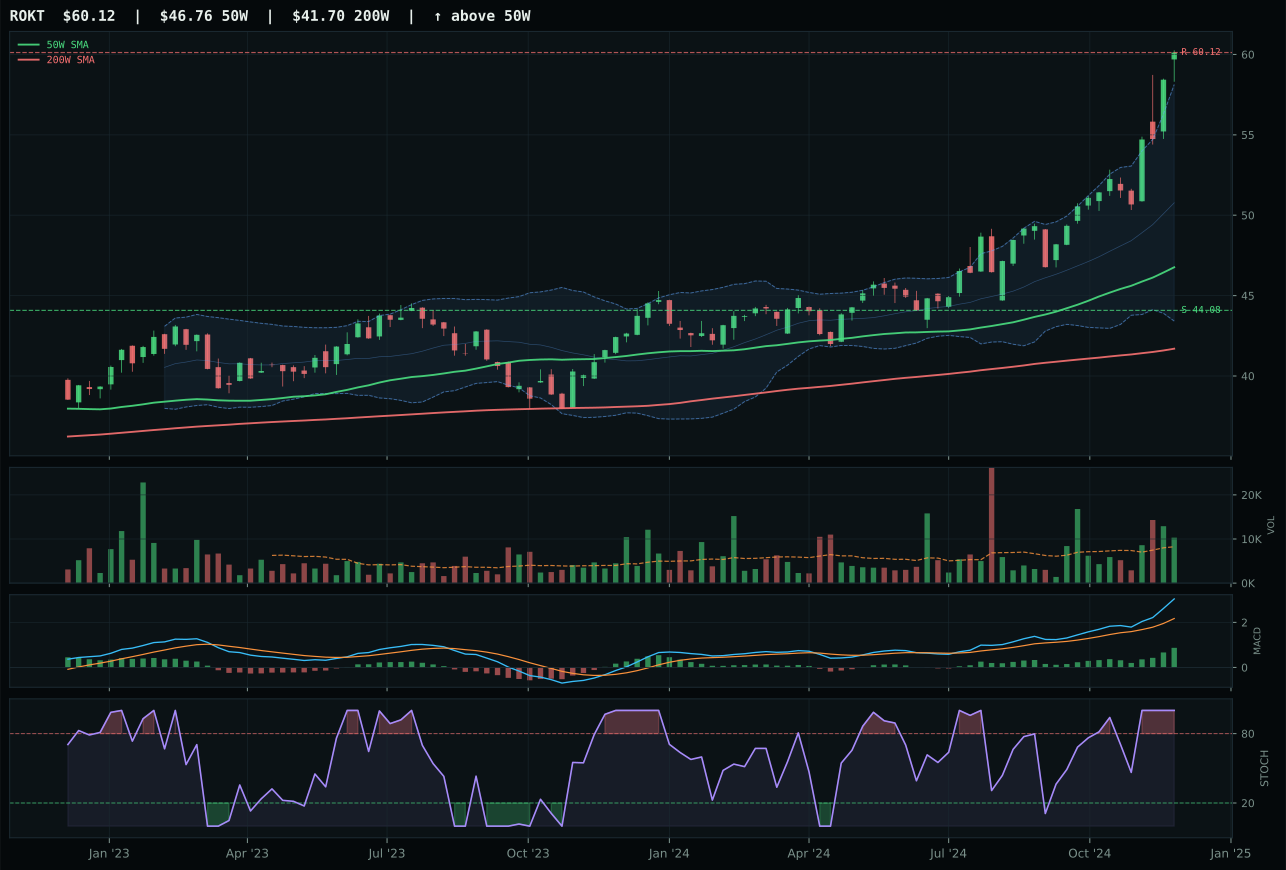
ROKT has a vertical extension profile with 15.0% 13-week relative strength versus SPY.
A failed hold above support would weaken the setup.
Tracked, but not top-2 eligible because: .
XAR won a tight category decision over ITA by just 0.9 points, claiming leadership through superior category-relative strength (0.0% versus -8.2%) and better risk-reward symmetry. Both setups are extended above their 50W levels, but XAR's momentum confirmation score of 100.0 paired with clean vertical extension structure proves that accumulation is still active despite thin participation. ITA's 13-week return of only 5.3% versus XAR's 13.5% appears marginal, yet it compounds with ITA's falling stochastic RSI and weaker structure cleanliness (75.0 vs 75.0) to create a setup that is deteriorating faster as price stretches. XAR's 21.7% extension above the 50W is aggressive, but the 0.6% slope of the 50W itself remains non-deteriorating, preserving trend validity.
Defense & Aerospace earned 5% allocation as tier-2, with a category score of 53.6 anchored in strong macro tailwinds. Defensive rotation is active at +8, broad market bear concern at +6, and dollar pressure contributing +3, yielding 66.0 category macro fit. This is notably the only sub-60 score category that benefits from active defensive positioning. However, XAR's technical evidence of only 61.6/100 is dragged down by thin participation, weaker volume-price confirmation, and entry risk from vertical extension. The allocation is defensively positioned rather than tactically bullish; the category would need XAR to break cleanly above its 176.52 resistance without rolling over to justify holding the position in a portfolio already tilted toward defensive themes like utilities and metals.
Precious Metals — GLD
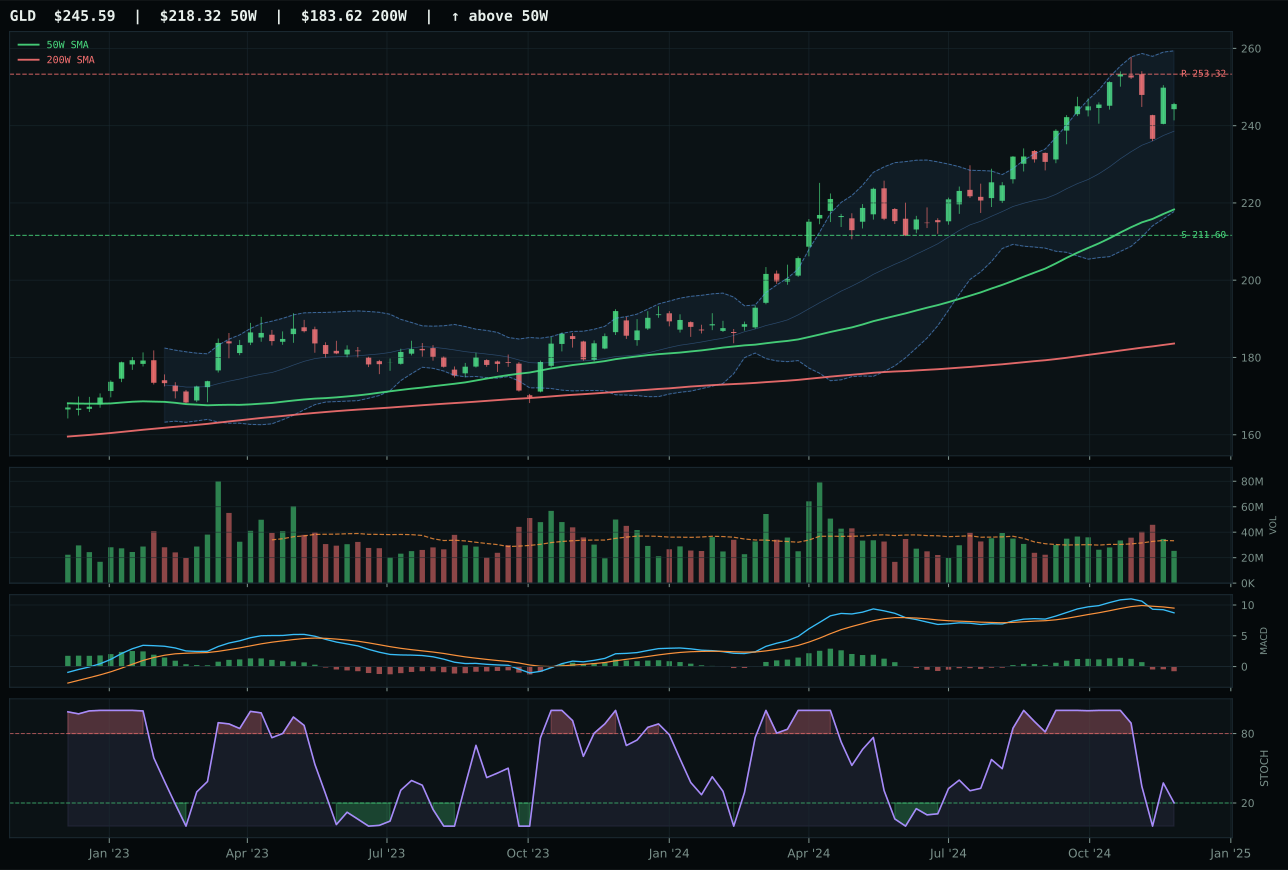
GLD has a neutral structure profile with -0.7% 13-week relative strength versus SPY.
A failed hold above support would weaken the setup.
Actionable but governed by invalidation levels.
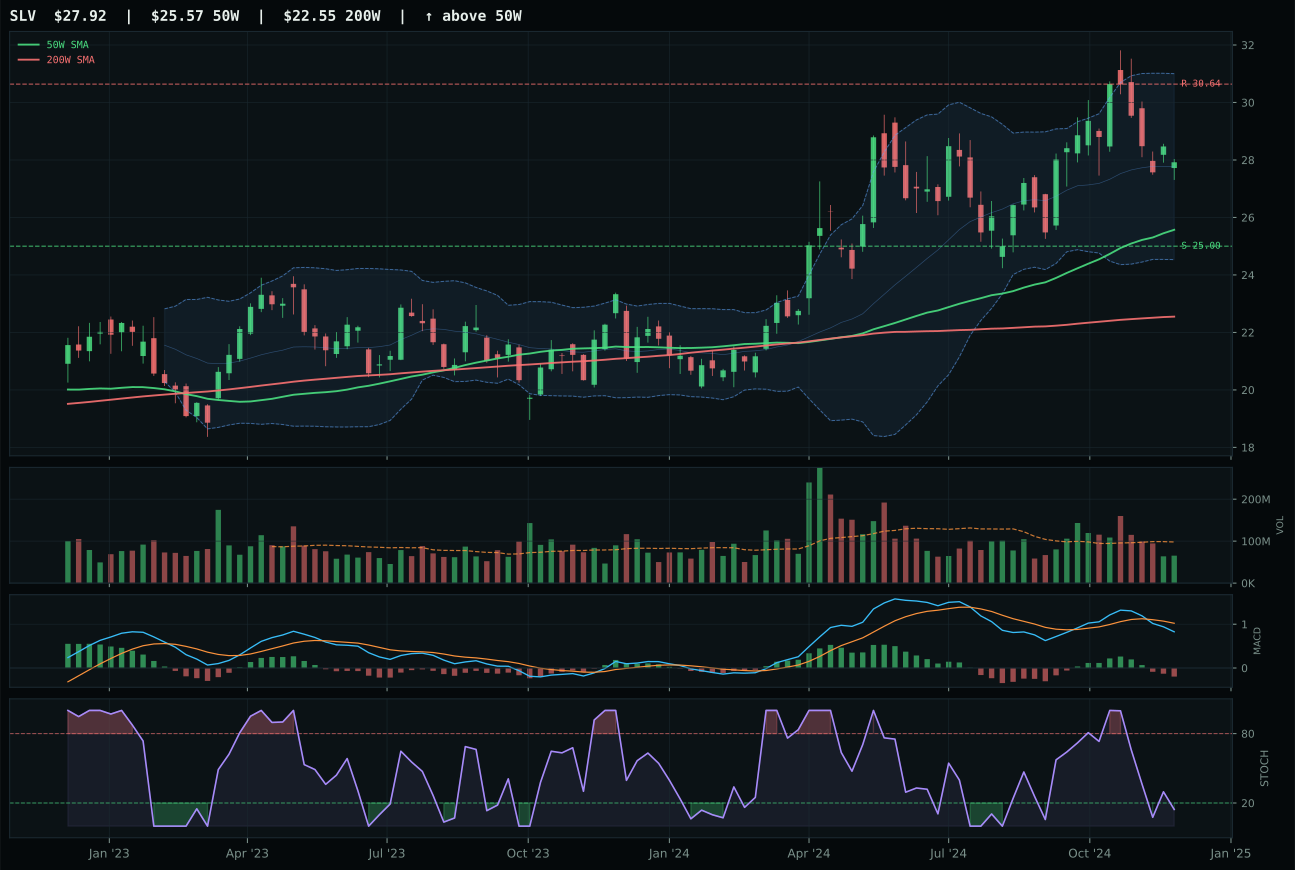
SLV has a neutral structure profile with -0.9% 13-week relative strength versus SPY.
A failed hold above support would weaken the setup.
Actionable but governed by invalidation levels.
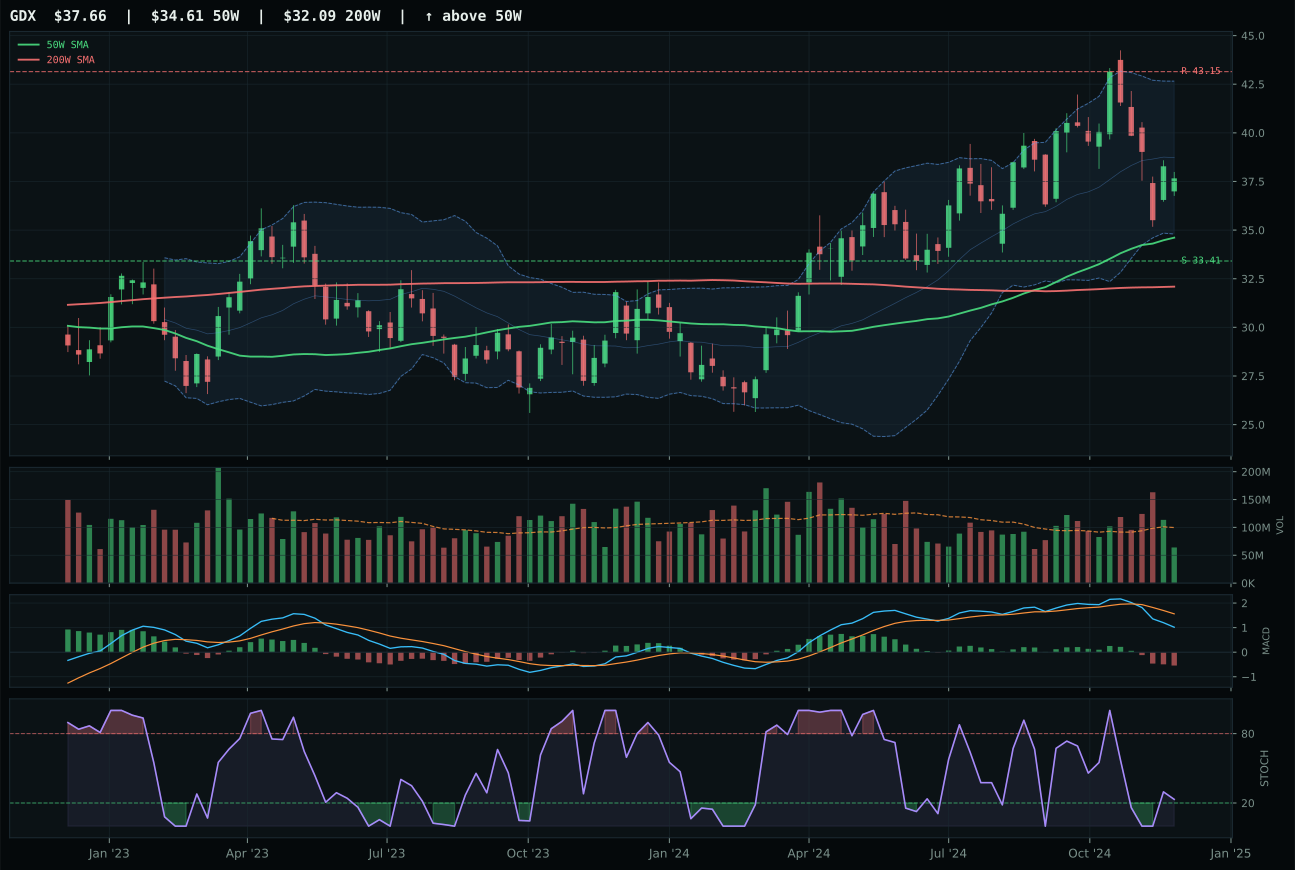
GDX has a neutral structure profile with -9.4% 13-week relative strength versus SPY.
A failed hold above support would weaken the setup.
Actionable but governed by invalidation levels.
GLD won by 8.6 points over SLV, securing the category representative slot through cleaner structure and superior volume confirmation despite both showing bearish MACD and negative four-week returns. The key differentiation: GLD's neutral volume participation at 0.76x the 20-day average versus SLV's thin participation signals that GLD's 6.2% thirteen-week return is being absorbed gradually rather than dumped on short covering. GLD's structure cleanliness of 58.3 and compression score of 85.8 indicate a setup that is mechanically tighter and more defensible, whereas SLV's cleanliness of 41.7 (the lowest score among the three) reflects choppier price action that offers less conviction. Both are 12.5% from their respective 50W levels, but GLD's neutral volume makes the extension feel sustainable in a risk-off environment.
Precious Metals earned 5% allocation as tier-2, justified by exceptional macro alignment with a category macro fit of 74.0. Disinflation helps this exposure at +8, defensive rotation is active at +7, and disinflation pressure contributes an additional +6, creating a three-pillar defensive setup. Despite GLD's bearish MACD and falling stochastic RSI (0.20), the macro fit is so strong that the 43.8 technical evidence score is sufficient to secure tier-2 placement. In the 50% overlay regime, 5% allocation becomes 2.5% capital, appropriately sized as a macro hedge rather than a tactical bet. The category would graduate to top-2 only if technical evidence improved—a stochastic rising from oversold or MACD inflecting positive—while maintaining current macro support. For now, GLD serves as the portfolio's disinflation insurance, paid for by underweight positioning elsewhere.
Industrial Metals — COPX
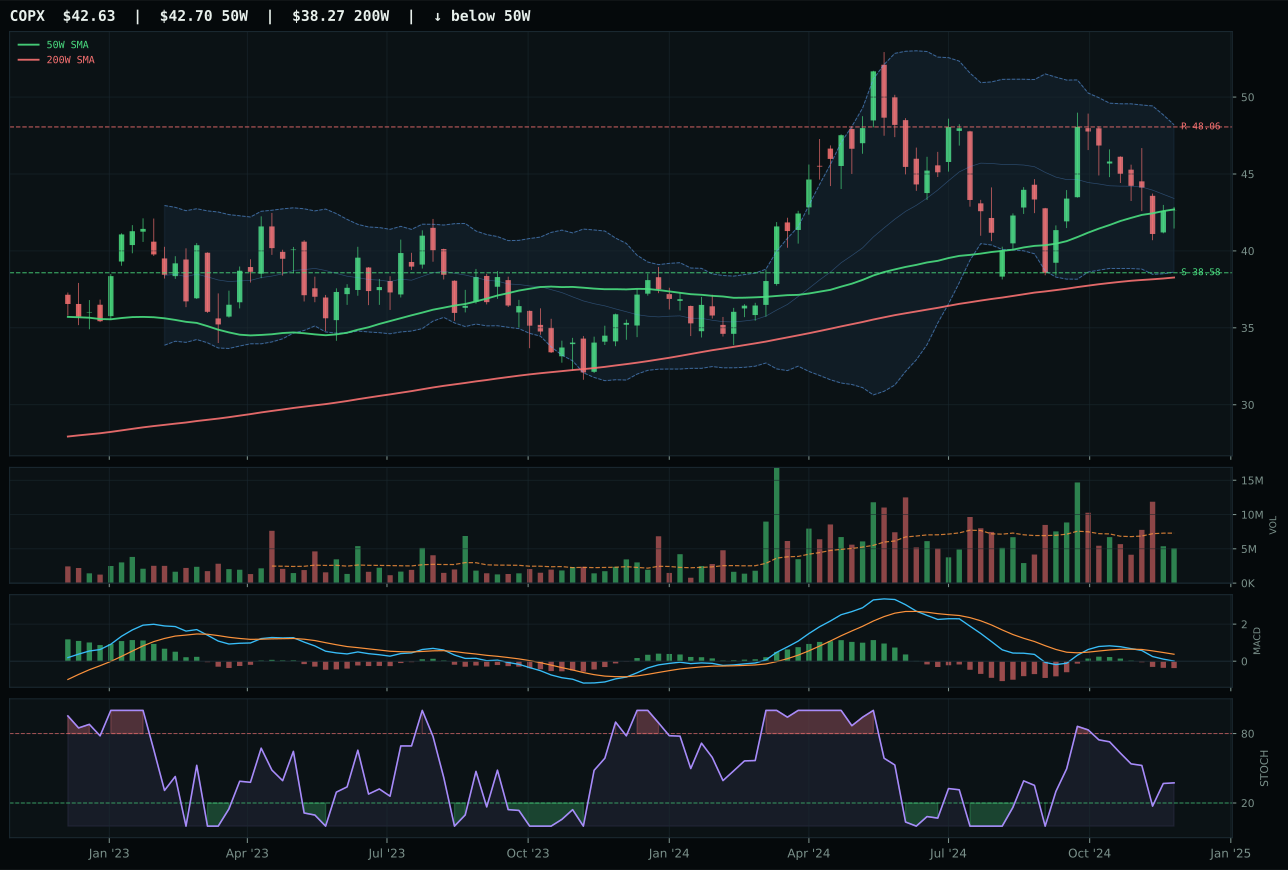
COPX has a compression near 50W profile with -8.5% 13-week relative strength versus SPY.
A failed hold above support would weaken the setup.
Actionable but governed by invalidation levels.
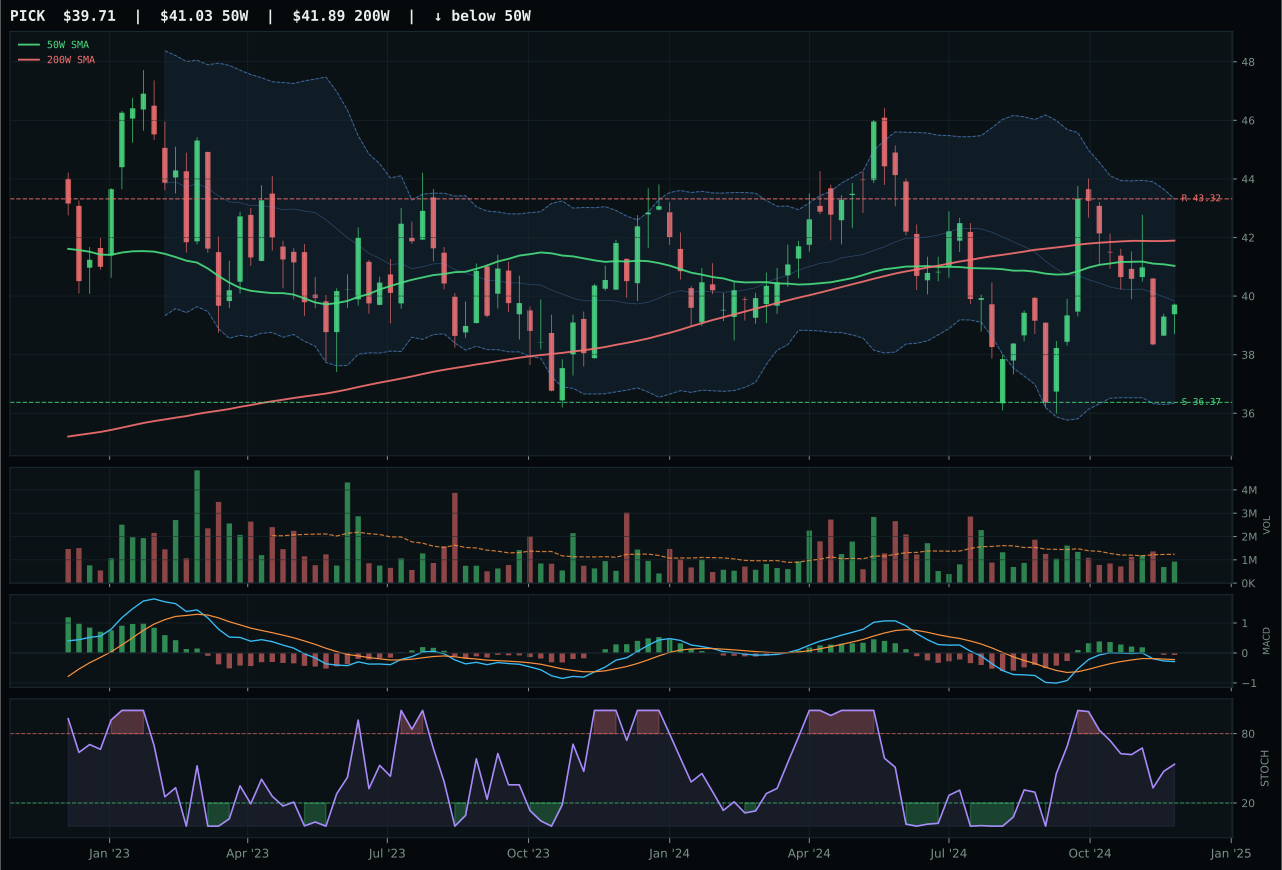
PICK has a neutral structure profile with -5.5% 13-week relative strength versus SPY.
Extension and support failure are the main tactical risks.
Tracked, but not top-2 eligible because: structurally broken.
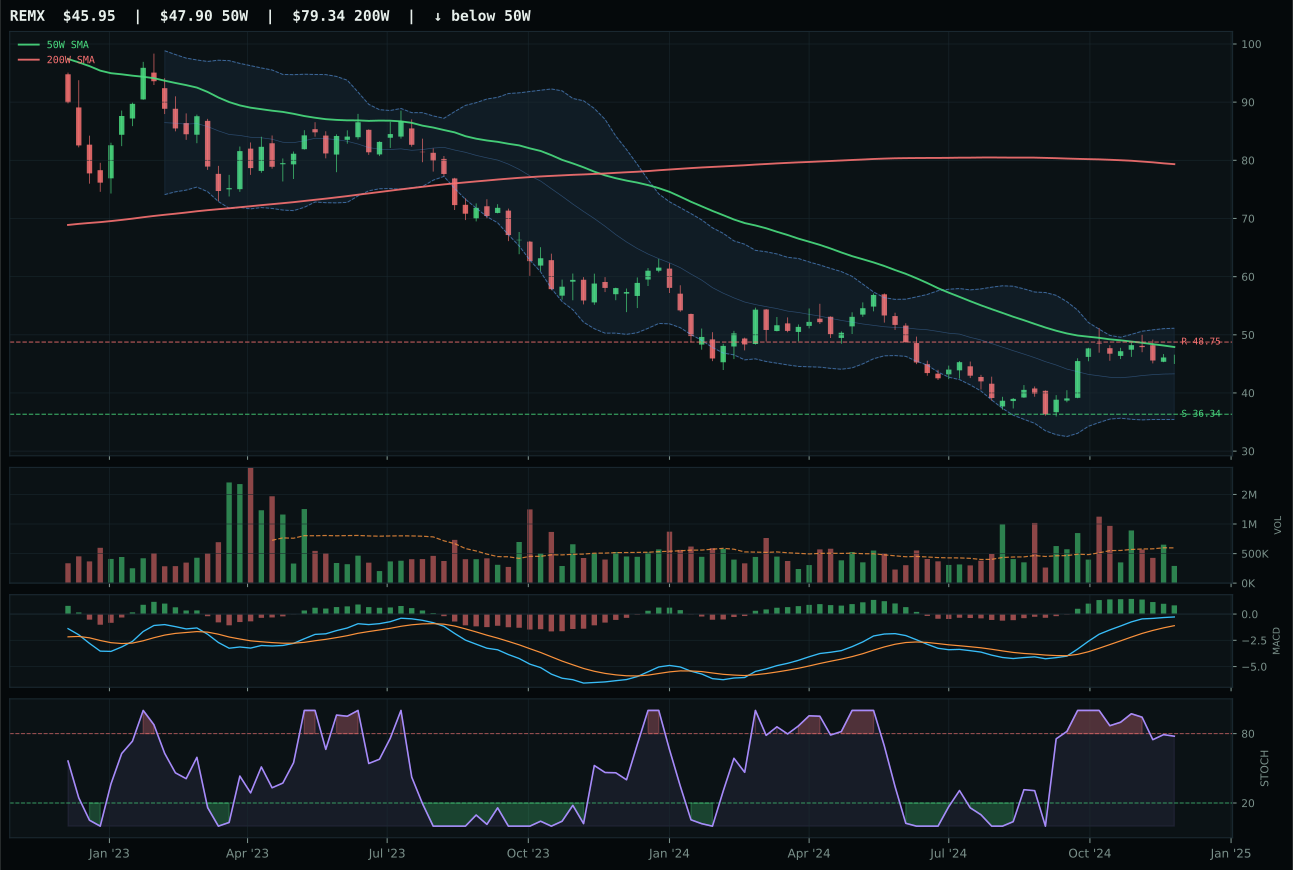
REMX has a neutral structure profile with 8.3% 13-week relative strength versus SPY.
Extension and support failure are the main tactical risks.
Tracked, but not top-2 eligible because: structurally broken.
COPX claimed the category representative slot over PICK on the back of superior timing (100.0 versus 85.0) and cleaner compression structure, despite both showing bearish MACD and negative momentum. COPX's setup is compression near the 50W at -0.2% distance, with stochastic falling through neutral at 0.37, creating a coil that has defined invalidation (support at 38.58) and defined expansion potential if 48.06 resistance breaks. PICK's deep retracement setup and -5.5% SPY-relative weakness indicate it has already suffered more damage and lacks the mechanical tightness of COPX. Risk-reward heavily favors COPX (72.4 vs 69.3): while both have poor upside, COPX offers only 10.5% downside to support versus PICK's deeper drawdown potential. Neither setup is technically attractive, but COPX's compressed state offers a better entry frame for a macro reversal trade.
Industrial Metals earned 5% allocation as tier-2, despite a category score of only 27.6 that reflects severe technical deterioration. The allocation is justified entirely by macro sponsorship: metals scarcity is active at +14, commodity breadth positive at +10, and real asset sponsorship at +6, totaling 58.0 category macro fit. However, active liquidity stress (-8) and credit stress (-7) drag on the macro outlook. COPX's 6.0 technical evidence score is dangerously low, offset only by 56.0 macro narrative fit. In the 50% overlay regime, this becomes a 2.5% tactical macro bet that copper demand remains supported despite financial stress. The category is underwater on a thirteen-week basis and would require both a technical reversal (stochastic rising, MACD inflecting) and continued commodity breadth support to justify holding beyond the next rebalance. This allocation is defensive positioning in case financial stress reverses, not a conviction trade.
AI — AIQ
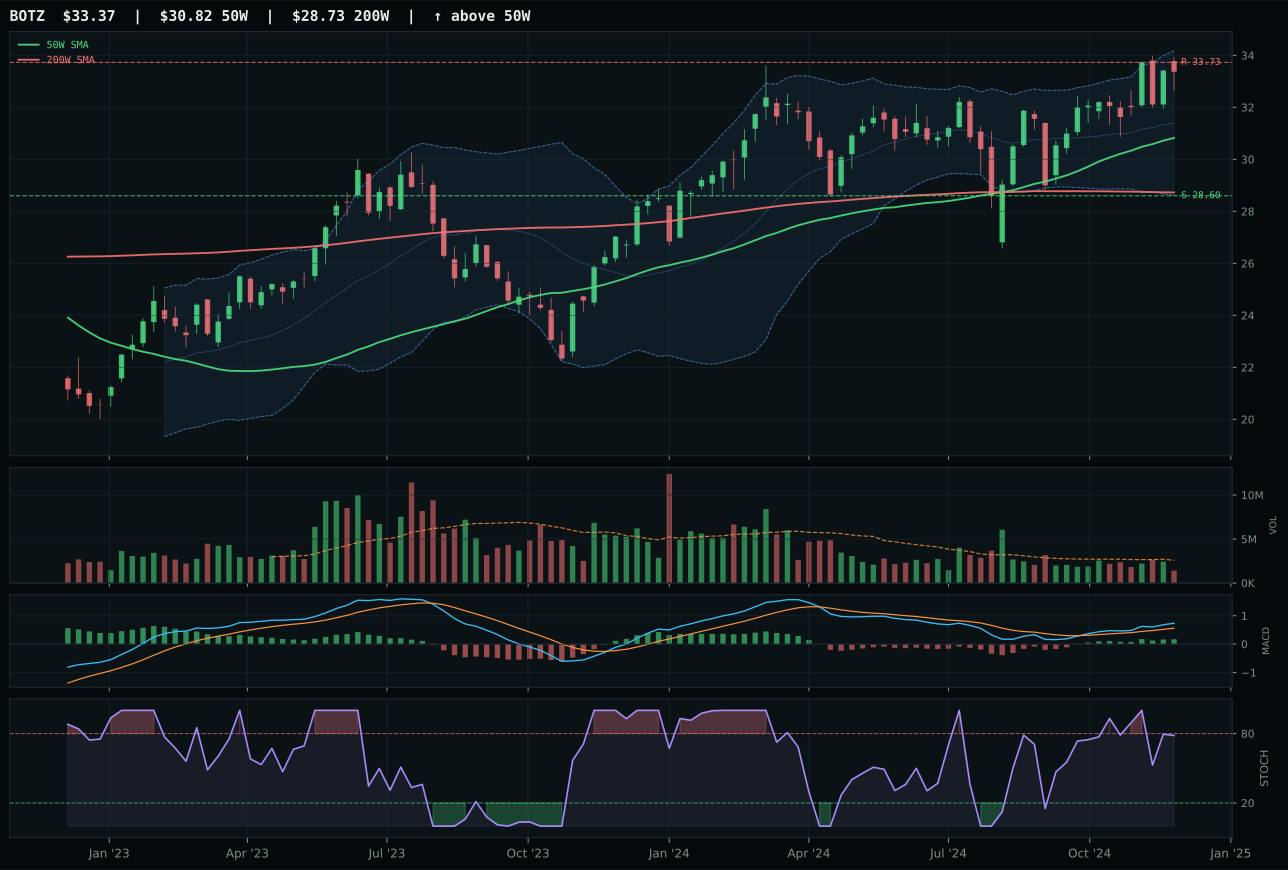
BOTZ has a neutral structure profile with -1.2% 13-week relative strength versus SPY.
A failed hold above support would weaken the setup.
Actionable but governed by invalidation levels.
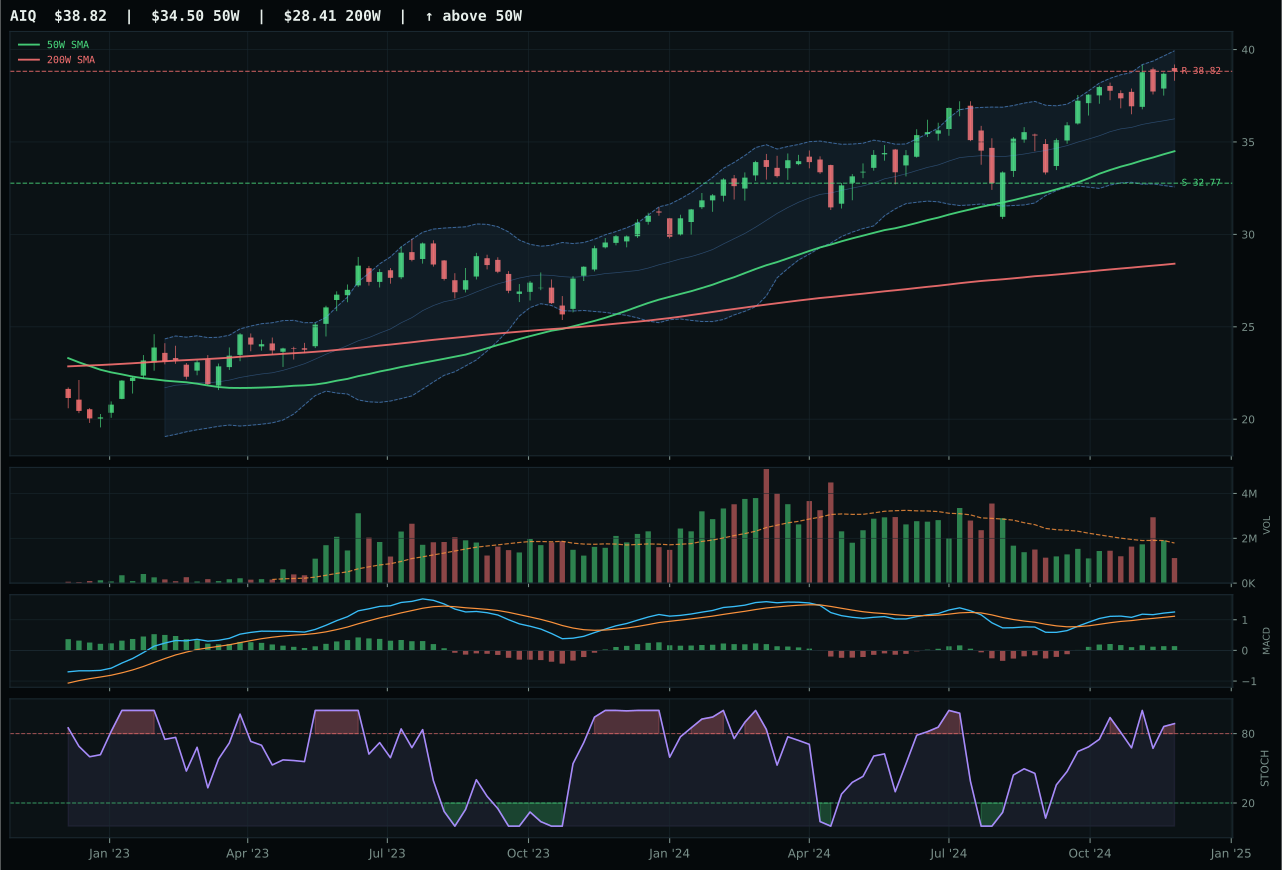
AIQ has a neutral structure profile with 2.9% 13-week relative strength versus SPY.
A failed hold above support would weaken the setup.
Actionable but governed by invalidation levels.
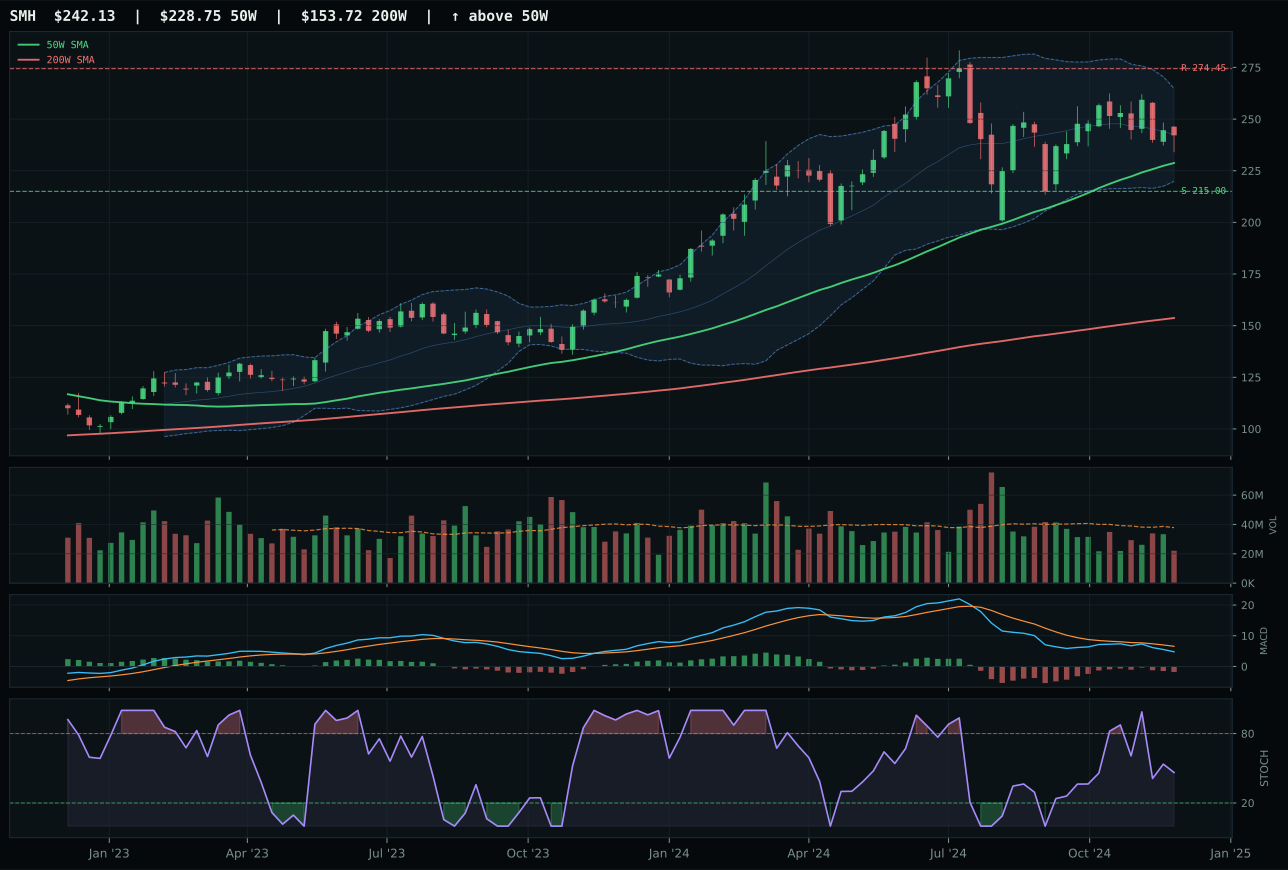
SMH has a neutral structure profile with -7.4% 13-week relative strength versus SPY.
A failed hold above support would weaken the setup.
Actionable but governed by invalidation levels.
AIQ edged BOTZ by 3.9 points, winning on category-relative strength (4.1% versus 0.0%) and superior risk-reward geometry despite both trading at thin participation levels. The pivotal advantage lay in AIQ's timing: stochastic RSI overbought and rolling over at 0.89 signals that this bounce is controlled, whereas BOTZ's stochastic falling through neutral suggests momentum is already fading. AIQ's 9.8% thirteen-week return outpaced BOTZ's 5.7%, and its 12.5% distance from the 50W versus BOTZ's deeper extension means there is still room to accumulate before invalidation. Both setups are neutral structure, but AIQ's slight edge in cleanliness and compression scores reflects tighter price action that is easier to defend mechanically.
AI received 5% allocation as a tier-2 category, but its score of 27.3 is severely compromised by macro misalignment. Liquidity stress and credit stress are both active, each dragging the category fit down by -9 to -12 points, and the broader macro backdrop of disinflation offers only a modest +5 bounce. AIQ's 59.3 technical evidence score is respectable, but 34.0 macro fit leaves the category sitting squarely in the middle of an unfavorable environment. In a 50% overlay regime, the 5% allocation represents a tactical hold rather than conviction. The category needs either a significant credit or liquidity relief event to justify rebalancing capital upward, or it risks becoming a drag on risk-adjusted returns as volatility spikes.
Traditional Energy — XLE
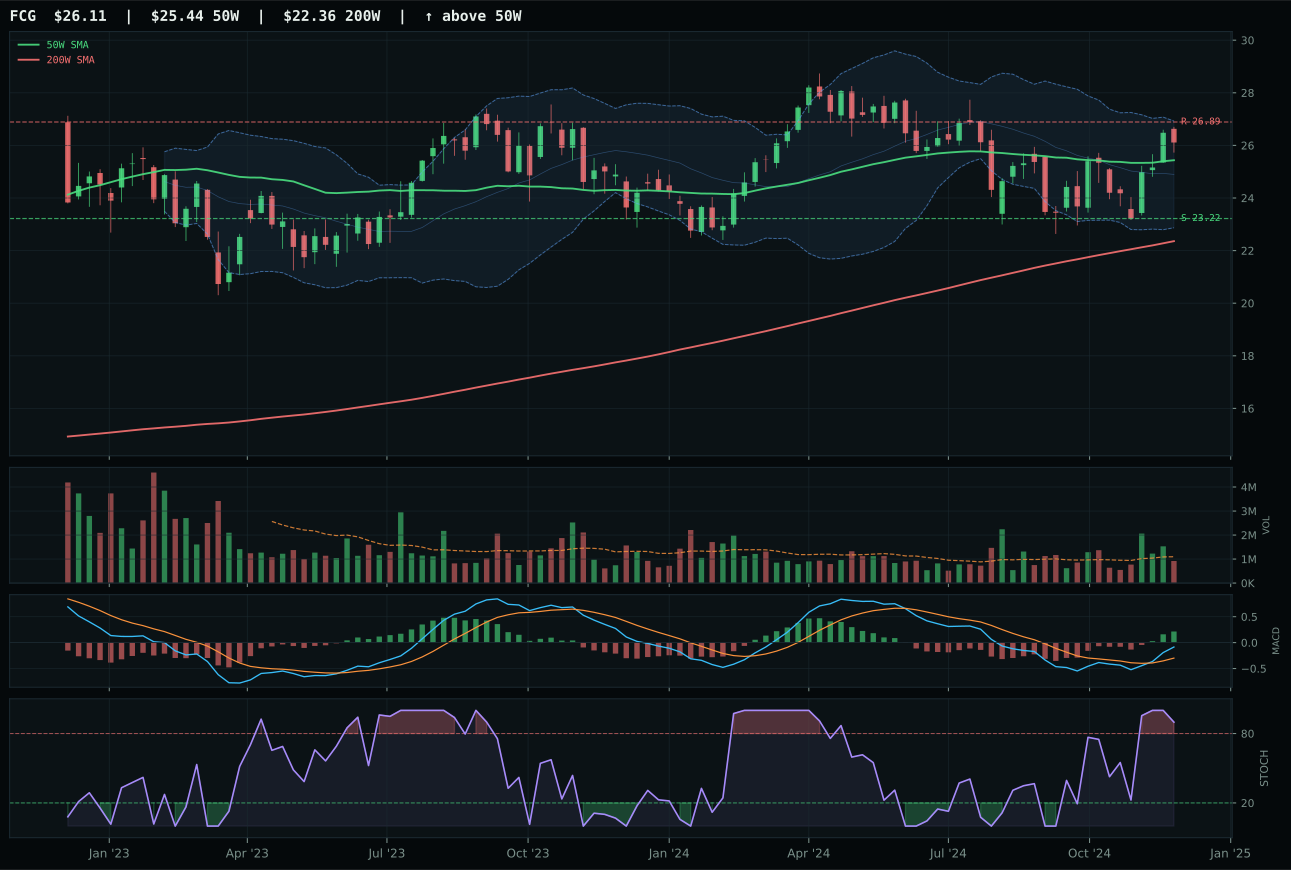
FCG has a compression near 50W profile with -4.0% 13-week relative strength versus SPY.
A failed hold above support would weaken the setup.
Actionable but governed by invalidation levels.
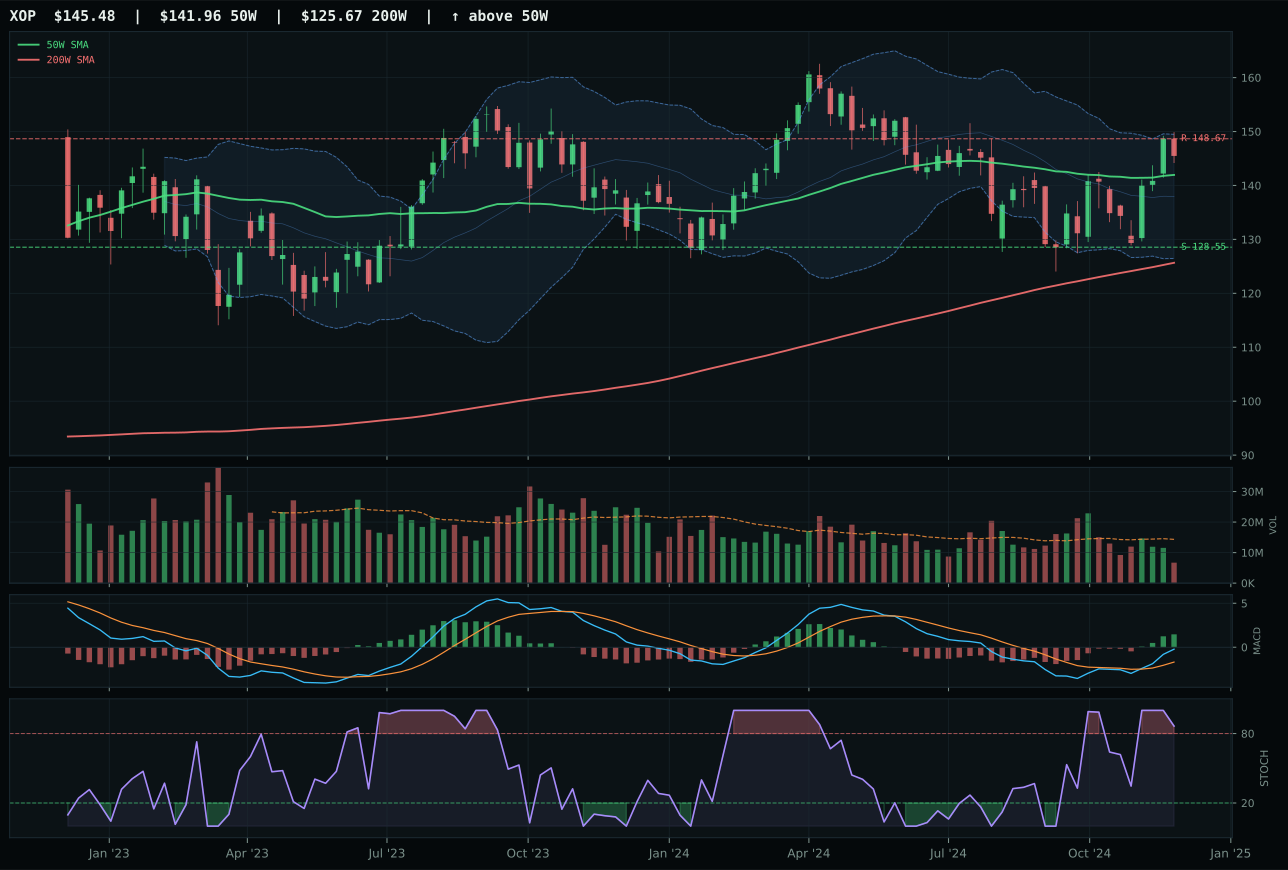
XOP has a compression near 50W profile with -2.6% 13-week relative strength versus SPY.
A failed hold above support would weaken the setup.
Actionable but governed by invalidation levels.
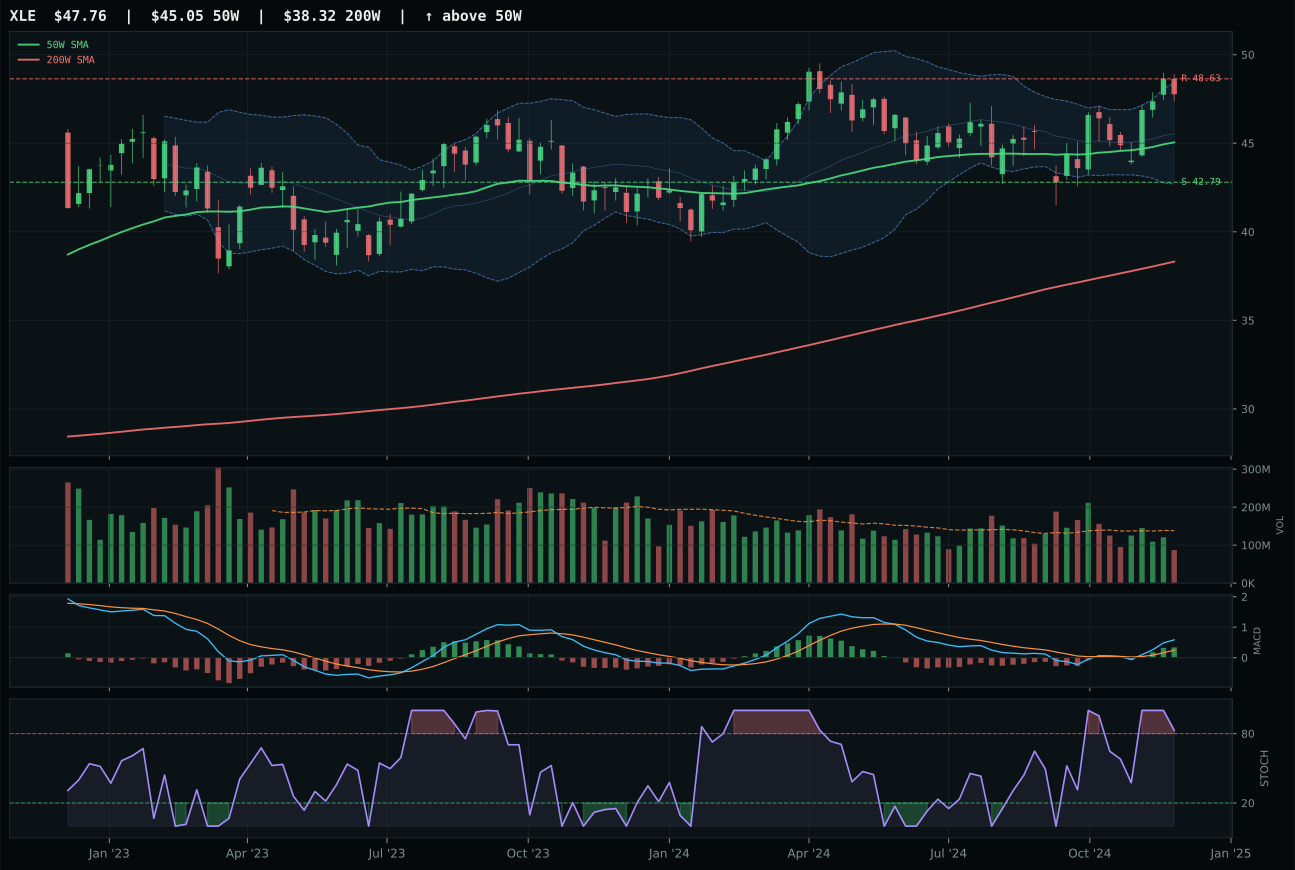
XLE has a neutral structure profile with -2.2% 13-week relative strength versus SPY.
A failed hold above support would weaken the setup.
Actionable but governed by invalidation levels.
XLE captured the category representative role over higher-ranked peers FCG and XOP by virtue of category-relative strength (0.4% versus -1.3%) and marginally superior composition despite all three showing bullish MACD and overbought stochastic rollover. XLE's 4.7% thirteen-week return trails FCG's 2.9%, yet beats on relative strength and category positioning—a signal that the allocator values peer leadership over absolute momentum. All three setups rest near their 52-week lows with repair-zone Fibonacci levels, meaning entry risk is minimal and invalidation is tight. XLE's neutral structure and 6.1% distance from the 50W create a lower-risk entry than FCG's compression setup, which is tighter but more vulnerable to false breakouts. Volume is thin across the category, but XLE's slight edge in category-relative sponsorship justifies selection.
Traditional Energy earned 5% allocation as tier-2, despite a severely depressed category score of 20.6 driven by powerful macro headwinds. Disinflation hurts this exposure at -10, and disinflation pressure is active at an additional -10, while real asset sponsorship provides only a +7 offset, yielding just 23.0 category macro fit. XLE's 42.0 technical evidence is respectable—trend at 96.6 is nearly perfect—but macro misalignment is overwhelming. In the 50% overlay regime, 5% becomes 2.5% capital allocated to a category fighting disinflation. The allocation appears defensive: energy is held not because of bullish technicals but because the macro regime may require real assets if deflation accelerates. XLE would need either a break above resistance at 48.63 with volume confirmation or a dramatic reversal in disinflation pressure to justify increasing the position. For now, it is a placeholder in case the macro narrative shifts toward stagflation.
Agriculture & Livestock — MOO
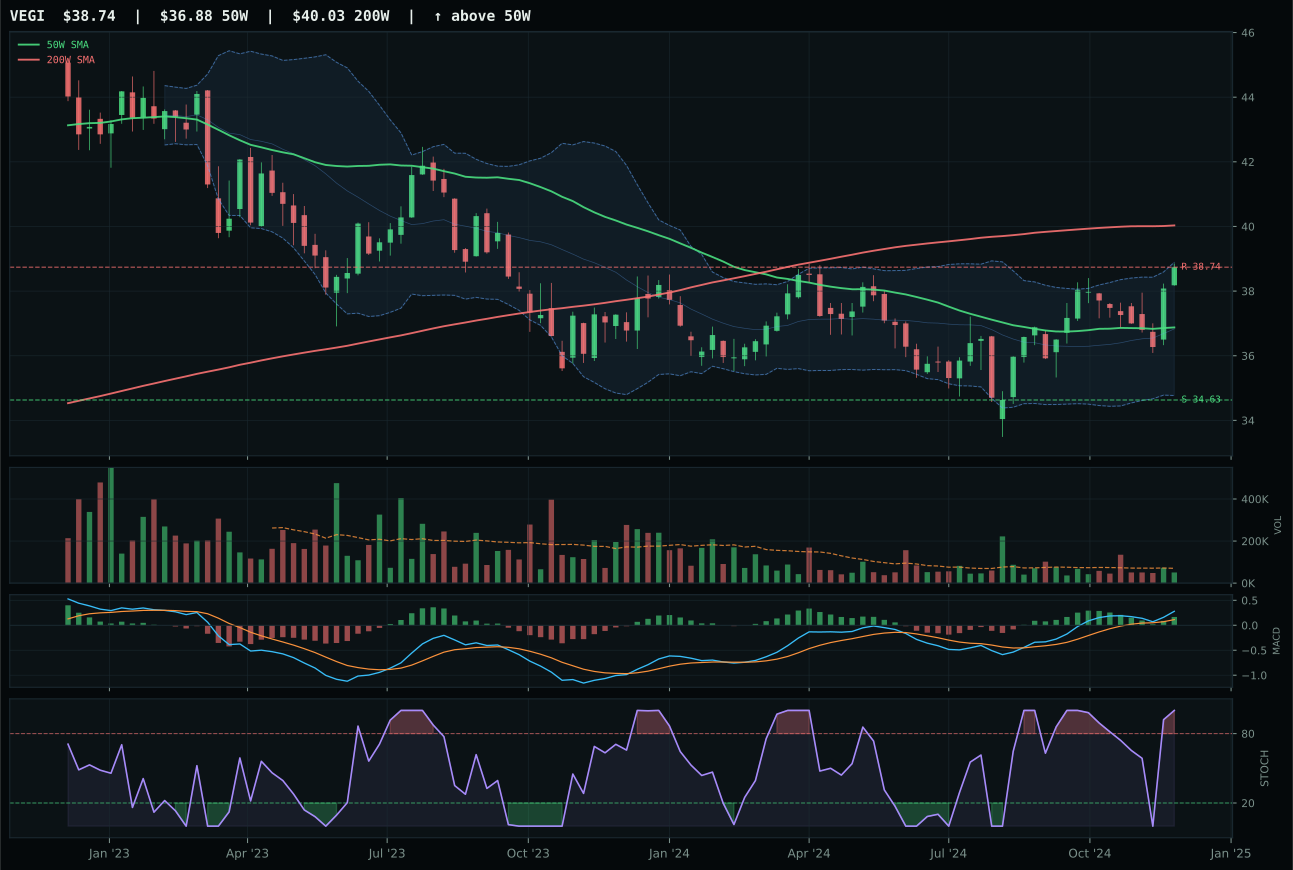
VEGI has a neutral structure profile with -1.9% 13-week relative strength versus SPY.
A failed hold above support would weaken the setup.
Tracked, but not top-2 eligible because: .
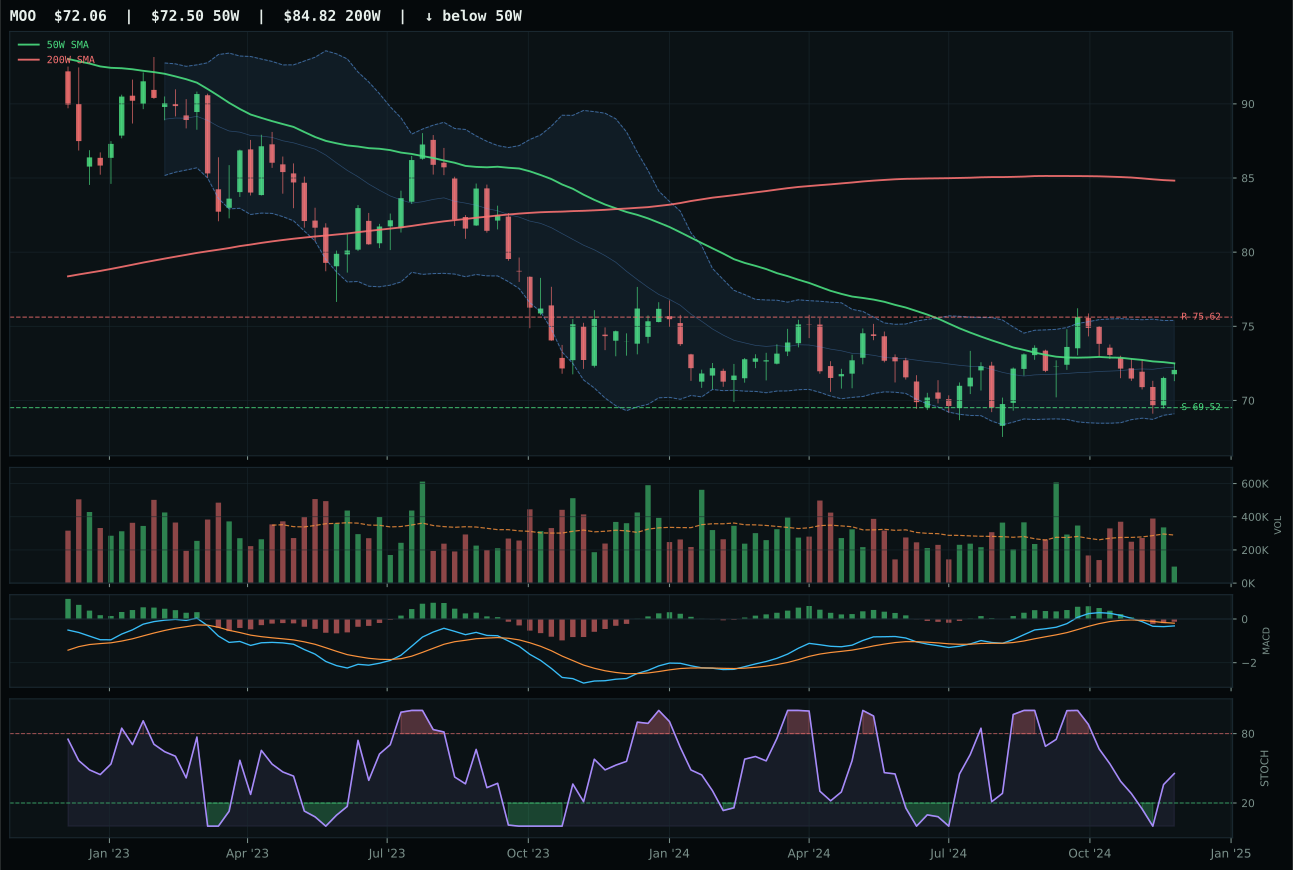
MOO has a pullback into support profile with -8.9% 13-week relative strength versus SPY.
Extension and support failure are the main tactical risks.
Tracked, but not top-2 eligible because: structurally broken.
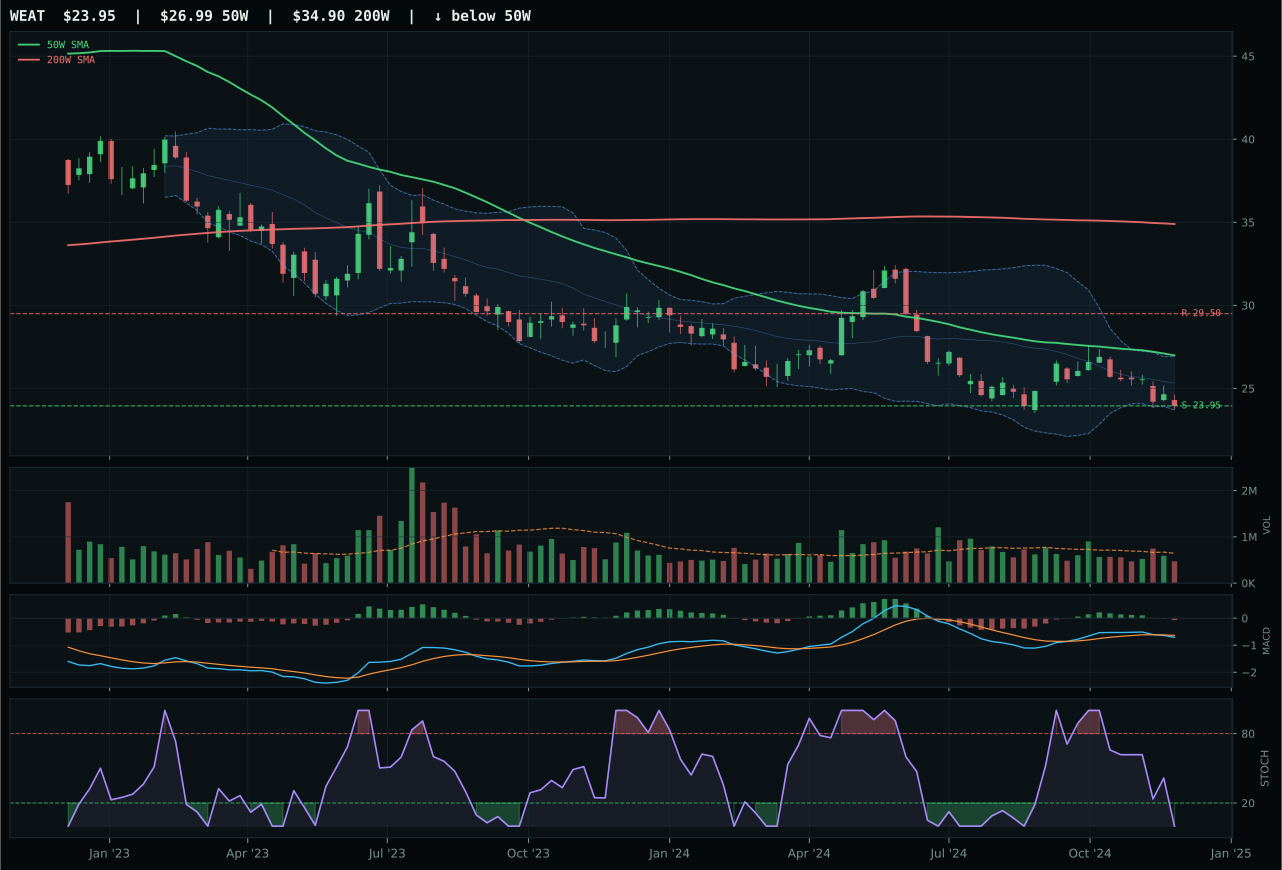
WEAT has a pullback into support profile with -10.5% 13-week relative strength versus SPY.
Extension and support failure are the main tactical risks.
Tracked, but not top-2 eligible because: structurally broken.
MOO won the category with the lowest absolute score (6.4) on a relative comparison, beating VEGI by 41.0 points through superior timing mechanics despite fundamentally broken technical structure. MOO's strength lies not in bullish confirmation—trend is at 13.6 and momentum at 15.5—but in its definition of risk. Price sits -0.6% from the 50W at compression support, giving stochastic RSI room to rise from mid-zone (0.46) without overcommitting, and MACD remains bearish, ensuring downside invalidation is tight at the 69.52 support level. VEGI's 5.0% thirteen-week return and overbought stochastic at 0.89 presents a looser risk profile: it is extended 5.1% from the 50W and lacks the mechanical reset that MOO offers. MOO's 76.2 risk-reward score reflects -4.7% upside but only 3.7% downside, creating an asymmetric edge in a deteriorating category.
Agriculture & Livestock earned 0% allocation this week, ranked 9th or 10th, excluded entirely from the portfolio. The category score of 6.4 and eligibility flag of False reflect a macro environment that is actively hostile to real assets. Disinflation pressure is active at -8 and real asset sponsorship at only +8, yielding net negative macro fit. Commodity breadth is positive at +5, but liquidity stress and dollar pressure overwhelm any potential upside. Even MOO's superior timing cannot salvage a category where 13-week returns are -2.0% and category-relative strength is at parity (0.0%). For this category to earn allocation, either disinflation pressure must reverse materially or real asset sponsorship must intensify to override the current deflationary headwind. Until then, the capital is better deployed in defensive utilities and precious metals, which benefit from the same protective macro regime without the commodity demand risk.
Emerging Markets — IEMG
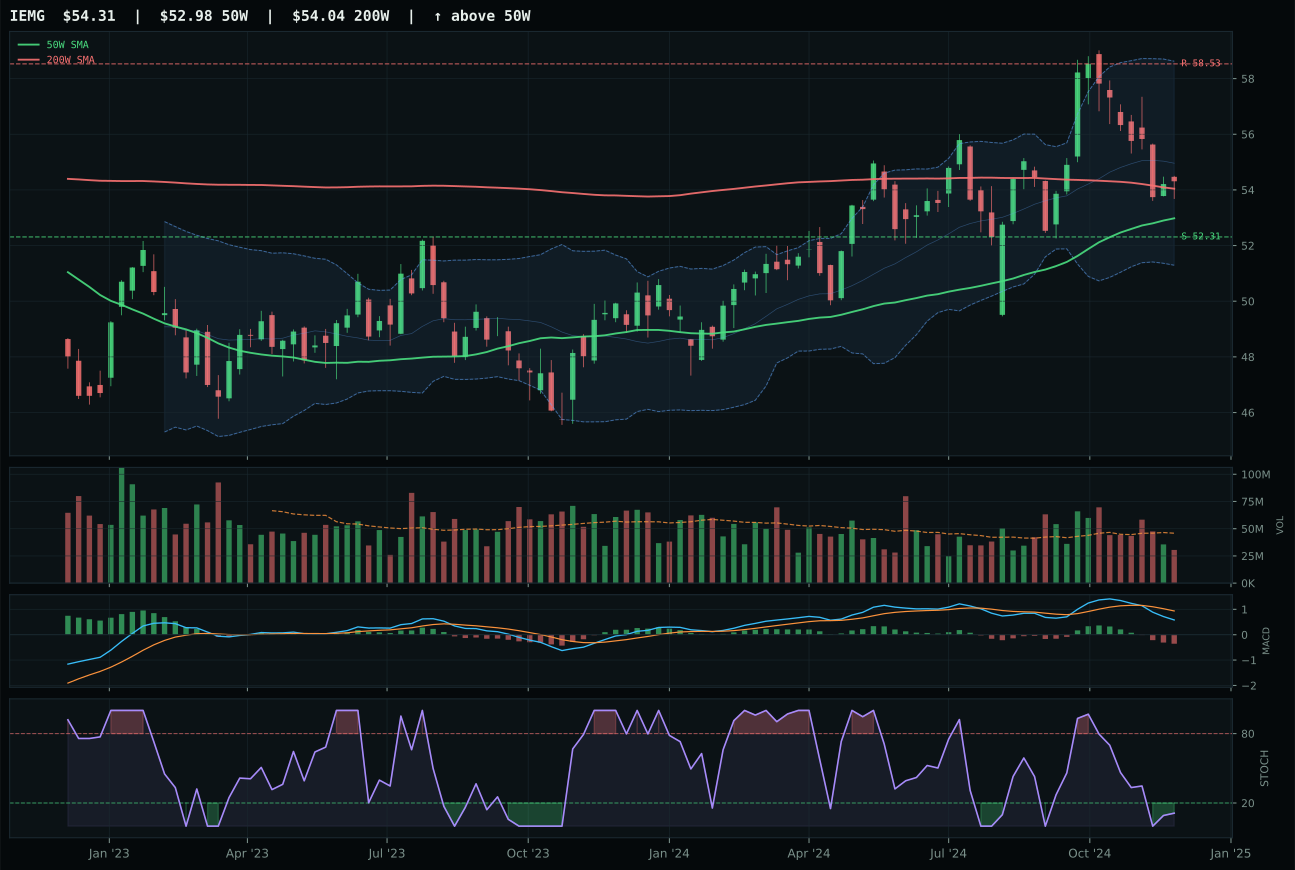
IEMG has a pullback into support profile with -7.2% 13-week relative strength versus SPY.
A failed hold above support would weaken the setup.
Actionable but governed by invalidation levels.
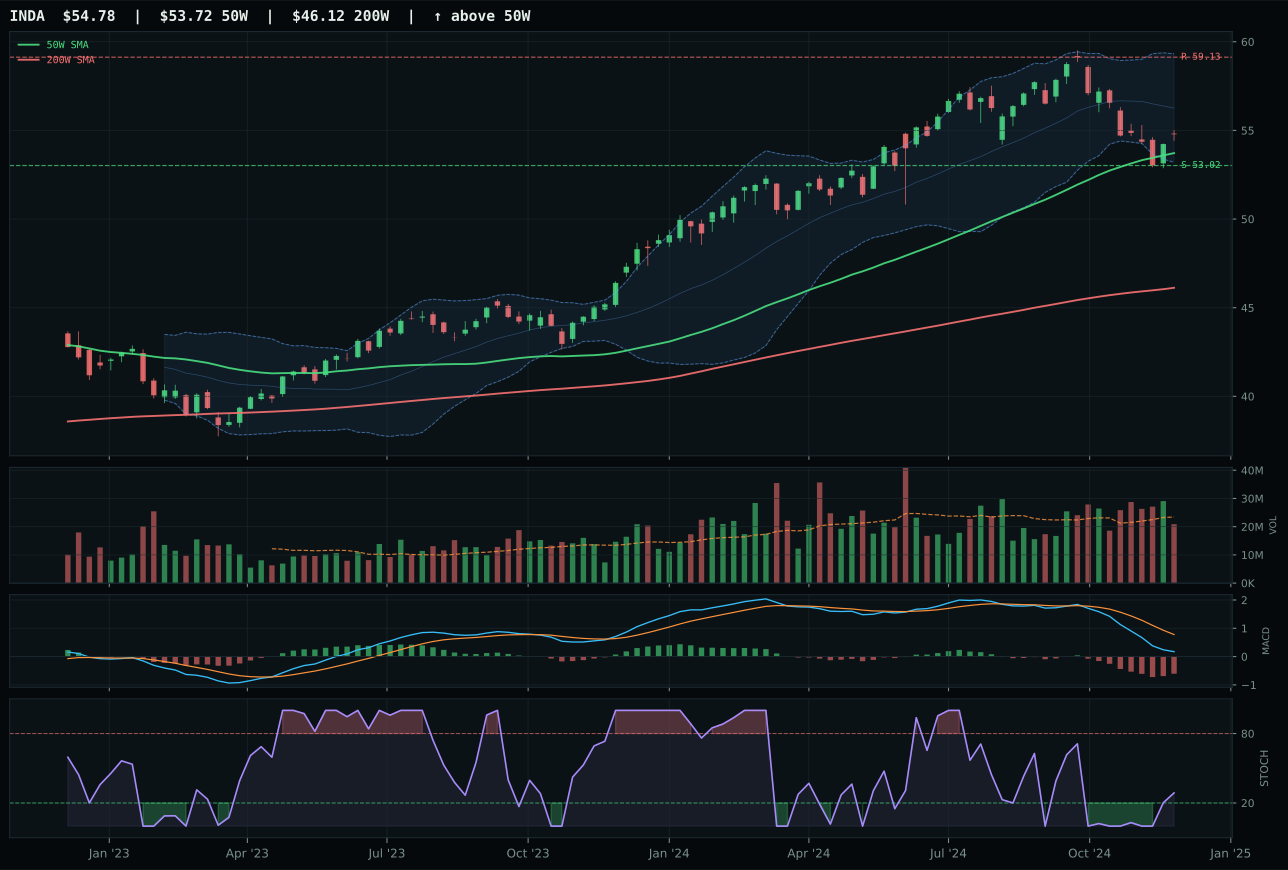
INDA has a pullback into support profile with -12.0% 13-week relative strength versus SPY.
A failed hold above support would weaken the setup.
Actionable but governed by invalidation levels.
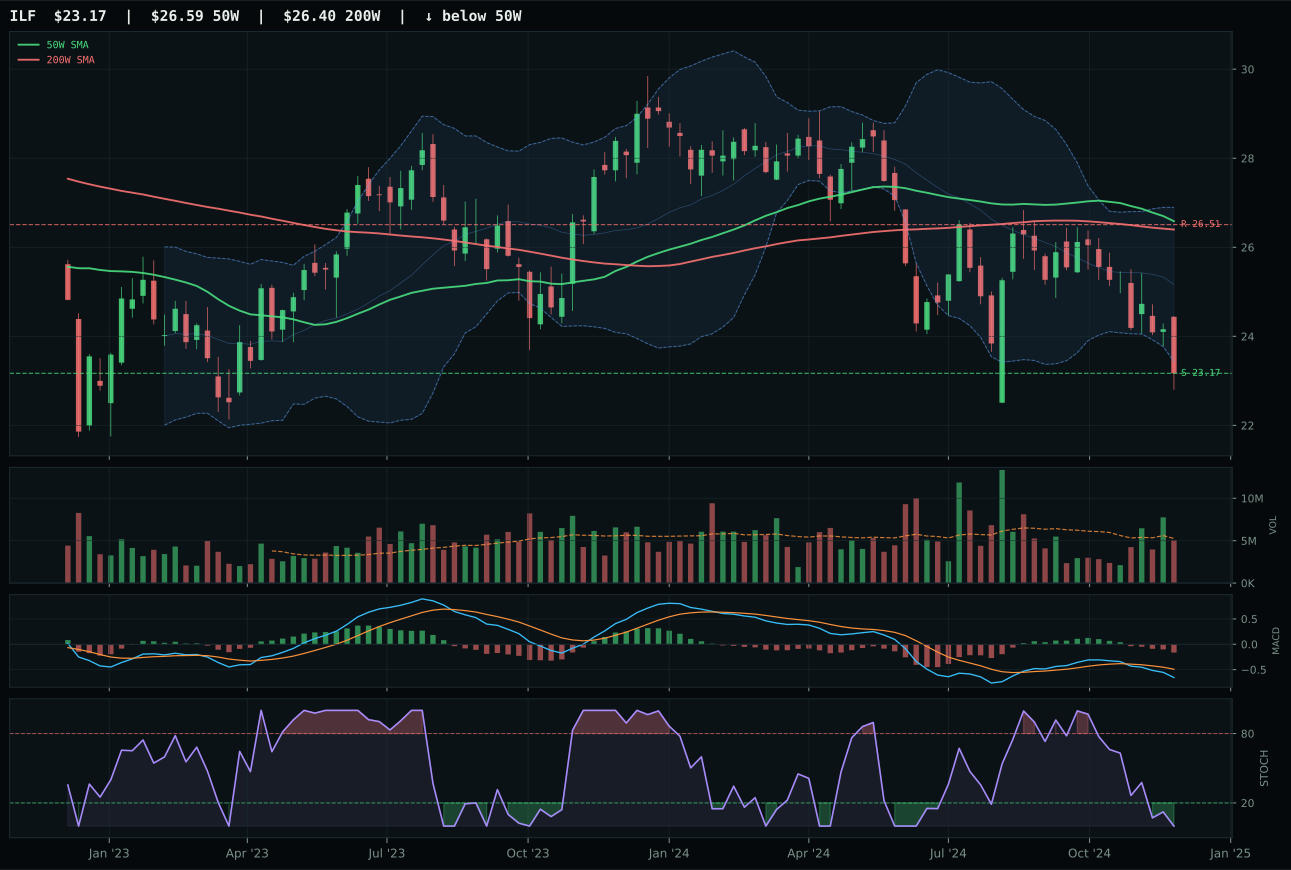
ILF has a pullback into support profile with -17.5% 13-week relative strength versus SPY.
A failed hold above support would weaken the setup.
Actionable but governed by invalidation levels.
IEMG won the category by 0.6 points over INDA on category-relative strength (4.8% versus 0.0%) despite both showing oversold/rising stochastic setups and bearish MACD. The decision margin was marginal: both pull into support with defined risk (3.8% downside), both register negative thirteen-week returns (-0.3% and -5.1%), and both suffer from active dollar pressure and credit stress. IEMG's advantage lies in its superior risk-reward setup: 86.9 score versus INDA's 84.9 reflects less upside potential (-7.2% versus -7.2%) but similar downside symmetry, paired with better volume signature. INDA's neutral volume and rising stochastic at 0.46 creates less mechanical conviction than IEMG's thin participation and oversold stochastic at 0.11, which leaves more room for unforced accumulation. The split is a judgment call on entry timing within a broken category.
Emerging Markets earned 0% allocation, ranked 9th or 10th, entirely excluded despite IEMG's technical merit. The category score of 1.6 and eligibility flag of False reflect a macro environment that is structurally hostile to emerging assets. Dollar pressure is active at -14, credit stress at -10, liquidity stress at -10, and broad market bear concern at -9, creating a combined -43 macro headwind that no technical setup can overcome. Even IEMG's superior 100.0 timing score cannot salvage a 7.0 category macro fit. The 41.6 technical evidence from IEMG is rendered irrelevant by the 24.0 macro narrative fit, weighted at 36%. For IEMG to earn allocation, the dollar would need to weaken materially, credit stress would need to ease, and liquidity conditions would need to improve—essentially requiring a broad risk-on rotation that would shift capital to riskier assets before returning to emerging markets. The category sits on a watch list rather than in the portfolio.