
2024-11-22
Informational purposes only. The content in this report, including allocations, analysis, and commentary, is provided solely for informational and educational purposes. It does not constitute financial advice, investment advice, trading advice, or any other type of advice. Past performance does not guarantee future results. Always conduct your own research and consult a qualified financial professional before making investment decisions.
Slow macro Defensive trigger is active (Monetary Defense), but crypto-cycle exposure has priority for this run.
Weekly Allocation
| Ticker | Category | Weight | Role |
|---|---|---|---|
| FBTC | 50% | Overlay | |
| URA | Nuclear Energy | 10% | Top-2 (10%) |
| XAR | Defense & Aerospace | 10% | Top-2 (10%) |
| PAVE | Utilities & Infrastructure | 5% | Tier-2 (5%) |
| XLE | Traditional Energy | 5% | Tier-2 (5%) |
| IGV | Technology | 5% | Tier-2 (5%) |
| GLD | Precious Metals | 5% | Tier-2 (5%) |
| BOTZ | AI | 5% | Tier-2 (5%) |
| COPX | Industrial Metals | 5% | Tier-2 (5%) |
Trade Instructions — Monday Open
Sell the tranche from 2024-10-25 (completing its 4-week hold). Buy the new tranche. Instructions show net portfolio changes — same-asset positions cancel, weight changes show the delta.
| Action | Ticker | Instruction |
|---|---|---|
| SELL | GLD | Sell 14% of GLD position (reduce 8.75% → 7.50%) |
| SELL | PAVE | Sell 14% of PAVE position (reduce 8.75% → 7.50%) |
| SELL | SMH | Sell entire SMH position (1.25% of portfolio) |
| SELL | INDA | Sell entire INDA position (1.25% of portfolio) |
| BUY | URA | Buy URA — 25.00% of freed cash (adds 1.25% to portfolio) |
| BUY | XAR | Buy XAR — 25.00% of freed cash (adds 1.25% to portfolio) |
| BUY | BOTZ | Buy BOTZ — 25.00% of freed cash (adds 1.25% to portfolio) |
| BUY | XLE | Buy XLE — 25.00% of freed cash (adds 1.25% to portfolio) |
Current Portfolio After Trade
Combined holdings across all 4 active tranches. Each tranche is 25% of the portfolio.
| Ticker | % of Portfolio | Weight Bar |
|---|---|---|
| FBTC | 50.00% | |
| GLD | 7.50% | |
| PAVE | 7.50% | |
| IGV | 6.25% | |
| XAR | 6.25% | |
| URA | 5.00% | |
| COPX | 5.00% | |
| BOTZ | 3.75% | |
| MOO | 3.75% | |
| NLR | 2.50% | |
| XLE | 2.50% |
Macro Regime — Disinflation
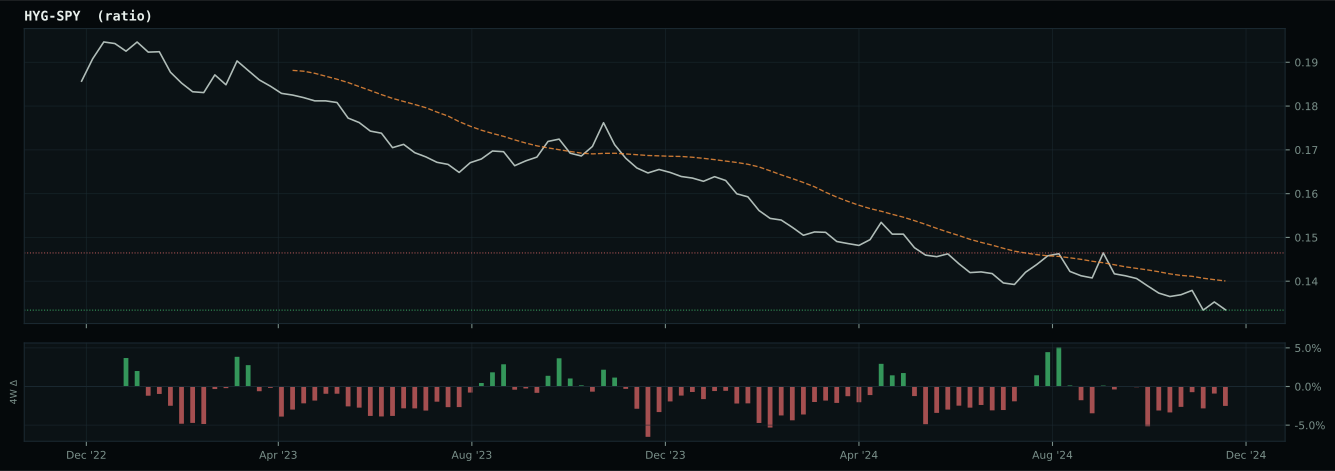
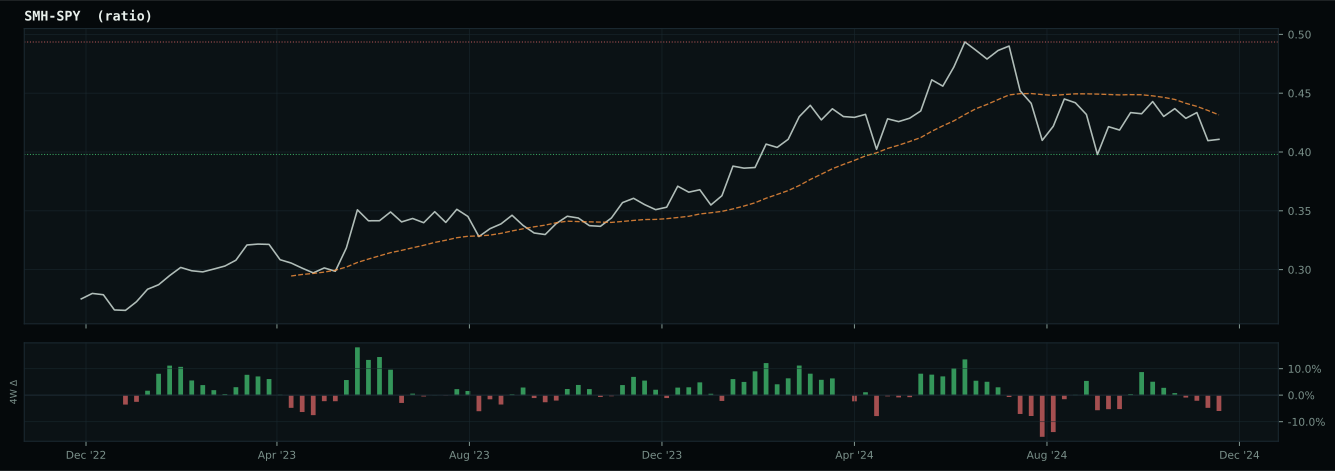
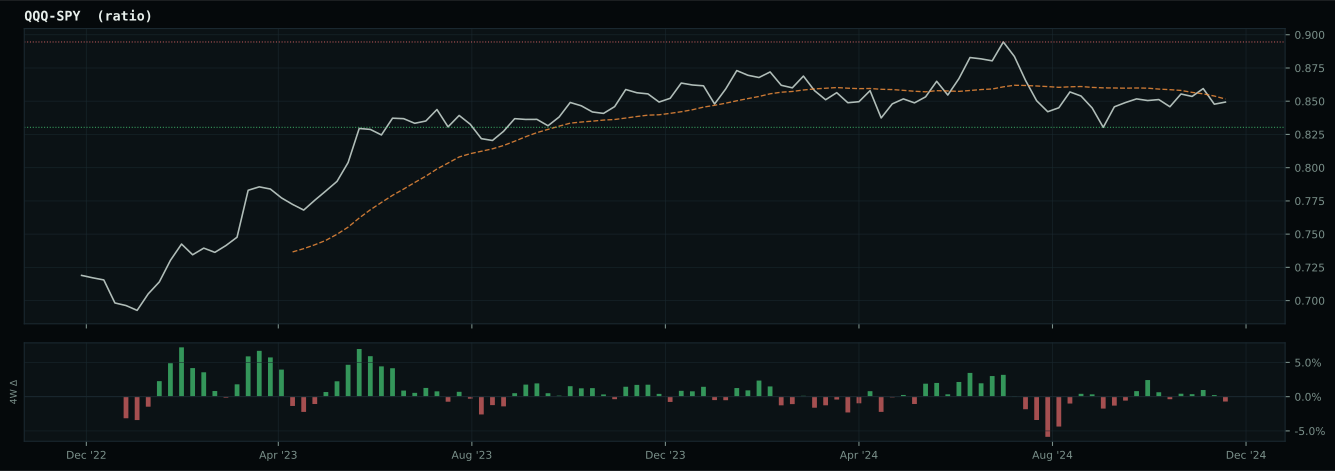
growth data is not confirming the weak market-implied risk appetite signal
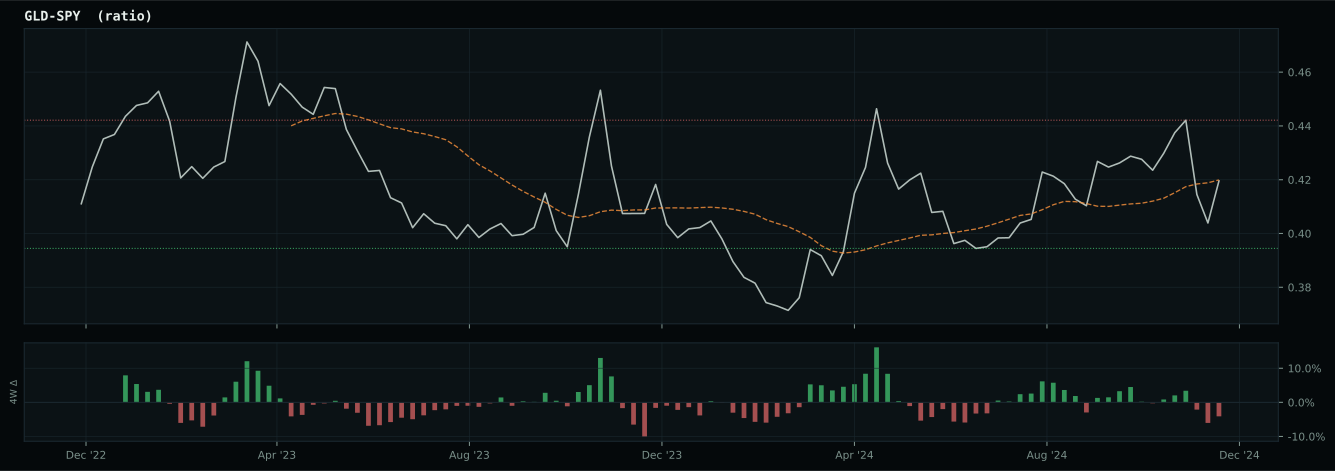
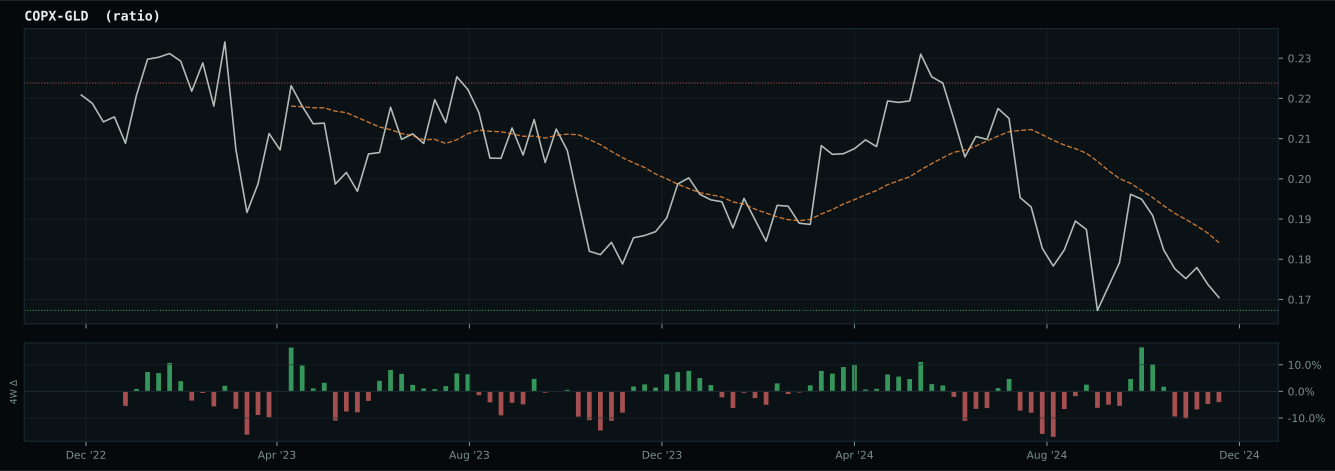
Defensive overlay cause is falling-growth or disinflation stress: gold is favored because falling real-yield pressure and monetary hedging are more relevant than cyclical commodity demand. GLD has been confirmed above its 8W SMA and is eligible.
Macro Evidence Charts
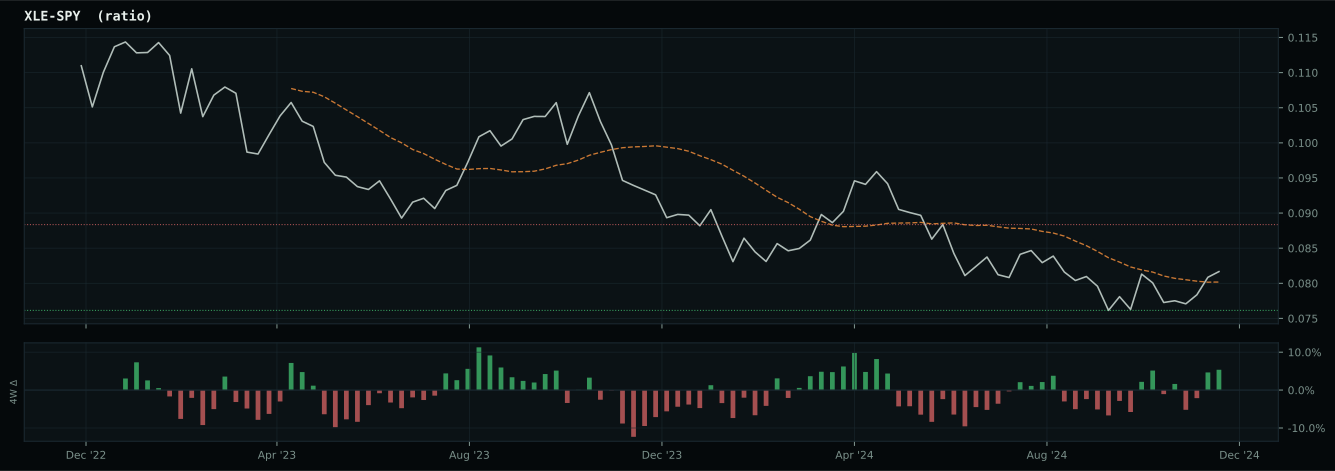
Market-implied signals behind the macro regime scores. Each ratio compares two assets; the direction and slope of the ratio is what the macro engine reads.
Crypto Regime — TrendBTC
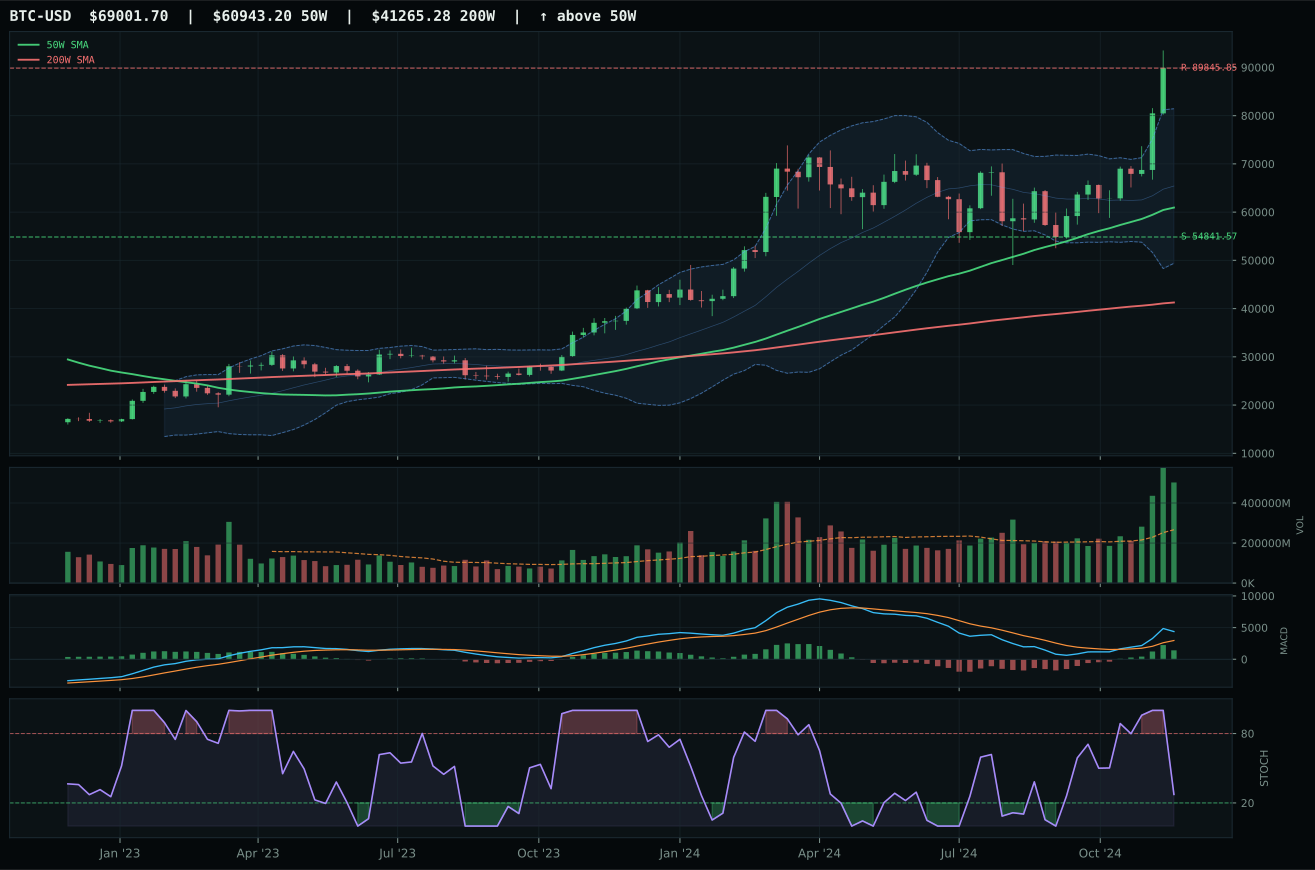
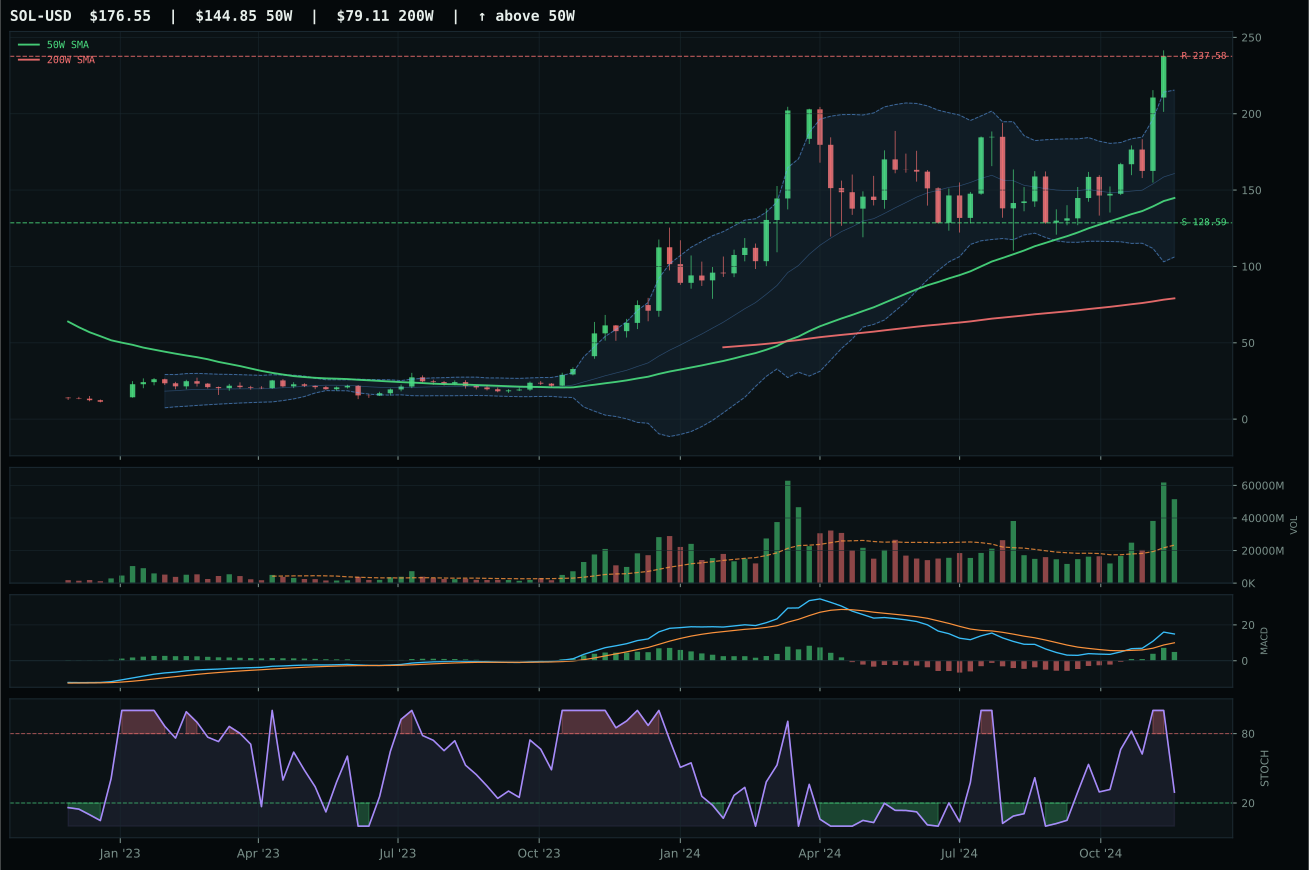
ValueBTC not armed: BTC has not made the first post-breakdown touch of the 200W buy zone after losing the 50W
TrendBTC confirmed: 2 consecutive closes above rising/flat 50W SMA
one or more available conditions failed
Category Rankings
| Rank | Category | Winner | Score | Alloc | 4W Ret | Peers (4W) |
|---|---|---|---|---|---|---|
| 1 | Nuclear Energy | URA | 66.1 | 20% | -16.22% | NLR -15.5% · URNM -17.8% |
| 2 | Defense & Aerospace | XAR | 64.4 | 20% | -4.98% | ITA -5.5% · ROKT -6.2% |
| 3 | Utilities & Infrastructure | PAVE | 61.6 | 10% | -10.40% | IGF -6.7% · XLU -7.9% |
| 4 | Traditional Energy | XLE | 58.1 | 10% | -14.33% | XOP -15.4% · FCG -12.9% |
| 5 | Technology | IGV | 57.7 | 10% | -3.74% | CIBR +0.1% · XLK +0.4% |
| 6 | Precious Metals | GLD | 56.3 | 10% | -1.09% | SLV -2.8% · GDX -7.5% |
| 7 | AI | BOTZ | 40.8 | 10% | -4.71% | AIQ +0.7% · SMH -1.1% |
| 8 | Industrial Metals | COPX | 29.6 | 10% | -9.31% | REMX -13.9% · PICK -10.9% |
| 9 | Agriculture & Livestock | MOO | 6.0 | 0% | -10.09% | VEGI -7.1% · WEAT -3.7% |
| 10 | Emerging Markets | INDA | 1.7 | 0% | -2.88% | IEMG -3.3% · ILF -13.6% |
Nuclear Energy — URA
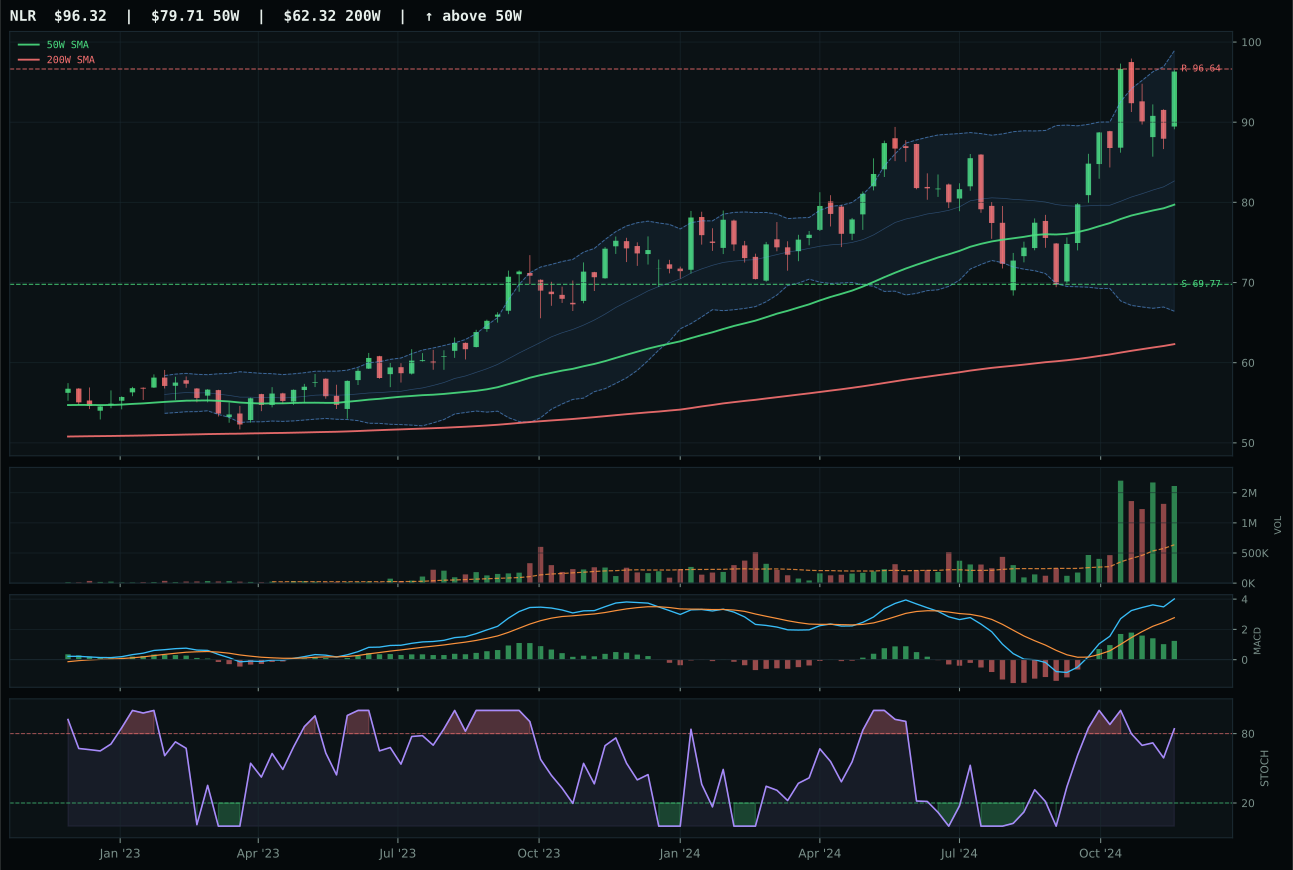
NLR has a vertical extension profile with 18.4% 13-week relative strength versus SPY.
A failed hold above support would weaken the setup.
Actionable but governed by invalidation levels.
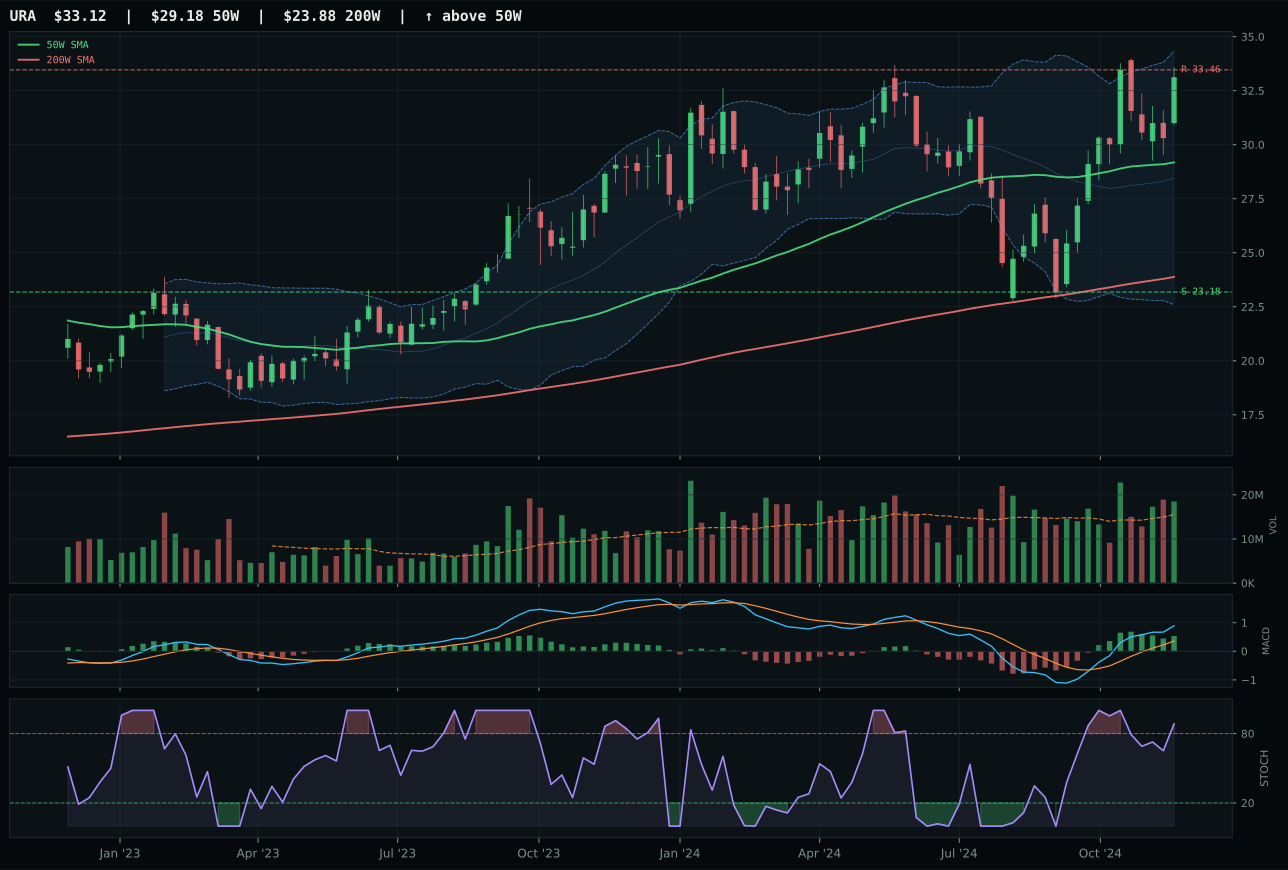
URA has a neutral structure profile with 17.6% 13-week relative strength versus SPY.
A failed hold above support would weaken the setup.
Actionable but governed by invalidation levels.
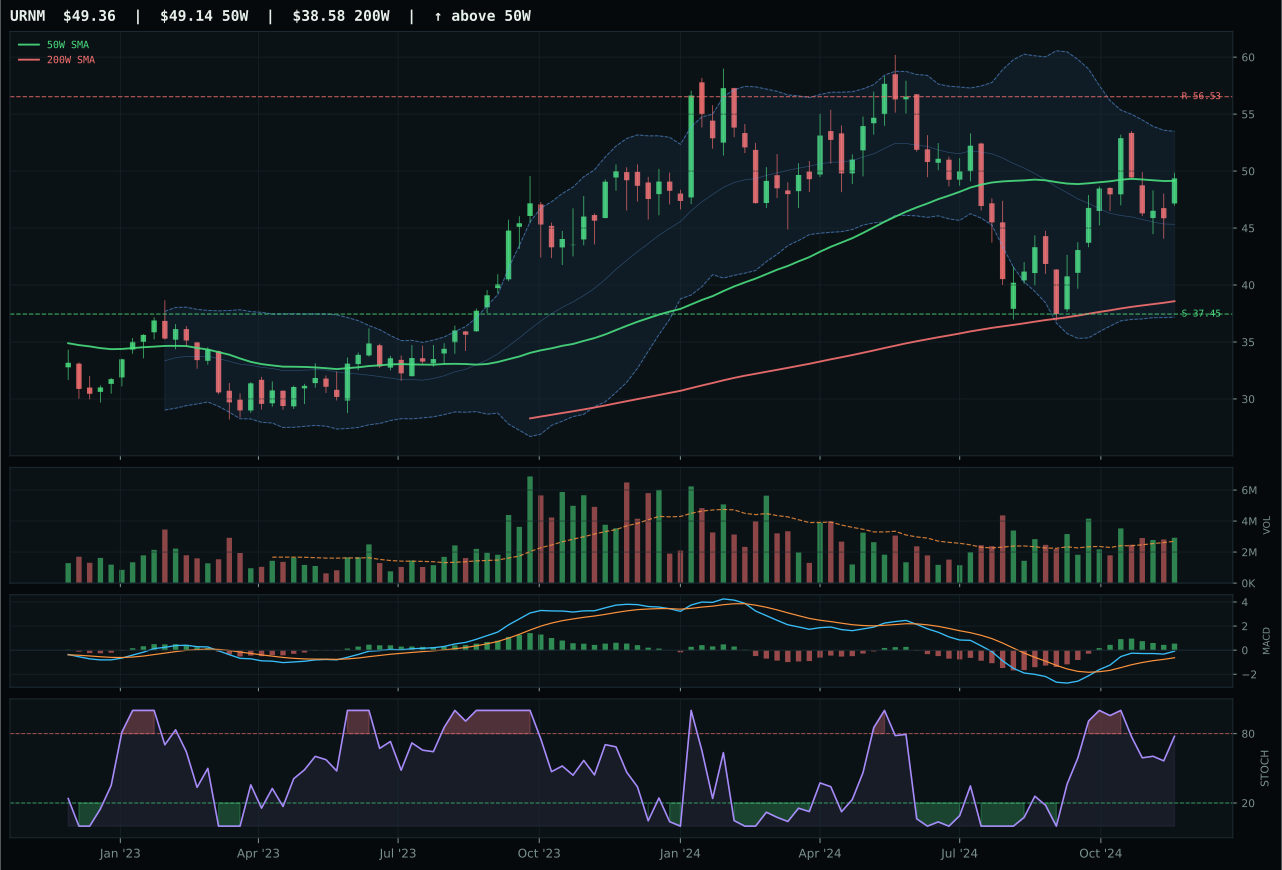
URNM has a compression near 50W profile with 8.0% 13-week relative strength versus SPY.
A failed hold above support would weaken the setup.
Actionable but governed by invalidation levels.
URA wins because its timing score of 54 beats NLR's 32, reflecting price proximity to the 50-week (13.5% for URA vs 20.8% for NLR) and a less-stretched Fibonacci placement. Both show 100.0 trend scores and overbought stochastic momentum, both have 23%+ 13-week returns, and both carry massive SPY-relative strength (17.6% for URA, 18.4% for NLR). The momentum confirmation is perfect for both, but NLR is extended enough that its risk-reward suffered (37.1 vs 37.4), and the timing deterioration from being further from the 50-week creates technical vulnerability. Volume-price confirmation slightly favors NLR (88 vs 83), but URA's tighter setup and better timing score make it the cleaner entry, even if NLR has steeper upside remaining.
Nuclear Energy ranks as a top-2 category at 66.1, earning 10% allocation alongside Defense & Aerospace. The macro profile is distinctly different from other energy plays: energy scarcity is active (+9), real asset sponsorship is active (+7), but the category's macro fit is 50.0/100 because liquidity stress, credit stress, and risk appetite broken are offsetting negatives. URA's 82.5 technical evidence and 23.5% 13-week return provide the allocation conviction. This is a thematic play on energy supply tightness without direct commodity price correlation—nuclear power plants don't care about oil inventory. The portfolio is comfortable with this at top-2 status because the thematic case (energy security, capital intensity, scarcity) is durable even in a disinflation regime. Exit trigger: if the energy scarcity descriptor deactivates or if URA's MACD deteriorates below bullish, the allocation should compress.
Defense & Aerospace — XAR
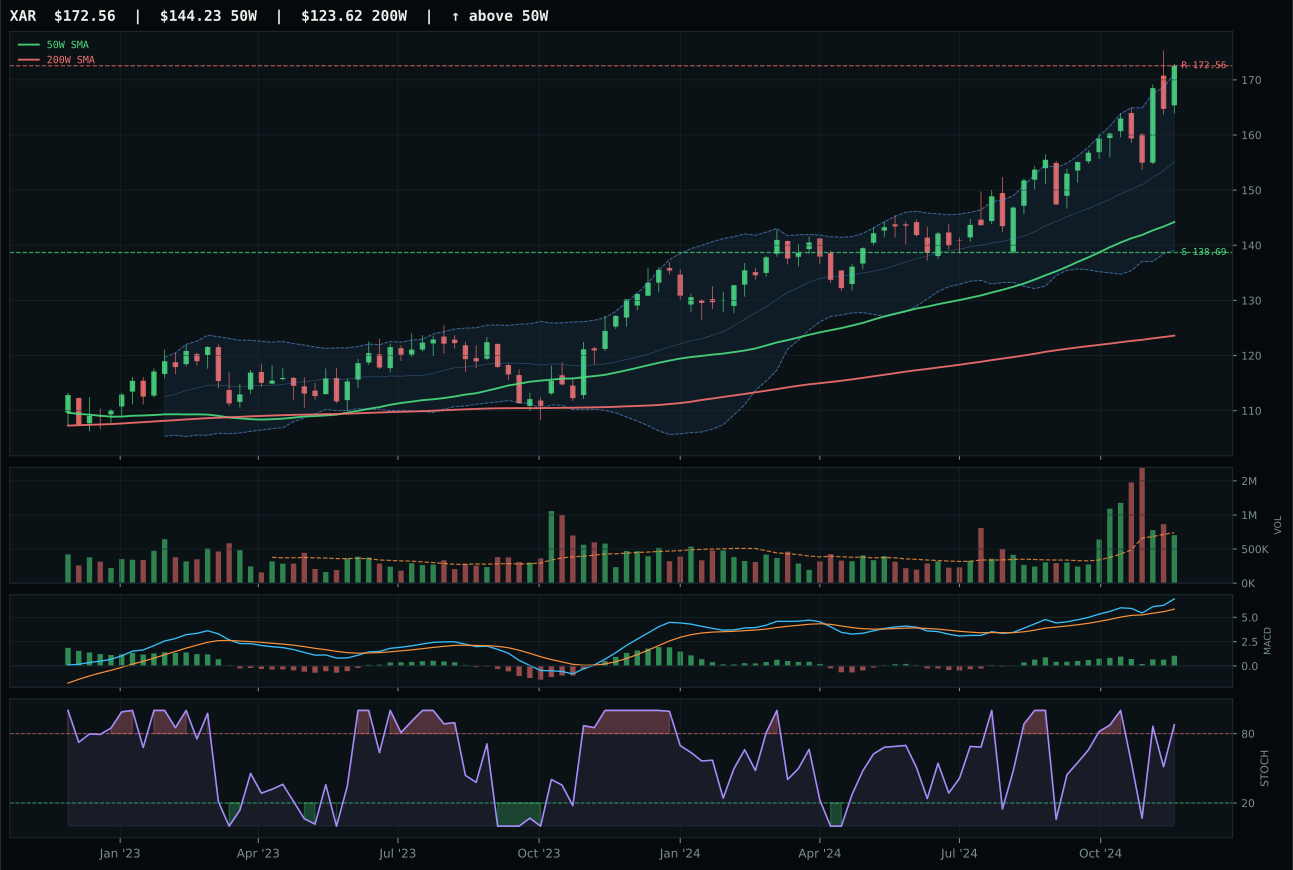
XAR has a vertical extension profile with 6.3% 13-week relative strength versus SPY.
A failed hold above support would weaken the setup.
Actionable but governed by invalidation levels.
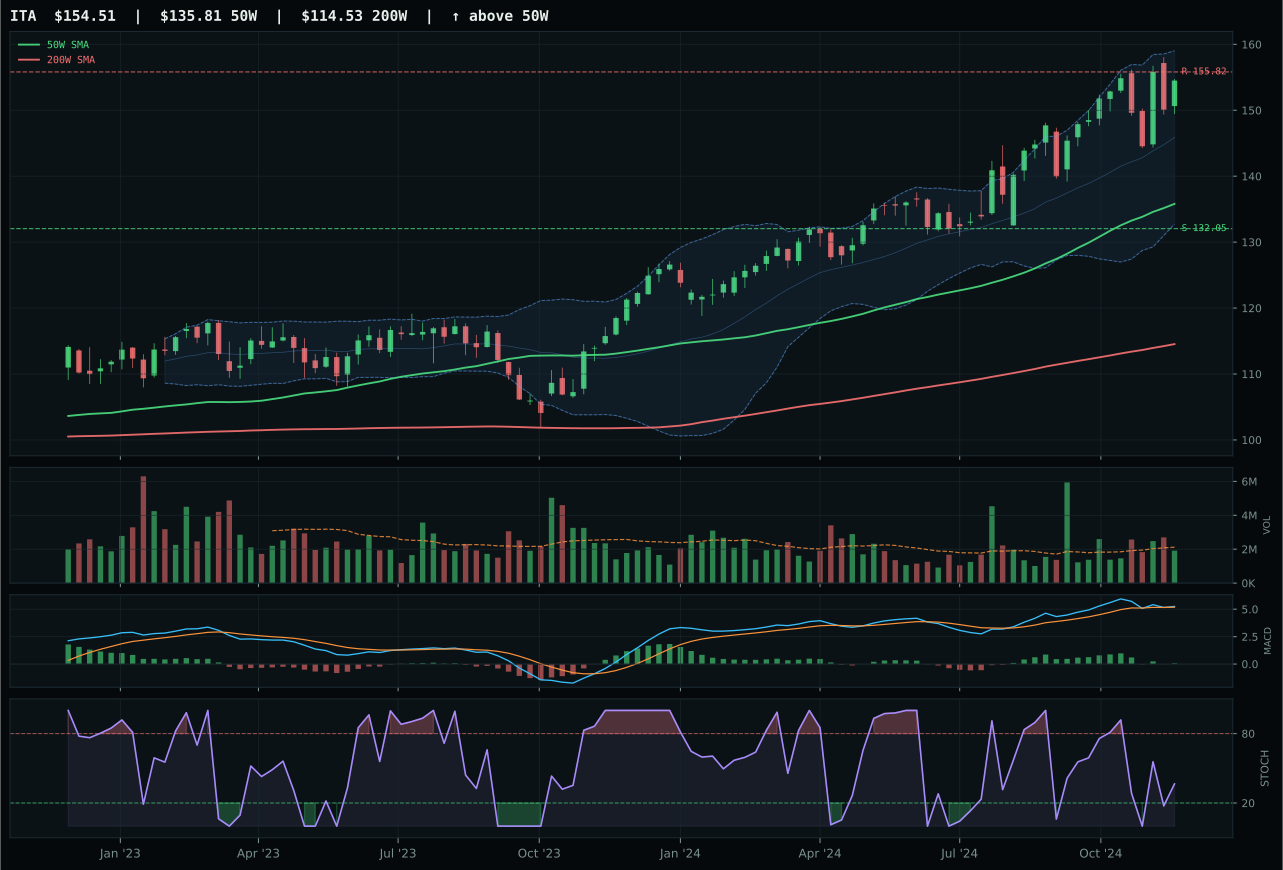
ITA has a neutral structure profile with 0.8% 13-week relative strength versus SPY.
A failed hold above support would weaken the setup.
Actionable but governed by invalidation levels.
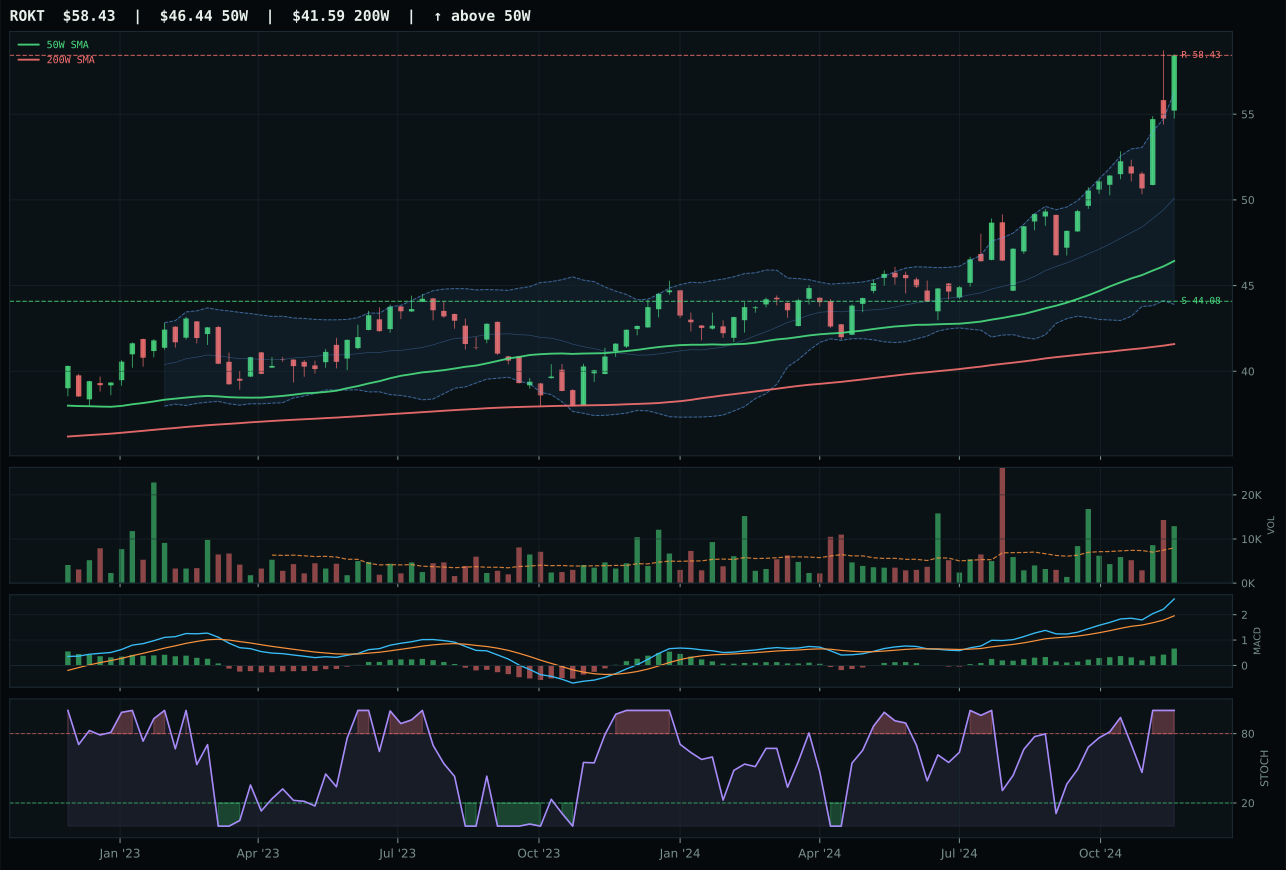
ROKT has a vertical extension profile with 12.9% 13-week relative strength versus SPY.
A failed hold above support would weaken the setup.
Tracked, but not top-2 eligible because: .
XAR wins by a margin so tight (0.5 points over ITA) that both are viable, but XAR's edge is instructive: MACD is bullish and improving while ITA's is bullish but flattening, and category-relative strength is flat 0.0% for XAR against ITA's -5.6%, telling the story of which fund is attracting fresh capital. Both show vertical extension structures at 19.6% and 18.5% respectively above their 50-week levels, both have trend scores in the high 90s, and both sit in overbought momentum on the stochastic. The deciding factor is the MACD trajectory and relative strength—ITA's deteriorating momentum confirmation and lagging category positioning make it a late-cycle expression of the same thesis. Risk-reward favors XAR slightly (42.9 vs 37.9), giving sellers just a bit less immediate downside relief.
Defense & Aerospace ranks as one of the two highest-eligible category scores at 64.4, securing 10% allocation in the top-2 tier. The macro setup is active and constructive: defensive rotation is the strongest signal (+8), broad market bear is active (+6), and the category itself benefits from dollar pressure and credit stress as portfolio insurance plays. The technical foundation is solid—XAR's trend score is a perfect 100.0, and the 12.2% 13-week return shows persistence even as the setup extends. The tension is real: timing is depressed to 37.0 because price is stretched, and risk-reward (42.9) signals limited upside, but the portfolio needs defensive rotation in a macro environment where credit stress and liquidity remain active. The holding will lose its top-2 status immediately if the MACD deteriorates to flattening or if relative strength turns negative.
Utilities & Infrastructure — PAVE
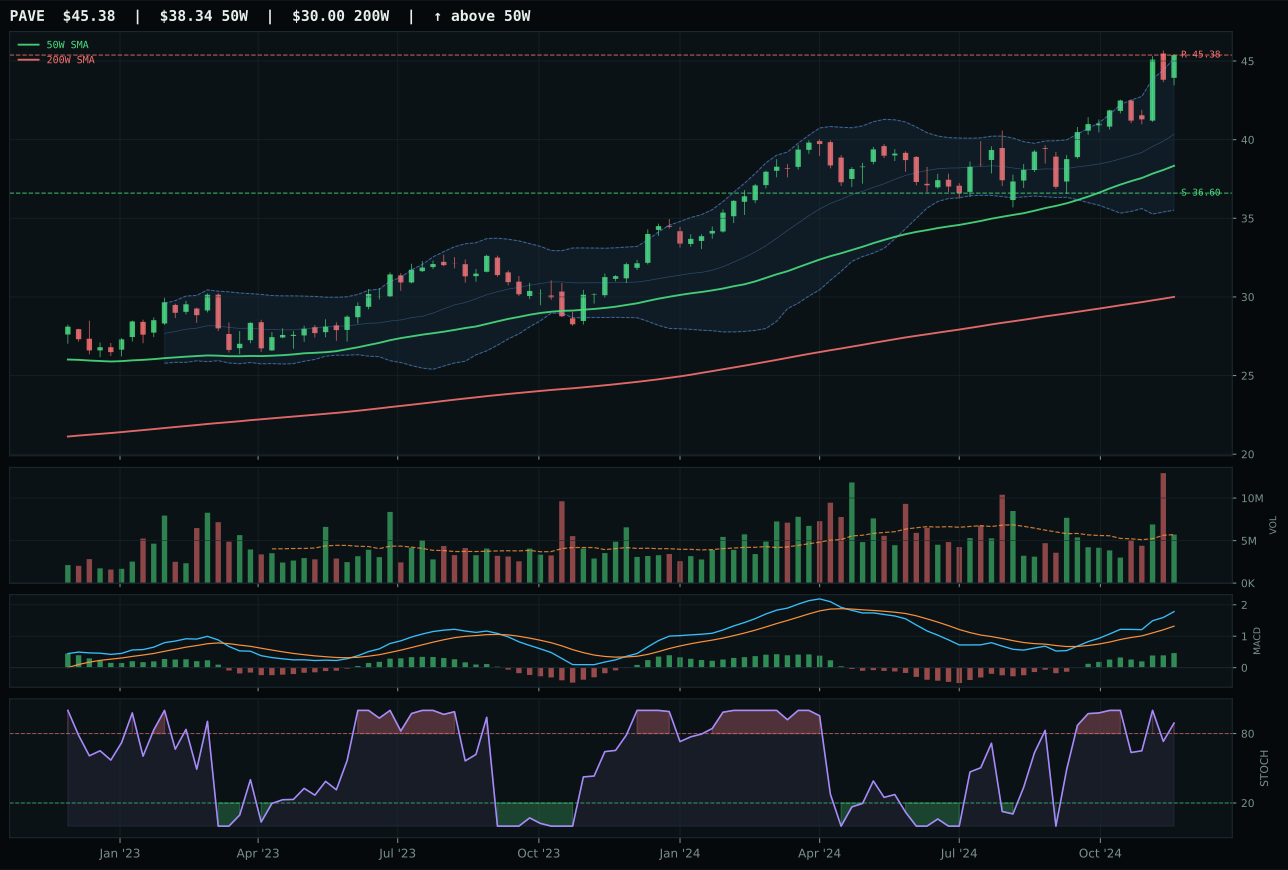
PAVE has a vertical extension profile with 9.7% 13-week relative strength versus SPY.
A failed hold above support would weaken the setup.
Actionable but governed by invalidation levels.
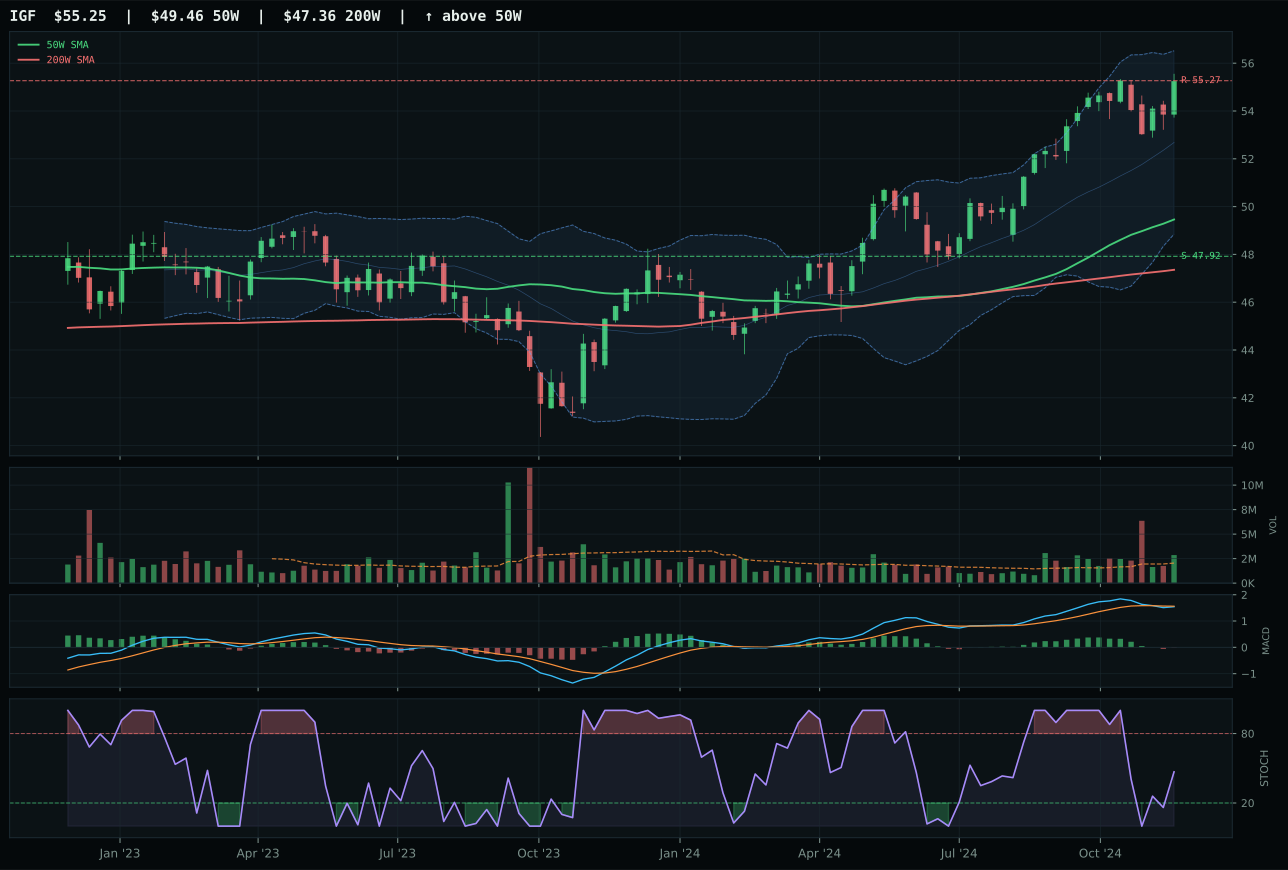
IGF has a neutral structure profile with -0.1% 13-week relative strength versus SPY.
A failed hold above support would weaken the setup.
Actionable but governed by invalidation levels.
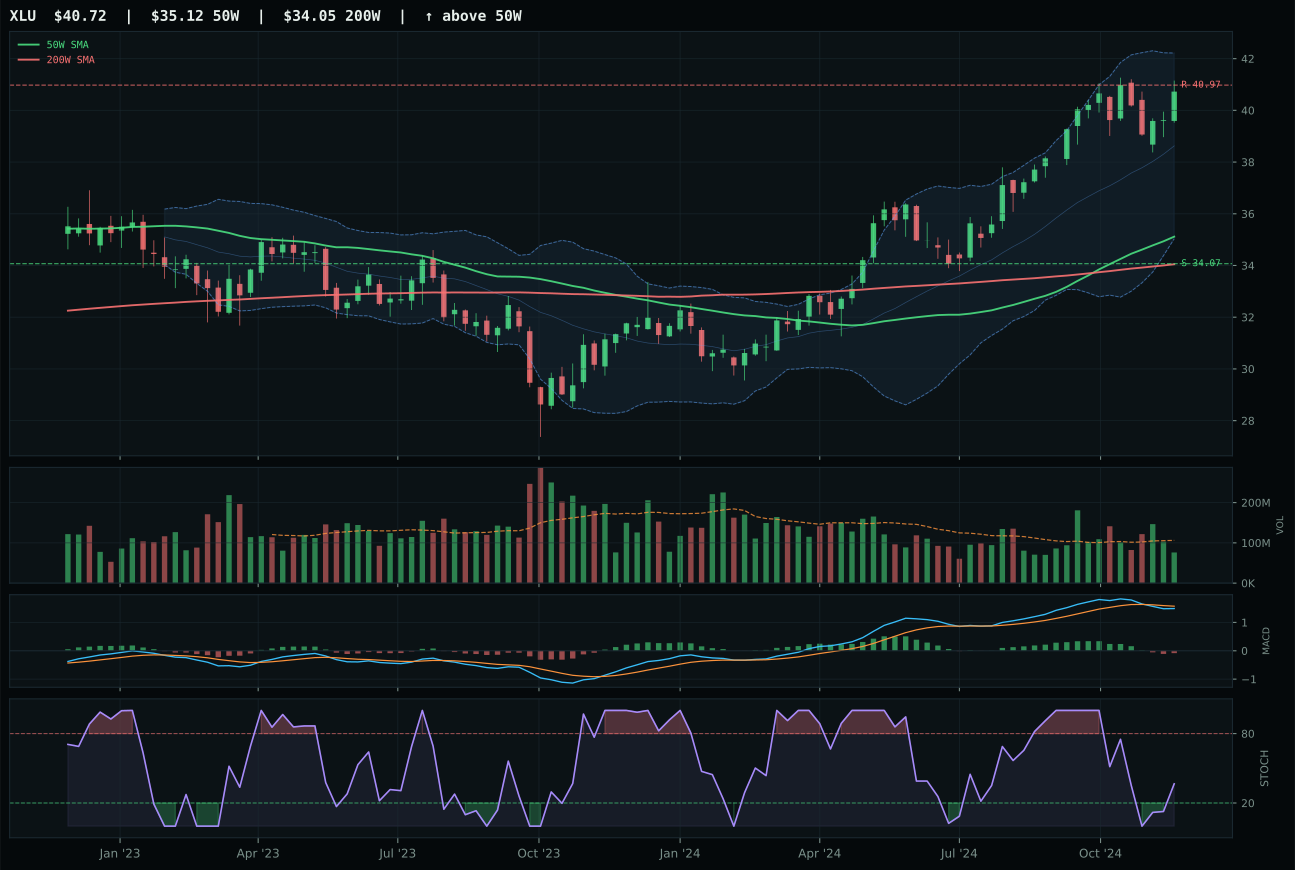
XLU has a vertical extension profile with 2.1% 13-week relative strength versus SPY.
A failed hold above support would weaken the setup.
Actionable but governed by invalidation levels.
PAVE wins by 6.1 points over IGF because it combines a perfect 100.0 trend score with bullish and improving MACD, while IGF's MACD is bearish and weakening. Both show vertical extension structures around 18%+ above the 50-week, but PAVE's 9.7% SPY-relative strength and 7.7% category-relative strength demonstrate that fresh capital is flowing into domestic infrastructure. The momentum confirmation is maxed at 100.0 for PAVE (15.6% 13-week return) versus IGF's 46, a massive divergence that tells the story of which thesis is being bought. Risk-reward is slightly better for PAVE (43.0 vs 37.0), and the volume-price confirmation (75.2 vs 51) shows better sponsorship behind the move.
Utilities & Infrastructure holds 5% allocation as a tier-2 position, justified by a solid 61.6 category score and exceptional macro fit of 80.0/100. The category benefits from defensive rotation being active at +12, disinflation helping it at +7, and the broad market bear environment adding +4. PAVE's 72.7 reasoned technical score and 9.7% SPY-relative strength make it the conviction play. The portfolio is using this sleeve for defensive income and capex exposure in a regime where infrastructure spending remains sticky even as disinflation pressures equities. The extended price level (18.4% above 50W) is the risk—if the momentum deteriorates or if IGF's bearish MACD starts to infect PAVE, the position becomes vulnerable. Promotion to top-2 would require either price consolidation that resets valuation while keeping the uptrend intact, or a macro shift that eliminates the bond yield support for utilities.
Traditional Energy — XLE
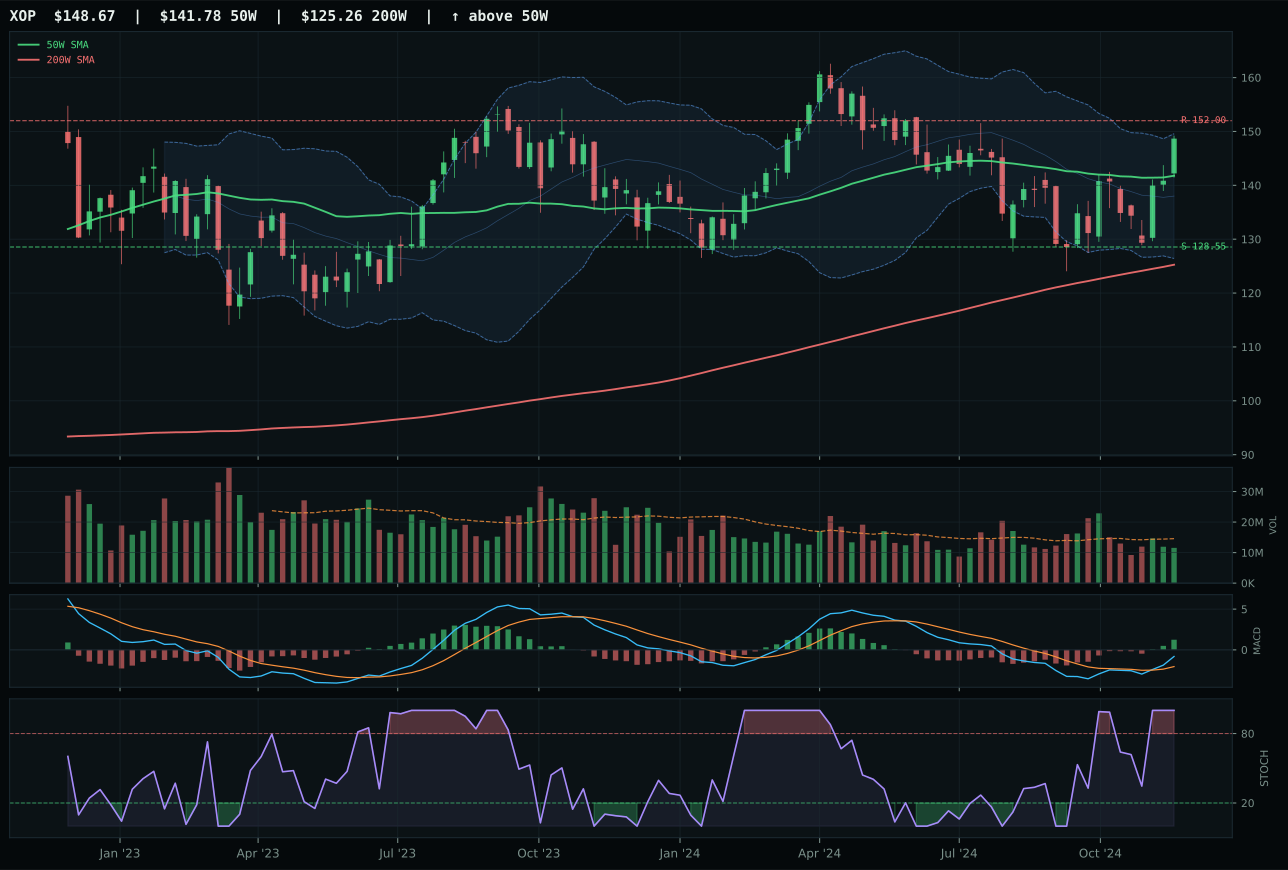
XOP has a neutral structure profile with 0.9% 13-week relative strength versus SPY.
A failed hold above support would weaken the setup.
Actionable but governed by invalidation levels.
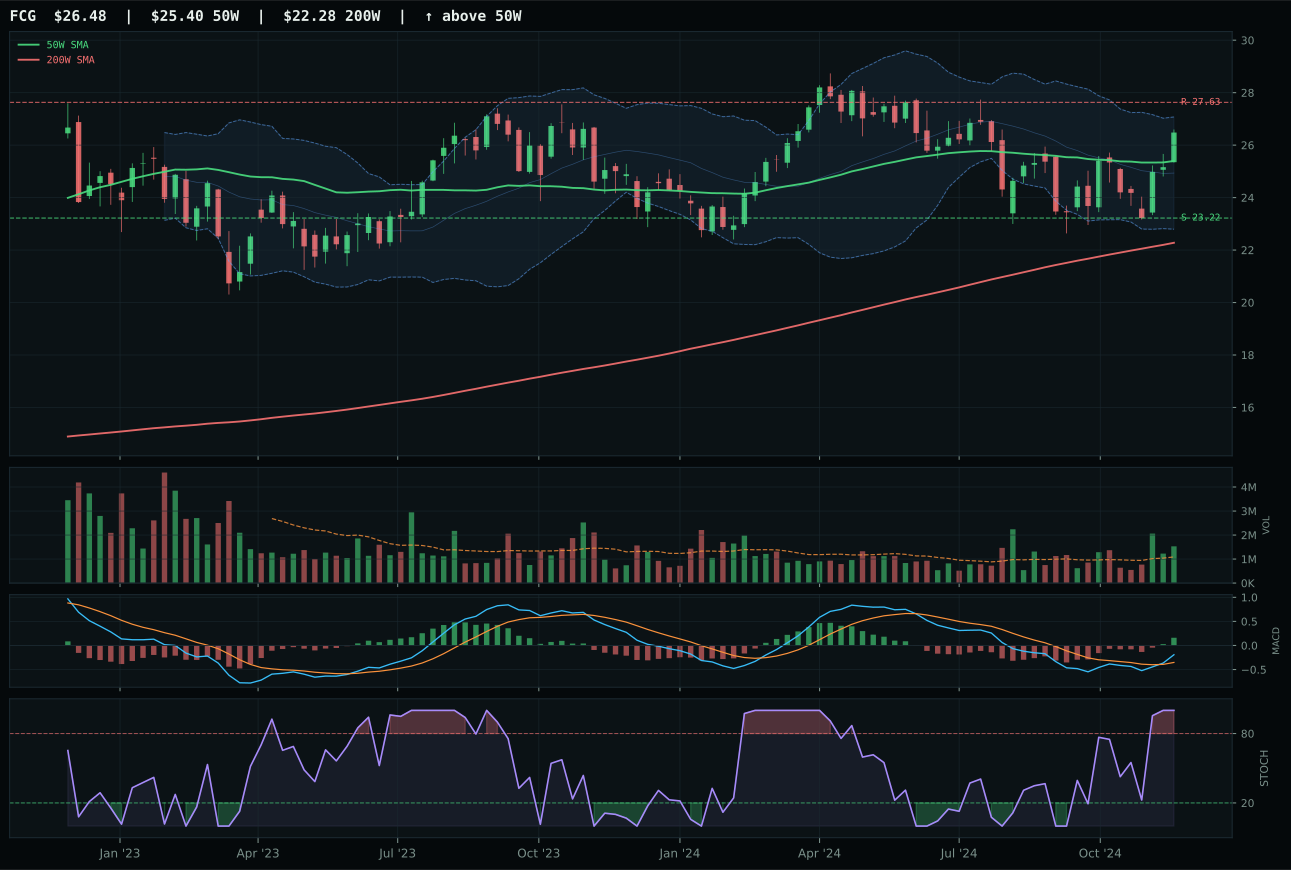
FCG has a neutral structure profile with -1.4% 13-week relative strength versus SPY.
A failed hold above support would weaken the setup.
Actionable but governed by invalidation levels.
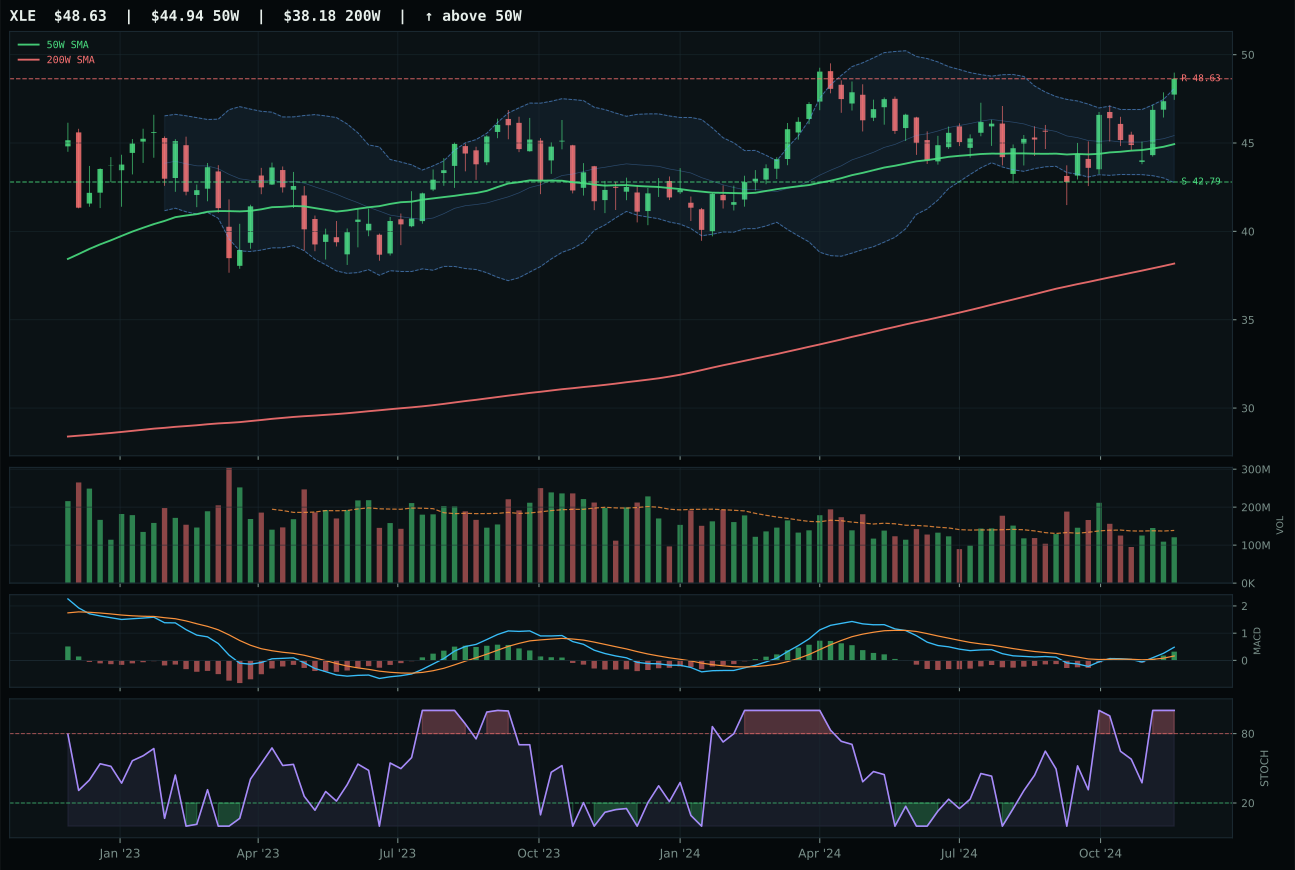
XLE has a neutral structure profile with 1.7% 13-week relative strength versus SPY.
A failed hold above support would weaken the setup.
Actionable but governed by invalidation levels.
XLE wins a close race over XOP because category-relative strength of 0.8% edges out XOP's 0.0%, even though XOP shows superior technical evidence (80.7 vs 71.2). Both sit in neutral structure above their 50-week averages with bullish and improving MACD, but XOP is more extended in price (14.2% from 50W vs 8.3%) and shows overbought stochastic RSI momentum that is less favorable to continued upside. XLE's proximity to the 50-week (8.3%) gives it better timing at 75 points versus XOP's likely 90+, a tradeoff that reverses when evaluating technical power. The deciding edge is that XLE captured more category demand, and that category-relative strength differential becomes the tiebreaker when both are structurally neutral.
Traditional Energy holds 5% allocation as a tier-2 position despite a tight 58.1 category score, benefiting primarily from energy scarcity being active at +16. Disinflation is a -10 headwind, offsetting much of the commodity upside. XLE's macro fit (61.0/100) is decent because of the energy scarcity signal and real asset sponsorship (+5), but the technical foundation is weaker than the defensive categories ranked above. The portfolio is betting that energy supply remains tight despite demand concerns in a disinflation regime. This position is vulnerable if oil inventories spike, if the energy scarcity descriptor flips off, or if crude breaks below key support. Promotion to top-2 would require a simultaneous improvement in XLE's relative strength versus SPY and a sustained deterioration in the disinflation descriptor impact.
Technology — IGV
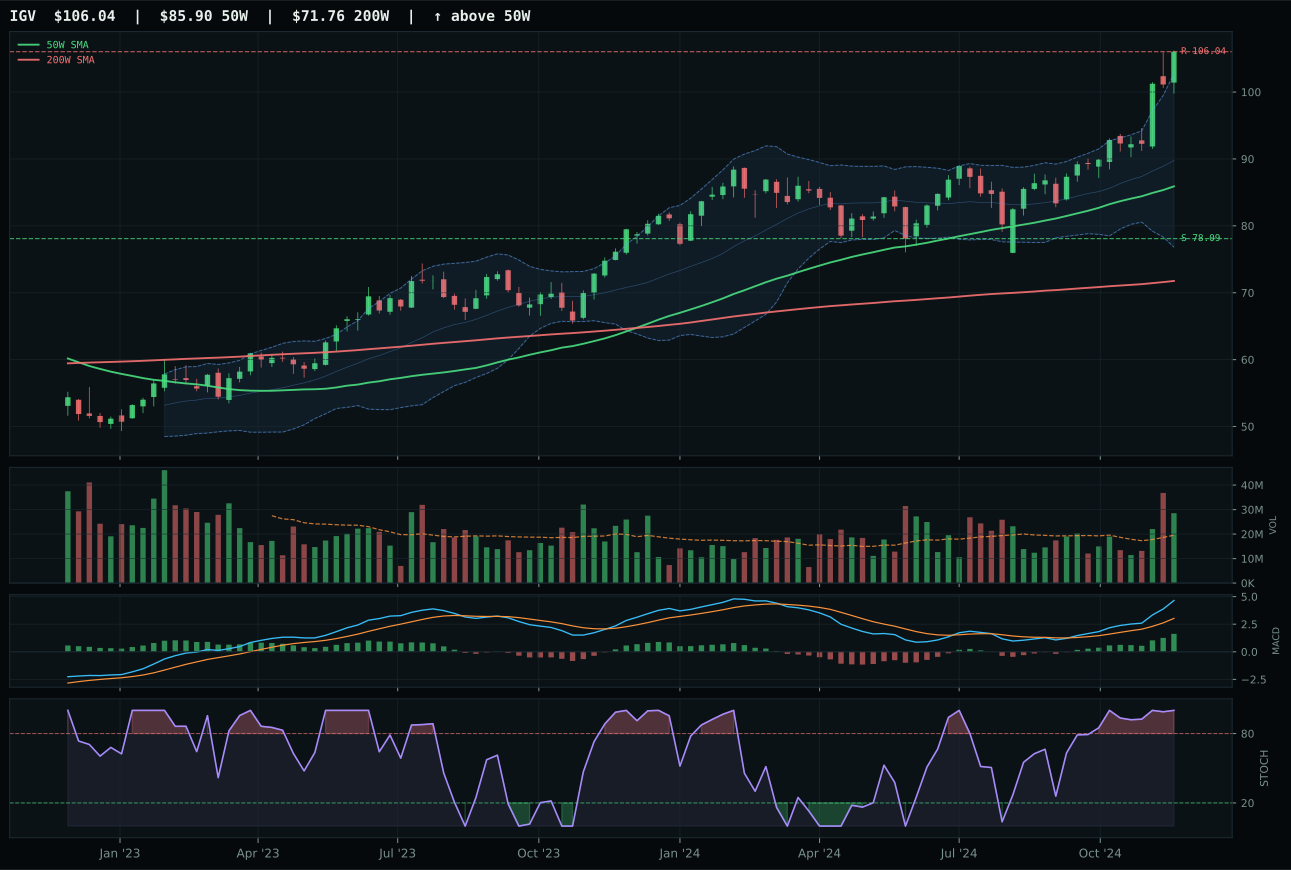
IGV has a vertical extension profile with 16.8% 13-week relative strength versus SPY.
A failed hold above support would weaken the setup.
Actionable but governed by invalidation levels.
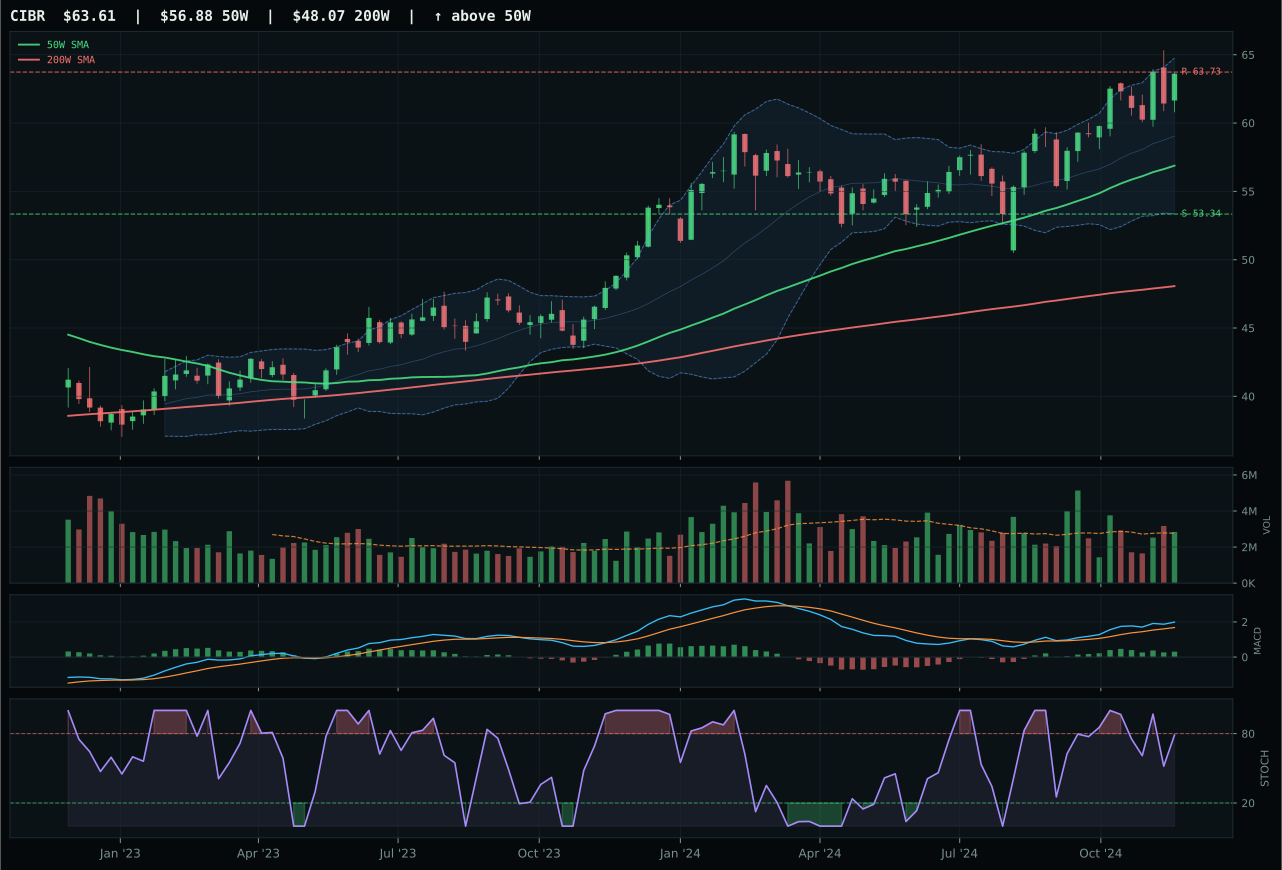
CIBR has a neutral structure profile with 1.5% 13-week relative strength versus SPY.
A failed hold above support would weaken the setup.
Actionable but governed by invalidation levels.
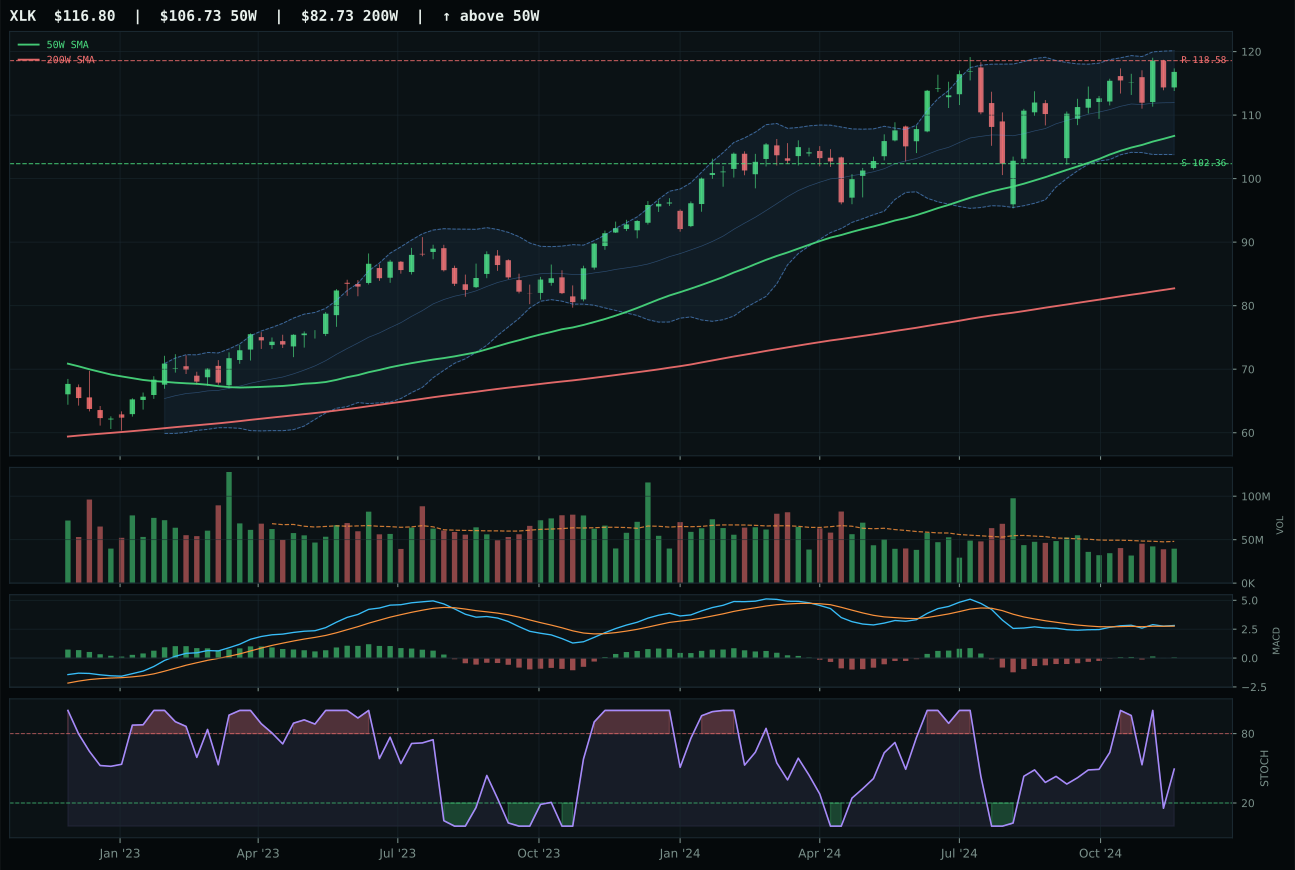
XLK has a neutral structure profile with -1.6% 13-week relative strength versus SPY.
A failed hold above support would weaken the setup.
Actionable but governed by invalidation levels.
IGV wins because it combines a clean uptrend with genuine relative strength that's being purchased, not merely bouncing. Price sits 23.4% above the 50-week moving average with a non-deteriorating slope, MACD is bullish and improving, and volume participation sits at 1.46x the 20-week average—all confirming that accumulation is real. The 13-week return of 22.8% and category-relative strength of 15.4% separate it decisively from CIBR, which shows the same uptrend structure but with a flattening MACD, neutral volume, and zero category-relative strength. Entry risk from the extended price level keeps the timing score depressed at 37, yet the momentum confirmation and volume-price sponsorship argue this is a paid-for move rather than a late-stage chase.
Technology earns 5% allocation as a tier-2 holding in a disinflation regime where growth carries macro headwinds. The category-level macro fit is 40.0/100 because liquidity stress, credit stress, and dollar pressure are all active, offsetting the modest benefit from disinflation itself. Two higher-scoring categories (Defense & Aerospace and Nuclear Energy, both at top-2 status) ranked above it, but IGV's 77.5 reasoned technical score and 15.4% category-relative strength justify holding the position. The portfolio needs technology exposure for breadth, and IGV's above-average volume and improving momentum offer more conviction than staleness. What would elevate this to top-2: a meaningful correction that resets the extended valuation while preserving the uptrend structure, or a shift in the macro descriptor checklist to reduce the credit and liquidity headwinds.
Precious Metals — GLD
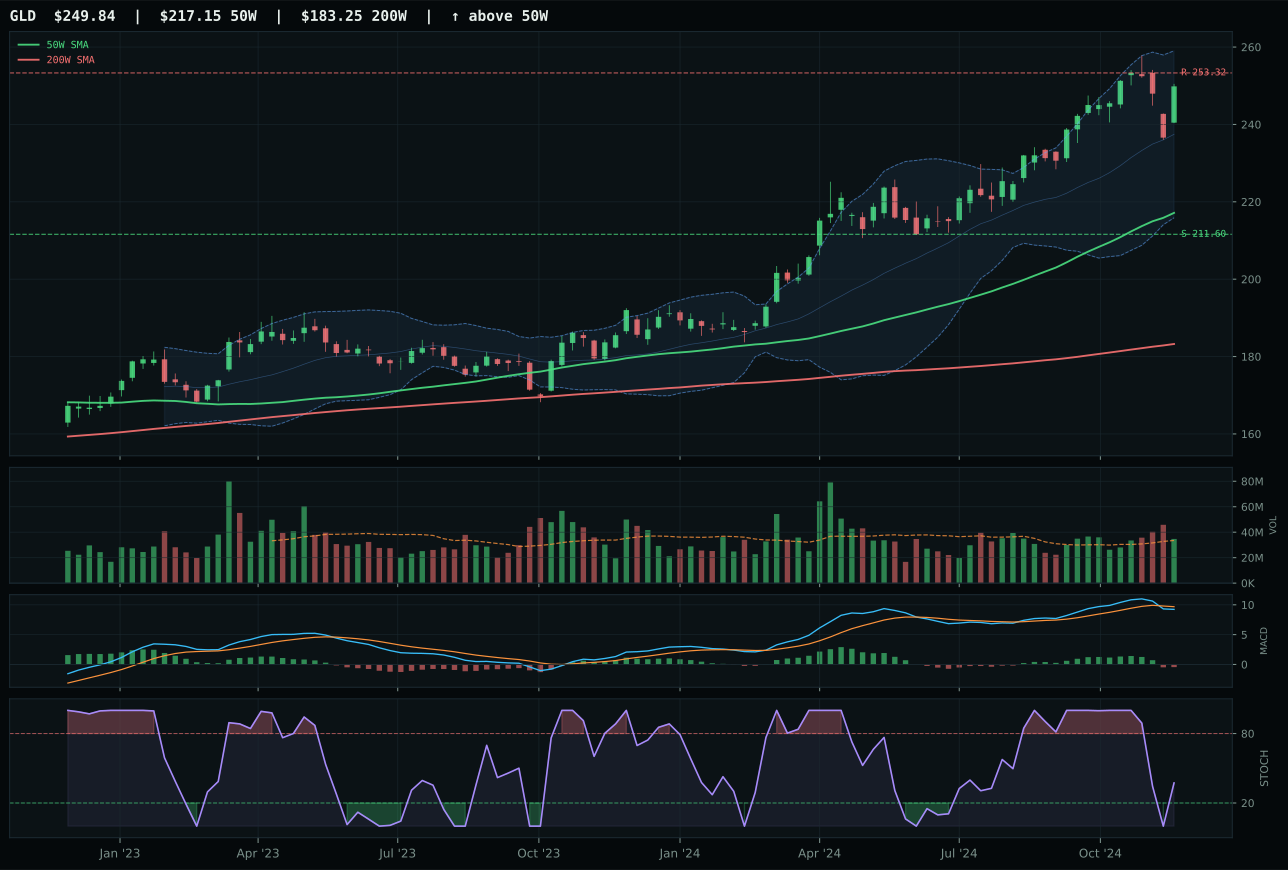
GLD has a vertical extension profile with 1.7% 13-week relative strength versus SPY.
A failed hold above support would weaken the setup.
Actionable but governed by invalidation levels.
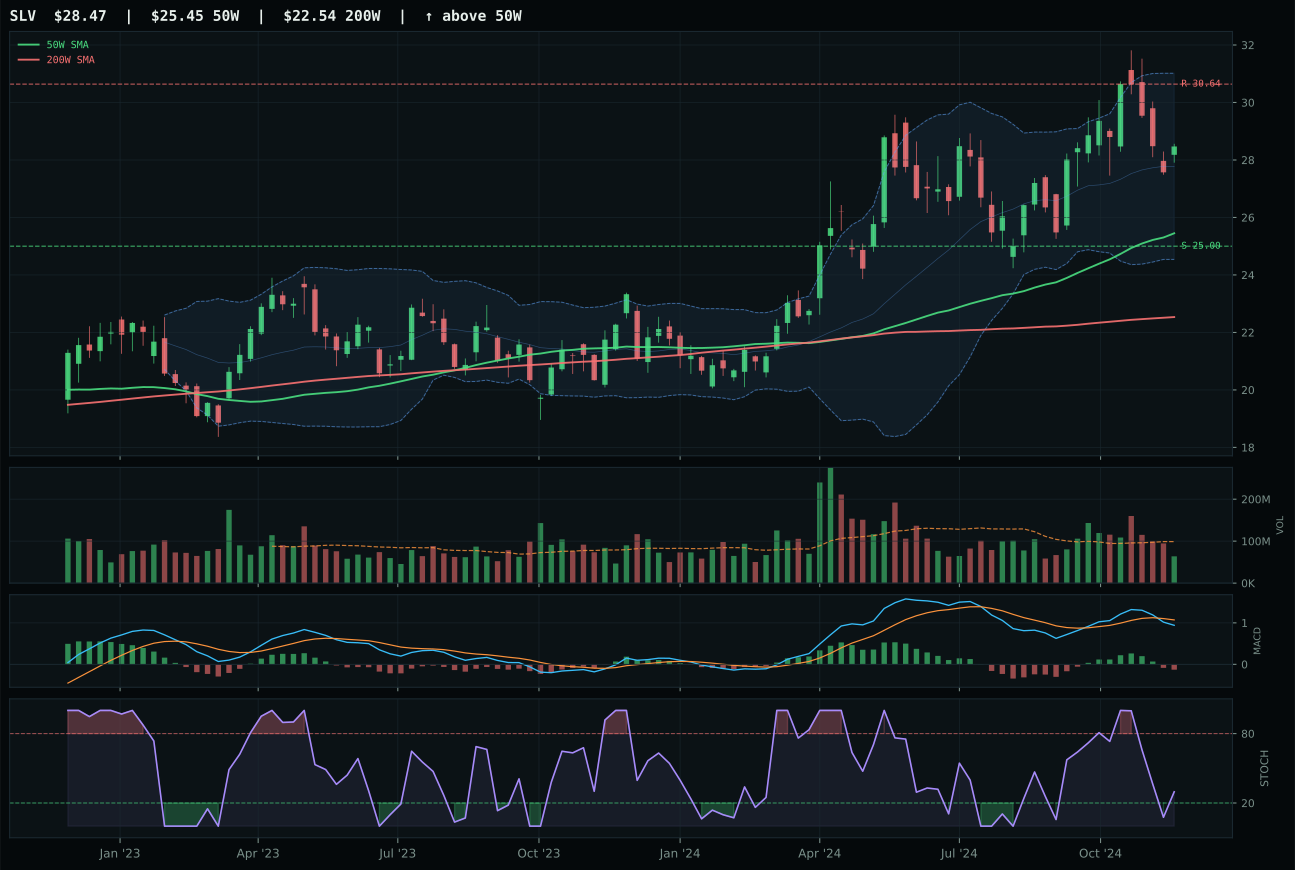
SLV has a neutral structure profile with -1.3% 13-week relative strength versus SPY.
A failed hold above support would weaken the setup.
Actionable but governed by invalidation levels.
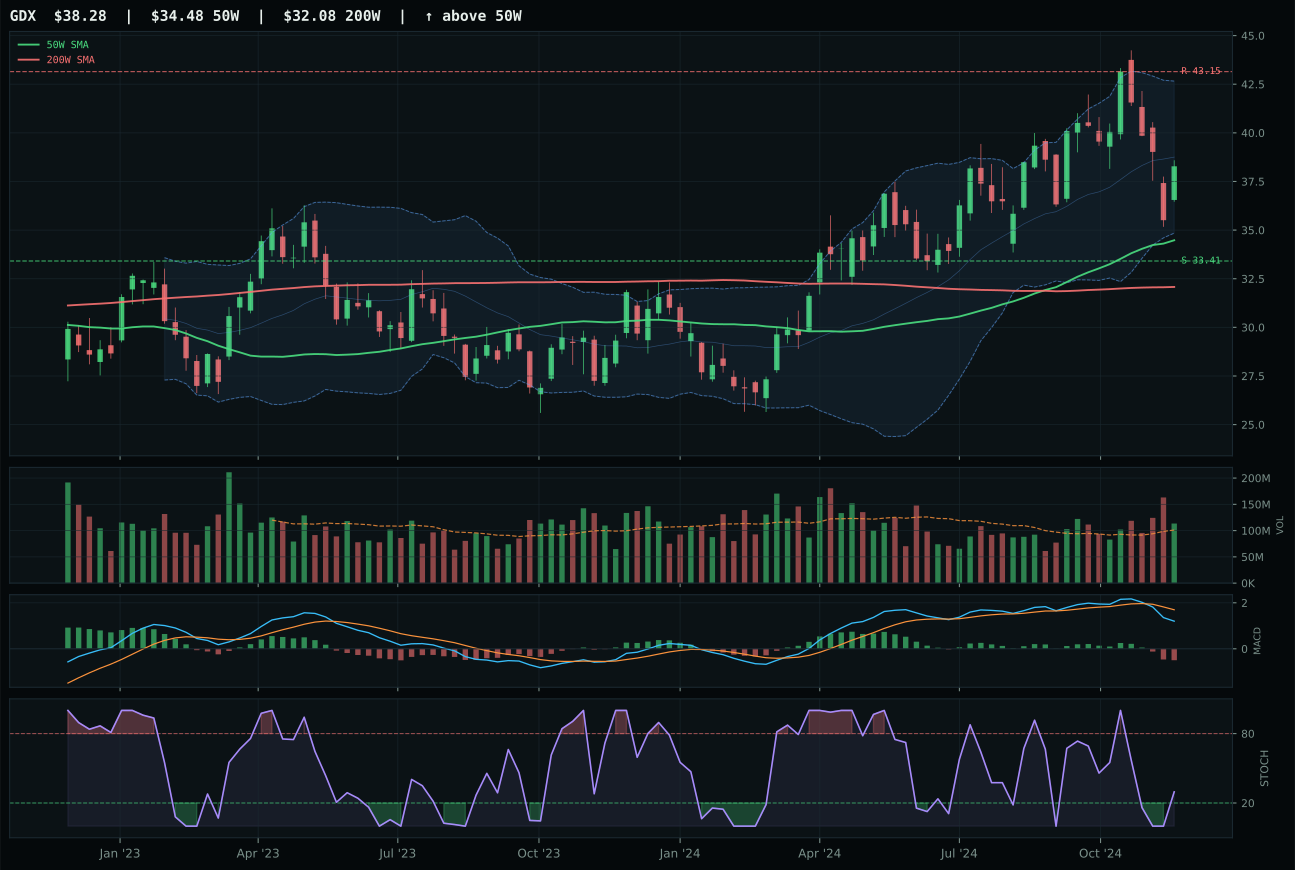
GDX has a neutral structure profile with -8.6% 13-week relative strength versus SPY.
A failed hold above support would weaken the setup.
Actionable but governed by invalidation levels.
GLD wins because its 3.0% category-relative strength and marginally cleaner structure (75.5 vs 67.8) separate it from SLV in a subtle decision. Both are extended significantly from support, MACD is weakening in both cases, and the stochastic RSI is falling neutral for both, but GLD's 1.04x volume is neutral participation while SLV's is thin, and that liquidity difference matters when both are holding uptrends despite weakening momentum. The 13-week return differential (7.7% for GLD vs 4.7% for SLV) shows which asset attracted more sustained buying. The 15.1% extension above the 50-week is substantial, signaling entry risk, and the timing score of 48 reflects that extension. What rescues this score are the macro tailwinds—monetary hedge bid is active at +14, disinflation pressure at +8, and defensive rotation at +6.
Precious Metals earns 5% as a tier-2 holding despite weak near-term technical setup because the macro fit is exceptional at 88.0/100. The portfolio is using gold as portfolio insurance in an environment where liquidity stress, credit stress, and dollar pressure are all active macro descriptors. GLD's macro fit sits at 80.0/100 because the monetary hedge bid and disinflation pressure are both pulling strongly, even though technical evidence is depressed (37.3/100). This is a conscious trade: sacrifice timing and entry cleanliness for macro hedge properties. The category would drop to zero allocation if the monetary hedge bid descriptor turned off or if the MACD moved into a sustained bullish posture—right now the weakness of the technical backdrop makes gold's insurance property more valuable than its price momentum.
AI — BOTZ
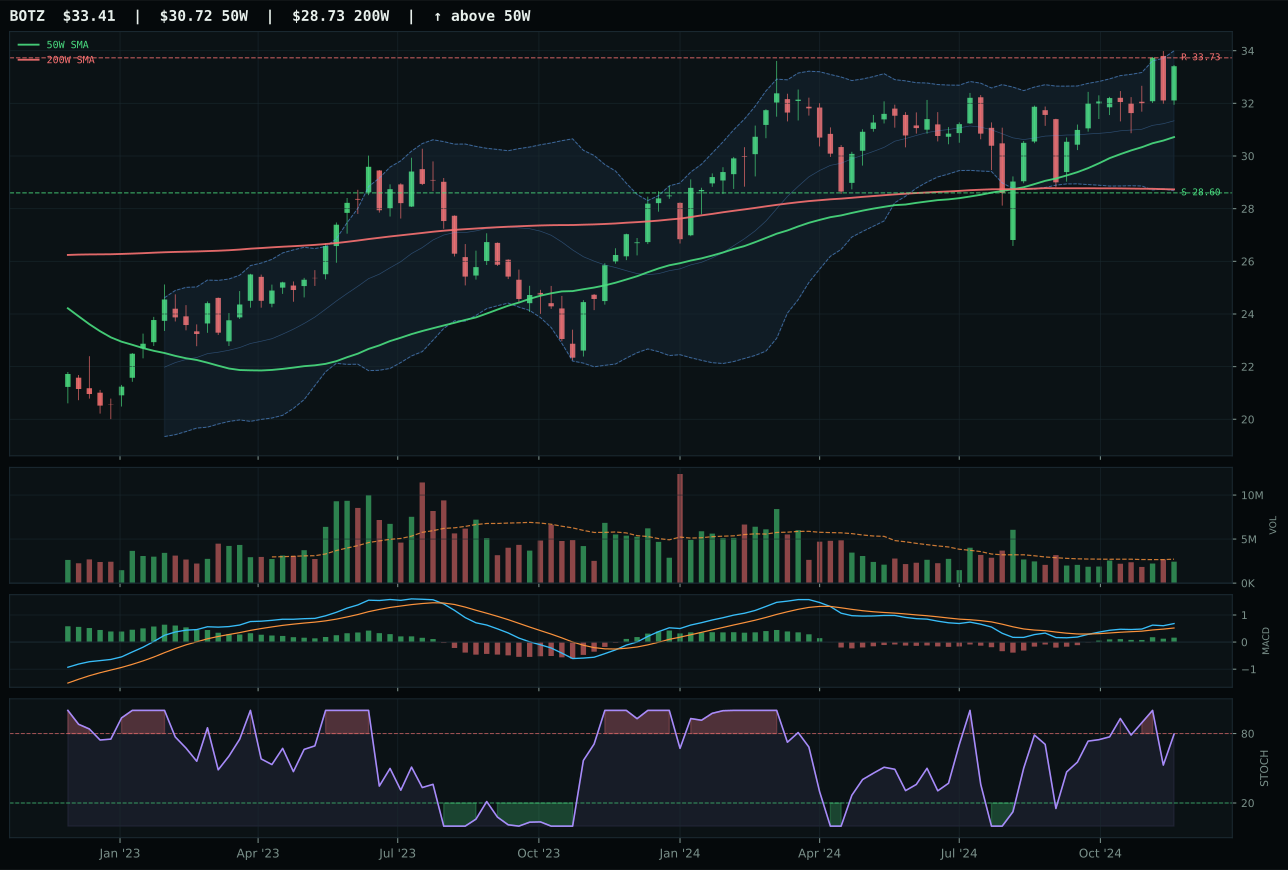
BOTZ has a neutral structure profile with -1.1% 13-week relative strength versus SPY.
A failed hold above support would weaken the setup.
Actionable but governed by invalidation levels.
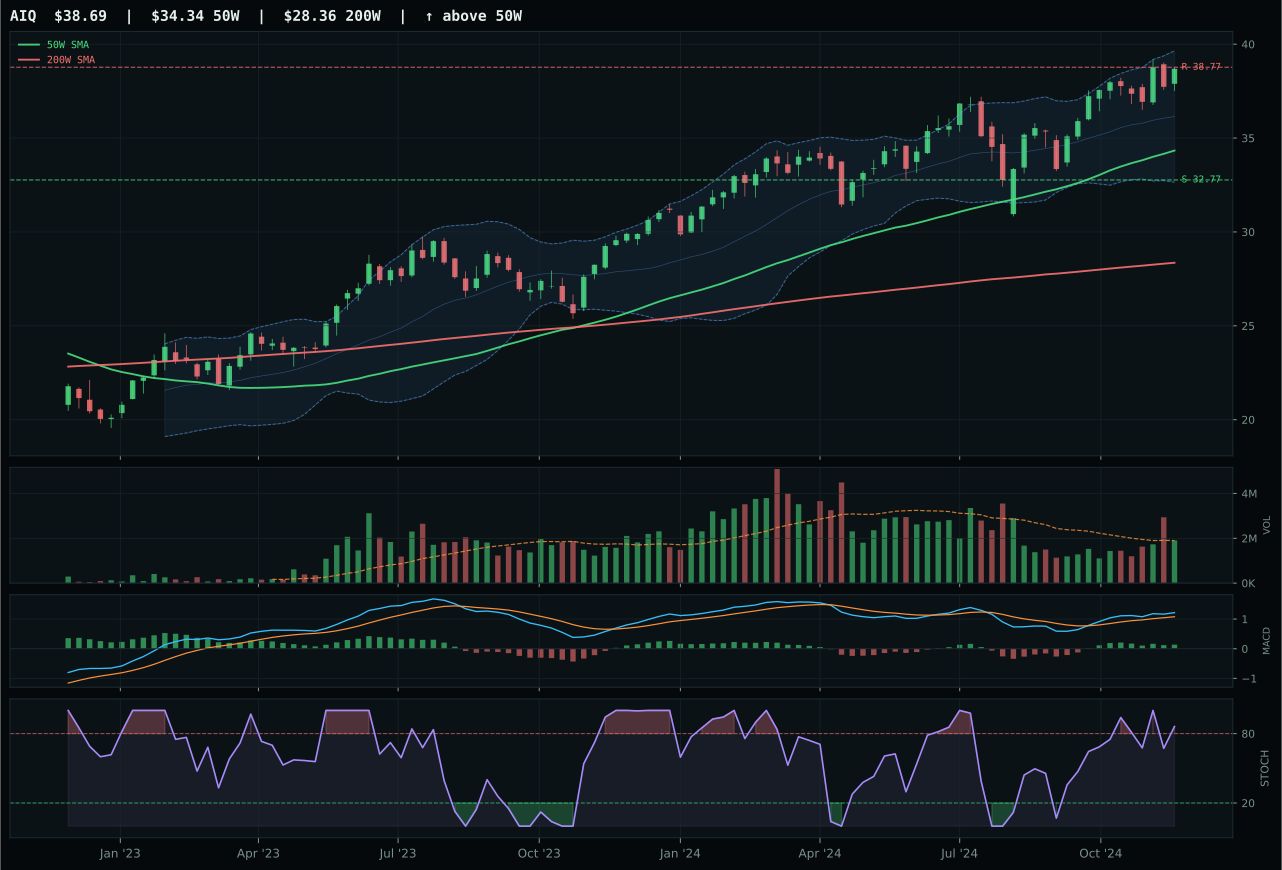
AIQ has a neutral structure profile with 3.0% 13-week relative strength versus SPY.
A failed hold above support would weaken the setup.
Actionable but governed by invalidation levels.
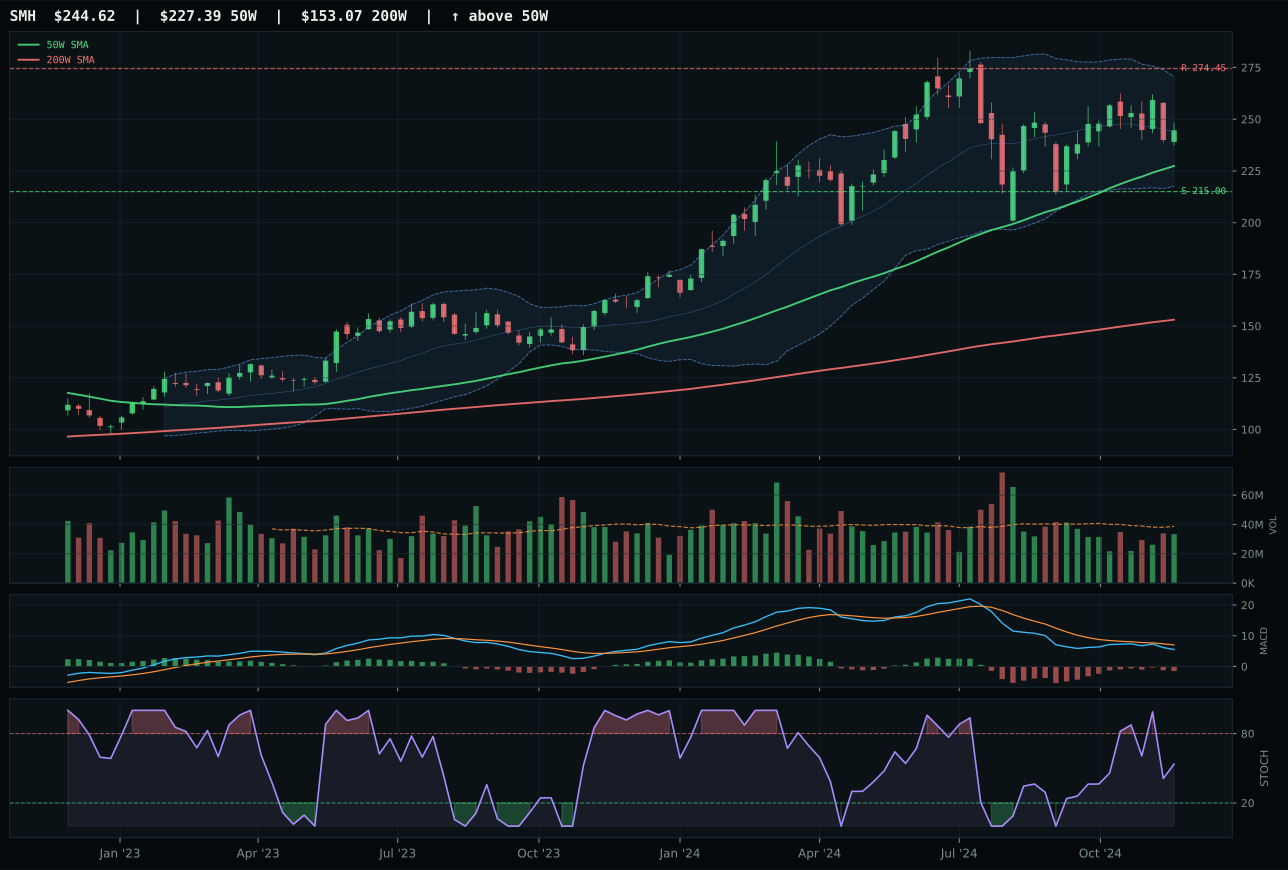
SMH has a neutral structure profile with -7.5% 13-week relative strength versus SPY.
A failed hold above support would weaken the setup.
Actionable but governed by invalidation levels.
BOTZ wins a close decision over AIQ because its timing score of 75 beats AIQ's 54—price sits just 8.8% from the 50-week with MACD bullish and improving and stochastic RSI falling neutral, which is a far cleaner setup than AIQ's overbought momentum state at a larger extension. Risk-reward is marginally better (38.0 vs 37.2), and structure remains neutral in both cases, but the proximity to the 50-week and the less-stretched technical posture give BOTZ better asymmetry. The 13-week return of 4.8% trails AIQ's 8.9%, and both show weak category-relative strength, but BOTZ's improving MACD carries more forward momentum potential than AIQ's flattening confirmation. Neither shows SPY-relative strength, which is why the category score is punished to 40.8.
AI receives 5% as a tier-2 sleeve despite a final score of just 40.8, ranking well below top-2 categories. The macro environment is actively hostile: liquidity stress, credit stress, broad market bear, and dollar pressure combine to a -37 impact on the category-level macro fit, which bottoms at 23.0/100. This is the defining constraint—the technical case (BOTZ's 74.0 technical evidence) gets overwhelmed by structural macro headwinds. The portfolio holds it for tactical breadth and for the event that corporate capex spending accelerates despite the disinflation backdrop, but this is defensive positioning. A sustained shift in the active macro descriptor checklist away from credit stress and liquidity concerns would be required to promote AI to top-2.
Industrial Metals — COPX
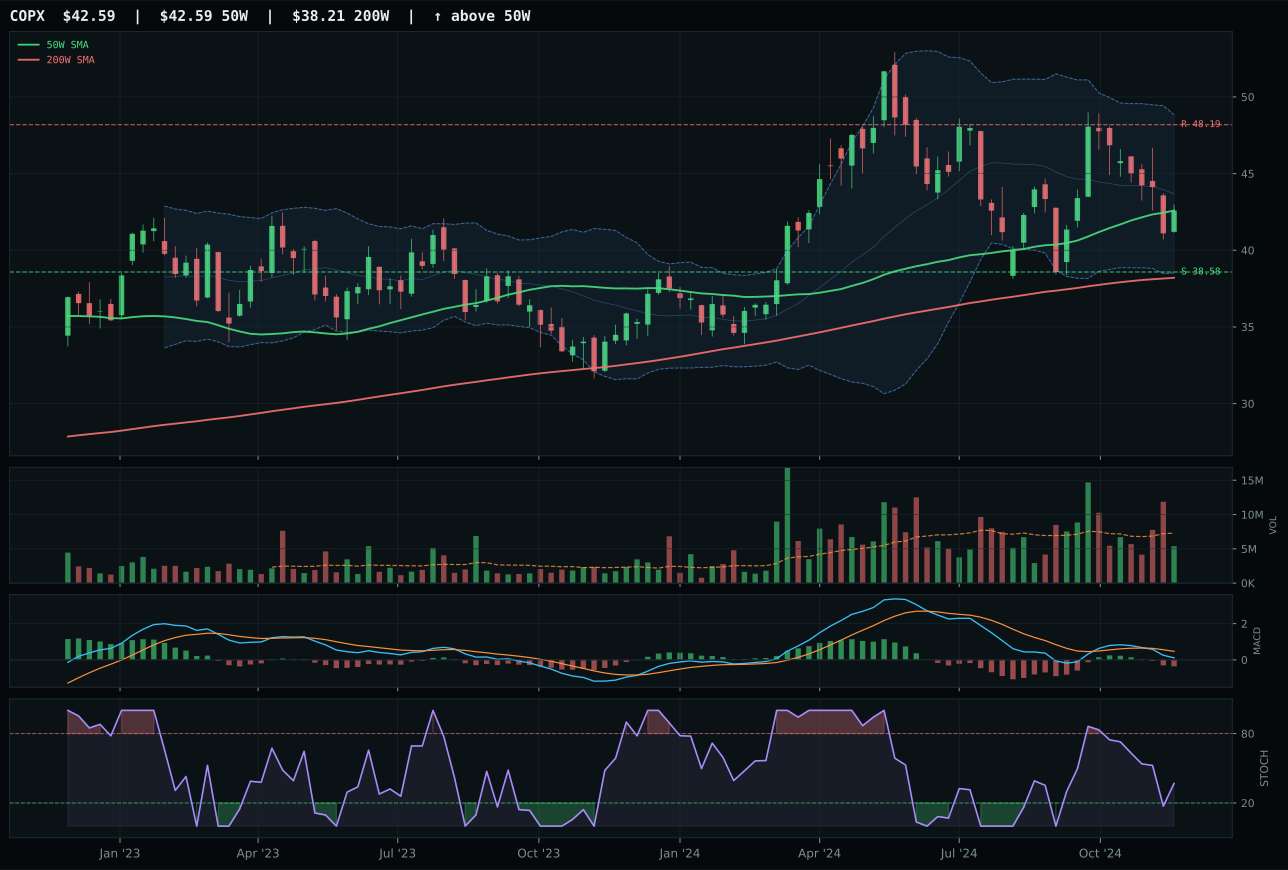
COPX has a compression near 50W profile with -9.1% 13-week relative strength versus SPY.
A failed hold above support would weaken the setup.
Actionable but governed by invalidation levels.
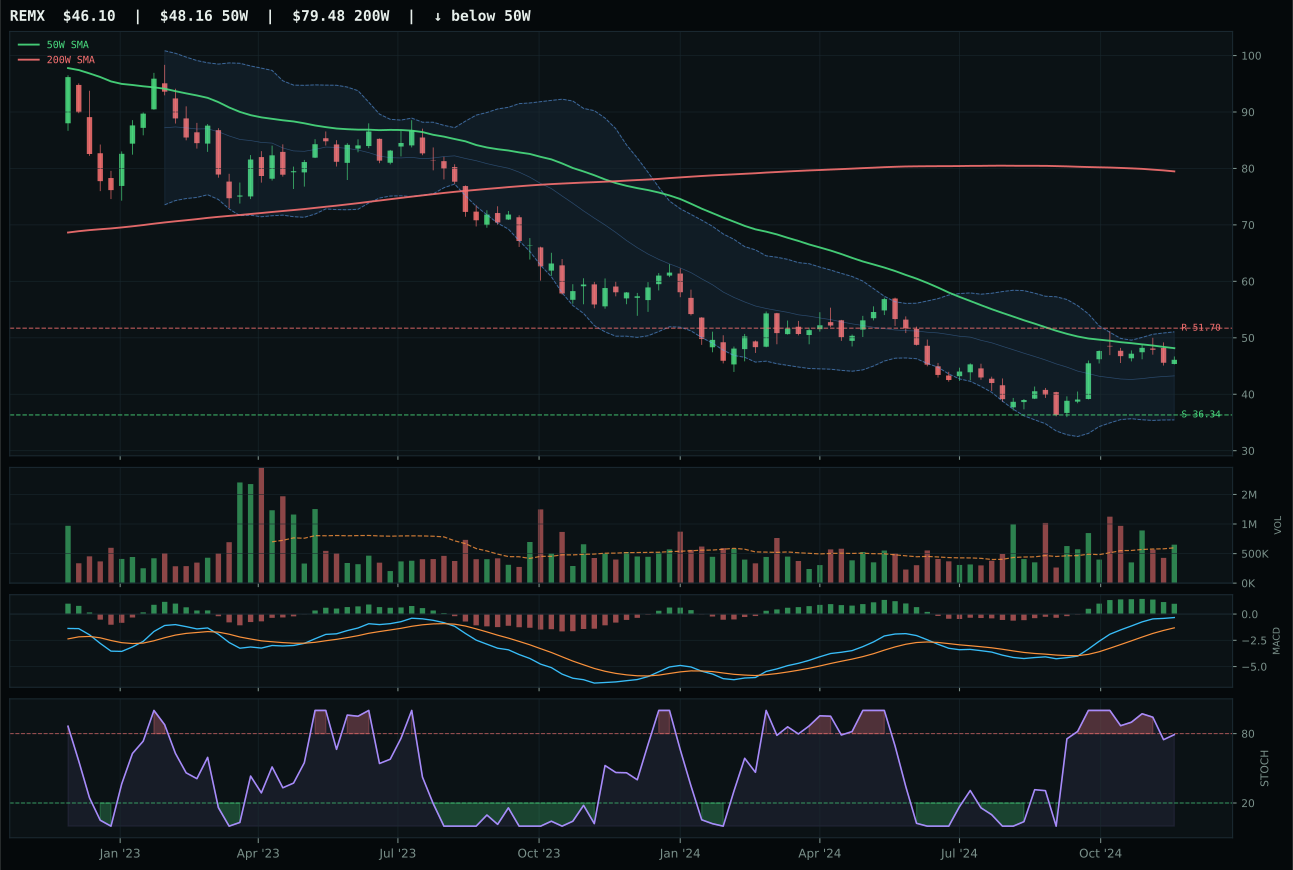
REMX has a neutral structure profile with 7.8% 13-week relative strength versus SPY.
Extension and support failure are the main tactical risks.
Tracked, but not top-2 eligible because: structurally broken.
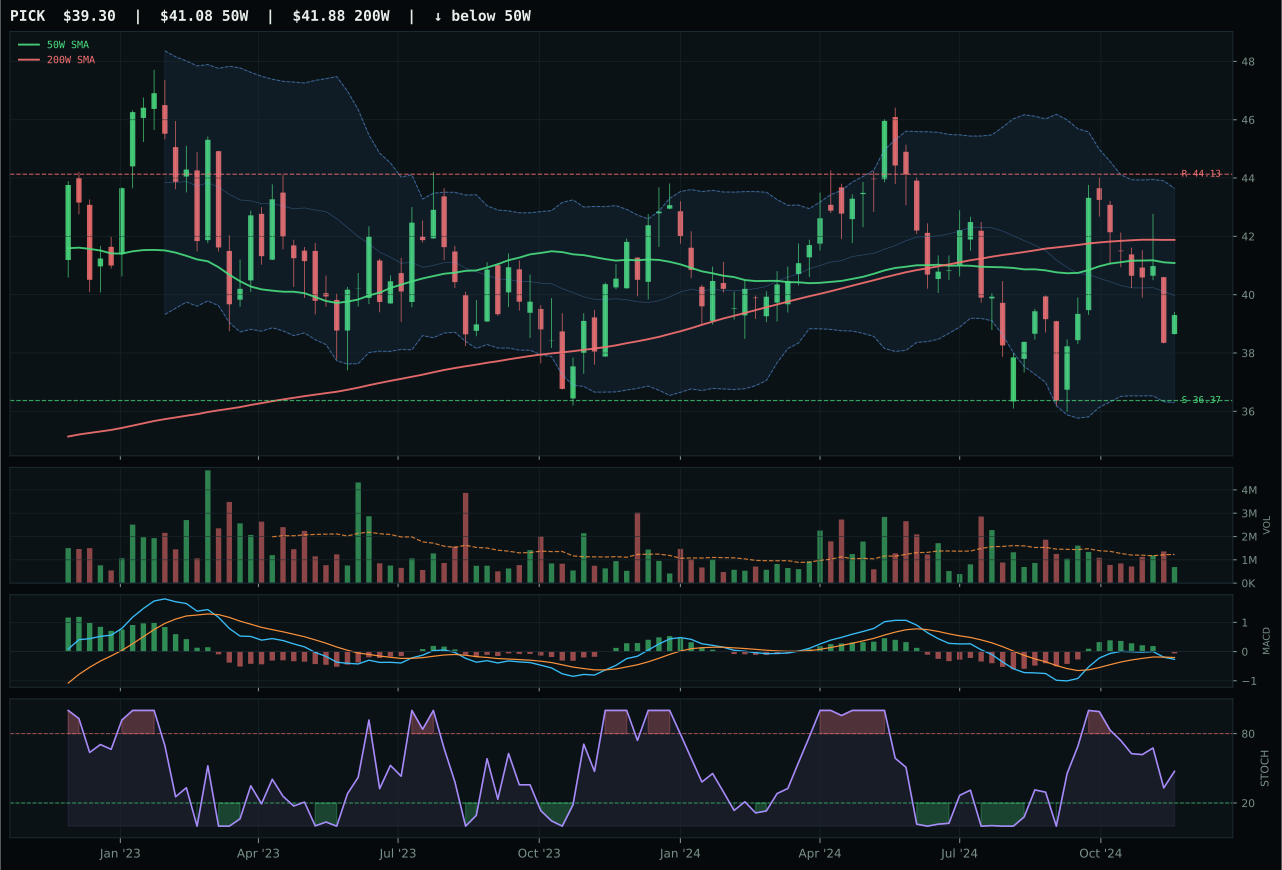
PICK has a neutral structure profile with -6.3% 13-week relative strength versus SPY.
Extension and support failure are the main tactical risks.
Tracked, but not top-2 eligible because: structurally broken.
COPX wins by 20.3 points over REMX despite showing a momentum confirmation score of 0.0/100 because price compression at the 50-week, paired with the optimal timing score of 100.0, offers better risk setup than REMX's stretched structure and deteriorating MACD. COPX is 0.0% from the 50-week with falling/neutral stochastic RSI and middle-zone Fibonacci placement—a coiling setup that could expand if buyers defend support. REMX shows bullish but flattening MACD, overbought structure, and 13.7% 13-week return, but the risk-reward advantage for COPX (73.1 vs 60.3) reflects that REMX is more extended and vulnerable. The thin participation (0.74x) hurts COPX's momentum score, but the setup proximity gives it better odds than REMX's stretched momentum.
Industrial Metals receives 5% allocation as a tier-2 holding, ranked below Defense and Nuclear but held despite a final category score of 29.6. The macro case is present but incomplete: metals scarcity is active at +14, commodity breadth positive at +10, but liquidity and credit stress are both active headwinds (-8 and -7 respectively). COPX's technical evidence is weak (27.9/100), but the macro descriptors for metals scarcity and real asset sponsorship are strong enough to justify the 5% position. This is a macro bet more than a technicals call. The category would move to tier-1 allocation if price broke above the 50-week with volume confirmation and if the stochastic RSI inflected bullish, but right now it's a squeeze-waiting-to-happen that the portfolio tolerates for scarcity exposure.
Agriculture & Livestock — MOO
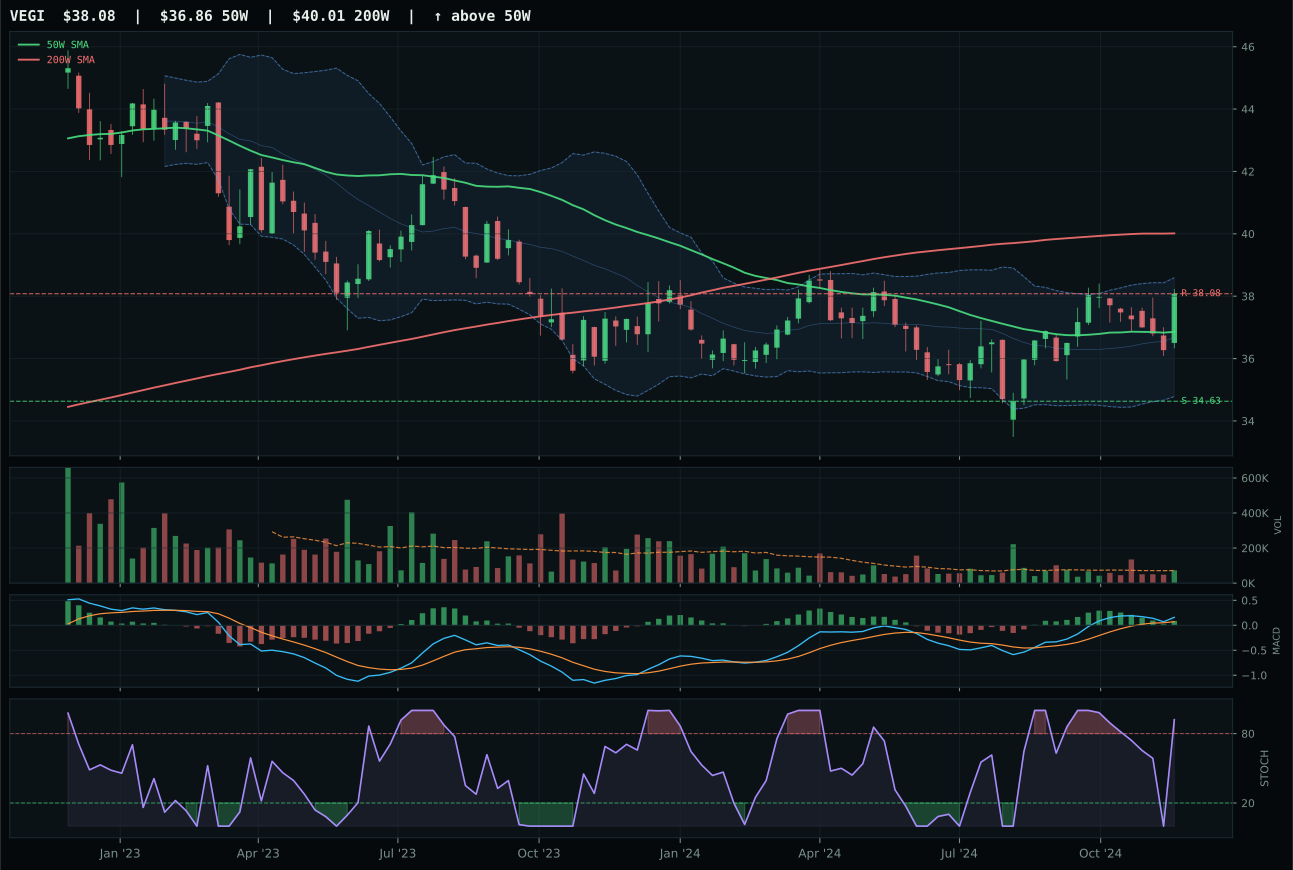
VEGI has a neutral structure profile with -1.8% 13-week relative strength versus SPY.
A failed hold above support would weaken the setup.
Tracked, but not top-2 eligible because: .
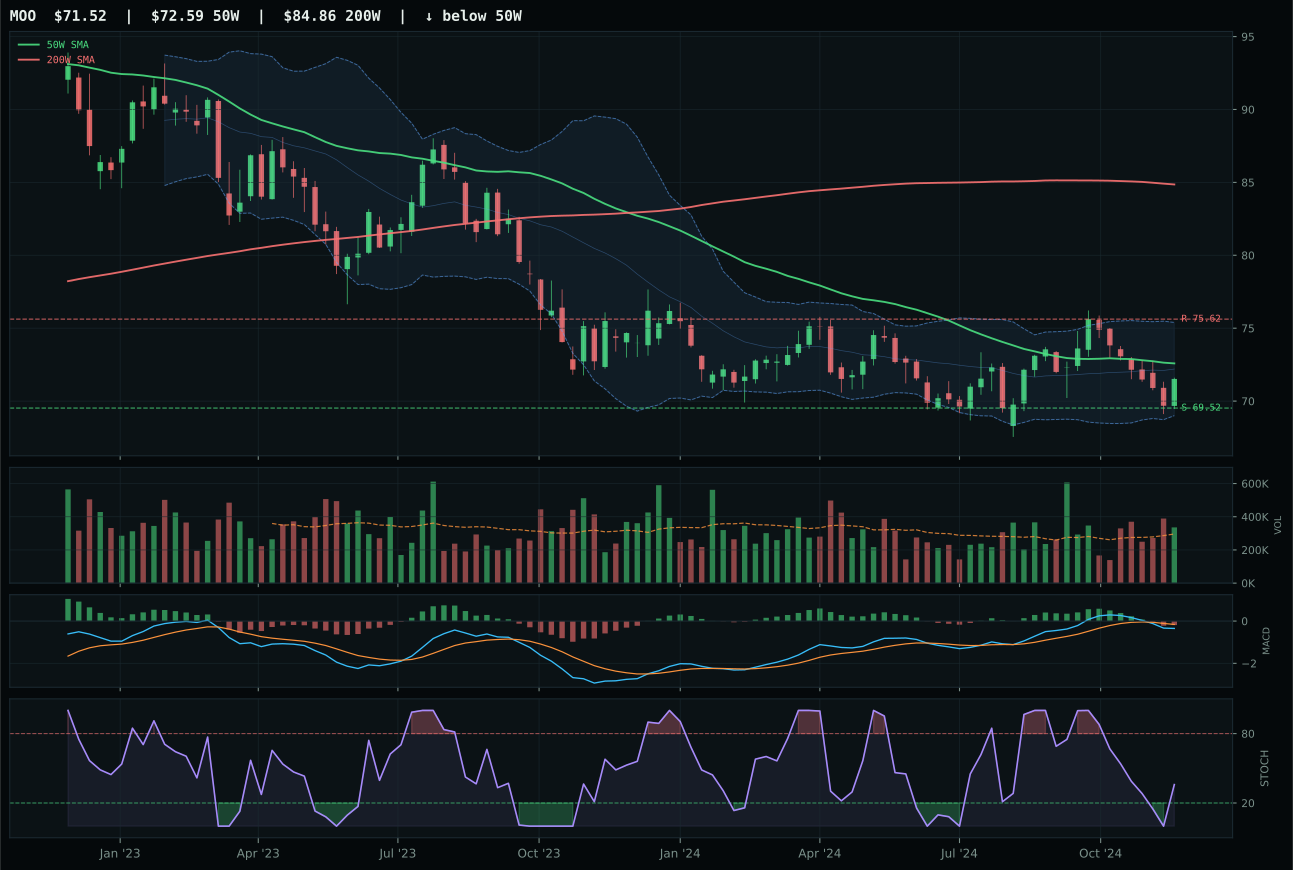
MOO has a pullback into support profile with -8.1% 13-week relative strength versus SPY.
Extension and support failure are the main tactical risks.
Tracked, but not top-2 eligible because: structurally broken.
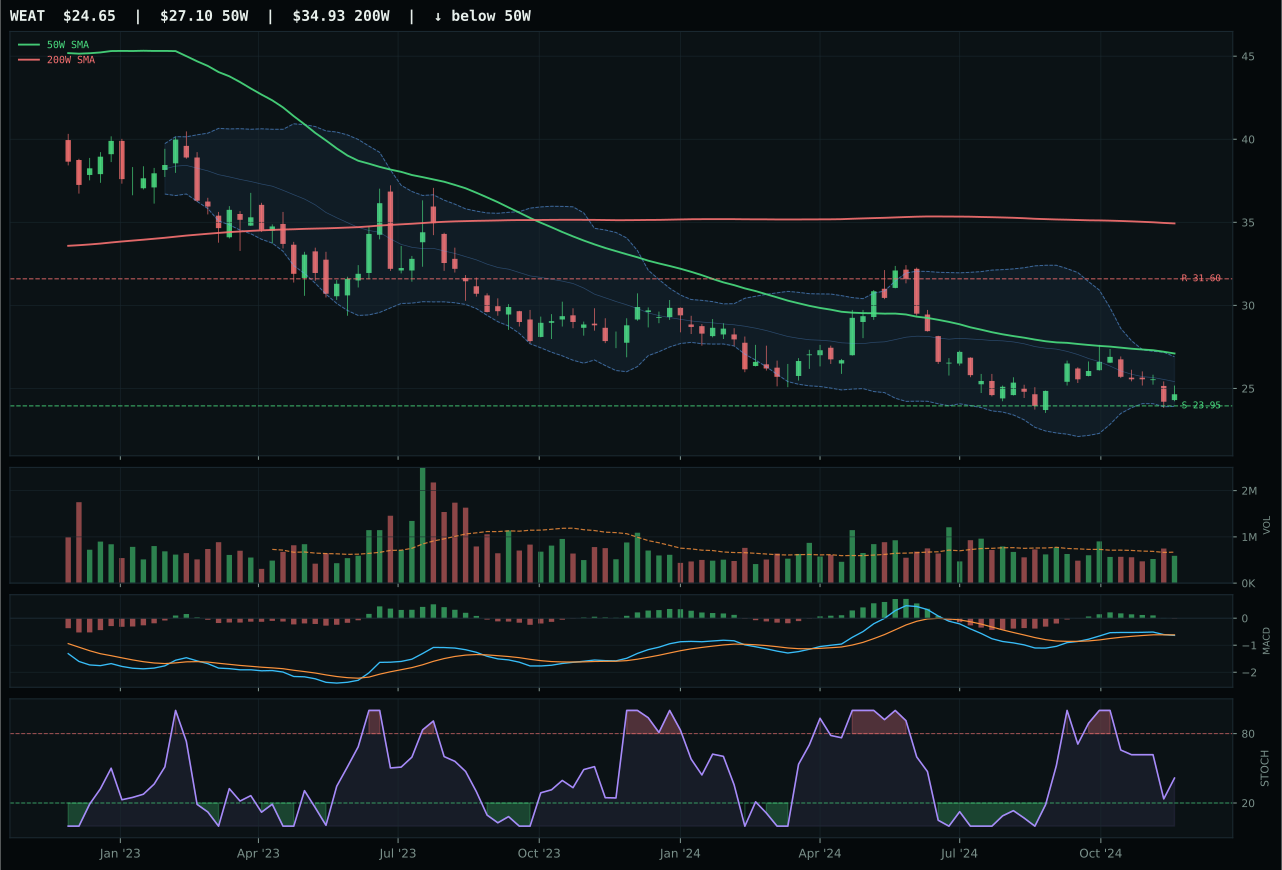
WEAT has a pullback into support profile with -3.0% 13-week relative strength versus SPY.
Extension and support failure are the main tactical risks.
Tracked, but not top-2 eligible because: structurally broken.
MOO wins but earns no allocation because it represents a broken setup that the system is forced to recognize as the category representative. Price is below the 50-week and 200-week moving averages, MACD is bearish and weakening, and the 13-week return is -2.2% with RS versus SPY at -8.1%. The only reason MOO scores at all is its proximity to the 50-week (-1.5%) and the favorable risk-reward from support (86.9/100)—it's trading a defined support zone, which gives it timing merit even as the trend collapses. VEGI showed 45.0 technical evidence but MOO still wins because the category itself is structurally impaired and the system must designate a representative. The -45-point gap versus VEGI underscore the category's dysfunction.
Agriculture & Livestock is shut out of allocation (0%) and ranked 9th or 10th because the final category score of 6.0 reflects a category-level macro fit that's actively broken at 45.0/100. Disinflation pressure is a -8 headwind, and while real asset sponsorship (+8) and commodity breadth (+5) offer some support, the damage is done by the structural macro mismatch and the technical deterioration across all three candidates. VEGI showed the cleanest technical case but still failed because the macro regime is asymmetrically negative for agricultural exposure in a disinflation environment. The category needs a sustained shift back toward inflation expectations, rising commodity breadth, or a technical repair where price establishes a new uptrend above the 50-week. Until then, this is dead capital.
Emerging Markets — INDA
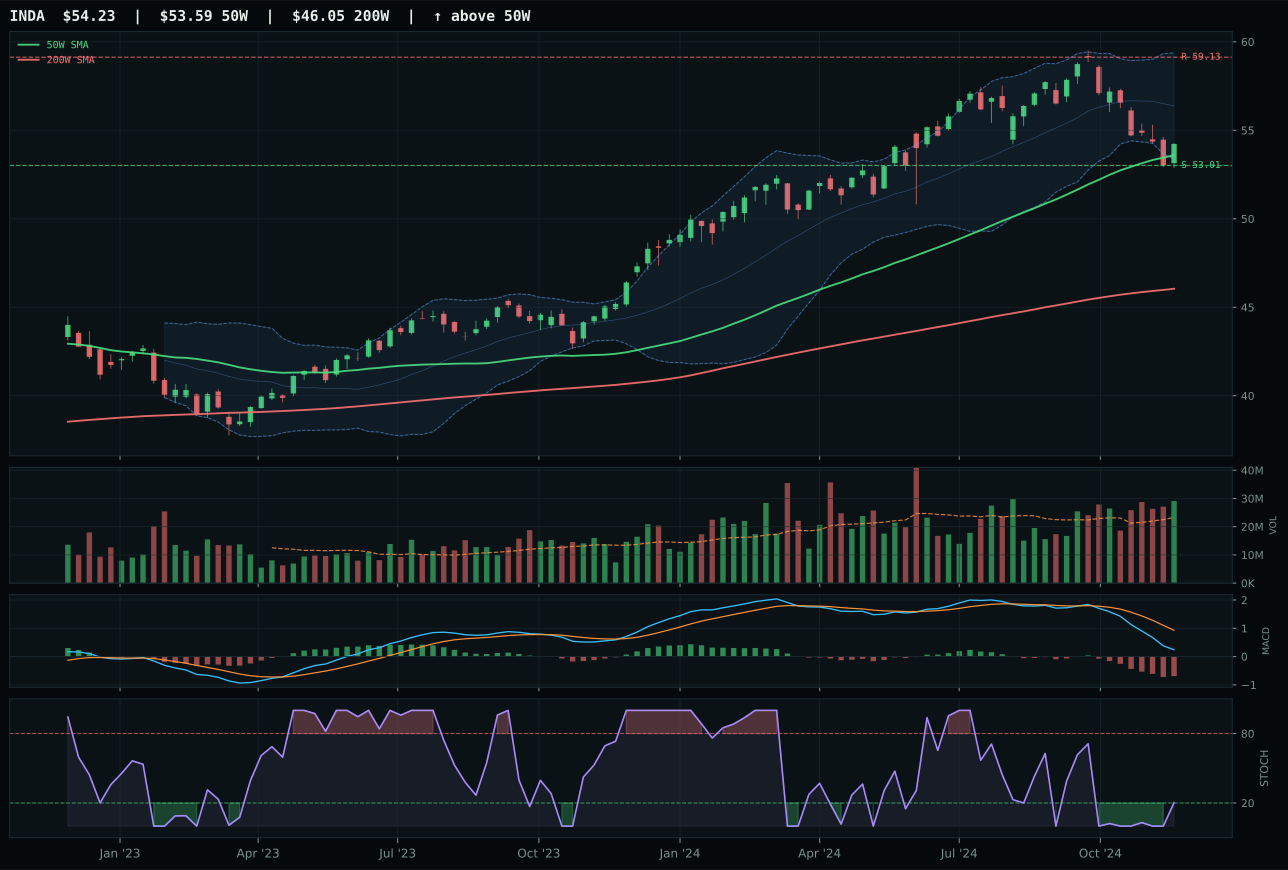
INDA has a pullback into support profile with -10.9% 13-week relative strength versus SPY.
A failed hold above support would weaken the setup.
Actionable but governed by invalidation levels.
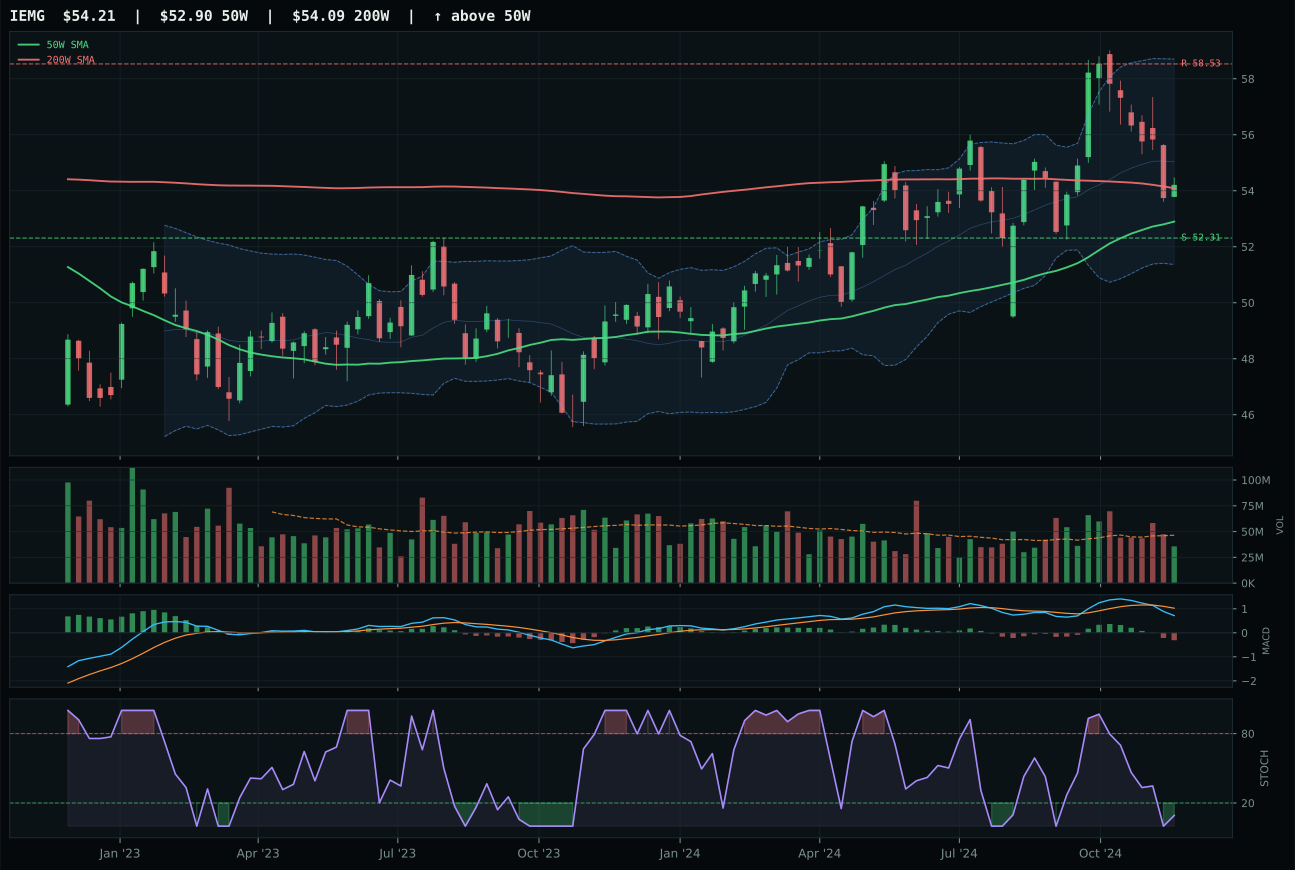
IEMG has a pullback into support profile with -7.4% 13-week relative strength versus SPY.
A failed hold above support would weaken the setup.
Actionable but governed by invalidation levels.
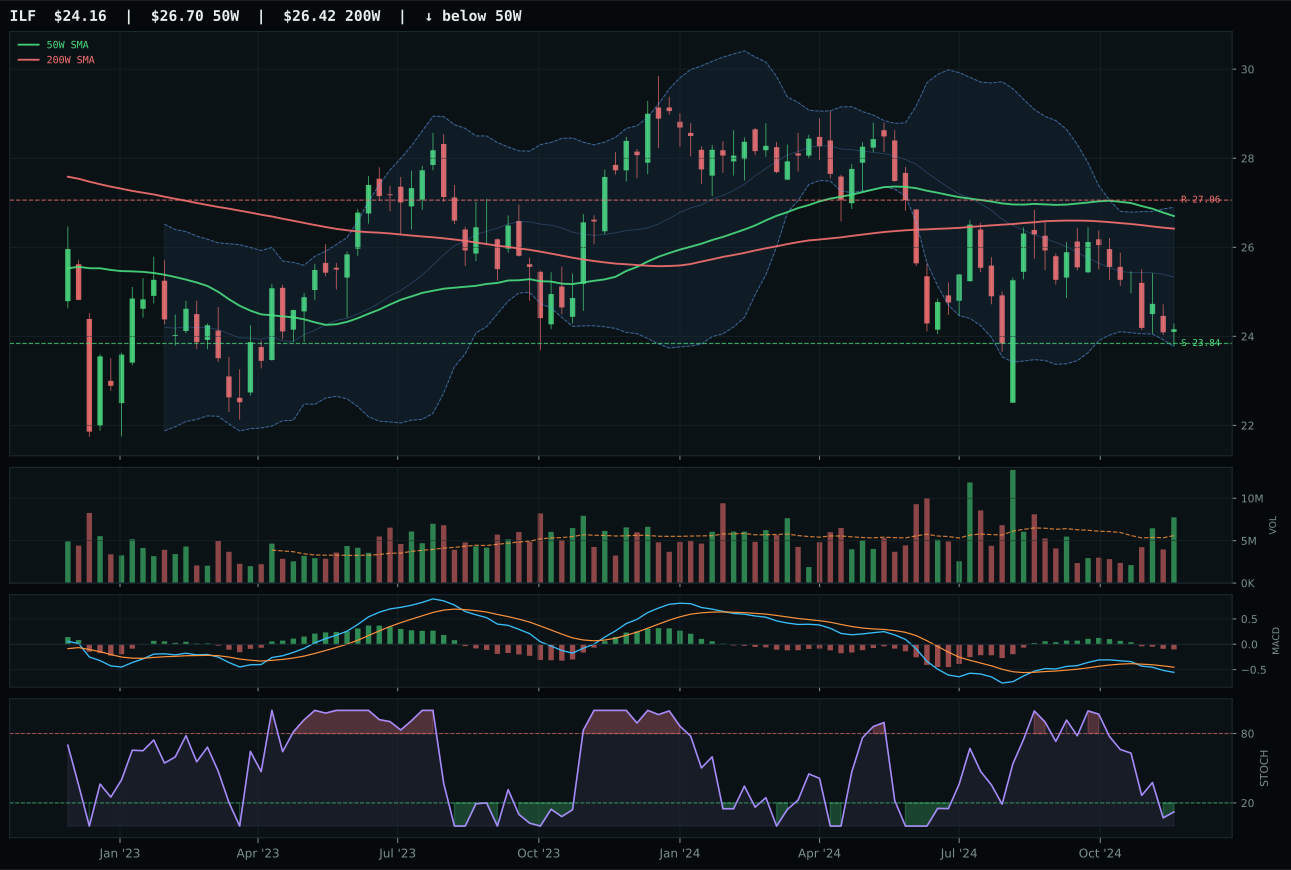
ILF has a pullback into support profile with -14.0% 13-week relative strength versus SPY.
A failed hold above support would weaken the setup.
Actionable but governed by invalidation levels.
INDA wins but earns no allocation because the category is entirely shut out. INDA beats IEMG and ILF by virtue of timing (100.0 vs 100.0 and 80 respectively) and risk-reward (90.0 vs 90.0 and 90), with the edge coming from above-average volume participation (1.25x) versus neutral and above-average respectively. The -5.0% 13-week return and -10.9% SPY-relative strength are disqualifying, but INDA's pullback-into-support setup and rising mid-zone stochastic RSI suggest the setup is stabilizing. The category-level score of 1.7 is so depressed that the identity of the representative is almost irrelevant.
Emerging Markets is allocated 0% and ranked 9th or 10th because the macro regime is actively hostile across all three candidates. Dollar pressure is a -14 headwind, credit stress is -10, liquidity stress is -10, and broad market bear is -9, combining to a category-level macro fit of 7.0/100. Even INDA's best timing score and favorable risk-reward cannot overcome the fundamental macro mismatch in a disinflation environment where the dollar strengthens and emerging-market credit faces pressure. The technical case is not the constraint—it's that the portfolio simply cannot justify allocating capital to an asset class that is fighting three concurrent macro headwinds. The category needs a sustained dollar peak and a reset in credit stress descriptors to become relevant again. Until then, this capital is better deployed in categories where macro and technicals are aligned.