
2024-11-15
Informational purposes only. The content in this report, including allocations, analysis, and commentary, is provided solely for informational and educational purposes. It does not constitute financial advice, investment advice, trading advice, or any other type of advice. Past performance does not guarantee future results. Always conduct your own research and consult a qualified financial professional before making investment decisions.
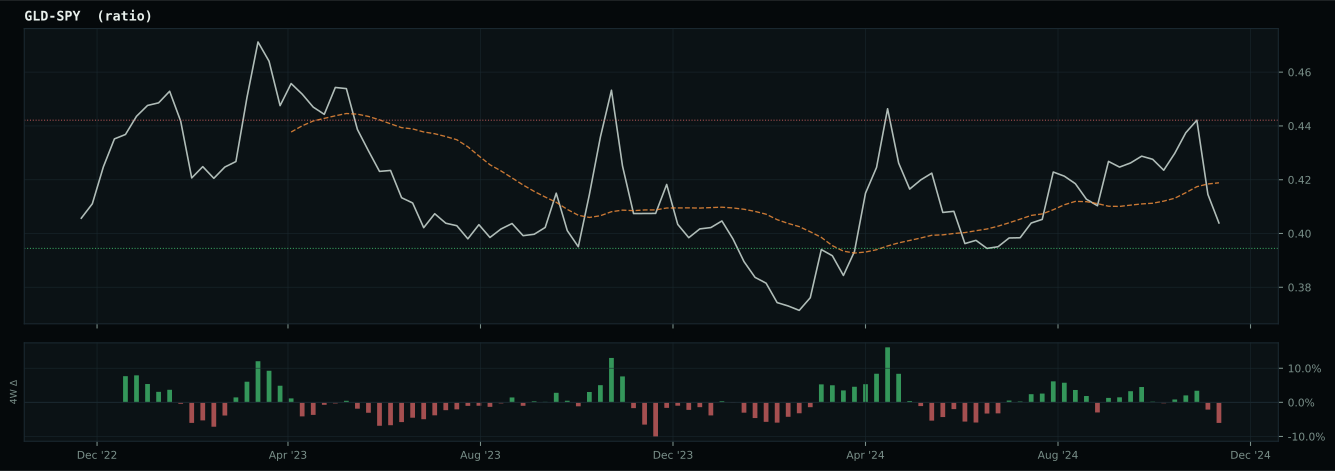
GLD defensive overlay excluded: price is below its 8W SMA. Cause selector will use cash alternative.
Slow macro Defensive trigger is active (Transition Defense), but crypto-cycle exposure has priority for this run.
Weekly Allocation
| Ticker | Category | Weight | Role |
|---|---|---|---|
| FBTC | 50% | Overlay | |
| PAVE | Utilities & Infrastructure | 10% | Top-2 (10%) |
| URA | Nuclear Energy | 10% | Top-2 (10%) |
| GLD | Precious Metals | 5% | Tier-2 (5%) |
| XAR | Defense & Aerospace | 5% | Tier-2 (5%) |
| XLE | Traditional Energy | 5% | Tier-2 (5%) |
| IGV | Technology | 5% | Tier-2 (5%) |
| MOO | Agriculture & Livestock | 5% | Tier-2 (5%) |
| COPX | Industrial Metals | 5% | Tier-2 (5%) |
Trade Instructions — Monday Open
Sell the tranche from 2024-10-18 (completing its 4-week hold). Buy the new tranche. Instructions show net portfolio changes — same-asset positions cancel, weight changes show the delta.
| Action | Ticker | Instruction |
|---|---|---|
| SELL | SLV | Sell entire SLV position (2.50% of portfolio) |
| SELL | CIBR | Sell entire CIBR position (1.25% of portfolio) |
| SELL | SMH | Sell 50% of SMH position (reduce 2.50% → 1.25%) |
| BUY | URA | Buy URA — 25.00% of freed cash (adds 1.25% to portfolio) |
| BUY | GLD | Buy GLD — 25.00% of freed cash (adds 1.25% to portfolio) |
| BUY | IGV | Buy IGV — 25.00% of freed cash (adds 1.25% to portfolio) |
| BUY | XLE | Buy XLE — 25.00% of freed cash (adds 1.25% to portfolio) |
Current Portfolio After Trade
Combined holdings across all 4 active tranches. Each tranche is 25% of the portfolio.
| Ticker | % of Portfolio | Weight Bar |
|---|---|---|
| FBTC | 50.00% | |
| GLD | 8.75% | |
| PAVE | 8.75% | |
| IGV | 6.25% | |
| XAR | 5.00% | |
| COPX | 5.00% | |
| URA | 3.75% | |
| MOO | 3.75% | |
| BOTZ | 2.50% | |
| NLR | 2.50% | |
| SMH | 1.25% | |
| INDA | 1.25% | |
| XLE | 1.25% |
Macro Regime — Disinflation
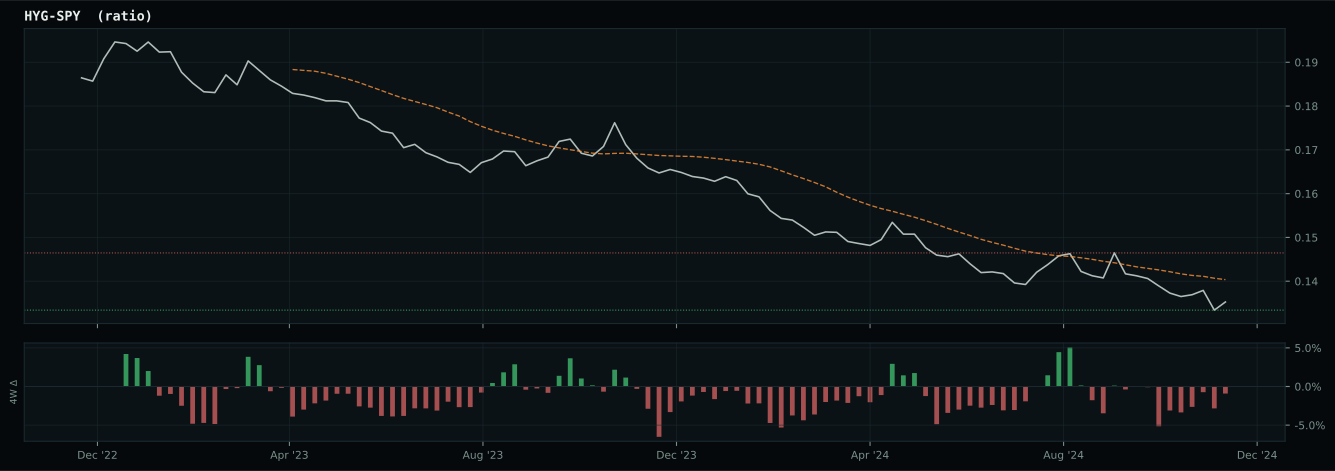
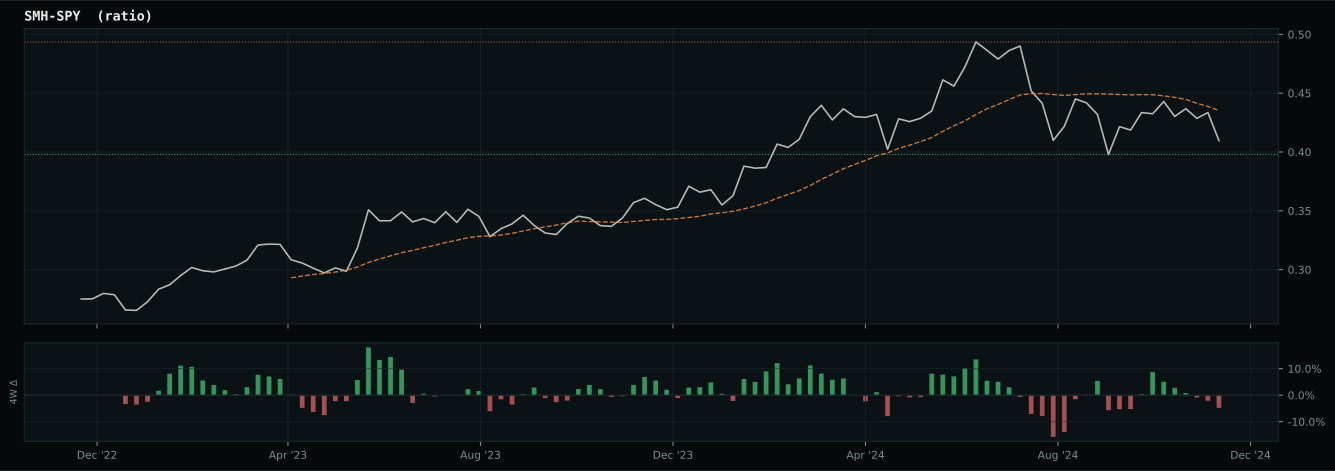
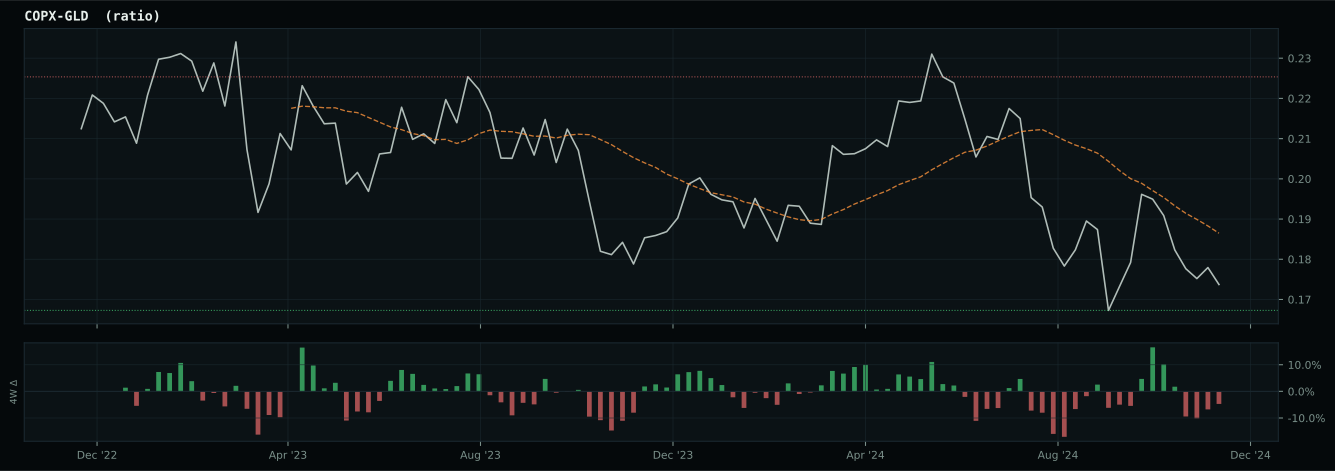
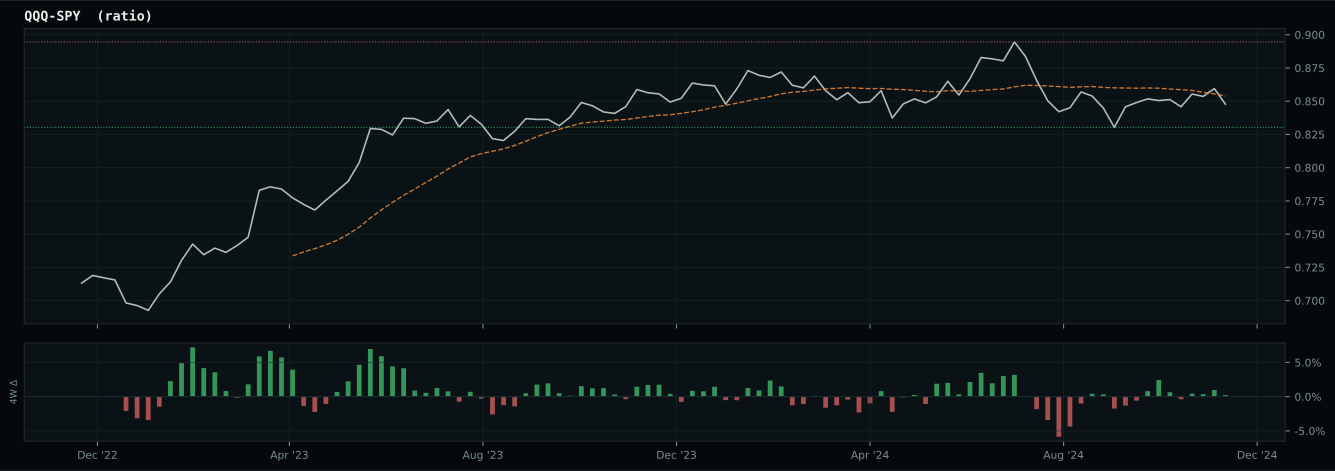
growth data is not confirming the weak market-implied risk appetite signal
Defensive overlay cause is not singular enough to concentrate: the sleeve diversifies across liquidity, monetary defense, and defensive equity exposure while the market resolves the next regime.
Macro Evidence Charts
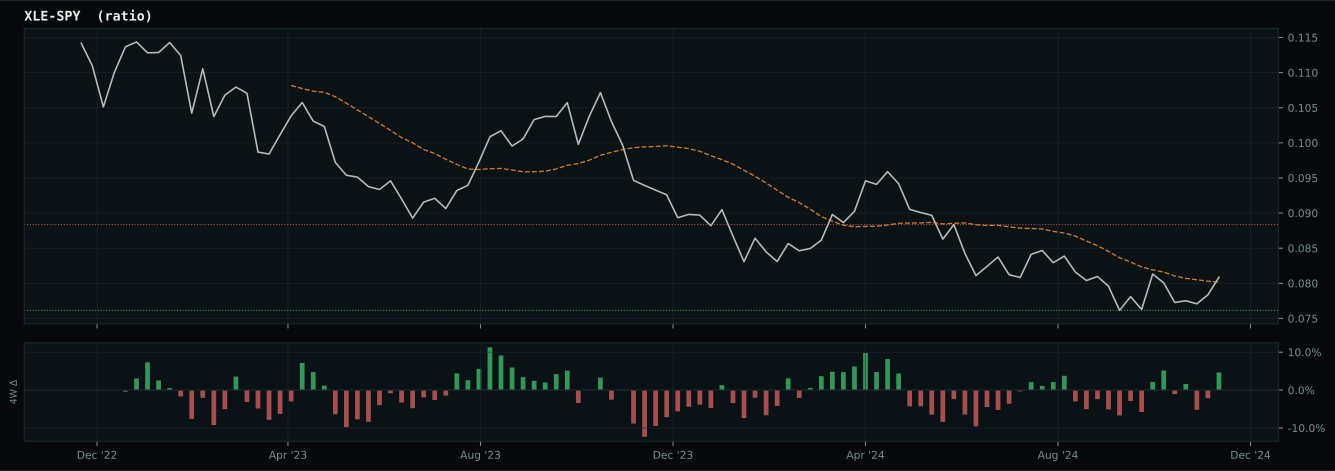
Market-implied signals behind the macro regime scores. Each ratio compares two assets; the direction and slope of the ratio is what the macro engine reads.
Crypto Regime — TrendBTC
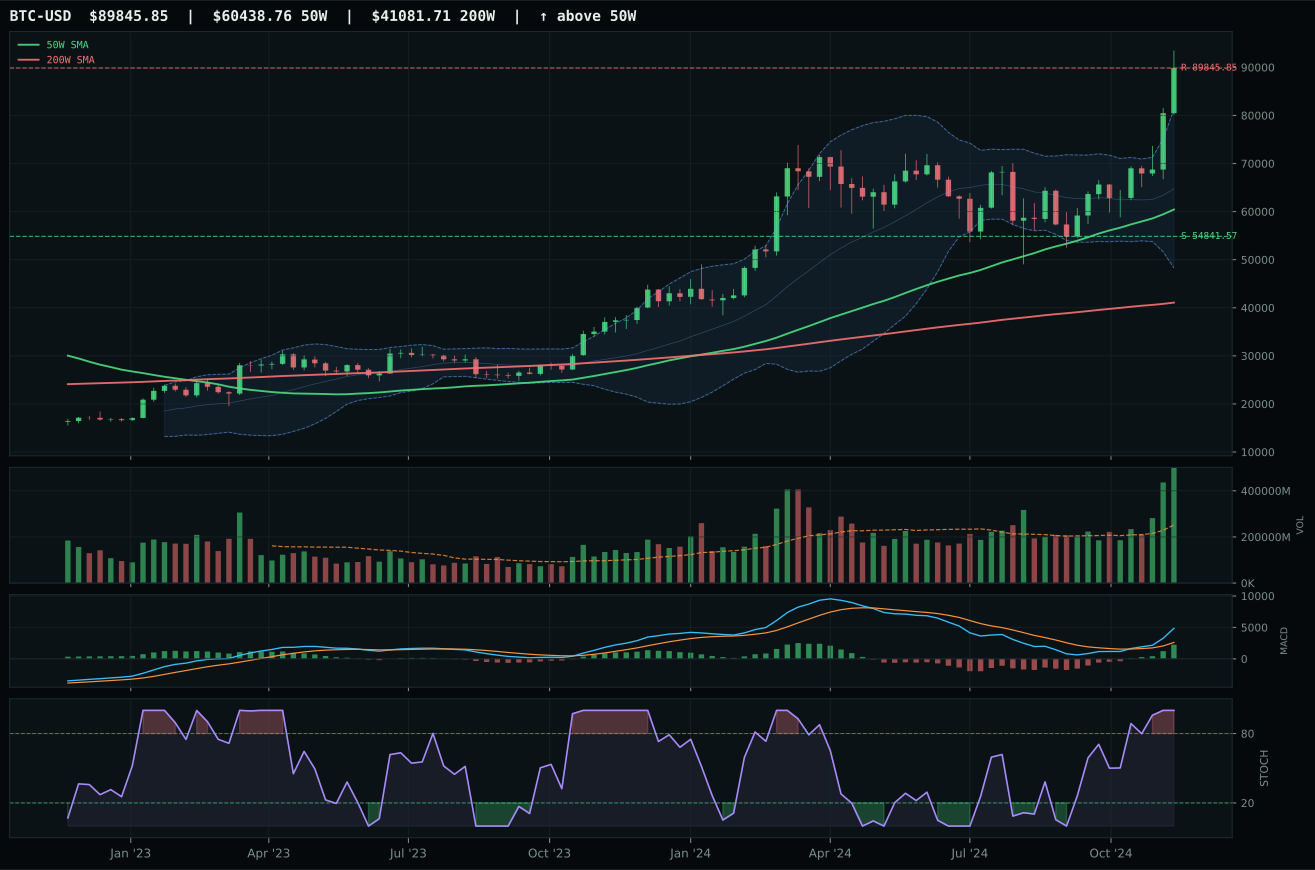
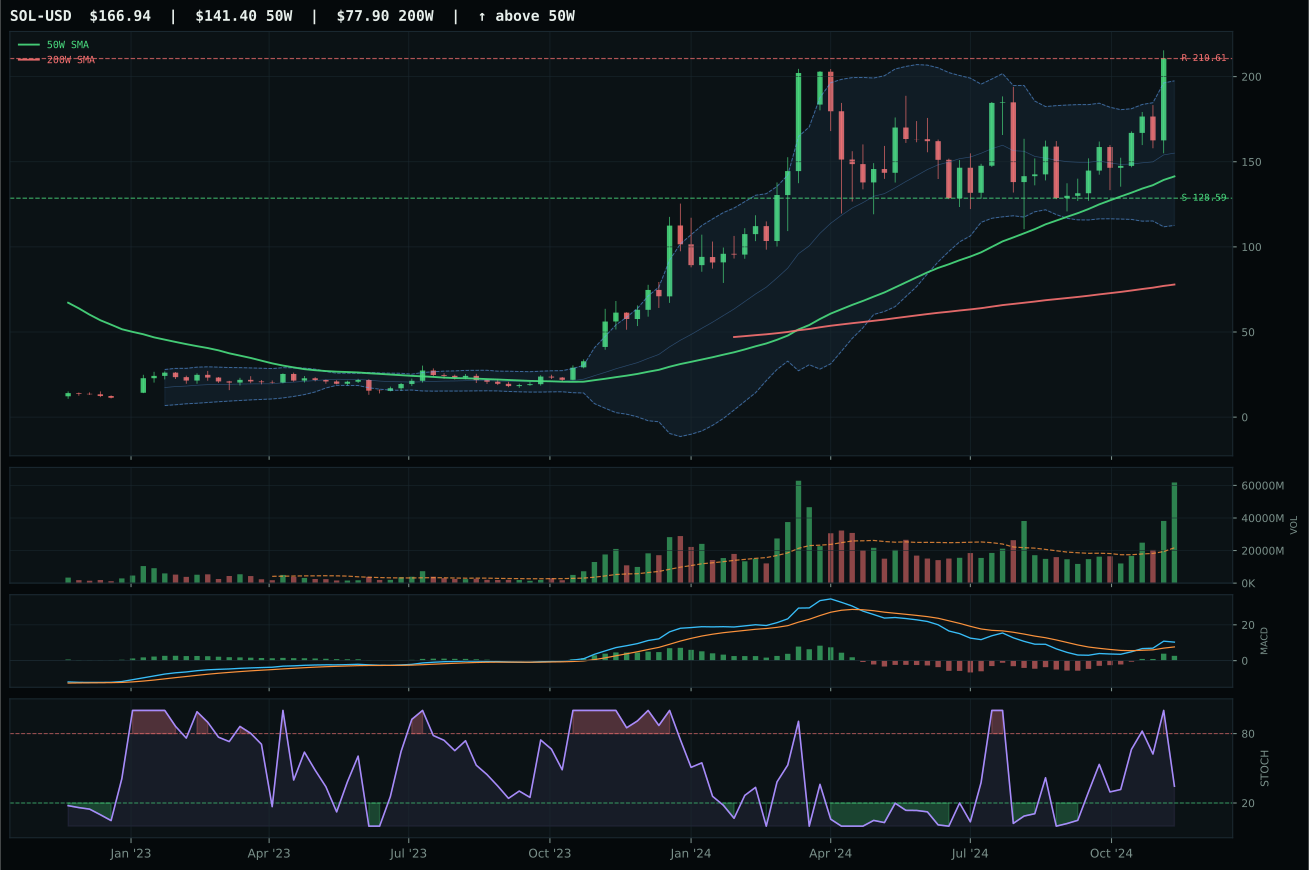
ValueBTC not armed: BTC has not made the first post-breakdown touch of the 200W buy zone after losing the 50W
TrendBTC confirmed: 2 consecutive closes above rising/flat 50W SMA
one or more available conditions failed
Category Rankings
| Rank | Category | Winner | Score | Alloc | 4W Ret | Peers (4W) |
|---|---|---|---|---|---|---|
| 1 | Utilities & Infrastructure | PAVE | 52.3 | 20% | -1.75% | XLU -1.9% · IGF -0.7% |
| 2 | Nuclear Energy | URA | 51.7 | 20% | -6.26% | NLR -3.6% · URNM -8.8% |
| 3 | Precious Metals | GLD | 49.6 | 10% | +2.06% | SLV -1.0% · GDX +0.8% |
| 4 | Defense & Aerospace | XAR | 45.2 | 10% | +2.03% | ROKT +4.5% · ITA -1.5% |
| 5 | Traditional Energy | XLE | 40.0 | 10% | -6.82% | FCG -3.2% · XOP -5.1% |
| 6 | Technology | IGV | 39.0 | 10% | +4.47% | CIBR +6.8% · XLK +4.7% |
| 7 | AI | BOTZ | 22.8 | 10% | +3.11% | AIQ +6.3% · SMH +4.8% |
| 8 | Agriculture & Livestock | MOO | — | 10% | +0.47% | VEGI +3.5% · WEAT +0.2% |
| 9 | Industrial Metals | COPX | — | 0% | -1.19% | REMX -7.0% · PICK -1.7% |
| 10 | Emerging Markets | INDA | — | 0% | +4.46% | IEMG +2.1% · ILF -4.1% |
Utilities & Infrastructure — PAVE
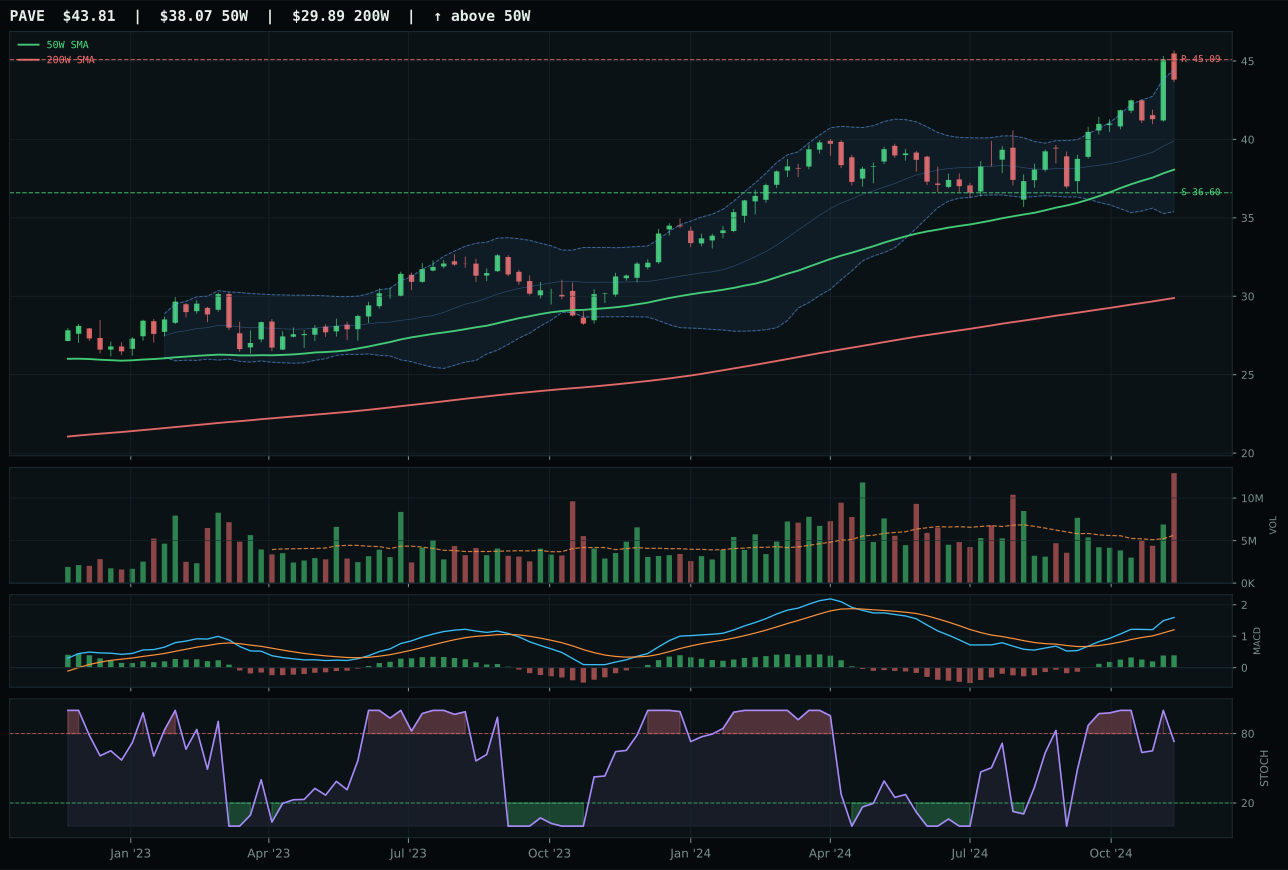
PAVE has a vertical extension profile with 9.4% 13-week relative strength versus SPY.
A failed hold above support would weaken the setup.
Actionable but governed by invalidation levels.
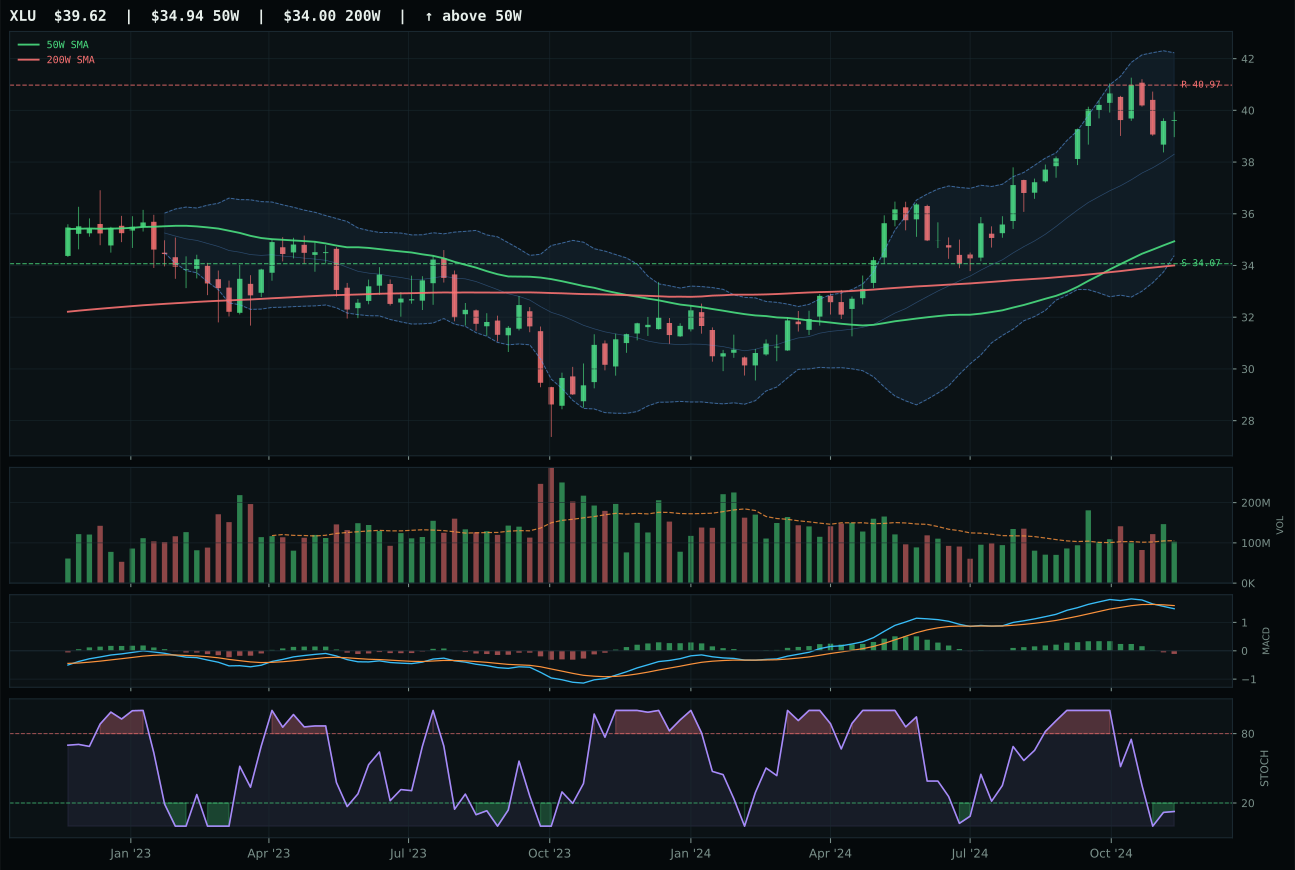
XLU has a neutral structure profile with 0.8% 13-week relative strength versus SPY.
A failed hold above support would weaken the setup.
Actionable but governed by invalidation levels.
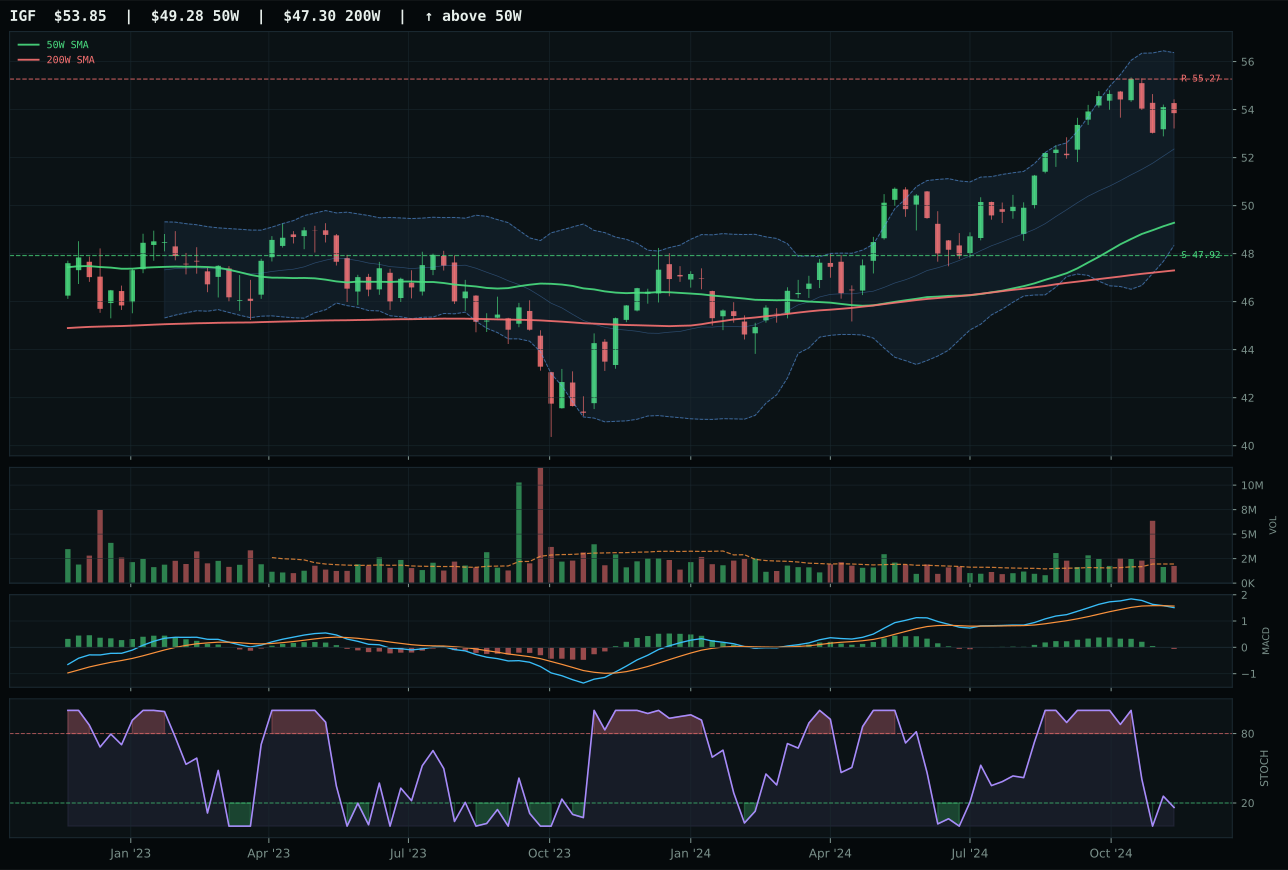
IGF has a neutral structure profile with -0.6% 13-week relative strength versus SPY.
A failed hold above support would weaken the setup.
Actionable but governed by invalidation levels.
PAVE wins by combining category leadership with momentum that justifies the extension: 9.4% SPY outperformance and 8.6% category-relative strength confirm that capital is flowing into domestic infrastructure capex narratives. The 100/100 trend score reflects clean above-50W and above-200W setup with non-deteriorating slope, while 98/100 momentum confirmation from 15.0% thirteen-week return and bullish improving MACD validates the move. The risk sits in timing at 61/100: price is 15.1% extended from the 50W with stochastic RSI rising mid-zone, meaning new entries are paying up. Distribution pressure at 2.30x confirms participation, not distribution — large players are adding despite the extension. XLU lost because MACD reversed to bearish/weakening, momentum collapsed to 37/100, and category-relative strength stalled at 0.0%, signaling that utilities narratives are being de-rated.
Utilities & Infrastructure earned 10% (top-2, 10% allocation split) because the category scored 52.5/100, ranking first or second, and PAVE's technical evidence of 54.6/100 combines with macro/narrative fit of 39.0/100 to justify strategic weight. Disinflation at +7 and Transition/Mixed at +4 are structural tailwinds (lower rates benefit long-duration capex), and broad market bear at +4 means capital is fleeing growth in favor of defensive infrastructure. The tension is that liquidity stress at -6 and credit stress at -5 are real headwinds, but infrastructure's essential utility nature and government-backing mitigate capital drought risk. PAVE's 2.30x volume at distribution pressure is the critical validation: this is not a vacuum rally or thin-volume squeeze, but institutional accumulation. The 19.7% downside to support and -2.8% upside to resistance mean the position is near-term momentum dependent, not a multi-month hold. However, the disinflation macro regime strongly favors domestic capex rotation, and PAVE's extension and rising momentum are early-stage, not climactic. This is a strong top-2 conviction allocation where technical evidence and macro narrative are genuinely synchronized.
Nuclear Energy — URA
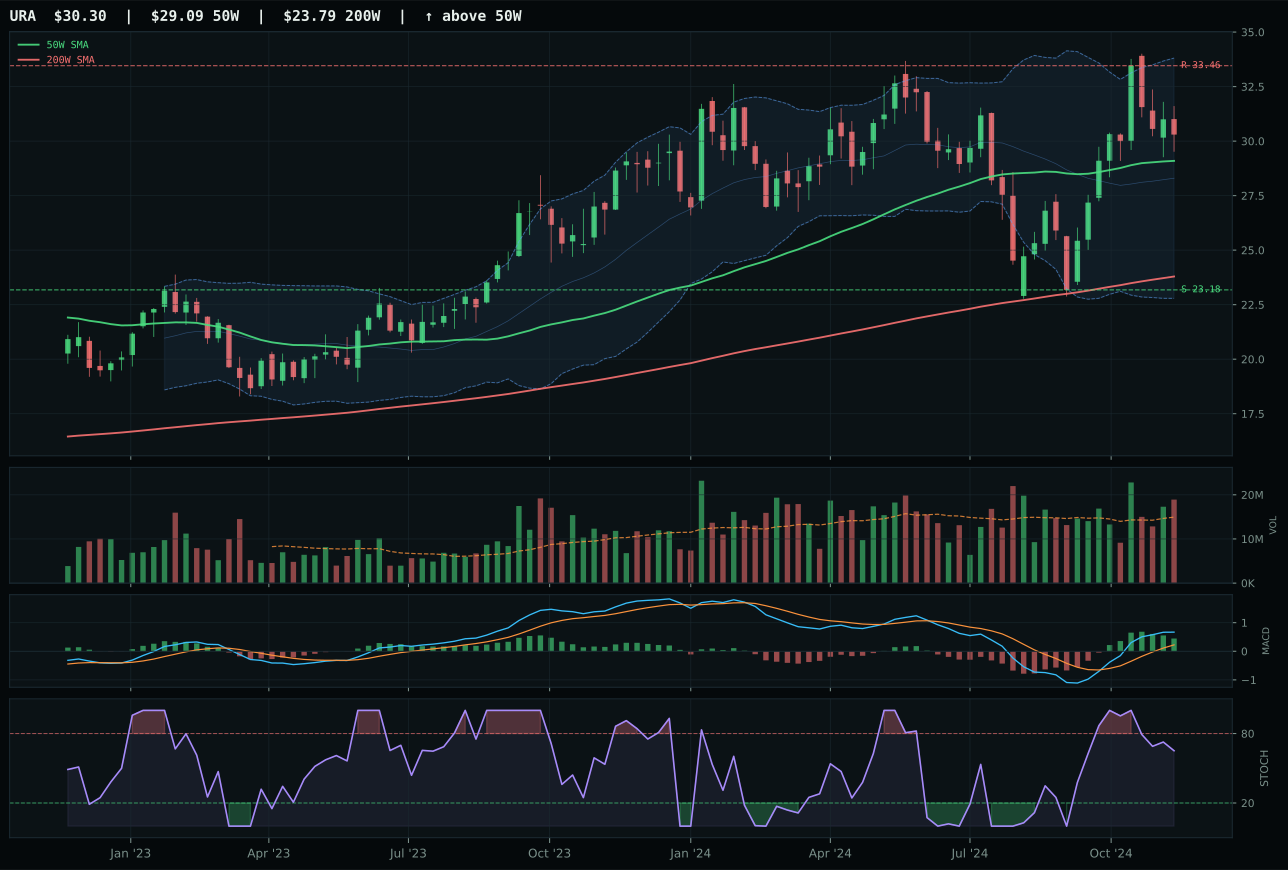
URA has a neutral structure profile with 14.0% 13-week relative strength versus SPY.
A failed hold above support would weaken the setup.
Actionable but governed by invalidation levels.
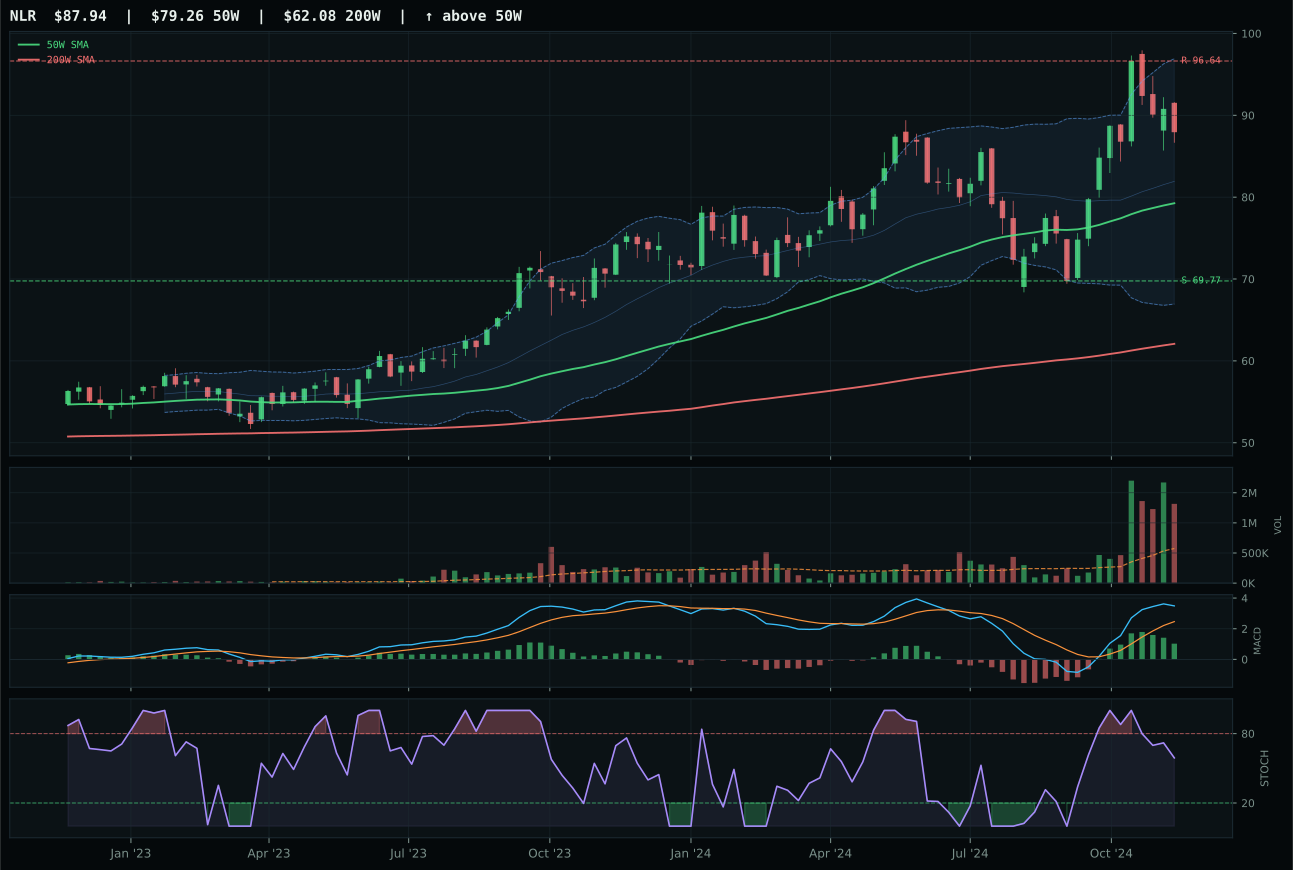
NLR has a neutral structure profile with 12.6% 13-week relative strength versus SPY.
A failed hold above support would weaken the setup.
Actionable but governed by invalidation levels.
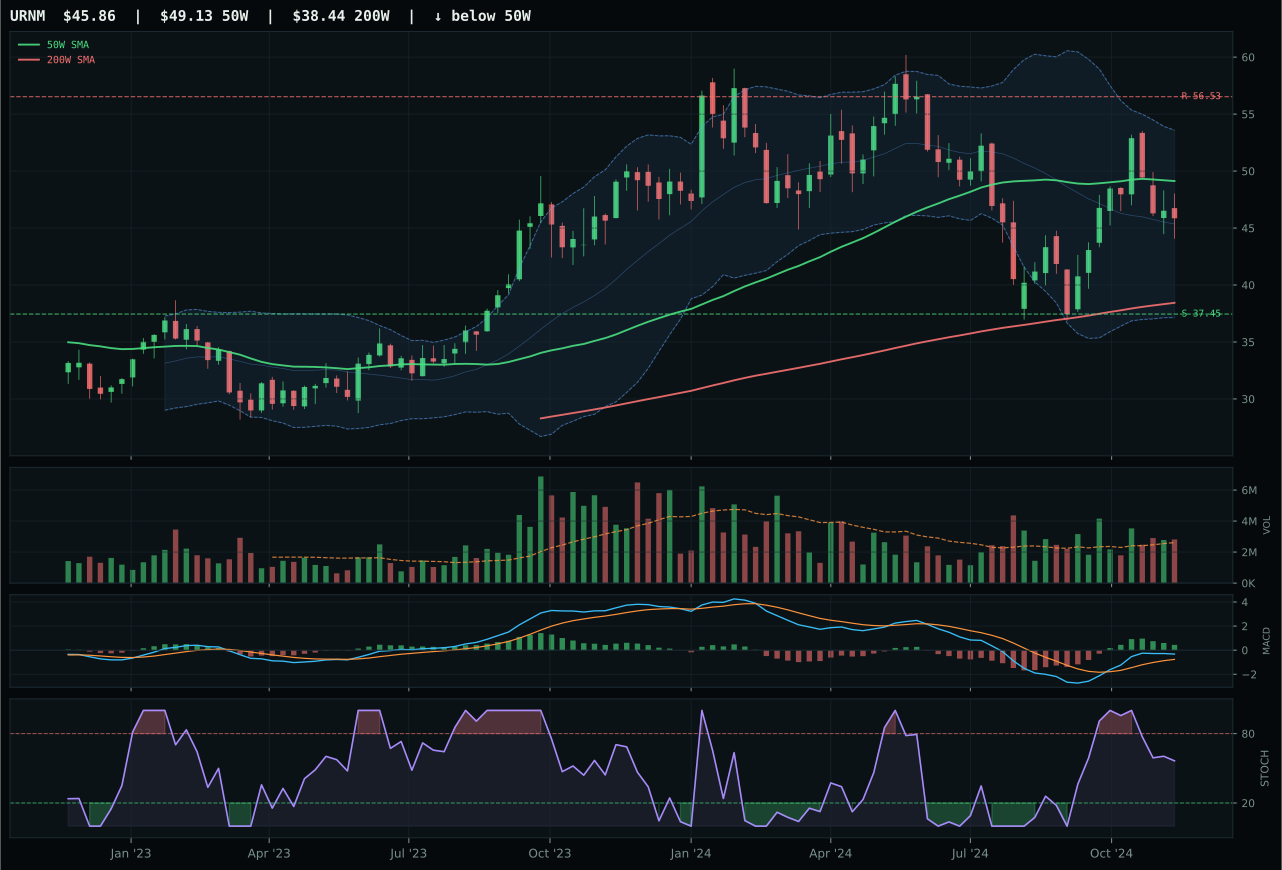
URNM has a neutral structure profile with 5.7% 13-week relative strength versus SPY.
A failed hold above support would weaken the setup.
Actionable but governed by invalidation levels.
URA wins decisively with a 14.2-point margin over NLR because its combination of 14.0% SPY outperformance and 19.7% thirteen-week return reflects genuine momentum without overheat. Timing at 85/100 captures a setup just 4.1% from the 50W with MACD flattening but stochastic RSI at neutral 0.65 — early profit-taking is occurring, but the move is not yet exhausted. NLR's distribution pressure, wider 11.0% extension, and 70/100 timing score reveal a name where late buyers are paying up into resistance. URA's above-average volume participation at 1.27x confirms accumulation, while NLR's distribution pressure at resistance looks like exit activity. The relative strength hierarchy is clear: URA leads the category consensus, and category-relative strength of 1.4% confirms peer strength. Energy scarcity narratives are pricing most favorably into uranium supply, not utilities.
Nuclear Energy earned 10% (top-2, 10% allocation split) because the category ranked second at 51.7/100 and URA's technical evidence of 76.5/100 validates the macro fit of 50.0/100. Energy scarcity at +9 is the structural bid, and disinflation is broadly neutral to nuclear (neither helping nor hurting the decarbonization narrative). The category's eligibility is not constrained by macro headwinds—liquidity stress at -7, credit stress at -5, and risk appetite broken at -4 are meaningful but not disqualifying in a sector riding energy transition tailwinds. This is a strategic allocation, not tactical. URA's 4.1% proximity to the 50-week and rising momentum confirmation mean the position is getting fresh accumulation, not distribution. The 30.7% downside to support at 23.18 is significant but acceptable because the -9.4% upside to resistance means the next logical move is a consolidation or pullback, not a runaway extension. Nuclear energy benefits from both energy scarcity narrative and disinflation (because utilities' fixed-rate debt becomes cheaper relative to earnings), making this a rare macro-technical alignment that justifies top-2 weight.
Precious Metals — GLD
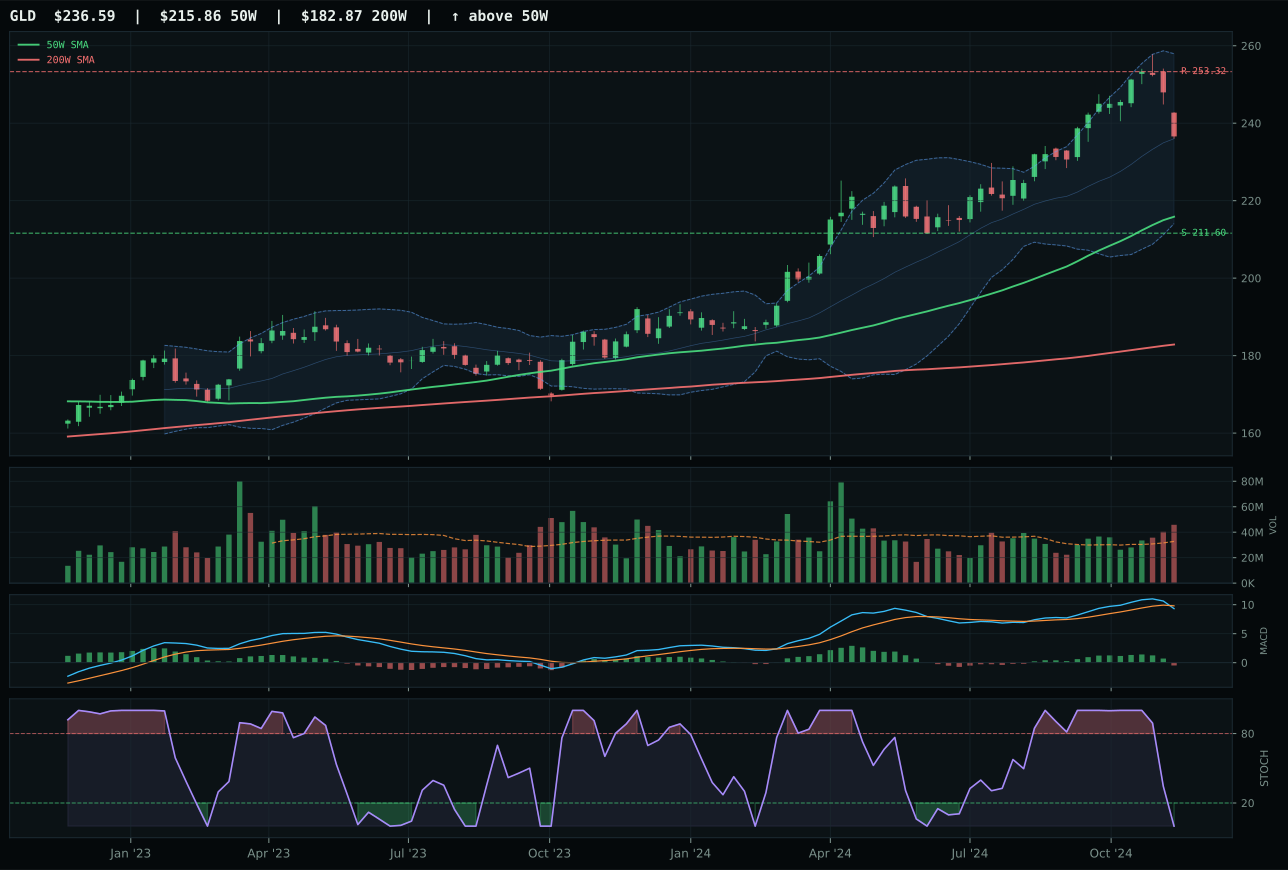
GLD has a neutral structure profile with -3.7% 13-week relative strength versus SPY.
A failed hold above support would weaken the setup.
Actionable but governed by invalidation levels.
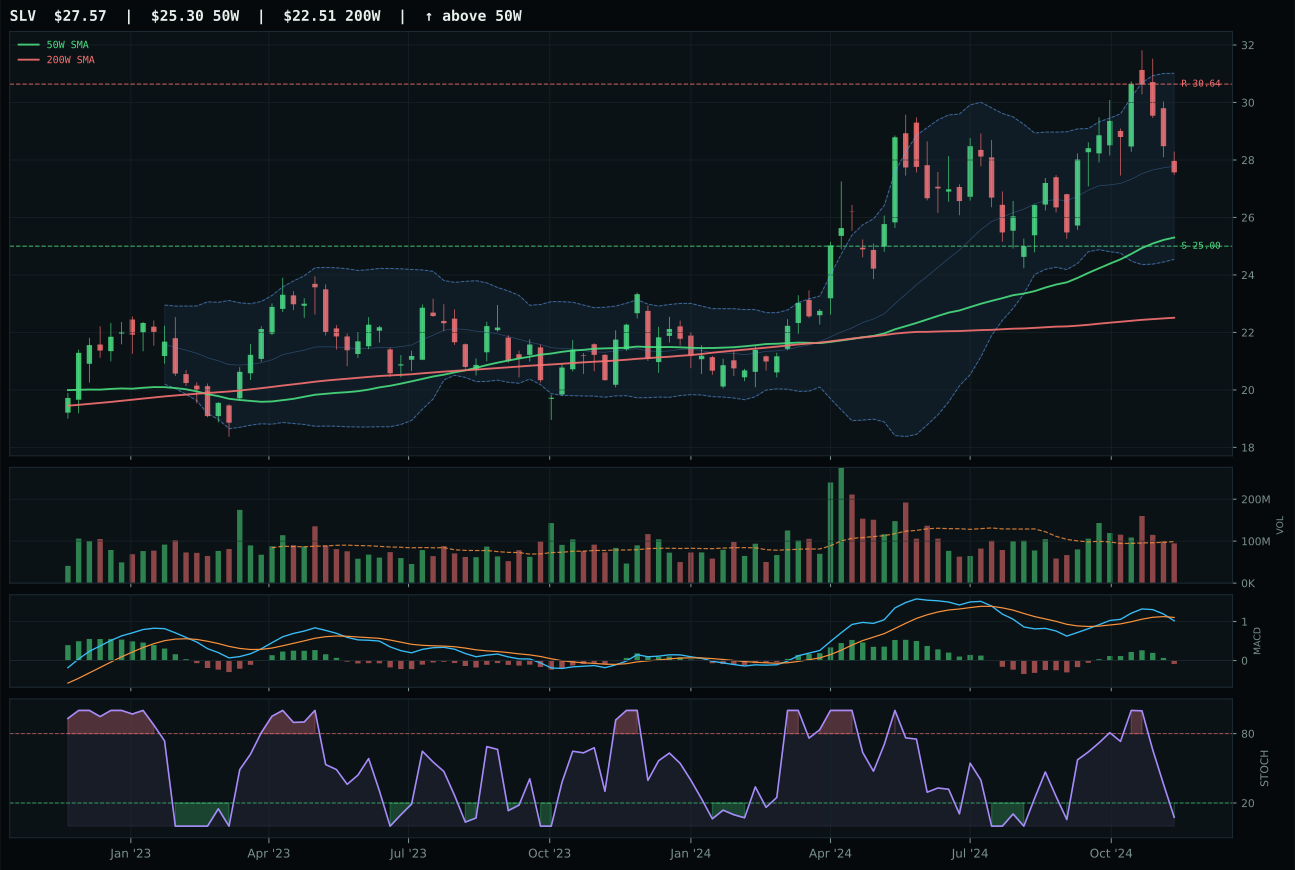
SLV has a neutral structure profile with -1.4% 13-week relative strength versus SPY.
A failed hold above support would weaken the setup.
Actionable but governed by invalidation levels.
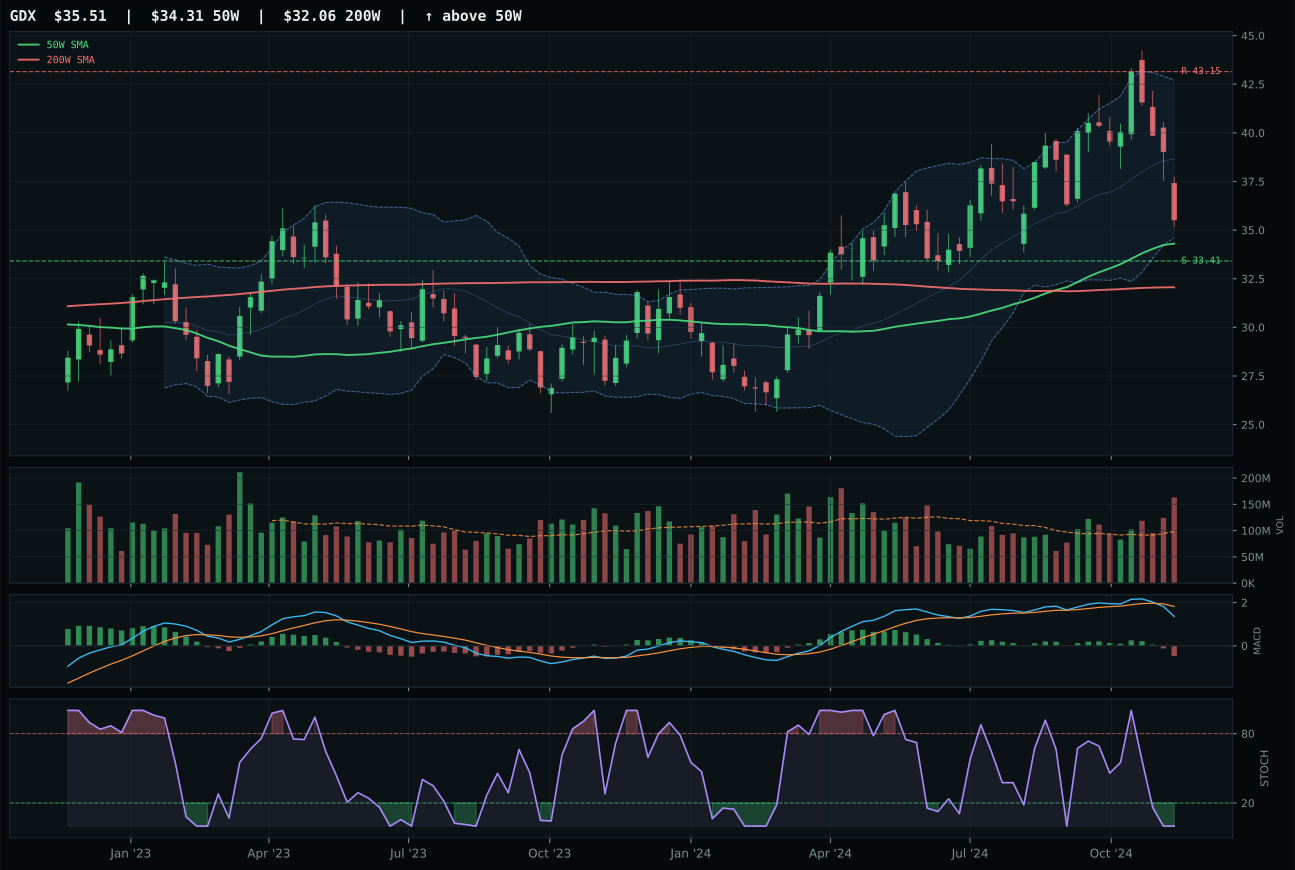
GDX has a neutral structure profile with -13.4% 13-week relative strength versus SPY.
A failed hold above support would weaken the setup.
Actionable but governed by invalidation levels.
GLD wins in a photo finish over SLV because its above-average volume participation at 1.40x confirms accumulation into weakness, whereas SLV's neutral volume leaves the timing more ambiguous. Both names are oversold at stochastic 0.00, both sit in upper retracement zones, and both carry bearish weakening MACD — the category is being bought on technical exhaustion, not fundamental recovery. GLD's 75.8 structure score edges SLV at 66.7 due to superior cleanliness, but the real decision driver is volume: 1.40x average is meaningful participation, while neutral is tentative. The category-relative strength of 0.0% means neither name outperforms its peers, but GLD's institutional footprint is larger and its entrance into the support zone is more credible. This is a support-zone catch, not a trend confirmation.
Precious Metals earned 5% as a defensive sleeve at 49.6/100, outside top-2 but well-positioned in a disinflation regime. Category-level macro fit is 81.0/100—among the strongest in the portfolio—because monetary hedge bid at +14 and disinflation pressure at +6 are structural, not cyclical. The tension is clean: GLD's technical indicators are weak (momentum confirmation at 25.0/100, persistence at 39.5/100), but the macro conviction is so strong that weak technicals are actually a feature, not a bug—they confirm that the move is structural accumulation rather than retail euphoria. Downside to support is 11.8%, providing defined risk. The category's role is to steadily migrate capital into monetary hedges as real rates compress and central banks eventually acknowledge disinflationary pressure. This is a six-to-twelve month view, not a two-week trade. If disinflation pressure reverses or risk appetite suddenly recovers sharply, GLD would underperform, but the 5% allocation risk cap is built into the 5% position size.
Defense & Aerospace — XAR
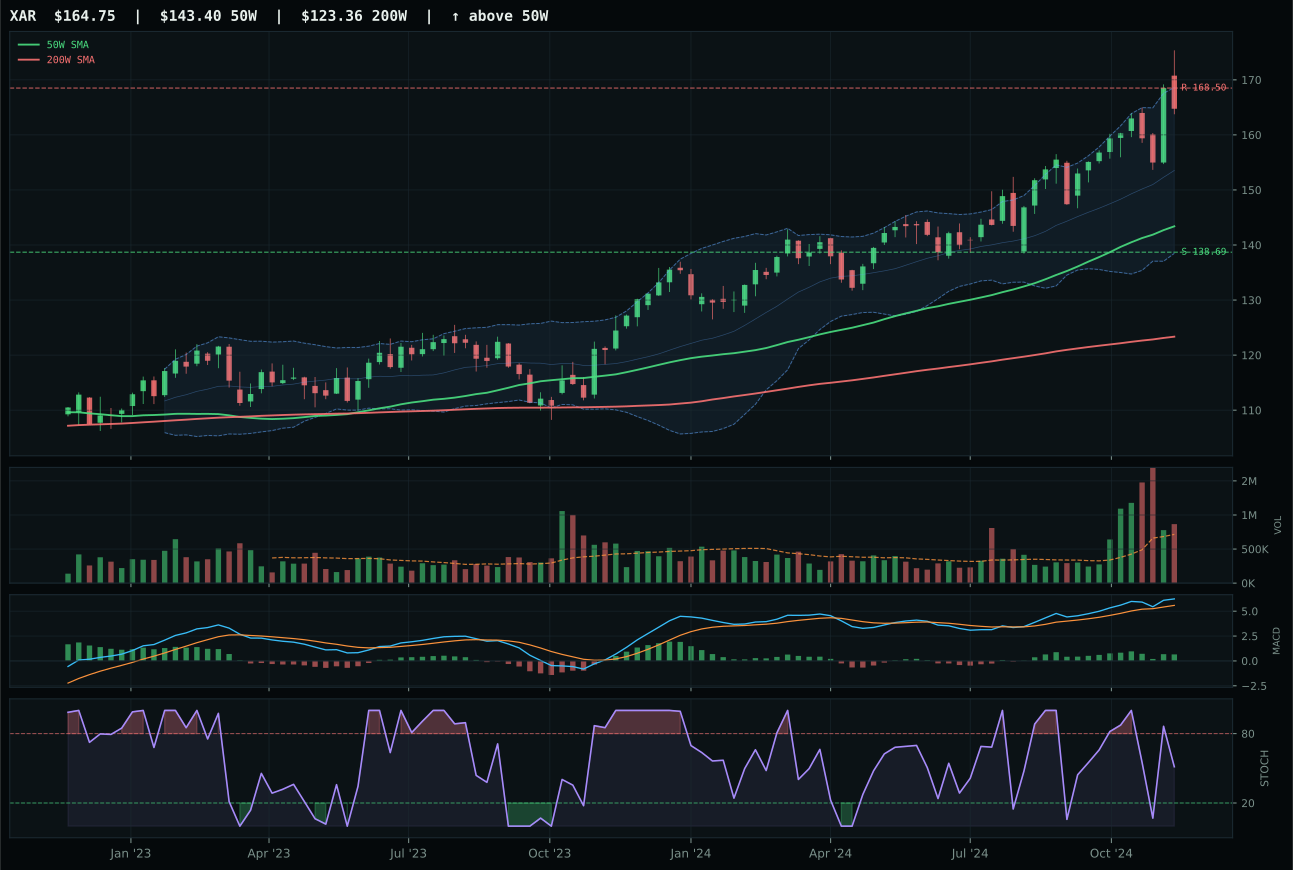
XAR has a neutral structure profile with 2.9% 13-week relative strength versus SPY.
A failed hold above support would weaken the setup.
Actionable but governed by invalidation levels.
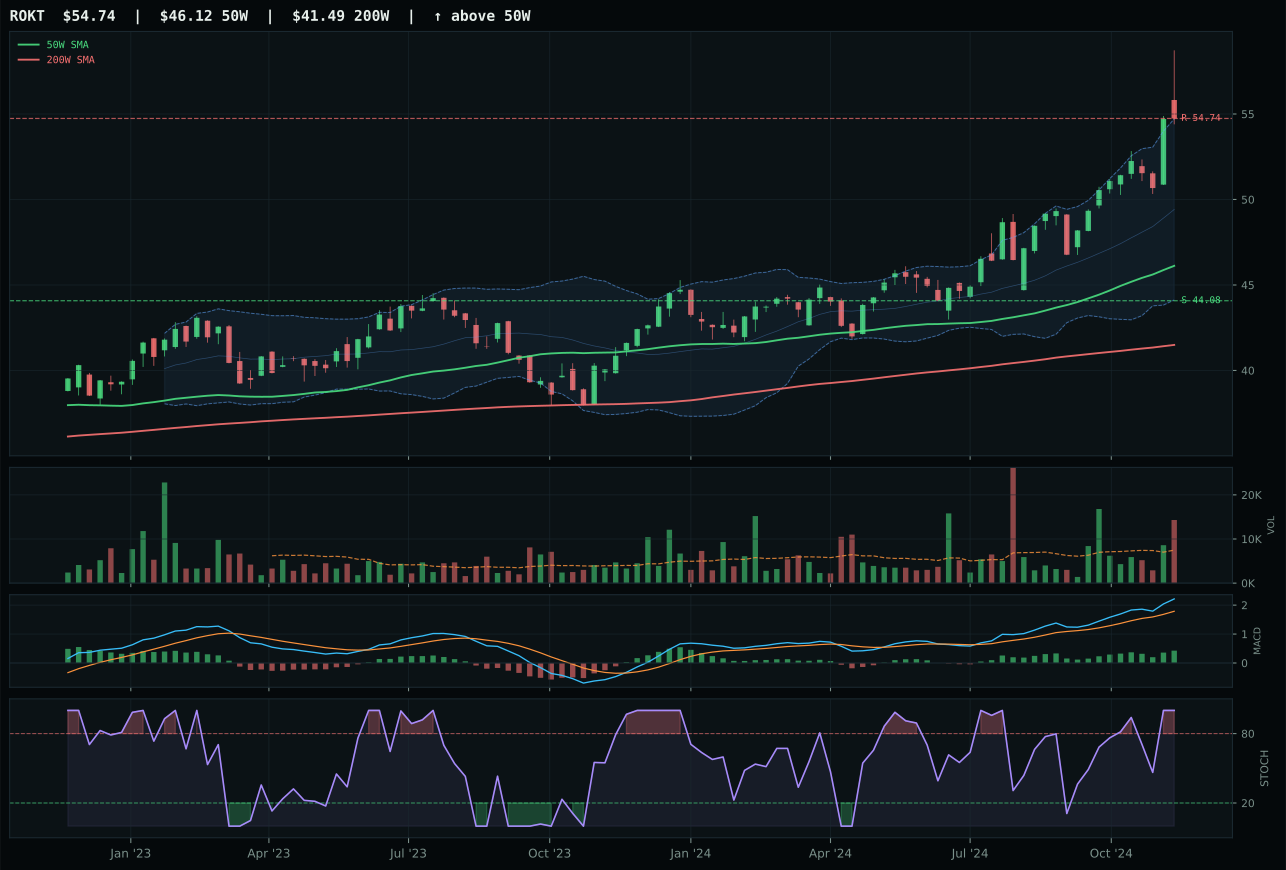
ROKT has a vertical extension profile with 7.3% 13-week relative strength versus SPY.
A failed hold above support would weaken the setup.
Tracked, but not top-2 eligible because: .
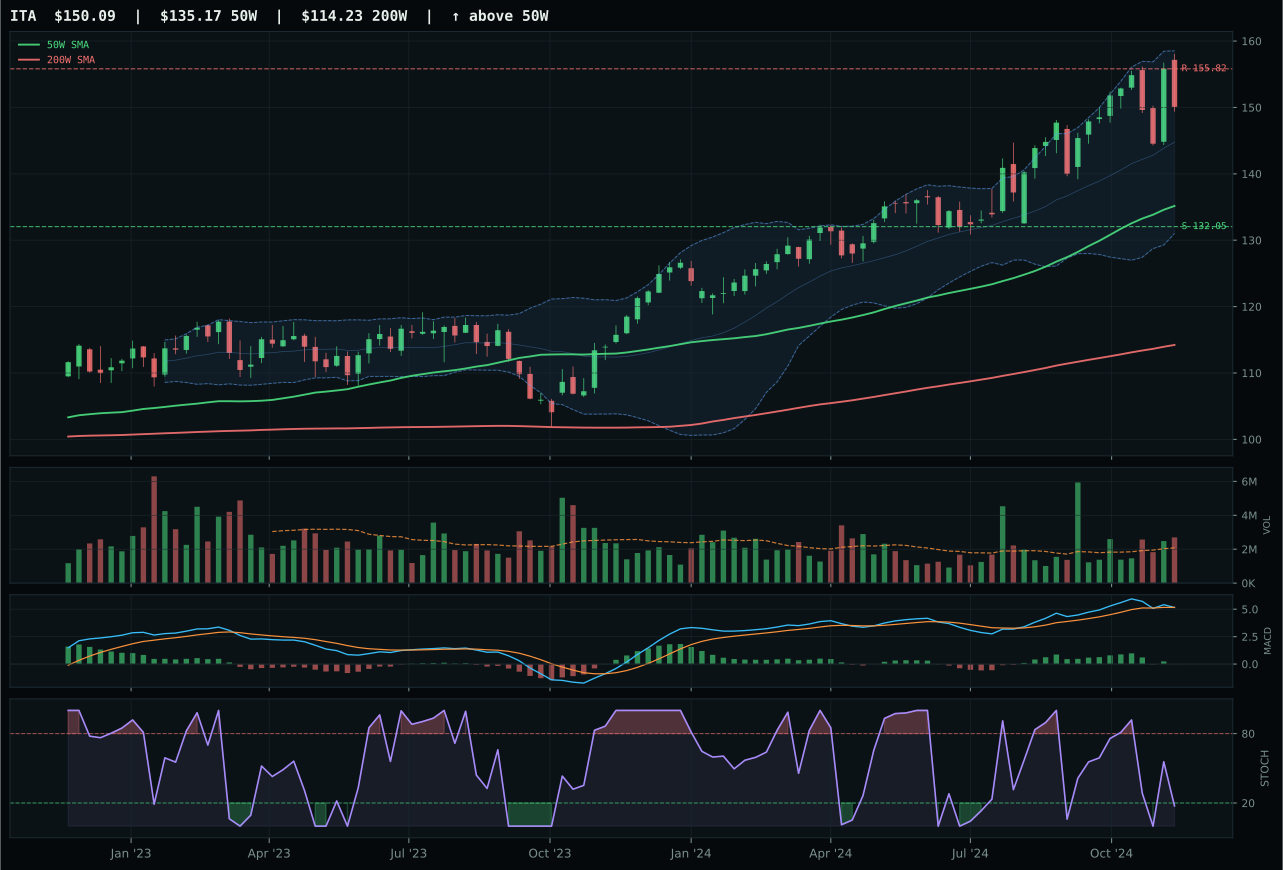
ITA has a neutral structure profile with -1.4% 13-week relative strength versus SPY.
A failed hold above support would weaken the setup.
Actionable but governed by invalidation levels.
XAR wins because its neutral structure and steady 8.6% thirteen-week return reflect accumulation without overheat, positioning it as the category consensus builder. A trend score of 100/100 anchors the decision, but the real differentiator is timing at 70/100: price sits 14.9% above the 50W with MACD flattening and stochastic RSI falling, which means the early buyers are de-risking while new accumulation is quiet. ROKT lost despite bullish improving MACD and overbought stochastic RSI momentum because timing collapsed to 45/100 — that setup is extended and exhausted, not fresh. XAR's above-average volume participation at 1.21x gives the move weight without the urgency of distribution pressure. The category is steady, not explosive.
Defense & Aerospace earned 5% as a tactical ballast holding, ranked below the top two but still in the eligible band at 45.2/100. Macro fit is neutral because no category-specific descriptor is available, but broad market bear at +6 and dollar pressure at +3 suggest geopolitical risk premium is embedded in the narrative. Credit stress at +2 and liquidity stress at -4 create a balanced macro setup that is neither strong nor weak. The category's role is to capture a defined rotation into defensive, non-discretionary capex (military/aerospace spending) without overstaying into an extended move. XAR's 2.9% relative strength is disciplined, not explosive, and the -2.2% upside to resistance means the next move is either a pullback or a grinding grind. The 18.8% downside to support gives risk managers a clear floor. If broad market bear intensifies or geopolitical headlines spike, this position would likely perform; if risk appetite suddenly recovers, it will underperform quietly and orderly.
Traditional Energy — XLE
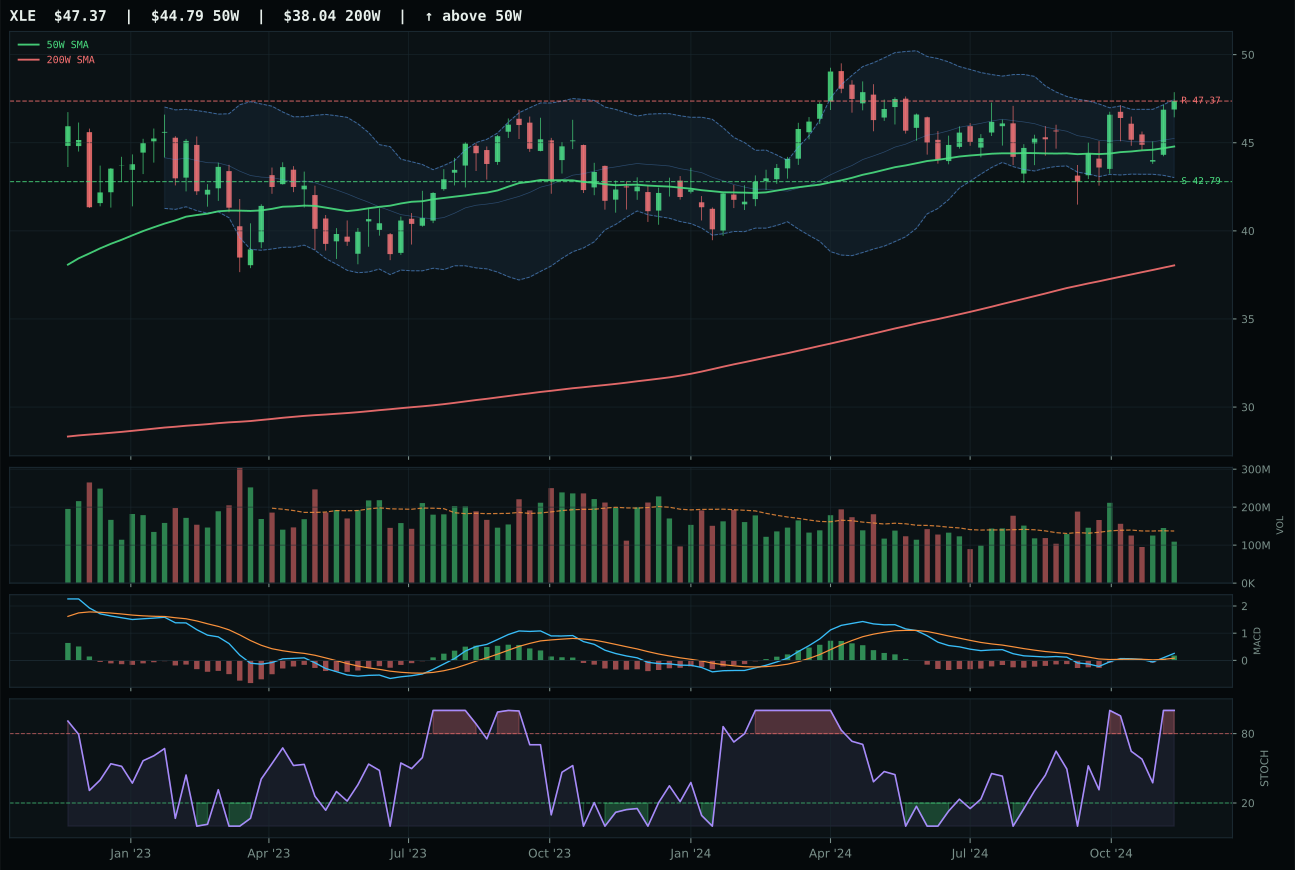
XLE has a neutral structure profile with -1.0% 13-week relative strength versus SPY.
A failed hold above support would weaken the setup.
Actionable but governed by invalidation levels.
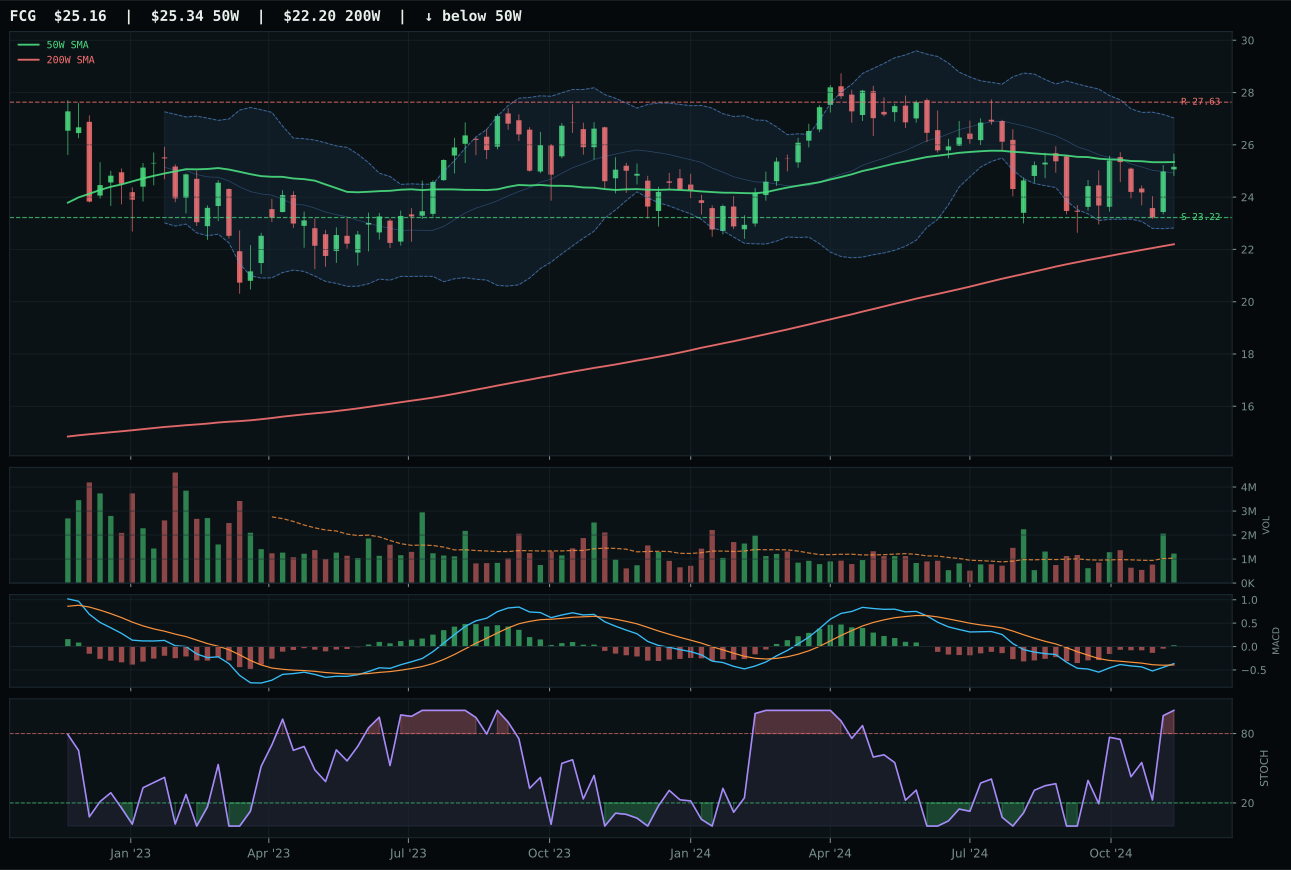
FCG has a compression near 50W profile with -5.9% 13-week relative strength versus SPY.
A failed hold above support would weaken the setup.
Actionable but governed by invalidation levels.
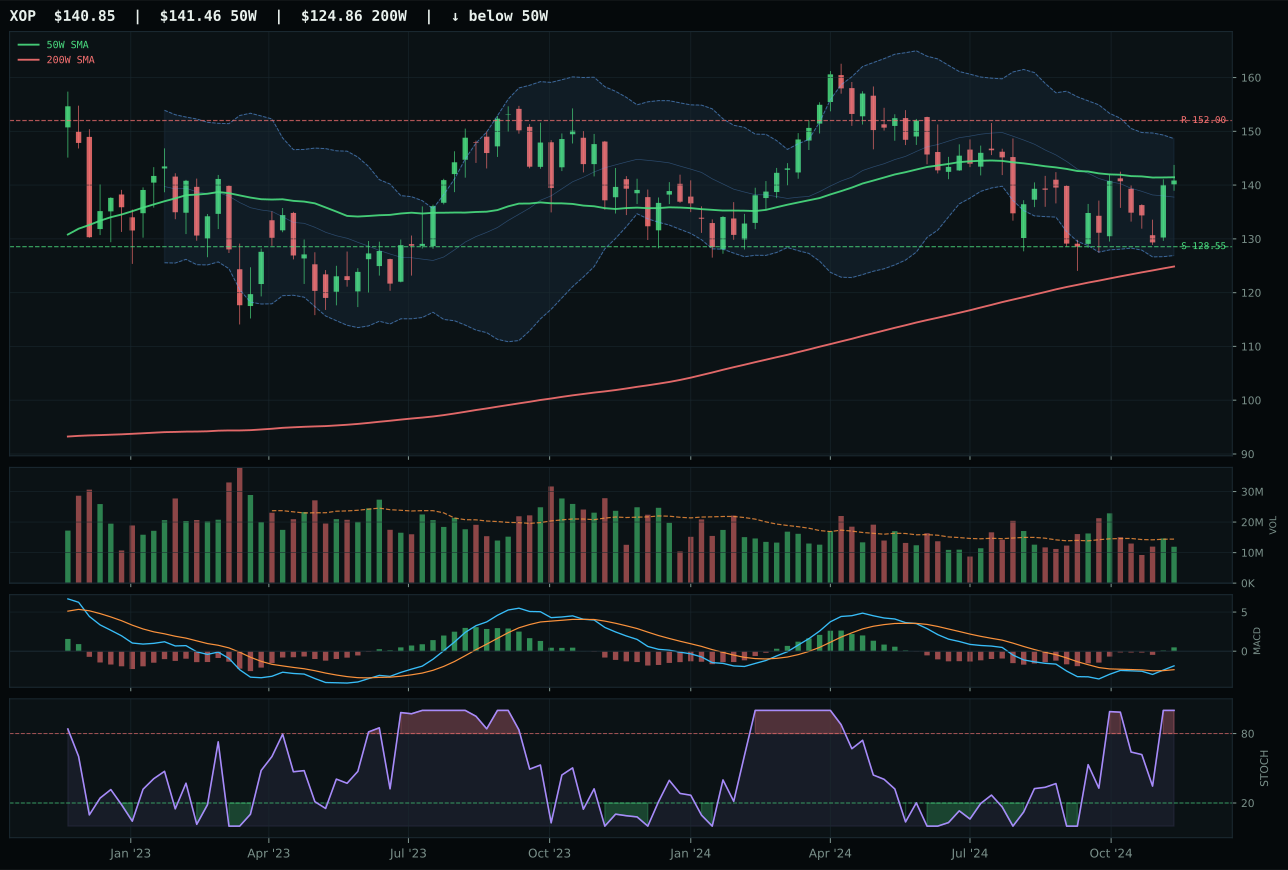
XOP has a compression near 50W profile with -4.6% 13-week relative strength versus SPY.
A failed hold above support would weaken the setup.
Actionable but governed by invalidation levels.
XLE wins on relative strength and cleaner structural progression: its 3.6% category edge and -1.0% SPY underperformance frame a name that's favored by peers despite broad market skepticism. FCG lost despite identical MACD and stochastic RSI signals because category-relative strength lagged at -1.3%, signaling that the sector's rally is not uniform. XLE's 98.6 trend score reflects consistent setup above both moving averages with improving MACD and overbought stochastic RSI at 1.00, creating a traditional momentum extension. The setup is stretched — 5.9% from the 50W — but volume at 0.80x average shows disciplined participation, not panic buying. FCG's above-average participation reads as desperation, not confidence. Energy scarcity narratives are pricing differently across the basket, and XLE holds the leadership position.
Traditional Energy earned 5% despite a category score of 33.8/100, outside top-2 but held for energy scarcity narrative (+14 macro bid) that disinflation has not yet killed. The tension is real: disinflation pressure is -10 headwind, but energy scarcity at +14 means market is pricing structural supply constraints despite near-term demand weakness. This is a regime-dependent position. Credit stress at -7 and liquidity stress at -7 are active headwinds, but XLE's dividend yield and integrated cash flow defense make it less vulnerable to capital strikes. The category's role is to capture energy supply premium without taking directional upstream leverage. If energy scarcity headlines reverse (OPEC cuts acceleration, new supply comes online) or crude WTI breaks below key support, the position is revisited. If recession accelerates and energy demand collapses faster than supply, XLE underperforms quickly. The 5% allocation reflects a measured bet that integrated energy durability is underpriced relative to the cost-of-capital for exploration. This is the most macro-conflicted position in the portfolio.
Technology — IGV
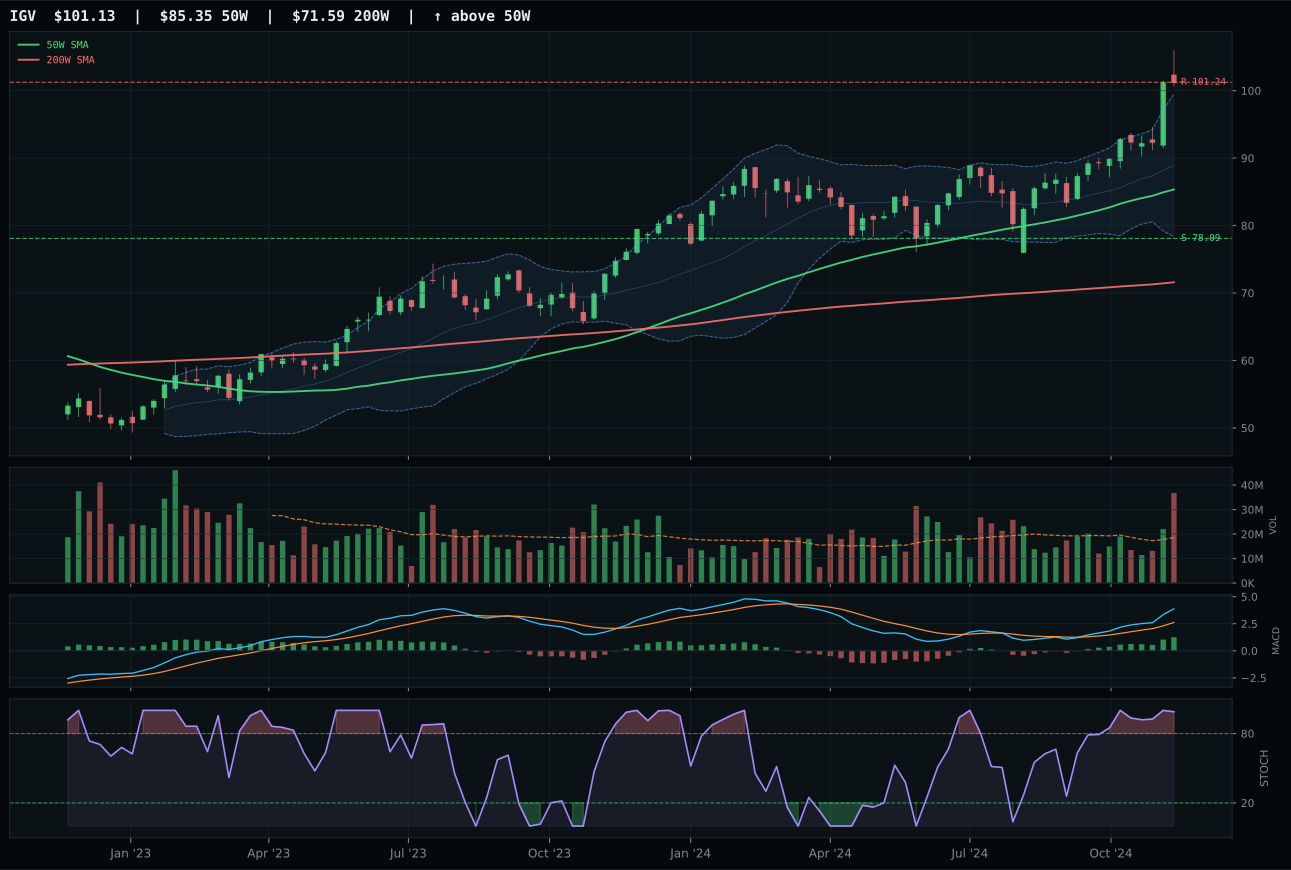
IGV has a vertical extension profile with 12.6% 13-week relative strength versus SPY.
A failed hold above support would weaken the setup.
Actionable but governed by invalidation levels.
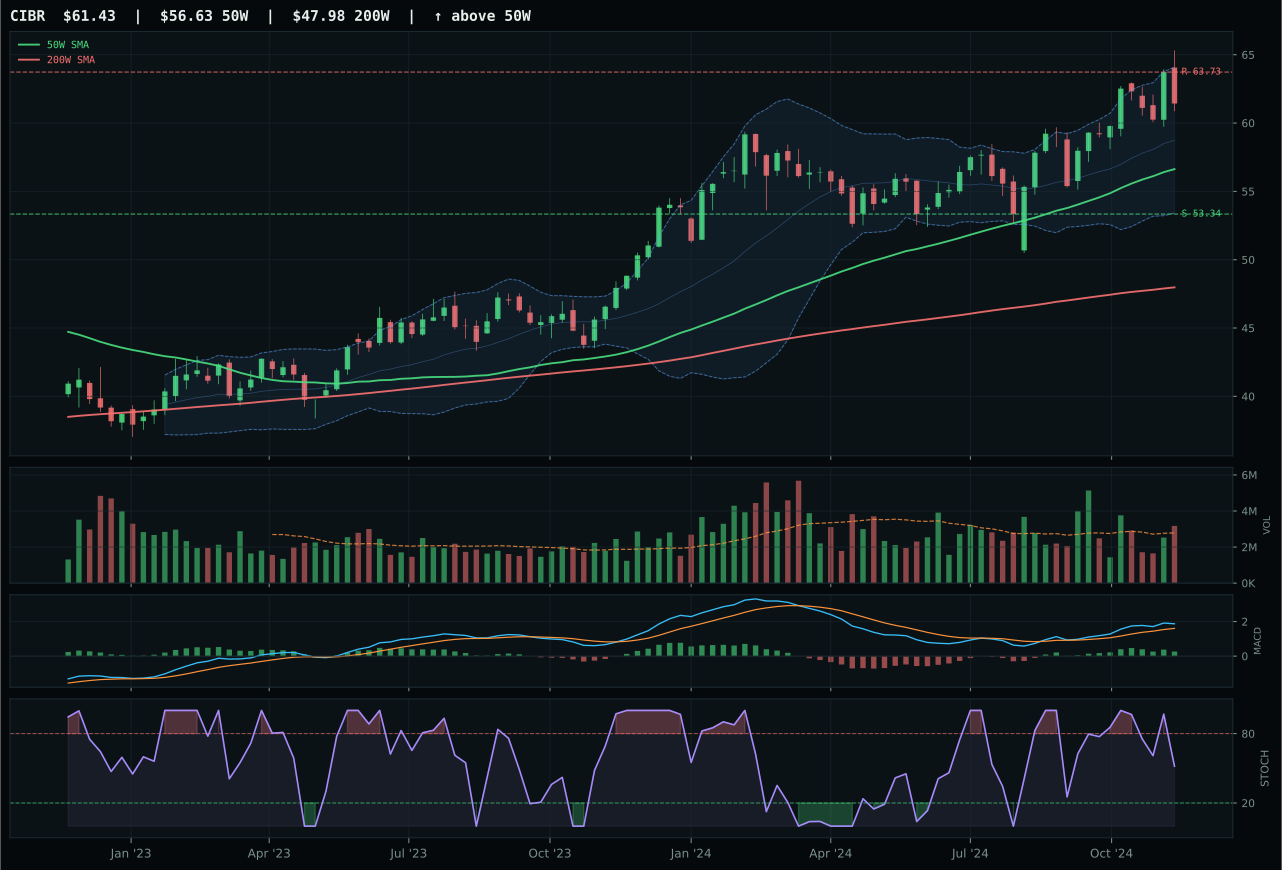
CIBR has a neutral structure profile with 0.6% 13-week relative strength versus SPY.
A failed hold above support would weaken the setup.
Actionable but governed by invalidation levels.
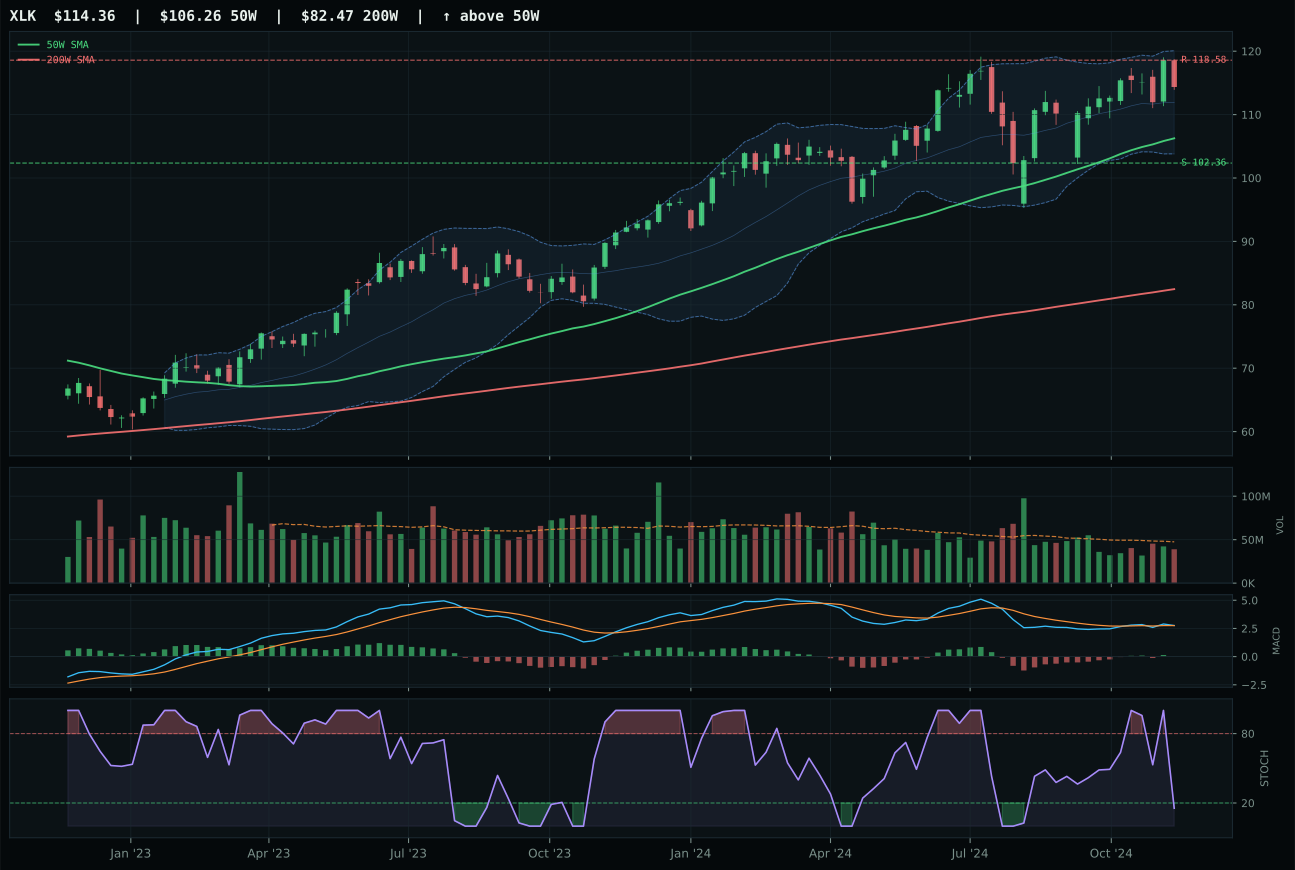
XLK has a neutral structure profile with -2.4% 13-week relative strength versus SPY.
A failed hold above support would weaken the setup.
Actionable but governed by invalidation levels.
IGV wins the category because its 12.6% outperformance versus SPY combined with a 12.0% category edge reflects real accumulation into a name that's cleanly above both the 50W and 200W. The chart sits 18.5% extended from the 50W, which ordinarily signals entry risk, but MACD is improving and stochastic RSI confirms overbought momentum at 0.99 — meaning momentum participants are still adding, not fleeing. CIBR lost ground despite a bullish MACD because its momentum profile flattened instead of improving, category relative strength stayed flat at 0.0%, and its 0.6% SPY edge doesn't justify the allocation framework's capital demand. The setup is a vertical extension that favors the leader inside the basket; late entry is the price of owning the strongest technician.
Technology earned 5% as a tactical sleeve precisely because IGV's strength is real but timing is asymmetrical. The category scored 40.4/100, ranking fourth or fifth among the ten categories this week, well below the inflation-adjusted bar for top-2 consideration. Disinflation is mechanically friendly to high-duration growth, a +7 tailwind, but three active headwinds—liquidity stress at -10, credit stress at -7, and dollar pressure at -5—are dampening the macro fit to 40.0/100. The setup works for a defined position, not a core allocation. IGV's 29.5% downside to support and 100% trend score give the position clear invalidation levels that risk management can monitor. This is a "prove it again" category: if MACD flattens or volume rolls over, the 5% comes straight out.
Agriculture & Livestock — MOO
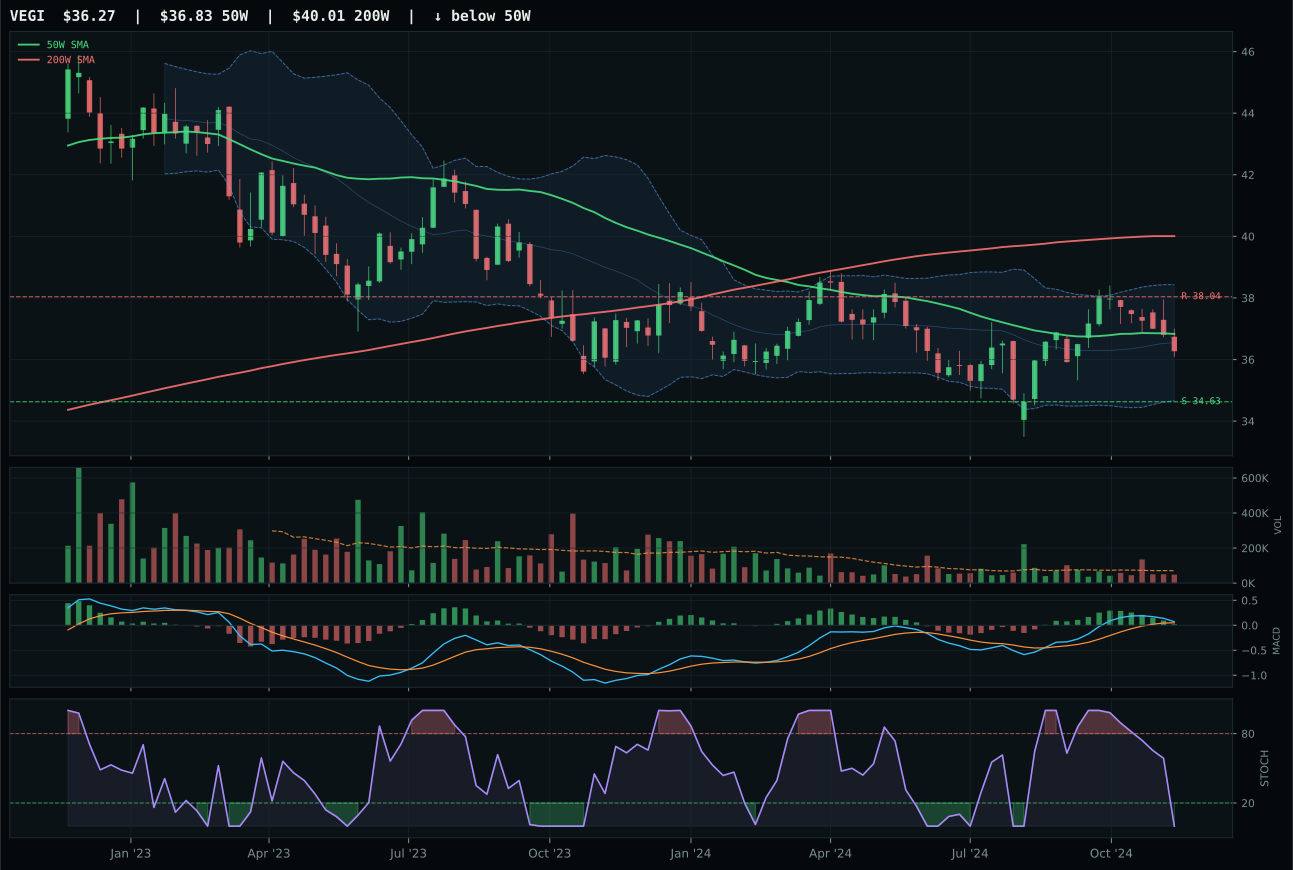
VEGI has a pullback into support profile with -4.8% 13-week relative strength versus SPY.
Extension and support failure are the main tactical risks.
Tracked, but not top-2 eligible because: structurally broken.
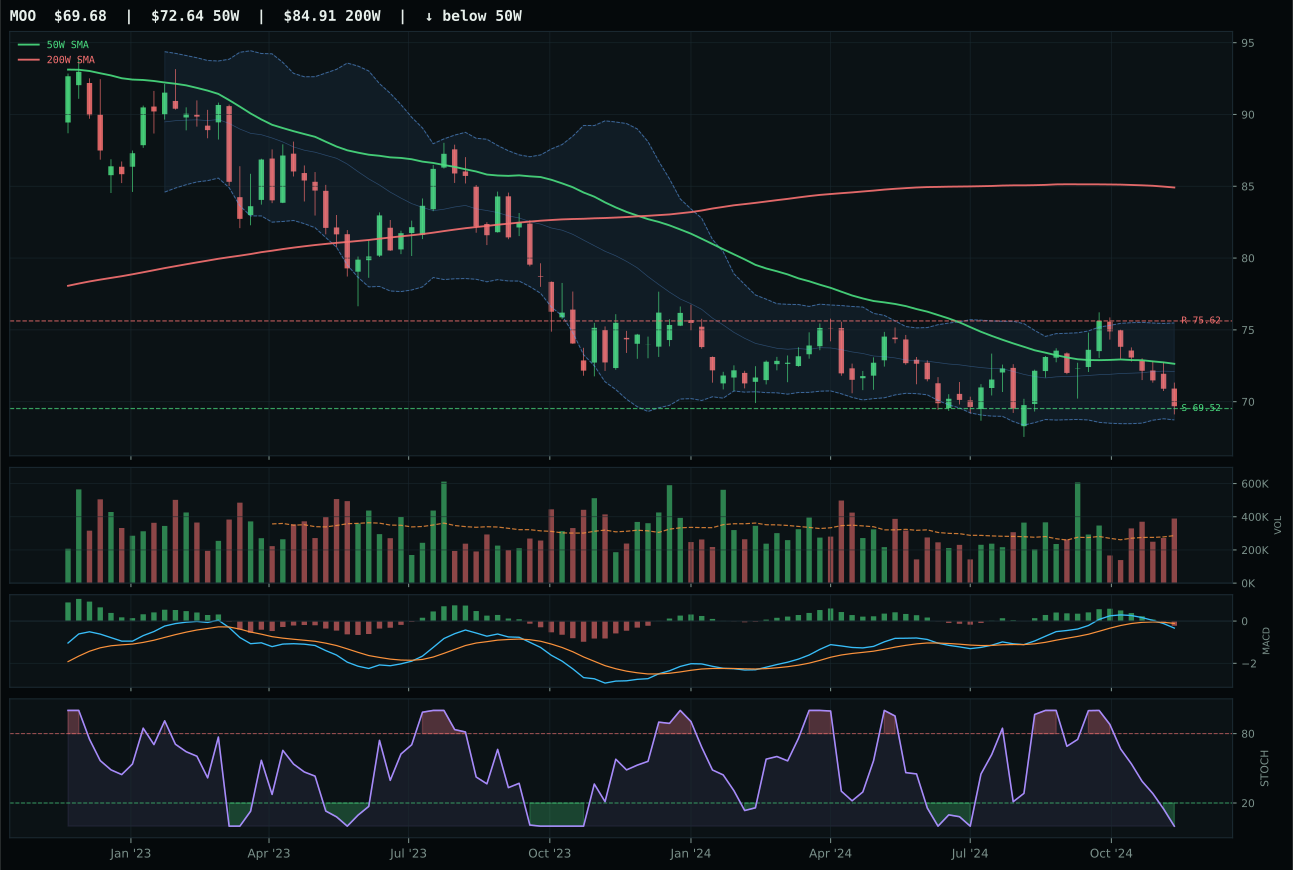
MOO has a pullback into support profile with -9.1% 13-week relative strength versus SPY.
Extension and support failure are the main tactical risks.
Tracked, but not top-2 eligible because: structurally broken.
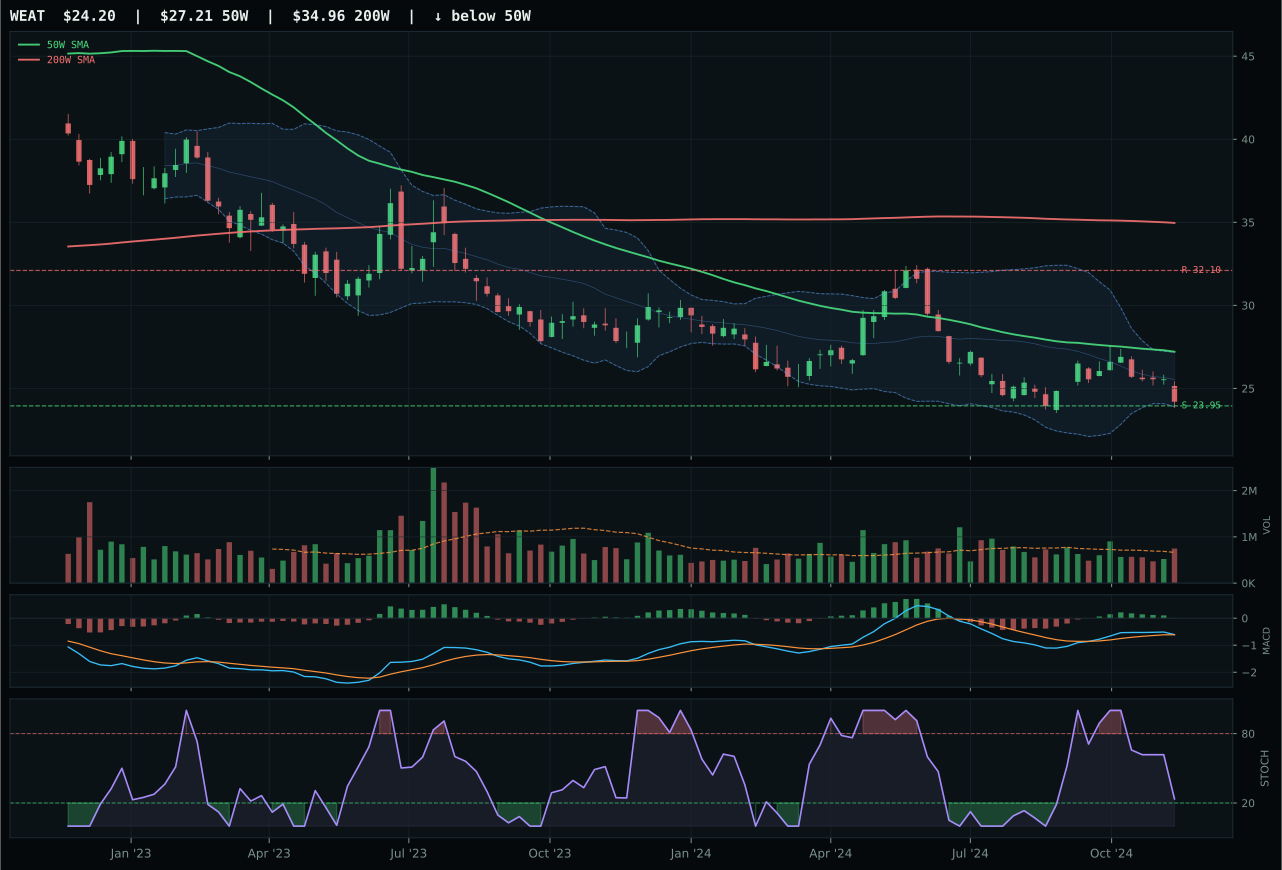
WEAT has a pullback into support profile with -8.1% 13-week relative strength versus SPY.
Extension and support failure are the main tactical risks.
Tracked, but not top-2 eligible because: structurally broken.
MOO wins by default but with structural caveats: the category is ineligible for larger allocation because the entire basket is broken below the 50W with bearish weakening MACD and oversold stochastic RSI. MOO edges VEGI because its risk/reward is superior at 90/100 — downside to support is only 0.2% — despite the worst momentum score in the category at 11.6/100. Volume at 1.36x shows above-average participation into the lows, which is ambiguous: it could signal capitulation or distribution. VEGI's thin participation and 70.7 risk/reward lose the coin flip. Neither name is attractive; this is a choice between two weak hands. The timing score of 95/100 across both candidates reflects how oversold the sector has become, not confidence in immediate reversal.
Agriculture & Livestock earned 5% despite an eligible flag of False and a category score of exactly 0.0/100, meaning this allocation is technical tactical, not macro justified. The reasoning is brutally simple: MOO is oversold at a defined support level and offers asymmetric risk/reward into a retest. However, the category ranked 9th or 10th precisely because disinflation pressure is a -8 headwind (commodities collapse when deflation accelerates), liquidity stress at -4 is draining speculative flows, and the macro fit is 32.0/100. This is a time-stamped, sub-two-week trade, not a strategic position. If support at 69.52 breaks, the 5% exits immediately. If support holds and volume begins accumulating on any bounce toward 75.62 resistance, PAVE would likely cannibalize this sleeve first, as infrastructure capex is more durable than commodity demand in a disinflation regime. The allocation exists only because risk/reward is so asymmetric that even a low-probability hold can justify a small position.
Industrial Metals — COPX
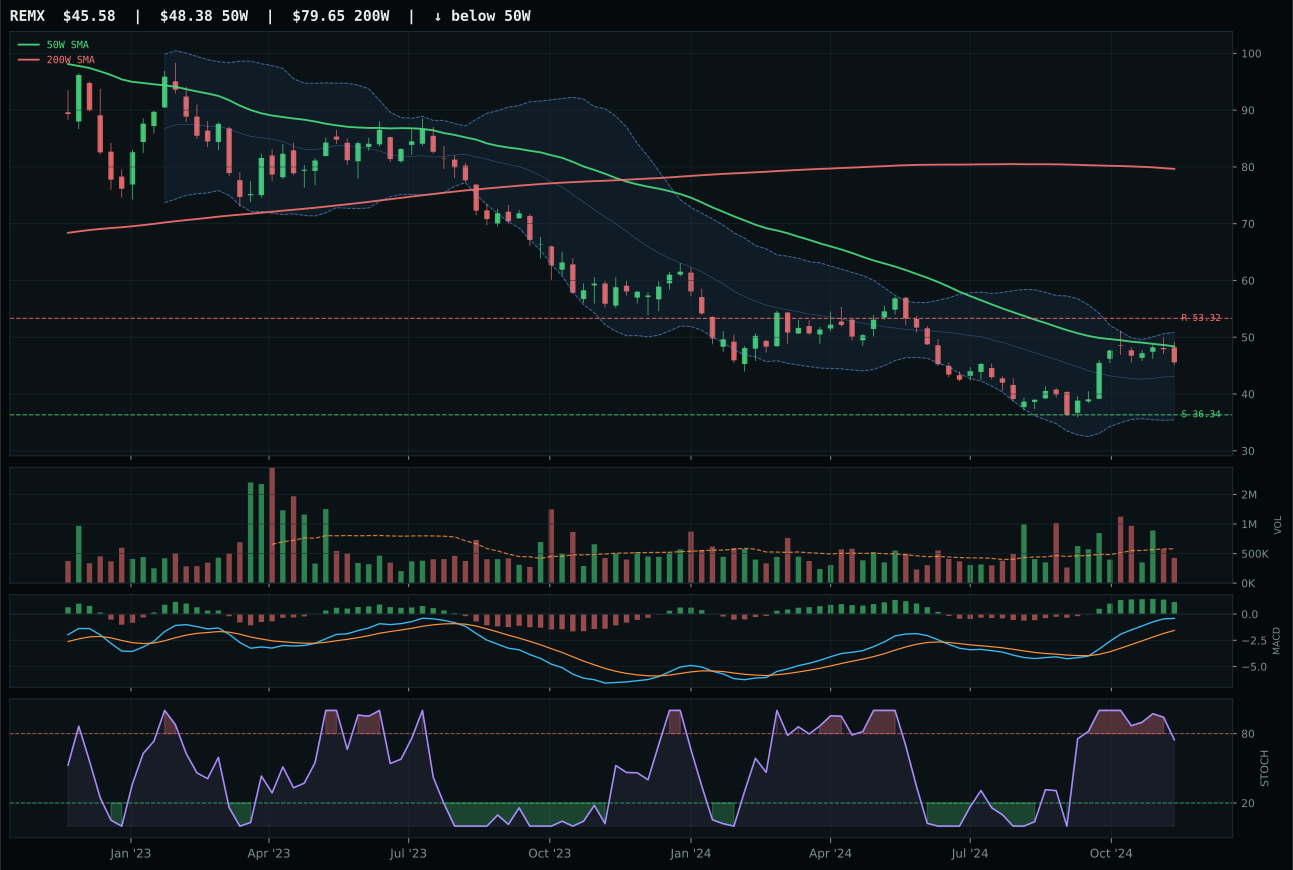
REMX has a neutral structure profile with 11.3% 13-week relative strength versus SPY.
Extension and support failure are the main tactical risks.
Tracked, but not top-2 eligible because: structurally broken.
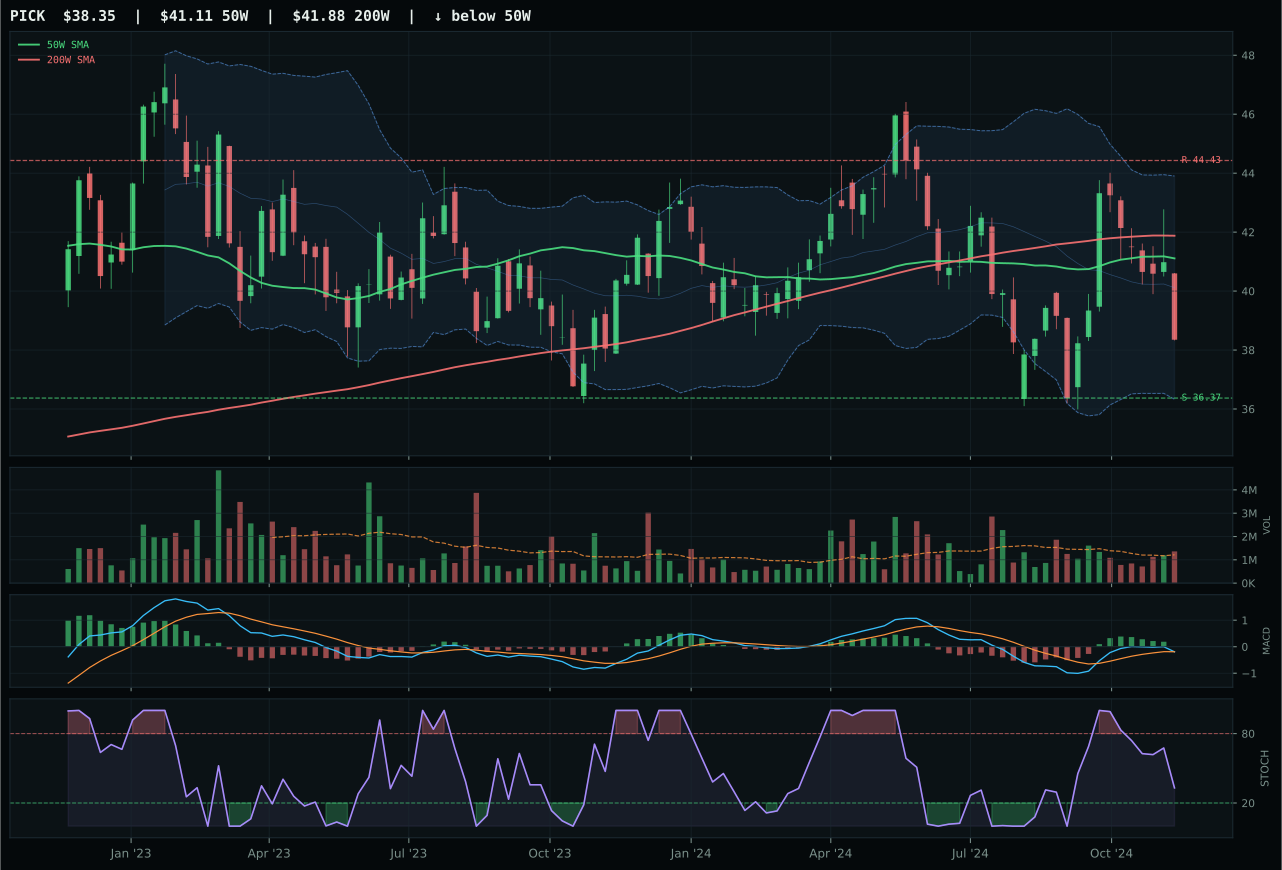
PICK has a neutral structure profile with -5.8% 13-week relative strength versus SPY.
Extension and support failure are the main tactical risks.
Tracked, but not top-2 eligible because: structurally broken.
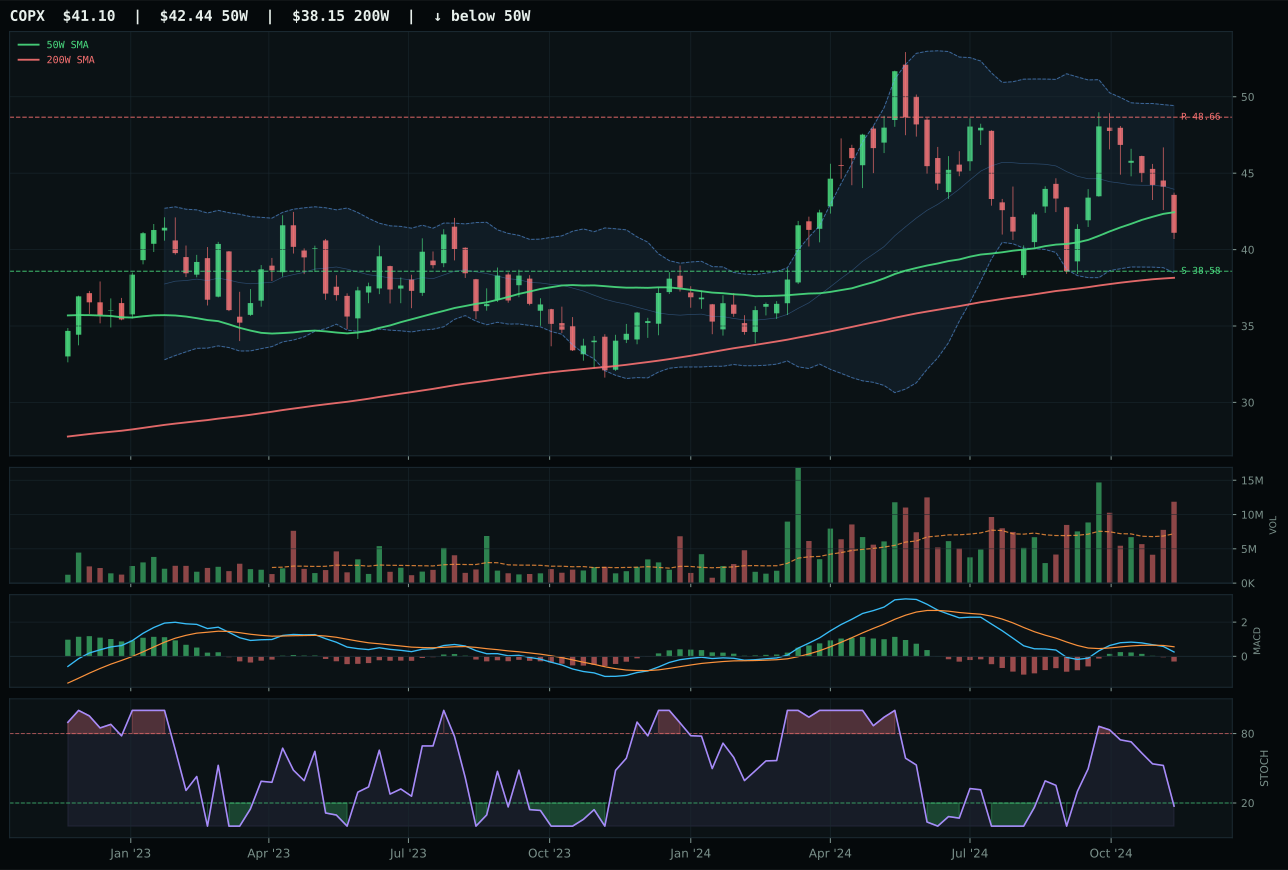
COPX has a neutral structure profile with -8.5% 13-week relative strength versus SPY.
A failed hold above support would weaken the setup.
Actionable but governed by invalidation levels.
COPX wins by surviving the hardest filters rather than winning on merit. The category is structurally broken with every name below the 50W, and COPX's 0.0 momentum confirmation score reflects -10.3% four-week drawdown and bearish weakening MACD. It beats REMX and PICK because its timing score of 92/100 captures the deepest oversold setup at Fibonacci 0.618, creating the largest potential rebound if demand revives. Distribution pressure at 1.65x suggests sellers exhausting, not buyers accumulating — the 87.8 risk/reward is mechanical, not qualitative. REMX's superior relative strength at 11.3% and bullish flattening MACD would normally dominate, but the structure filter overrides: REMX is neutral structure, COPX at least shows capitulation geometry.
Industrial Metals earned 5% despite a 0.0/100 category score and failed eligibility because COPX's support setup is too asymmetric to ignore entirely. However, this allocation is pure tactical and carries a hard stop. Liquidity stress at -8, credit stress at -7, and dollar pressure at -7 total -22 headwinds, and macro fit is 28.0/100—the weakest in the portfolio. Copper demand thesis is reflexively linked to growth, and in a disinflation regime, growth expectations are compressing, not expanding. This sleeve exists for exactly one reason: COPX is within 6.5% of defined support and the reward-to-risk ratio justifies a small position betting on a retest bounce. The moment support at 38.58 breaks, the position exits. If support holds and volume begins accumulating through 48.66 resistance, the position would be reconsidered, but that would require a macro regime shift (risk appetite recovery or Fed pivot confirmation). As written, this is a two-to-three-week tactical trade masquerading as an allocation.
AI — BOTZ
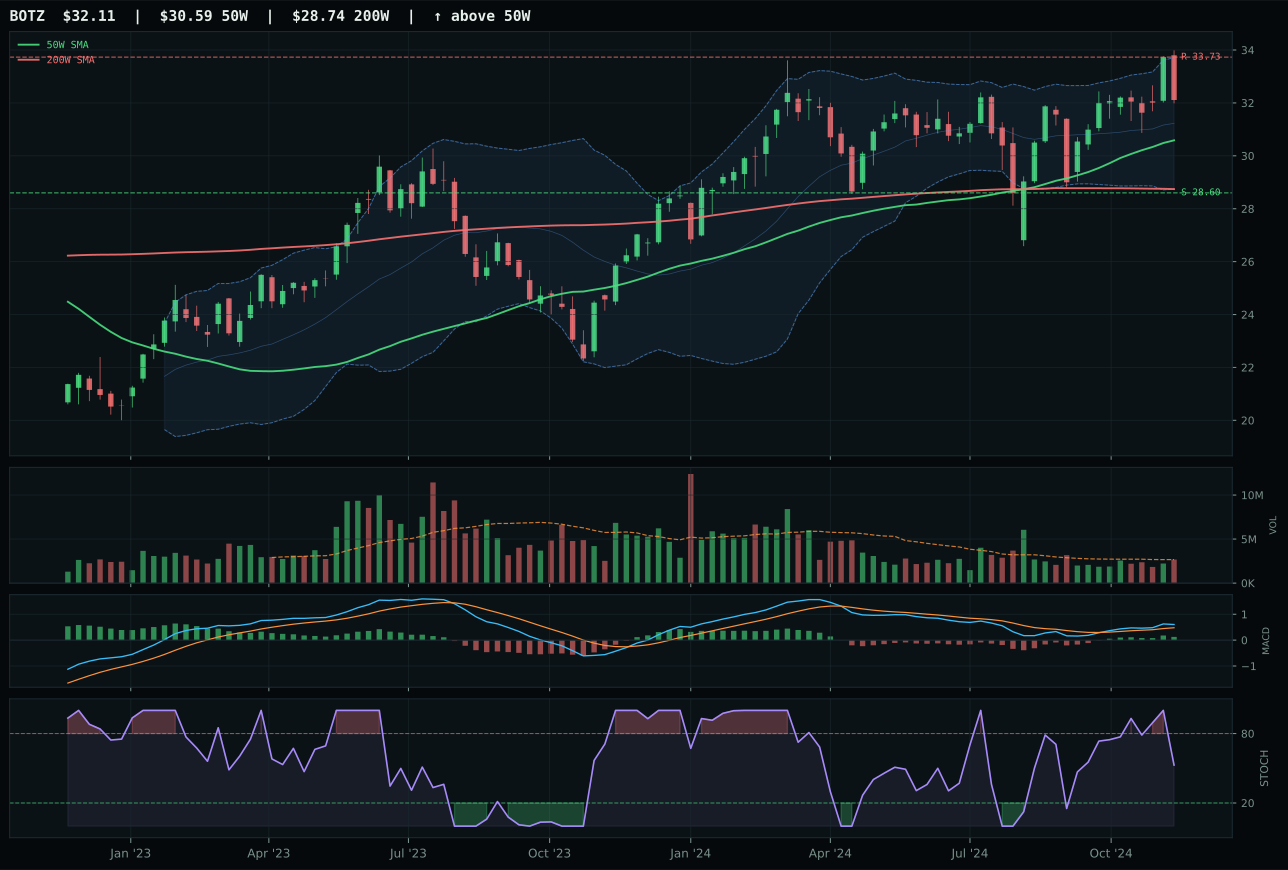
BOTZ has a neutral structure profile with -0.4% 13-week relative strength versus SPY.
A failed hold above support would weaken the setup.
Actionable but governed by invalidation levels.
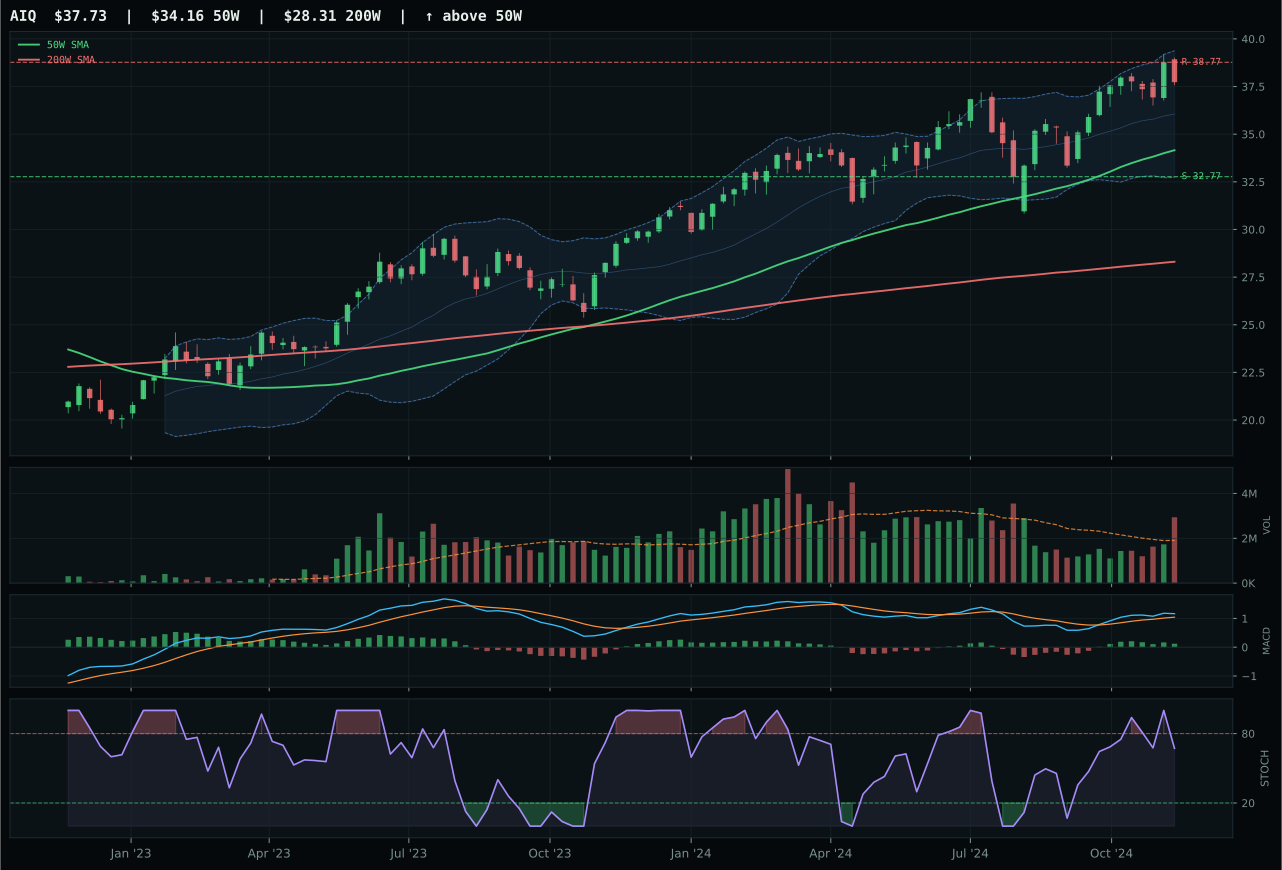
AIQ has a neutral structure profile with 1.6% 13-week relative strength versus SPY.
A failed hold above support would weaken the setup.
Actionable but governed by invalidation levels.
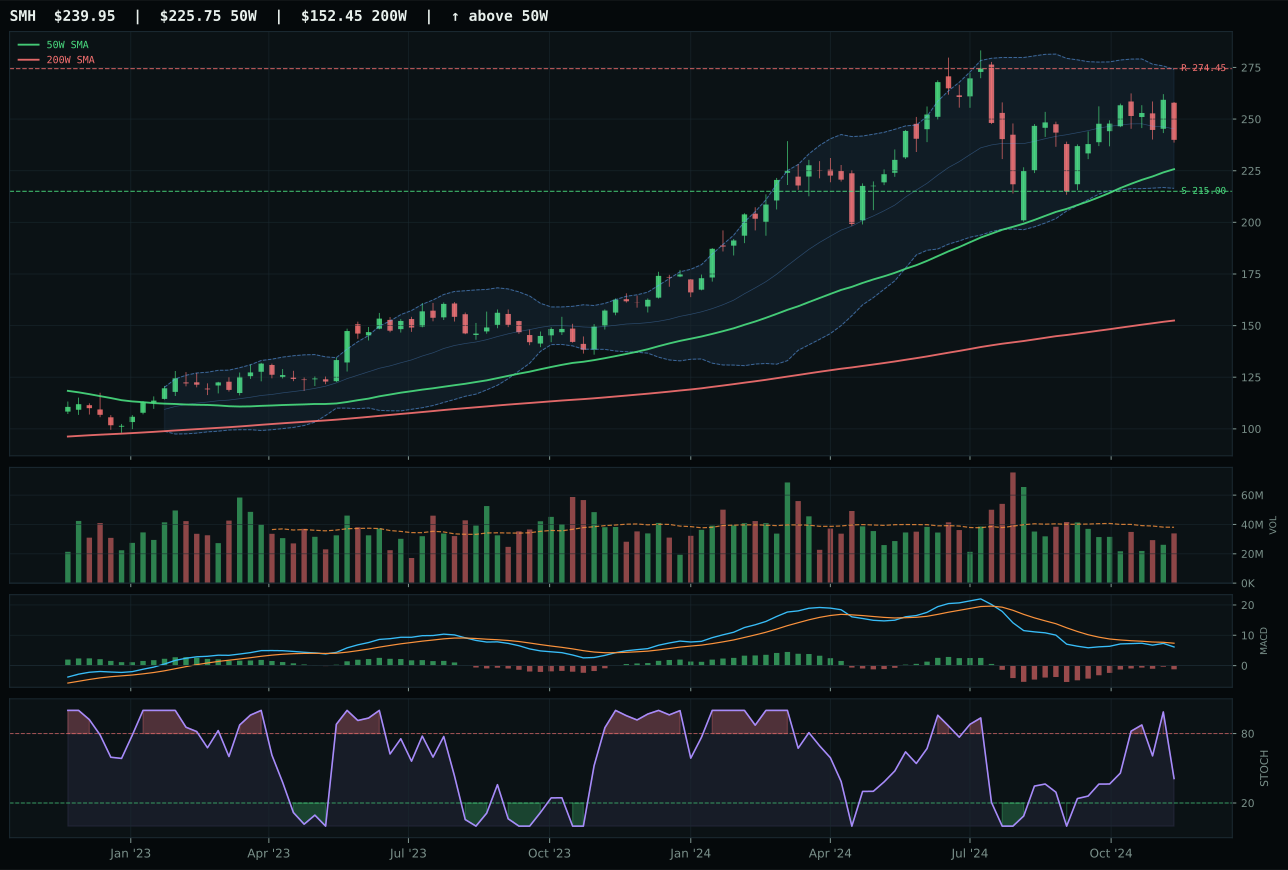
SMH has a neutral structure profile with -8.4% 13-week relative strength versus SPY.
A failed hold above support would weaken the setup.
Actionable but governed by invalidation levels.
BOTZ wins by trading aggressiveness for precision: its timing score of 90/100 reflects a 5.0% proximity to the 50W with MACD improving and stochastic RSI at neutral 0.53, creating a low-risk entry window with defined support at 28.60. AIQ lost the decision despite a 7.2% thirteen-week return because it's 10.5% extended from the 50W, its MACD flattened instead of improved, and distribution pressure at the lows signals sellers, not buyers. The category-relative strength is essentially flat across both names, so the tiebreaker is entry quality: BOTZ offers a fresh pullback into support, while AIQ is stretched and volume-confirmed higher. Robotics cyclicality and physical AI demand are sound macro calls, but chart geometry matters more than narrative.
AI earned 0% allocation and ranked 9th or 10th because the category score collapsed to 22.8/100 after the macro filter was applied. The technical evidence is decent at 75.0/100 for BOTZ, but macro/narrative fit at 31.0/100 guts any case for capital deployment. Three simultaneous stresses—liquidity, credit, and risk appetite—are all negative double-digit headwinds, and disinflation's +5 help does nothing to offset a -29 delta from macro headwinds. The category is trapped: BOTZ's 19.7% 26-week return looks strong in isolation, but it came before the macro regime shifted, and forward guidance is deteriorating. The setup has no redemption condition at current prices. To earn reallocation, AI needs either macro capitulation (a risk appetite reset that reopens the reflexivity trade) or technical validation (BOTZ breaking above 33.73 resistance with volume confirmation), neither of which appears imminent in a disinflation regime where duration compression is the only story.
Emerging Markets — INDA
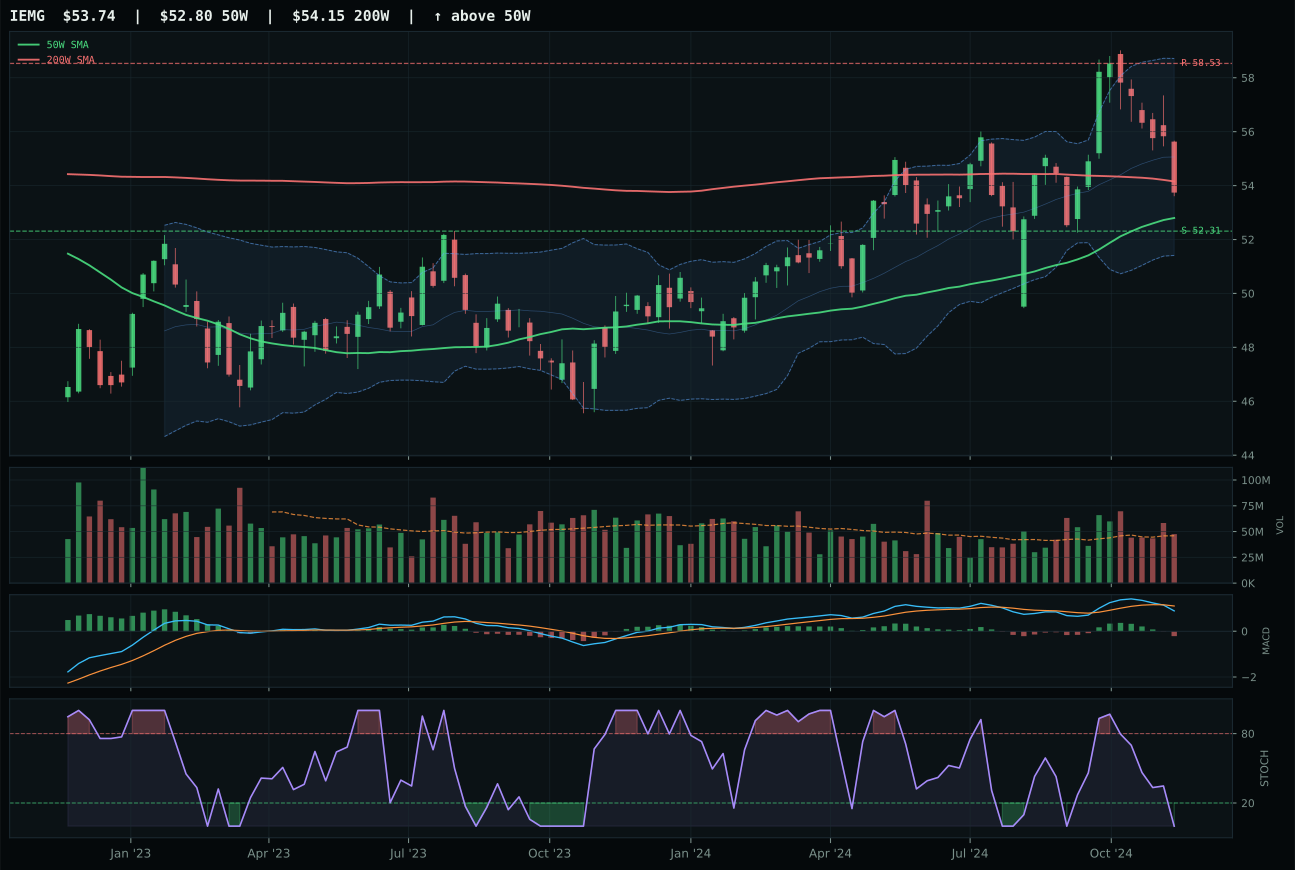
IEMG has a pullback into support profile with -6.9% 13-week relative strength versus SPY.
A failed hold above support would weaken the setup.
Actionable but governed by invalidation levels.
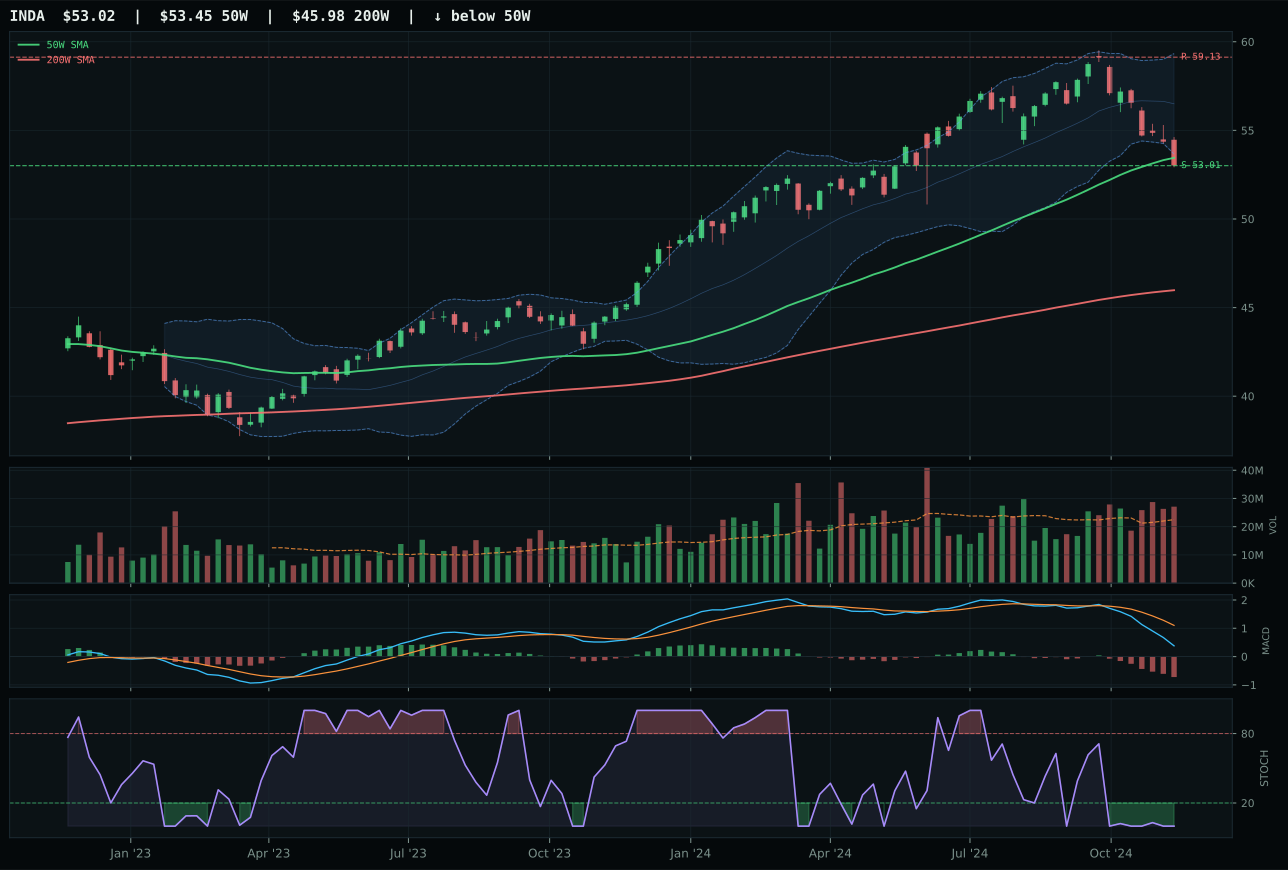
INDA has a pullback into support profile with -11.6% 13-week relative strength versus SPY.
A failed hold above support would weaken the setup.
Actionable but governed by invalidation levels.
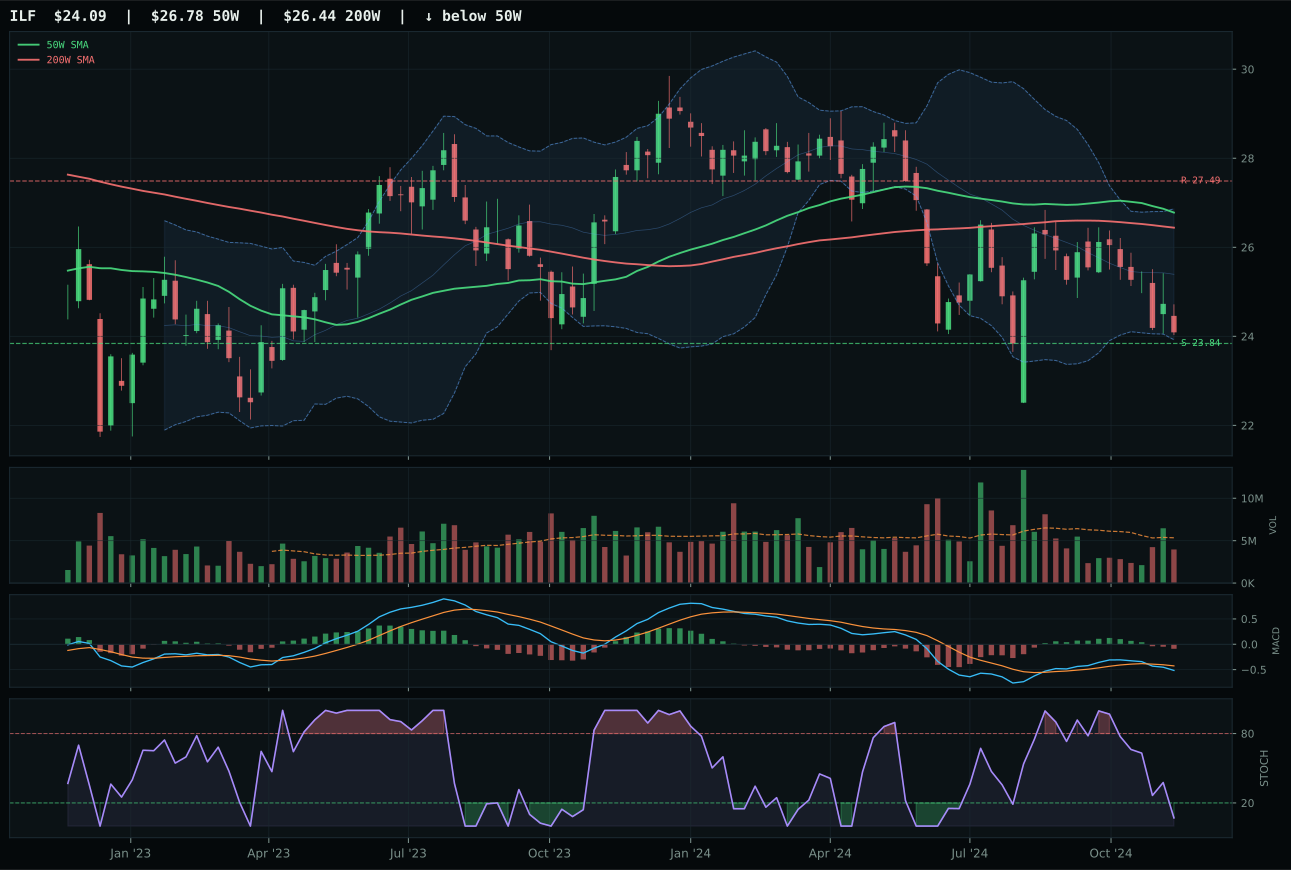
ILF has a pullback into support profile with -14.1% 13-week relative strength versus SPY.
A failed hold above support would weaken the setup.
Actionable but governed by invalidation levels.
INDA wins because its 100/100 timing score reflects the worst-case technical setup in the entire portfolio — price sits just 0.8% from the 50W with bearish weakening MACD and oversold stochastic RSI at 0.00 — creating a precise invalidation level at support 53.01. IEMG lost despite superior macro fit and broader index exposure because its 95/100 timing and 69.9 structure leave less definition. INDA's pullback into support geometry is mechanical: downside risk is 0% to support, upside risk to resistance is -10.3%, creating an information-rich setup. IEMG's neutral volume and superior relative strength of -6.9% versus INDA's -11.6% suggest that India-specific stress is more pronounced, which means the reversal, if it comes, will be more violent. Volume participation at 1.20x for INDA adds credibility.
Emerging Markets earned 0% allocation despite INDA representing the category because the macro filter obliterated category fit at 7.0/100. Dollar pressure at -14, credit stress at -10, liquidity stress at -10, and broad market bear at -9 total -43 headwinds with zero offsetting tailwind—this is the most macro-hostile category in the portfolio by a wide margin. INDA's technical setup is genuinely attractive (100/100 timing, 98/100 risk/reward), but the technical evidence is only 32.9/100 because trend is 52.0/100 and momentum confirmation is 3.6/100. The category score of 0.0 reflects that technical perfection in a support retest does not overcome structural macro rejection. Emerging markets are caught in the dollar pinch: dollar strength is a -14 macro descriptor, crushing EM assets. To earn reallocation, Emerging Markets would need a dollar reversal (Fed pivot or Treasury yield compression) or risk appetite capitulation where investors suddenly fled dollar cash into EM risk. Neither appears probable in next two weeks. INDA remains on the watchlist for a longer timeframe play if dollar/risk appetite regimes shift, but at this moment, the entire category is gated out by macro headwinds that overwhelm any tactical support retest.