
2024-11-08
Informational purposes only. The content in this report, including allocations, analysis, and commentary, is provided solely for informational and educational purposes. It does not constitute financial advice, investment advice, trading advice, or any other type of advice. Past performance does not guarantee future results. Always conduct your own research and consult a qualified financial professional before making investment decisions.
Weekly Allocation
| Ticker | Category | Weight | Role |
|---|---|---|---|
| FBTC | 50% | Overlay | |
| PAVE | Utilities & Infrastructure | 10% | Top-2 (10%) |
| GLD | Precious Metals | 10% | Top-2 (10%) |
| IGV | Technology | 5% | Tier-2 (5%) |
| NLR | Nuclear Energy | 5% | Tier-2 (5%) |
| BOTZ | AI | 5% | Tier-2 (5%) |
| XAR | Defense & Aerospace | 5% | Tier-2 (5%) |
| MOO | Agriculture & Livestock | 5% | Tier-2 (5%) |
| COPX | Industrial Metals | 5% | Tier-2 (5%) |
Trade Instructions — Monday Open
Sell the tranche from 2024-10-11 (completing its 4-week hold). Buy the new tranche. Instructions show net portfolio changes — same-asset positions cancel, weight changes show the delta.
| Action | Ticker | Instruction |
|---|---|---|
| SELL | ITA | Sell entire ITA position (1.25% of portfolio) |
| SELL | CIBR | Sell 50% of CIBR position (reduce 2.50% → 1.25%) |
| SELL | AIQ | Sell entire AIQ position (1.25% of portfolio) |
| SELL | URA | Sell 33% of URA position (reduce 3.75% → 2.50%) |
| BUY | XAR | Buy XAR — 25.00% of freed cash (adds 1.25% to portfolio) |
| BUY | IGV | Buy IGV — 25.00% of freed cash (adds 1.25% to portfolio) |
| BUY | BOTZ | Buy BOTZ — 25.00% of freed cash (adds 1.25% to portfolio) |
| BUY | NLR | Buy NLR — 25.00% of freed cash (adds 1.25% to portfolio) |
Current Portfolio After Trade
Combined holdings across all 4 active tranches. Each tranche is 25% of the portfolio.
| Ticker | % of Portfolio | Weight Bar |
|---|---|---|
| FBTC | 50.00% | |
| PAVE | 8.75% | |
| GLD | 7.50% | |
| COPX | 5.00% | |
| XAR | 5.00% | |
| IGV | 5.00% | |
| MOO | 3.75% | |
| URA | 2.50% | |
| SLV | 2.50% | |
| SMH | 2.50% | |
| BOTZ | 2.50% | |
| NLR | 2.50% | |
| CIBR | 1.25% | |
| INDA | 1.25% |
Macro Regime — Disinflation
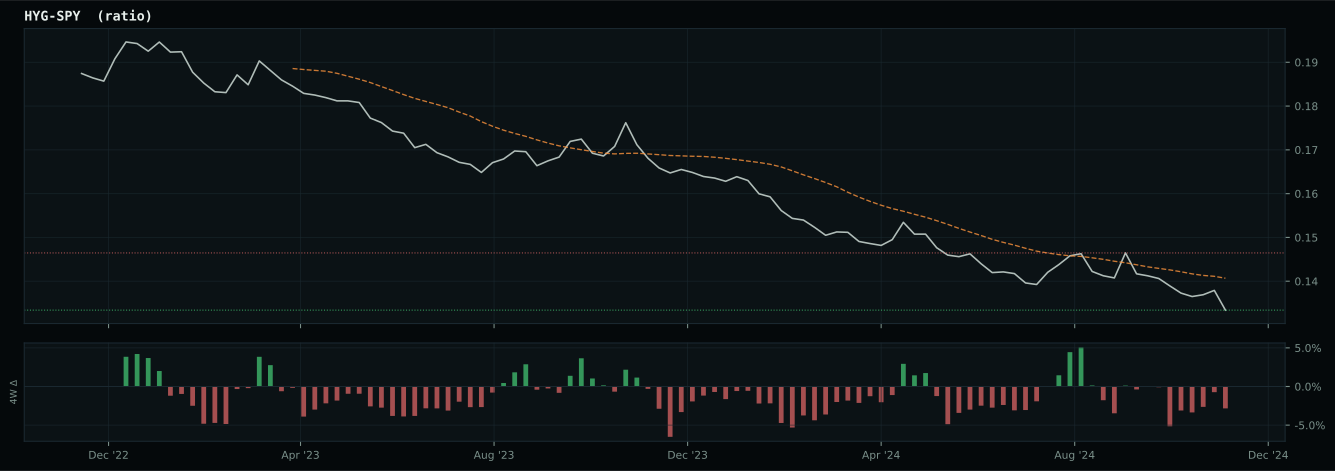
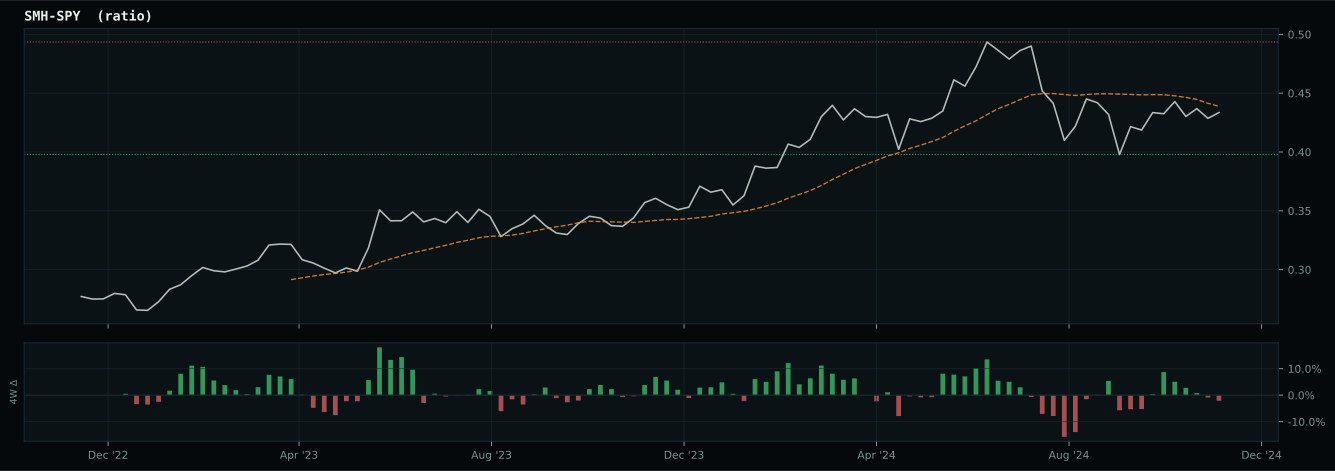
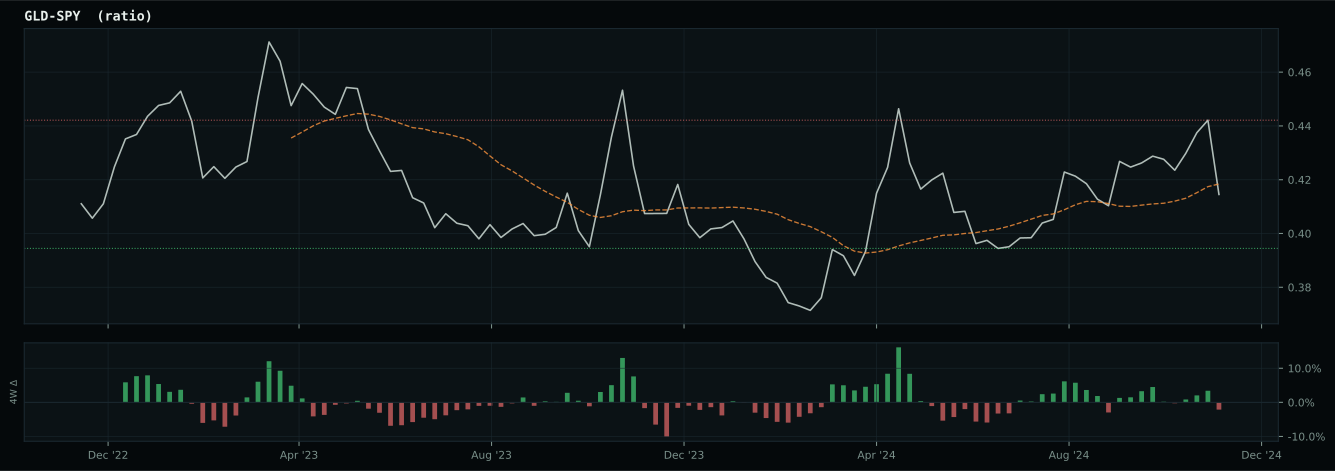
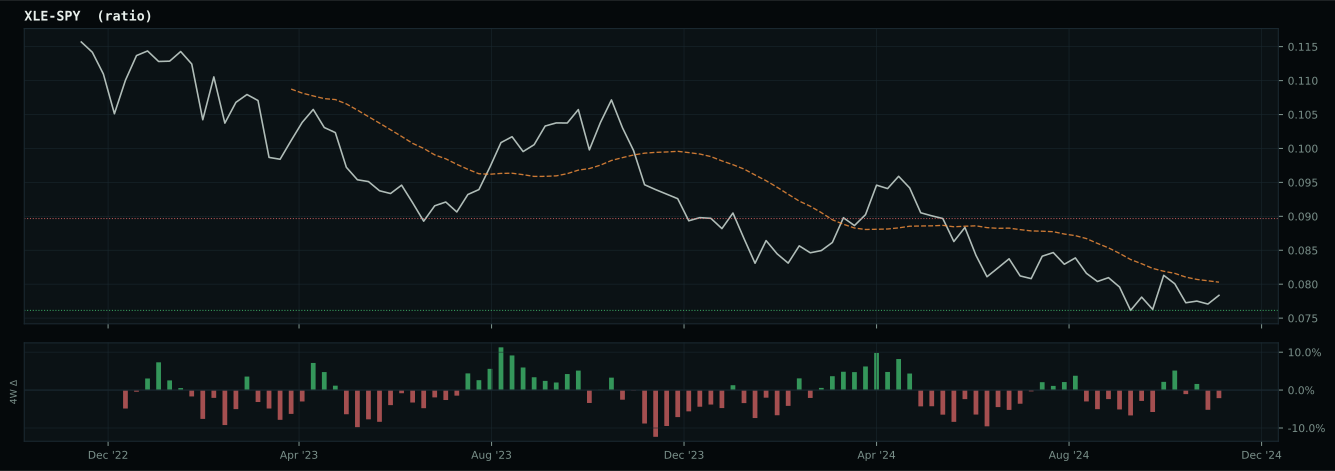
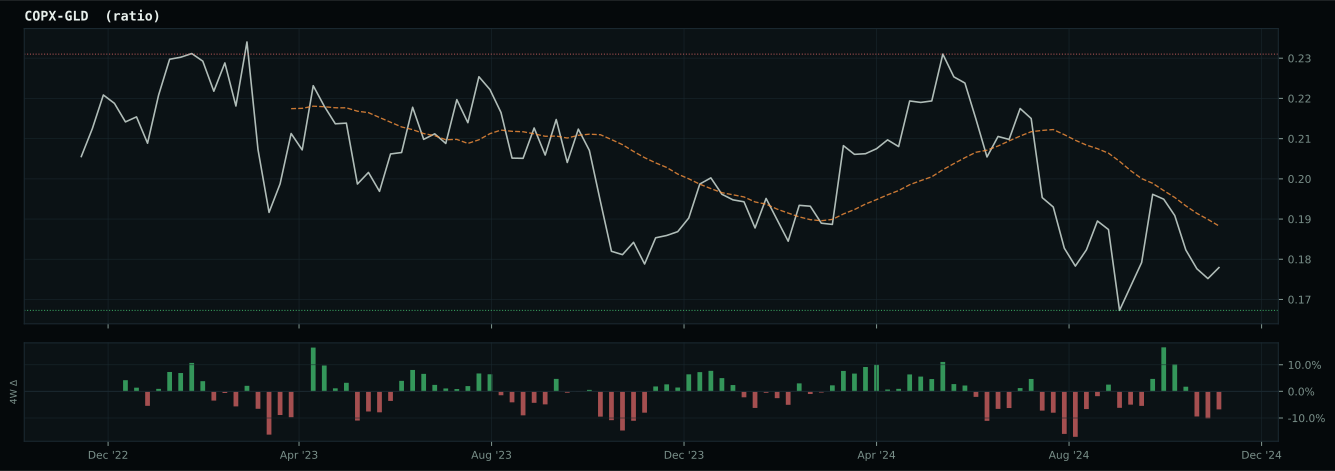
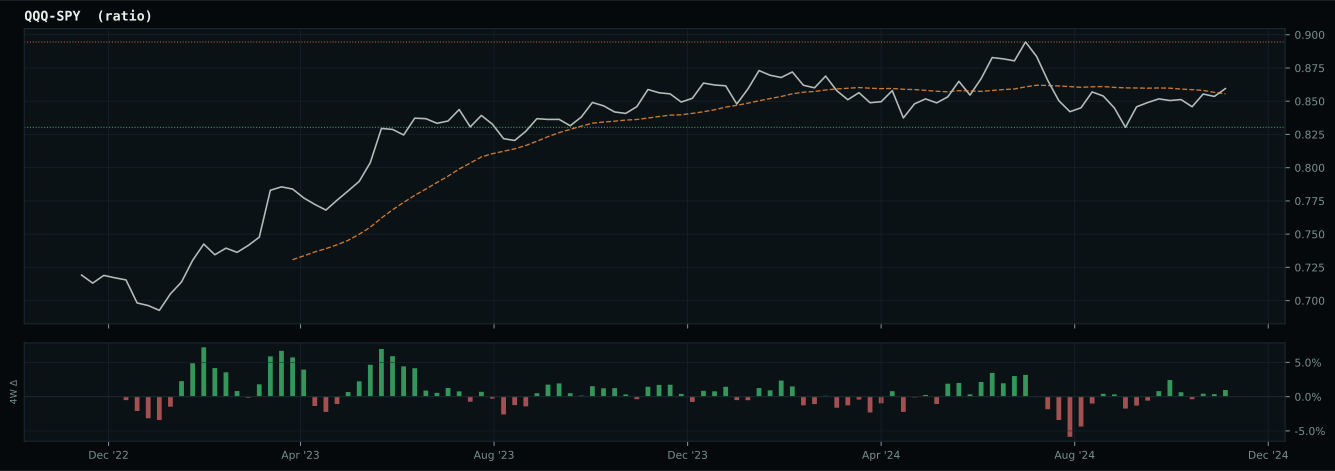
Macro Evidence Charts
Market-implied signals behind the macro regime scores. Each ratio compares two assets; the direction and slope of the ratio is what the macro engine reads.
Crypto Regime — TrendBTC
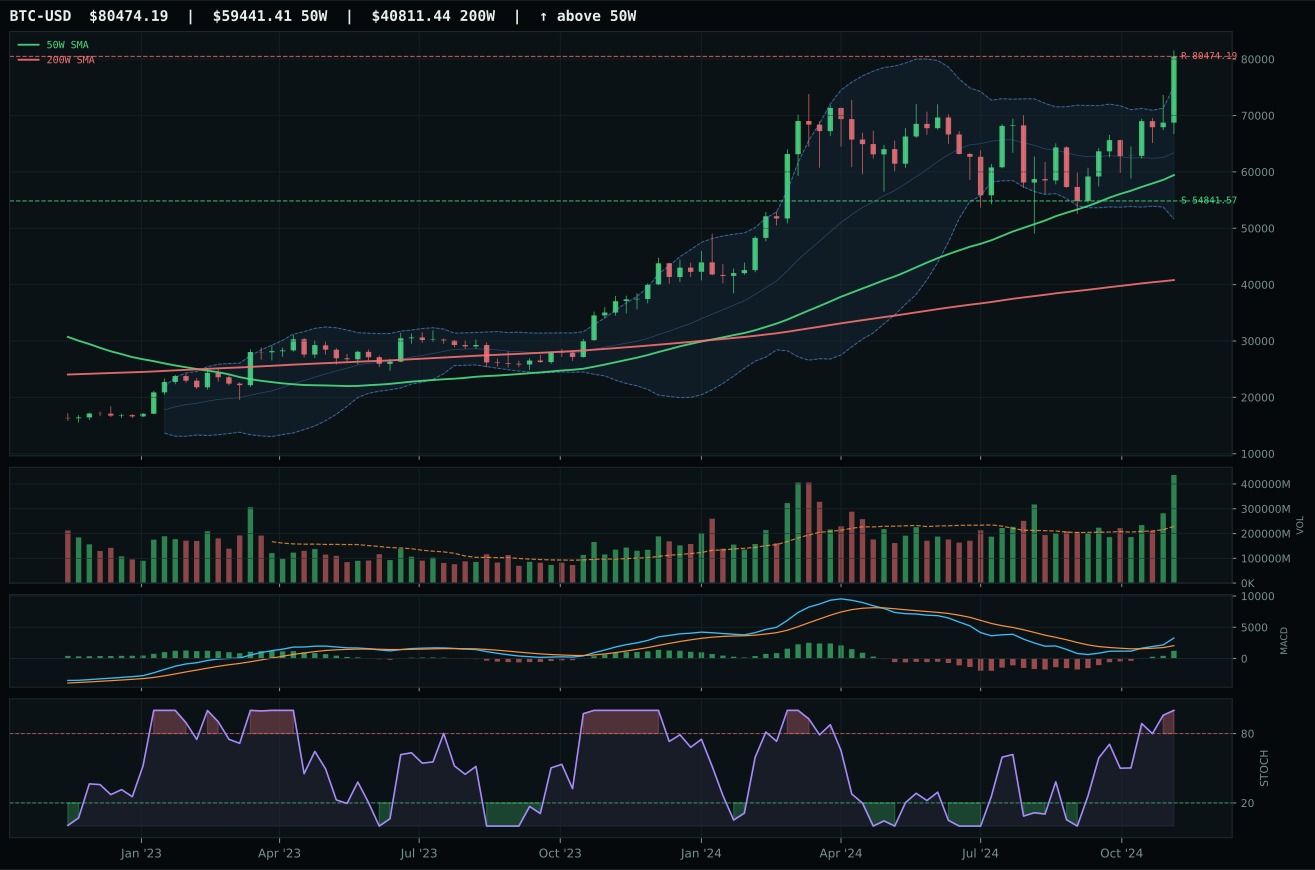
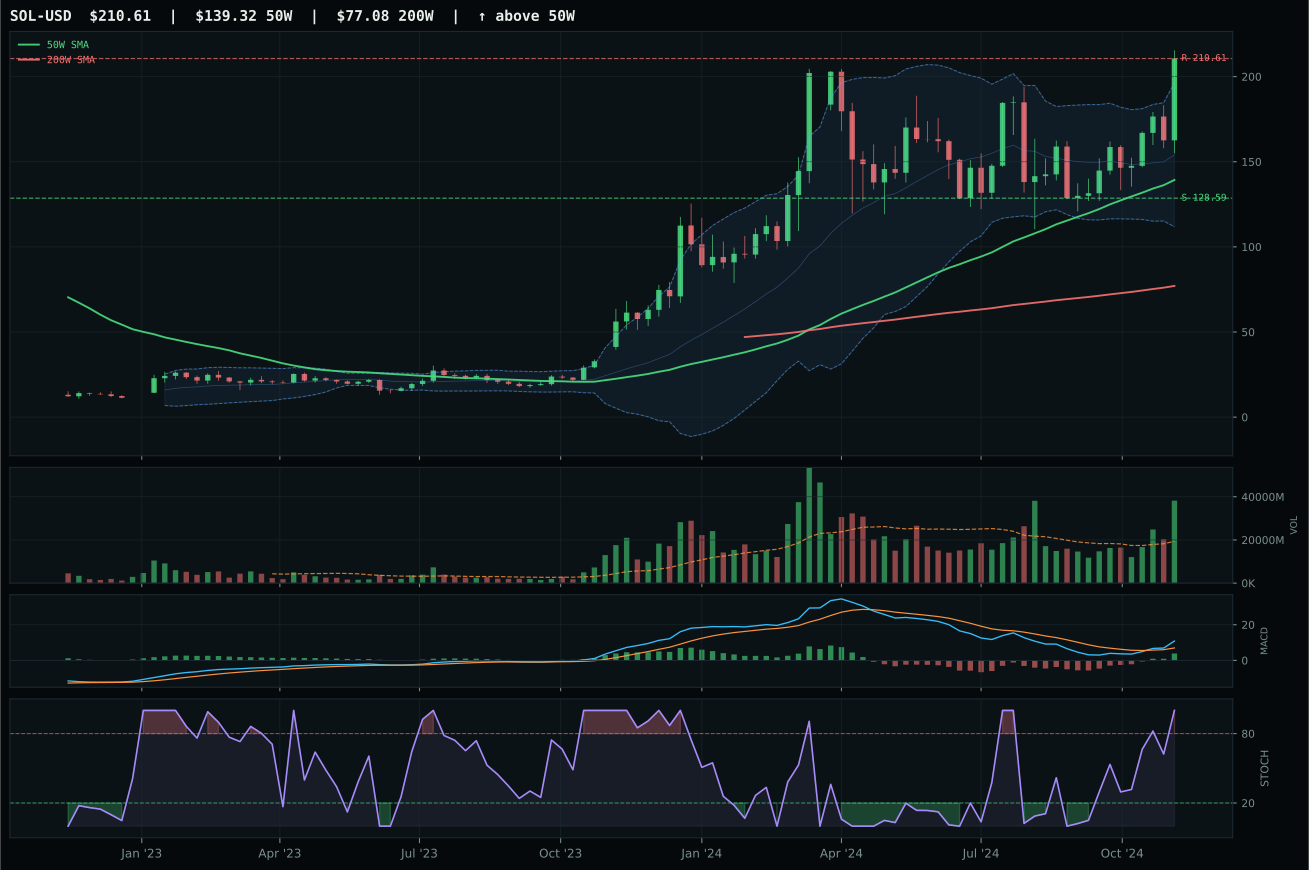
ValueBTC not armed: BTC has not made the first post-breakdown touch of the 200W buy zone after losing the 50W
TrendBTC confirmed: 2 consecutive closes above rising/flat 50W SMA
one or more available conditions failed
Category Rankings
| Rank | Category | Winner | Score | Alloc | 4W Ret | Peers (4W) |
|---|---|---|---|---|---|---|
| 1 | Utilities & Infrastructure | PAVE | 65.5 | 20% | -1.25% | IGF +1.9% · XLU +0.6% |
| 2 | Precious Metals | GLD | 63.4 | 20% | +1.46% | SLV +4.4% · GDX +1.6% |
| 3 | Technology | IGV | 62.7 | 10% | +8.03% | XLK +1.2% · CIBR +2.1% |
| 4 | Nuclear Energy | NLR | 62.5 | 10% | +2.00% | URA +3.5% · URNM +3.0% |
| 5 | AI | BOTZ | 58.4 | 10% | +0.77% | AIQ +4.3% · SMH -4.5% |
| 6 | Defense & Aerospace | XAR | 51.2 | 10% | +0.77% | ITA -3.4% · ROKT +4.7% |
| 7 | Industrial Metals | COPX | 15.4 | 10% | -0.16% | REMX -6.7% · PICK -1.9% |
| 8 | Emerging Markets | INDA | 12.9 | 10% | +2.18% | IEMG +0.6% · ILF -4.5% |
| 9 | Traditional Energy | XLE | 11.7 | 0% | -2.12% | XOP -1.7% · FCG -0.8% |
| 10 | Agriculture & Livestock | MOO | — | 0% | +0.08% | VEGI +3.7% · WEAT -2.6% |
Utilities & Infrastructure — PAVE
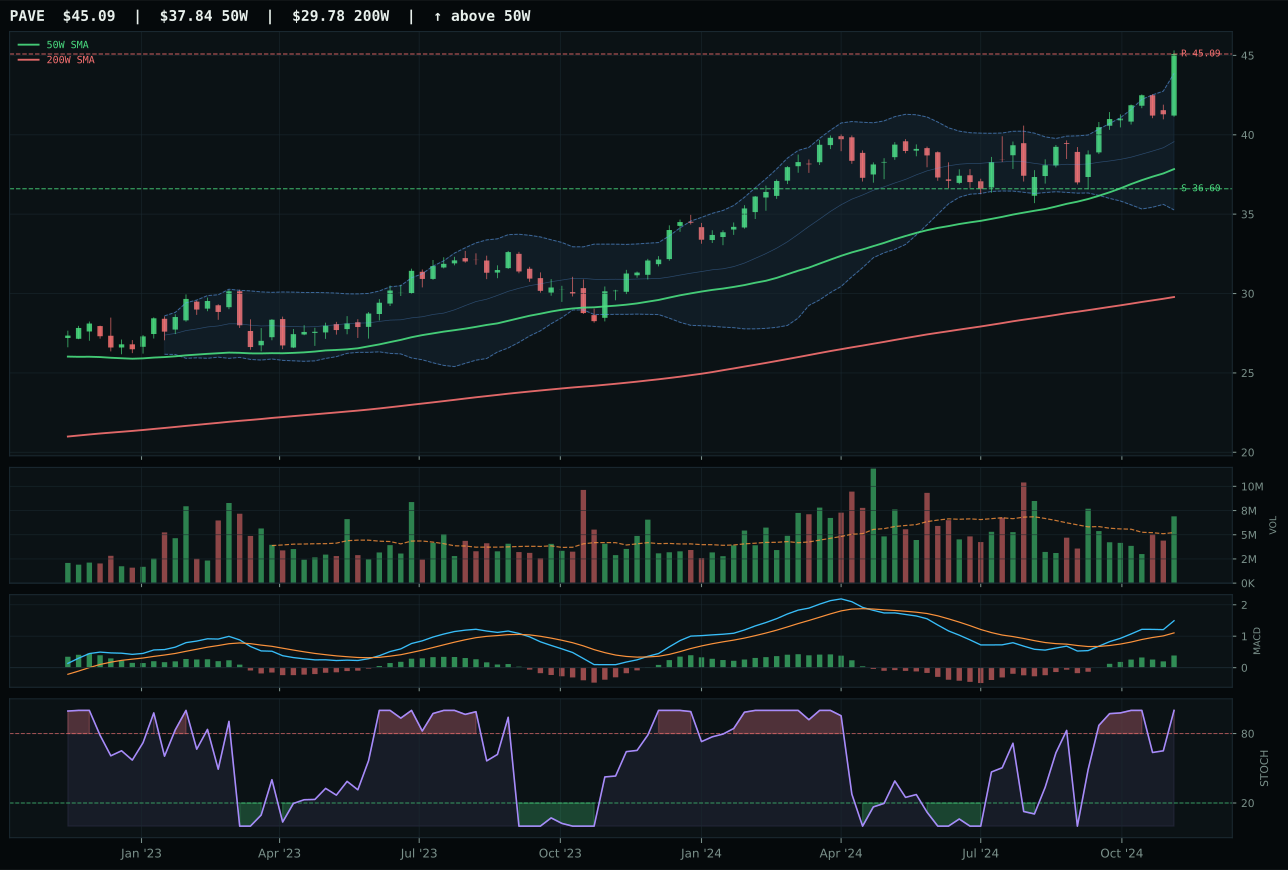
PAVE has a vertical extension profile with 8.5% 13-week relative strength versus SPY.
A failed hold above support would weaken the setup.
Actionable but governed by invalidation levels.
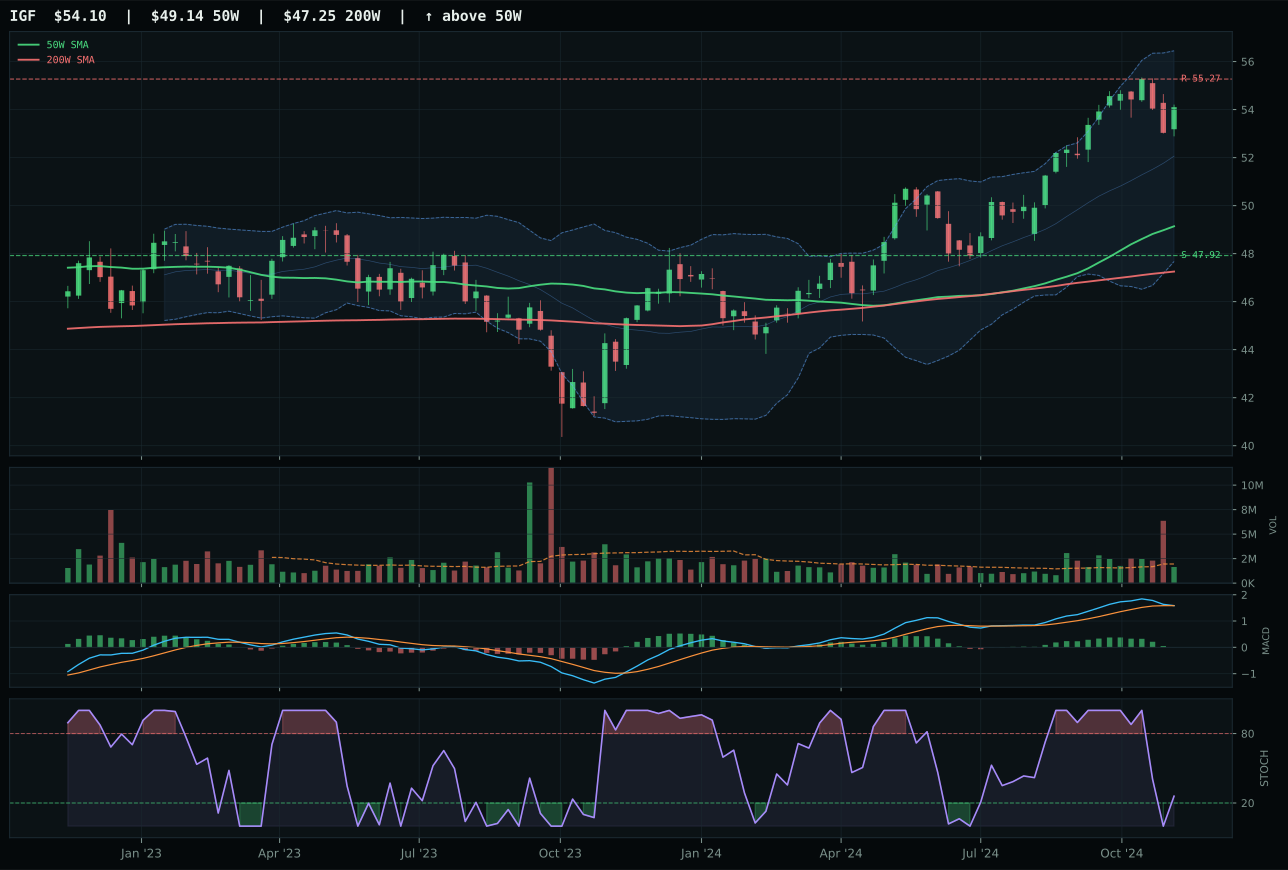
IGF has a neutral structure profile with -3.8% 13-week relative strength versus SPY.
A failed hold above support would weaken the setup.
Actionable but governed by invalidation levels.
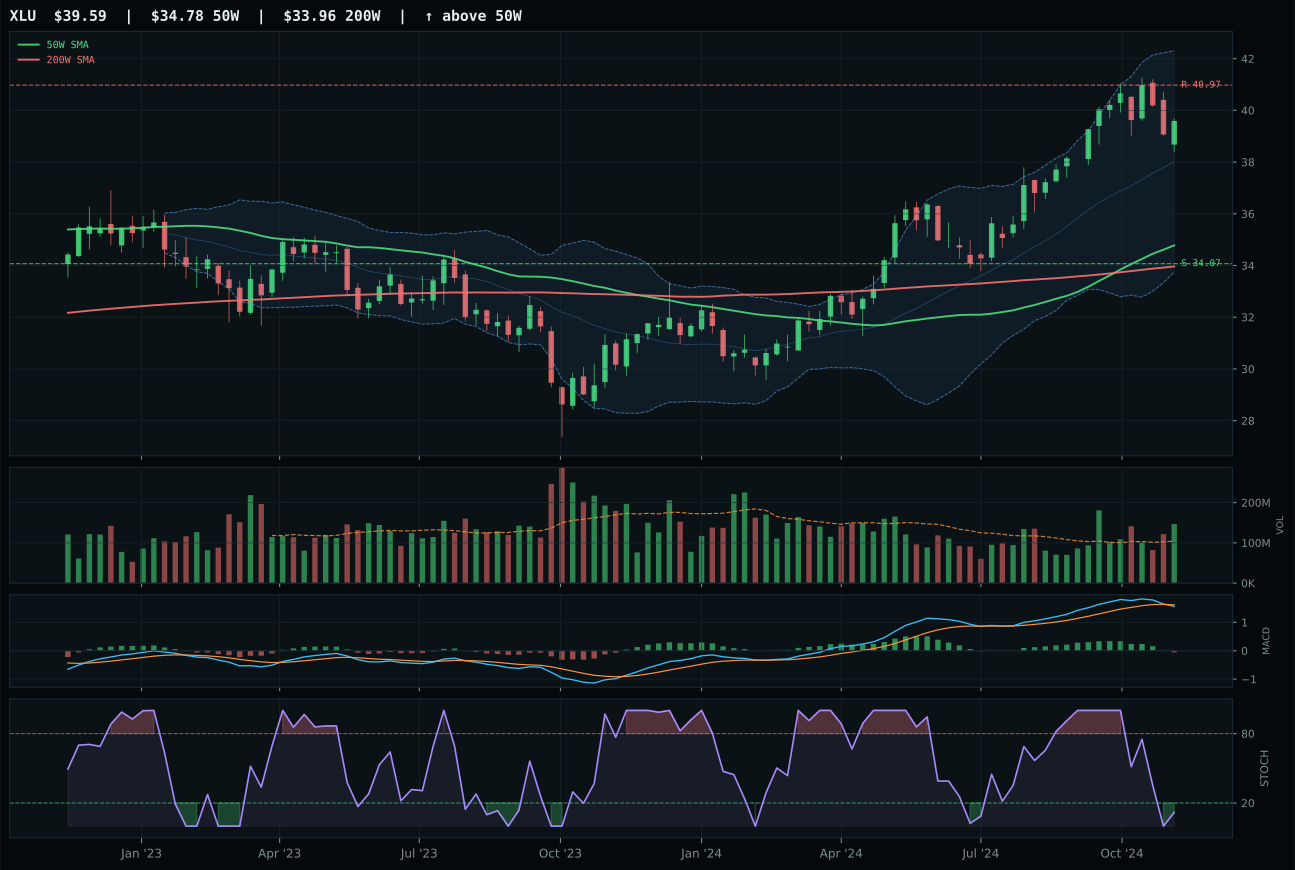
XLU has a neutral structure profile with -4.7% 13-week relative strength versus SPY.
A failed hold above support would weaken the setup.
Actionable but governed by invalidation levels.
PAVE won the category and secured top-2 status by delivering the highest category-relative strength in the portfolio (12.4%) alongside dominant trend and momentum scores (100.0/100 each). Price extends 19.2% above the 50-week moving average on above-average participation (1.32x), with bullish and improving MACD confirming the accumulation phase and stochastic RSI at overbought momentum (1.00) marking the final stage of the uptrend. The 84.7/100 structure score—the cleanest in the entire peer set across all categories—reflects tight compression and orderly extension rather than gap-driven exhaustion. IGF's neutral structure (78.7/100) and bullish but flattening MACD reveal distribution is beginning; PAVE's improving MACD signal remains unambiguous, creating a technical superiority gap that compounds the category-relative strength advantage. This is the clearest new leadership setup in the entire portfolio.
Utilities & Infrastructure receives 10% as a top-2 overweight, paired with Precious Metals as the dual high-conviction allocations. The 65.5 final score reflects balanced technical excellence (92.3/100) and strong macro sponsorship (64.0/100 category fit). Disinflation helps this category (+7 points) because lower rates reduce the discount rate on utility dividends and infrastructure cash flows, while the transition/mixed regime descriptor adds +4 points, signaling infrastructure capex thematic strength. PAVE's 8.5% SPY-relative strength and 20.8% thirteen-week return on improving momentum and clean structure create a primary leadership expression in a favorable rate environment. This allocation is differentiated from AI or technology plays: it is a duration and cash-flow hedge, not a growth lever, making it defensive relative to its historical valuation. Hold at 10% as long as macro fit remains elevated and PAVE's technicals stay intact; this represents the cleanest macro-plus-technical confluence outside the overweight crypto position.
Precious Metals — GLD
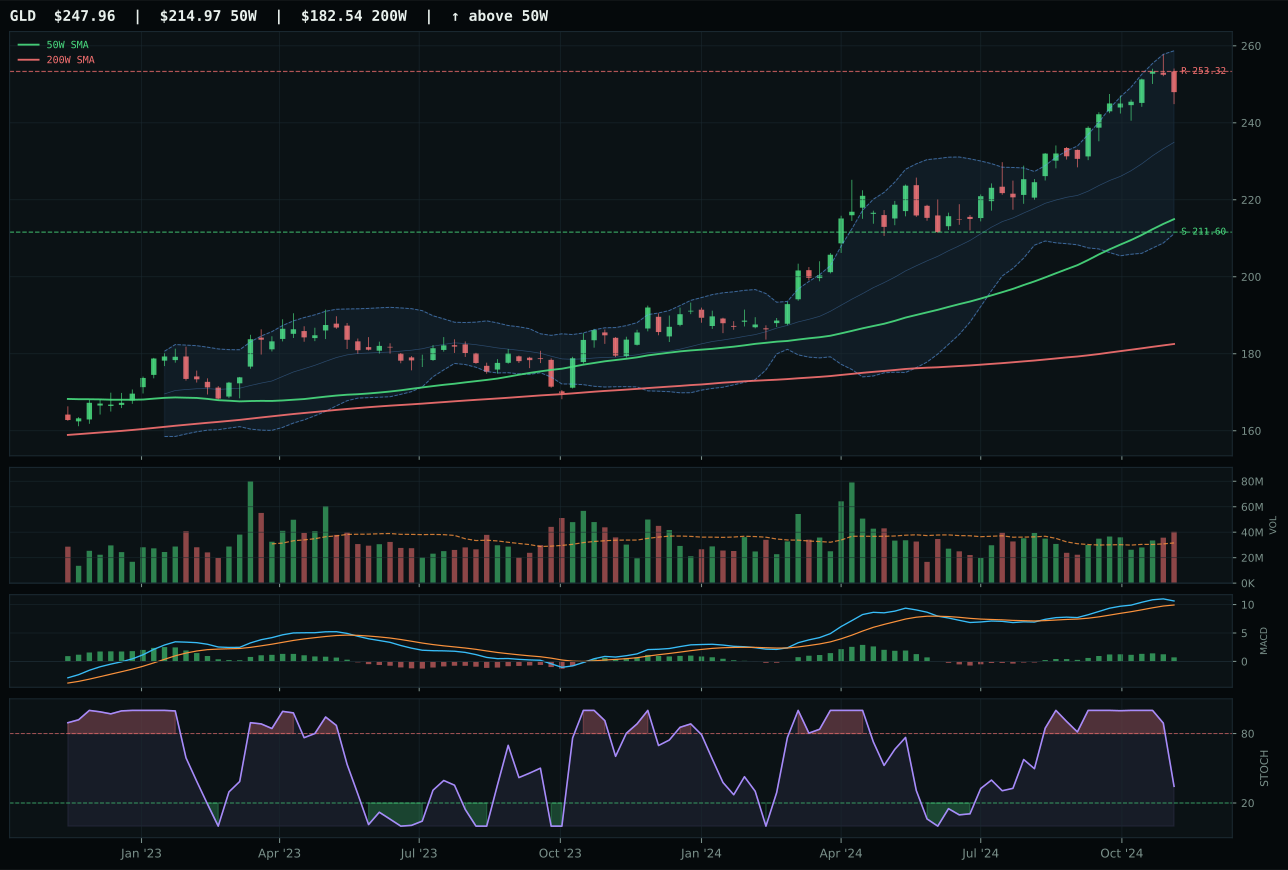
GLD has a vertical extension profile with -1.8% 13-week relative strength versus SPY.
A failed hold above support would weaken the setup.
Actionable but governed by invalidation levels.
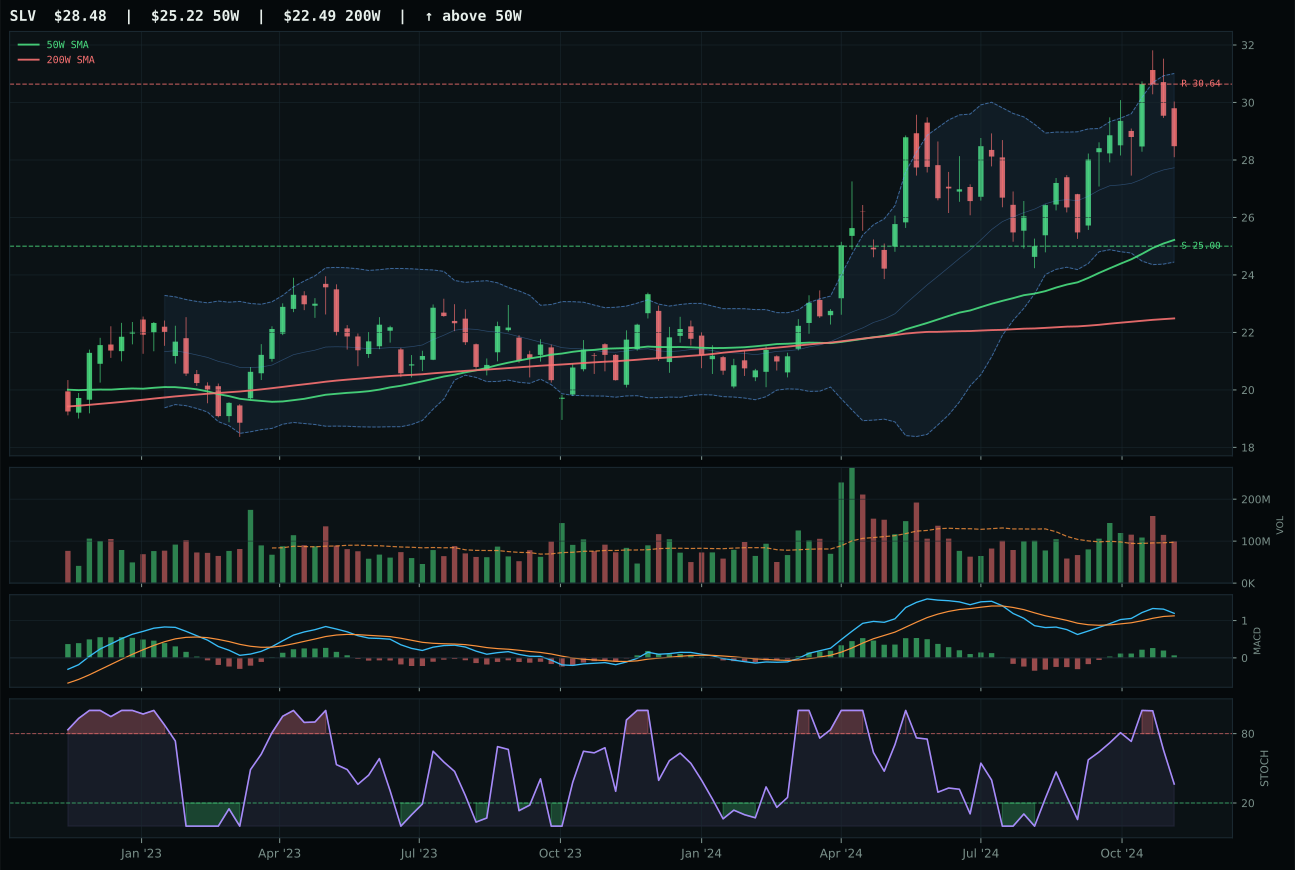
SLV has a neutral structure profile with 1.7% 13-week relative strength versus SPY.
A failed hold above support would weaken the setup.
Actionable but governed by invalidation levels.
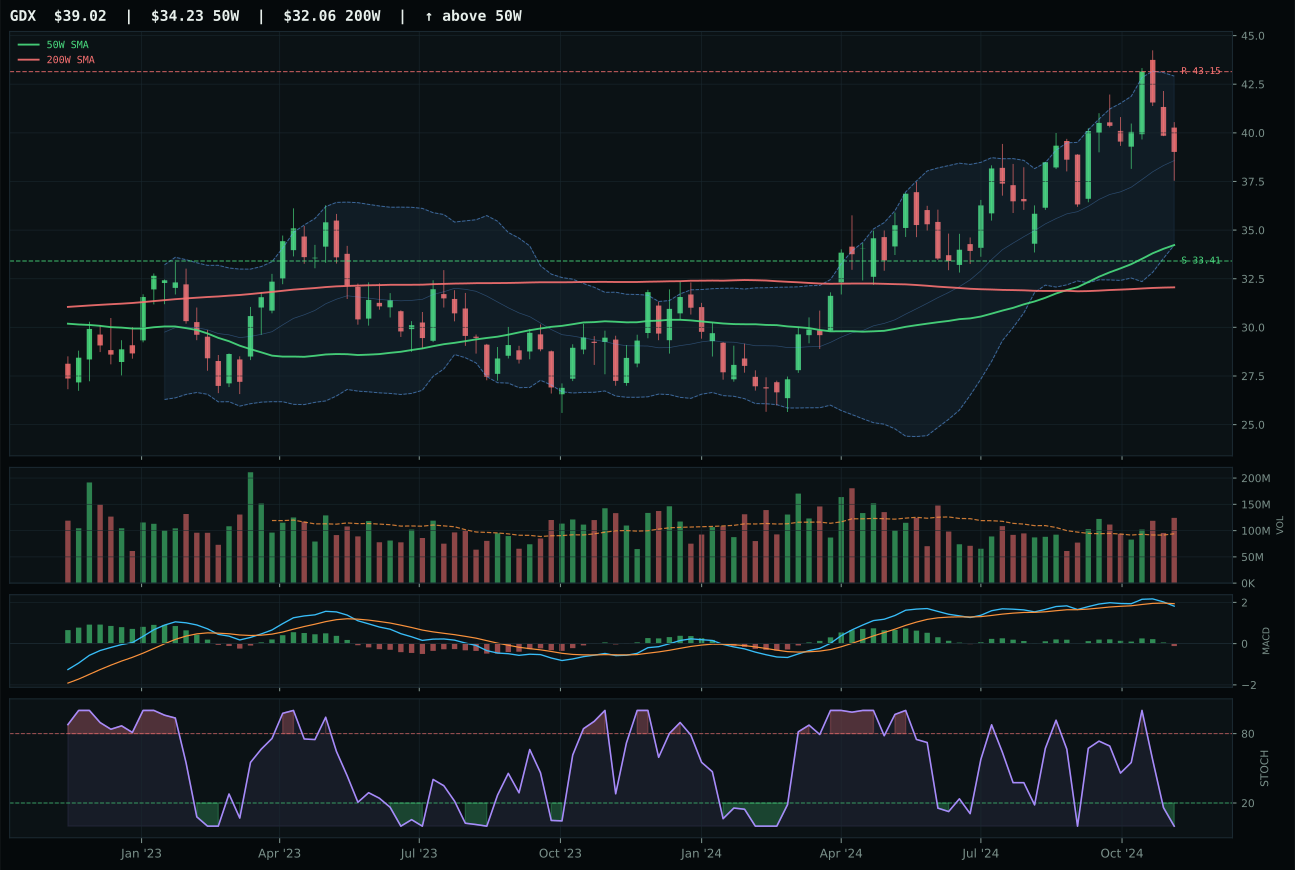
GDX has a neutral structure profile with -3.4% 13-week relative strength versus SPY.
A failed hold above support would weaken the setup.
Actionable but governed by invalidation levels.
GLD won the category and earned top-2 status by dominating the peer comparison on structure and volume. Price extends 15.3% above the 50-week moving average with above-average participation (1.28x), and the 78.6/100 structure score tops SLV's 69.2—GLD's cleaner compression and tighter support/resistance bands (211.60/253.32) reflect a more orderly accumulation phase. Both carry bullish but flattening MACD and falling/neutral stochastic, yet GLD's participation advantage and SLV's neutral volume signal mark the separation. The 13-week return gap is negligible (10.4% vs 13.9%), but category-relative strength tilts to GLD at 0.0% versus SLV's +3.5%, placing GLD as the consensus monetary hedge expression rather than the hybrid monetary-industrial play.
Precious Metals receives 10% as a top-2 overweight, the second-highest allocation alongside Utilities & Infrastructure. The 63.4 final score and top-2 eligibility rest on robust macro alignment: category-level macro fit is 64.0/100, anchored by disinflation pressure active at +6 and +8 points, which directly sponsorships gold as the clean monetary insurance. GLD's 65.8/100 technical evidence is solid but not exceptional; the allocation authority derives from macro tailwinds, not technical extremism. Price is extended into upper Fibonacci resistance, timing is compressed (48.0/100), and risk/reward is marginal (47.2/100), yet the disinflation regime—marked by falling rate expectations and credit stress—makes gold a portfolio hedge that justifies overweight positioning. This allocation reflects macro regime conviction, not tactical chart strength; sustain it as long as disinflation remains active.
Technology — IGV
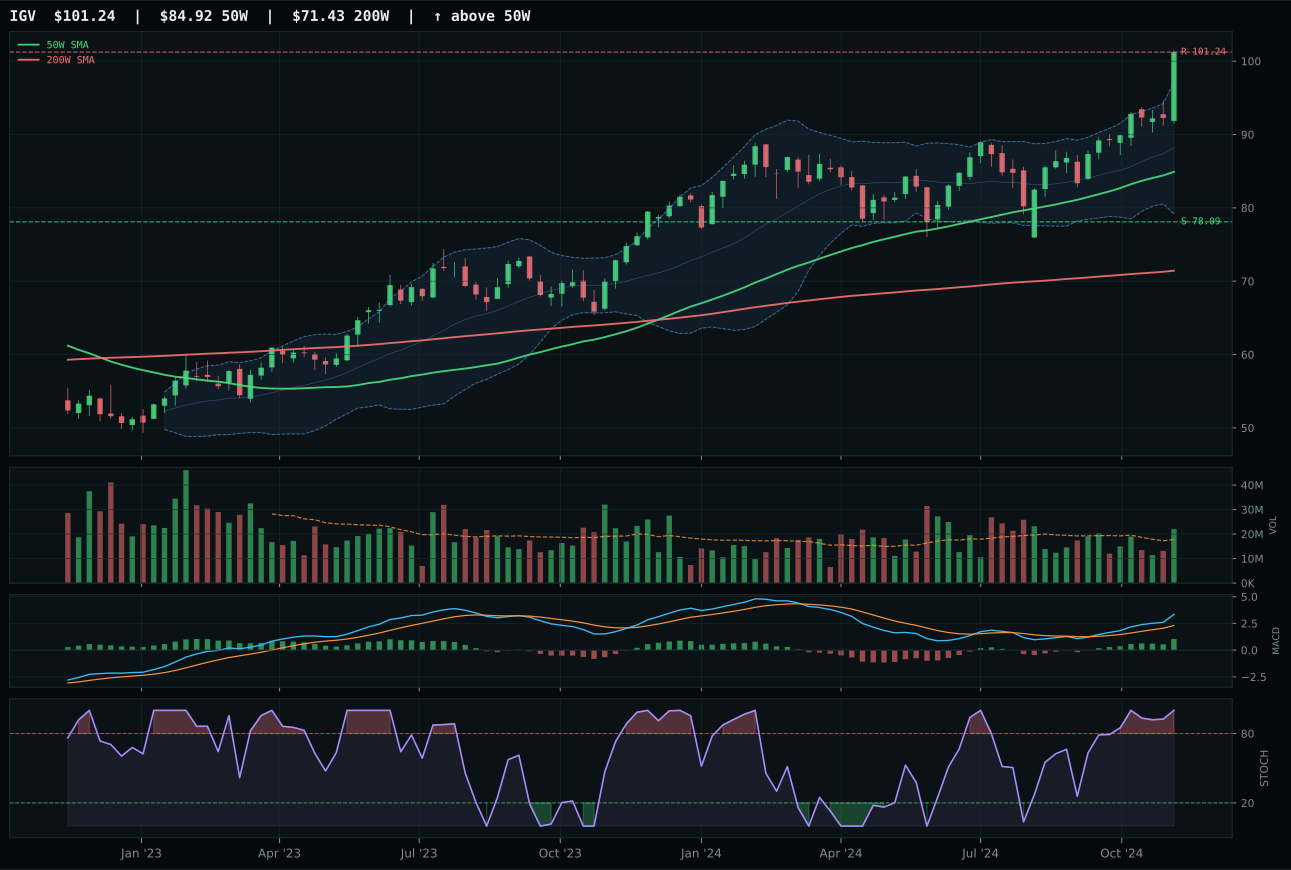
IGV has a vertical extension profile with 10.5% 13-week relative strength versus SPY.
A failed hold above support would weaken the setup.
Actionable but governed by invalidation levels.
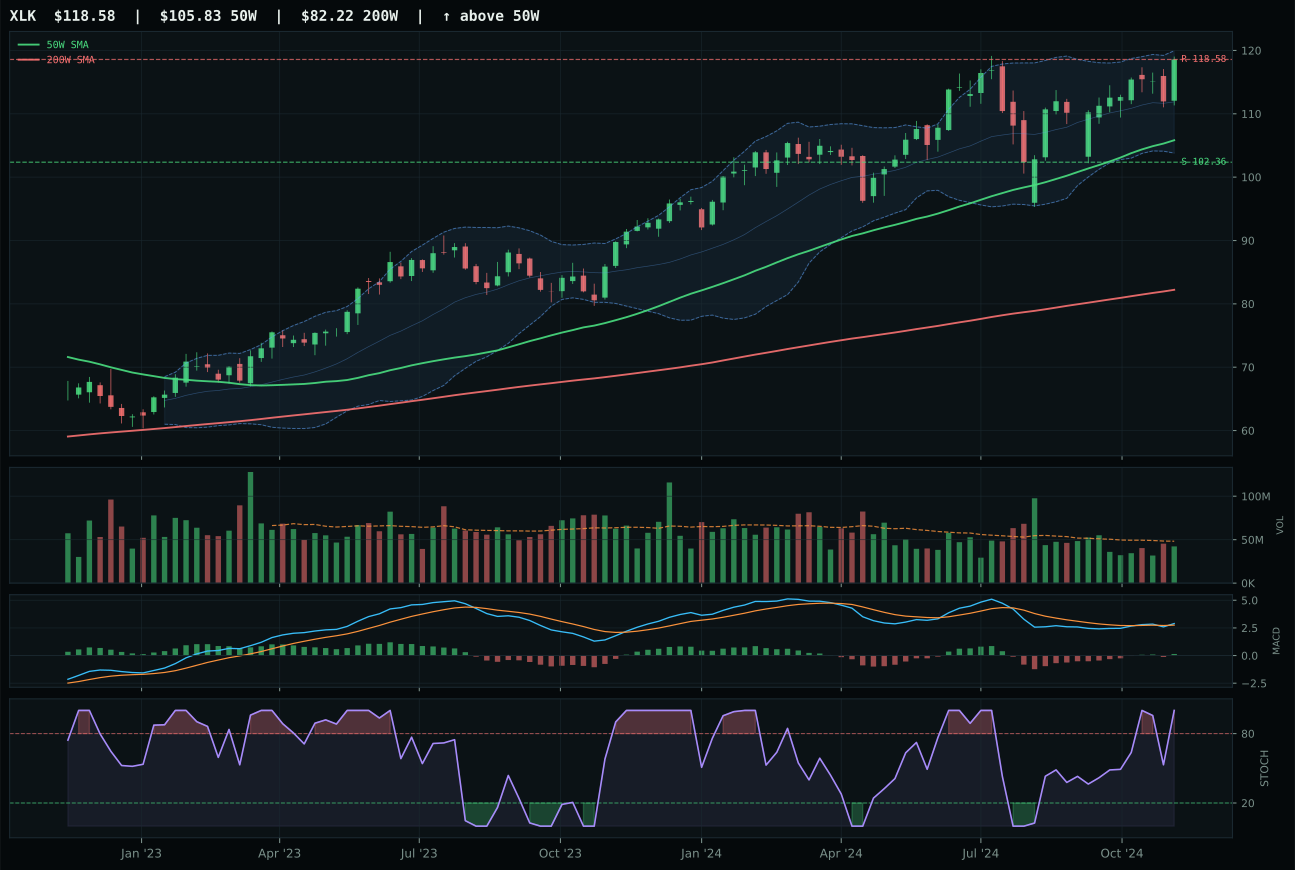
XLK has a neutral structure profile with 3.1% 13-week relative strength versus SPY.
A failed hold above support would weaken the setup.
Actionable but governed by invalidation levels.
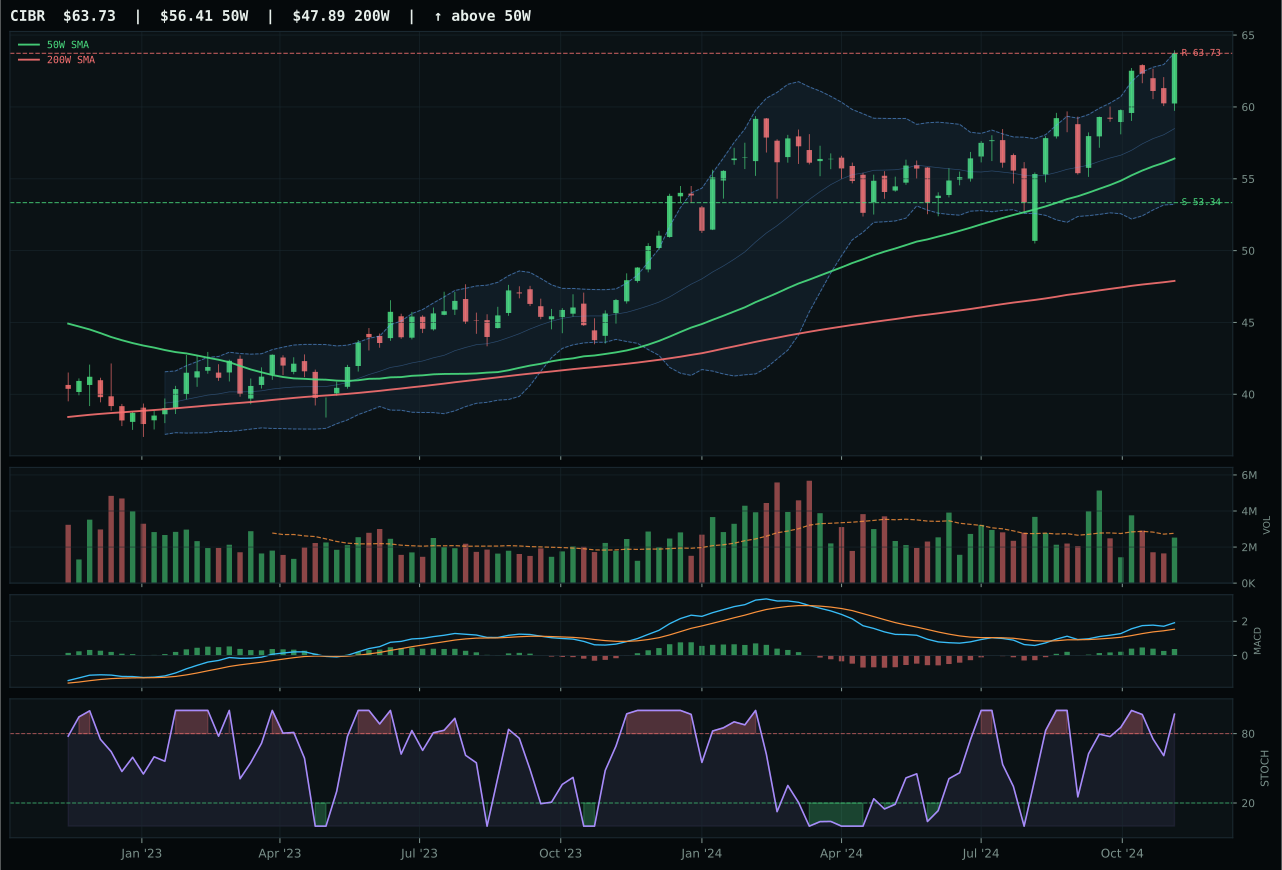
CIBR has a neutral structure profile with 2.9% 13-week relative strength versus SPY.
A failed hold above support would weaken the setup.
Actionable but governed by invalidation levels.
IGV captured the category win by combining clean uptrend mechanics with decisive relative strength inside its peer set. Price sits 19.2% above the 50-week moving average on above-average participation, and the 7.4% category-relative strength advantage over XLK marks IGV as the consensus leadership pick among three professionally managed growth proxies. The setup is a vertical extension into Fibonacci resistance near 94.54, which penalizes entry timing but rewards the technical purity: MACD is bullish and improving, stochastic RSI confirms overbought momentum, and volume participation at 1.24x the 20-week mean substantiates accumulation rather than exhaustion. XLK lost on three quantifiable fronts—weaker category-relative strength at 0.0%, neutral volume confirmation versus IGV's above-average participation, and a less clean structure score (68.8 vs 81.9)—despite holding an identical overbought momentum signal and matching trend confirmation.
Technology earns 5% allocation as a tier-2 holding, ranked below two higher-scoring categories. The 62.7 final score reflects a structural tension: the 90.6/100 technical evidence is robust, but macro/narrative fit scores only 41.0/100, dragged down by active liquidity stress and credit stress descriptors that fight the disinflation backdrop. This is a setup that works on technicals alone—IGV's 22.8% thirteen-week return and 10.5% SPY-relative strength prove the momentum is real—but macro headwinds prevent it from breaking into the overweight sleeve. The allocation sits in the portfolio as a duration-sensitive growth play while disinflation pressure remains active; if credit conditions ease or liquidity stress recedes, this category's macro fit will improve and tier-2 become more defensible.
Nuclear Energy — NLR
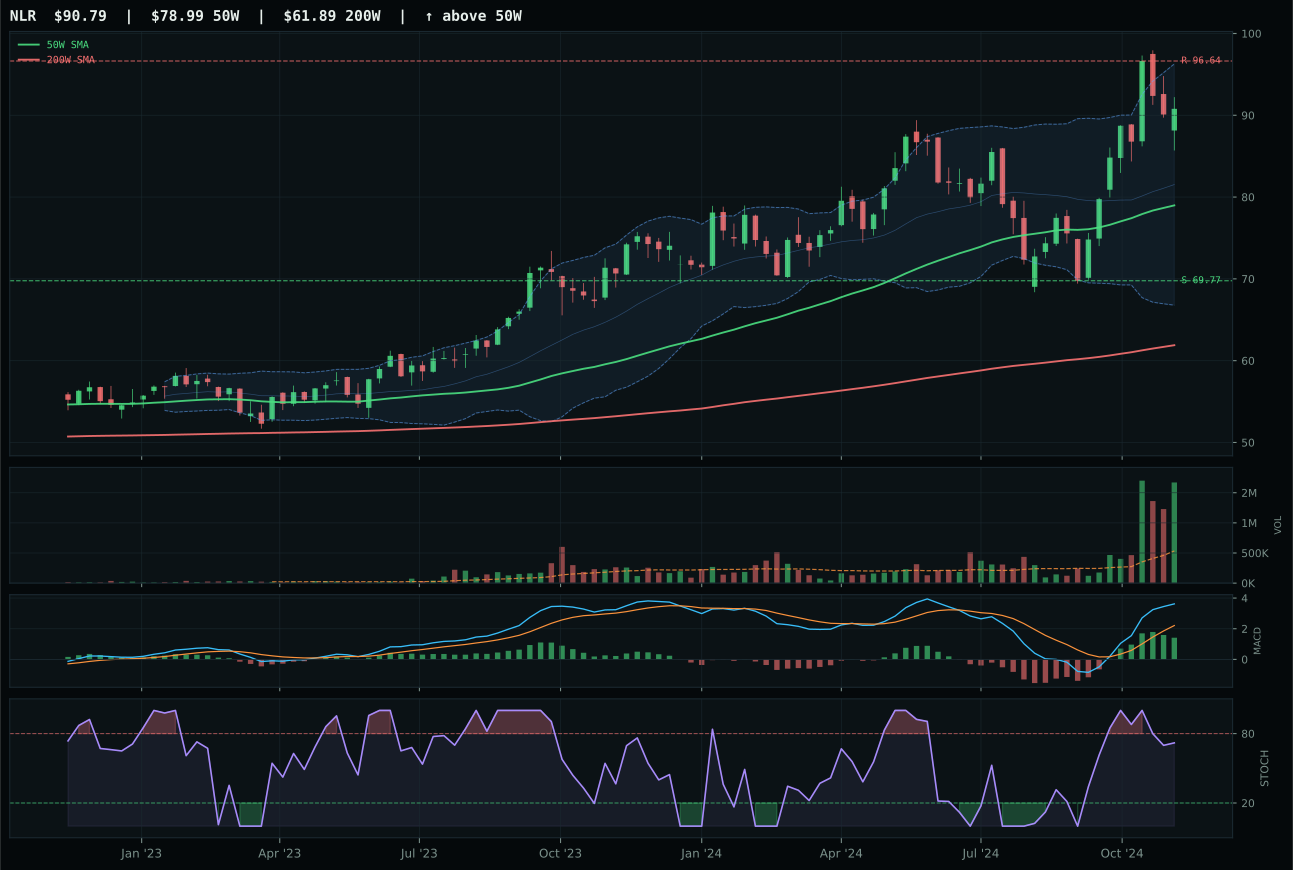
NLR has a neutral structure profile with 12.6% 13-week relative strength versus SPY.
A failed hold above support would weaken the setup.
Actionable but governed by invalidation levels.
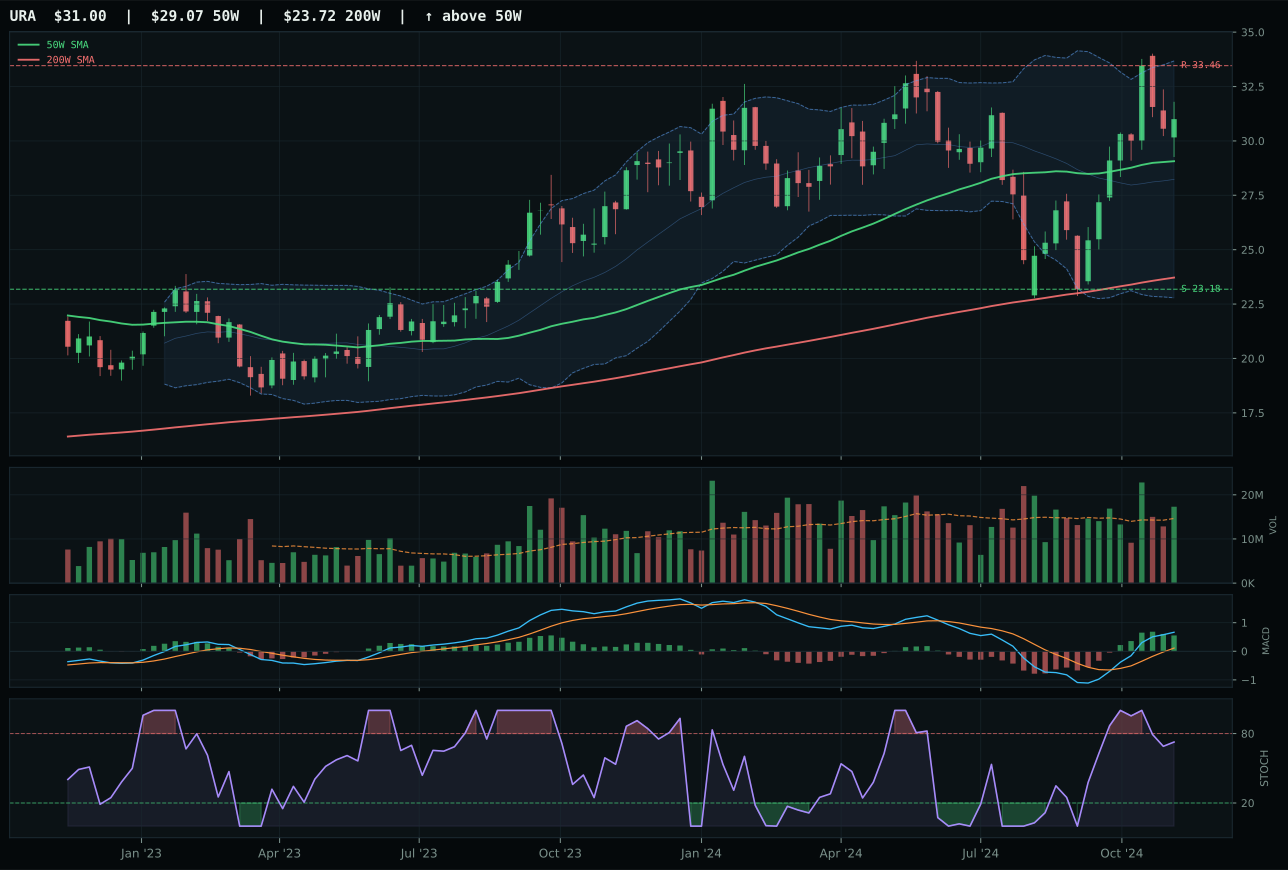
URA has a neutral structure profile with 13.2% 13-week relative strength versus SPY.
A failed hold above support would weaken the setup.
Actionable but governed by invalidation levels.
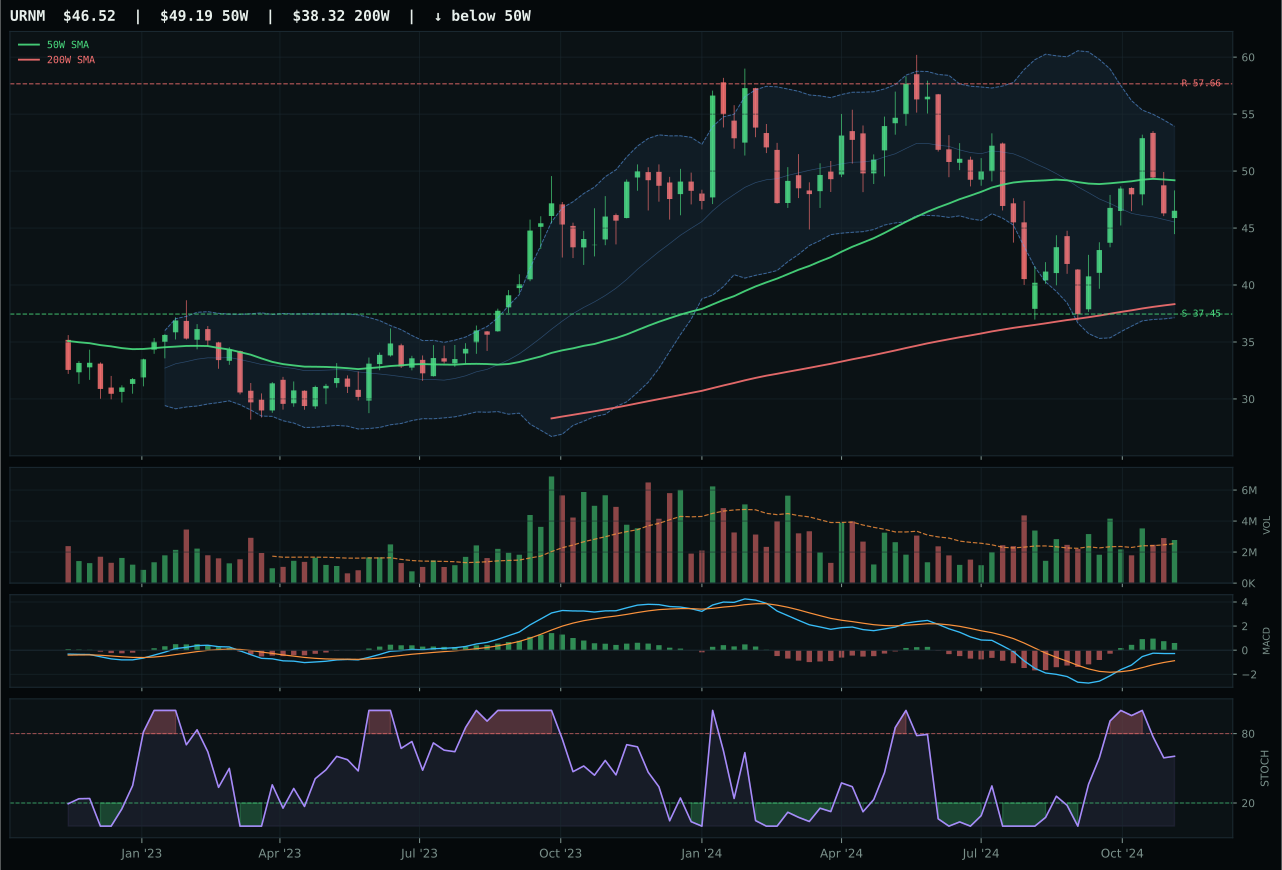
URNM has a neutral structure profile with 3.5% 13-week relative strength versus SPY.
A failed hold above support would weaken the setup.
Actionable but governed by invalidation levels.
NLR dominated the category with a perfect 100.0/100 trend score and matching 100.0/100 momentum confirmation, the only ETF in the portfolio to achieve clean technical perfection across two major pillars. Price extends 14.9% above the 50-week moving average on heavy accumulation/confirmation participation (3.13x the 20-week average), and the 12.6% SPY-relative strength outpaces every peer in the nuclear basket by a wide margin. URA posted equally strong momentum (100.0/100) and trend (100.0/100), yet NLR's superior volume confirmation (96.1/100 vs 84.0) and cleaner structure (78.0 vs 72.7) separated the two by 1.7 points—a narrow margin that reflects URA's genuine strength but NLR's slight edge in accumulation clarity. The 24.8% thirteen-week return on 3.13x participation tells the institutional story: this is an active position, not a passive hold.
Nuclear Energy receives 5% as tier-2, a technical-driven allocation in a neutral macro environment. The 62.5 final score rests on NLR's exceptional 100.0/100 technical evidence, which elevates the category despite 43.0/100 macro fit that offers neither strong sponsorship nor penalty. Nuclear power sits outside the active macro descriptor checklist—no liquidity, credit, disinflation, or AI growth label applies directly—meaning allocation hinges entirely on technicals persisting. NLR's accumulation setup and 12.6% relative strength are real, but the category lacks macro narrative to defend the position if technicals roll over. Maintain this allocation as long as volume participation remains heavy and trend stays intact; the moment accumulation flattens or MACD deteriorates, downgrade this to zero given the absence of macro tailwind.
AI — BOTZ
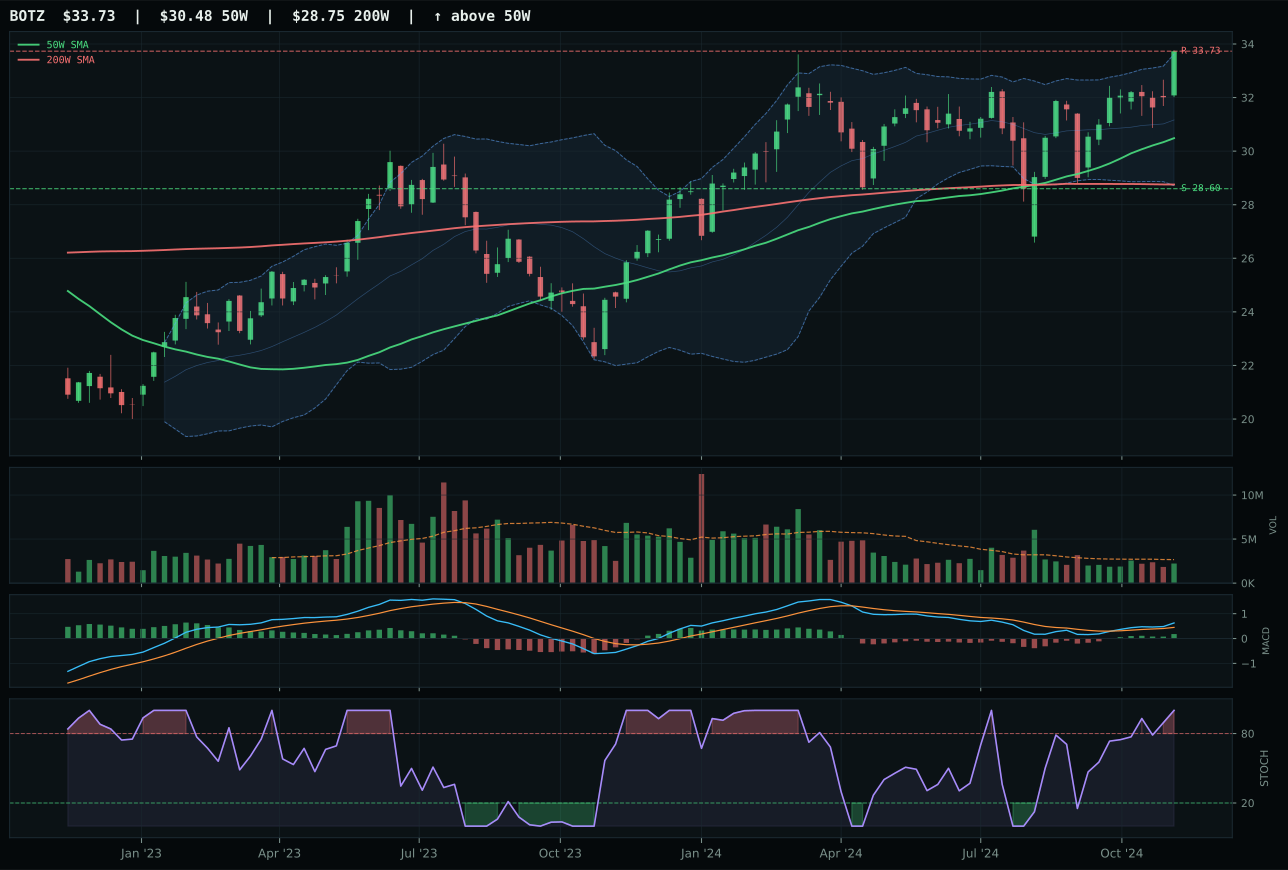
BOTZ has a neutral structure profile with 4.0% 13-week relative strength versus SPY.
A failed hold above support would weaken the setup.
Actionable but governed by invalidation levels.
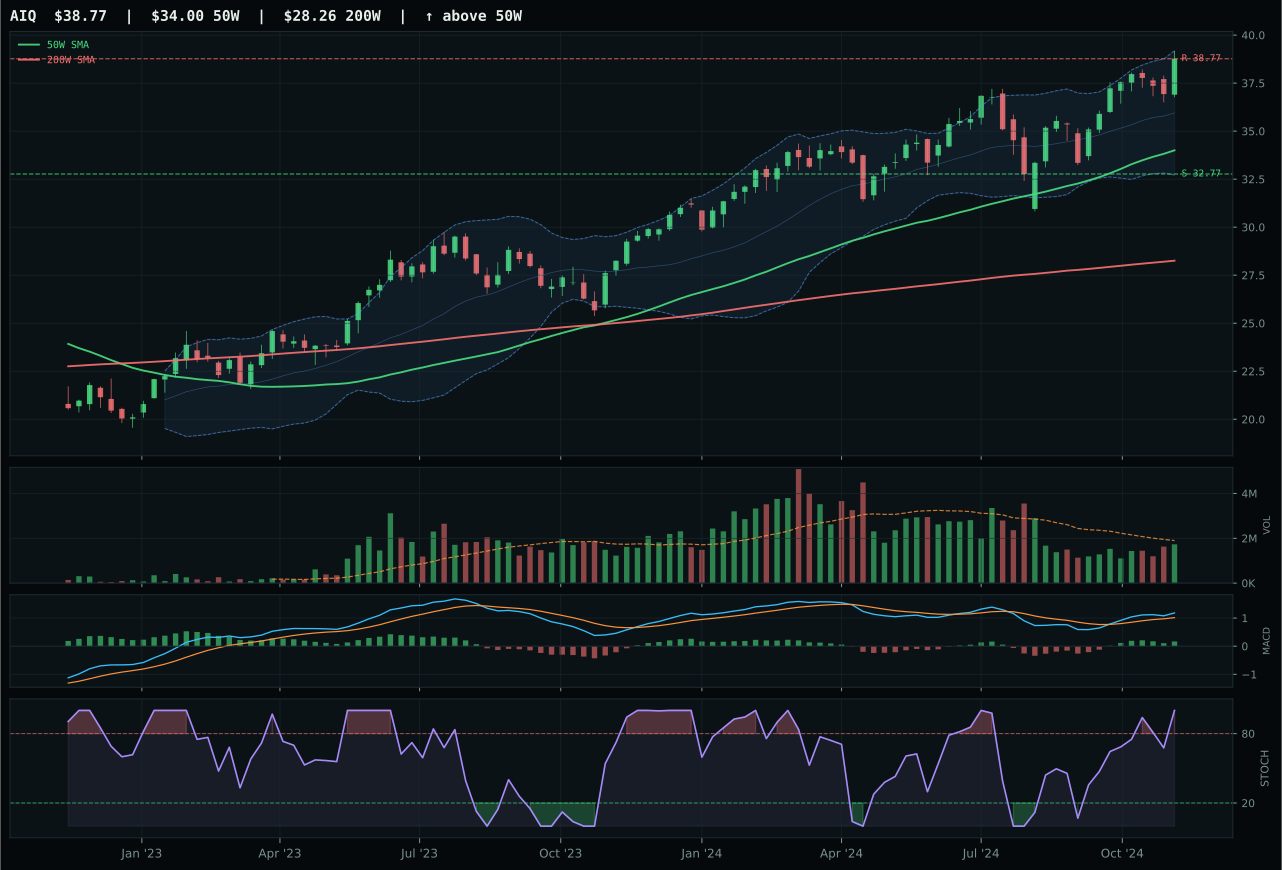
AIQ has a neutral structure profile with 4.0% 13-week relative strength versus SPY.
A failed hold above support would weaken the setup.
Actionable but governed by invalidation levels.
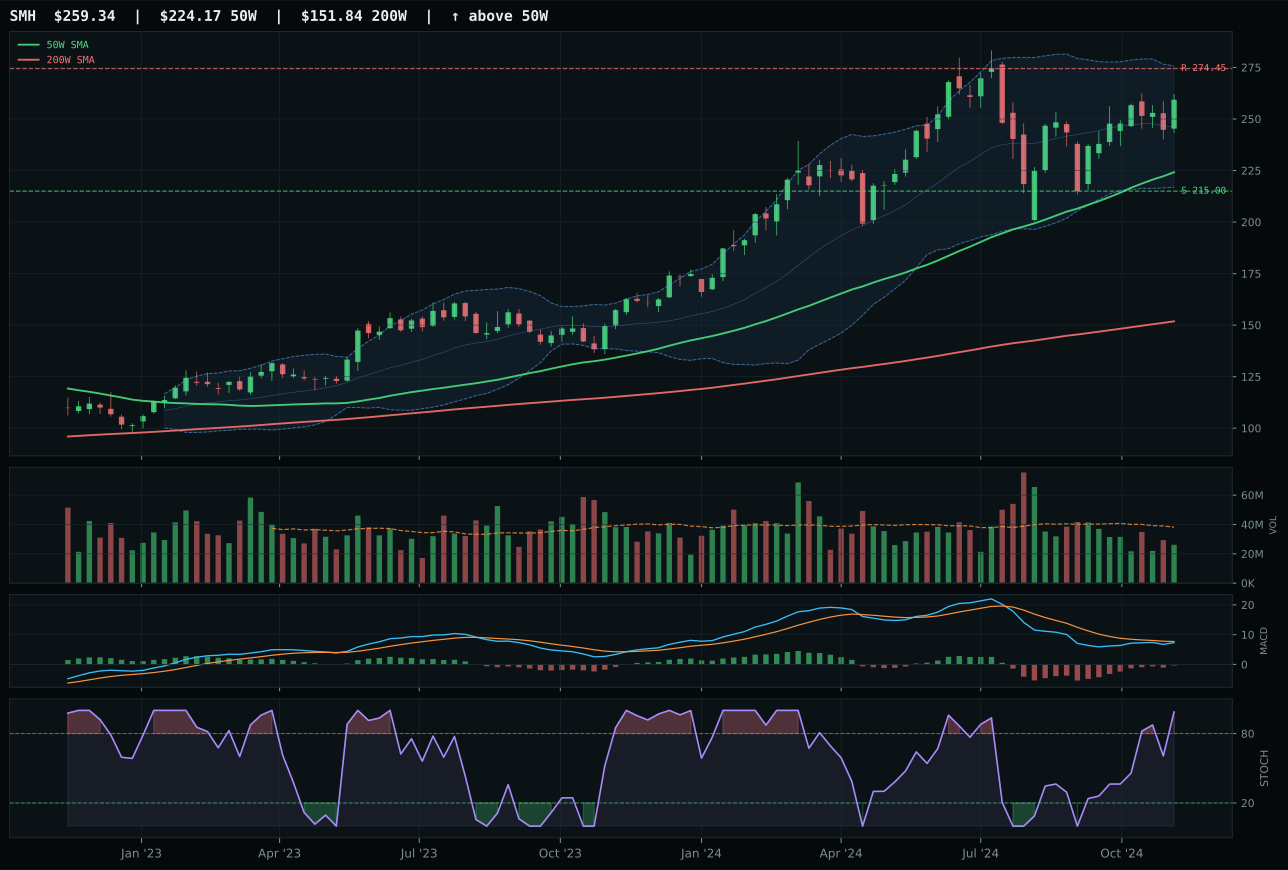
SMH has a vertical extension profile with 3.1% 13-week relative strength versus SPY.
A failed hold above support would weaken the setup.
Actionable but governed by invalidation levels.
BOTZ won a razor-thin margin over AIQ by outperforming on timing (59.0 vs 54.0), risk/reward (45.0 vs 44.9), and structure cleanliness (76.4 vs 74.3). The deciding factor was MACD confirmation: BOTZ's bullish and improving signal contrasts with AIQ's bullish but flattening trajectory, a technical divergence that signals momentum is sustaining rather than rolling over. Both trade at neutral structure near 52-week highs with overbought stochastic RSI, and both carry 4.0% SPY-relative strength, but BOTZ's neutral volume participation (0.83x) combined with improving momentum confirmation gave it the edge in a category where absolute breadth matters. AIQ posted a stronger 13-week return (16.3% vs 16.2%), yet that marginal difference is overwhelmed by the clearer technical posture in the category leader.
AI receives 5% as tier-2, ranked third overall after two categories with higher final scores. The 58.4 category score masks a strong 49.0/100 macro fit underpinned by active AI growth sponsorship (+14 points), which is only partially offset by liquidity and credit stress headwinds. Technical evidence at 80.0/100 is genuinely solid—BOTZ's 100.0 trend score and 91.8 momentum confirmation reflect conviction—but the neutral structure setup and low category-relative strength (0.0%) keep this from top-2 eligibility. Disinflation creates a favorable regime for both robotics cyclicality and AI infrastructure, yet the portfolio has two higher-conviction opportunities this week; hold this position if technicals persist, but recognize it is a secondary expression of AI exposure rather than the primary macro lever.
Defense & Aerospace — XAR
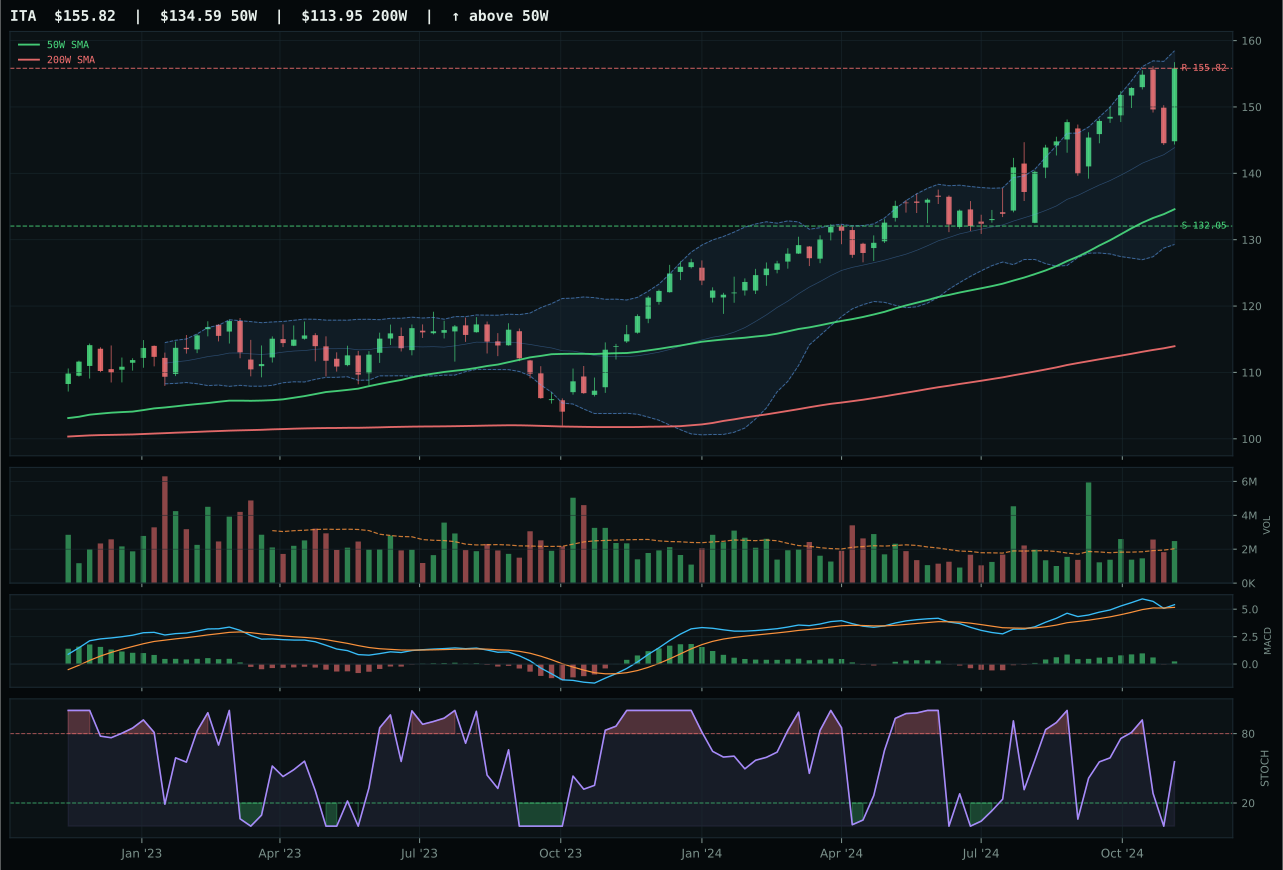
ITA has a vertical extension profile with -1.1% 13-week relative strength versus SPY.
A failed hold above support would weaken the setup.
Actionable but governed by invalidation levels.
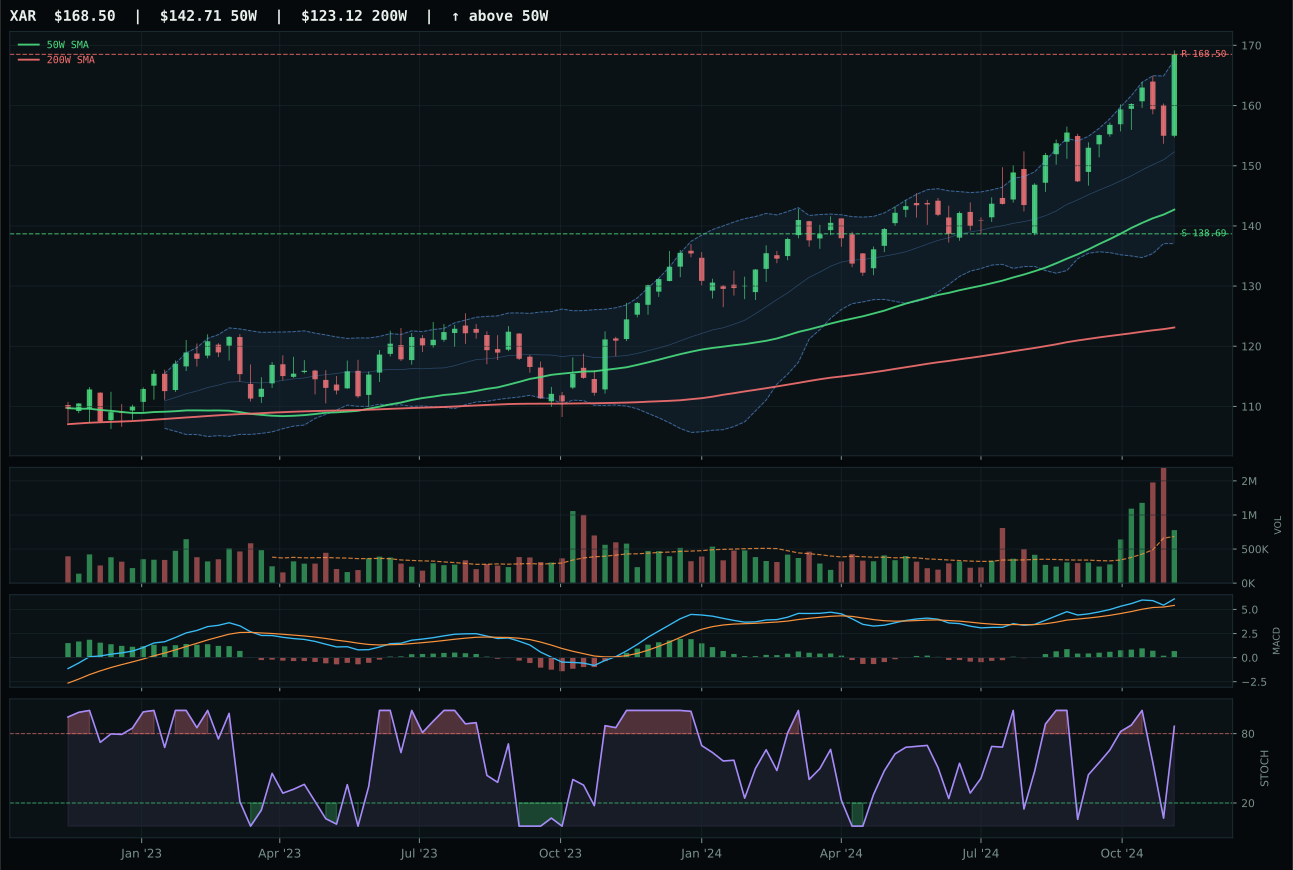
XAR has a vertical extension profile with 2.5% 13-week relative strength versus SPY.
A failed hold above support would weaken the setup.
Actionable but governed by invalidation levels.
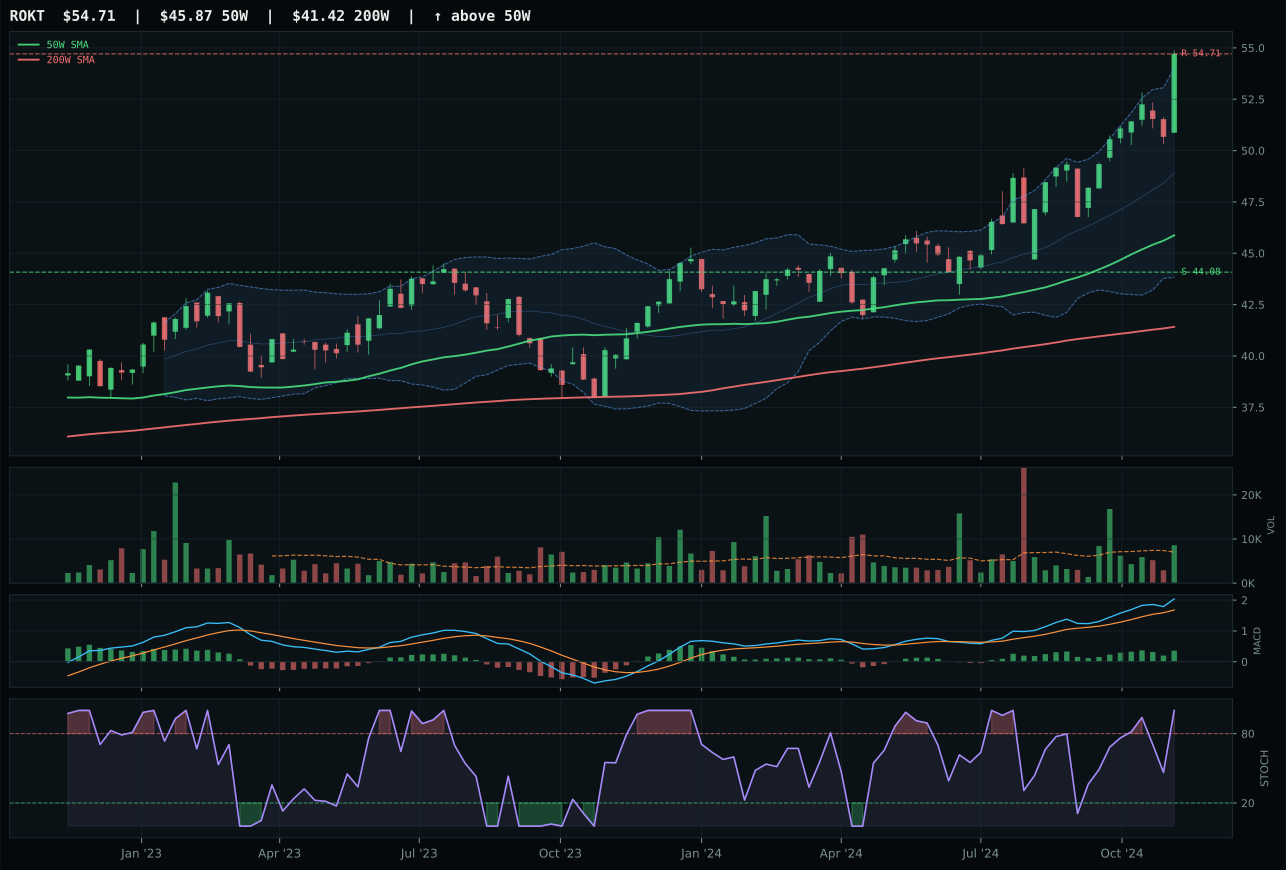
ROKT has a vertical extension profile with 3.8% 13-week relative strength versus SPY.
A failed hold above support would weaken the setup.
Tracked, but not top-2 eligible because: .
XAR edged ITA despite trailing by 0.7 points in the reasoned proof order, winning the representative slot by category-relative strength: XAR posted 0.0% while ITA fell -3.6% versus the category median. Both charts sit extended 18% above their respective 50-week moving averages with above-average volume, and both suffer from compressed timing scores (22.0 and 40.0) due to extended entry risk. XAR's advantage crystallizes in MACD: bullish but flattening matches ITA exactly, yet XAR's overbought stochastic rolling over (0.86) provides clearer exhaustion signal than ITA's falling/neutral reading. The structural cleanliness favors XAR (82.2 vs 75.0+), and on a 0.7-point margin in a tight category, that compression quality tipped the selection in XAR's direction.
Defense & Aerospace holds 5% in tier-2, positioned as the fourth-ranked category overall. The 51.2 final score reflects a deeply neutral macro regime: no category-specific descriptor profile exists to favor or penalize defense spending, leaving the allocation entirely technical. XAR's 61.0/100 technical evidence and perfectly neutral 50.0/100 macro fit mean this allocation hinges on technicals remaining intact; the moment trend deteriorates or timing compresses further, the category loses its justification. Credit stress is active (+2) and liquidity stress penalizes the setup (-4), creating a macro floor that prevents upside. This is a technical hold in a category with no strong narrative sponsorship; the tier-2 sleeve protects against the cyclical whipsaw while the portfolio focuses capital on the two overweight categories with stronger macro tailwinds.
Industrial Metals — COPX
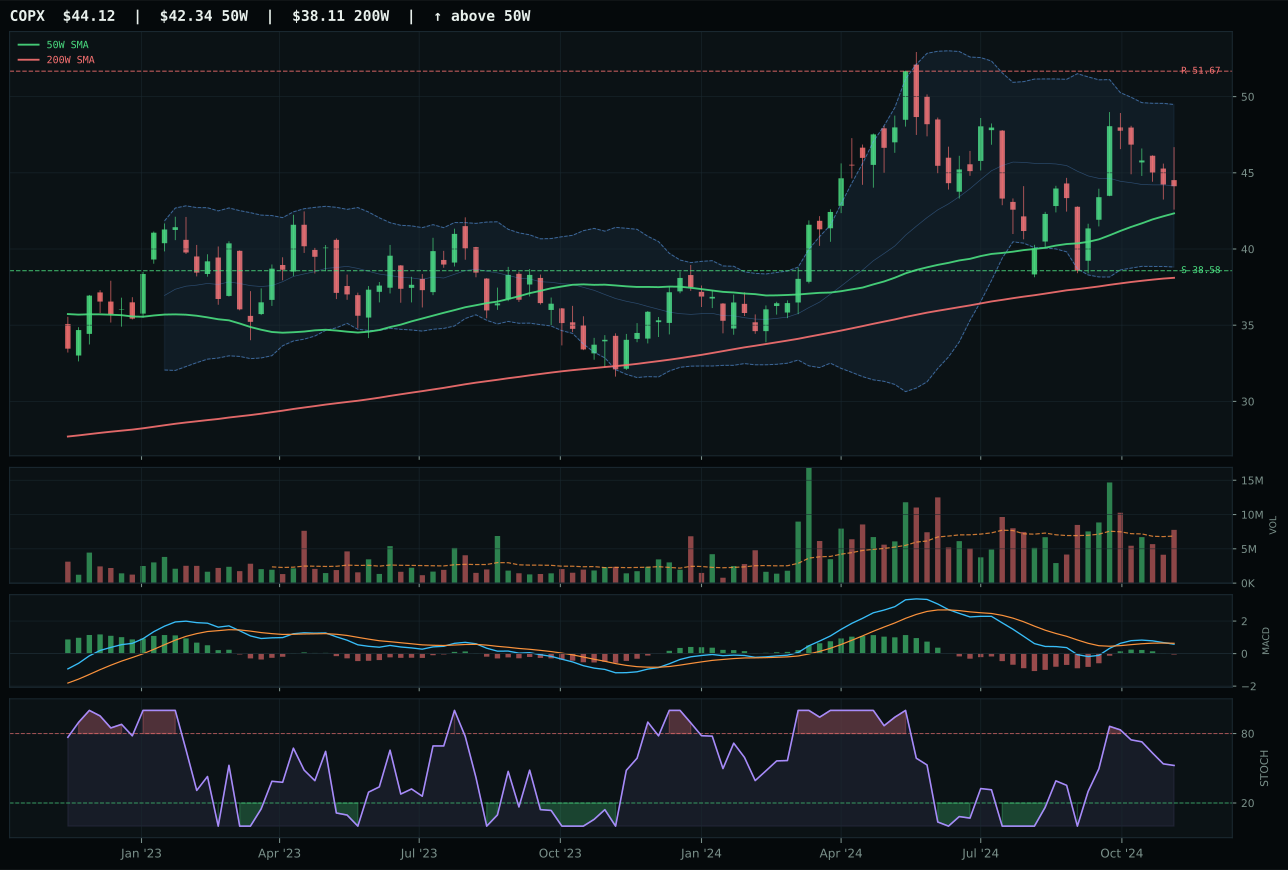
COPX has a neutral structure profile with -2.0% 13-week relative strength versus SPY.
A failed hold above support would weaken the setup.
Actionable but governed by invalidation levels.
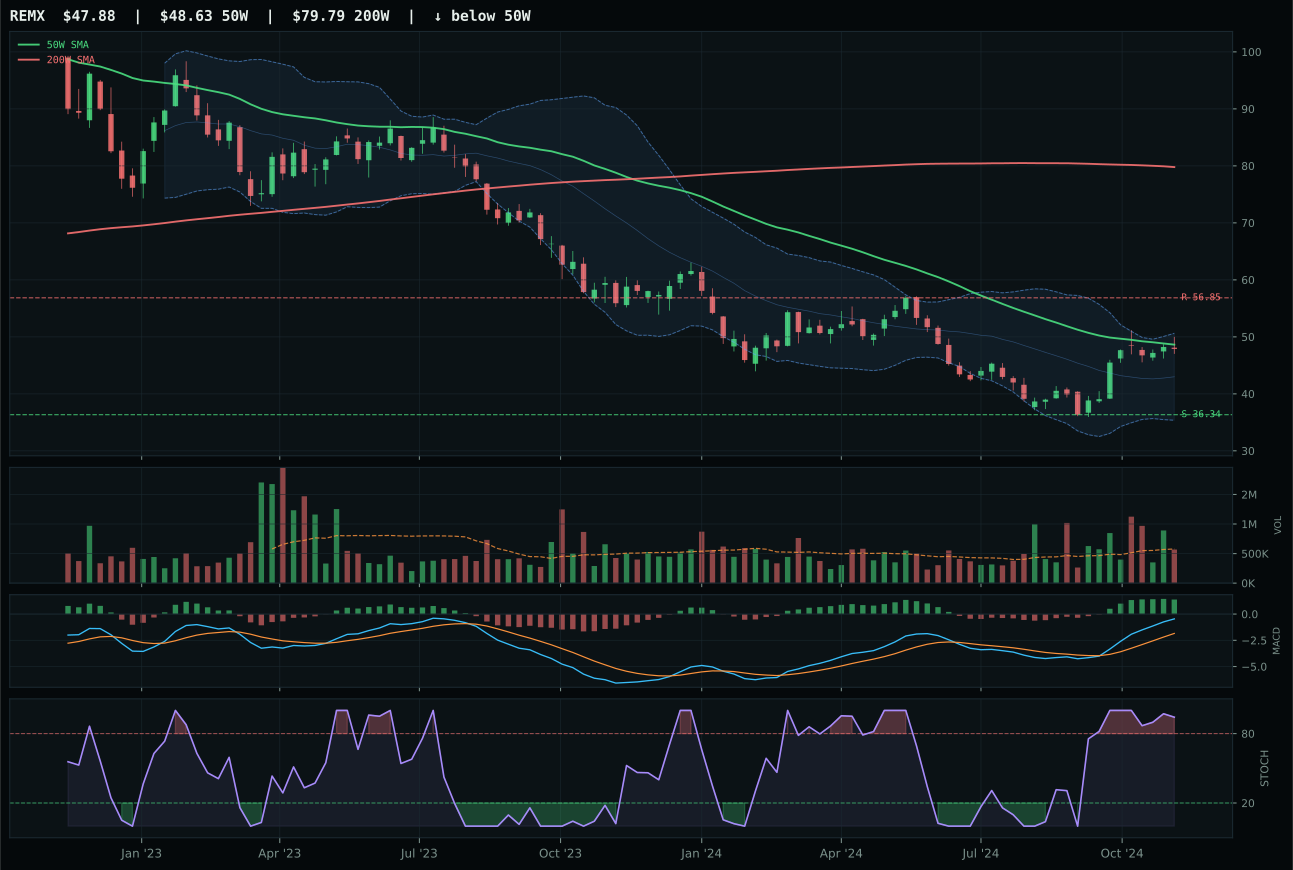
REMX has a compression near 50W profile with 11.6% 13-week relative strength versus SPY.
Extension and support failure are the main tactical risks.
Tracked, but not top-2 eligible because: structurally broken.
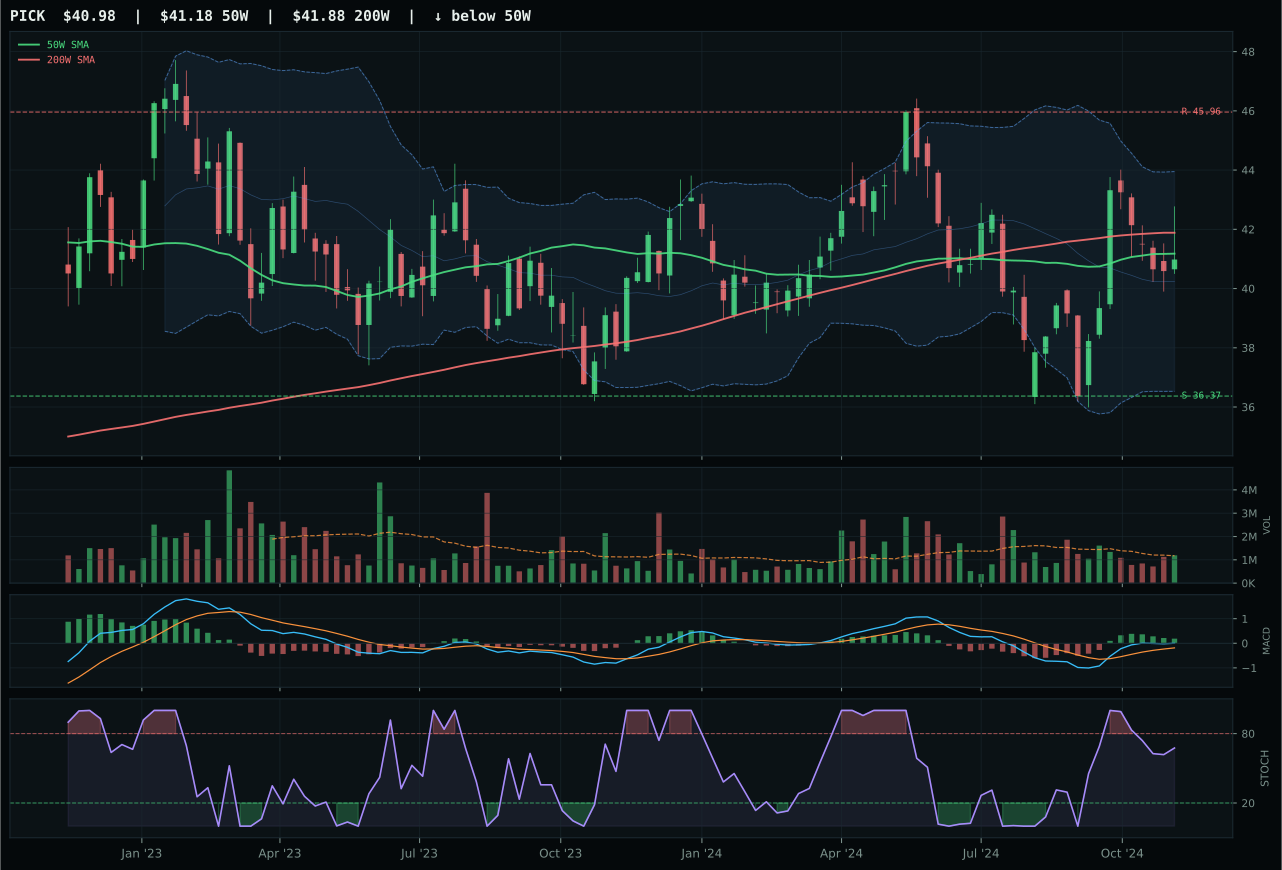
PICK has a compression near 50W profile with -4.0% 13-week relative strength versus SPY.
Extension and support failure are the main tactical risks.
Tracked, but not top-2 eligible because: structurally broken.
COPX beat REMX and PICK despite structurally neutral setup by posting superior timing (92.0 vs 100.0) and risk/reward (71.3 vs 53.9 and 68.0). Price sits only 4.2% above the 50-week moving average near the 0.382 Fibonacci decision zone, marking a setup where technical clarity matters more than extension momentum. COPX's bearish/weakening MACD and falling/neutral stochastic RSI align with the shallow pullback, creating a compressed timing score that paradoxically becomes an advantage: the setup is neither extended nor broken, it is waiting. Above-average participation (1.13x) confirms institutional accumulation into weakness. REMX's bullish and improving MACD triggered a false positive; the compression near 50W and neutral volume reveal institutional distribution rather than accumulation, invalidating the breadth signal.
Industrial Metals holds 5% as tier-2, a technical-only allocation in the face of poor macro fit. The 15.4 final score and 35.0/100 category-level macro fit tell the story: liquidity stress and credit stress combine to penalize industrial demand (-8 and -7 respectively), while disinflation pressure offers no offset. COPX's 43.8/100 technical evidence is the sole justification; the category survives allocation only because COPX's timing and risk/reward setup is defensible on a short timeframe. This is a liquidation-insurance hold rather than a growth position—COPX maintains the slot only if timing persists near the 50W and support holds at 38.58. Any break below support or deterioration in breadth should trigger reduction; macro conditions offer no sponsorship for industrial metals upside, so technical edge is mandatory to justify any position at all.
Agriculture & Livestock — MOO
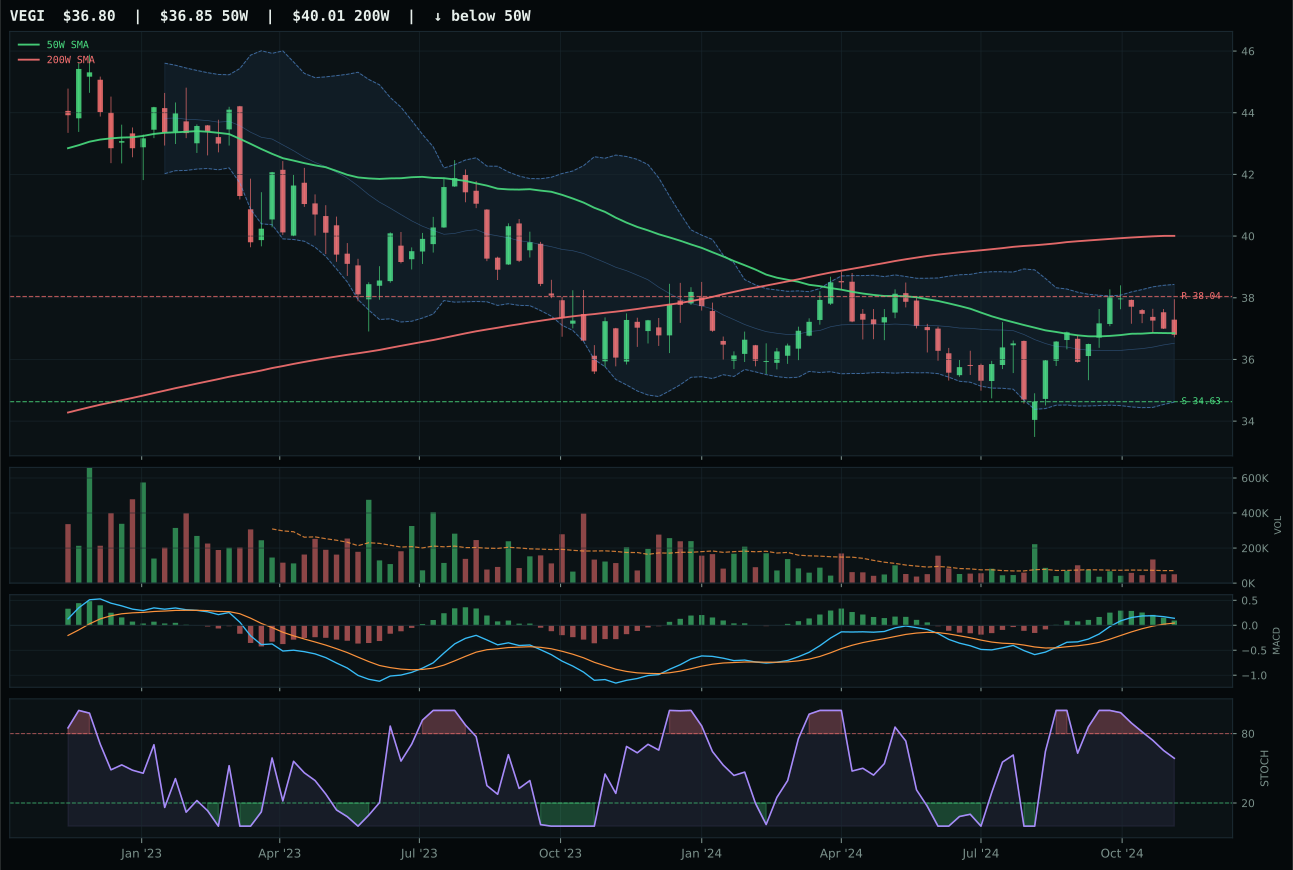
VEGI has a compression near 50W profile with -6.0% 13-week relative strength versus SPY.
Extension and support failure are the main tactical risks.
Tracked, but not top-2 eligible because: structurally broken.
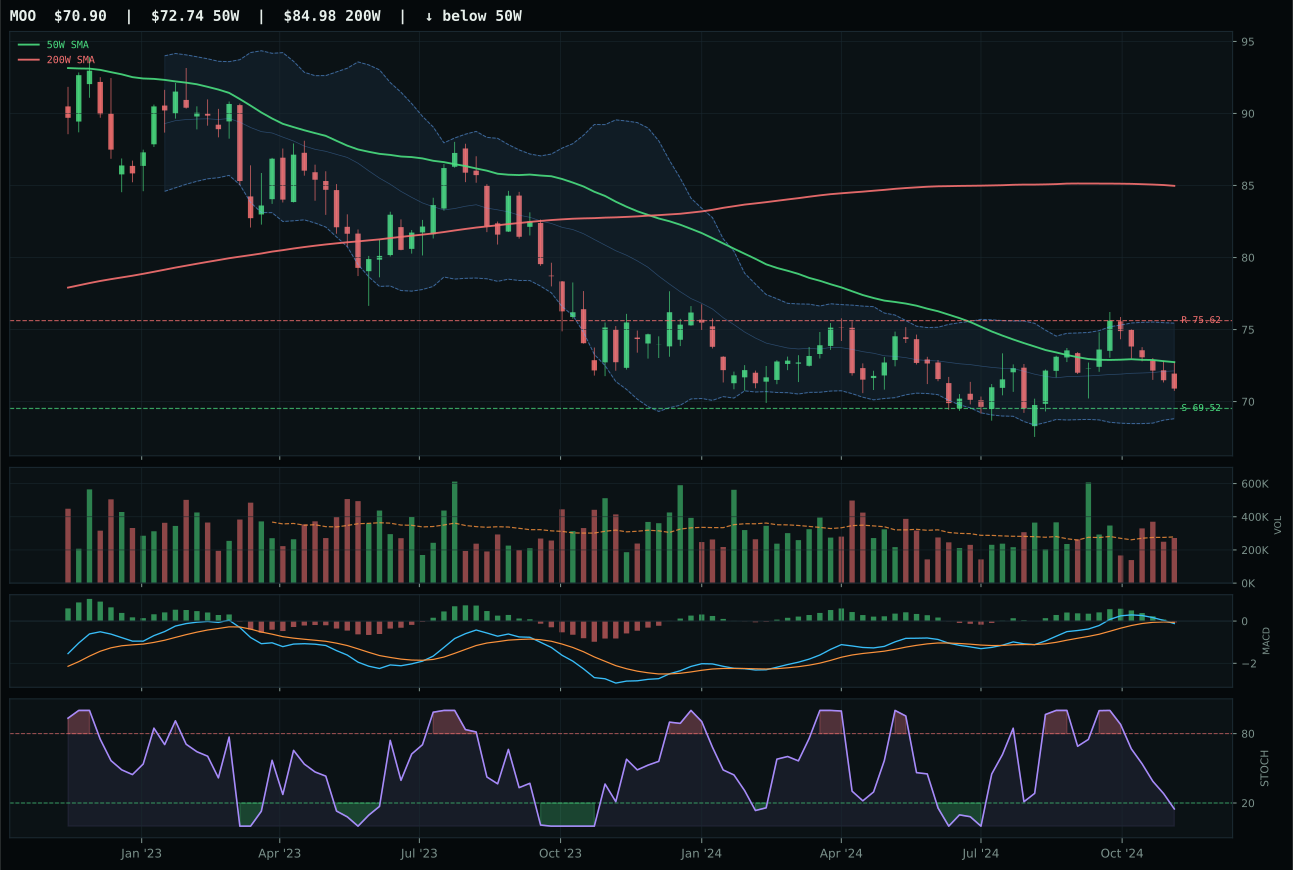
MOO has a pullback into support profile with -10.6% 13-week relative strength versus SPY.
Extension and support failure are the main tactical risks.
Tracked, but not top-2 eligible because: structurally broken.
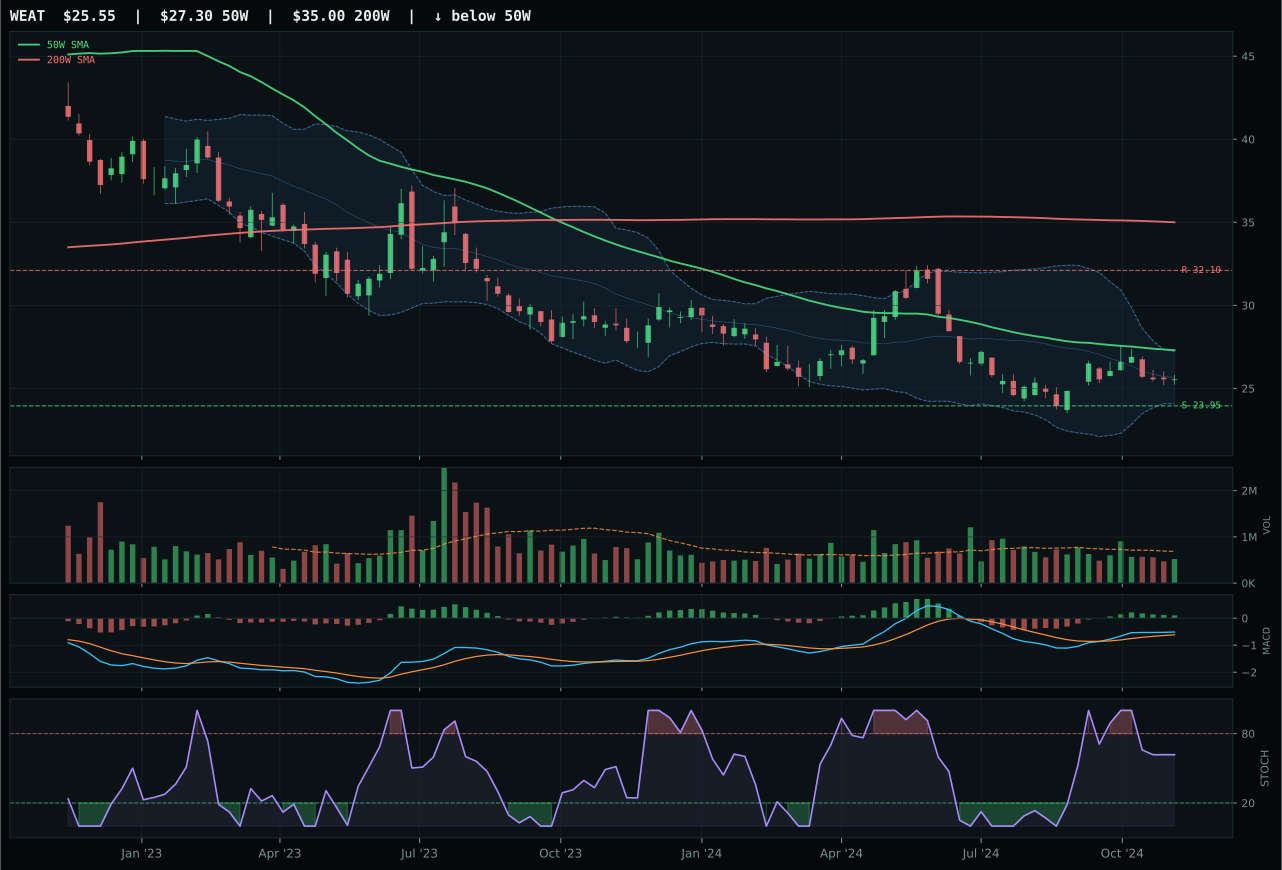
WEAT has a neutral structure profile with -11.4% 13-week relative strength versus SPY.
Extension and support failure are the main tactical risks.
Tracked, but not top-2 eligible because: structurally broken.
MOO wins a structurally broken category by losing less completely than VEGI. Price sits 2.5% below the 50-week moving average with bearish/weakening MACD and oversold stochastic RSI at 0.15, marking a classic deep-value pullback near the 0.618 Fibonacci level. The 98.0/100 risk/reward score reflects the asymmetry: upside to resistance is -6.2%, but downside to support at 69.52 is only 2.0%, creating a defined invalidation zone that appeals to mean-reversion traders. MOO's category-relative strength is neutral (0.0%) while VEGI lags at +4.6%, and the MACD bear case is unambiguous here versus VEGI's bullish but flattening signal. Neither deserves allocation in this regime, but MOO's sharper technical picture makes it the lesser evil.
Agriculture & Livestock receives 5% allocation—the category is entirely held at the tier-2 weight this week. The final score of 0.0 and ineligible status reflect structural collapse: category-level macro fit is only 32.0/100, devastated by active disinflation pressure (-8) and liquidity stress (-4) that directly penalize commodity prices and rural capex. The 3/2/1 weighted basket began at 37.9 but failed the post-test screening on leadership, volume persistence, and timing quality. MOO's 23.8/100 technical evidence and VEGI's marginally higher 42.0/100 both fall short of the threshold needed to justify even a tier-2 position. Disinflation is a structural headwind for agribusiness; reinstate this category only if macro descriptors shift toward inflation pressure or credit normalization, both of which would restore pricing power and demand.
Emerging Markets — INDA
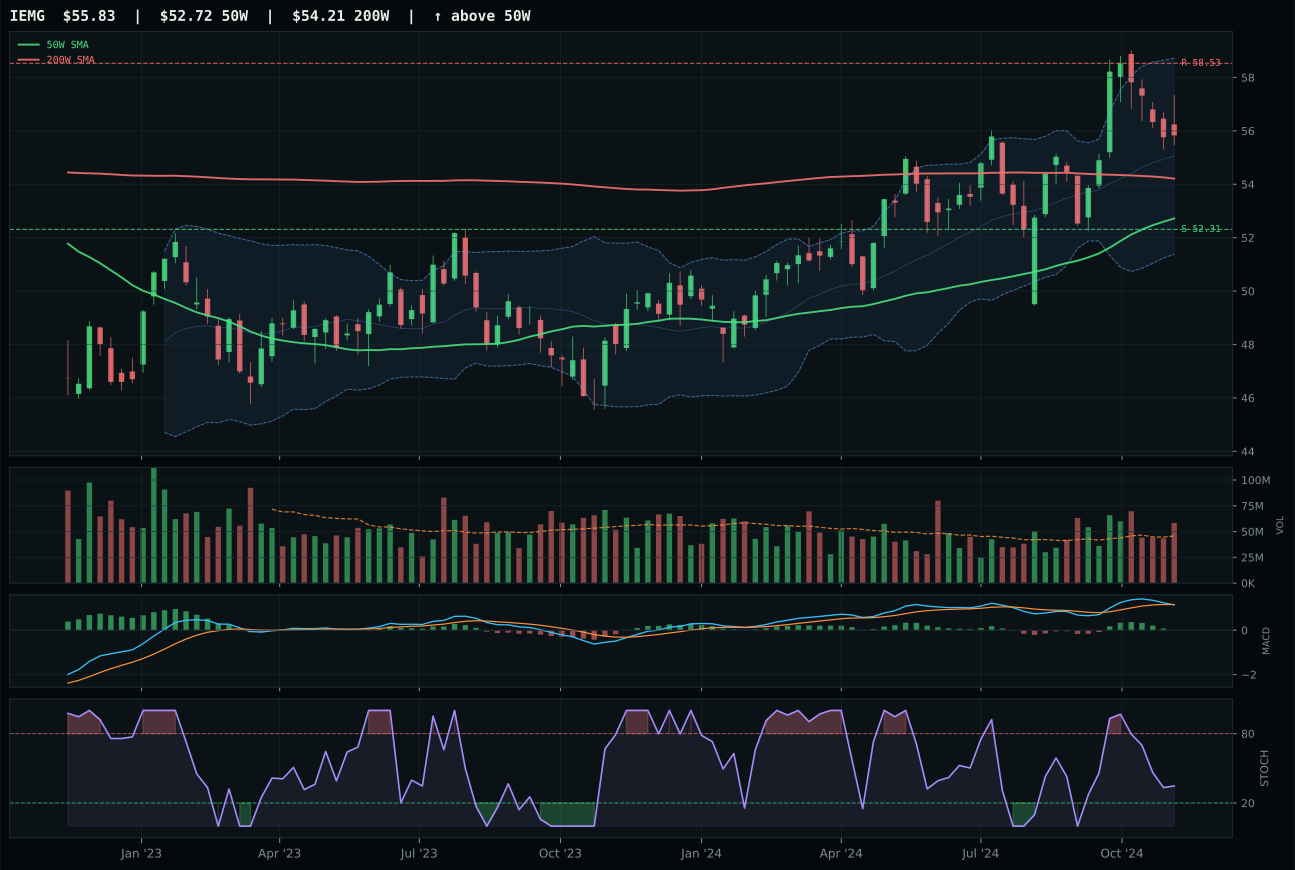
IEMG has a neutral structure profile with -6.4% 13-week relative strength versus SPY.
A failed hold above support would weaken the setup.
Actionable but governed by invalidation levels.
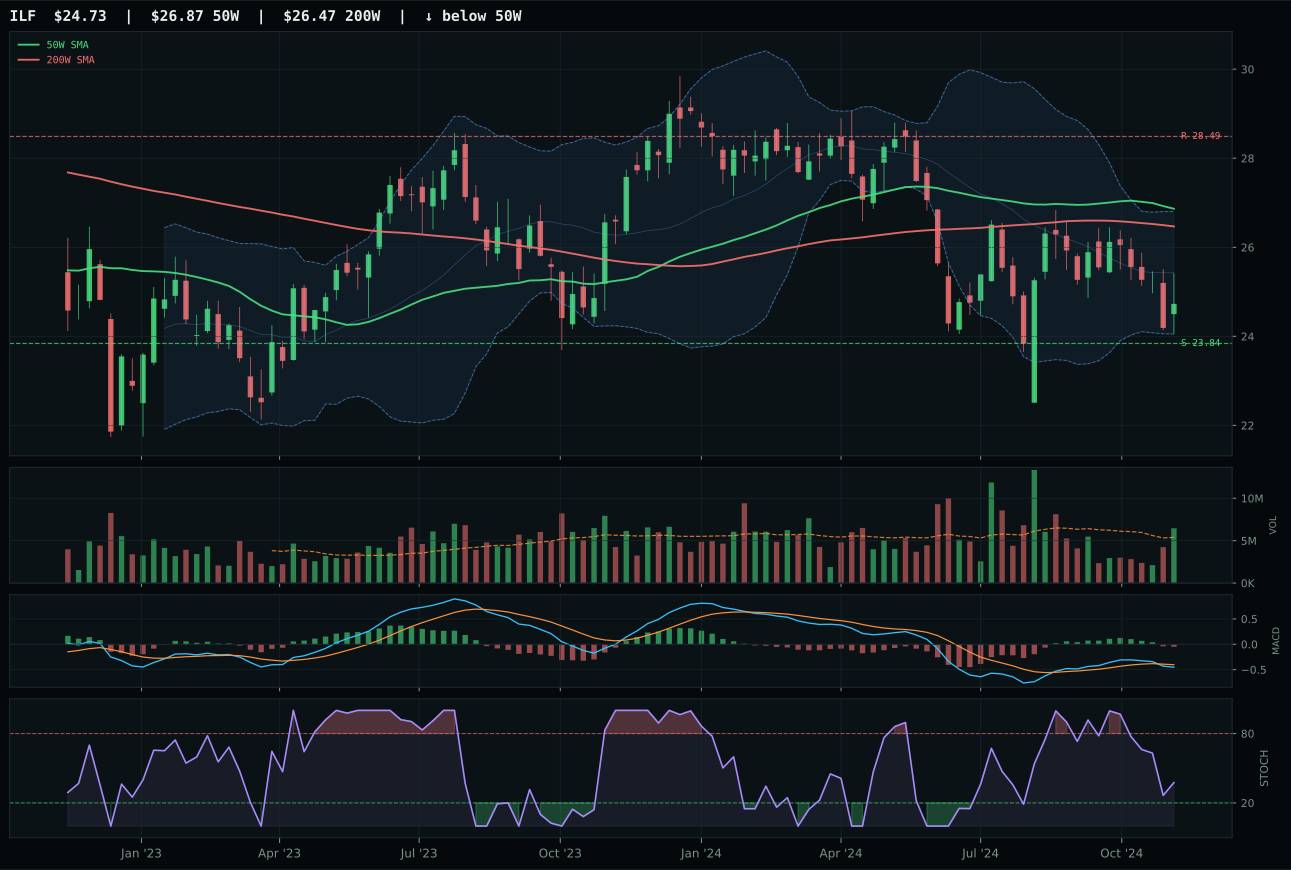
ILF has a pullback into support profile with -14.3% 13-week relative strength versus SPY.
A failed hold above support would weaken the setup.
Actionable but governed by invalidation levels.
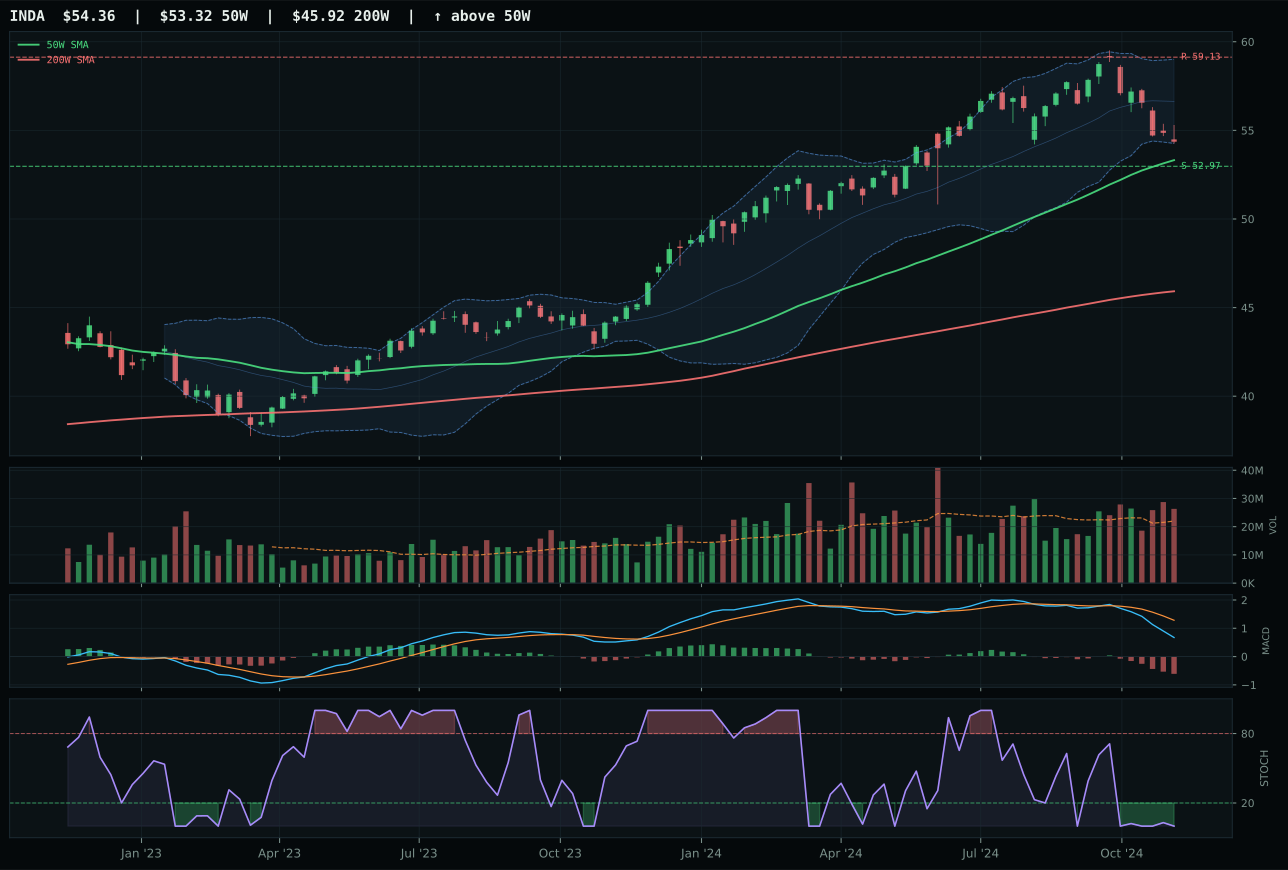
INDA has a pullback into support profile with -14.8% 13-week relative strength versus SPY.
A failed hold above support would weaken the setup.
Actionable but governed by invalidation levels.
INDA captured the category representative slot despite posting the lowest composite technical score (71 vs IEMG's 61) by combining exceptional timing and risk/reward with the only pullback-into-support setup among the three. Price sits only 2.0% above the 50-week moving average at oversold stochastic RSI (0.00) near the 0.382 Fibonacci zone, marking a disciplined mean-reversion coil rather than a trend continuation. INDA's 95.0/100 timing score and 90.0/100 risk/reward (upside -8.1%, downside +2.6%) create the sharpest invalidation structure in the category, appealing to tactical players with defined risk. IEMG's neutral structure and higher trend score (62 vs 67) cannot compensate for weaker timing (70.0 vs 95.0) and risk/reward (57.3 vs 90.0), revealing the category's setup is rewarding pullback entries over continuation plays.
Emerging Markets receives 0% allocation, entirely excluded from the portfolio. The 12.9 final score and ineligible status stem from catastrophic macro misalignment: category-level macro fit is only 30.0/100, pulverized by active credit stress and liquidity stress descriptors that each apply -10 points. These twin headwinds directly penalize emerging-market credit accessibility and foreign capital flows—the structural underpinning of EM strength. INDA's -14.8% SPY-relative weakness and -2.6% thirteen-week return reveal the technical story aligns with macro regime; this is not a false negative on technicals, it is a genuine category collapse. The only reason INDA holds any validity is the mean-reversion coil at support, but that is a tactical counter-trend trade, not a portfolio allocation. Reinstate EM exposure only when credit stress eases or liquidity normalizes; until then, this category is a value trap.
Traditional Energy — XLE
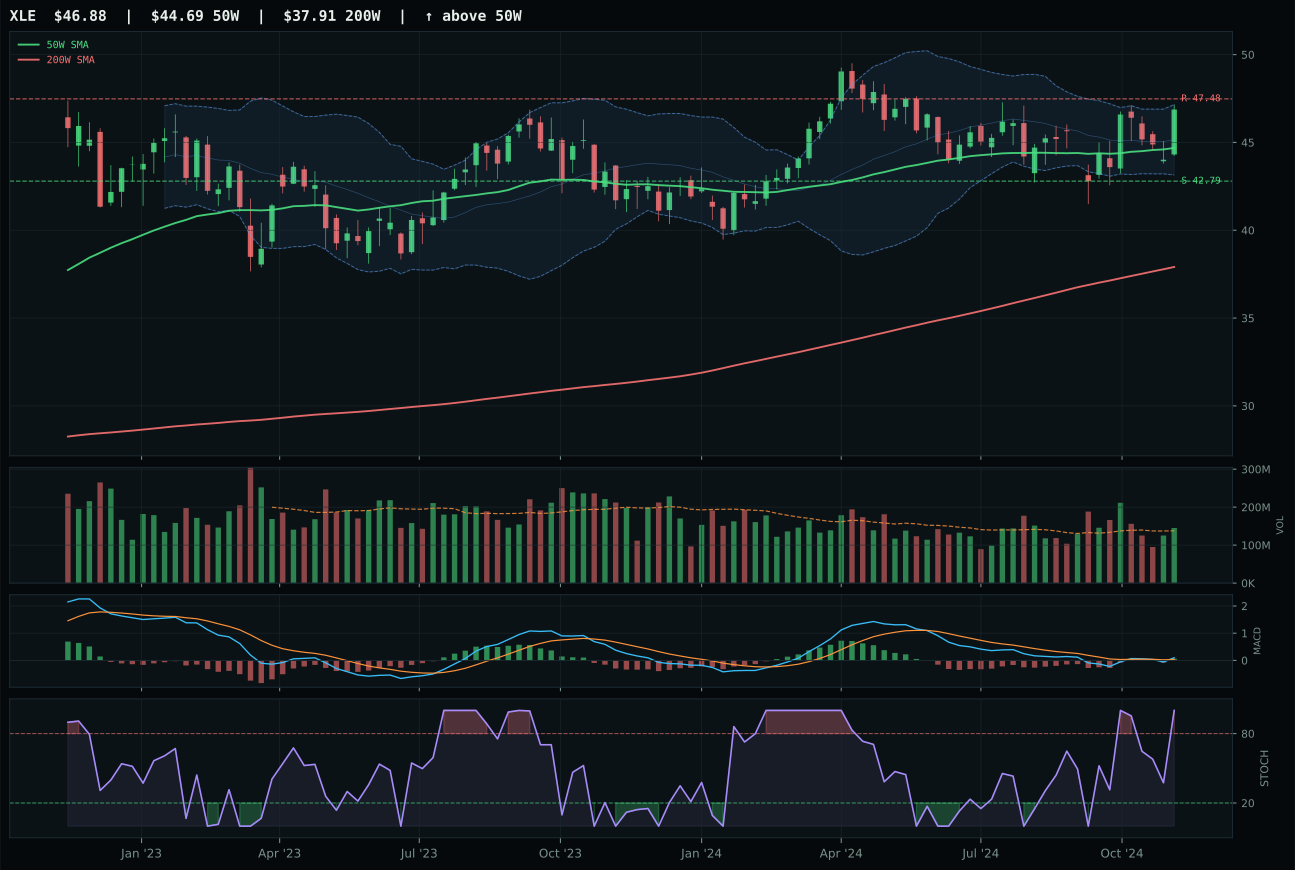
XLE has a neutral structure profile with -7.4% 13-week relative strength versus SPY.
A failed hold above support would weaken the setup.
Actionable but governed by invalidation levels.
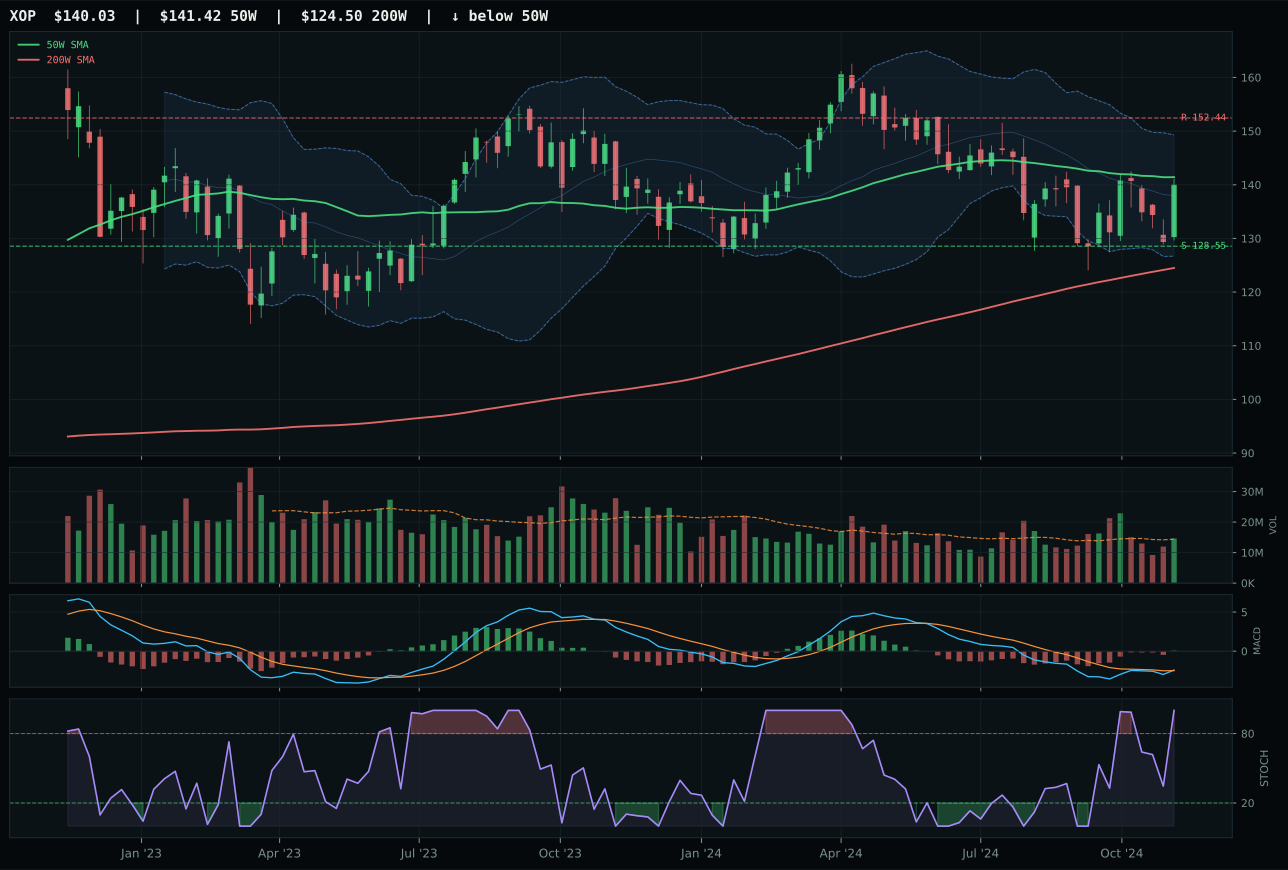
XOP has a compression near 50W profile with -9.6% 13-week relative strength versus SPY.
A failed hold above support would weaken the setup.
Actionable but governed by invalidation levels.
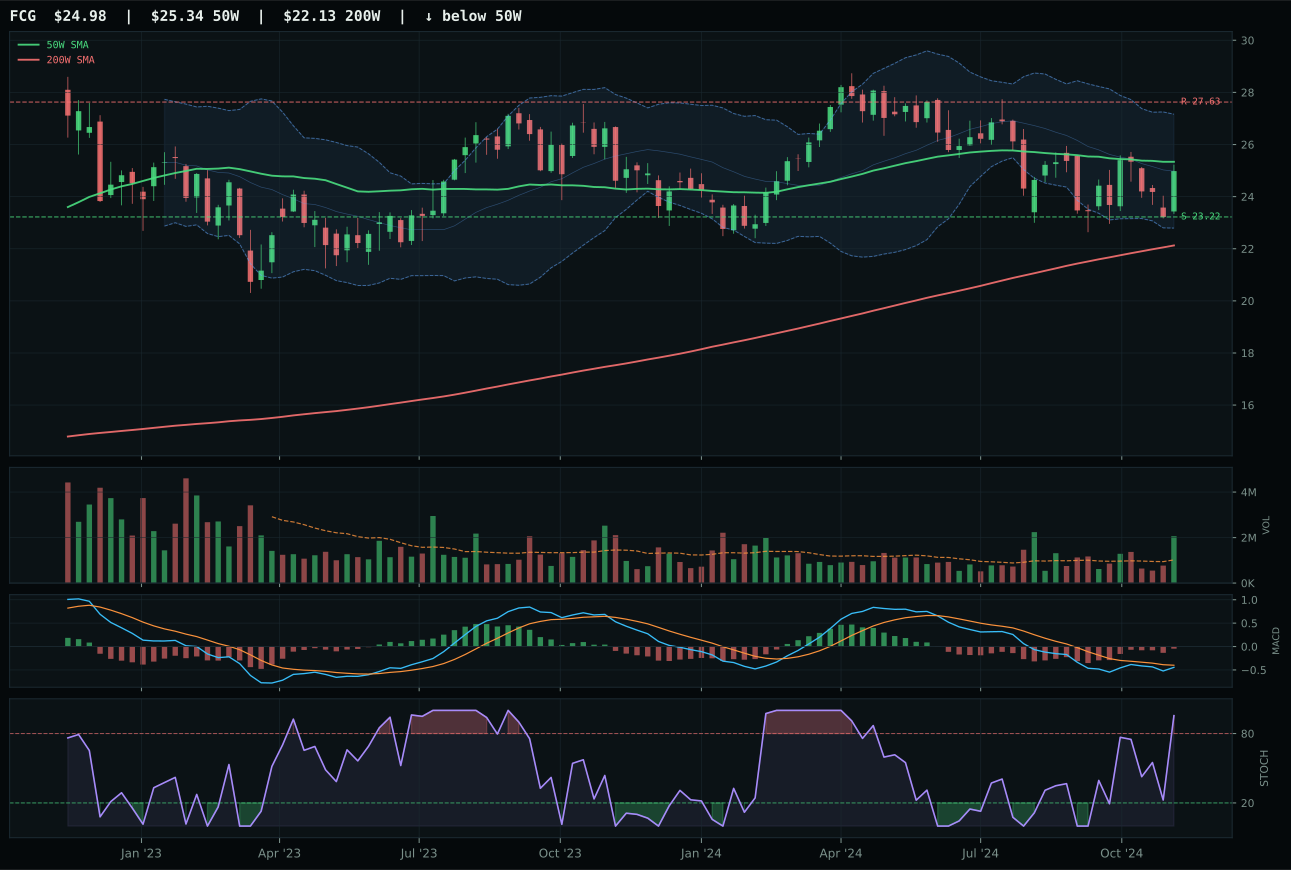
FCG has a compression near 50W profile with -10.9% 13-week relative strength versus SPY.
A failed hold above support would weaken the setup.
Actionable but governed by invalidation levels.
XLE won the category but failed to clear the allocation threshold, beating XOP on category-relative strength (2.2% vs 0.0%) despite being structurally neutral and compressed near the 50-week moving average. Both display bullish and improving MACD with overbought stochastic momentum, yet XLE's slight relative strength advantage tilts the decision in a category where technical differentiation is razor-thin. XOP's setup is compression near 50W with -9.6% SPY-relative weakness, revealing exploration beta is rolling over; XLE's neutral structure and +4.9% thirteen-week return are equally weak, yet marginally less negative. The score gap of -5.6 points understates the category's distress: both names are fighting against macro, not flowing with it.
Traditional Energy receives 0% allocation, entirely excluded from the portfolio this week. The 11.7 final score and failed eligibility screening reflect devastating macro headwinds: category-level macro fit is only 16.0/100, crushed by active disinflation pressure (-10) and both credit stress and liquidity stress penalties (-7 each). XLE's 62.3/100 technical evidence cannot overcome the regime; disinflation means falling inflation expectations translate to lower energy prices, and credit stress starves industrial demand. The reasoned ETF proof order (XOP 53.7, XLE 51.9, FCG 49.2) shows all three names are fighting structural headwinds, with XLE winning only a Pyrrhic technical edge in a sector that offers no macro sponsorship. Reinstate energy allocation only when disinflation pressure reverses or credit stress eases; until then, this category is a liquidity trap.