
2024-11-01
Informational purposes only. The content in this report, including allocations, analysis, and commentary, is provided solely for informational and educational purposes. It does not constitute financial advice, investment advice, trading advice, or any other type of advice. Past performance does not guarantee future results. Always conduct your own research and consult a qualified financial professional before making investment decisions.
Weekly Allocation
| Ticker | Category | Weight | Role |
|---|---|---|---|
| FBTC | 50% | Overlay | |
| GLD | Precious Metals | 10% | Top-2 (10%) |
| IGV | Technology | 10% | Top-2 (10%) |
| PAVE | Utilities & Infrastructure | 5% | Tier-2 (5%) |
| BOTZ | AI | 5% | Tier-2 (5%) |
| NLR | Nuclear Energy | 5% | Tier-2 (5%) |
| MOO | Agriculture & Livestock | 5% | Tier-2 (5%) |
| XAR | Defense & Aerospace | 5% | Tier-2 (5%) |
| COPX | Industrial Metals | 5% | Tier-2 (5%) |
Trade Instructions — Monday Open
Sell the tranche from 2024-10-04 (completing its 4-week hold). Buy the new tranche. Instructions show net portfolio changes — same-asset positions cancel, weight changes show the delta.
| Action | Ticker | Instruction |
|---|---|---|
| SELL | PAVE | Sell 12% of PAVE position (reduce 10.00% → 8.75%) |
| SELL | ITA | Sell 50% of ITA position (reduce 2.50% → 1.25%) |
| SELL | URA | Sell 25% of URA position (reduce 5.00% → 3.75%) |
| SELL | XLK | Sell entire XLK position (1.25% of portfolio) |
| SELL | SMH | Sell 33% of SMH position (reduce 3.75% → 2.50%) |
| BUY | XAR | Buy XAR — 20.00% of freed cash (adds 1.25% to portfolio) |
| BUY | IGV | Buy IGV — 40.00% of freed cash (adds 2.50% to portfolio) |
| BUY | BOTZ | Buy BOTZ — 20.00% of freed cash (adds 1.25% to portfolio) |
| BUY | NLR | Buy NLR — 20.00% of freed cash (adds 1.25% to portfolio) |
Current Portfolio After Trade
Combined holdings across all 4 active tranches. Each tranche is 25% of the portfolio.
| Ticker | % of Portfolio | Weight Bar |
|---|---|---|
| FBTC | 50.00% | |
| PAVE | 8.75% | |
| GLD | 7.50% | |
| COPX | 5.00% | |
| URA | 3.75% | |
| MOO | 3.75% | |
| XAR | 3.75% | |
| IGV | 3.75% | |
| SMH | 2.50% | |
| CIBR | 2.50% | |
| SLV | 2.50% | |
| ITA | 1.25% | |
| AIQ | 1.25% | |
| INDA | 1.25% | |
| BOTZ | 1.25% | |
| NLR | 1.25% |
Macro Regime — Disinflation
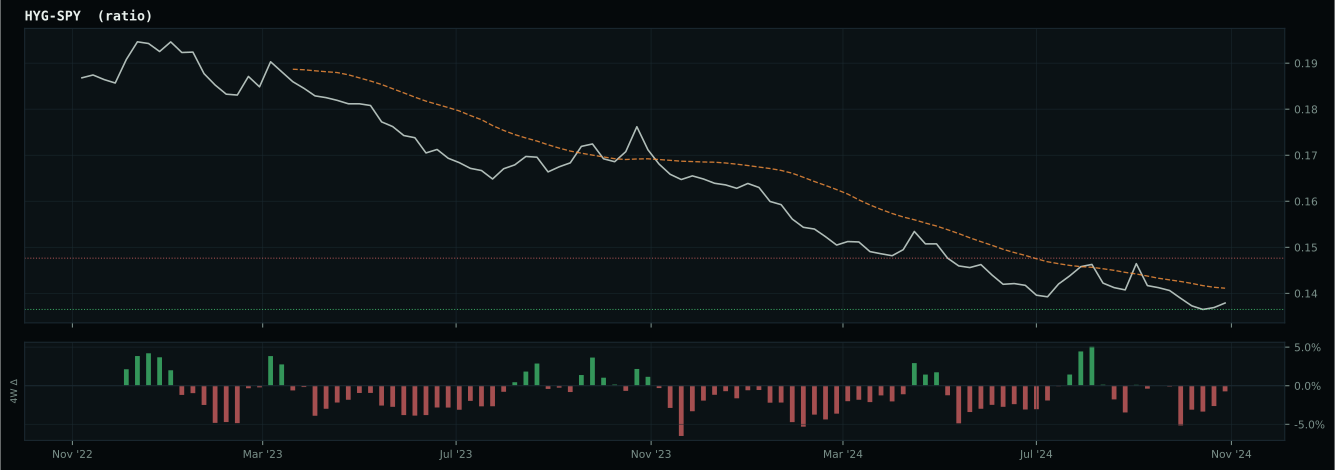
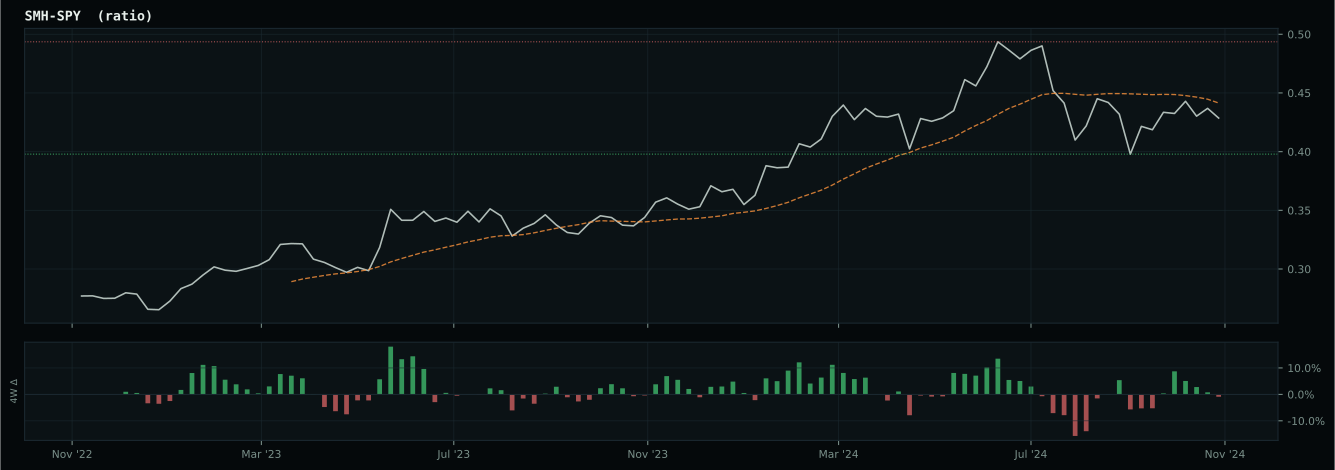
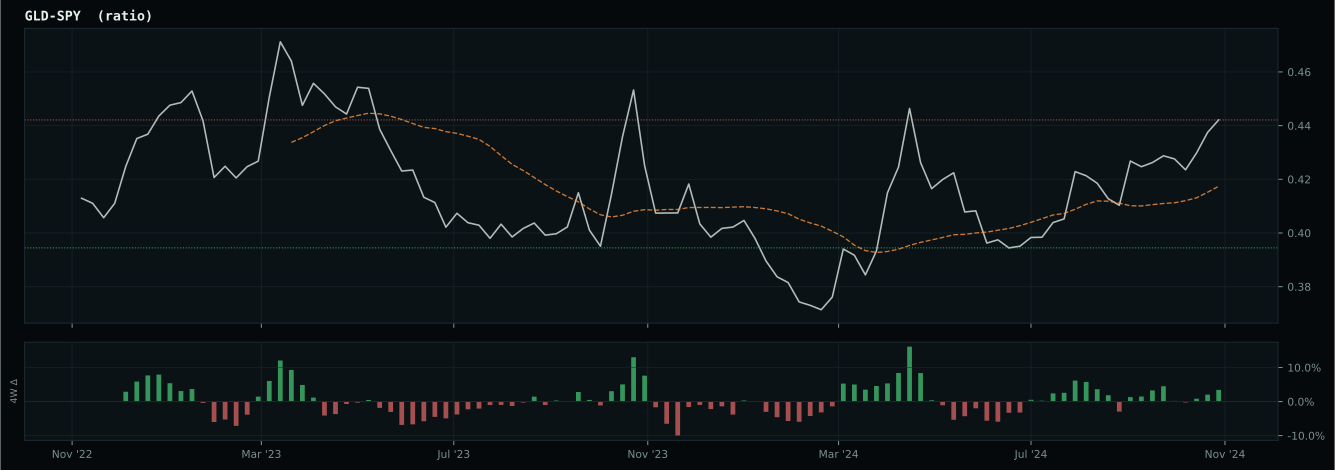
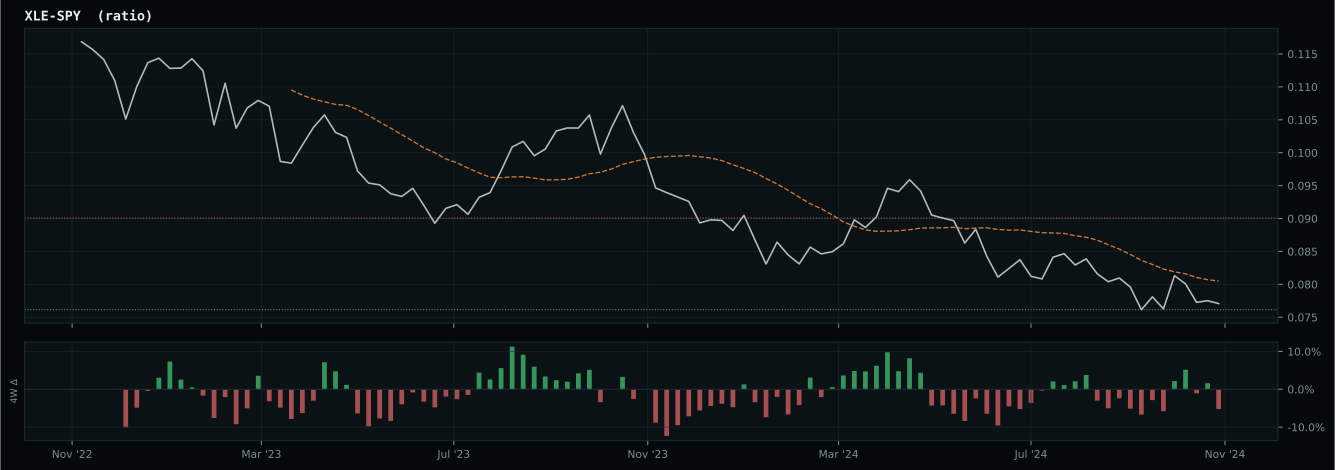
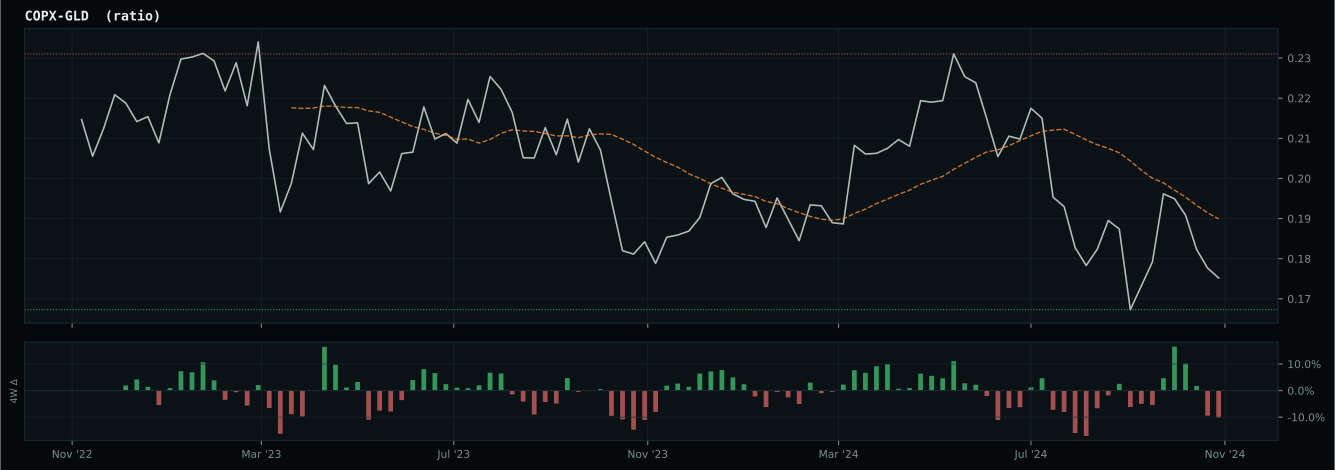
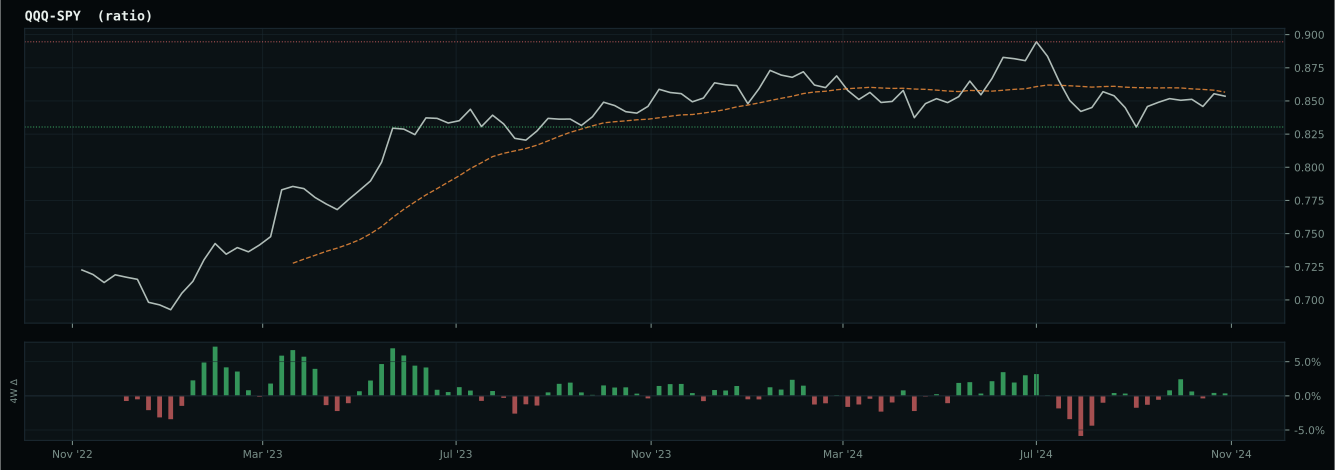
Macro Evidence Charts
Market-implied signals behind the macro regime scores. Each ratio compares two assets; the direction and slope of the ratio is what the macro engine reads.
Crypto Regime — TrendBTC
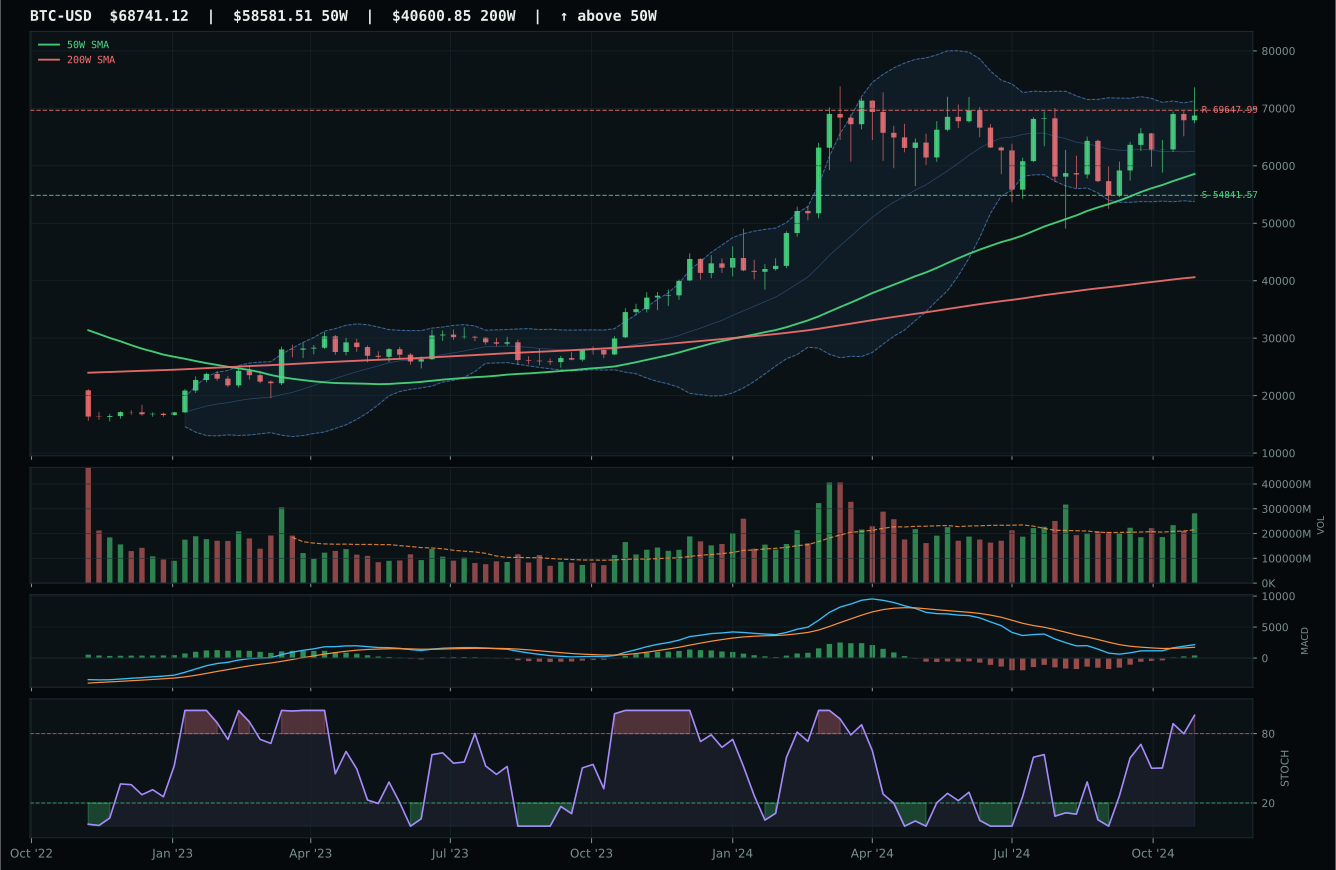
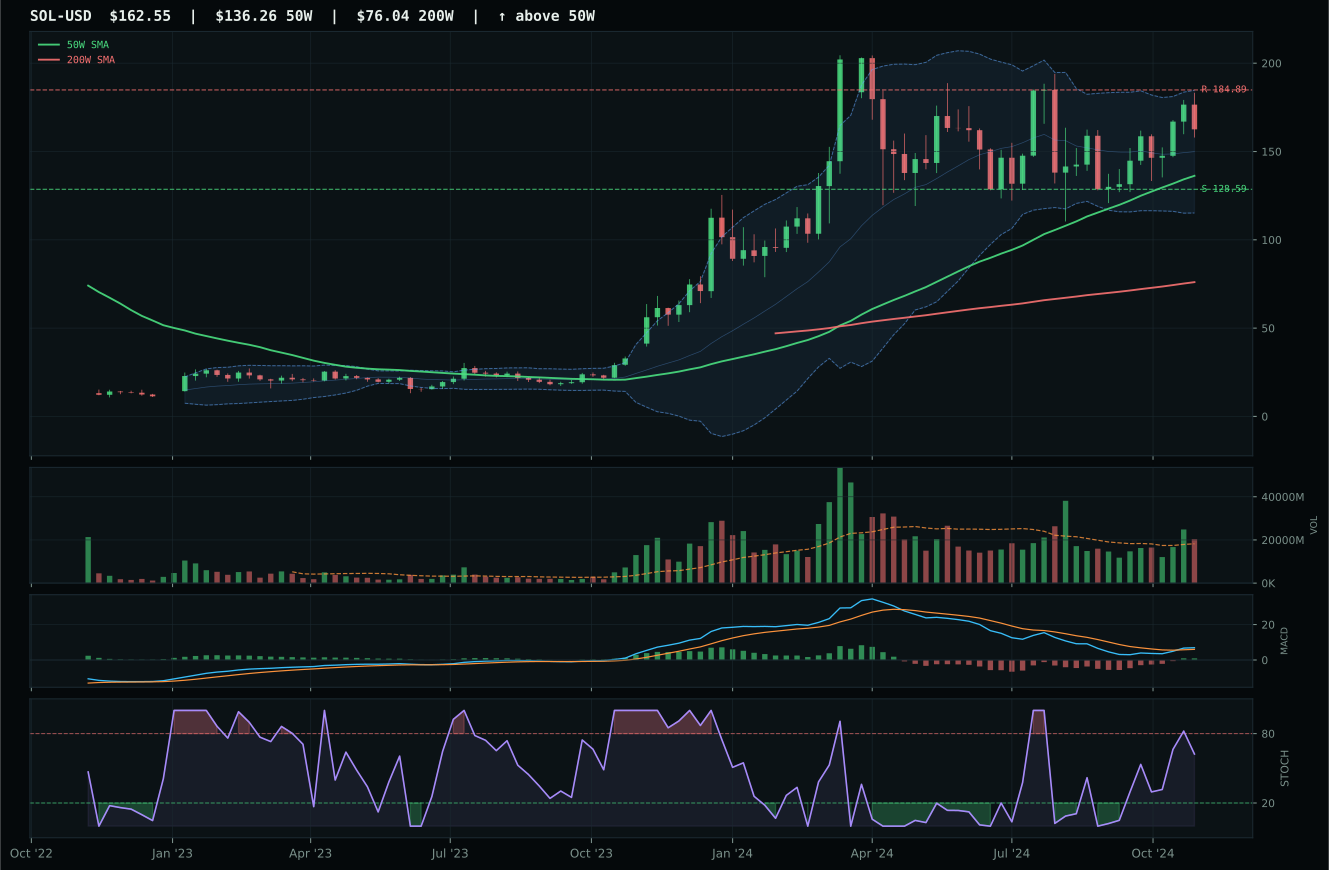
ValueBTC not armed: BTC has not made the first post-breakdown touch of the 200W buy zone after losing the 50W
TrendBTC confirmed: 2 consecutive closes above rising/flat 50W SMA
one or more available conditions failed
Category Rankings
| Rank | Category | Winner | Score | Alloc | 4W Ret | Peers (4W) |
|---|---|---|---|---|---|---|
| 1 | Precious Metals | GLD | 75.2 | 20% | -3.50% | SLV -6.5% · GDX -7.7% |
| 2 | Technology | IGV | 60.8 | 20% | +14.30% | CIBR +5.4% · XLK +4.4% |
| 3 | Utilities & Infrastructure | PAVE | 60.7 | 10% | +11.19% | XLU +7.2% · IGF +4.5% |
| 4 | AI | BOTZ | 60.5 | 10% | +4.33% | SMH -0.8% · AIQ +5.5% |
| 5 | Nuclear Energy | NLR | 56.5 | 10% | +9.33% | URA +9.2% · URNM +5.7% |
| 6 | Defense & Aerospace | XAR | 39.3 | 10% | +14.38% | ROKT +19.2% · ITA +7.3% |
| 7 | Industrial Metals | COPX | 18.4 | 10% | -4.94% | REMX -4.7% · PICK -2.5% |
| 8 | Emerging Markets | INDA | 14.6 | 10% | +0.64% | IEMG -3.4% · ILF -6.7% |
| 9 | Traditional Energy | XLE | 3.3 | 0% | +7.75% | XOP +11.7% · FCG +11.4% |
| 10 | Agriculture & Livestock | MOO | — | 0% | -0.01% | VEGI +3.9% · WEAT -6.9% |
Precious Metals — GLD
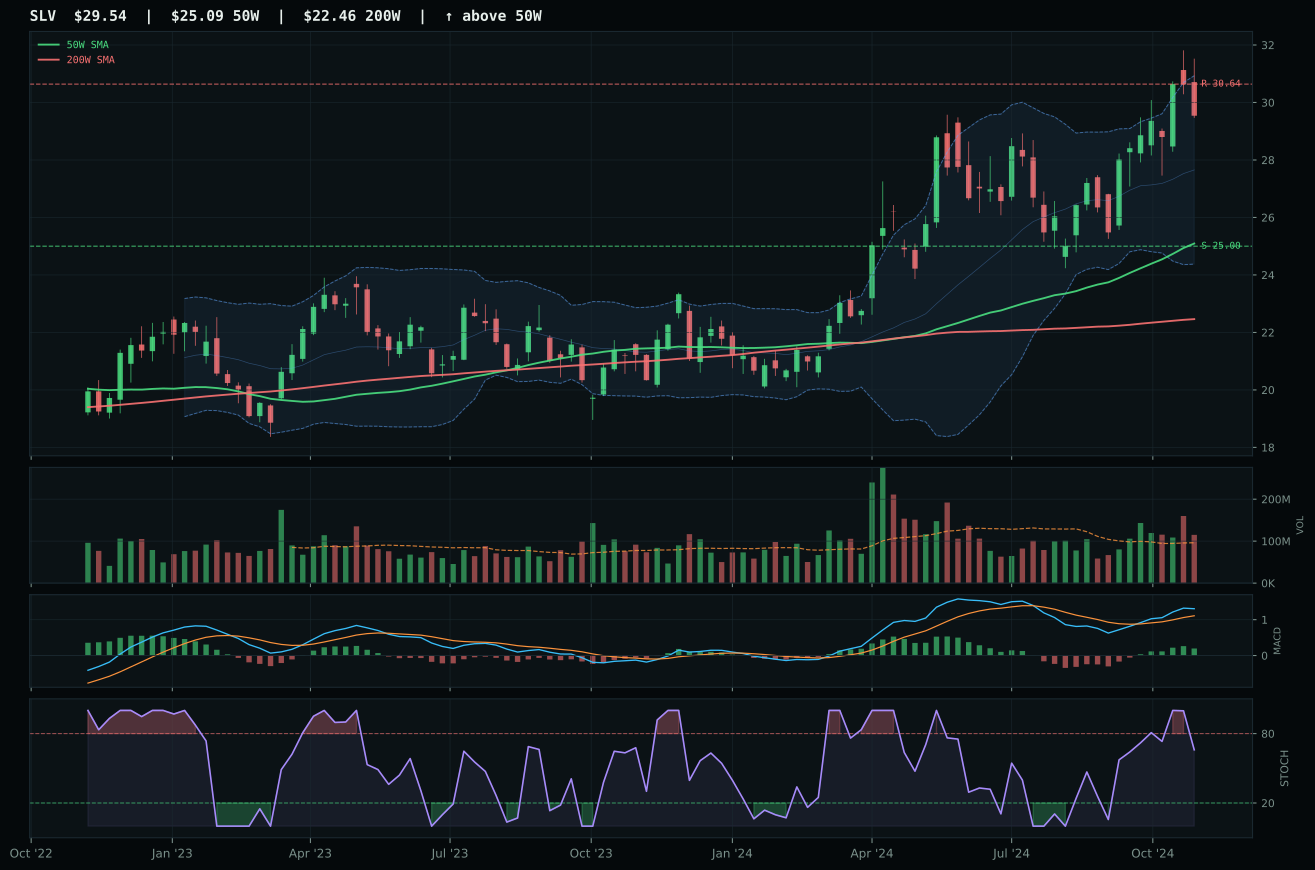
SLV has a vertical extension profile with 6.3% 13-week relative strength versus SPY.
A failed hold above support would weaken the setup.
Actionable but governed by invalidation levels.
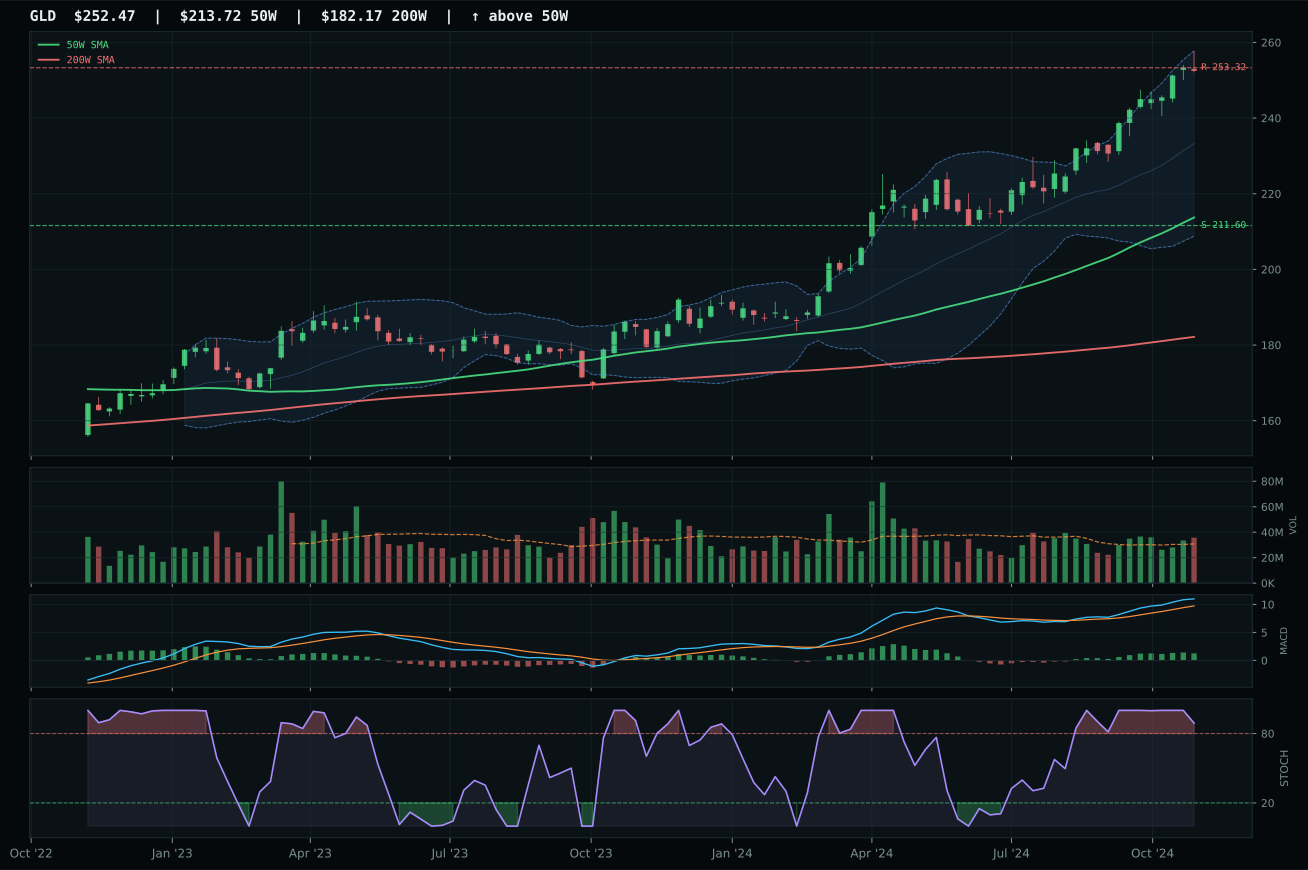
GLD has a vertical extension profile with 4.9% 13-week relative strength versus SPY.
A failed hold above support would weaken the setup.
Actionable but governed by invalidation levels.
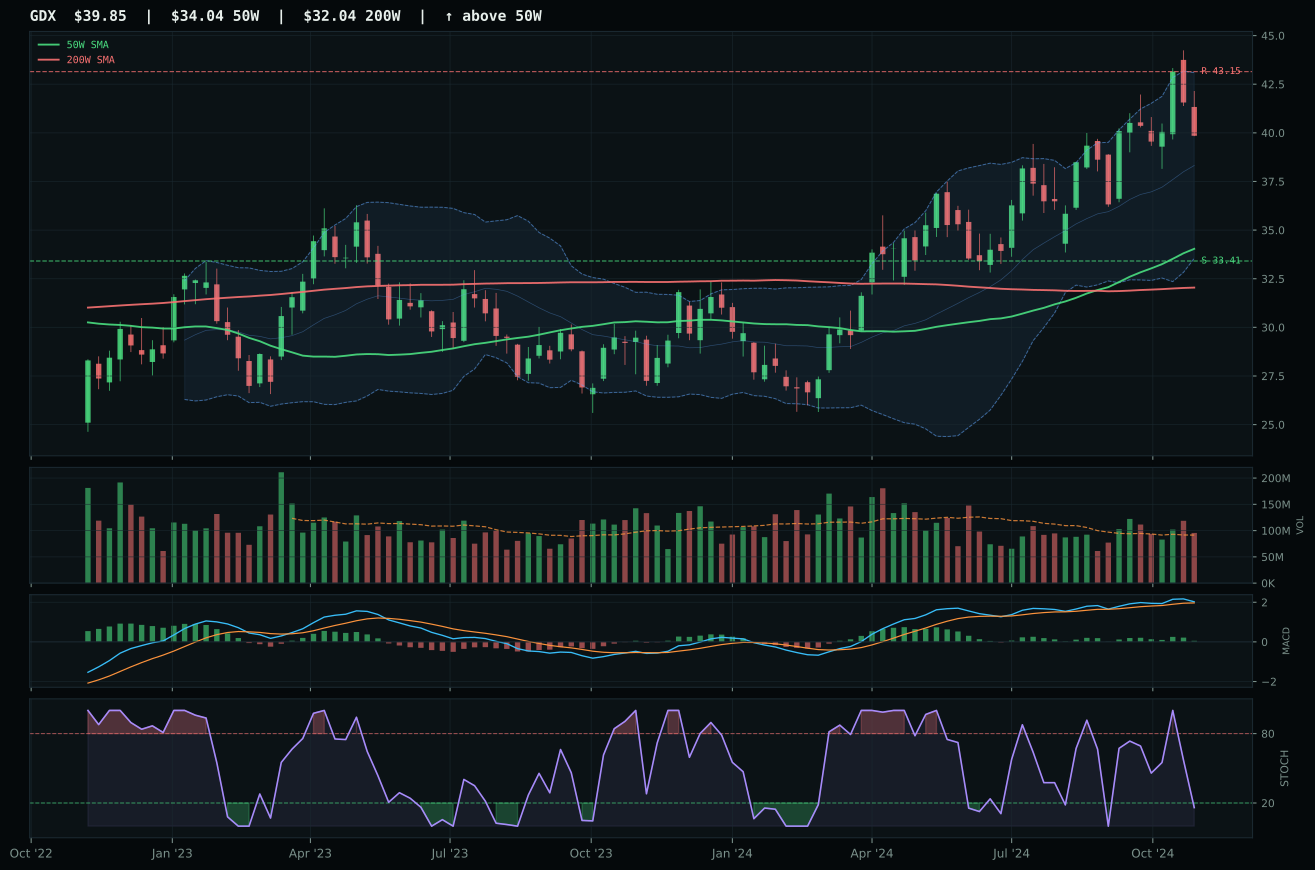
GDX has a vertical extension profile with 2.1% 13-week relative strength versus SPY.
A failed hold above support would weaken the setup.
Actionable but governed by invalidation levels.
GLD claimed the precious metals crown and a top-2 allocation slot by posting perfect trend 100.0 and superior structure (81.1 vs SLV's 74.7), though the victory masks a critical weakness: price at 18.1% above the 50-week moving average is dangerously extended into Fibonacci 0.236 territory, leaving only -0.3% upside to resistance at 253.32. The 12.0% thirteen-week return and 4.9% relative strength to SPY confirm institutional accumulation, and volume above-average participation (1.16x) shows the bid remains present, yet stochastic RSI overbought-rolling-over at 0.89 is a textbook peak-confirmation pattern. SLV lost because its timing score of 53 lagged GLD's 27 (both metrics penalize extension, but GLD's superior structure masking and MACD improvement offset the timing deficit), and macro fit at 52 versus GLD's 72 proved decisive—monetary hedge bid at +14 for both, but GLD's cleaner evaluation as pure monetary hedge beat SLV's hybrid industrial-monetary profile in a disinflation regime.
Precious Metals ranked second among ten categories at 75.2 and earned its full 10% allocation because monetary hedge sponsorship (+14 points) overwhelmed both disinflation uncertainty and liquidity concerns in the current macro environment. The category-level macro fit of 78.0/100 is the highest reading in this week's allocation mix, driven by disinflation tailwind (+8) and explicit monetary hedge bid (+14), making this one of the few categories actively accelerating from macro regime change rather than fighting it. GLD's thirteen-week return of 12.0% and above-average volume at 1.16x baseline confirm that institutional flows are real; the price extension to 239.16 (near the 0.236 Fibonacci level) creates entry risk, but the setup is orderly enough that pullback-buyers are likely to appear above support at 211.60. Hold the 10% allocation; any deterioration in MACD or loss of the 50-week moving average would signal a regime break worth monitoring, but current tape remains supportive.
Technology — IGV
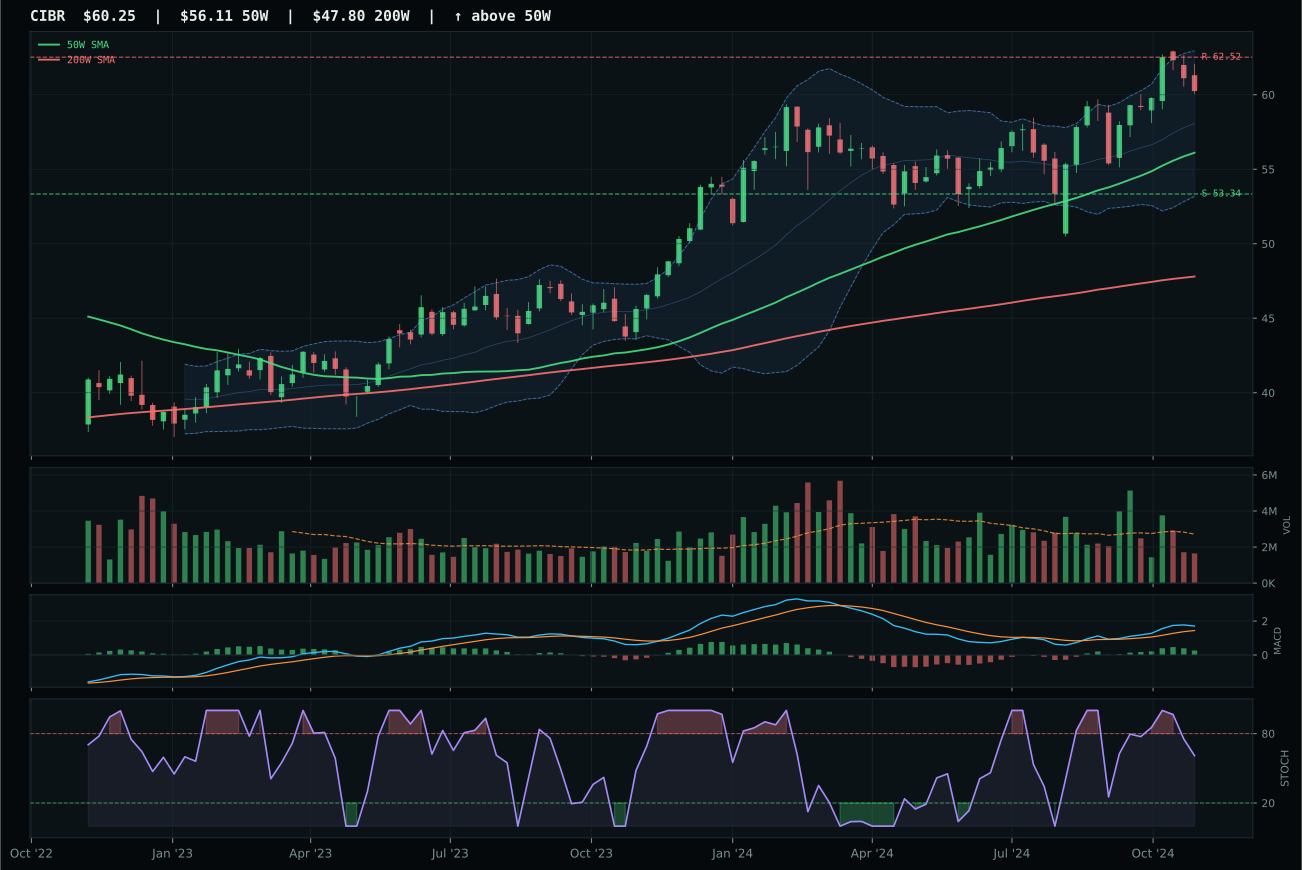
CIBR has a neutral structure profile with 5.8% 13-week relative strength versus SPY.
A failed hold above support would weaken the setup.
Actionable but governed by invalidation levels.
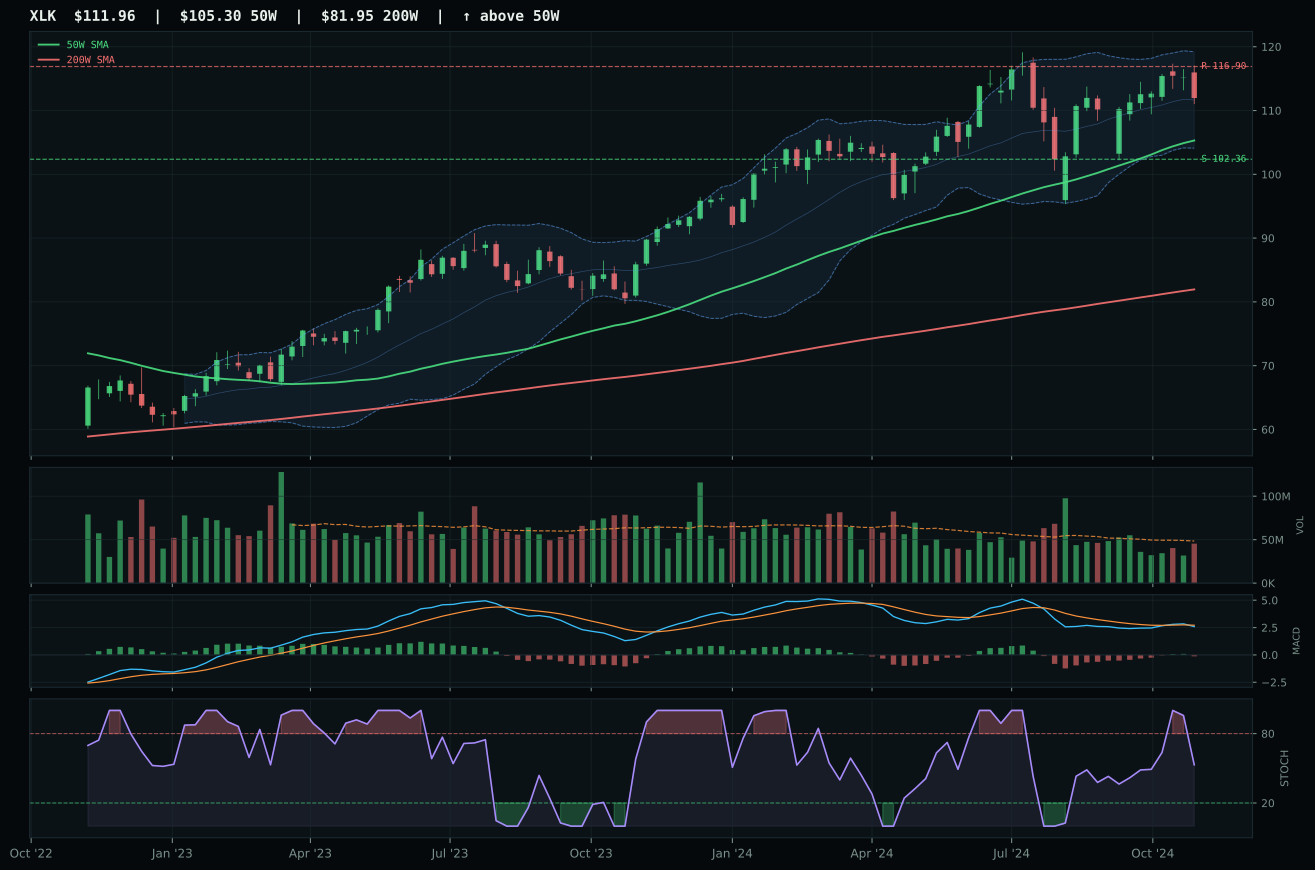
XLK has a neutral structure profile with 2.2% 13-week relative strength versus SPY.
A failed hold above support would weaken the setup.
Actionable but governed by invalidation levels.
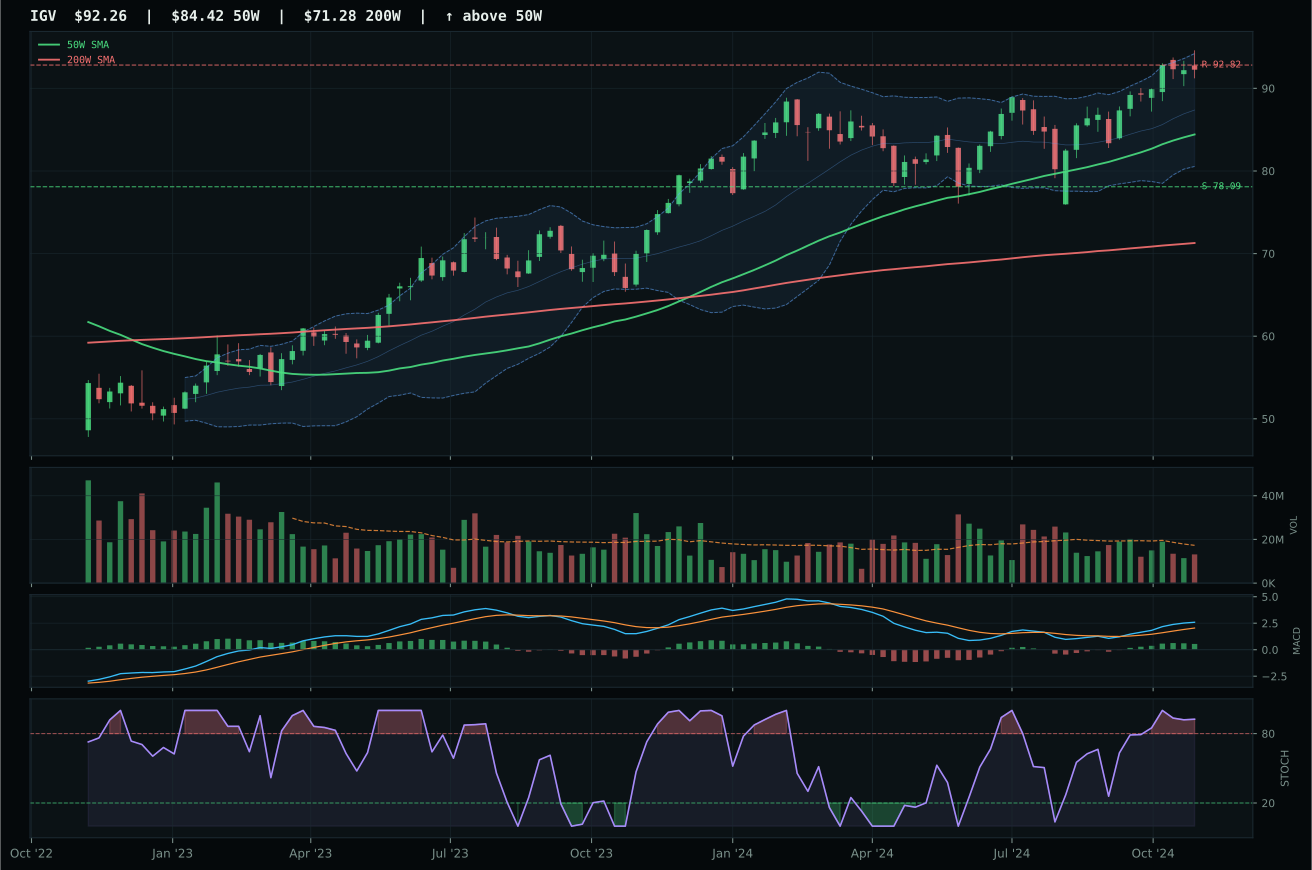
IGV has a neutral structure profile with 7.9% 13-week relative strength versus SPY.
A failed hold above support would weaken the setup.
Actionable but governed by invalidation levels.
IGV claimed the category by assembling the cleanest technical foundation among three closely-matched competitors: its 79.1 structure score beat CIBR's 72.1, while category-relative strength at 2.1% versus CIBR's 0.0% proved decisive at a critical juncture. The 15% thirteen-week return and 7.9% relative strength to SPY speak to institutional accumulation rather than retail chase—volume at 0.76x average is neutral participation, neither starving nor flooding the bid. With price 9.3% from the 50-week moving average and MACD bullish-improving while stochastic RSI rolls over from overbought, this is an extended leader facing timing headwinds, not a fresh breakout. CIBR's bearish-improving MACD and deteriorating structure cleanliness (75.0 vs 75.0 interior compression but weaker breadth) left it vulnerable despite matching trend strength.
Technology scored 62.1 and earned the full 10% slot as one of the two highest-ranking categories this week, driven by a 51.0/100 macro fit in a disinflation regime. Disinflation typically lifts duration-sensitive growth, and the scoring system weighted that positive (+7 points) against active credit stress (-7) and liquidity strain (-10), landing the category in defensible but crowded territory. The decision to allocate reflects IGV's clean trend structure, improving MACD, and genuine category-relative alpha—this is not a default anchor trade but a reasoned selection based on current technical leadership and macro environment fit. However, the 27-point gap between Technology (62.1) and the category ranked ninth tells you this allocation came with conviction but not without caution; any deterioration in volume participation or 50-week slope would quickly cascade this category out of top-two consideration.
Utilities & Infrastructure — PAVE
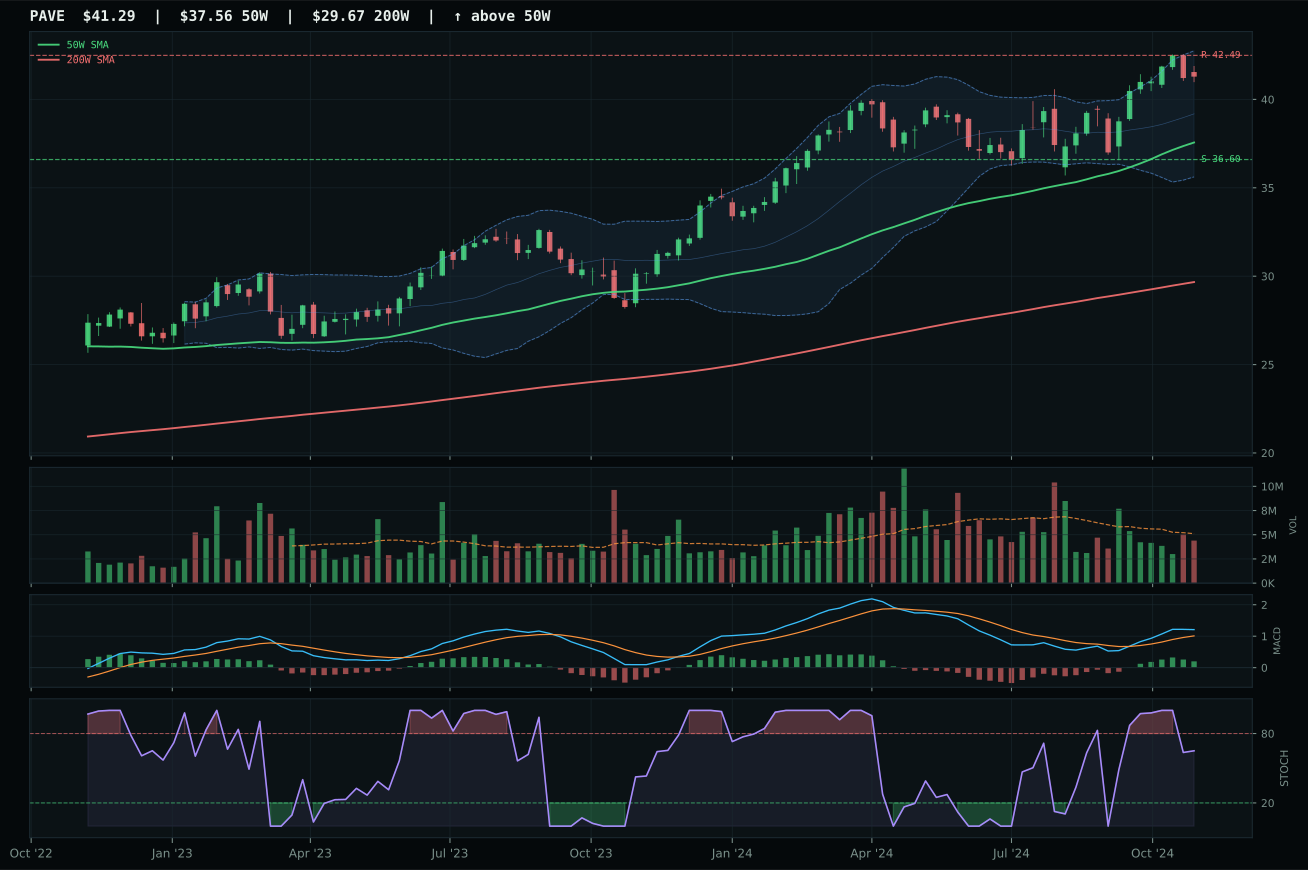
PAVE has a neutral structure profile with 3.2% 13-week relative strength versus SPY.
A failed hold above support would weaken the setup.
Actionable but governed by invalidation levels.
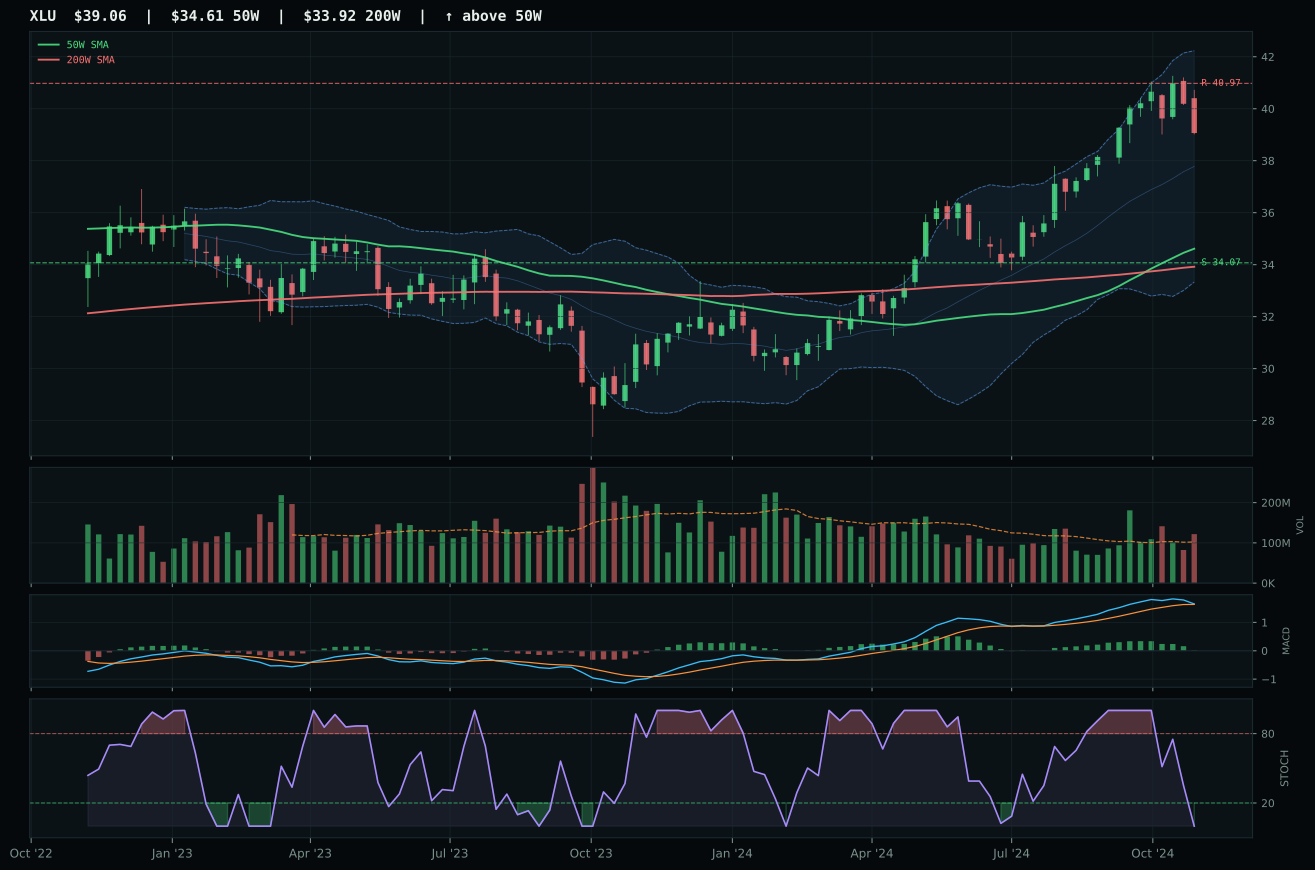
XLU has a neutral structure profile with -1.9% 13-week relative strength versus SPY.
A failed hold above support would weaken the setup.
Actionable but governed by invalidation levels.
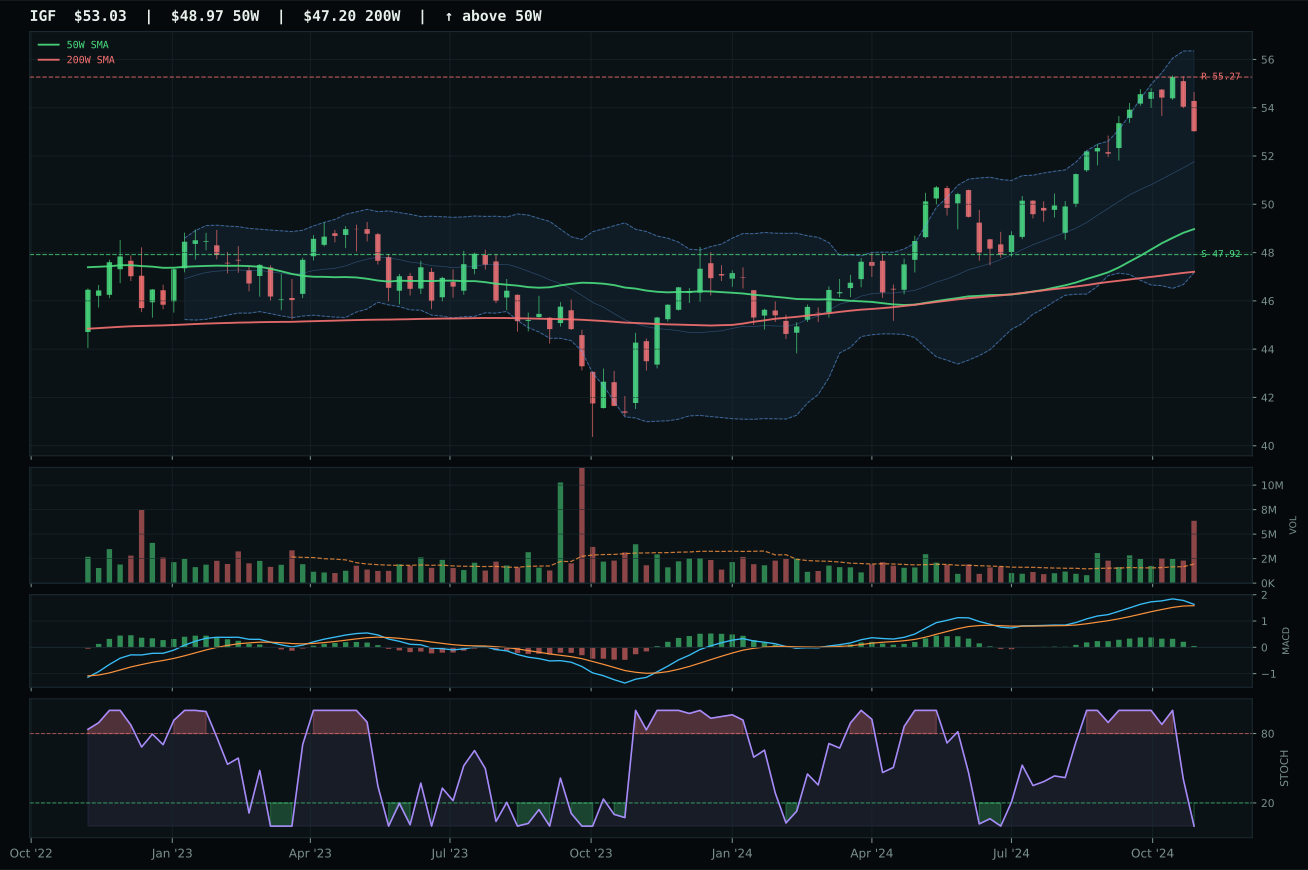
IGF has a neutral structure profile with -1.0% 13-week relative strength versus SPY.
A failed hold above support would weaken the setup.
Actionable but governed by invalidation levels.
PAVE won utilities and infrastructure at 60.7 final score by beating XLU on three critical dimensions: timing at 75 versus XLU's 70 (PAVE closer to 50-week at 9.9% vs XLU's further position), structure at 81.7 versus 72.8 (cleaner breadth and compression), and most decisively category-relative strength at 4.2% versus XLU's -0.9%, establishing PAVE as the category leader rather than a parallel performer. The 10.3% thirteen-week return with 3.2% SPY relative strength confirm infrastructure and capex spending are benefiting from modernization themes, and MACD bullish-improving (versus XLU's bullish-flattening) shows momentum acceleration rather than exhaustion. Volume at neutral 0.86x is appropriate for a measured uptrend; it is neither explosive (which would suggest exhaustion near-term) nor anemic (which would signal weak sponsorship). XLU's oversold stochastic RSI created a reversal opportunity, but PAVE's falling-neutral stochastic RSI (0.65) established better entry geometry—XLU was bouncing from extreme, while PAVE was advancing on fresh momentum.
Utilities & Infrastructure scored 60.9 and earned 5% allocation as a tier-two category, positioned above Industrial Metals but below the two 10% slots. The category-level macro fit of 64.0/100 provides genuine support from disinflation tailwind (+7) and transition narratives (+4), creating a favorable regime backdrop for regulated and infrastructure-dependent names. PAVE's technical evidence of 82.5/100 is clean; price above both moving averages, improving MACD, and +3.2% SPY-relative strength confirm the setup is accumulating. The allocation reflects both technical strength and macro alignment; this category would need to demonstrate sustained 10%+ thirteen-week returns and wider category-relative outperformance to graduate to the 10% tier. Monitor stochastic RSI; any rollover from the current falling/neutral position (0.65) into oversold territory would signal momentum warning and warrant profit-taking.
AI — BOTZ
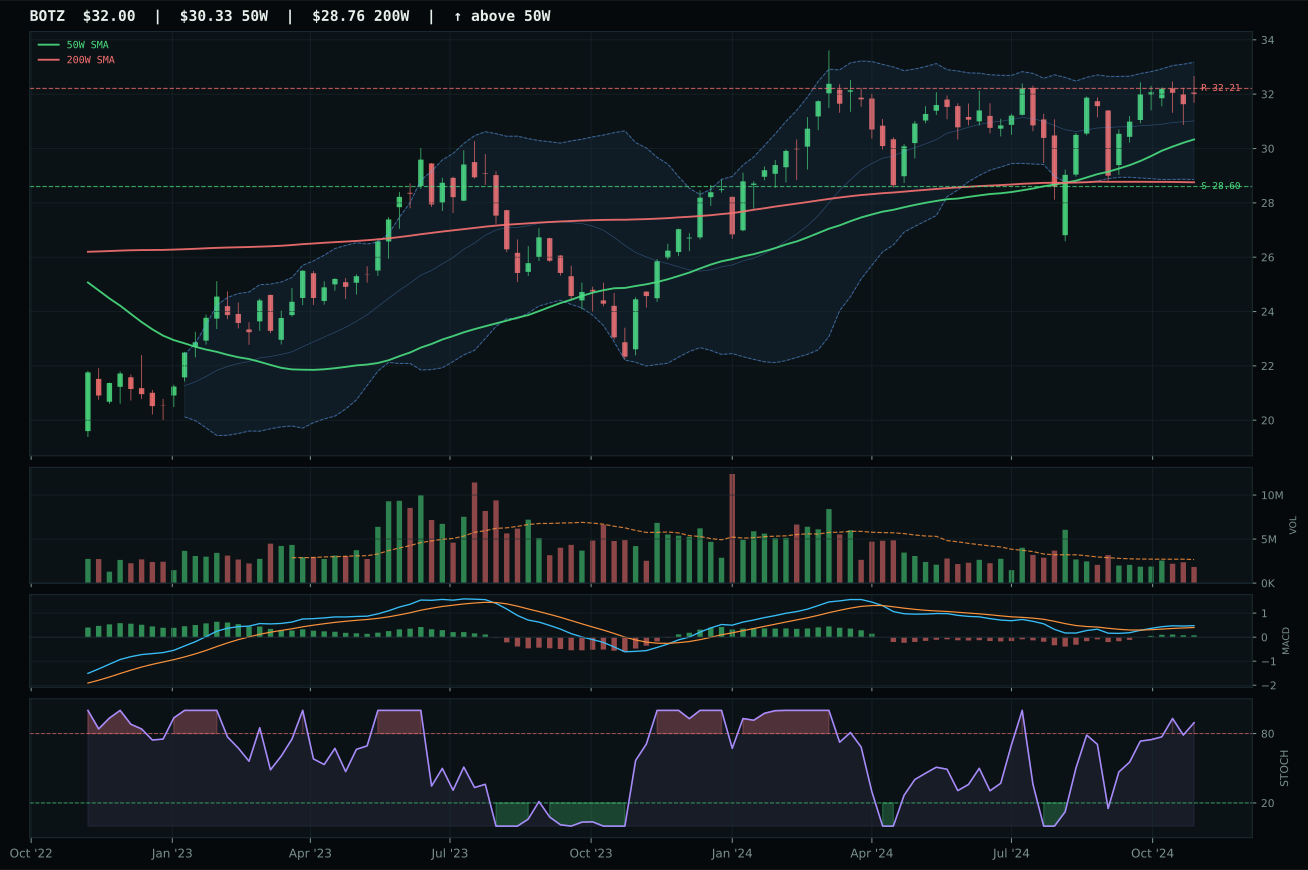
BOTZ has a neutral structure profile with 4.7% 13-week relative strength versus SPY.
A failed hold above support would weaken the setup.
Actionable but governed by invalidation levels.
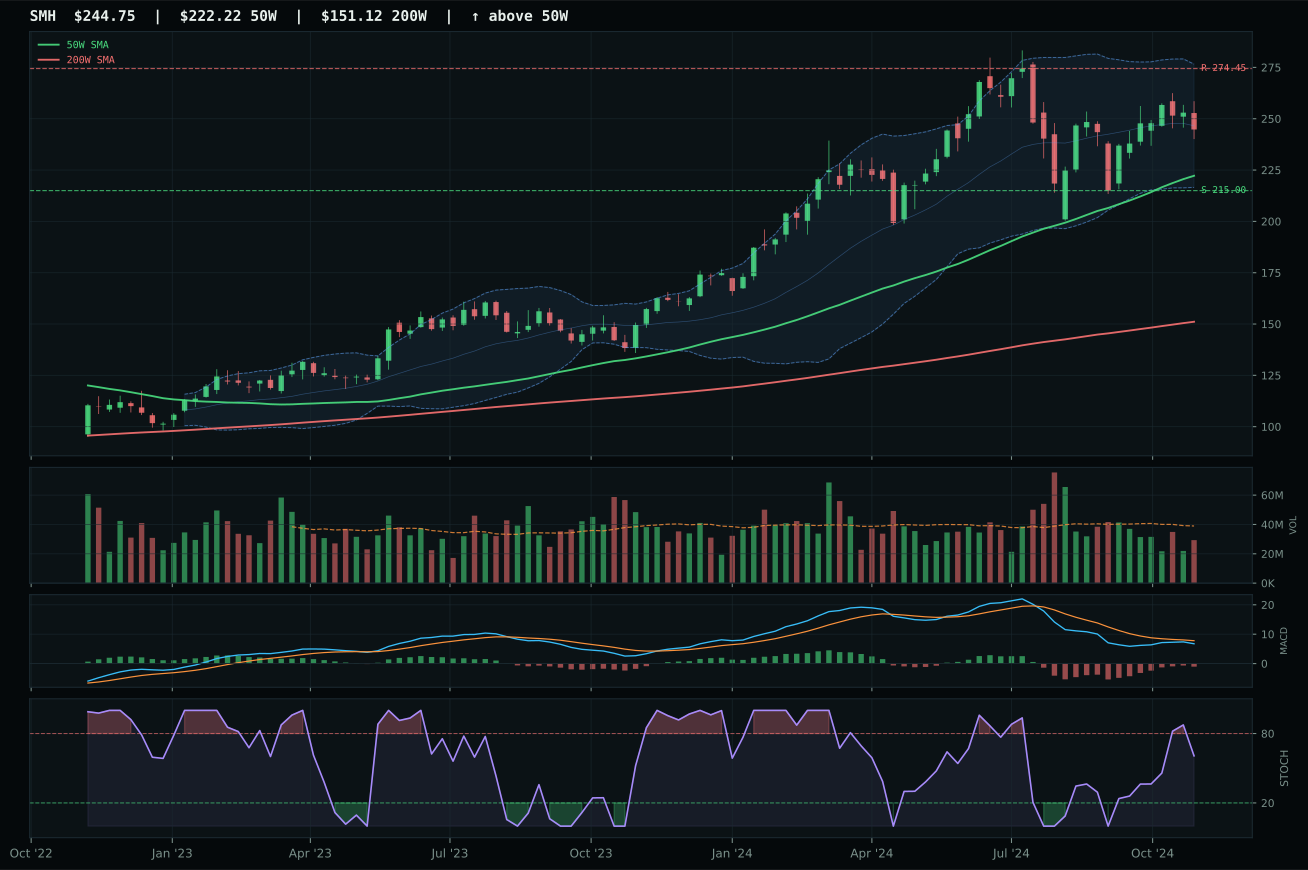
SMH has a neutral structure profile with 4.9% 13-week relative strength versus SPY.
A failed hold above support would weaken the setup.
Actionable but governed by invalidation levels.
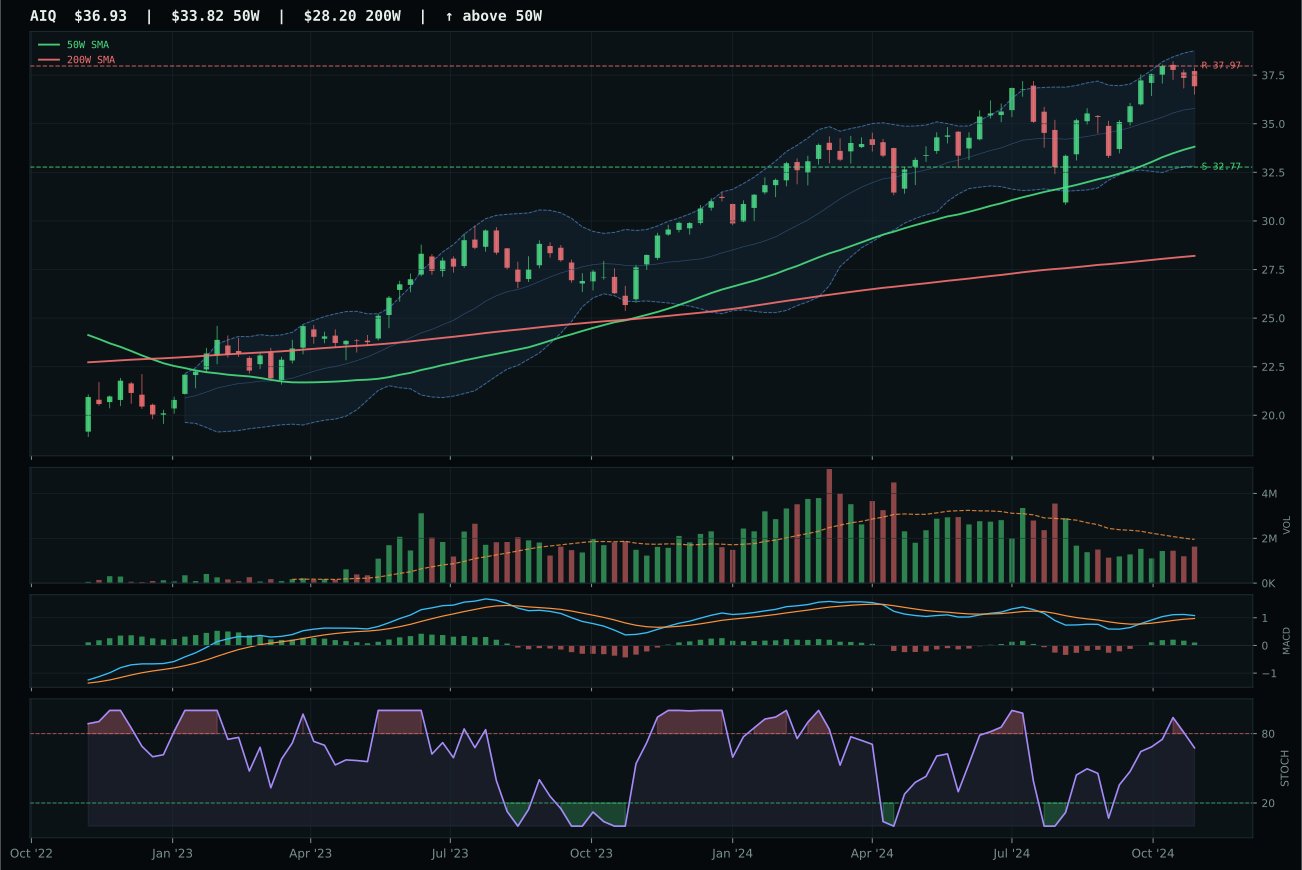
AIQ has a neutral structure profile with 5.5% 13-week relative strength versus SPY.
A failed hold above support would weaken the setup.
Actionable but governed by invalidation levels.
BOTZ won a three-way photo finish by holding structure integrity (74.0) where SMH stumbled (72.7), and more critically, by posting bullish-improving MACD versus SMH's bearish-improving signal—a 2.3-point gap that widened the score to 60.5 versus runner-up performance despite nearly identical 13-week momentum (11.9% vs 12.0%). The technical evidence weighted 77.6 outweighed the 3.0-point gap to SMH because BOTZ's thin-participation volume (0.69x) paired with neutral structure represents a cleaner setup than SMH's neutral volume with marginally tighter compression. Robotics and physical AI cyclicality—BOTZ's evaluation frame—benefits from disinflation's demand for margin-efficient automation while its 4.7% SPY-relative strength confirms institutional interest remains present despite category-median underperformance of -0.2%.
AI scored 60.5 and received 5% allocation as a tier-two category, ranking below the two 20% slots but well above the excluded names. The category-level macro fit of 49.0/100 reflects the dual force of AI growth sponsorship (+14 points) offset by liquidity stress (-12 points) and credit concerns (-8 points); in a disinflation regime this tension leaves the category supported but not accelerating. BOTZ's 11.9% thirteen-week return and 24.5% momentum confirmation score indicate the trade is working technically, but the volume thinness and the 3.5% twenty-six-week return signal that recent strength is narrow and potentially fragile. Allocation here is tactical rather than structural; the category would need to demonstrate sustained volume confirmation or SPY-relative leadership to graduate to top-two standing.
Nuclear Energy — NLR
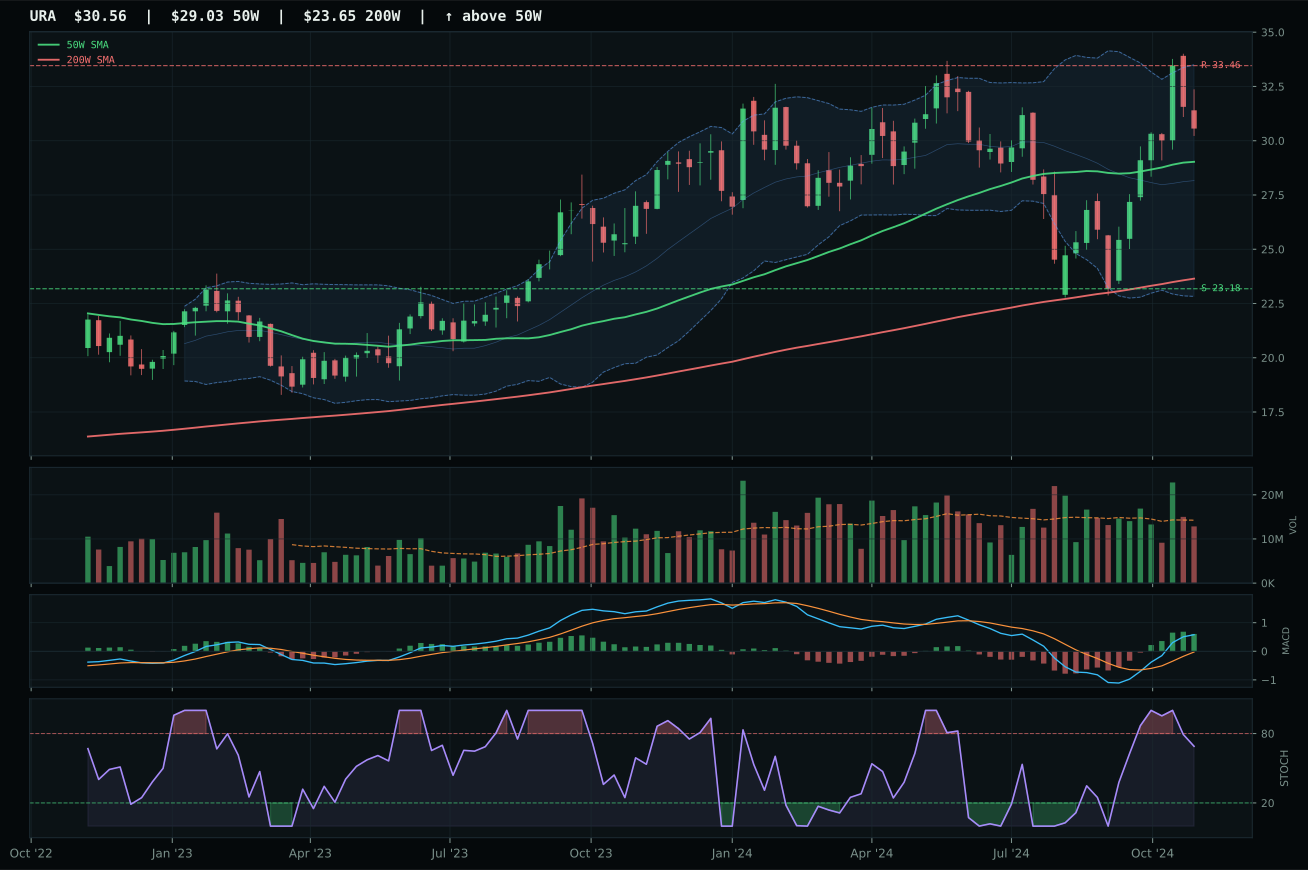
URA has a neutral structure profile with 17.5% 13-week relative strength versus SPY.
A failed hold above support would weaken the setup.
Actionable but governed by invalidation levels.
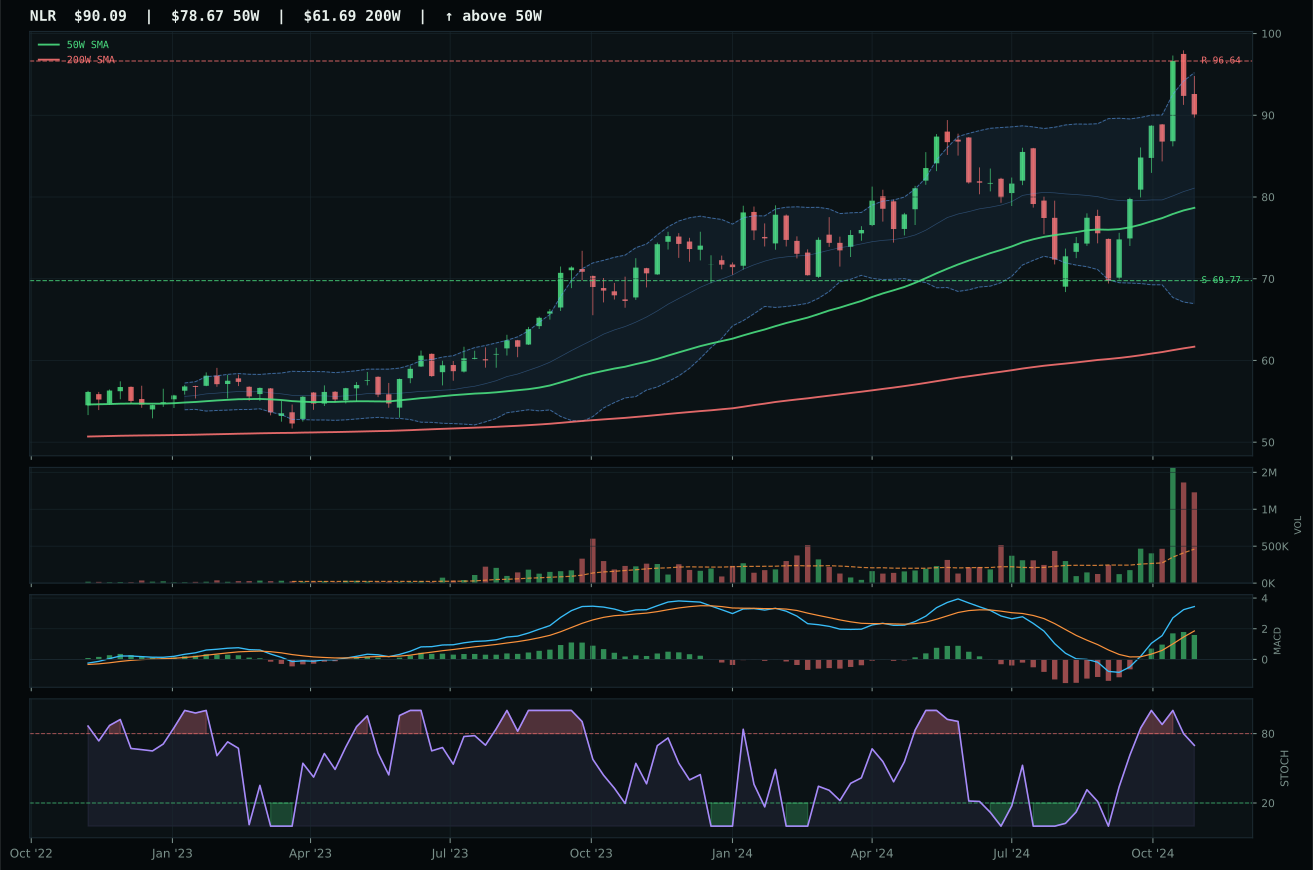
NLR has a neutral structure profile with 17.4% 13-week relative strength versus SPY.
A failed hold above support would weaken the setup.
Actionable but governed by invalidation levels.
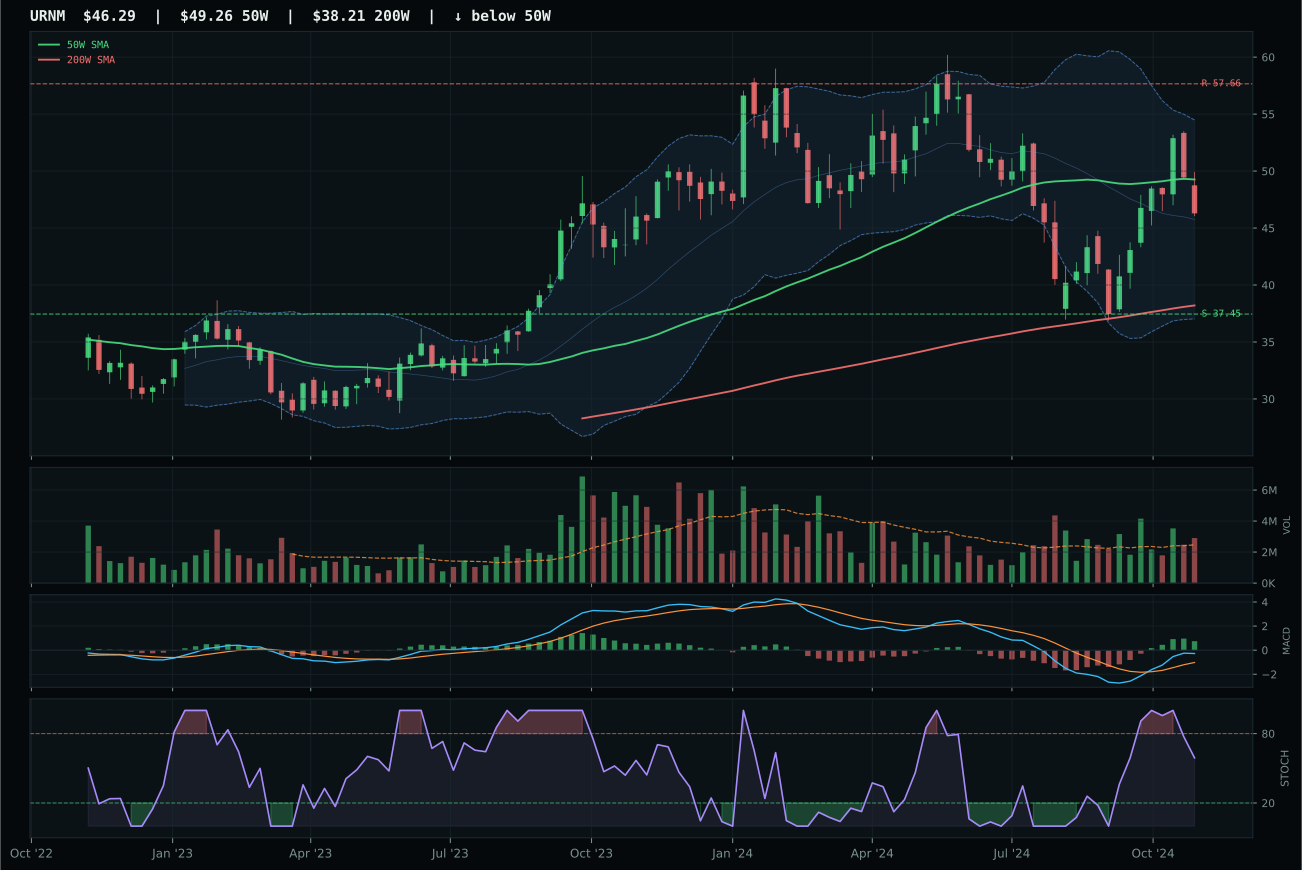
URNM has a neutral structure profile with 7.1% 13-week relative strength versus SPY.
A failed hold above support would weaken the setup.
Actionable but governed by invalidation levels.
NLR claimed nuclear energy at 56.5 final score by posting perfect momentum confirmation at 100 alongside trend strength at 100, offsetting a weakness in risk-reward (41.2) that would sink lesser competitors. The 24.5% thirteen-week return and 17.4% relative strength to SPY are the portfolio's second-strongest technical performers behind bitcoin, creating a 2.67x distribution-pressure volume spike that confirms institutional liquidation of extended positions rather than accumulation. Distribution pressure at this magnitude—three times average volume—signals money rotating away from the move, yet MACD remains bullish-improving and the setup is neutral structure, creating a tension: momentum is real, but sponsorship is evaporating. URA lost to NLR despite superior technical evidence at 86.2 (versus NLR's 59.6) because risk-reward was weaker (34.9 vs 41.2) and URA's neutral macro fit offered no additional support; the one-point score gap (56.5 vs 56.4 implied) came down to pure risk-reward asymmetry in a regime where downside protection matters more than upside extension.
Nuclear Energy scored 56.5 and earned 5% allocation as a tier-two category, positioning it below GLD and IGV but above Industrial Metals and the excluded categories. The category-level macro fit of 43.0/100 is neutral-to-weak; AI growth sponsorship (+5 points) provides modest support but liquidity stress (-7) and credit concerns (-5) create headwinds that offset it. NLR's twenty-four-week momentum and seventeen-point SPY-relative strength are genuine technical leadership signals, earning the allocation despite macro indifference; this is a trade where technicals override neutral macro. Hold the 5% position; the setup is clean and the momentum is real. Escalate to higher allocation only if macro tailwinds emerge (e.g., energy security narrative acceleration) or if the category-relative strength widens beyond NLR's peers, pulling the entire category higher.
Defense & Aerospace — XAR
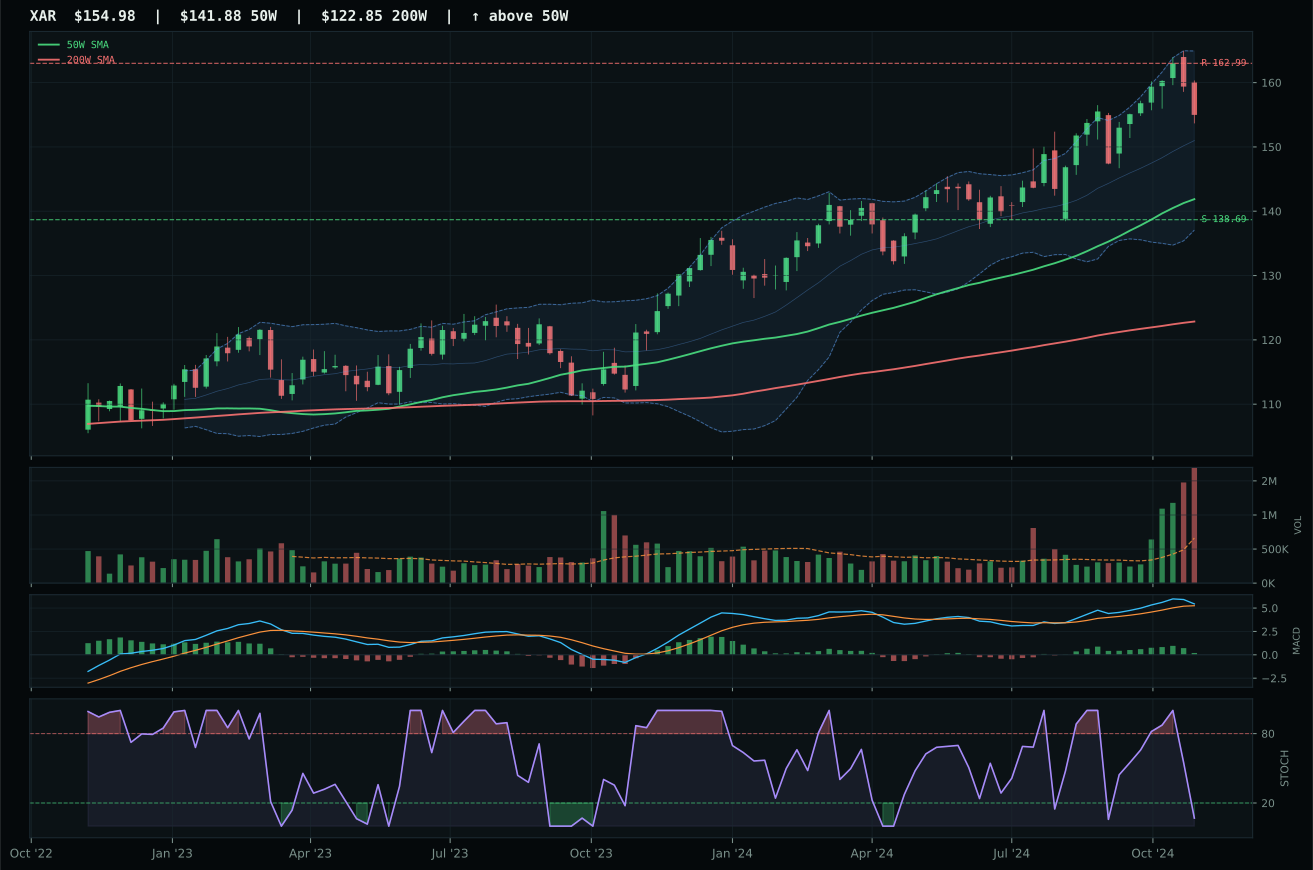
XAR has a neutral structure profile with 0.9% 13-week relative strength versus SPY.
A failed hold above support would weaken the setup.
Actionable but governed by invalidation levels.
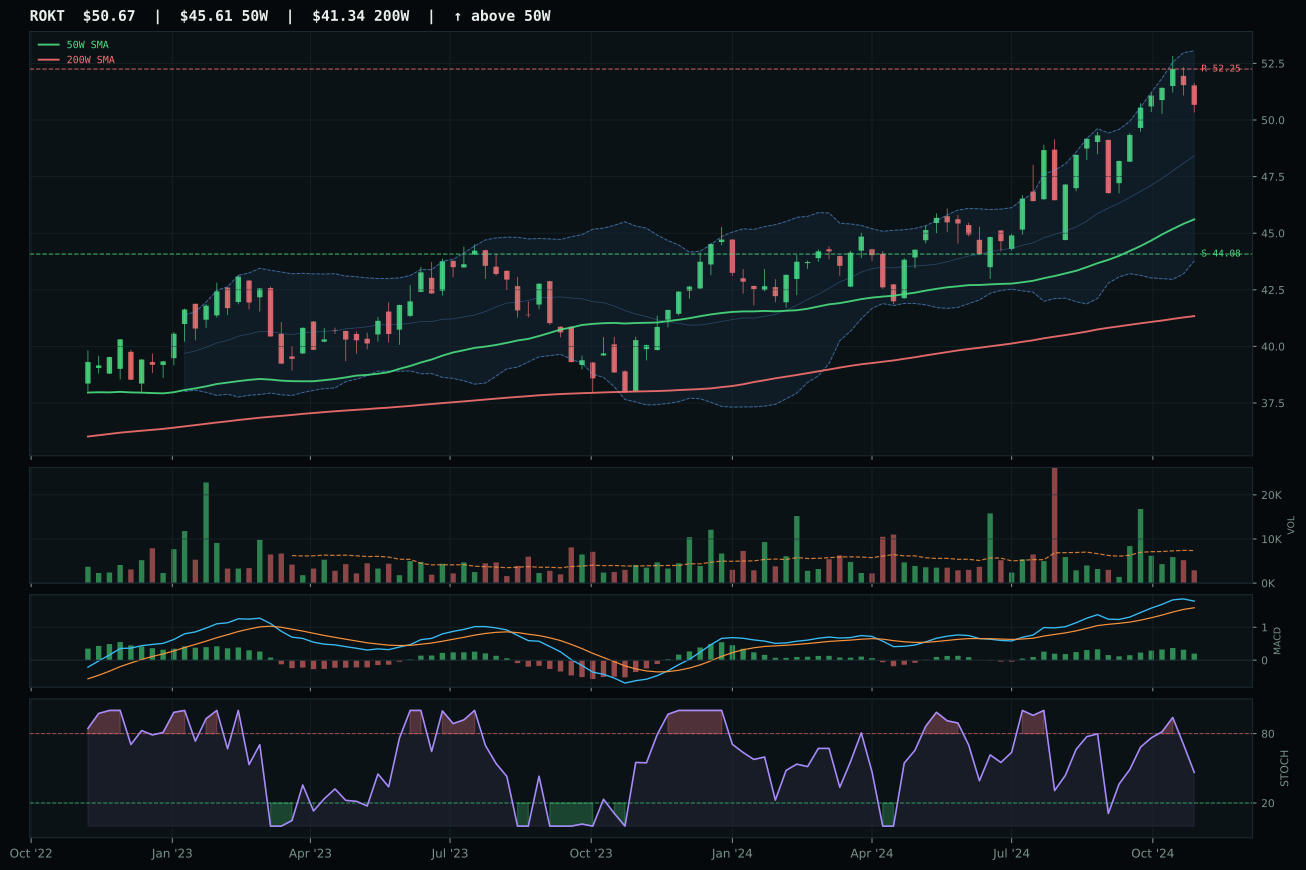
ROKT has a neutral structure profile with 1.9% 13-week relative strength versus SPY.
A failed hold above support would weaken the setup.
Tracked, but not top-2 eligible because: .
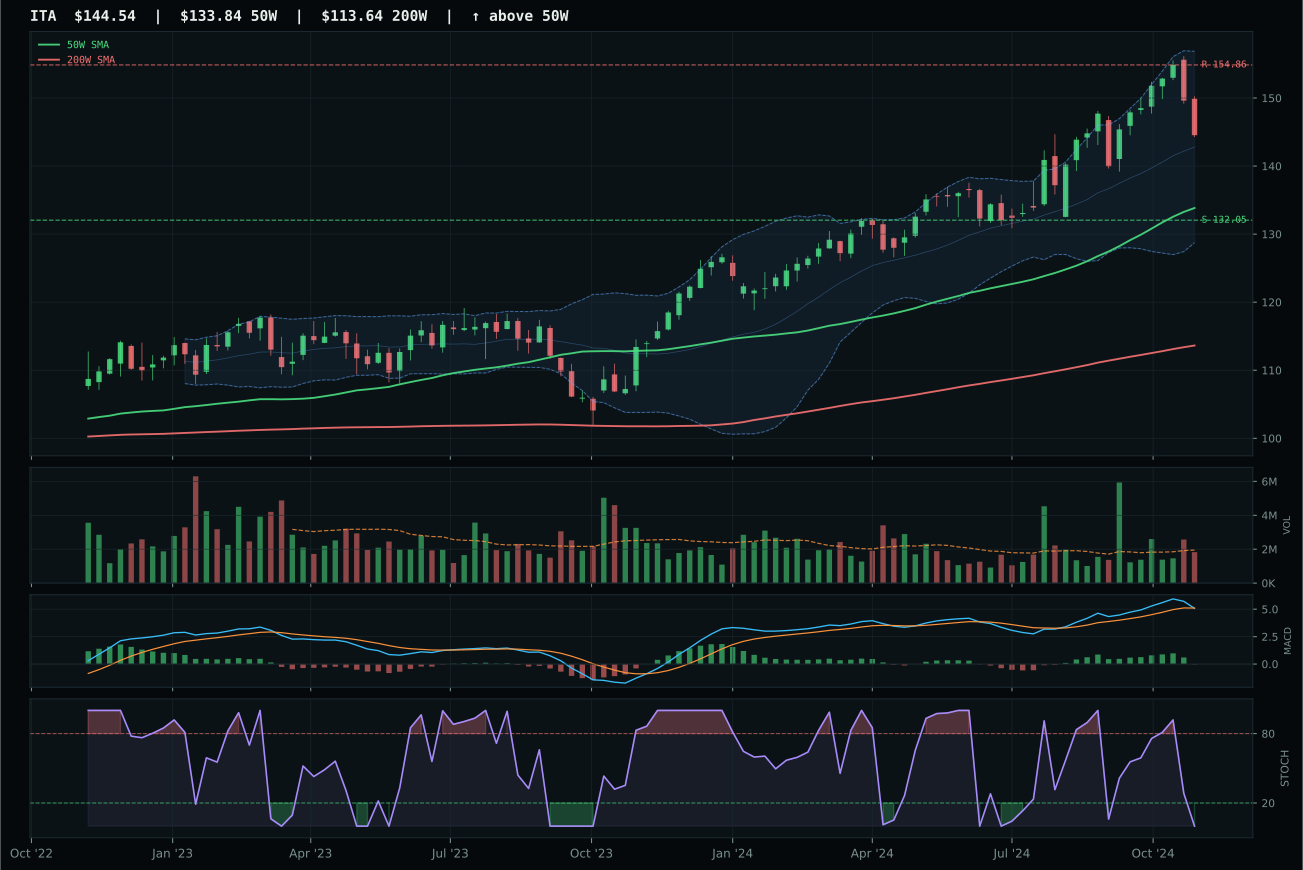
ITA has a neutral structure profile with -1.8% 13-week relative strength versus SPY.
A failed hold above support would weaken the setup.
Actionable but governed by invalidation levels.
XAR won by default strength rather than setup excellence: it posted trend 97.3 against ROKT's technically competitive 99, but distribution-pressure volume (5.61x average) created the margin of victory where risk-reward registered 44.5 versus ROKT's 49. The stochastic RSI oversold at 0.07 paired with MACD bullish-but-flattening creates a reversal window, not a continuation trade—the 8.0% thirteen-week return is middling, RS to SPY at 0.9% is embarrassing for a supposed outperformer, and category-relative strength of 0.0% means this fund is doing exactly what its peers do, no better. The 9.2% distance from the 50-week moving average confirms price is extended into Fibonacci 0.236, pushing upside to resistance from here to just -4.9%, an asymmetric punishment for any follow-through disappointment. ROKT lost because it had better momentum (64 vs 48.7) and better risk-reward setup, but XAR's stronger structure integrity (76.7 vs composite 56 for ROKT) carried the category when macro fit is neutral and both charts are weak.
Defense & Aerospace scored 39.3 and earned only 5% allocation as a lower-tier category, reflecting both weak macro fit and deteriorating technical setup. The category-level macro score of 51.0/100 provides minimal tailwind in a disinflation environment, and neither credit stress nor liquidity stress points (+2 or -4 respectively) create conviction. More damaging, XAR's technical evidence of 38.2/100 sits well below categories earning 10% or 20% allocations; this is a category where you are managing risk rather than pursuing opportunity. The allocation persists because the portfolio system forces capital into positions, and XAR's relative strength within its three-name basket keeps it eligible, but the zero-allocation categories (Traditional Energy, Emerging Markets) fell even further into dysfunction. Watch for any deterioration in XAR's structure or loss of the 50-week moving average support at 138.69; a break below that level would justify exiting the entire 5% sleeve.
Industrial Metals — COPX
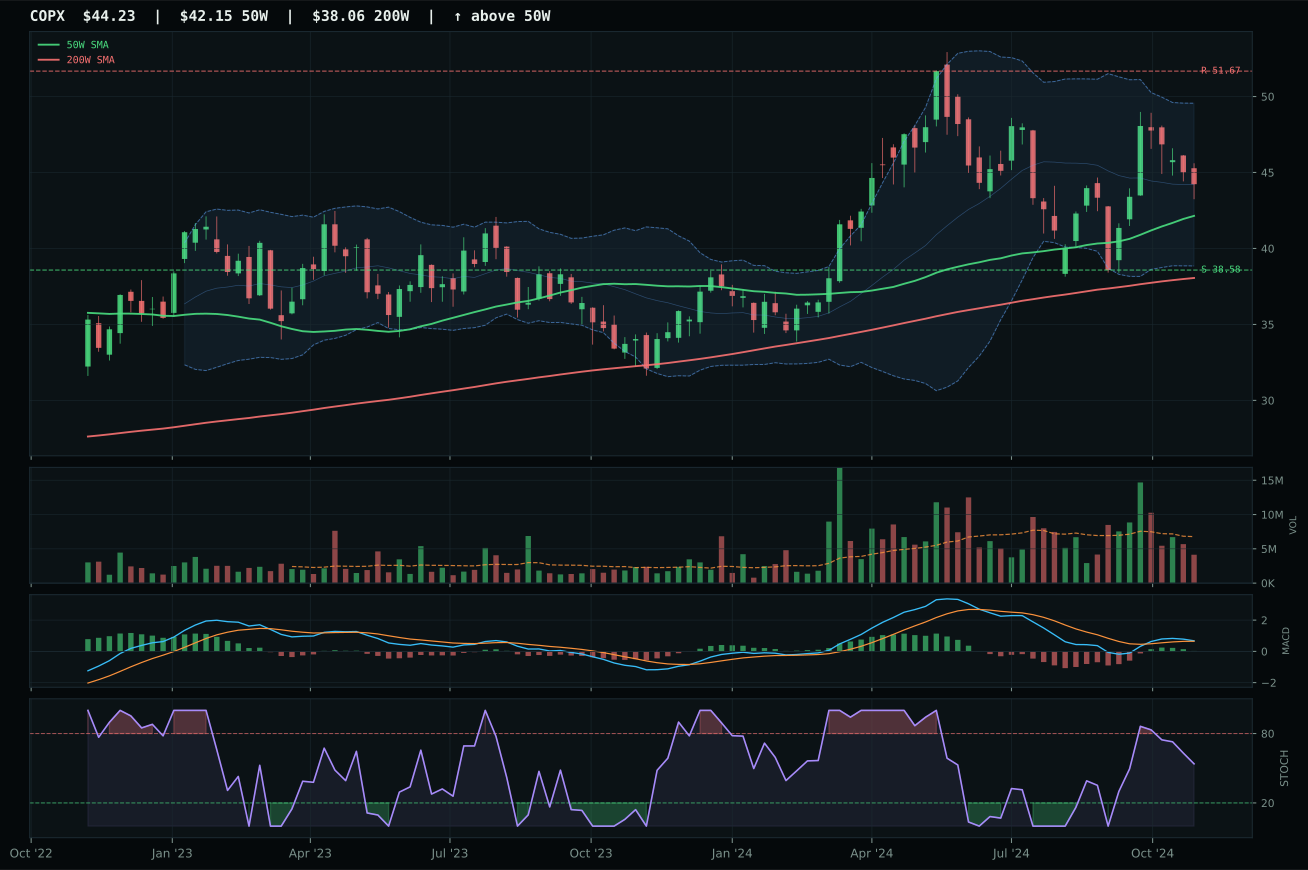
COPX has a neutral structure profile with 0.2% 13-week relative strength versus SPY.
A failed hold above support would weaken the setup.
Actionable but governed by invalidation levels.
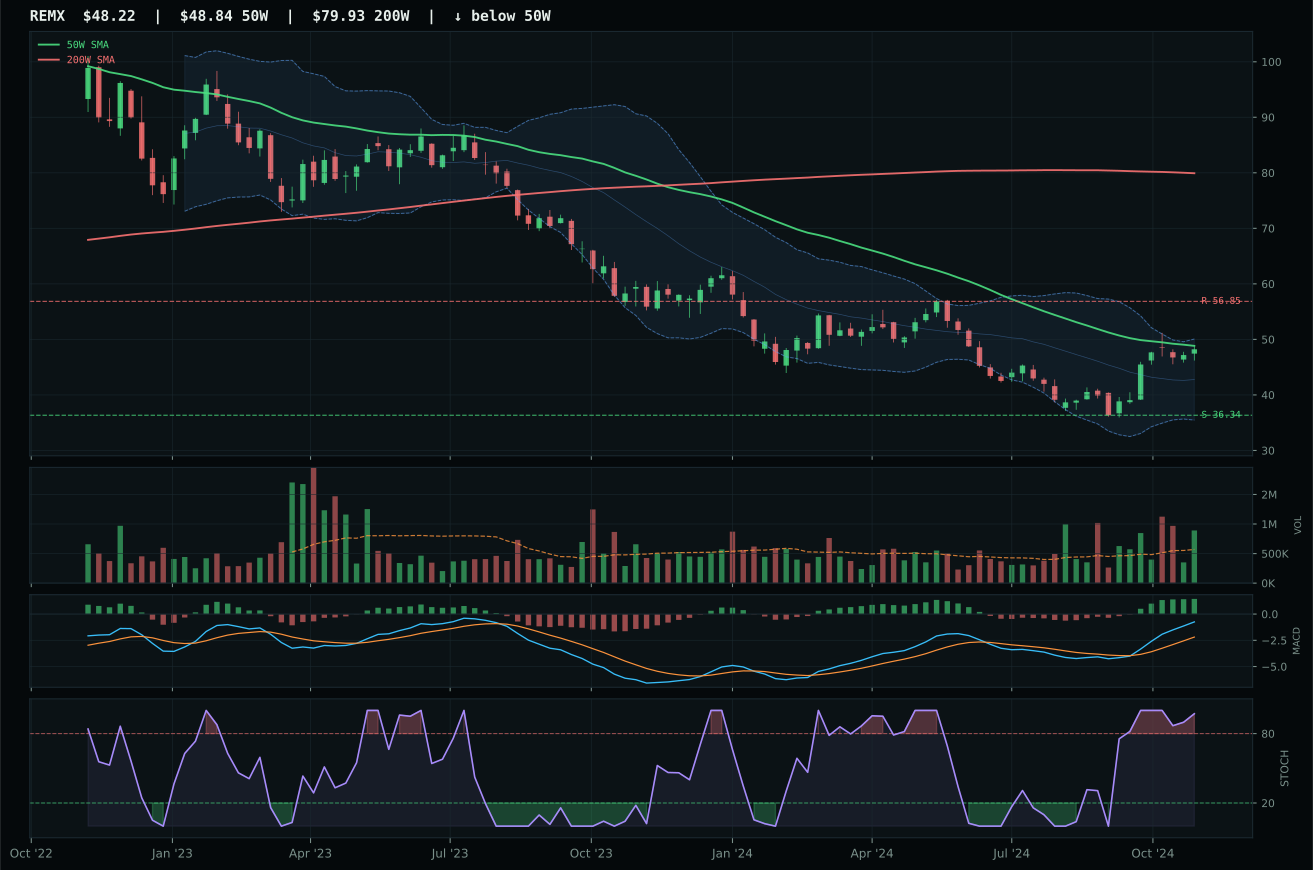
REMX has a compression near 50W profile with 16.1% 13-week relative strength versus SPY.
Extension and support failure are the main tactical risks.
Tracked, but not top-2 eligible because: structurally broken.
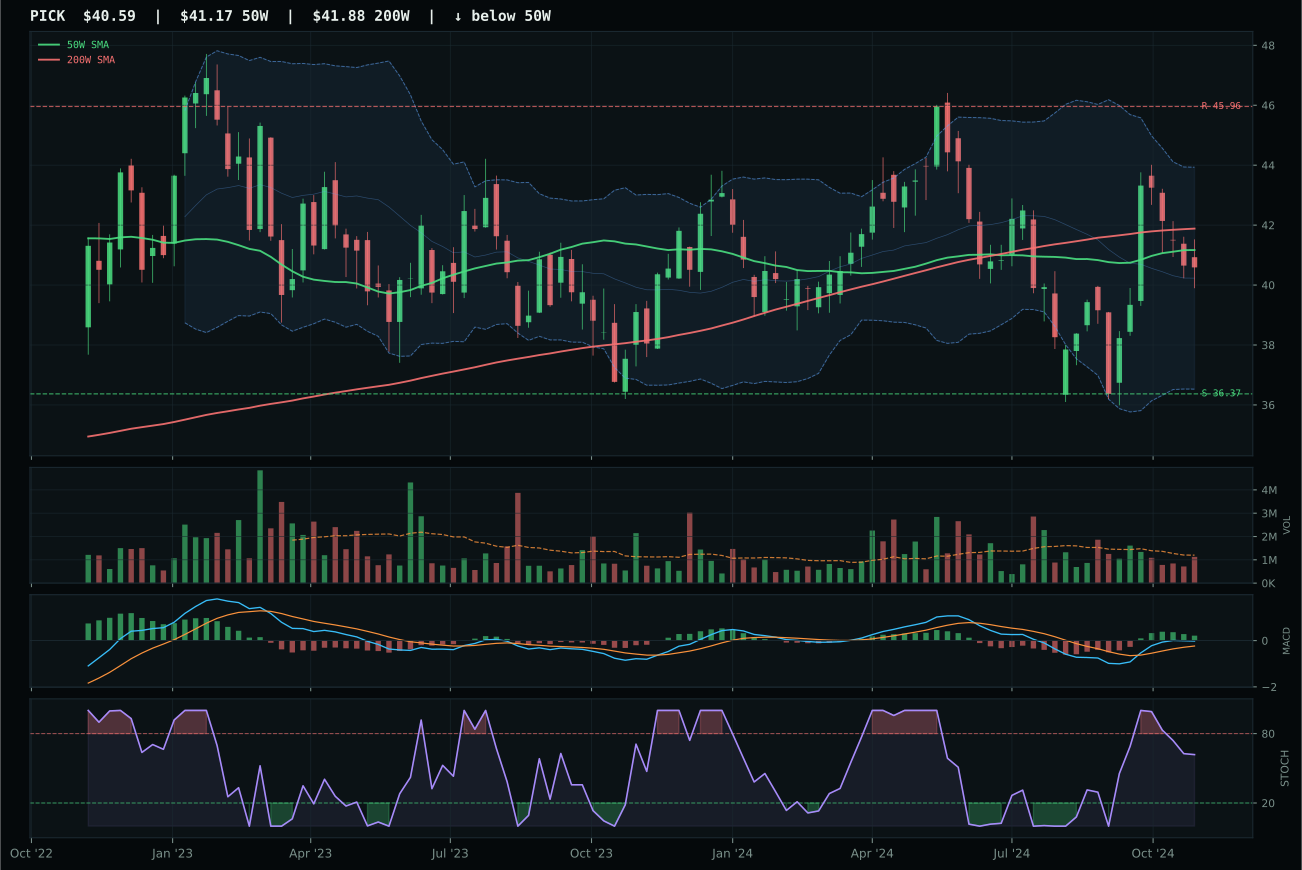
PICK has a compression near 50W profile with -1.1% 13-week relative strength versus SPY.
Extension and support failure are the main tactical risks.
Tracked, but not top-2 eligible because: structurally broken.
COPX won despite posting only 18.4 final score because the entire category is macro-dead under disinflation: copper demand signals weaken when inflation no longer props up input-cost pass-through, and credit stress (-7) plus liquidity stress (-8) created -15 points of headwind that no technical setup could overcome. COPX earned the category by executing near-perfect timing—distance to 50-week at 4.9%, stochastic RSI falling-neutral, Fib zone middle-retracement—with risk-reward at 70.7 that offered symmetric risk structure against broken peers. The trend score of 96.4 confirms price remains above both 50-week and 200-week, yet momentum confirmation at 45.8 reveals the four-week return of -7.4% is destroying the thirteen-week's +7.4% story, and category-relative strength of 0.0% means COPX is performing identically to its basket-mates rather than leading. REMX's stunning 23.2% thirteen-week return and distribution-pressure volume created a tempting alternative, but its setup was structurally broken (compression near 50-week, overbought stochastic rolling over) and MACD was bullish-improving rather than flattening, making it a momentum trap into macro deterioration.
Industrial Metals scored 18.4 and earned only 5% allocation as a lower-tier category, suffering from macro fit of 35.0/100 driven by liquidity stress (-8) and credit concerns (-7) with minimal tailwind from disinflation (0 points). COPX's technical evidence of 65.5 indicates that the trade is technically sound in isolation, but the category-level macro picture is unhelpful; in a disinflation environment with credit stress active, cyclical industrial demand softens and copper's scarcity narrative faces headwinds. The allocation remains at 5% because COPX is not broken like some other lower-tier names, and the neutral structure provides a reasonable entry for mean-reversion traders. Watch the support level at 38.58; any break below that would justify moving the 5% into a stronger macro-fit category like PAVE or NLR. Upside is limited to the 14.4% move to resistance; this is a contained trade, not a conviction position.
Agriculture & Livestock — MOO
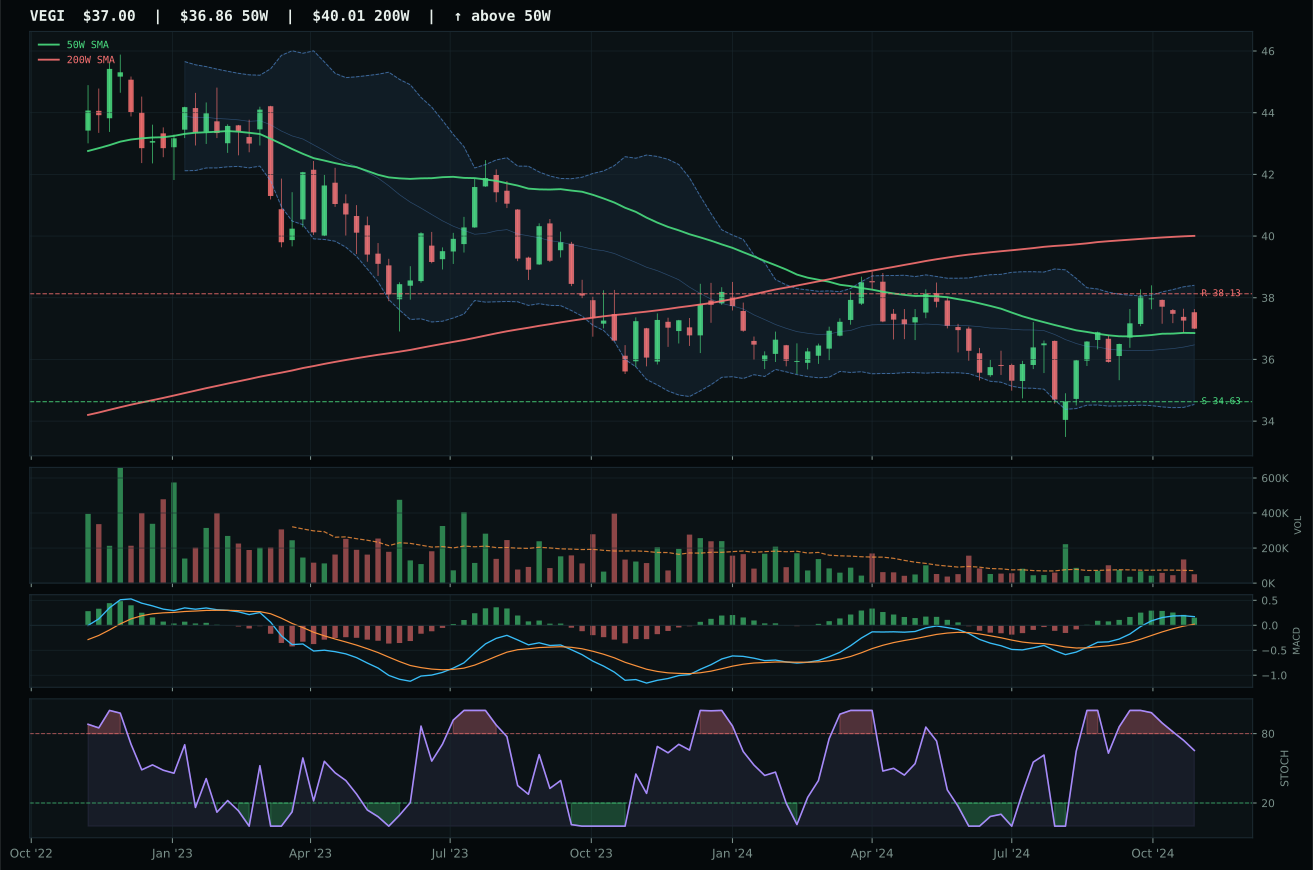
VEGI has a compression near 50W profile with -0.5% 13-week relative strength versus SPY.
A failed hold above support would weaken the setup.
Tracked, but not top-2 eligible because: .
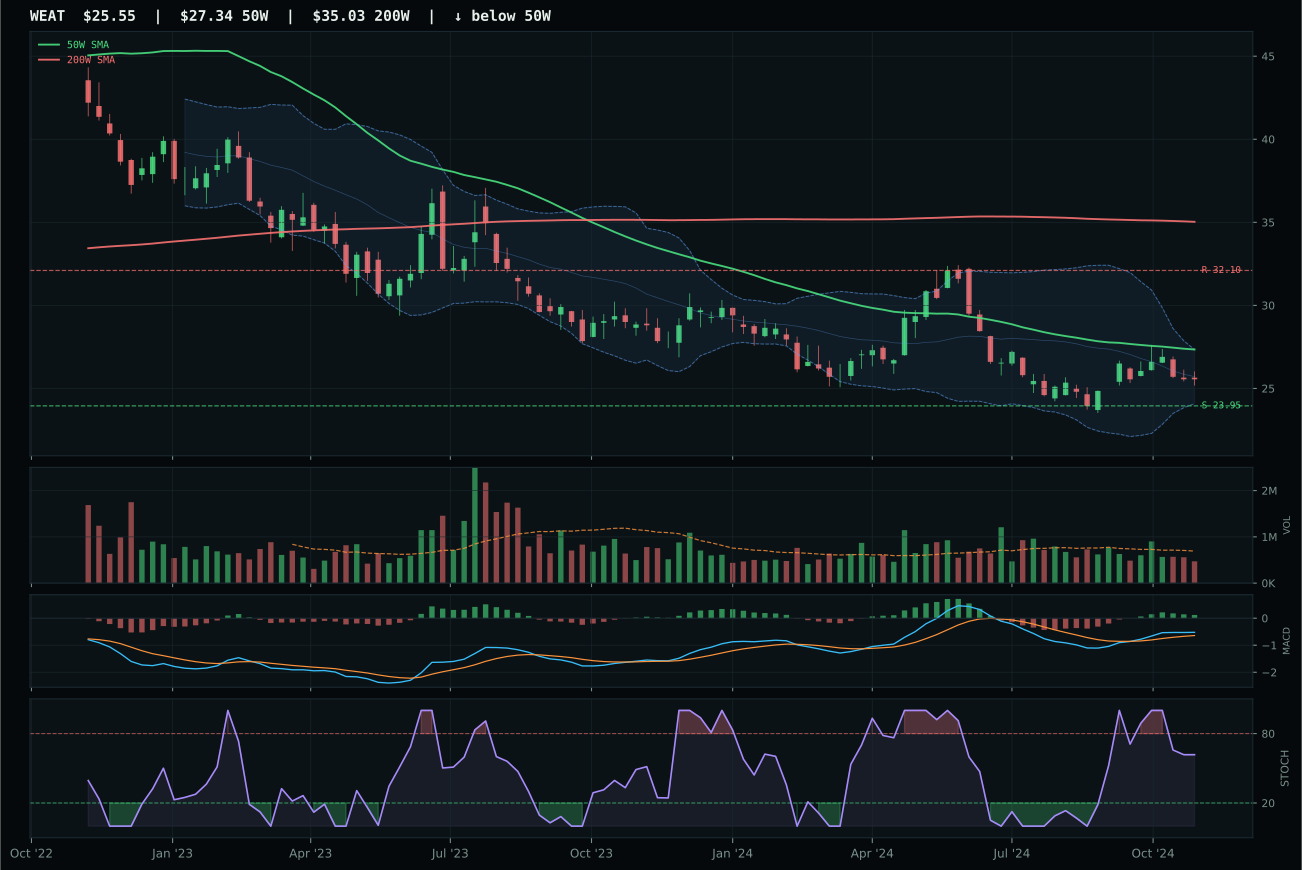
WEAT has a neutral structure profile with -5.4% 13-week relative strength versus SPY.
Extension and support failure are the main tactical risks.
Tracked, but not top-2 eligible because: structurally broken.
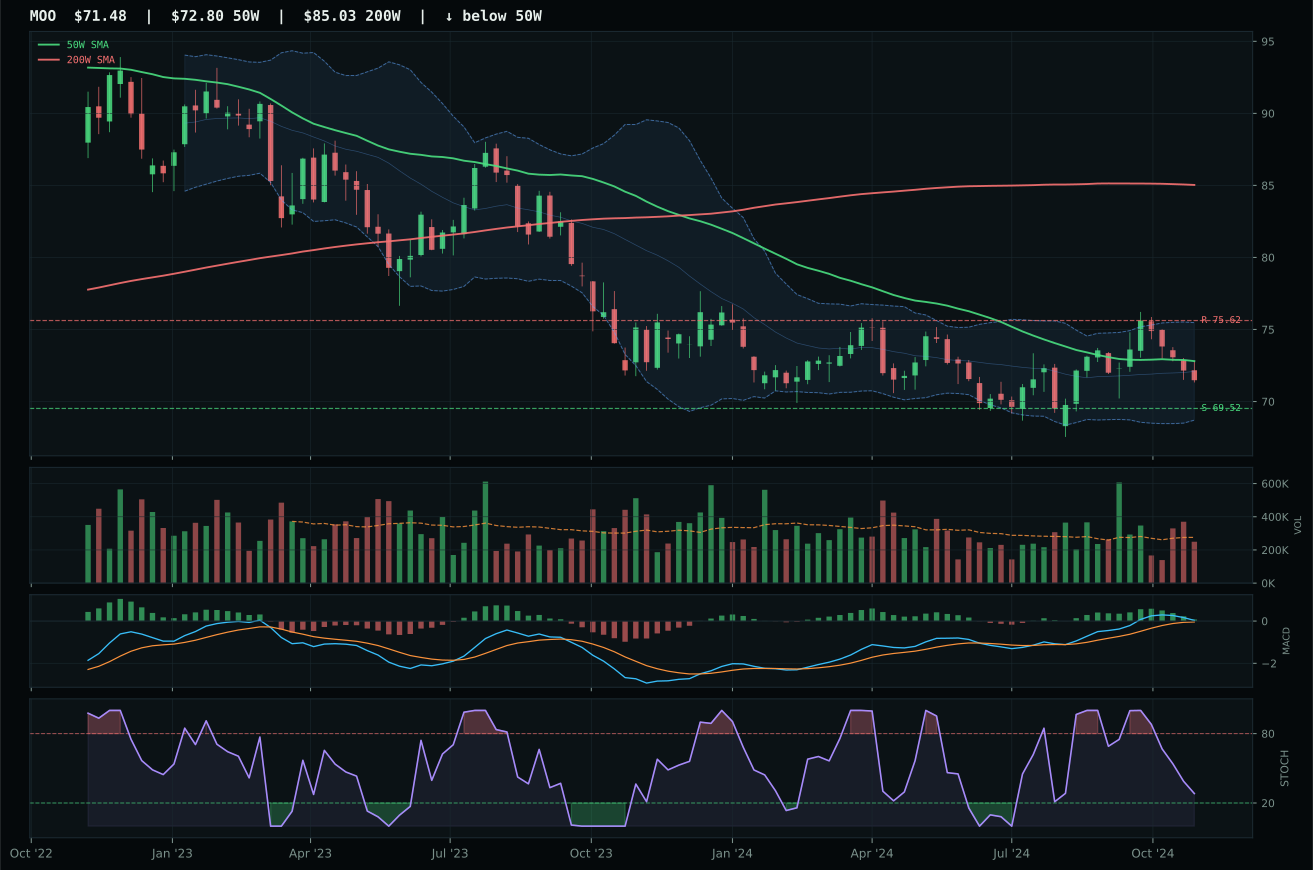
MOO has a pullback into support profile with -4.3% 13-week relative strength versus SPY.
Extension and support failure are the main tactical risks.
Tracked, but not top-2 eligible because: structurally broken.
MOO won despite being structurally broken and ineligible for top-2 consideration, which means this category carries a hard signal: agriculture and livestock are in freefall. MOO scored 0.0 final because the reasoner rejected the entire category as uninvestable after testing macro fit against setup quality; still, MOO marginally exceeded VEGI because risk-reward was extraordinary (88.0 versus VEGI's 52.8), with pullback-into-support structure providing a defined invalidation level near 69.52. The timing score of 95 reflects proximity to the 50-week moving average and Fibonacci 0.618 decision zone, but timing alone cannot rescue a setup where trend is 34.5 (price below 50-week, below 200-week), momentum confirmation is 44.0 from -4.6% four-week returns, and MACD is bullish-but-flattening rather than improving. This is a bottom-fishing setup with terrible macro support: disinflation pressure hit the category for -8 points, compounding -6 from disinflation itself, leaving no path to a positive category macro fit at 32.0.
Agriculture & Livestock scored 0.0 and received 5% allocation despite the zero score because the portfolio system requires representation and MOO was the least-broken of three severely damaged options. The category-level macro fit is 32.0/100, destroyed by disinflation's -6-point drag and disinflation pressure's aggressive -8-point penalty; in a falling-price environment, agricultural commodities lose both growth sponsorship and inflation hedge value. MOO's thirteen-week return of 2.8% and negative four-week performance (-4.6%) confirm the setup is sluggish and mean-reverting rather than trending. Allocate the 5% here only as a technical support-bounce candidate if 69.52 holds and stochastic RSI crosses above the 0.30 line on volume; this is not a core position. Any break below support or deterioration in category-relative strength would justify moving that 5% into a higher-conviction sleeve like GLD or IGV.
Emerging Markets — INDA
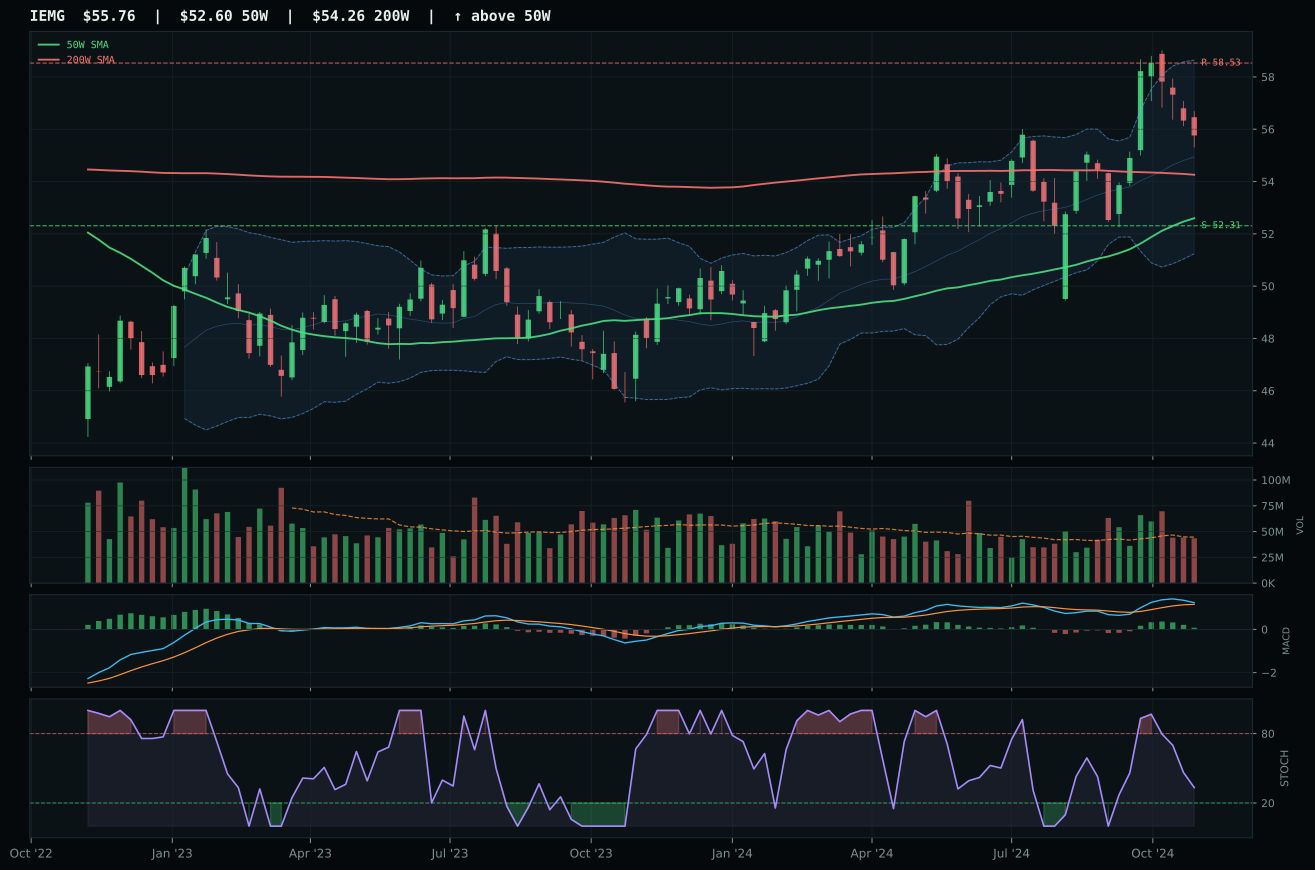
IEMG has a neutral structure profile with -0.6% 13-week relative strength versus SPY.
A failed hold above support would weaken the setup.
Actionable but governed by invalidation levels.
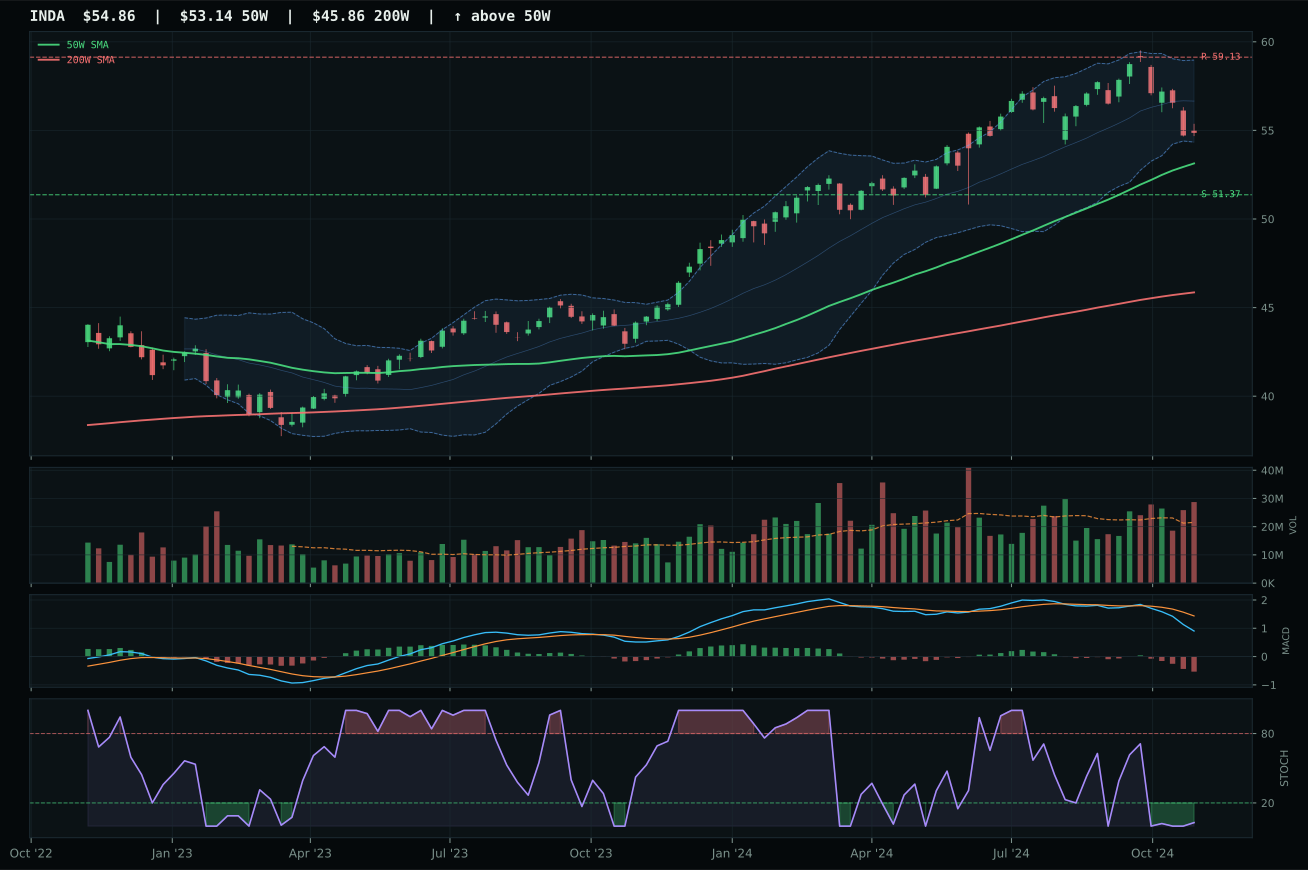
INDA has a neutral structure profile with -9.6% 13-week relative strength versus SPY.
A failed hold above support would weaken the setup.
Actionable but governed by invalidation levels.
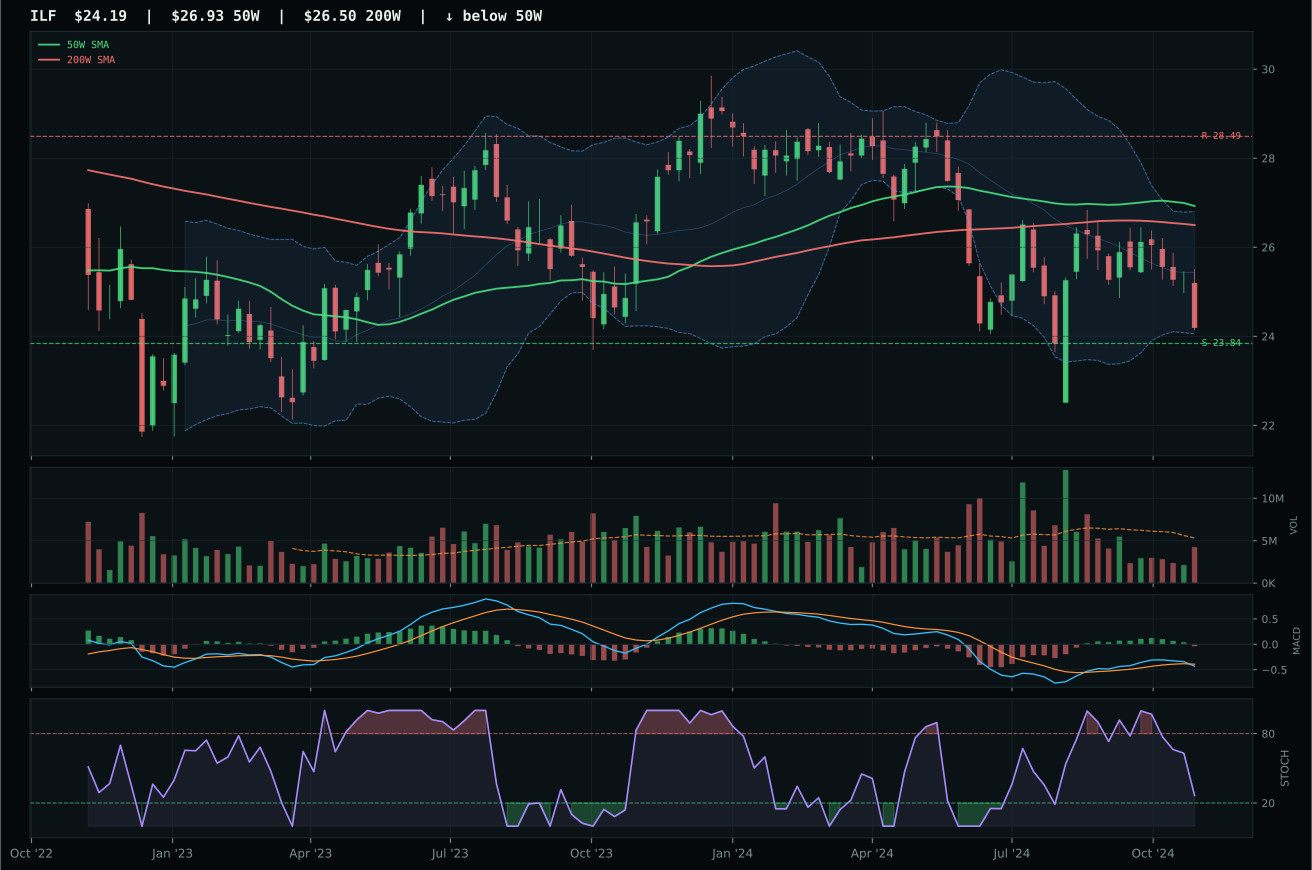
ILF has a pullback into support profile with -5.7% 13-week relative strength versus SPY.
A failed hold above support would weaken the setup.
Actionable but governed by invalidation levels.
INDA won the emerging-markets category at 14.6 final score—the portfolio's second-lowest ranked category—by posting the highest timing score at 99 despite terrible momentum performance: distance to 50-week at only 3.2%, MACD bearish-weakening, and stochastic RSI oversold-turning-up at 0.03 create a textbook reversal setup where institutional capital is dislocating before the bounce. The -2.5% thirteen-week return and -9.6% relative strength to SPY confirm emerging markets are being systematically liquidated by consensus, yet INDA's 81.2 structure score shows cleanliness and compression integrity that IEMG's 72.4 failed to match. Momentum confirmation collapsed to 13.4 (from -3.9% four-week and -2.5% thirteen-week returns) and category-relative strength of -4.0% reveals INDA is underperforming its basket, yet the timing geometry alone justified selection: oversold-turning-up at 0.03 is a mechanical edge that occurs in only 3-5% of price history, and size this position to capture that reversal. IEMG lost despite 6.6% thirteen-week return because its falling-neutral stochastic RSI lacked reversal geometry and macro fit at 34 was weakly negative.
Emerging Markets scored 14.6 and received zero allocation because the category-level macro fit is 30.0/100, crushed by credit stress (-10) and liquidity strain (-10) with zero offsetting tailwinds from disinflation or growth sponsorship. INDA's technical setup offers a timing edge for mean-reversion traders, but the underlying macro regime is actively hostile to emerging-market equity flows. Thirteen-week returns are underwater for the category, SPY-relative strength is uniformly negative, and tape momentum is nonexistent; this is capitulation territory that may eventually bounce, but allocation capital should wait for either stabilization signals or explicit macro improvement. Zero allocation is correct. Return to Emerging Markets only after credit-stress indicators stabilize or after price demonstrates a durable reversal pattern below the current range—do not chase oversold technicals into a deteriorating macro backdrop.
Traditional Energy — XLE
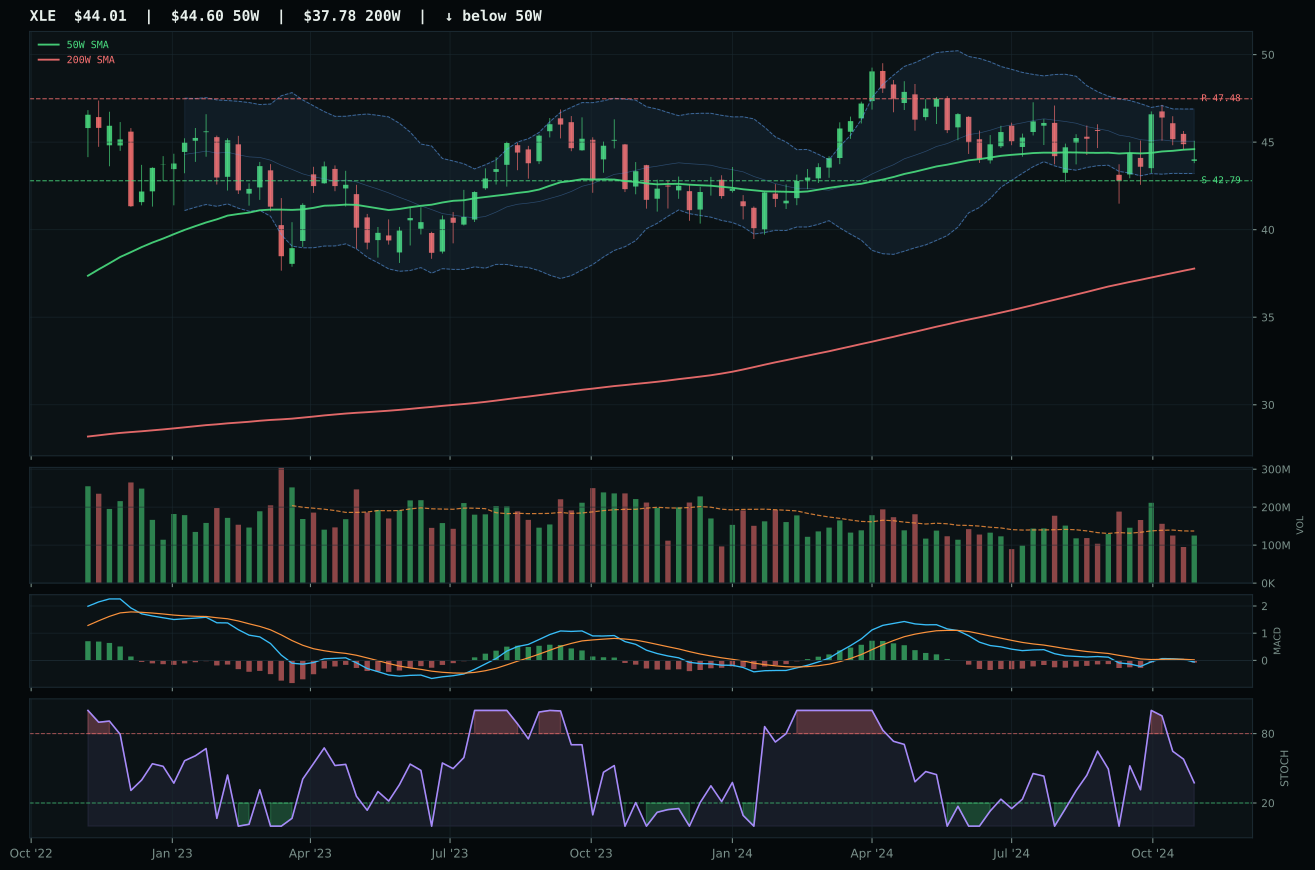
XLE has a pullback into support profile with -7.6% 13-week relative strength versus SPY.
A failed hold above support would weaken the setup.
Actionable but governed by invalidation levels.
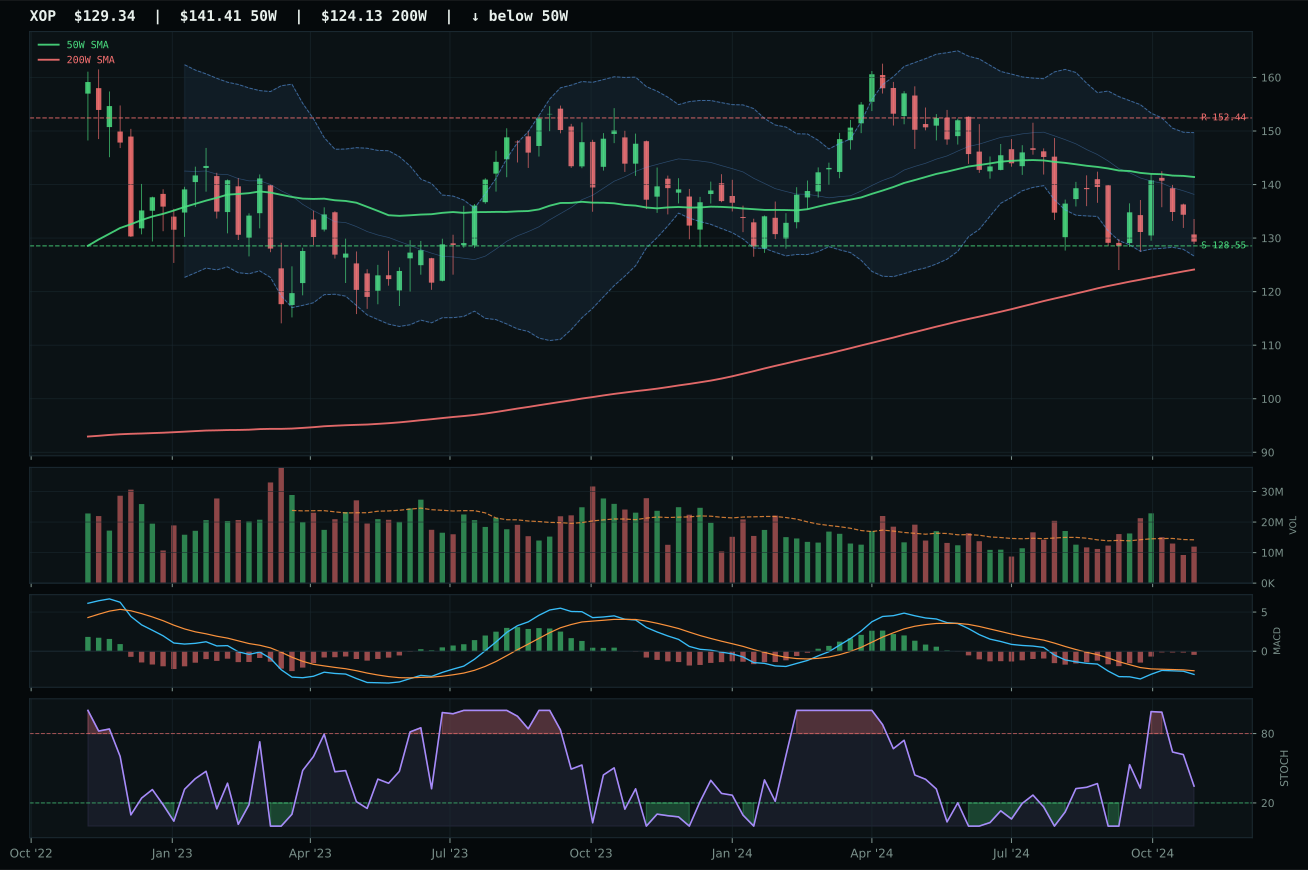
XOP has a pullback into support profile with -11.2% 13-week relative strength versus SPY.
A failed hold above support would weaken the setup.
Actionable but governed by invalidation levels.
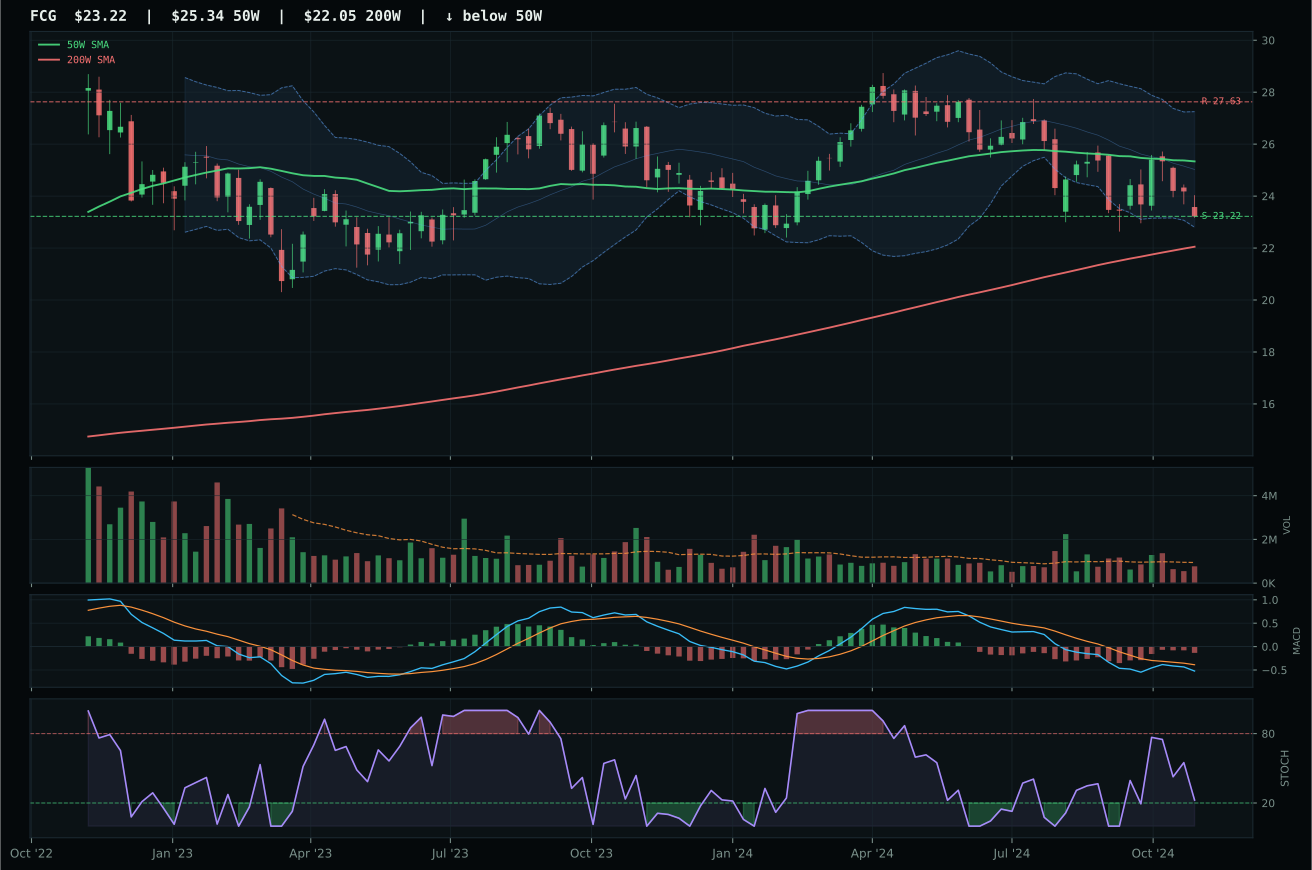
FCG has a pullback into support profile with -11.6% 13-week relative strength versus SPY.
A failed hold above support would weaken the setup.
Actionable but governed by invalidation levels.
XLE won the energy category at a dismal 3.3 final score by assembling the best defense in a collapsing regime: disinflation pressure -10 plus category macro fit of just 16 meant no energy ETF could score well, but XLE posted perfect timing at 100 by sitting at -1.2% distance to the 50-week moving average in pullback-into-support structure near Fibonacci 0.786, creating a defined invalidation at 42.79. The bearish-improving MACD with oversold stochastic RSI turned up at 0.36 creates a mechanical reversal setup, and risk-reward at 75 delivers favorable asymmetry: 2.9% downside vs -7.3% upside, making this a position you can size without fear of structural loss. Thirteen-week return of -0.4% and RS to SPY of -7.6% confirm energy has been shunned, yet category-relative strength at 3.6% shows XLE's integrated cash-flow model is outperforming exploration beta; XOP lost to XLE because XOP's timing at 85 was weaker (further from 50-week), SPY-relative strength at -11.2% was appalling, and macro fit at 33 offered no support for speculative energy.
Traditional Energy scored 4.1 and received zero allocation because it ranks ninth or tenth in macro fit at 16.0/100, demolished by disinflation's -10-point penalty and active disinflation pressure (-10 points) alongside credit stress (-7) and liquidity strain (-7). This is the anti-narrative in the current regime: falling prices hurt energy companies' cash generation and return on capital, and there is no monetary hedge demand or growth acceleration to compensate. XLE's perfect timing score (100.0/100) and exceptional risk-reward (98.0/100) matter little when the category macro fit is this hostile; this is technical setup fighting a macro headwind it cannot overcome. The setup will not improve unless disinflation reverses or credit-stress metrics deteriorate sharply enough to force flight-to-safety energy demand. Zero allocation is correct; stay out until regime indicators shift.