
2024-10-25
Informational purposes only. The content in this report, including allocations, analysis, and commentary, is provided solely for informational and educational purposes. It does not constitute financial advice, investment advice, trading advice, or any other type of advice. Past performance does not guarantee future results. Always conduct your own research and consult a qualified financial professional before making investment decisions.
Weekly Allocation
| Ticker | Category | Weight | Role |
|---|---|---|---|
| FBTC | 50% | Overlay | |
| GLD | Precious Metals | 10% | Top-2 (10%) |
| PAVE | Utilities & Infrastructure | 10% | Top-2 (10%) |
| IGV | Technology | 5% | Tier-2 (5%) |
| URA | Nuclear Energy | 5% | Tier-2 (5%) |
| XAR | Defense & Aerospace | 5% | Tier-2 (5%) |
| SMH | AI | 5% | Tier-2 (5%) |
| COPX | Industrial Metals | 5% | Tier-2 (5%) |
| INDA | Emerging Markets | 5% | Tier-2 (5%) |
Trade Instructions — Monday Open
Sell the tranche from 2024-09-27 (completing its 4-week hold). Buy the new tranche. Instructions show net portfolio changes — same-asset positions cancel, weight changes show the delta.
| Action | Ticker | Instruction |
|---|---|---|
| SELL | XLU | Sell entire XLU position (2.50% of portfolio) |
| SELL | NLR | Sell entire NLR position (1.25% of portfolio) |
| SELL | IEMG | Sell entire IEMG position (1.25% of portfolio) |
| SELL | AIQ | Sell 50% of AIQ position (reduce 2.50% → 1.25%) |
| BUY | PAVE | Buy PAVE — 40.00% of freed cash (adds 2.50% to portfolio) |
| BUY | URA | Buy URA — 20.00% of freed cash (adds 1.25% to portfolio) |
| BUY | SMH | Buy SMH — 20.00% of freed cash (adds 1.25% to portfolio) |
| BUY | INDA | Buy INDA — 20.00% of freed cash (adds 1.25% to portfolio) |
Current Portfolio After Trade
Combined holdings across all 4 active tranches. Each tranche is 25% of the portfolio.
| Ticker | % of Portfolio | Weight Bar |
|---|---|---|
| FBTC | 50.00% | |
| PAVE | 10.00% | |
| GLD | 7.50% | |
| COPX | 5.00% | |
| URA | 5.00% | |
| SMH | 3.75% | |
| MOO | 3.75% | |
| XAR | 2.50% | |
| ITA | 2.50% | |
| CIBR | 2.50% | |
| SLV | 2.50% | |
| AIQ | 1.25% | |
| XLK | 1.25% | |
| IGV | 1.25% | |
| INDA | 1.25% |
Macro Regime — Disinflation
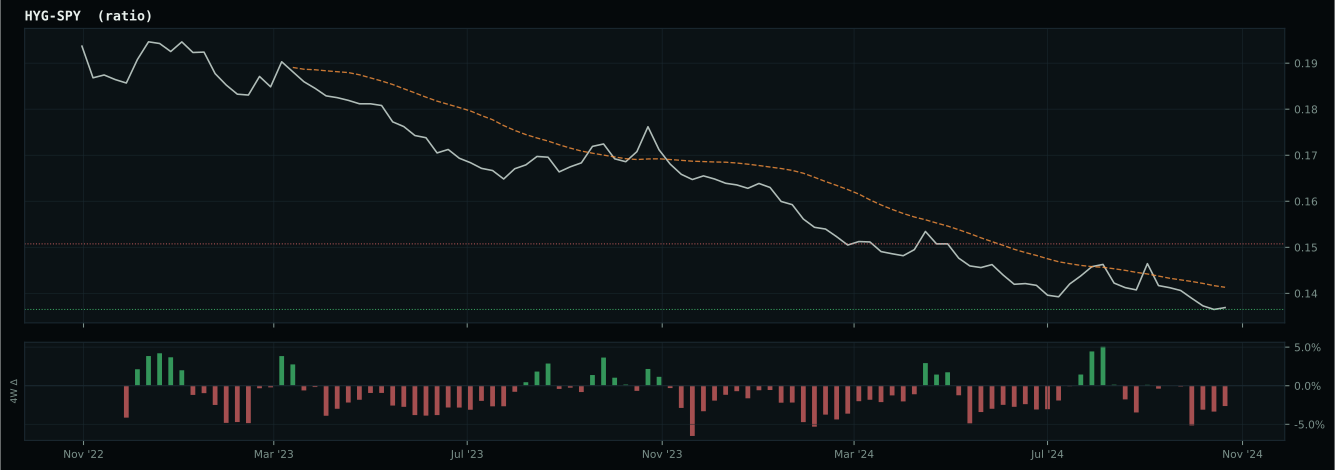
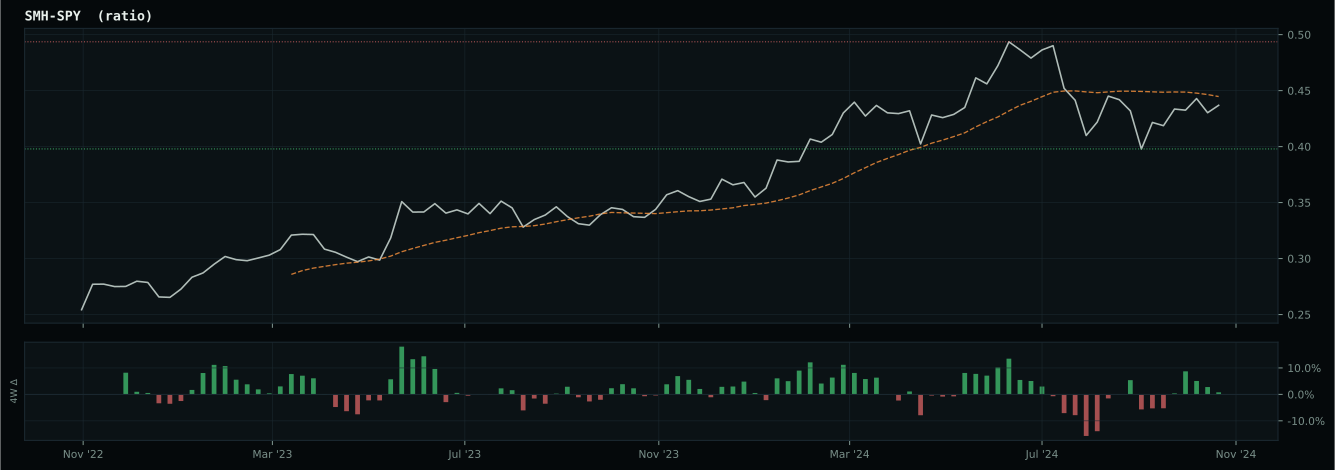
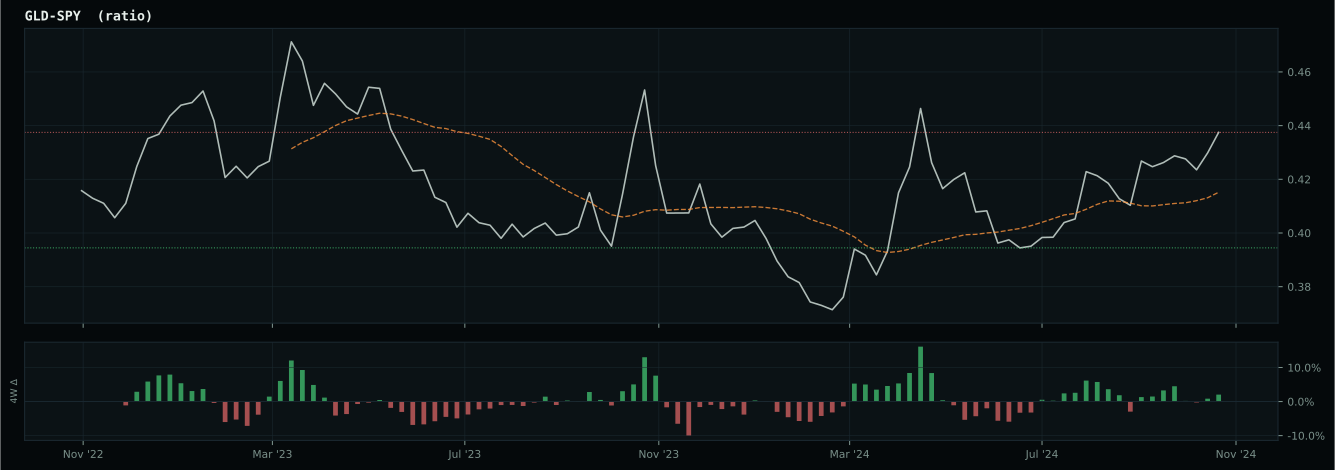
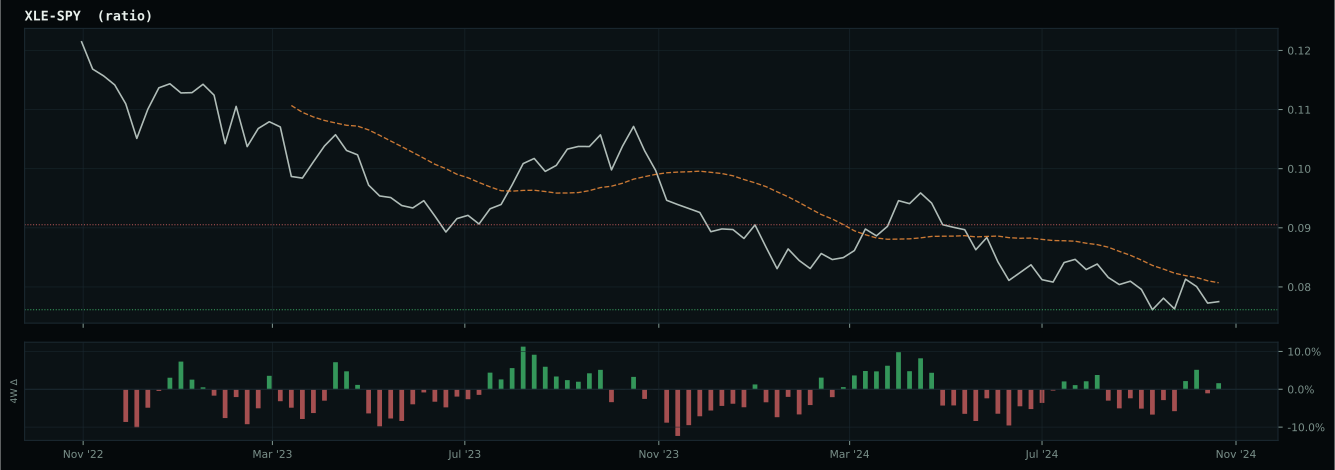
growth data is not confirming the weak market-implied risk appetite signal
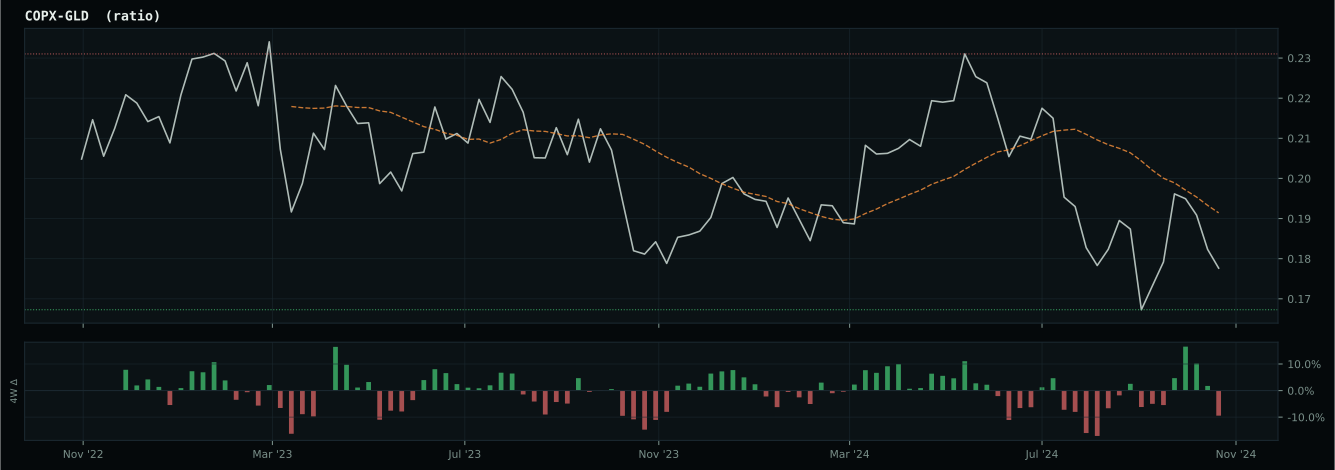
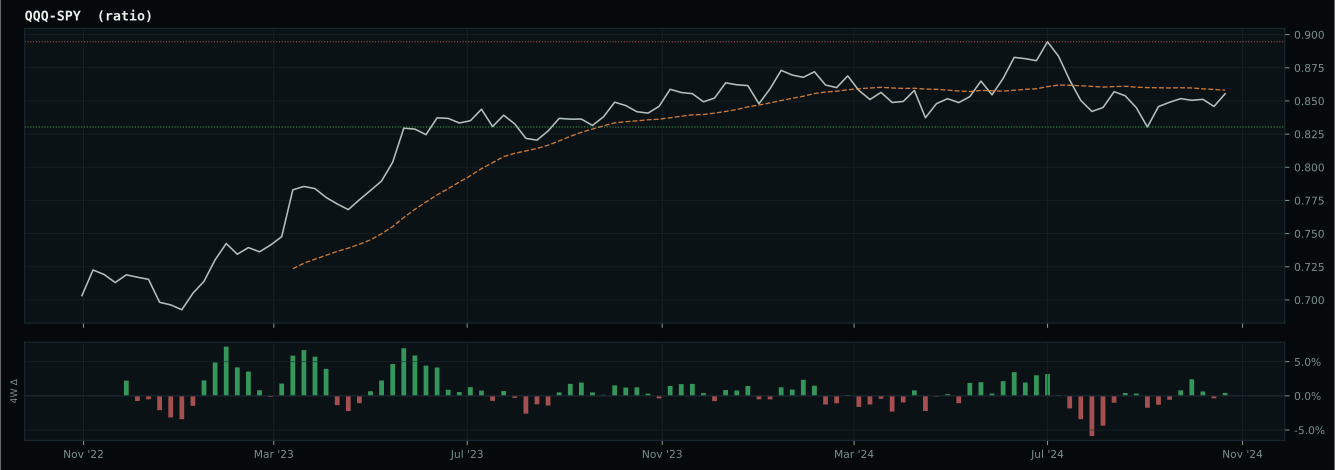
Macro Evidence Charts
Market-implied signals behind the macro regime scores. Each ratio compares two assets; the direction and slope of the ratio is what the macro engine reads.
Crypto Regime — TrendBTC
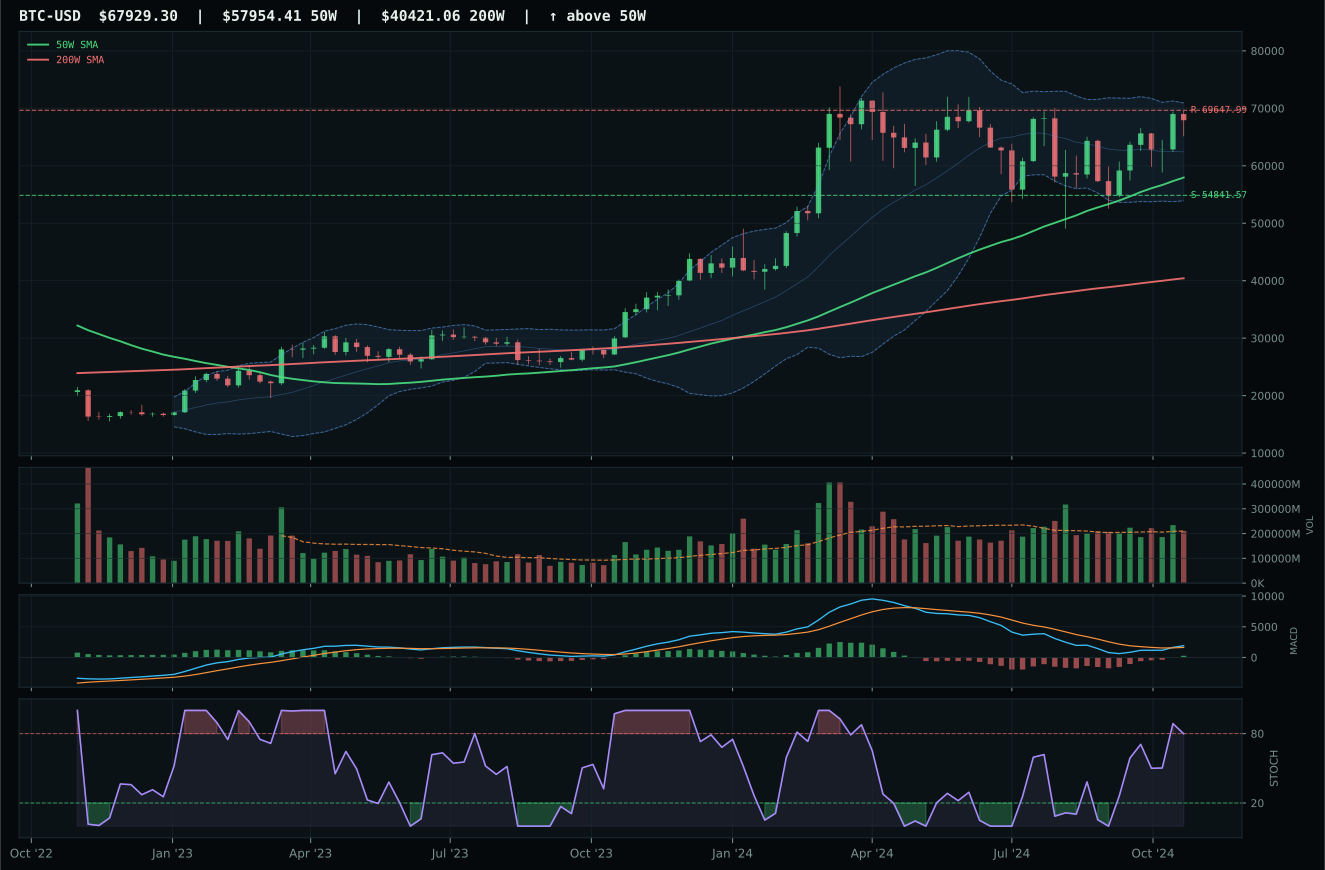
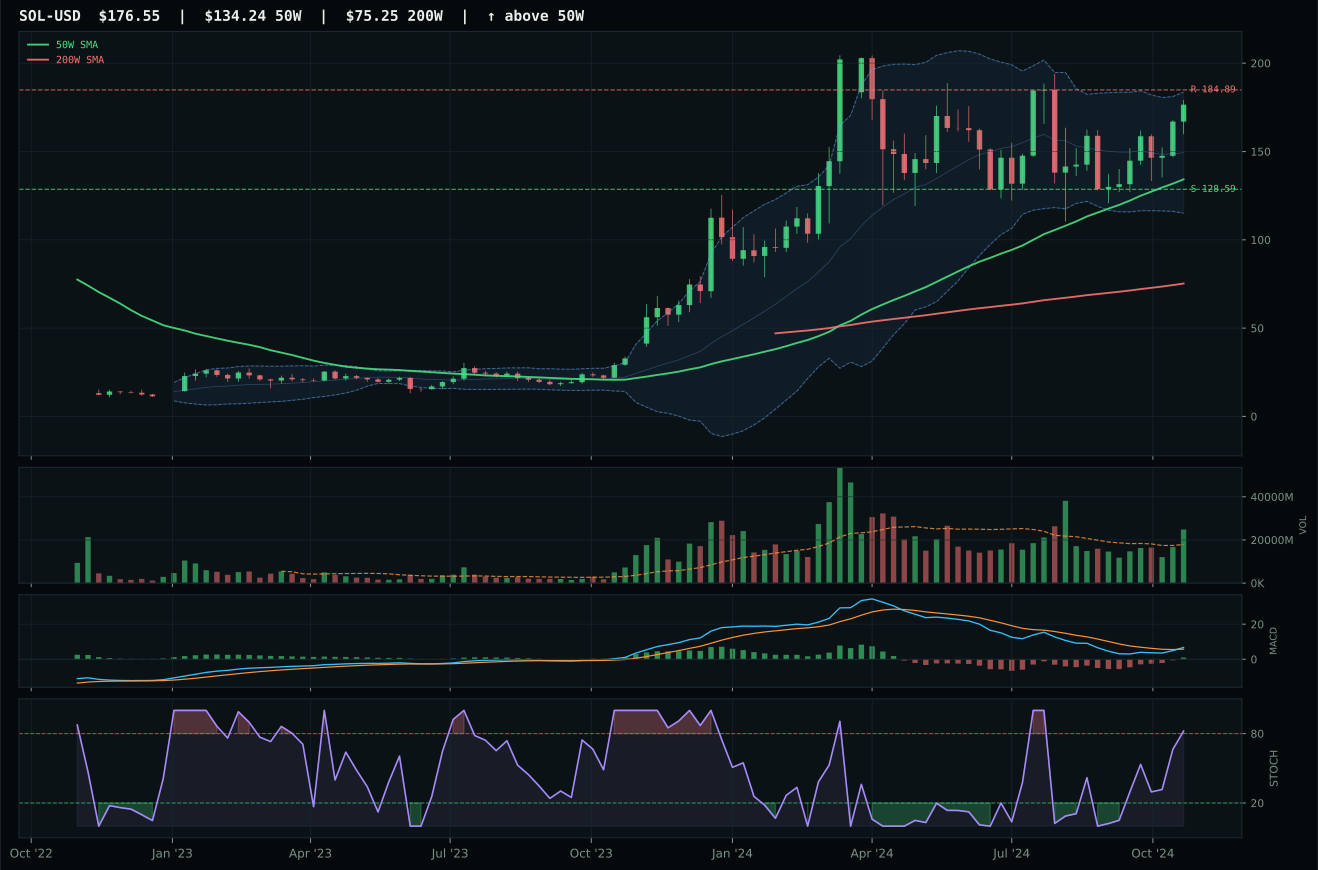
ValueBTC not armed: BTC has not made the first post-breakdown touch of the 200W buy zone after losing the 50W
TrendBTC confirmed: 2 consecutive closes above rising/flat 50W SMA
one or more available conditions failed
Category Rankings
| Rank | Category | Winner | Score | Alloc | 4W Ret | Peers (4W) |
|---|---|---|---|---|---|---|
| 1 | Precious Metals | GLD | 81.5 | 20% | -3.45% | SLV -9.7% · GDX -10.5% |
| 2 | Utilities & Infrastructure | PAVE | 75.3 | 20% | +10.13% | XLU +1.6% · IGF +2.6% |
| 3 | Technology | IGV | 57.4 | 10% | +15.77% | CIBR +4.6% · XLK +1.5% |
| 4 | Nuclear Energy | URA | 57.2 | 10% | +6.05% | NLR +5.3% · URNM +1.2% |
| 5 | Defense & Aerospace | XAR | 49.1 | 10% | +9.20% | ITA +3.4% · ROKT +15.8% |
| 6 | AI | SMH | 47.2 | 10% | -2.54% | AIQ +3.4% · BOTZ +5.4% |
| 7 | Industrial Metals | COPX | 39.3 | 10% | -5.87% | REMX -3.1% · PICK -3.8% |
| 8 | Emerging Markets | INDA | 17.2 | 10% | -0.33% | IEMG -3.5% · ILF -3.0% |
| 9 | Agriculture & Livestock | MOO | 9.4 | 0% | -0.55% | VEGI +1.7% · WEAT -5.3% |
| 10 | Traditional Energy | XLE | 8.8 | 0% | +10.69% | XOP +13.8% · FCG +12.9% |
Precious Metals — GLD
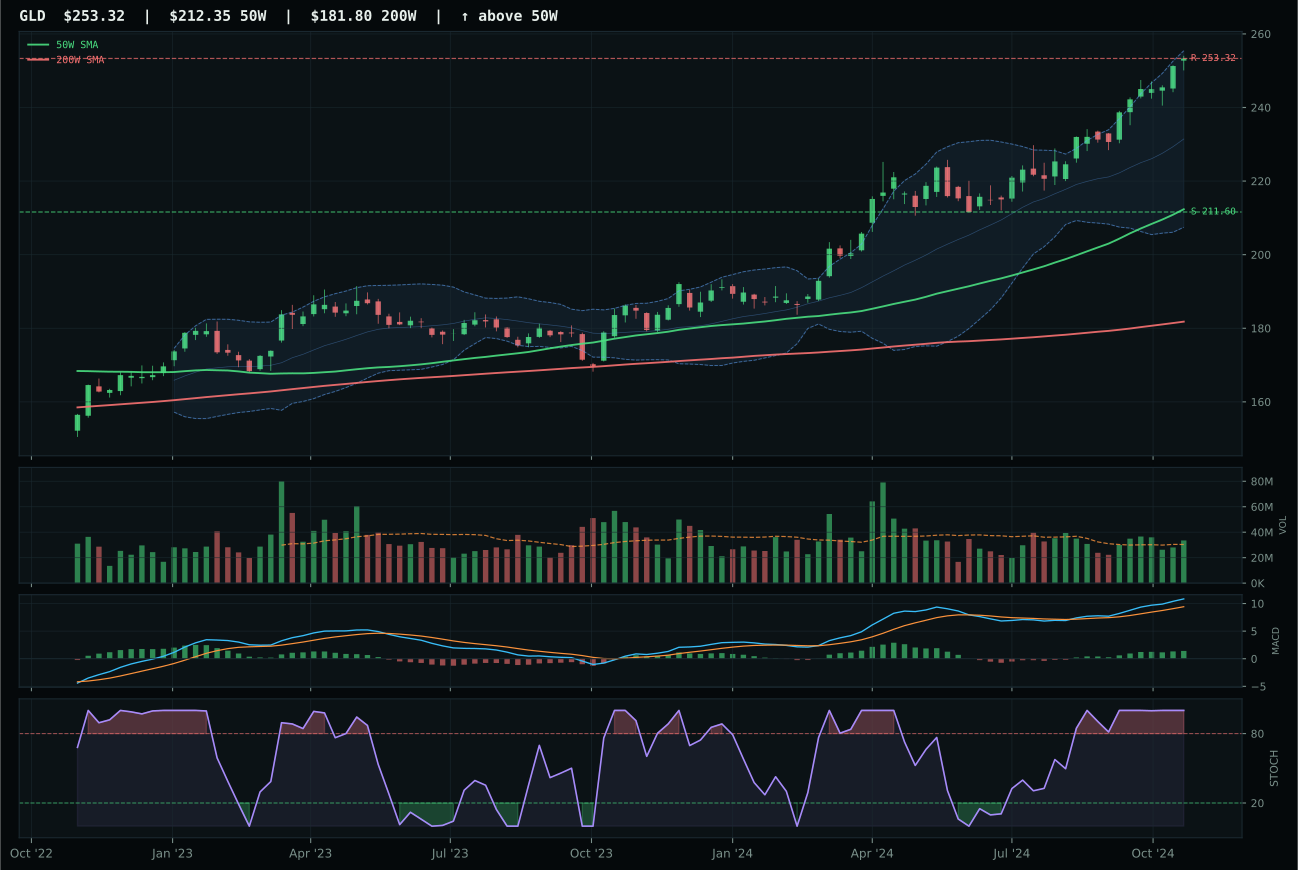
GLD has a vertical extension profile with 8.5% 13-week relative strength versus SPY.
A failed hold above support would weaken the setup.
Actionable but governed by invalidation levels.
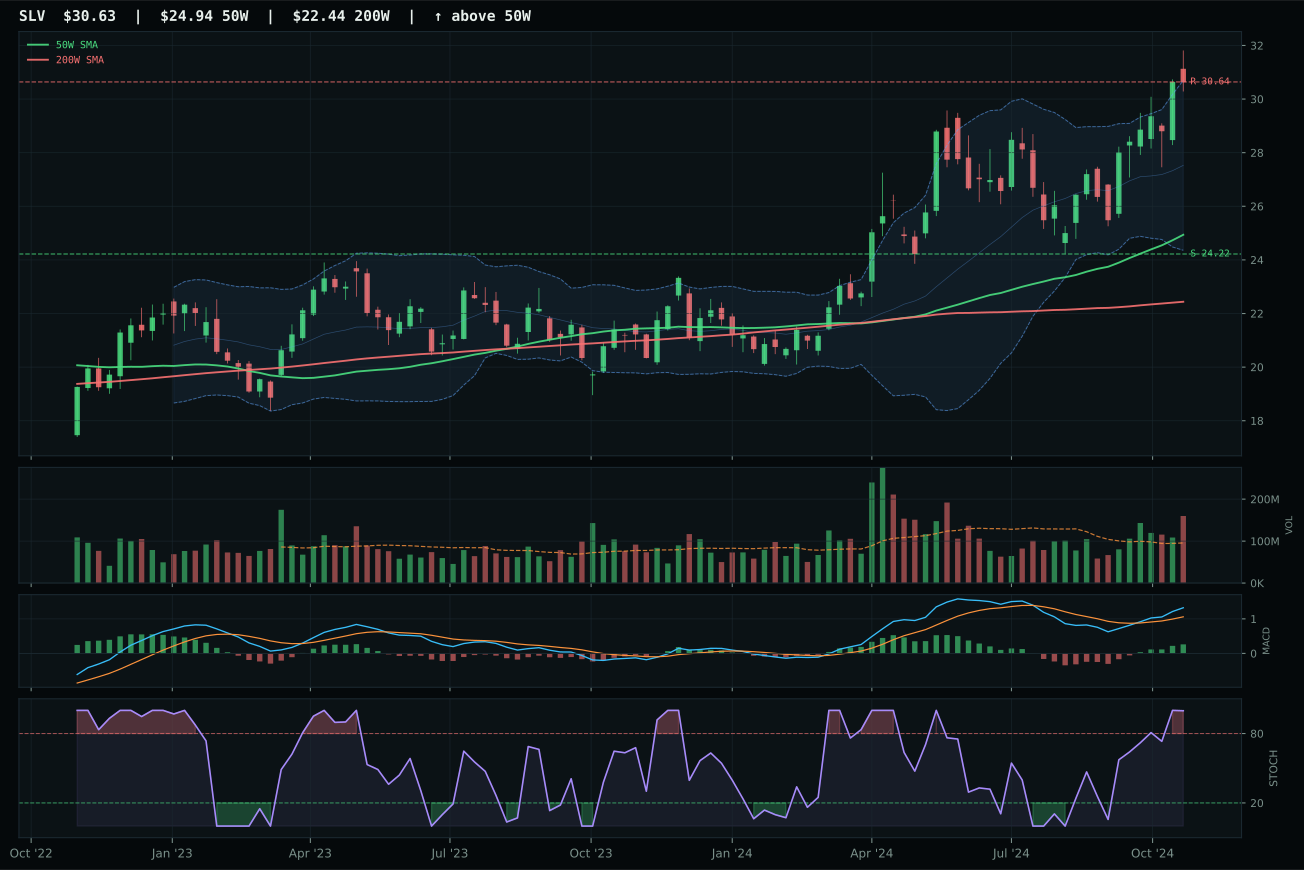
SLV has a vertical extension profile with 13.9% 13-week relative strength versus SPY.
A failed hold above support would weaken the setup.
Actionable but governed by invalidation levels.
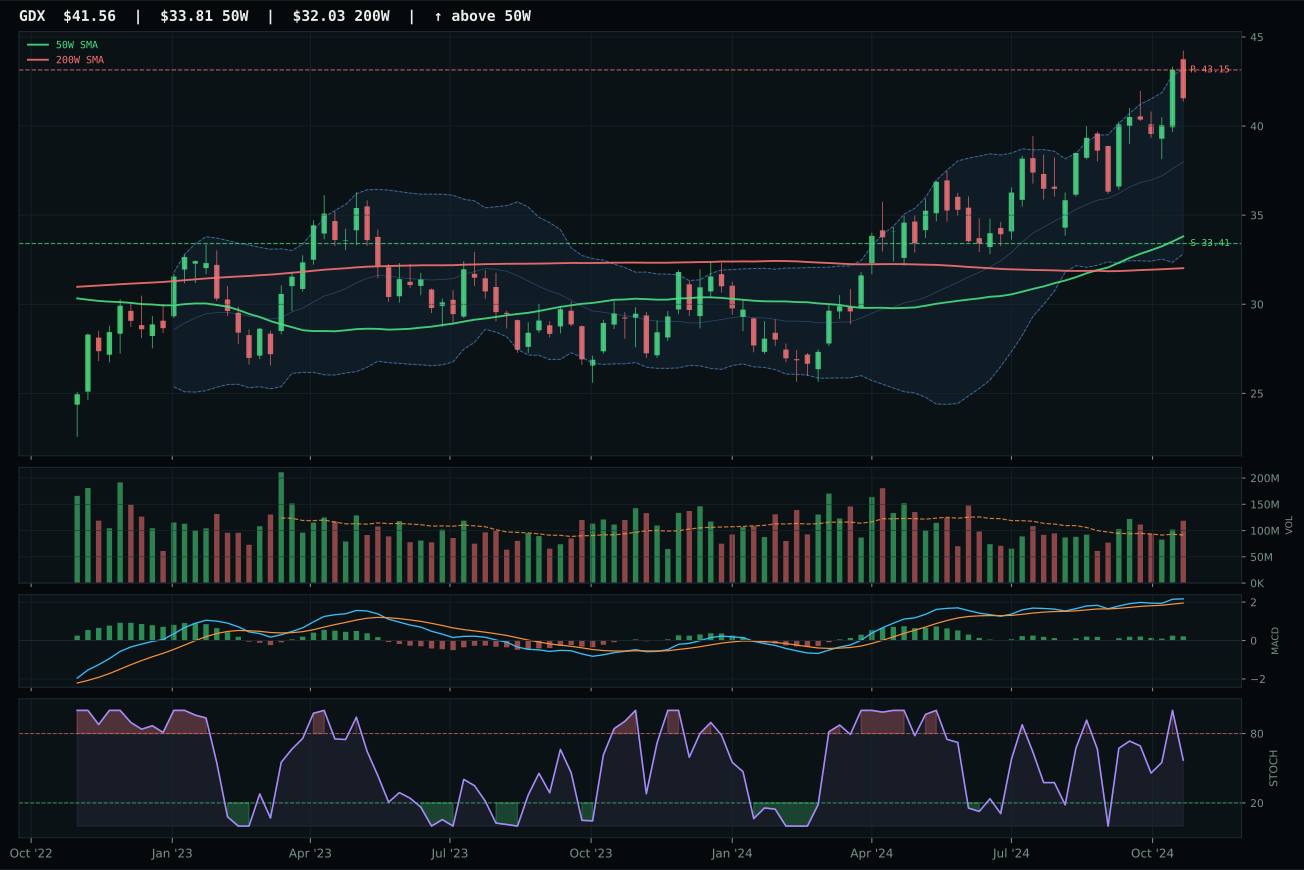
GDX has a vertical extension profile with 7.6% 13-week relative strength versus SPY.
A failed hold above support would weaken the setup.
Actionable but governed by invalidation levels.
GLD captured top-two status and the metals category through demonstrated monetary hedge sponsorship and clean structural extension with active institutional accumulation. Its 8.5% RS versus SPY tells a complete story: capital is flowing into gold specifically as a hedge against credit stress and deflation risk, not into the commodity complex broadly. The 19.3% extension above the 50W creates entry risk that the 99.8 momentum confirmation score fully justifies—thirteen-week returns of 14.8% with a stochastic RSI at maximum overbought (1.00) means every new buyer enters at peak valuation risk. Yet the 1.10x volume reading (above-average participation) contradicts the extension; this is institutional buying, not retail FOMO, evidenced by persistence scores near 76. GLD's 81.1 structure score reflects vertical extension rather than compression, meaning the setup is extended but clean, supporting the macro case for monetary hedge positioning over speculative gold trading.
Precious metals rank top-2 at 81.5, earning 10% allocation as the second-highest category score this week. Macro fit of 85.0/100 is a structural advantage: monetary hedge bid is active at +14, defensive rotation at +7, and disinflation pressure at +6 create a 27-point tailwind that reinforces technical strength. This is the rare category where macro and technical evidence align decisively—the category's 62/38 technical-to-macro weighting means the 85.9 technical evidence from the representative (GLD) combines cleanly with near-perfect narrative fit to justify top-2 positioning. The setup is extended, with GLD at 19.3% above the 50-week and stochastic RSI maxed at 1.00, creating entry risk that is explicitly reflected in the 37.0 timing score—yet the conviction that gold's monetary hedge function will persist into a liquidity-stressed, credit-anxious disinflation justifies the allocation. Gold holders accept near-term extension as the price of portfolio insurance; the 10% sleeve reflects capital protecting against tail risks while capturing upside from rising real rates and hedged nominal returns.
Utilities & Infrastructure — PAVE
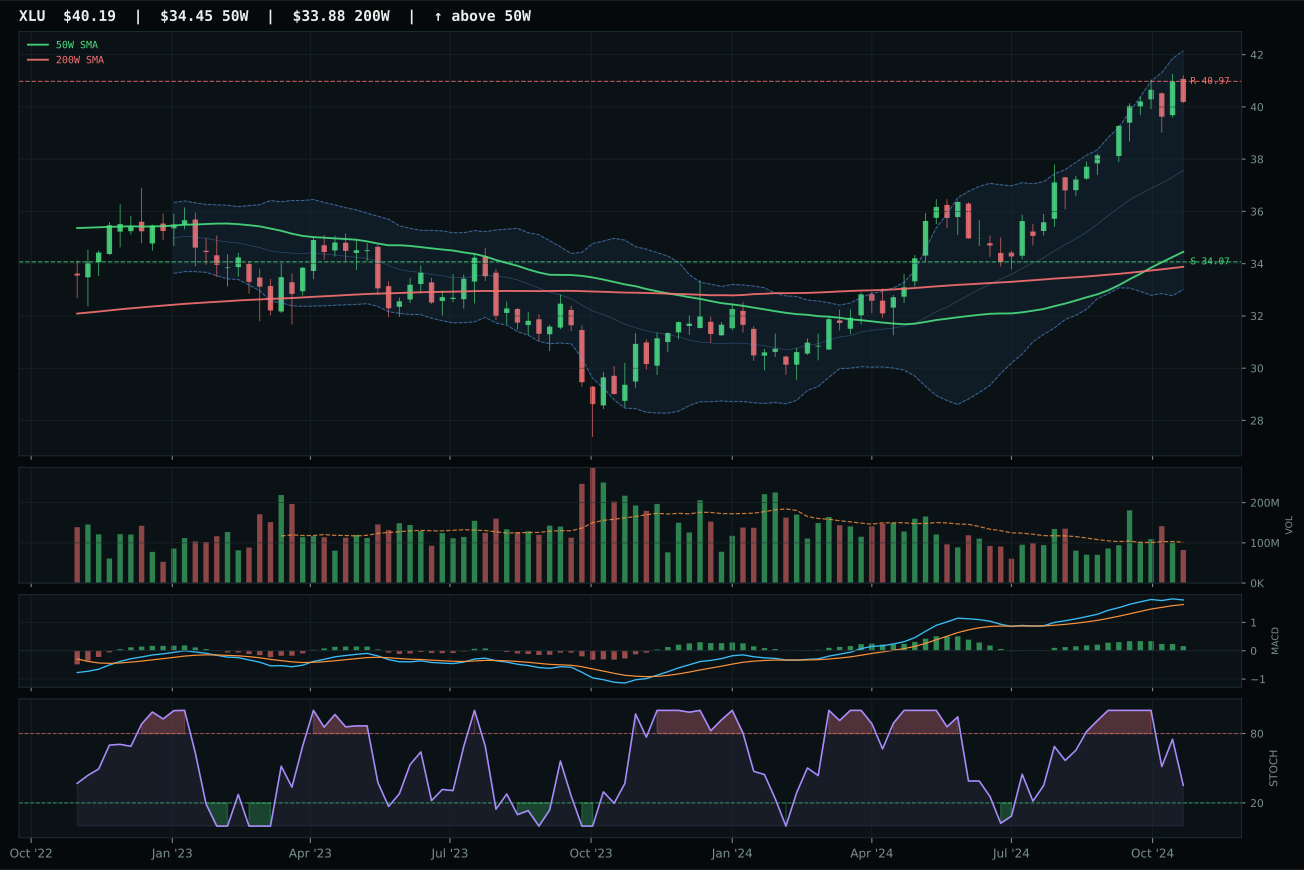
XLU has a vertical extension profile with 6.6% 13-week relative strength versus SPY.
A failed hold above support would weaken the setup.
Actionable but governed by invalidation levels.
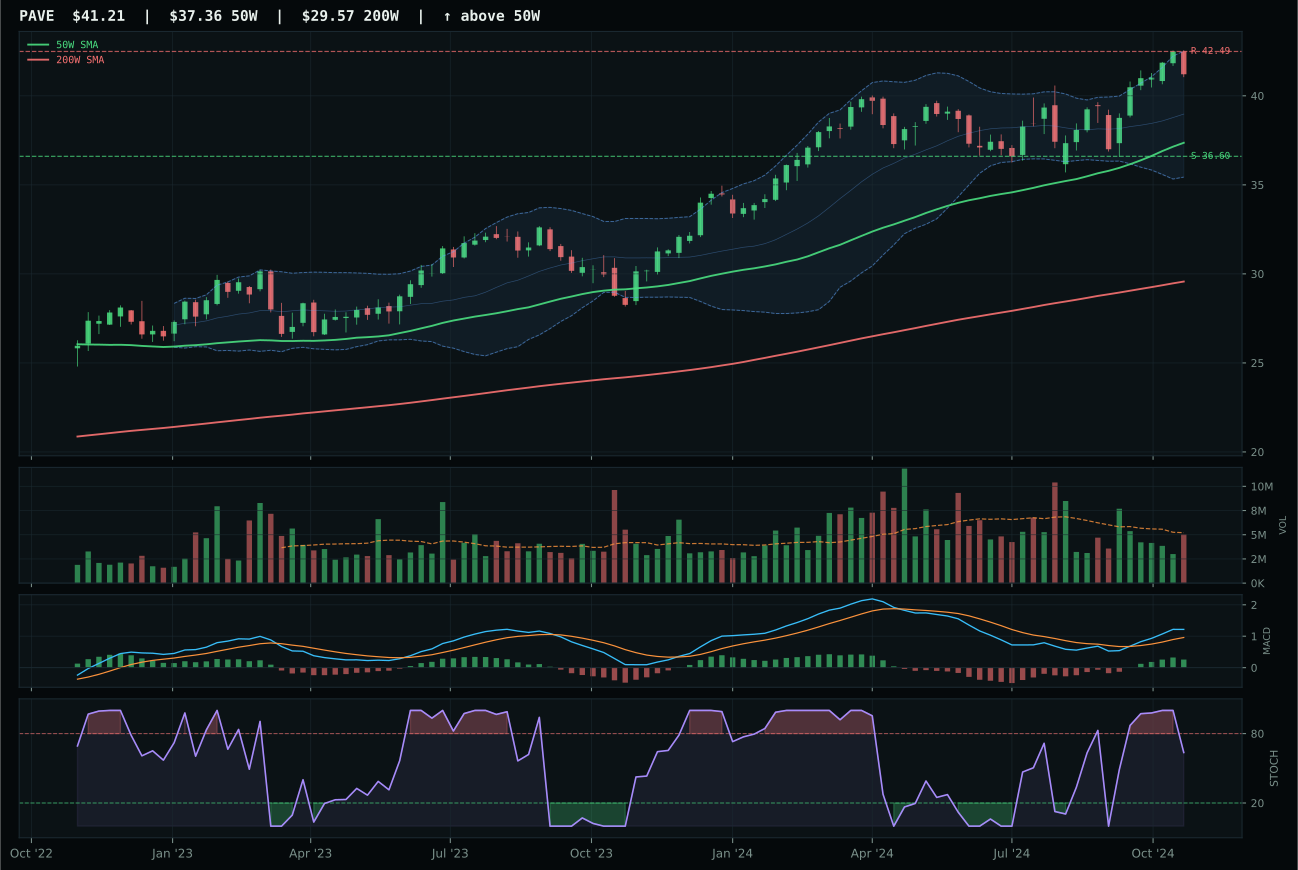
PAVE has a neutral structure profile with -1.6% 13-week relative strength versus SPY.
A failed hold above support would weaken the setup.
Actionable but governed by invalidation levels.
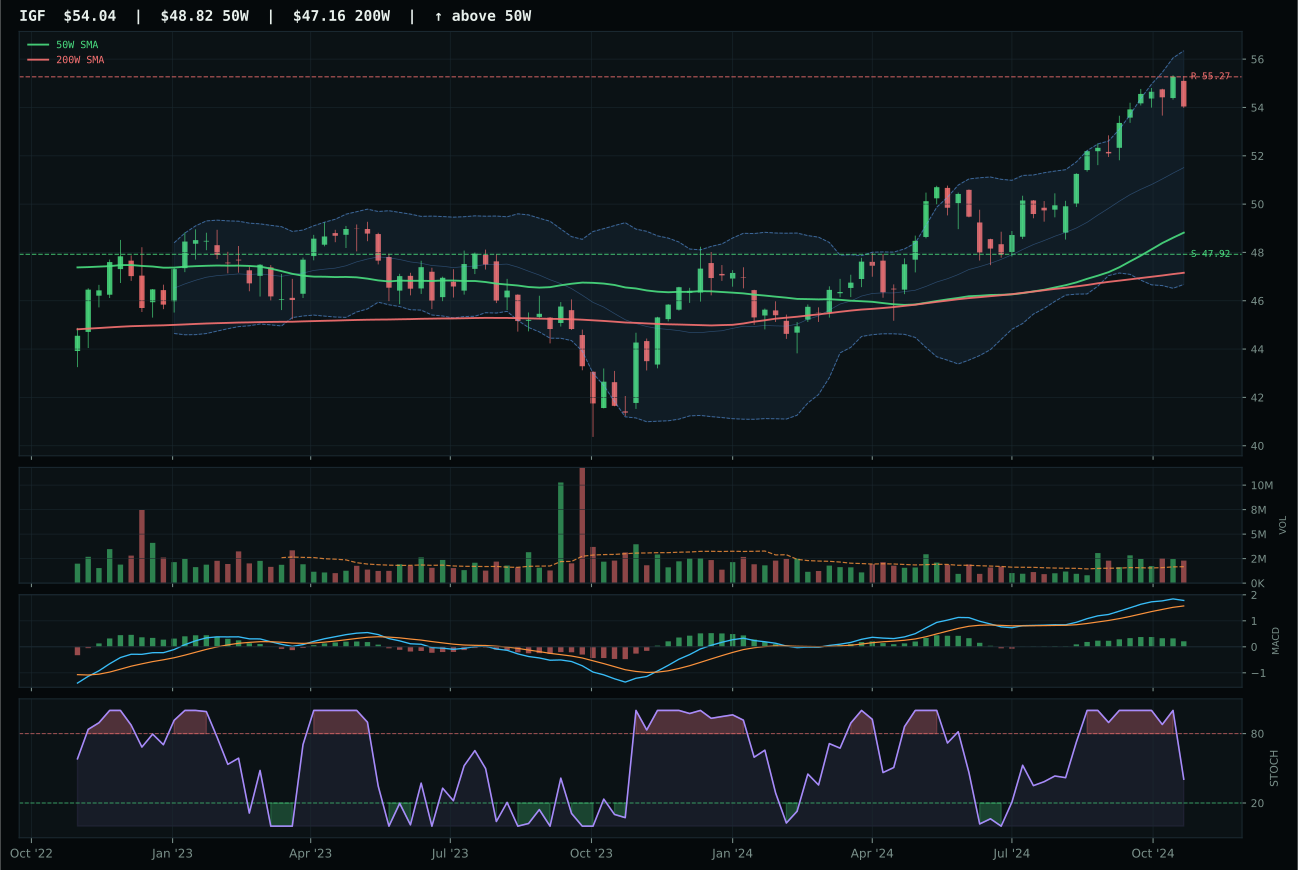
IGF has a neutral structure profile with 2.3% 13-week relative strength versus SPY.
A failed hold above support would weaken the setup.
Actionable but governed by invalidation levels.
PAVE captured top-two status by delivering superior technical roadmap and better reward geometry than XLU despite an intensity gap in momentum. PAVE's 67.0 timing score beats XLU's 48.0 through tighter proximity to the 50W (10.3% versus 16.7%) and bullish-and-improving MACD versus XLU's bullish-but-flattening deterioration. The structure score of 79.0 for PAVE versus 70.6 for XLU reflects superior compression and support integrity; XLU is extended into vertical territory while PAVE remains in neutral structure, offering better risk-adjusted entry. PAVE's 41.3 risk-reward versus XLU's 31.9 tells the story: PAVE has -3.0% overhead but 12.6% downside cushion, whereas XLU is already compressed with limited expansion room. Neither name offers SPY outperformance (PAVE -1.6%, XLU +6.6% relative strength), but PAVE's defensive positioning with better technicals justifies category leadership and top-two allocation.
Utilities & infrastructure rank top-2 at 75.3, earning 10% allocation due to exceptional macro fit (80.0/100) combining with solid technical evidence (71.3/100) to justify shared top-2 positioning with precious metals. The macro case is clean: defensive rotation active at +12, disinflation pressure at +6, broad market bear at +4, and transition/mixed support at +4 create a 26-point tailwind that liquidity stress (-6) and credit stress (-5) cannot fully erode. This is infrastructure's structural strength in regime environments where capital seeks yield stability, inflation protection, and earnings visibility—characteristics that disinflation regimes reward. The reasoned proof order shows IGF, PAVE, and XLU nearly tied (69.4, 68.9, 68.2), indicating genuine category quality without single dominant technical leader, yet the category-level macro sponsorship overcomes that technical marginal call. PAVE's 4.8% 13-week return is modest yet steady, confirming accumulation into domestic capex cycles rather than speculative rotation. The 10% allocation signals confidence in infrastructure's secular tailwinds (energy transition, broadband capex, grid modernization) amplified by disinflation-era valuations and yield pickup. This is the rare category where macro sponsorship creates genuine conviction beyond technical setup quality alone.
Technology — IGV
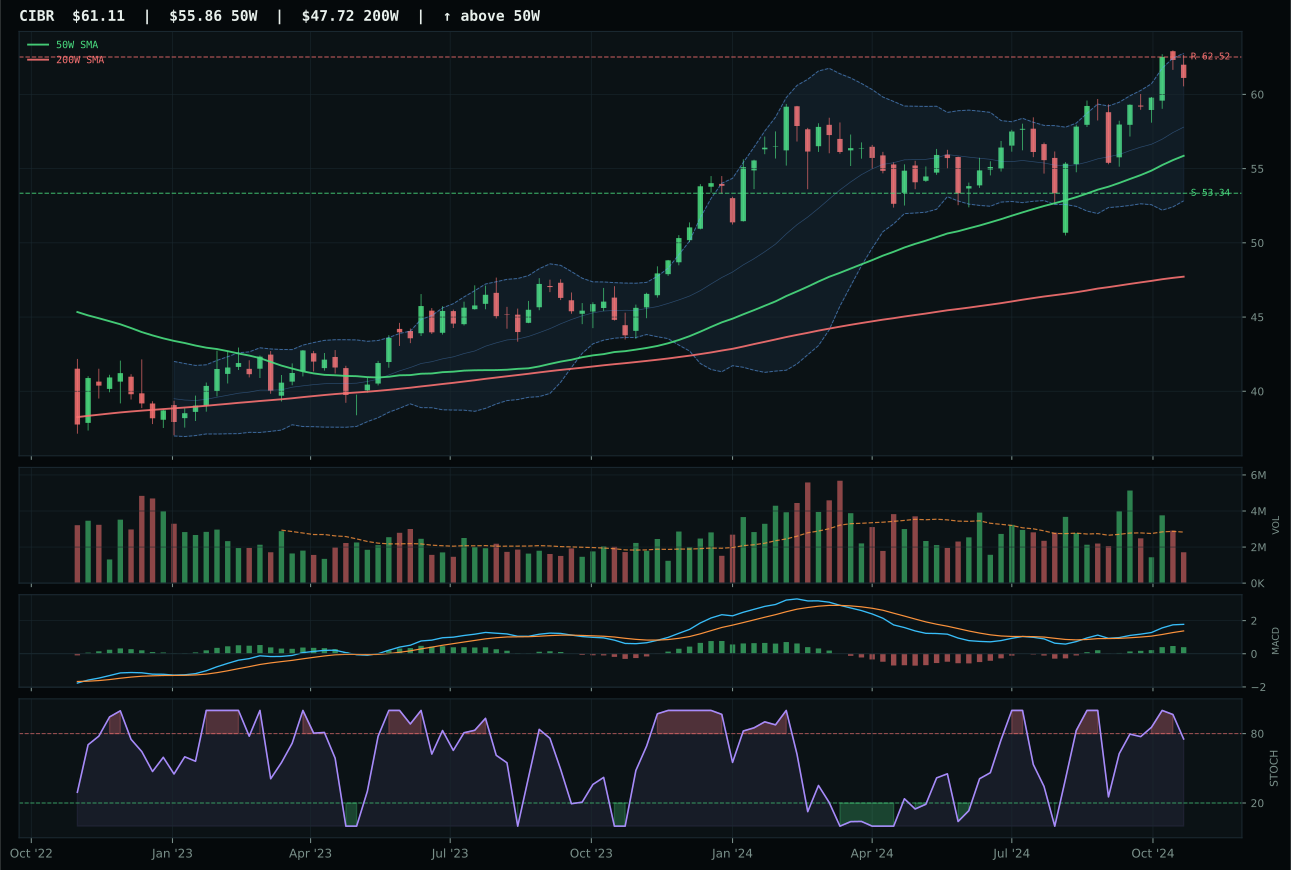
CIBR has a neutral structure profile with 3.6% 13-week relative strength versus SPY.
A failed hold above support would weaken the setup.
Actionable but governed by invalidation levels.
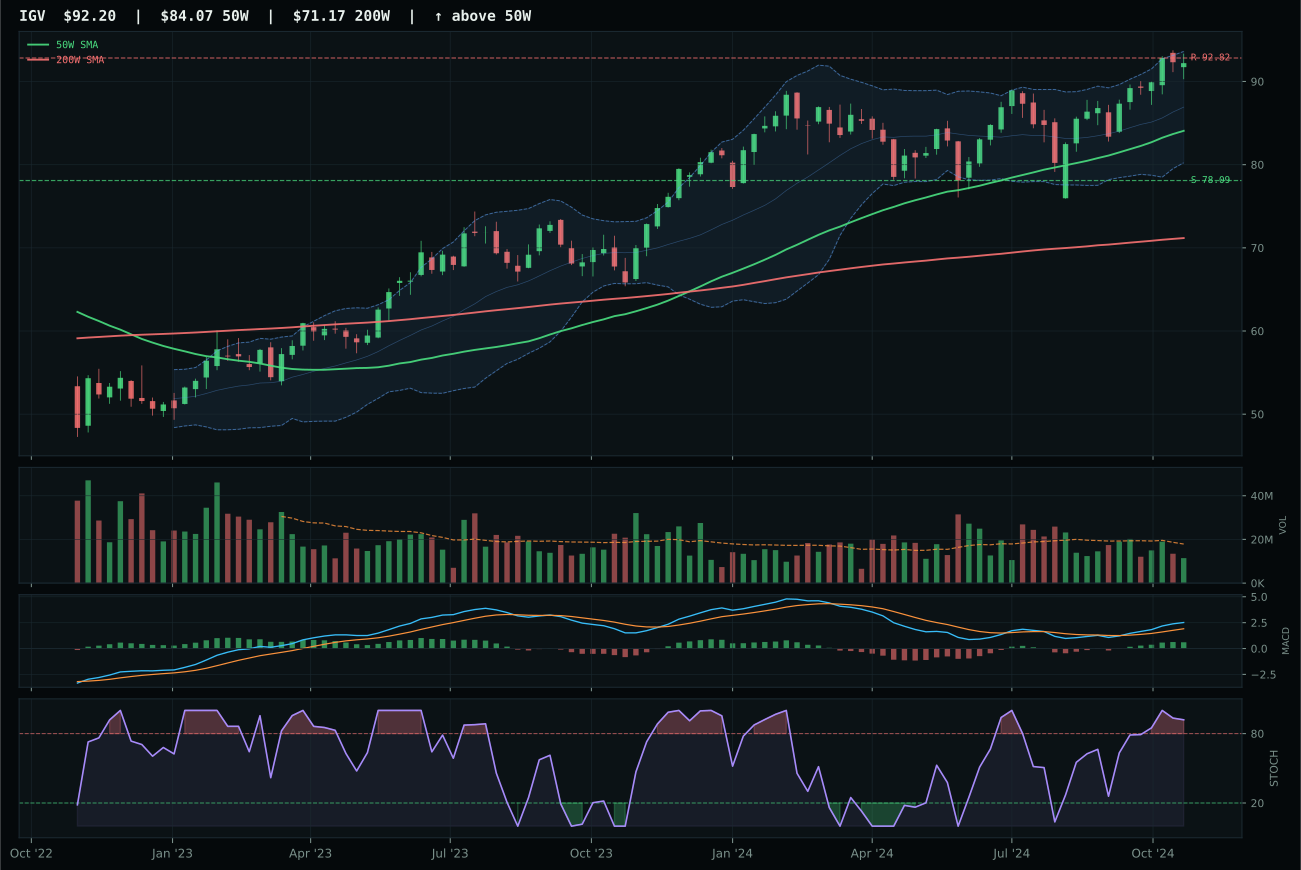
IGV has a neutral structure profile with 2.4% 13-week relative strength versus SPY.
A failed hold above support would weaken the setup.
Actionable but governed by invalidation levels.
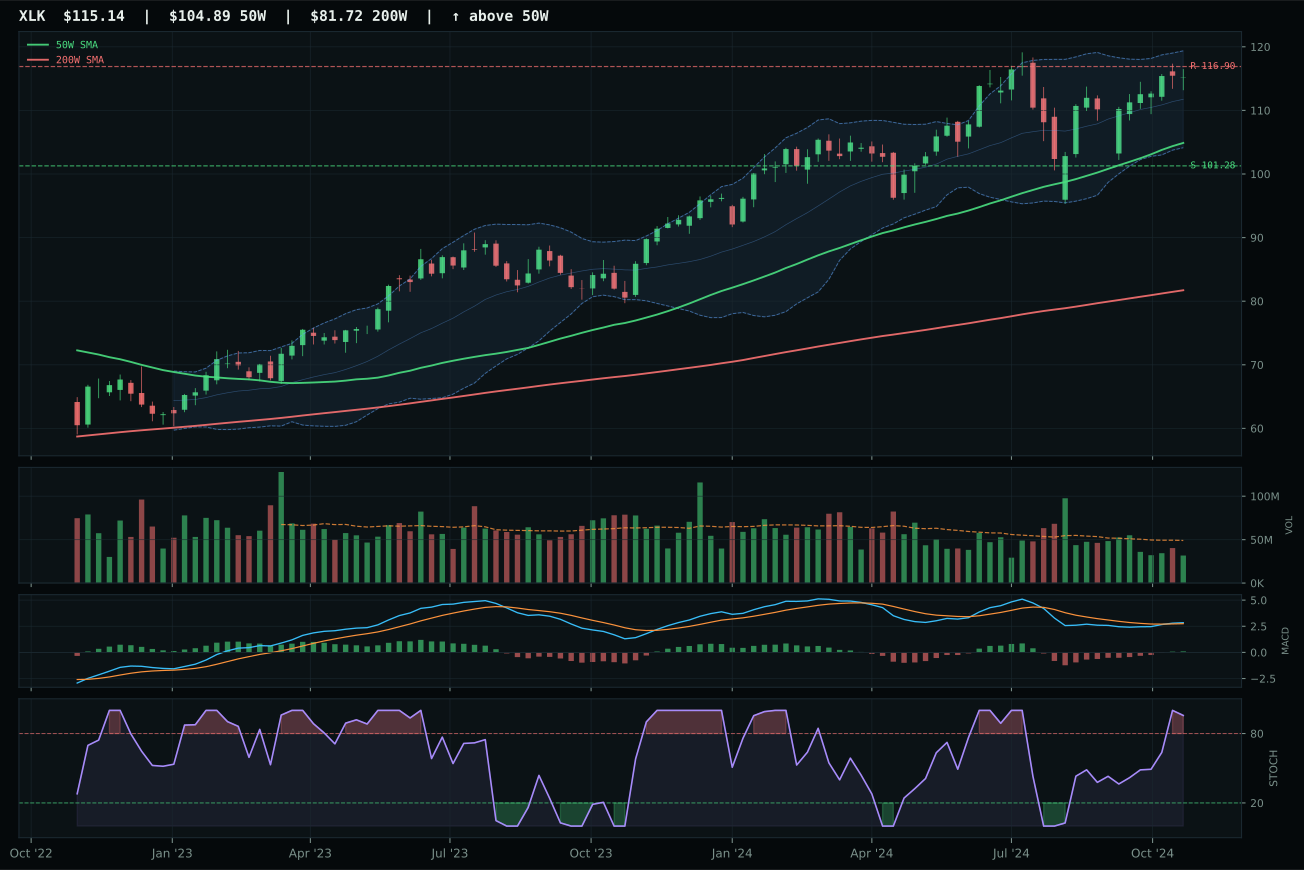
XLK has a neutral structure profile with 0.1% 13-week relative strength versus SPY.
A failed hold above support would weaken the setup.
Actionable but governed by invalidation levels.
IGV captured the category by delivering cleaner structure and superior relative strength confirmation versus CIBR despite a tighter technical margin. IGV's 77.3 structure score versus CIBR's 74.6 reflects better compression and support integrity, while a 2.4% RS versus SPY paired with a perfectly neutral category-relative standing suggests institutional accumulation rather than retail chase. The setup sits 9.7% above the 50W moving average with stochastic RSI pinned at overbought (0.92), indicating late-stage entry risk that the allocator is consciously accepting given the bullish MACD improvement and 8.8% thirteen-week return. Volume confirmation remains thin at 0.64x average, meaning conviction is present but breadth remains suspect—the chart is clean but not yet sponsored by institutional aggregation.
Technology scores 58.5 and holds 5% allocation outside the top-2 due to structural constraints in a disinflation regime. Macro fit of 45.0/100 reflects conflicting headwinds: disinflation pressure adds 7 points while liquidity stress and credit stress each subtract double digits, creating a 20-point drag that technical strength alone cannot overcome. The category's 62/38 technical-to-macro weighting means the crisp trend and momentum data (MACD bullish, stochastic overbought across the basket) cannot push this higher when both IGV and CIBR sit extended from their 50-week lines with thin volume confirming the move. For allocation to improve, the category needs either macro relief—a shift away from liquidity stress fears—or a reset from extended price levels back to tighter entry points. At current levels, the 5% sleeve represents conviction that technology leadership persists, but not confidence in near-term risk/reward.
Nuclear Energy — URA
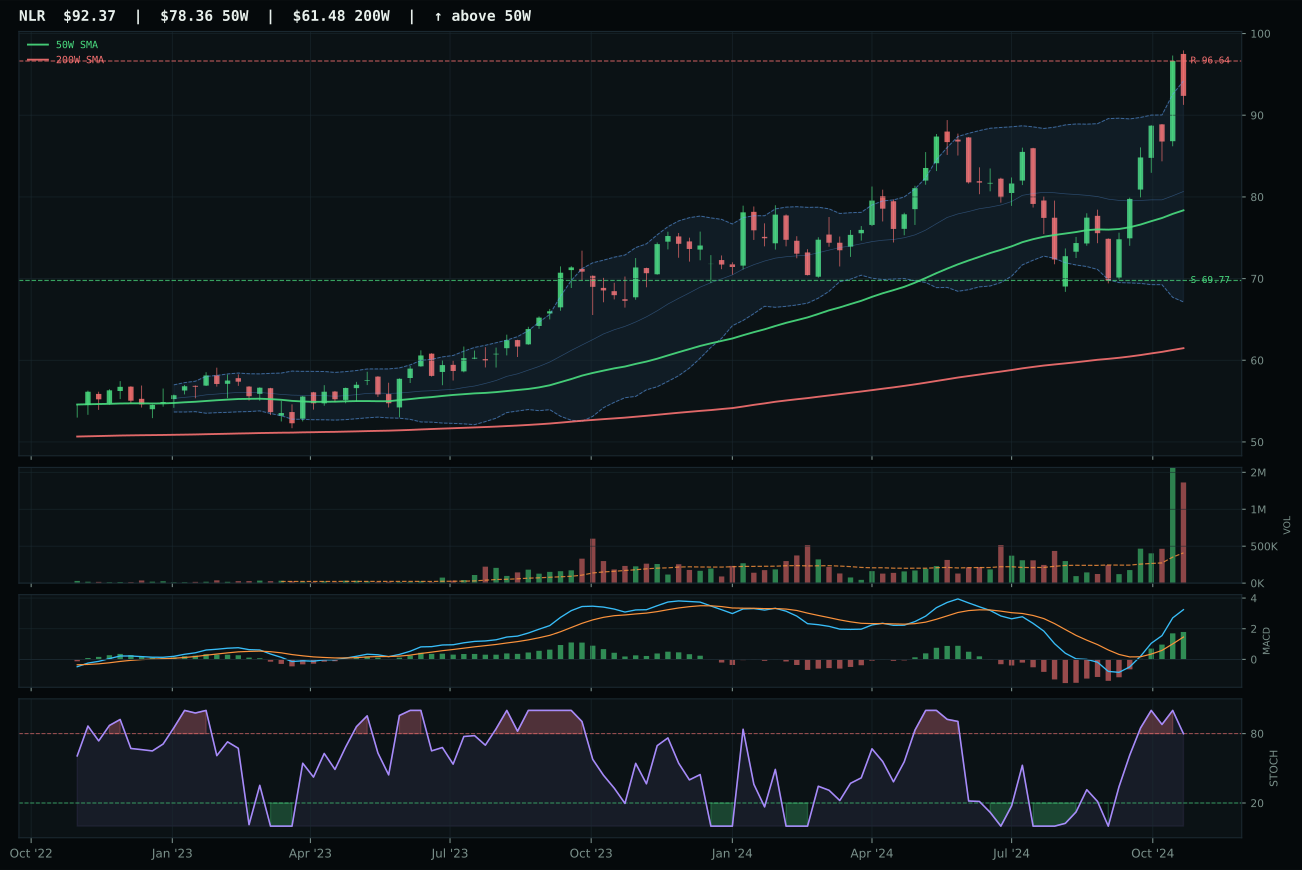
NLR has a vertical extension profile with 12.9% 13-week relative strength versus SPY.
A failed hold above support would weaken the setup.
Actionable but governed by invalidation levels.
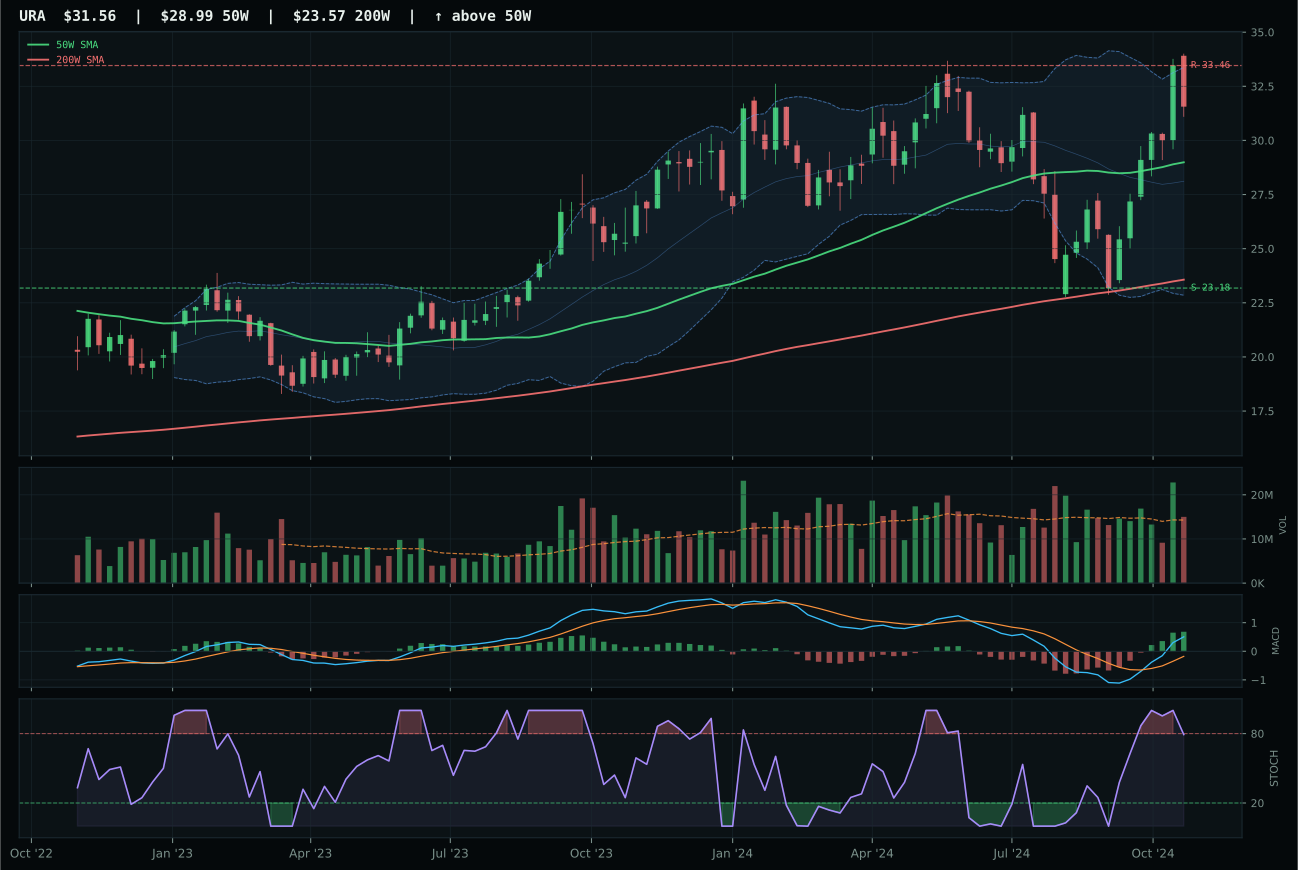
URA has a neutral structure profile with 8.2% 13-week relative strength versus SPY.
A failed hold above support would weaken the setup.
Actionable but governed by invalidation levels.
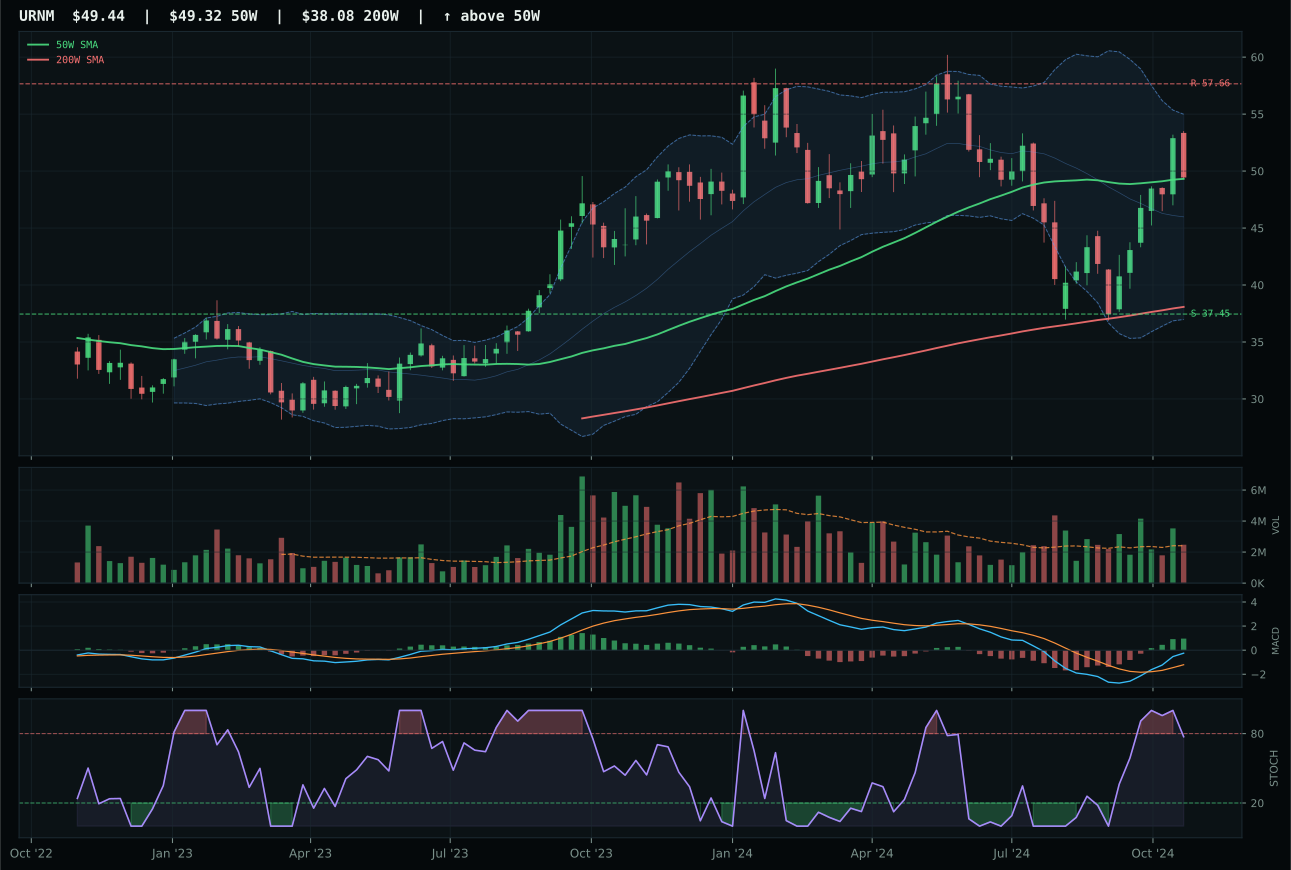
URNM has a compression near 50W profile with 2.3% 13-week relative strength versus SPY.
A failed hold above support would weaken the setup.
Actionable but governed by invalidation levels.
URA won nuclear energy with a clean 9.4-point victory over NLR by trading off NLR's superior momentum (NLR 100 versus URA 100 is a tie) for better timing positioning and structure integrity. URA's 75.0 timing score defeats NLR's 53.0 because the name sits 8.9% above the 50W in the upper retracement zone with room to run, while NLR at 17.9% extension faces meaningful overbought mechanics. NLR's vertical extension setup creates entry risk that its volume profile (distribution pressure) confirms—the market is taking profits into strength. URA's neutral structure and neutral volume participation (1.05x) indicate accumulation is still in progress; combined with an identical 100.0 momentum confirmation score driven by 14.6% thirteen-week returns, URA offers better reward with half the entry risk. The 72.4 persistence score for URA versus NLR's comparable 73 is nearly equal, but URA's superior technical roadmap justifies the category win.
Nuclear energy scores 57.3 and holds 5% allocation, ranking sixth due to moderate macro fit (41.0/100) that benefits from real asset sponsorship at +7 but is offset by liquidity stress (-7), credit stress (-5), and risk appetite broken (-4). The category's technical evidence is strong (83.6/100 for URA, with momentum confirmation maxed at 100.0), yet macro skepticism prevents top-2 positioning—defensive rotation does not explicitly favor nuclear in the descriptor set, and systemic stress risks (credit, liquidity) create fund-flow friction for cyclical energy exposure. URA's positioning at neutral distance from the 50-week and neutral volume participation offer a technically sound entry that avoids the extended risk of NLR and URNM (which sits at compression near the 50-week despite scoring 86 composite). The 5% allocation reflects conviction that energy transition infrastructure and baseload power demand will support uranium miners through a disinflation cycle, yet not enough conviction to compete with precious metals and infrastructure for top-2 capital. To earn 5% allocation, nuclear would need either MACD or relative strength to materially improve across the basket, signaling institutional accumulation beyond the current sentiment baseline.
Defense & Aerospace — XAR
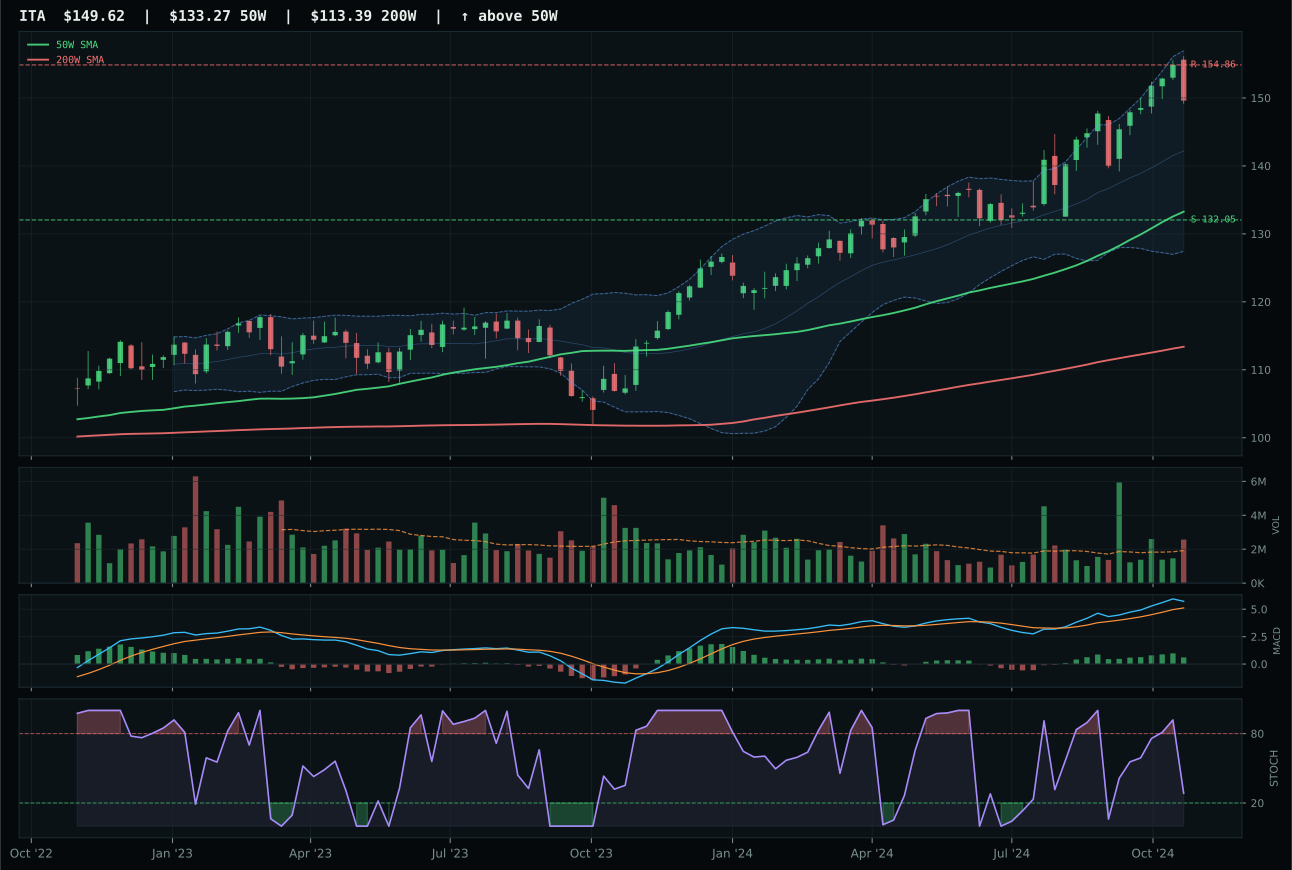
ITA has a neutral structure profile with -0.2% 13-week relative strength versus SPY.
A failed hold above support would weaken the setup.
Actionable but governed by invalidation levels.
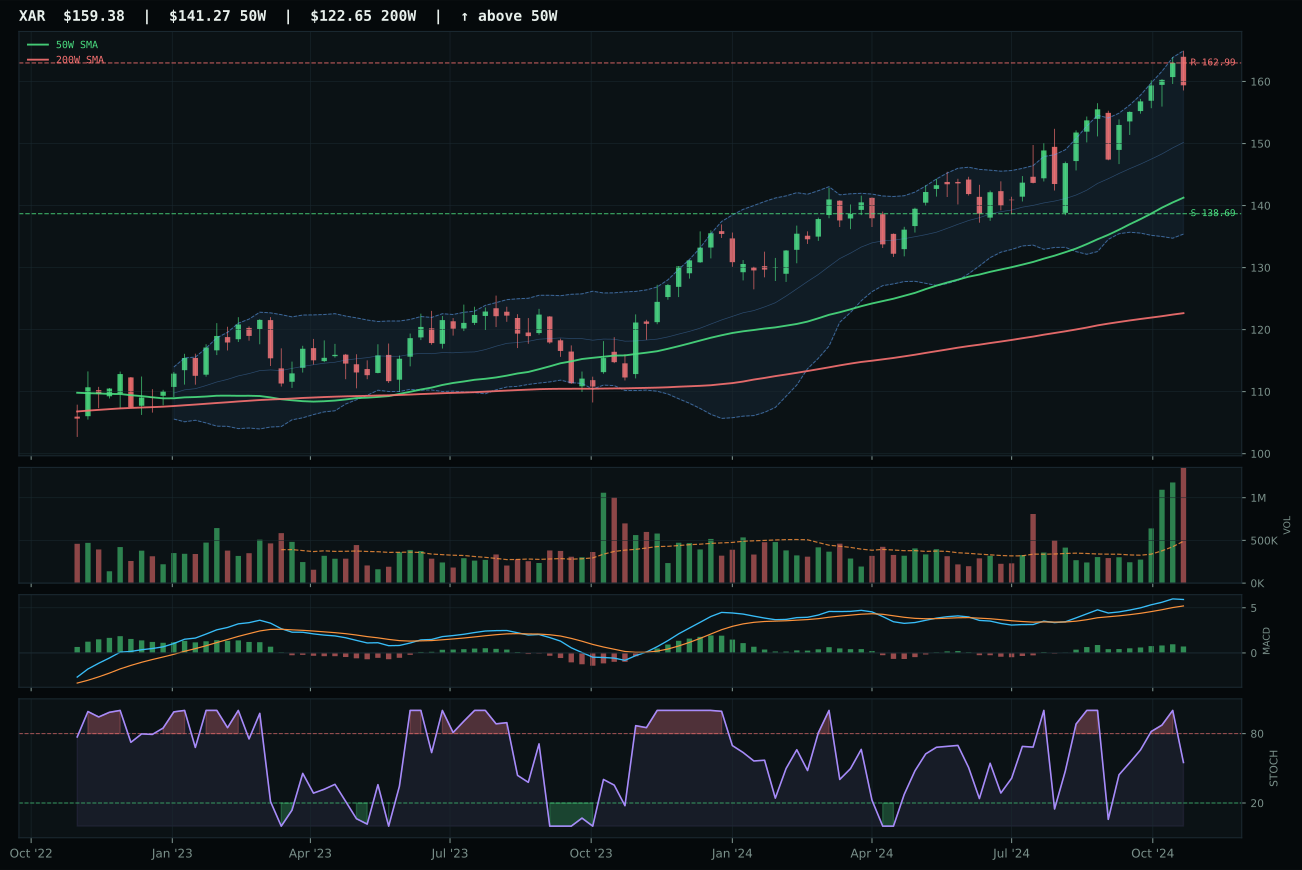
XAR has a neutral structure profile with 0.7% 13-week relative strength versus SPY.
A failed hold above support would weaken the setup.
Actionable but governed by invalidation levels.
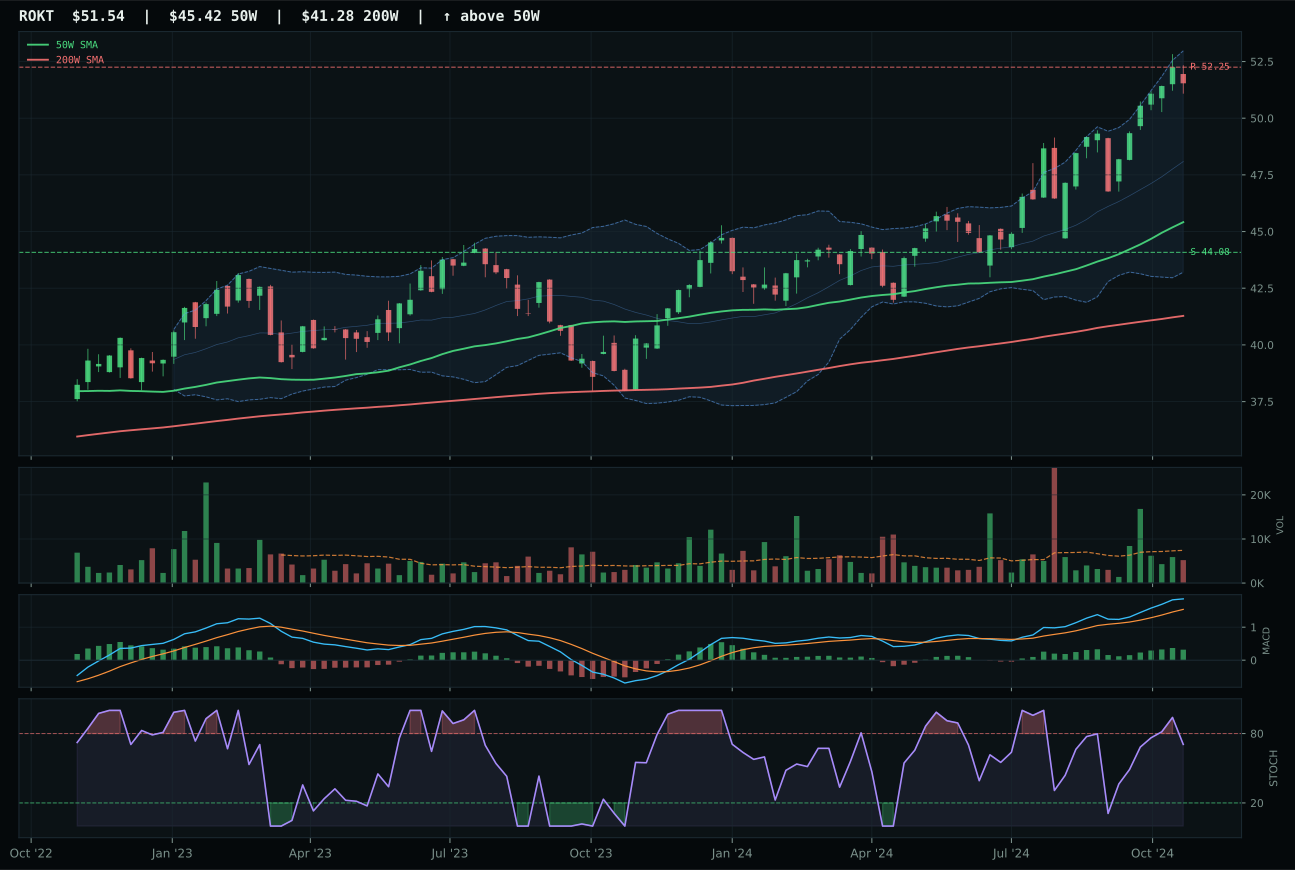
ROKT has a neutral structure profile with -0.5% 13-week relative strength versus SPY.
A failed hold above support would weaken the setup.
Tracked, but not top-2 eligible because: .
XAR edged out ITA for category leadership by delivering superior MACD confirmation and measurable category-relative strength in a micro-decision between two structurally sound setups. XAR's bullish-and-improving MACD versus ITA's bullish-but-flattening reading separated conviction scores by 5 points at the timing level; paired with 0.9% category outperformance versus ITA's neutral reading, XAR demonstrated genuine peer sponsorship within the defense basket. The 100.0 trend score on both setups is academic—the real differentiation came from volume dynamics: XAR's distribution pressure (3.02x average) suggested rotation into the name despite overhead, while ITA's above-average participation lacked the intensity needed to justify premium entry. Both names sit 12-14% above their 50W averages, creating equal entry risk; XAR justified it with cleaner technicals.
Defense & Aerospace scores 49.1 and holds 5% allocation, ranking fourth behind the top-2 categories and infrastructure leaders. Macro fit of 63.0/100 is a genuine strength—defensive rotation active at +8, broad market bear at +6—yet technical evidence from the reasoned proof order reveals ITA at 67.5 as the preferred choice, not the representative XAR at 51.3. This 16-point gap between the technical leader and the representative selected indicates that ITA's stronger macro sponsorship (60.0 vs 50.0 narrative fit) should dominate, yet XAR's marginal timing and MACD advantage in the category selection rule the representative vote. The category cannot earn top-2 allocation because its 49.1 score trails both precious metals and infrastructure decisively; the 5% sleeve reflects conviction in defensive flows rather than a tactical opportunity. For promotion, Defense would need ITA's superior macro narrative to fully translate into stronger technical execution—specifically, MACD must remain improving rather than flattening, and volume confirmation must step into the strength.
AI — SMH
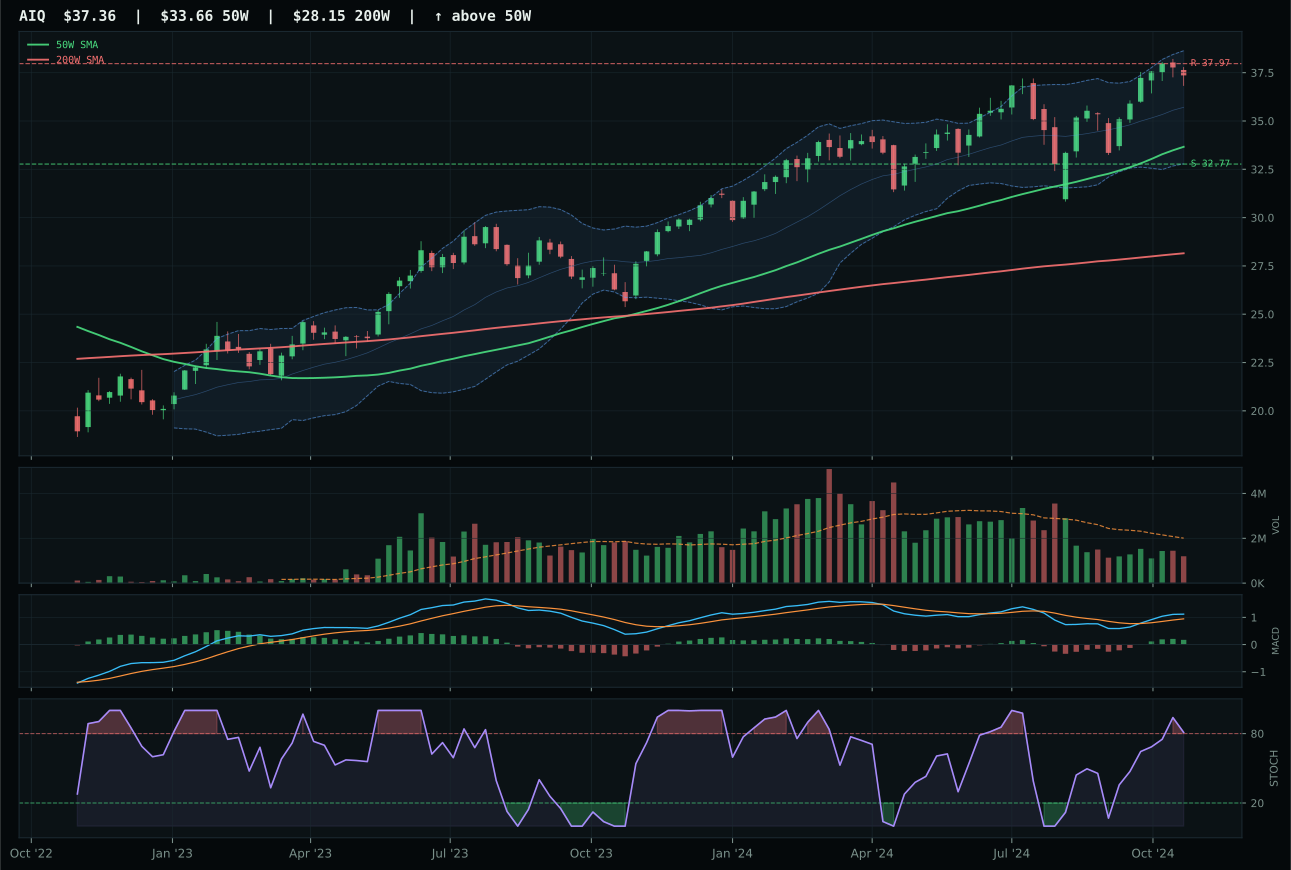
AIQ has a neutral structure profile with 1.8% 13-week relative strength versus SPY.
A failed hold above support would weaken the setup.
Actionable but governed by invalidation levels.
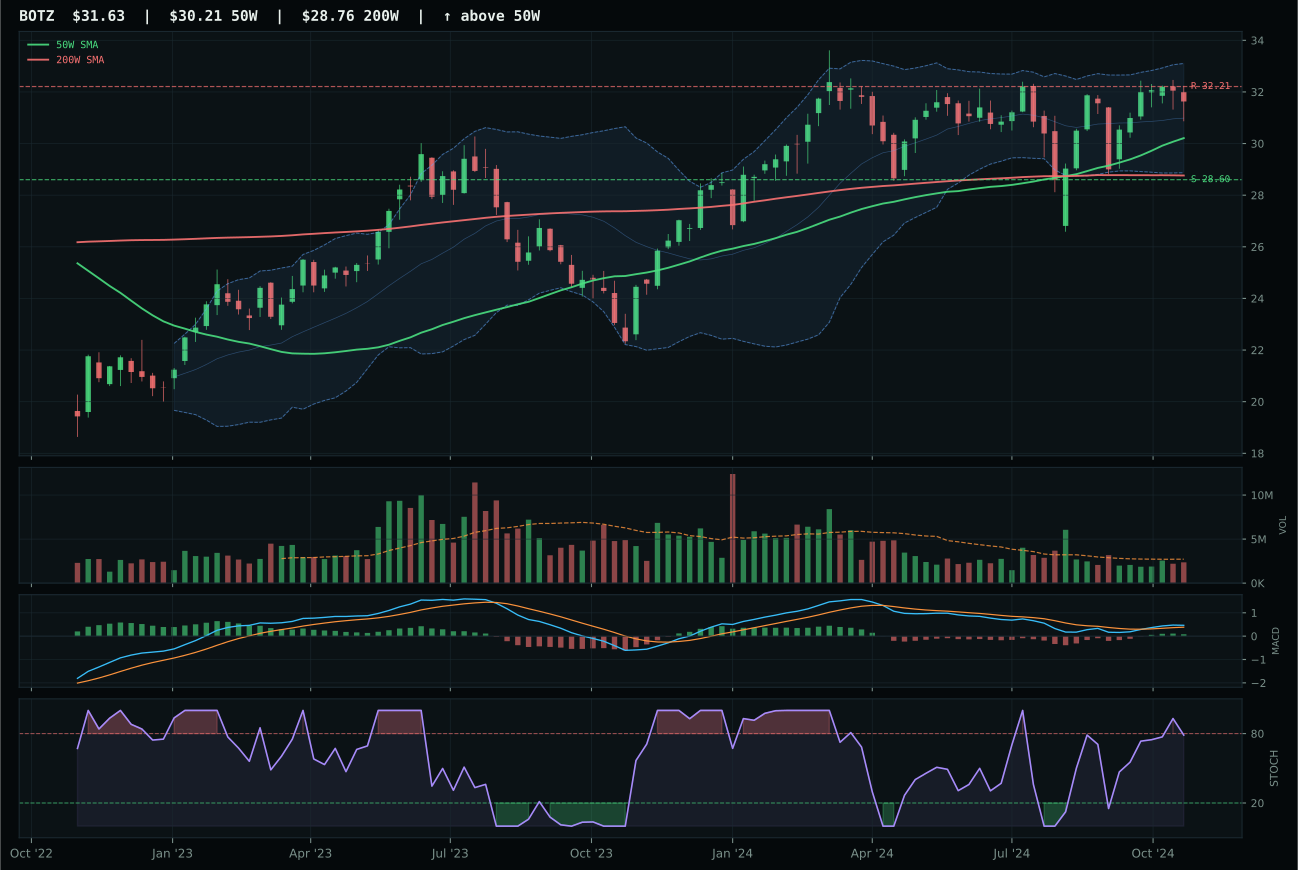
BOTZ has a neutral structure profile with -2.3% 13-week relative strength versus SPY.
A failed hold above support would weaken the setup.
Actionable but governed by invalidation levels.
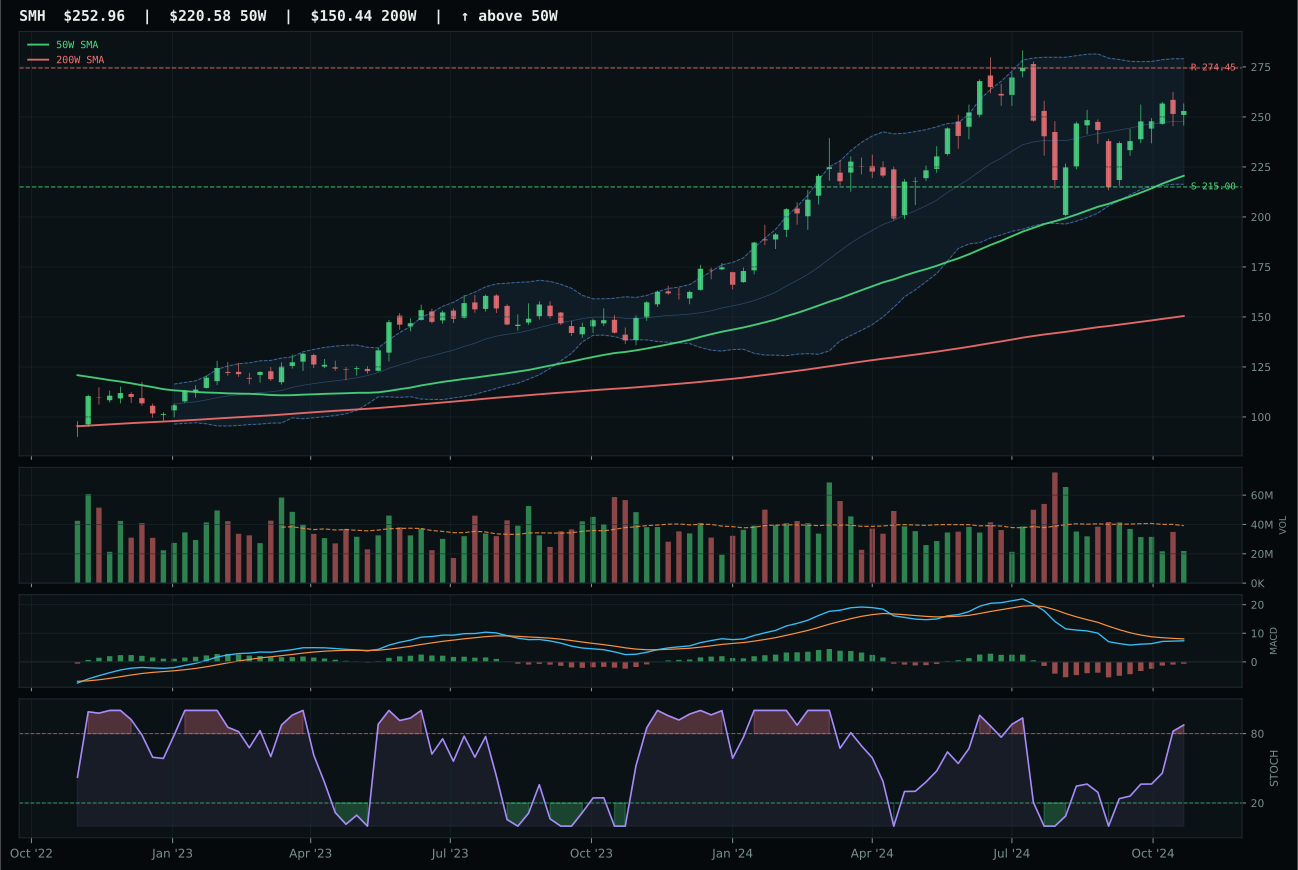
SMH has a neutral structure profile with -1.1% 13-week relative strength versus SPY.
A failed hold above support would weaken the setup.
Actionable but governed by invalidation levels.
SMH won the AI category by trading off higher momentum readings for better risk-adjusted timing and reward geometry against AIQ and BOTZ. Its 67.0 timing score decisively beat AIQ's 59.0 by sitting closer to the 50W (14.7% extension versus deeper overbought zones) and maintaining bearish-but-improving MACD rather than the false bullish signals that cost AIQ conviction. The 53.0 risk-reward reading reflects a realistic -7.8% headroom to resistance paired with 17.7% downside cushion, while AIQ's 39.1 reward potential versus -5.7% upside tells the story of a name already priced too far ahead of its evidence. Volume participation at 0.56x average confirms the move is not being accumulated by serious capital, yet SMH's 5.3% thirteen-week return with negative SPY relative strength suggests this is a trade, not a structural position.
AI ranks 47.2, receiving 5% allocation despite scoring below technology and most infrastructure plays, reflecting a severely constrained macro backdrop that outweighs the category's technical merit. Macro fit of only 27.0/100 is the binding constraint: liquidity stress, risk appetite broken, and credit stress combine for a -25 point headwind that disinflation's modest +5 boost cannot offset. The reasoned proof order shows AIQ and BOTZ both superior to SMH in technical evidence (63.0, 62.1 vs 52.5), yet the category-level reasoning layer penalizes the entire basket for weak sponsorship in a regime where risk appetite is fragile. SMH itself generates only 63.4/100 technical evidence despite winning the category selection, indicating that every ETF in the space trades below conviction levels. To earn 5% allocation, AI would need either macro relief from credit stress and liquidity concerns, or a reset in SMH's extended stochastic position back toward oversold neutral—either move would free up allocation capital from defensive rotation trades.
Industrial Metals — COPX
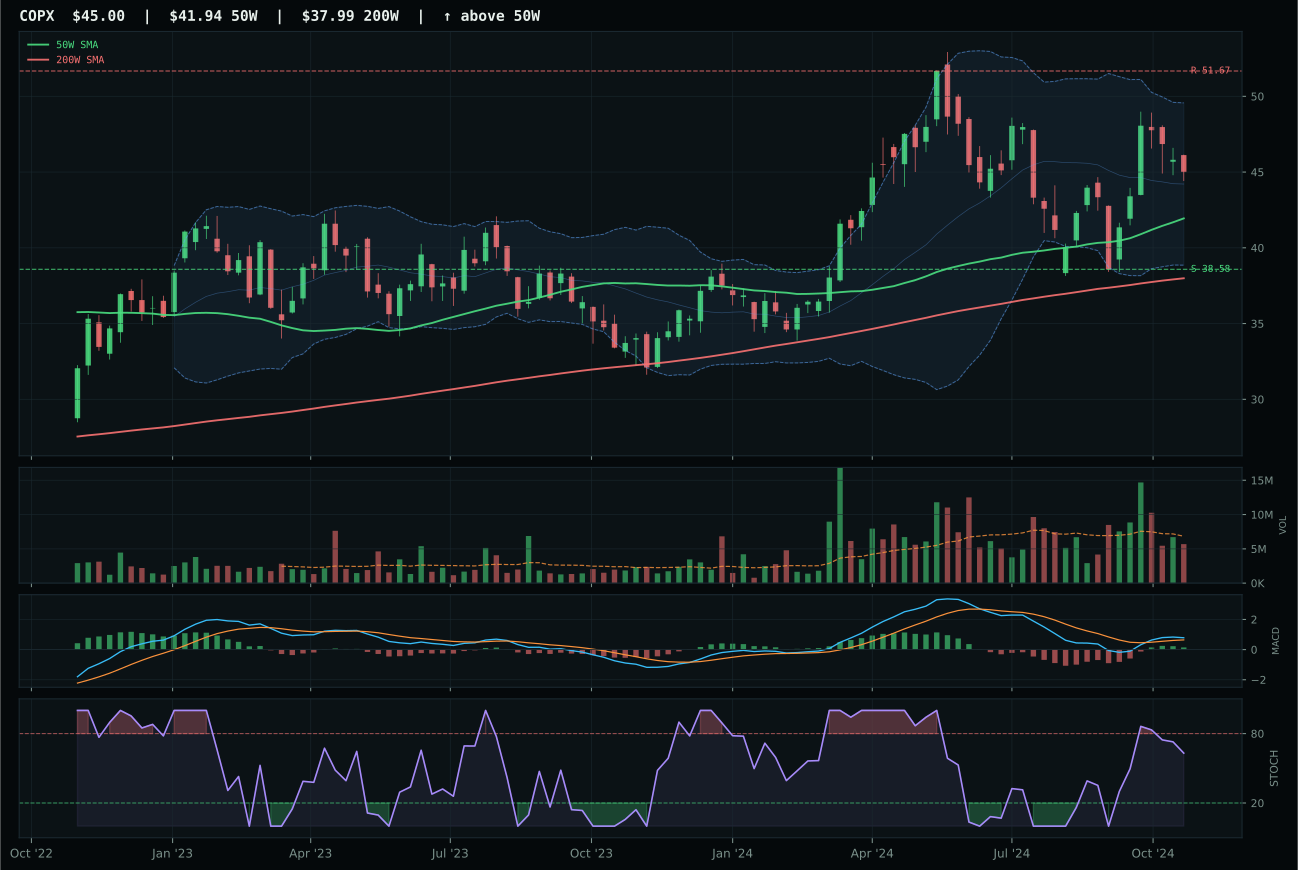
COPX has a neutral structure profile with -0.7% 13-week relative strength versus SPY.
A failed hold above support would weaken the setup.
Actionable but governed by invalidation levels.
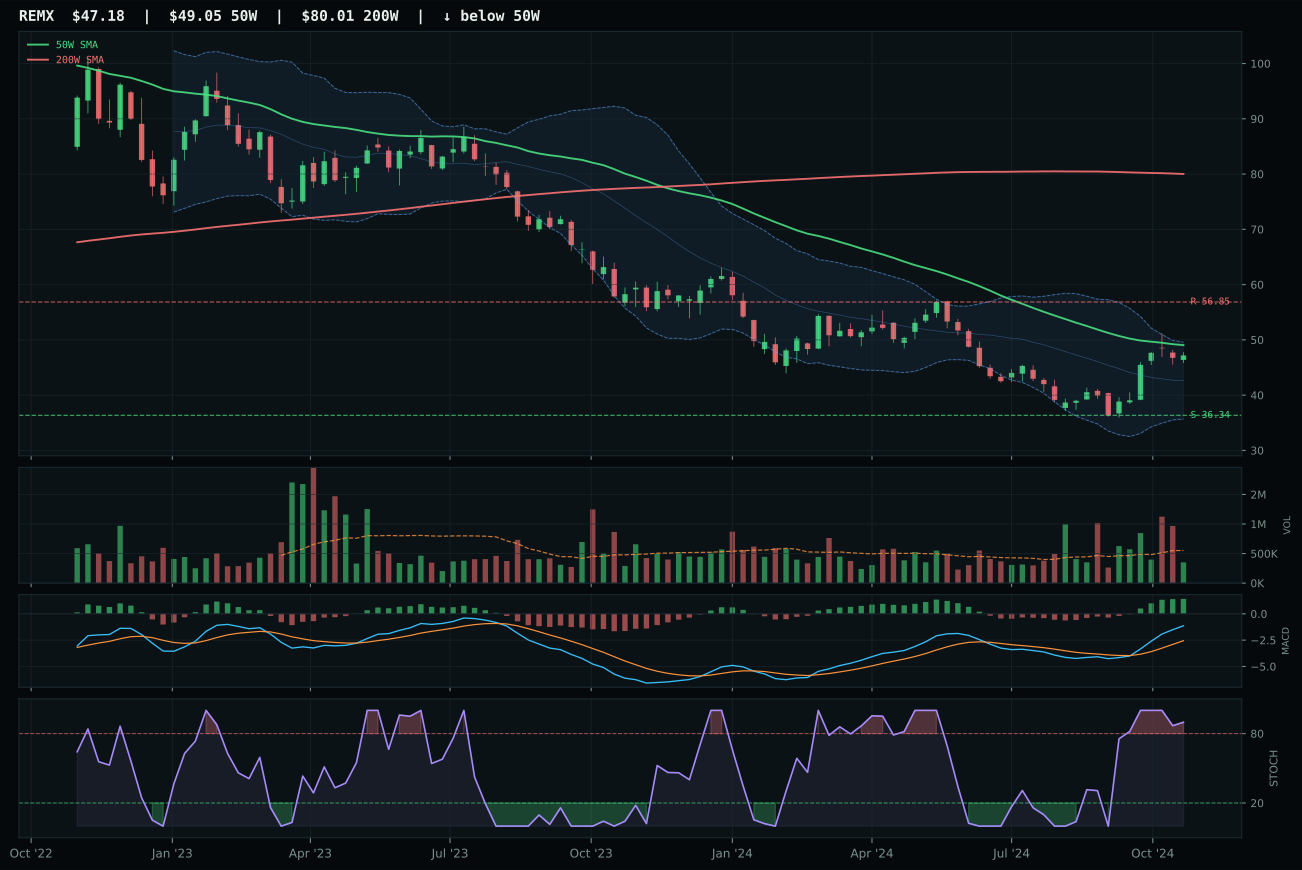
REMX has a neutral structure profile with 6.0% 13-week relative strength versus SPY.
Extension and support failure are the main tactical risks.
Tracked, but not top-2 eligible because: structurally broken.
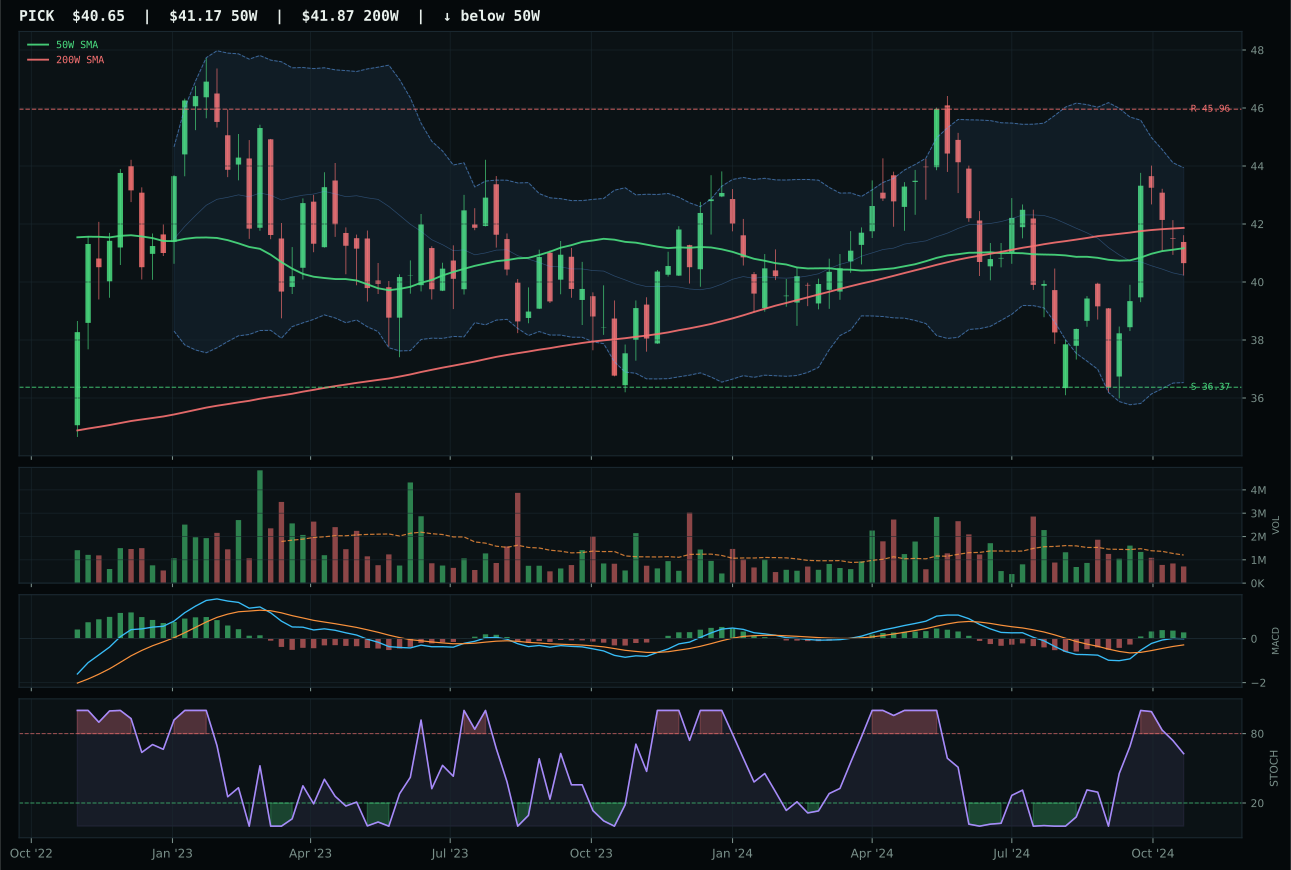
PICK has a compression near 50W profile with -4.6% 13-week relative strength versus SPY.
Extension and support failure are the main tactical risks.
Tracked, but not top-2 eligible because: structurally broken.
COPX outpointed REMX in industrial metals by balancing technical durability with superior structure integrity despite a 38.7-point score gap that reflects category weakness, not COPX strength. COPX's 66.4 structure score defeats REMX's 42.3 because compression and support are cleanly defined; REMX's neutral structure masks a chart at overbought inflection (stochastic RSI rolling over) with thin volume participation (0.56x), suggesting the momentum is exhausting. COPX's 75.0 timing score versus REMX's 72.0 captures a critical distinction: COPX sits 7.3% from the 50W in the upper retracement zone with stochastic RSI still falling/neutral (0.63), indicating room for further accumulation before exhaustion. The metals scarcity descriptor is active (+12 weighting) in both cases, but COPX's bullish-and-improving MACD paired with neutral volume suggests institutional buying while REMX's falling stochastic suggests institutional distribution.
Industrial metals score 39.3 and receive 5% allocation, ranking seventh among ten categories due to macro tailwinds that are offset by technical weakness in the representative. Macro fit of 65.0/100 is robust: metals scarcity is active at +14, commodity breadth positive at +10, and real asset sponsorship at +6, creating a 30-point fundamental bid that disinflation's lack of specific pressure (-0 descriptor) and liquidity stress (-8) cannot fully erode. Yet technical evidence from the reasoned proof order reveals COPX at only 69.9 technical score, well below the category average, indicating that copper-specific demand remains uncertain. The 5% allocation represents a structural bet that supply constraints (particularly copper for energy transition, rare earths for defense) will support prices despite soft macro conditions—a contrarian tilt acceptable only at modest weight. COPX's neutral distance from the 50-week (7.3%) and falling stochastic RSI (0.63) offer technical relief from extension, distinguishing it from the overbought peers. To earn 5% allocation, COPX would need to demonstrate volume confirmation—a shift from neutral to above-average participation showing institutional money flowing into the scarcity narrative.
Emerging Markets — INDA
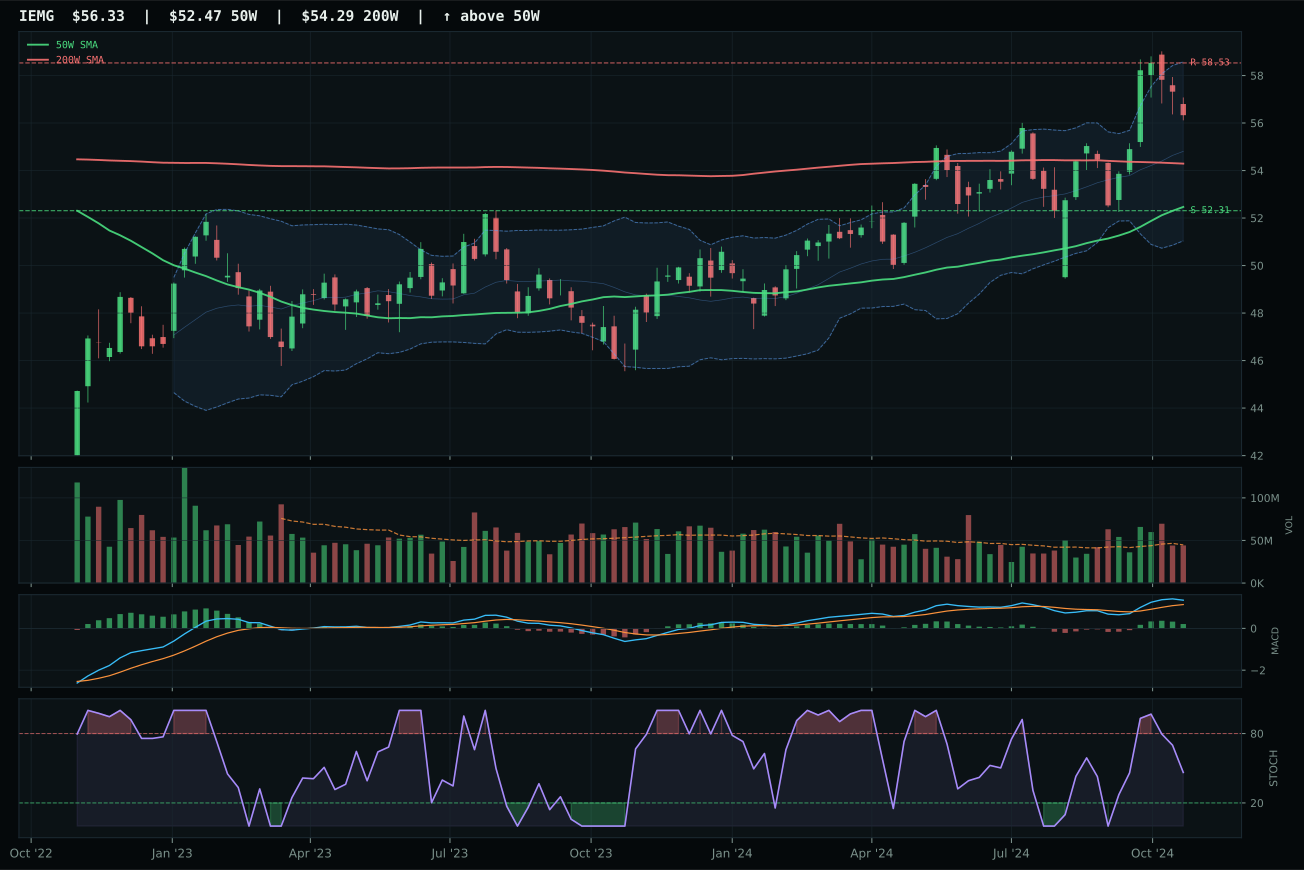
IEMG has a neutral structure profile with -0.5% 13-week relative strength versus SPY.
A failed hold above support would weaken the setup.
Actionable but governed by invalidation levels.
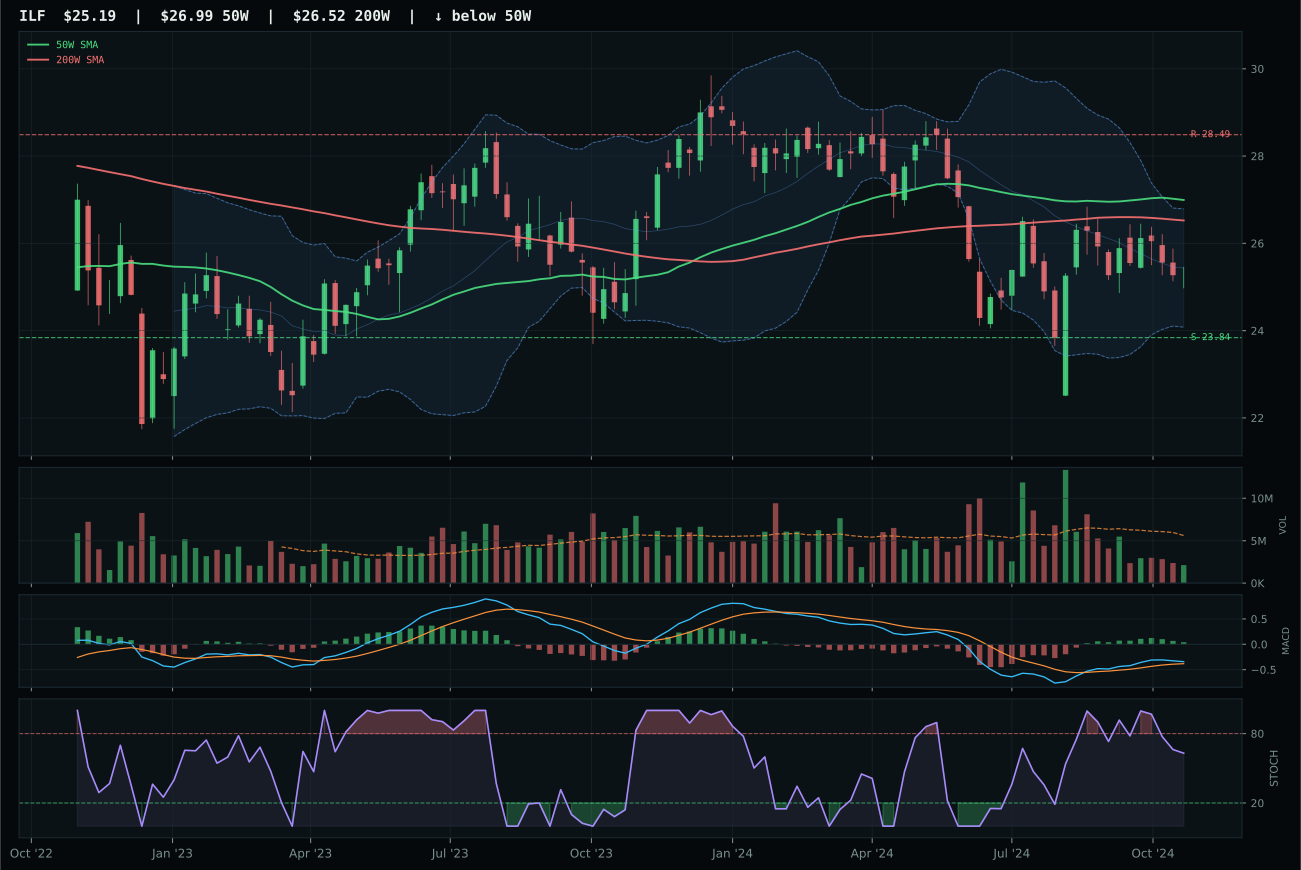
ILF has a neutral structure profile with -5.2% 13-week relative strength versus SPY.
A failed hold above support would weaken the setup.
Actionable but governed by invalidation levels.
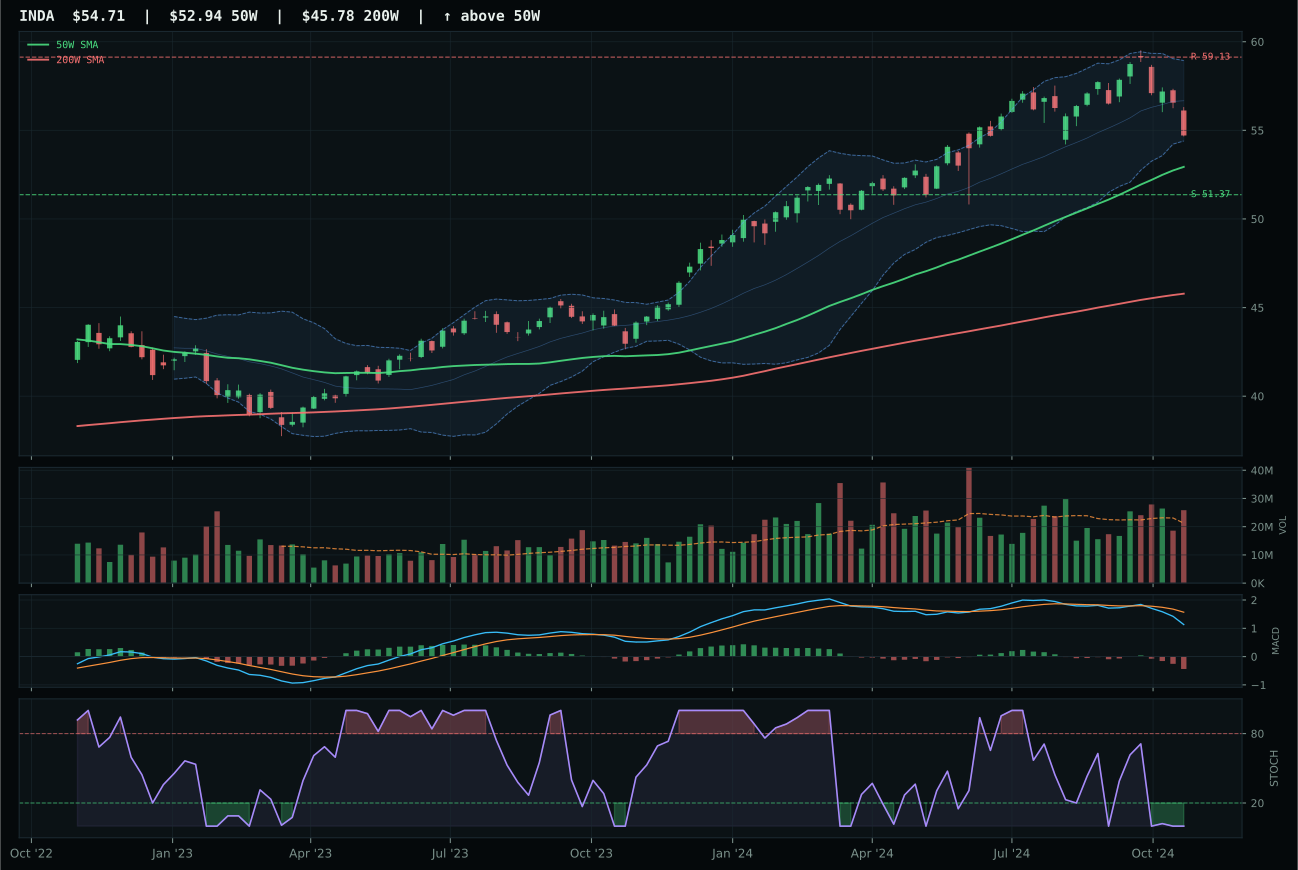
INDA has a neutral structure profile with -10.1% 13-week relative strength versus SPY.
A failed hold above support would weaken the setup.
Actionable but governed by invalidation levels.
INDA won the emerging markets category by offering the only entry with viable risk-reward geometry despite IEMG's superior trend and momentum credentials. INDA's 85.0 timing score cremates IEMG's 75.0 because INDA sits closest to the 50W (3.3% above) with stochastic RSI oversold (0.00) and bearish MACD, creating textbook mean-reversion setup with defined support at 51.37. IEMG's neutral MACD and falling stochastic place it in a less immediately attractive entry zone; while IEMG's bullish improvements offer better near-term trajectory, INDA's risk-reward of 65.7 versus IEMG's 53.8 indicates better downside cushion for the patient trader. INDA's momentum score of 0.0 is catastrophic on its face—thirteen-week return of -3.7% with -4.9% category relative strength—but that deterioration is precisely why timing scores high; this is capitulation, not continuation.
Emerging markets score 17.2 and hold 5% allocation despite ranking last among all categories, excluded from top-2 consideration due to the worst macro fit in the portfolio (21.0/100). Credit stress and liquidity stress each subtract -10 points, combining with broad market bear at -9 to create a 29-point macro headwind that the category's modest +5 real asset sponsorship cannot offset. IEMG's superior technical evidence (75.6/100) versus INDA's 26.3 reveals that the category's highest-quality setup (IEMG) cannot overcome macro regime rejection—a signal that emerging market flows are structurally constrained by dollar strength and deleveraging fears. The 5% allocation represents a contrarian tilt for mean-reversion buyers willing to accept INDA's oversold technical extreme and -3.7% 13-week performance in exchange for exposure to growth narratives (India quality-growth) that benefit from eventual monetary easing. RS versus SPY at -10.1% confirms capital rotation away from EM into developed markets and defensive hedges. For re-allocation to 10%, emerging markets would need either macro relief from credit stress and liquidity fears, or a shift in the descriptor set toward growth-cycle sponsorship—neither likely until risk appetite stabilizes and capital repatriation flows reverse.
Agriculture & Livestock — MOO
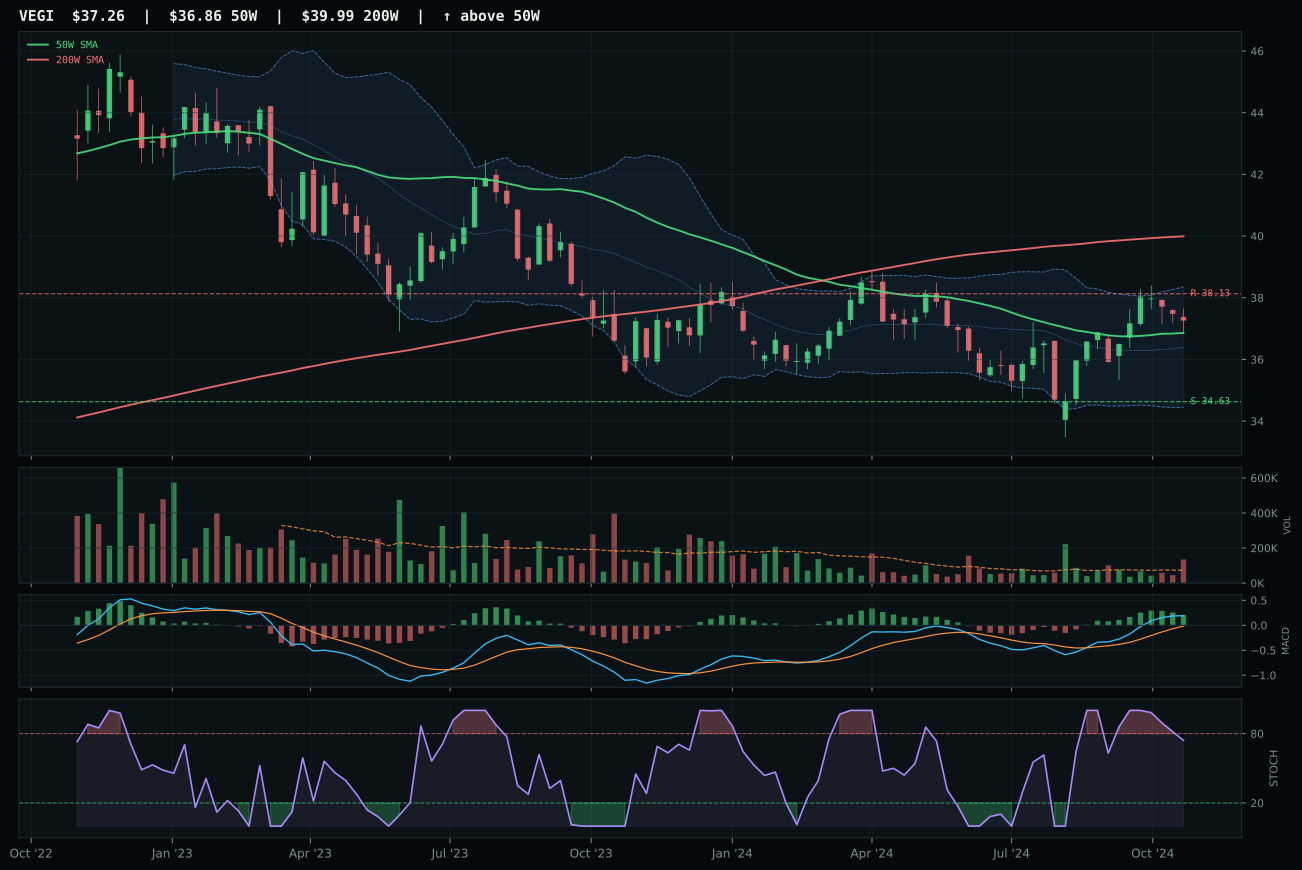
VEGI has a compression near 50W profile with -4.3% 13-week relative strength versus SPY.
A failed hold above support would weaken the setup.
Tracked, but not top-2 eligible because: .
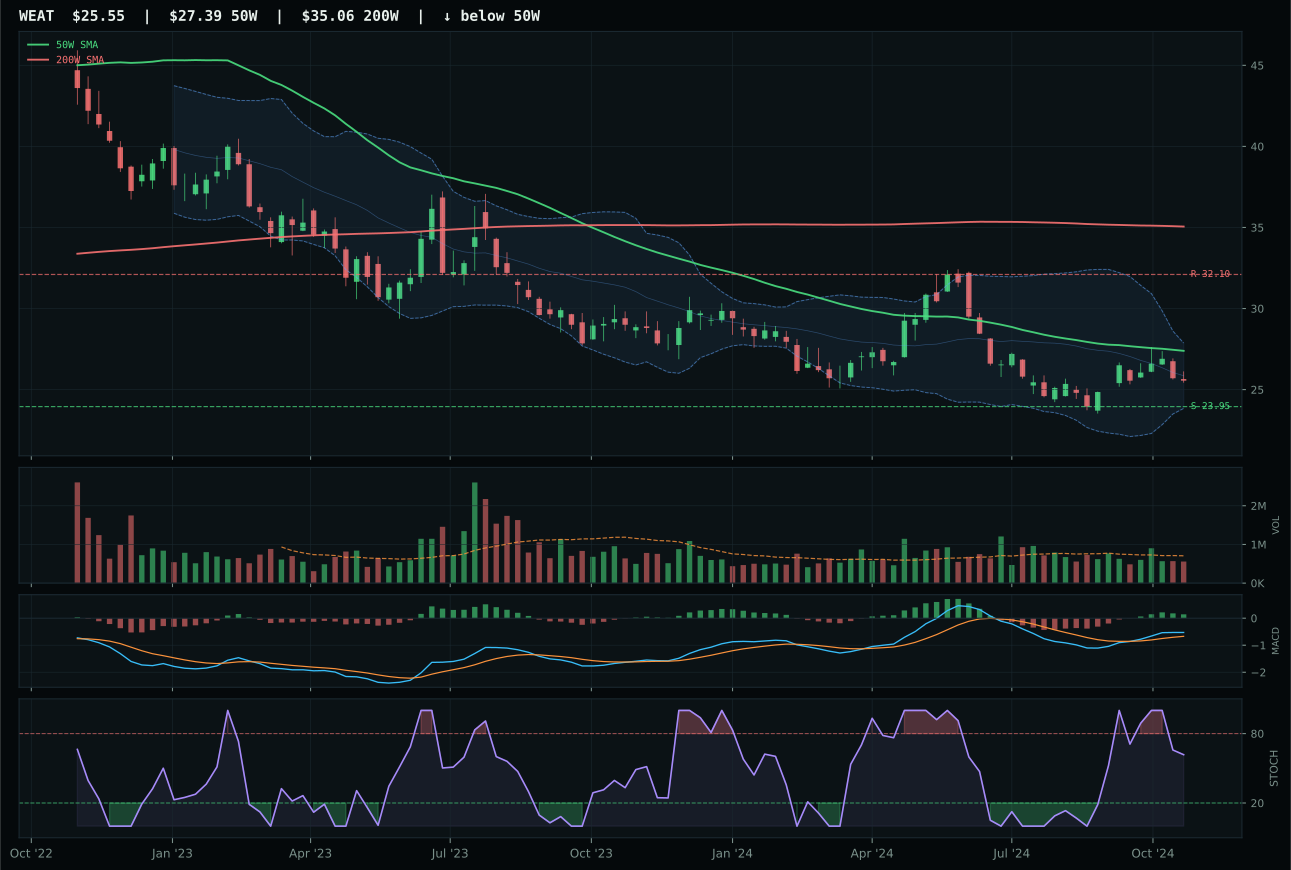
WEAT has a neutral structure profile with -2.5% 13-week relative strength versus SPY.
Extension and support failure are the main tactical risks.
Tracked, but not top-2 eligible because: structurally broken.
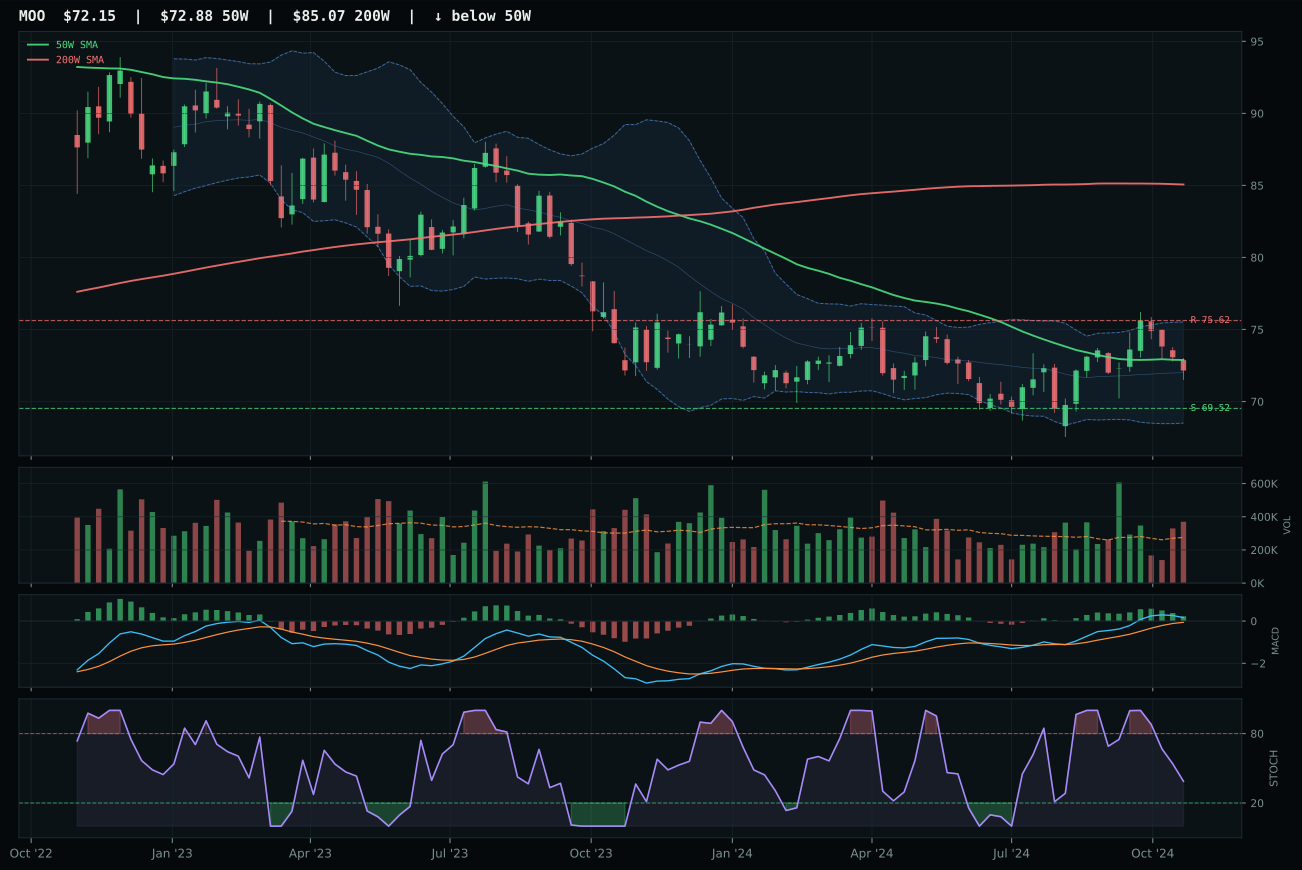
MOO has a pullback into support profile with -6.6% 13-week relative strength versus SPY.
Extension and support failure are the main tactical risks.
Tracked, but not top-2 eligible because: structurally broken.
MOO won by default in a structurally broken category where no candidate qualified for top-two positioning. Its 9.4 composite score reflects a setup pulling into support with perfect timing (95.0) but non-functional momentum (38.0) and zero persistence confirmation. The 1.0% distance below the 50W with stochastic RSI falling into decision territory created a textbook mean-reversion setup, yet thirteen-week returns of -0.2% and a -6.6% RS versus SPY scream category underperformance. Volume came in at above-average participation (1.34x) but that liquidity was likely rotation out, not in, given the bearish momentum profile and -2.2% category-relative weakness. MOO's advantage over VEGI lies purely in superior risk-reward (74.8 versus 42.4), meaning downside protection is real but upside is capped—this is a contrarian entry, not a conviction trade.
Agriculture receives 0% allocation this week, ranking outside the portfolio entirely due to ineligibility—both category technical evidence and macro fit conspire to exclude the space. The 9.4 final score reflects a disinflation regime that actively punishes real assets: commodity breadth is positive at +5, yet disinflation pressure subtracts -8 and liquidity stress subtracts -4, netting to -7 macro headwind. Technical evidence across the three-ETF basket (WEAT, VEGI, MOO) averages only 26-29/100, with MOO's 26.2 representing the best of a very weak cohort. Price action is structurally broken—all three trade below their 50-weeks or sit in pullbacks into support—leaving no clean entry setup for a capital allocator in a regime where monetary conditions are tightening. Disinflation pressure is the core anchor: falling input costs and weakening commodity demand reduce the sector's fundamental appeal. The category remains on the watchlist for a potential 5% allocation only if prices stabilize above their 50-week moving averages with volume confirmation, and only if macro descriptors shift away from liquidity stress into real asset sponsorship.
Traditional Energy — XLE
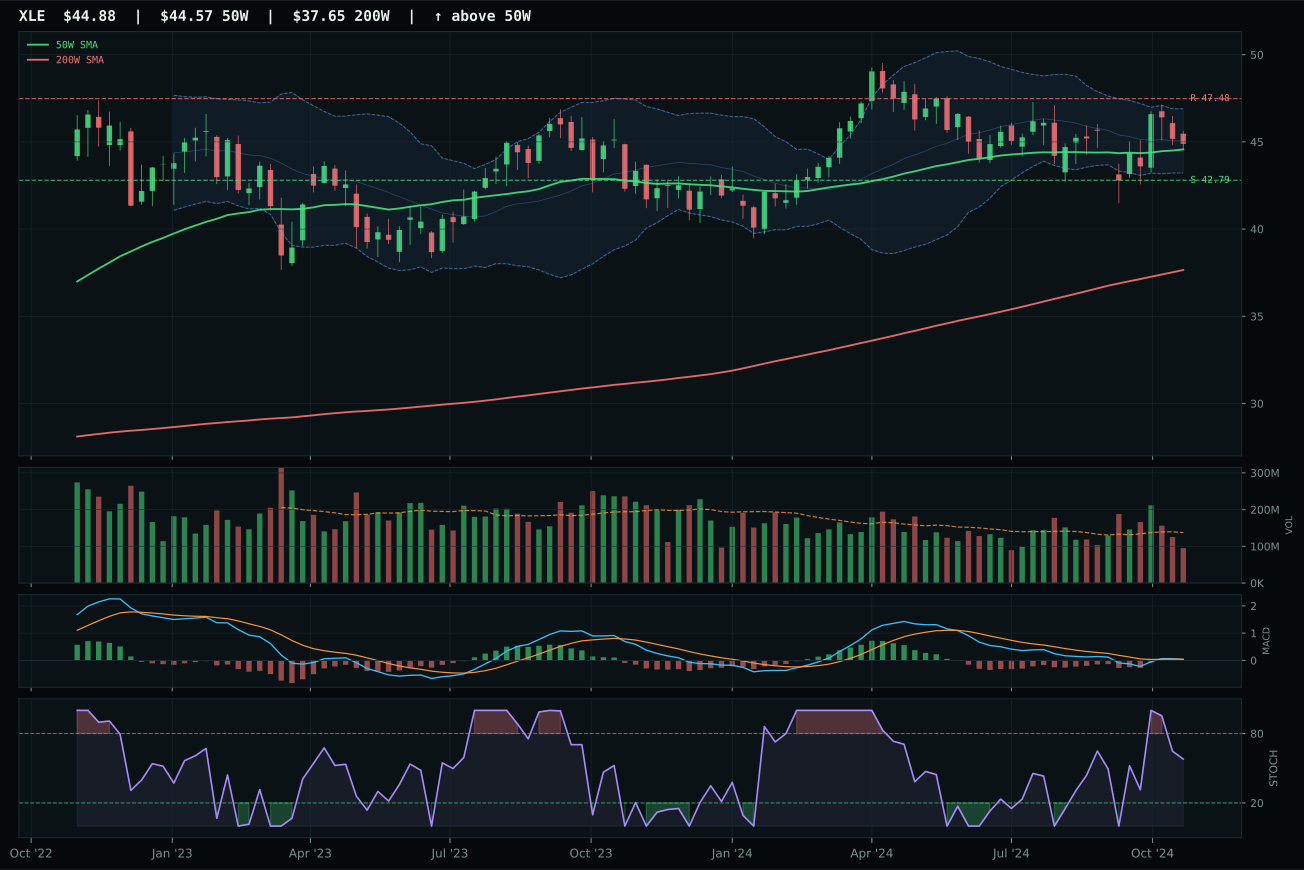
XLE has a pullback into support profile with -9.0% 13-week relative strength versus SPY.
A failed hold above support would weaken the setup.
Actionable but governed by invalidation levels.
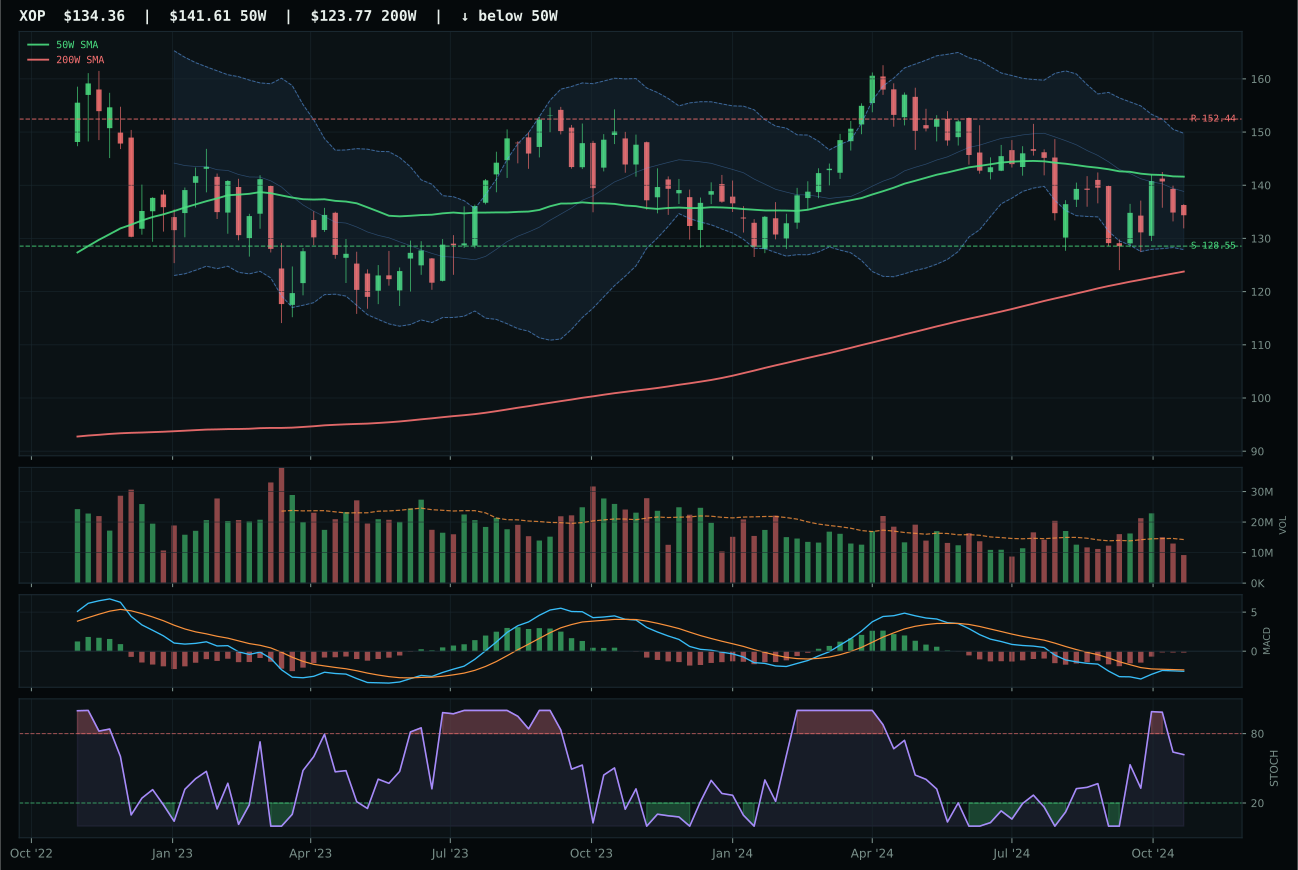
XOP has a pullback into support profile with -13.8% 13-week relative strength versus SPY.
A failed hold above support would weaken the setup.
Actionable but governed by invalidation levels.
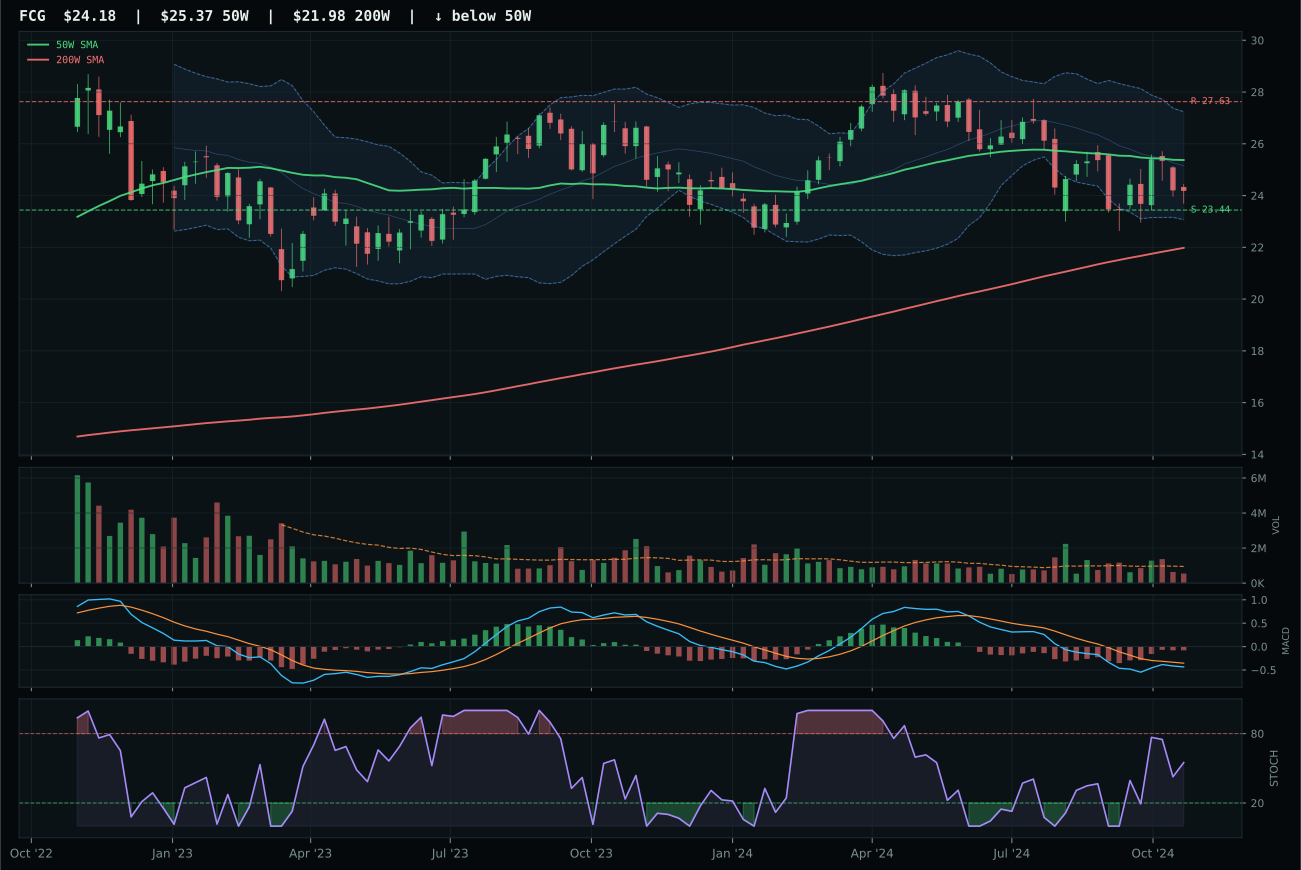
FCG has a pullback into support profile with -13.8% 13-week relative strength versus SPY.
A failed hold above support would weaken the setup.
Actionable but governed by invalidation levels.
XLE won the energy category by a decisive 21.3-point margin over XOP through perfect timing into support and superior MACD confirmation rather than better momentum or relative strength. XLE's 100.0 timing score reflects price sitting just 0.8% below the 50W in the near 52W low / repair zone with falling/neutral stochastic RSI—this is the exact definition of mean-reversion entry point. XOP's 92.0 timing versus XLE's 100.0 penalizes the exploration name for sitting deeper in the repair zone without the same support clarity. The critical technical difference: XLE's MACD is bullish and improving while XOP's is bearish but improving, meaning XLE has conviction to hold while XOP is awaiting confirmation. Both names carry -9 to -14% RS versus SPY, confirming that energy's underperformance is structural in the disinflation regime; XLE's 4.8% category-relative strength versus XOP's 0.0% suggests cash-flow defensiveness is the only surviving narrative.
Traditional energy ranks 9th or 10th with 0% allocation, entirely excluded from the portfolio due to macro incompatibility with the disinflation regime. The 8.5 final score reflects the category-level macro fit of 23.0/100—the worst in the cohort—driven by disinflation pressure active at -10 and real asset sponsorship unable to push above +7. Credit stress and liquidity stress each subtract 7-8 points, meaning energy faces a -20 combined macro penalty with zero descriptor tailwind to offset it. XLE's superior timing (100.0) and support setup (4.9% downside to 42.79) would normally justify a tactical 5% allocation into mean reversion, yet the portfolio's macro state explicitly rejects energy exposure until either disinflation fears recede or energy demand signals improve materially. The category's 13-week performance of -2.6% (XLE) to -7.4% (XOP) confirms that money is flowing into defensive rotations and monetary hedges, not commodity extraction beta. Energy remains on the watchlist for re-entry if stochastic RSI pushes oversold below 0.30 with volume support, signaling institutional accumulation into value—but that re-entry requires macro regime shift toward inflation re-acceleration or commodity breadth expansion.