
2024-10-18
Informational purposes only. The content in this report, including allocations, analysis, and commentary, is provided solely for informational and educational purposes. It does not constitute financial advice, investment advice, trading advice, or any other type of advice. Past performance does not guarantee future results. Always conduct your own research and consult a qualified financial professional before making investment decisions.
Weekly Allocation
| Ticker | Category | Weight | Role |
|---|---|---|---|
| FBTC | 50% | Overlay | |
| SLV | Precious Metals | 10% | Top-2 (10%) |
| PAVE | Utilities & Infrastructure | 10% | Top-2 (10%) |
| URA | Nuclear Energy | 5% | Tier-2 (5%) |
| XAR | Defense & Aerospace | 5% | Tier-2 (5%) |
| CIBR | Technology | 5% | Tier-2 (5%) |
| COPX | Industrial Metals | 5% | Tier-2 (5%) |
| SMH | AI | 5% | Tier-2 (5%) |
| MOO | Agriculture & Livestock | 5% | Tier-2 (5%) |
Trade Instructions — Monday Open
Sell the tranche from 2024-09-20 (completing its 4-week hold). Buy the new tranche. Instructions show net portfolio changes — same-asset positions cancel, weight changes show the delta.
| Action | Ticker | Instruction |
|---|---|---|
| SELL | XLU | Sell 50% of XLU position (reduce 5.00% → 2.50%) |
| SELL | GLD | Sell 25% of GLD position (reduce 10.00% → 7.50%) |
| SELL | ITA | Sell 33% of ITA position (reduce 3.75% → 2.50%) |
| SELL | IGV | Sell 50% of IGV position (reduce 2.50% → 1.25%) |
| SELL | NLR | Sell 50% of NLR position (reduce 2.50% → 1.25%) |
| SELL | AIQ | Sell 33% of AIQ position (reduce 3.75% → 2.50%) |
| SELL | INDA | Sell entire INDA position (1.25% of portfolio) |
| BUY | XAR | Buy XAR — 11.11% of freed cash (adds 1.25% to portfolio) |
| BUY | PAVE | Buy PAVE — 22.22% of freed cash (adds 2.50% to portfolio) |
| BUY | URA | Buy URA — 11.11% of freed cash (adds 1.25% to portfolio) |
| BUY | SMH | Buy SMH — 11.11% of freed cash (adds 1.25% to portfolio) |
| BUY | MOO | Buy MOO — 11.11% of freed cash (adds 1.25% to portfolio) |
| BUY | CIBR | Buy CIBR — 11.11% of freed cash (adds 1.25% to portfolio) |
| BUY | SLV | Buy SLV — 22.22% of freed cash (adds 2.50% to portfolio) |
Current Portfolio After Trade
Combined holdings across all 4 active tranches. Each tranche is 25% of the portfolio.
| Ticker | % of Portfolio | Weight Bar |
|---|---|---|
| FBTC | 50.00% | |
| GLD | 7.50% | |
| PAVE | 7.50% | |
| COPX | 5.00% | |
| URA | 3.75% | |
| MOO | 3.75% | |
| ITA | 2.50% | |
| AIQ | 2.50% | |
| XLU | 2.50% | |
| XAR | 2.50% | |
| SMH | 2.50% | |
| CIBR | 2.50% | |
| SLV | 2.50% | |
| IGV | 1.25% | |
| NLR | 1.25% | |
| IEMG | 1.25% | |
| XLK | 1.25% |
Macro Regime — Disinflation
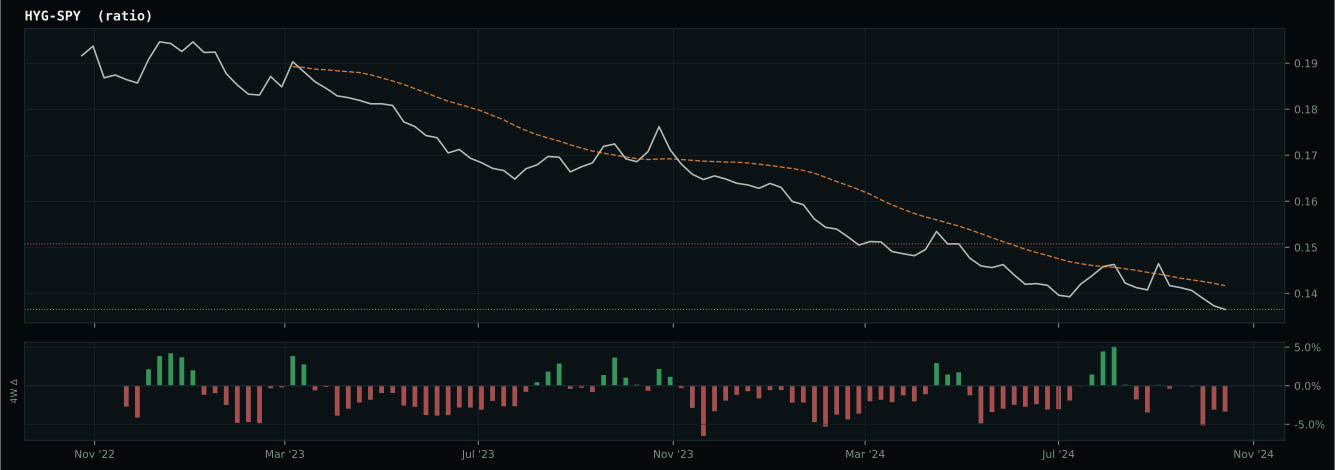
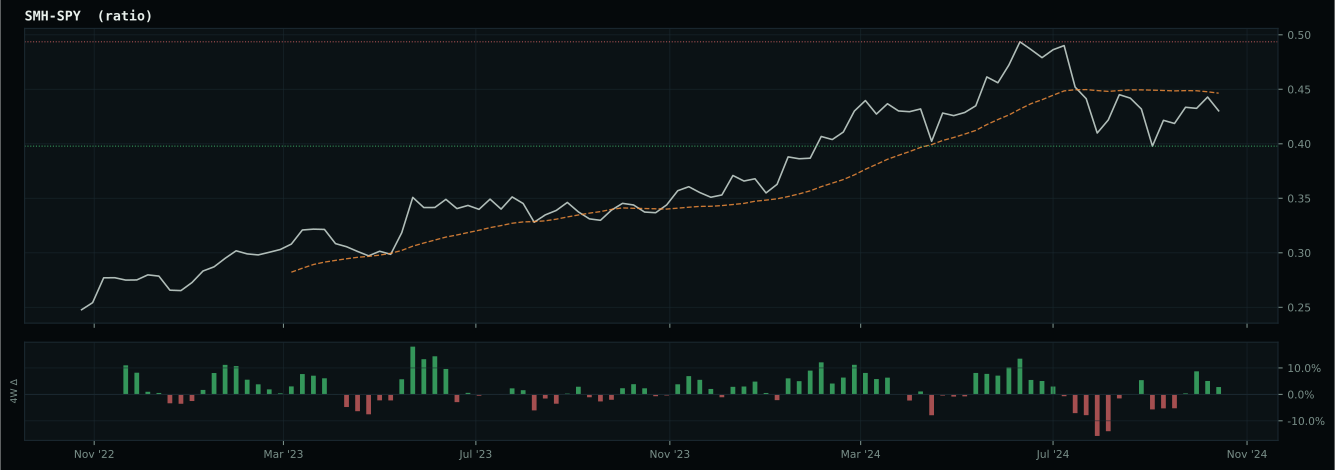
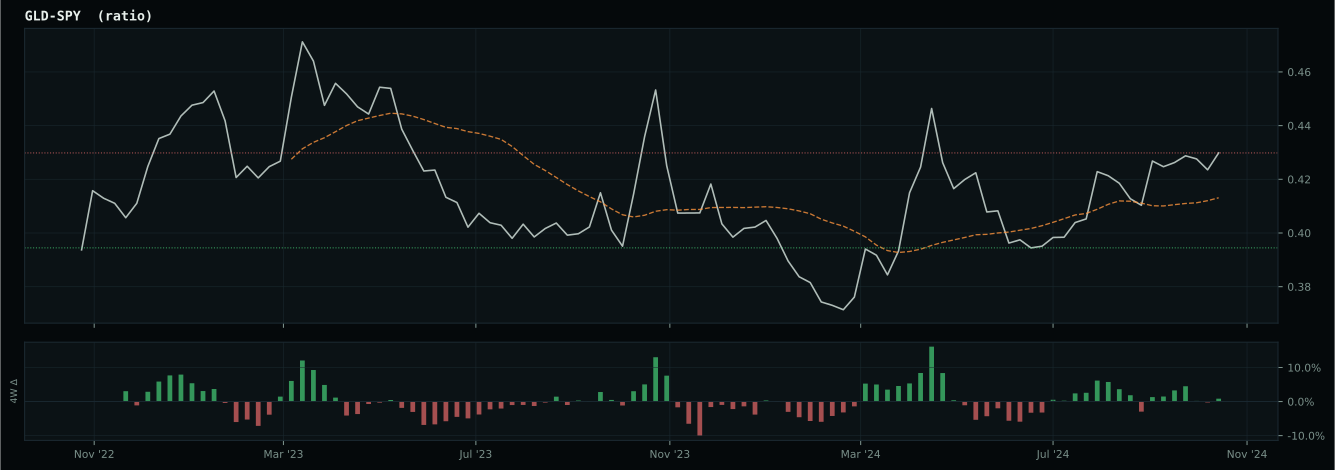
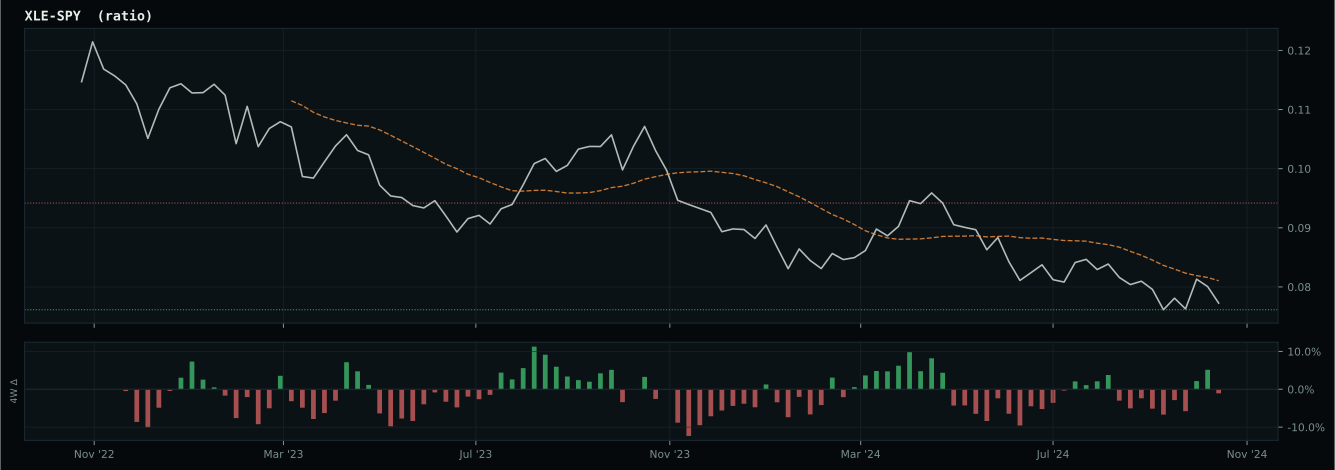
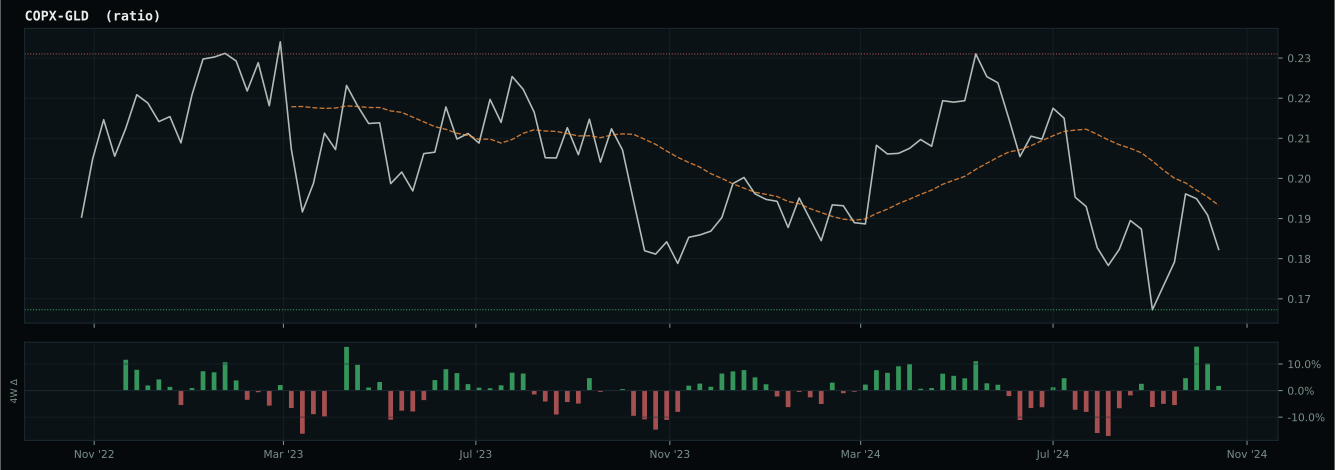
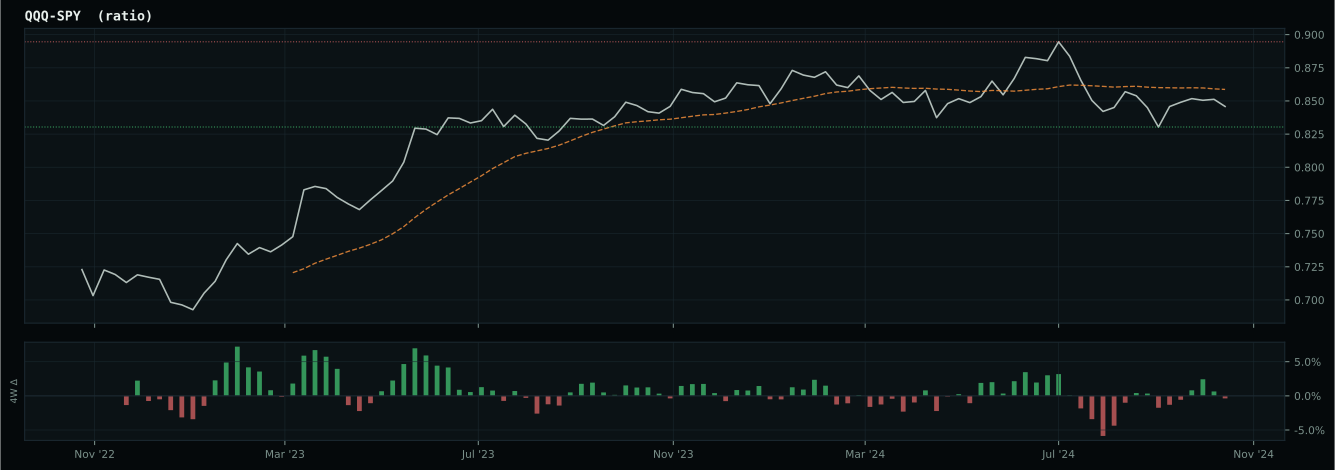
growth data is not confirming the weak market-implied risk appetite signal
Macro Evidence Charts
Market-implied signals behind the macro regime scores. Each ratio compares two assets; the direction and slope of the ratio is what the macro engine reads.
Crypto Regime — TrendBTC
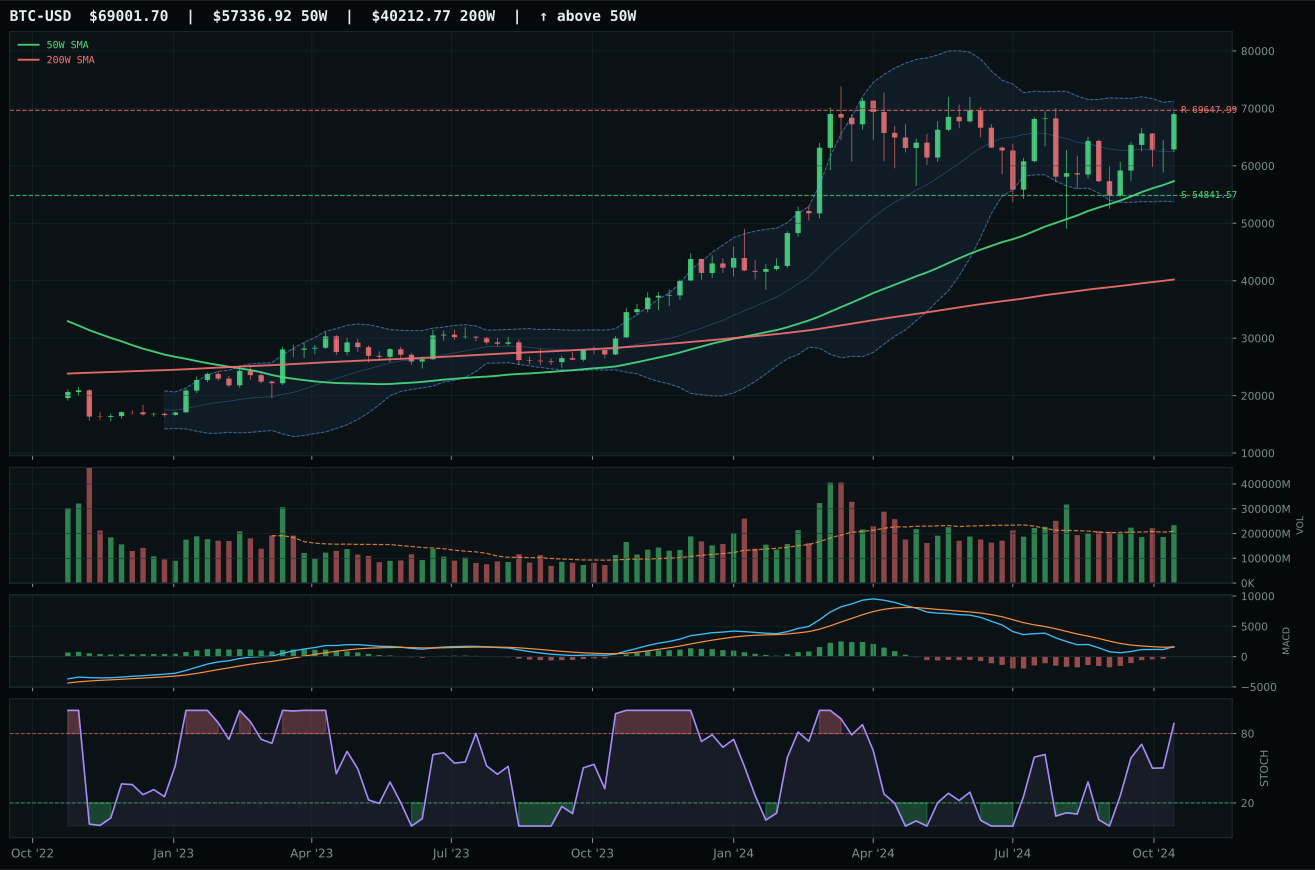
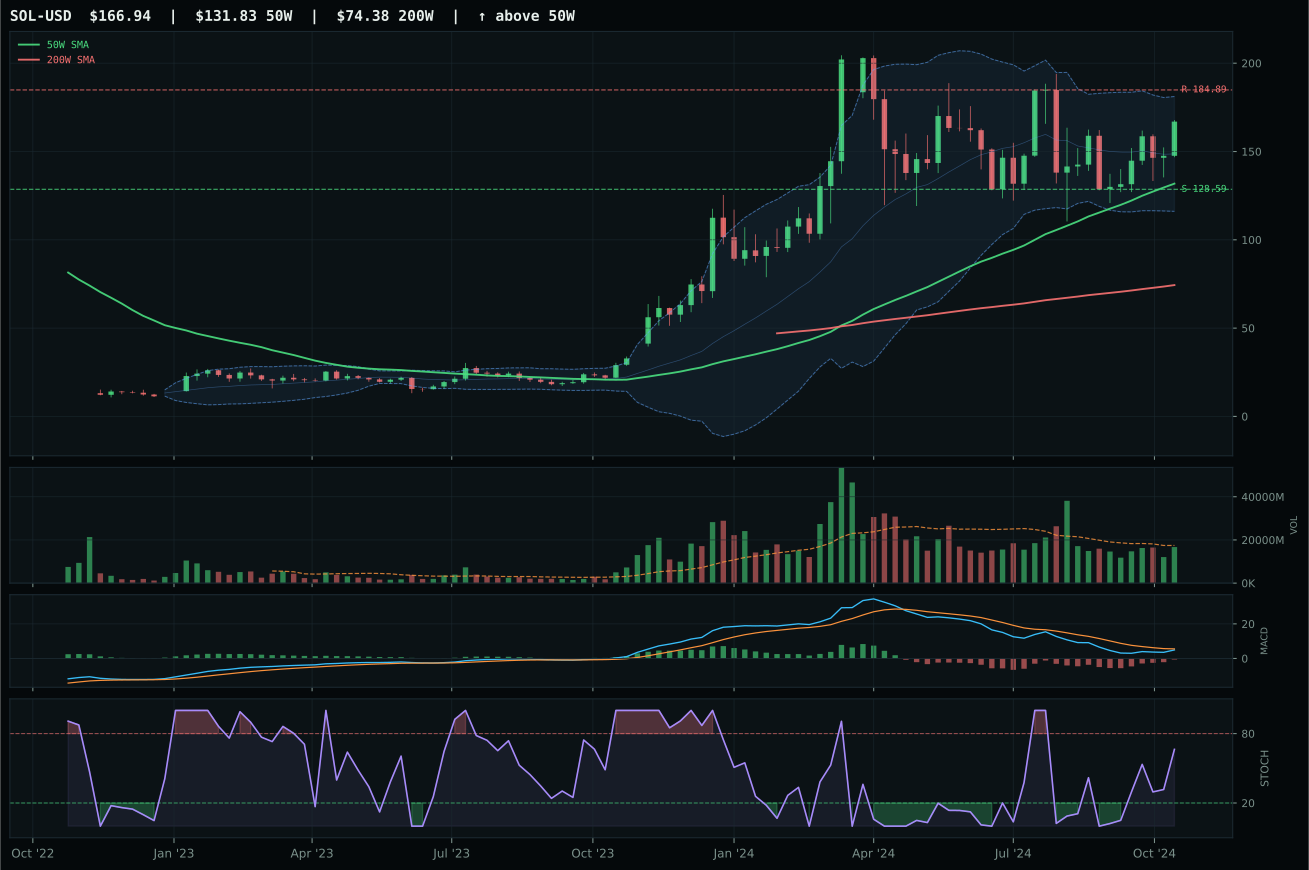
ValueBTC not armed: BTC has not made the first post-breakdown touch of the 200W buy zone after losing the 50W
TrendBTC confirmed: 2 consecutive closes above rising/flat 50W SMA
one or more available conditions failed
Category Rankings
| Rank | Category | Winner | Score | Alloc | 4W Ret | Peers (4W) |
|---|---|---|---|---|---|---|
| 1 | Precious Metals | SLV | 80.8 | 20% | -9.48% | GLD -4.9% · GDX -16.5% |
| 2 | Utilities & Infrastructure | PAVE | 78.2 | 20% | +3.39% | XLU -3.6% · IGF -2.3% |
| 3 | Nuclear Energy | URA | 67.2 | 10% | -8.58% | NLR -8.2% · URNM -11.6% |
| 4 | Defense & Aerospace | XAR | 65.8 | 10% | +0.86% | ITA -3.2% · ROKT +6.3% |
| 5 | Technology | CIBR | 57.4 | 10% | -0.56% | IGV +10.6% · XLK -0.6% |
| 6 | Industrial Metals | COPX | 56.7 | 10% | -10.67% | PICK -6.6% · REMX -2.2% |
| 7 | AI | SMH | 44.6 | 10% | -4.77% | AIQ +0.7% · BOTZ +0.3% |
| 8 | Agriculture & Livestock | MOO | 22.6 | 10% | -4.39% | VEGI -2.4% · WEAT -5.3% |
| 9 | Emerging Markets | IEMG | 12.5 | 0% | -5.32% | ILF -4.3% · INDA -5.3% |
| 10 | Traditional Energy | XLE | 9.3 | 0% | +4.99% | XOP +4.4% · FCG +4.2% |
Precious Metals — SLV
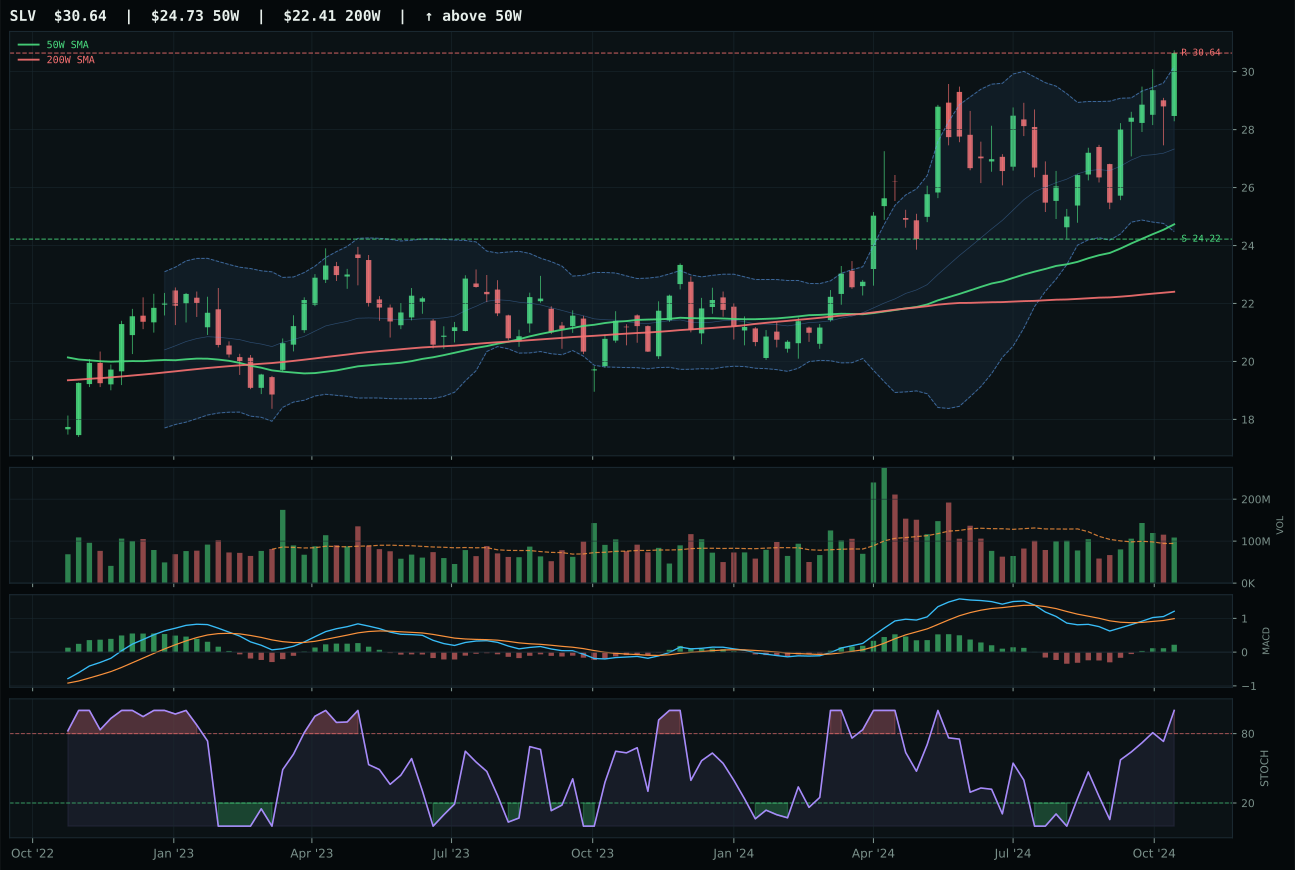
SLV has a vertical extension profile with 8.3% 13-week relative strength versus SPY.
A failed hold above support would weaken the setup.
Actionable but governed by invalidation levels.
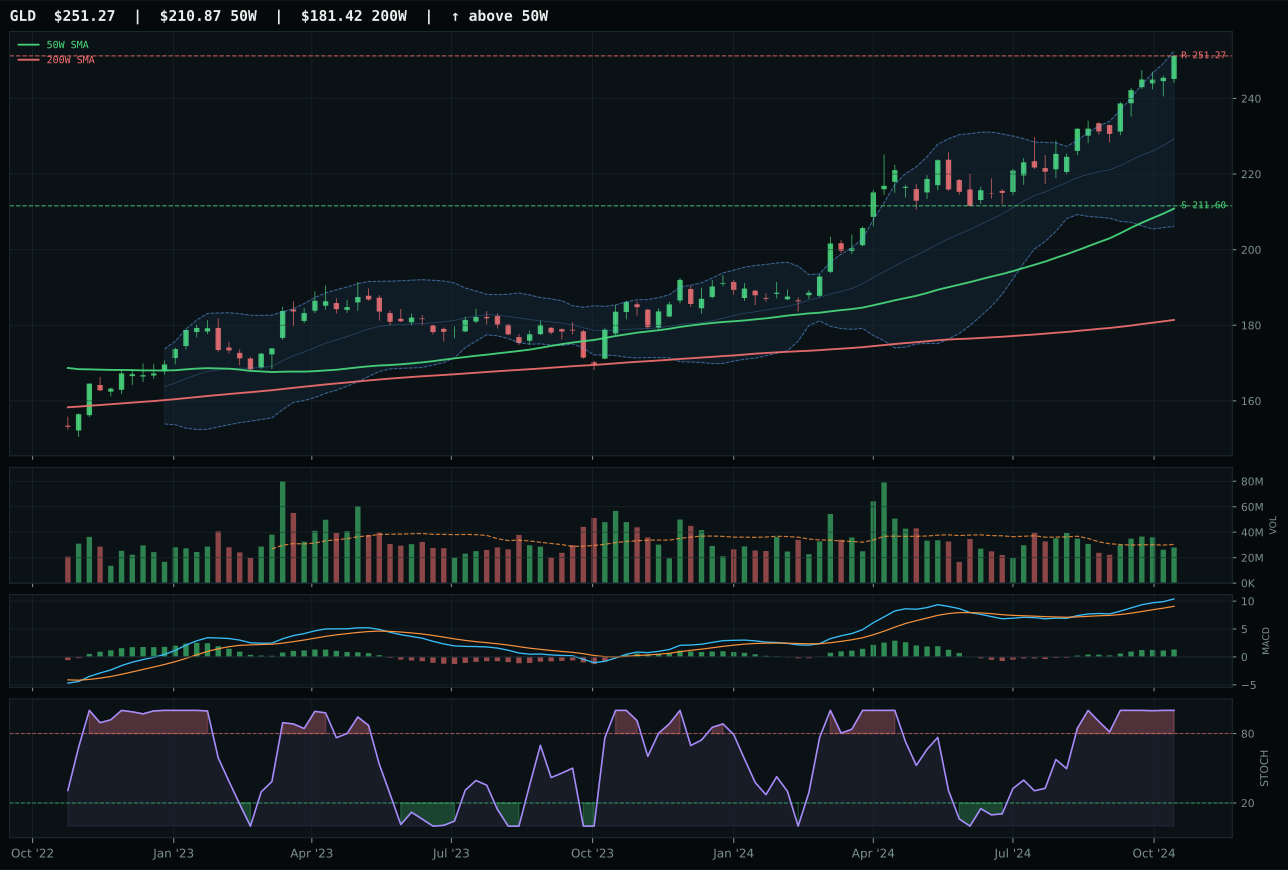
GLD has a vertical extension profile with 6.8% 13-week relative strength versus SPY.
A failed hold above support would weaken the setup.
Actionable but governed by invalidation levels.
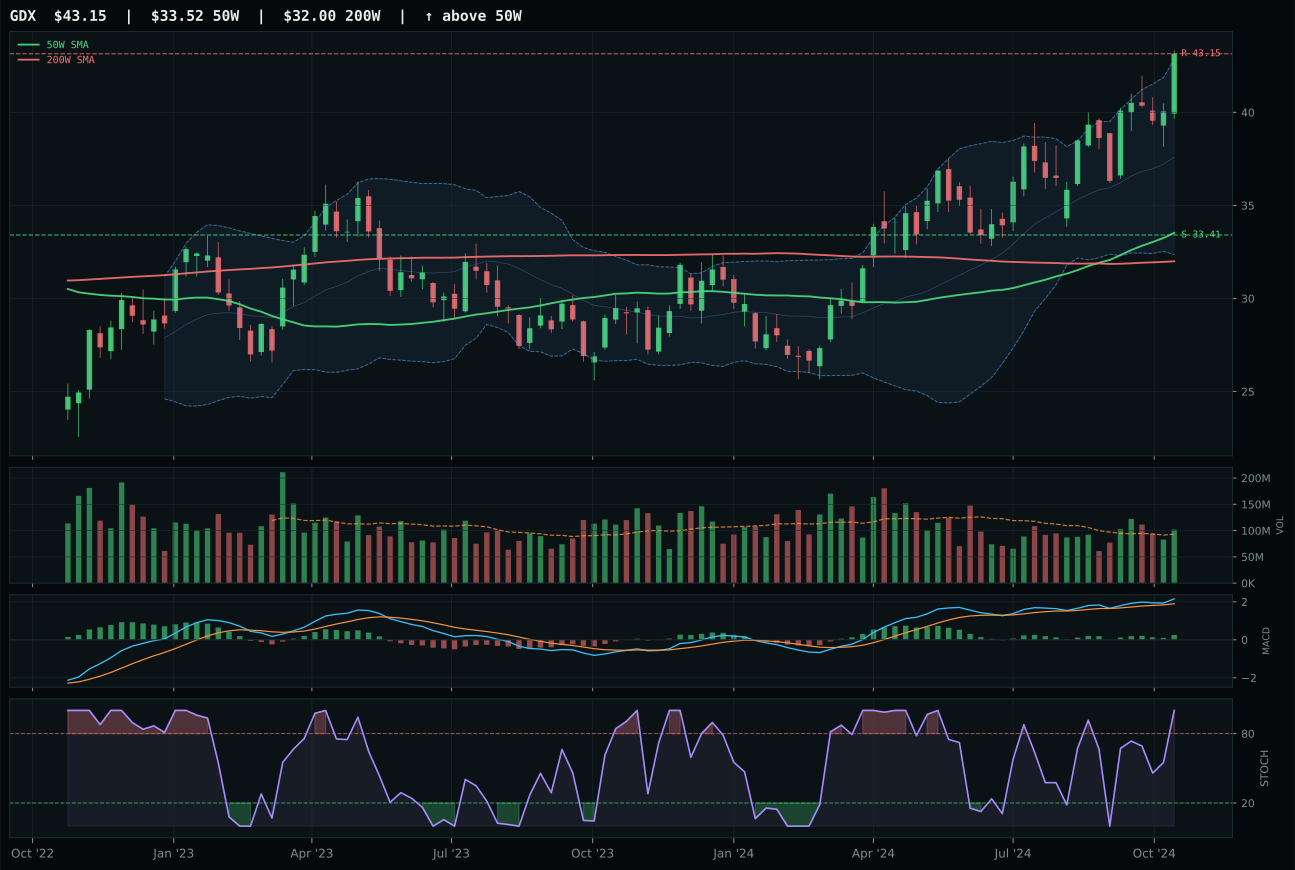
GDX has a vertical extension profile with 8.9% 13-week relative strength versus SPY.
A failed hold above support would weaken the setup.
Actionable but governed by invalidation levels.
SLV claimed the top-2 slot with an 80.9 reasoned ETF score, edging GLD by 7.4 points on volume sponsorship and category-relative momentum. At 1.15x participation versus GLD's neutral and +0.0% category-relative strength versus GLD's -1.5%, SLV demonstrated genuine accumulation in a vertical extension setup already 23.9% above the 50W. Both carry extreme timing risk—overbought stochastics near 52-week highs with zero upside to resistance—yet SLV's heavier volume participation on the 14.8% 13-week return signaled conviction. GLD's superior macro narrative fit (78.0 versus SLV's 59.0) was overridden by the technical edge; in a monetary hedge bid environment, the silver vs. gold call favors the commodity with tighter sponsorship.
Precious Metals earned 10% allocation as a top-2 overweight at 80.8, the second-highest category score. This reflects the regime's structural tilt: monetary hedge bid (+14), metals scarcity (+14), and defensive rotation (+7) create 35 points of macro tailwind before technical evidence even enters. The 85.0 macro fit score is the highest in the portfolio, reflecting alignment between disinflation (which lifts real assets), credit stress (which benefits safe havens), and risk appetite erosion (which favors monetary optionality). Yet extension—both SLV and GLD sit 23-24% above the 50W—means timing is asymmetric. New buyers enter at elevated risk; this allocation is appropriate for a macro hedging portfolio but would struggle in a coordinated risk-appetite recovery. Hold this overweight for regime durability, but recognize the entry point has shifted to tactical weakness, not tactical strength.
Utilities & Infrastructure — PAVE
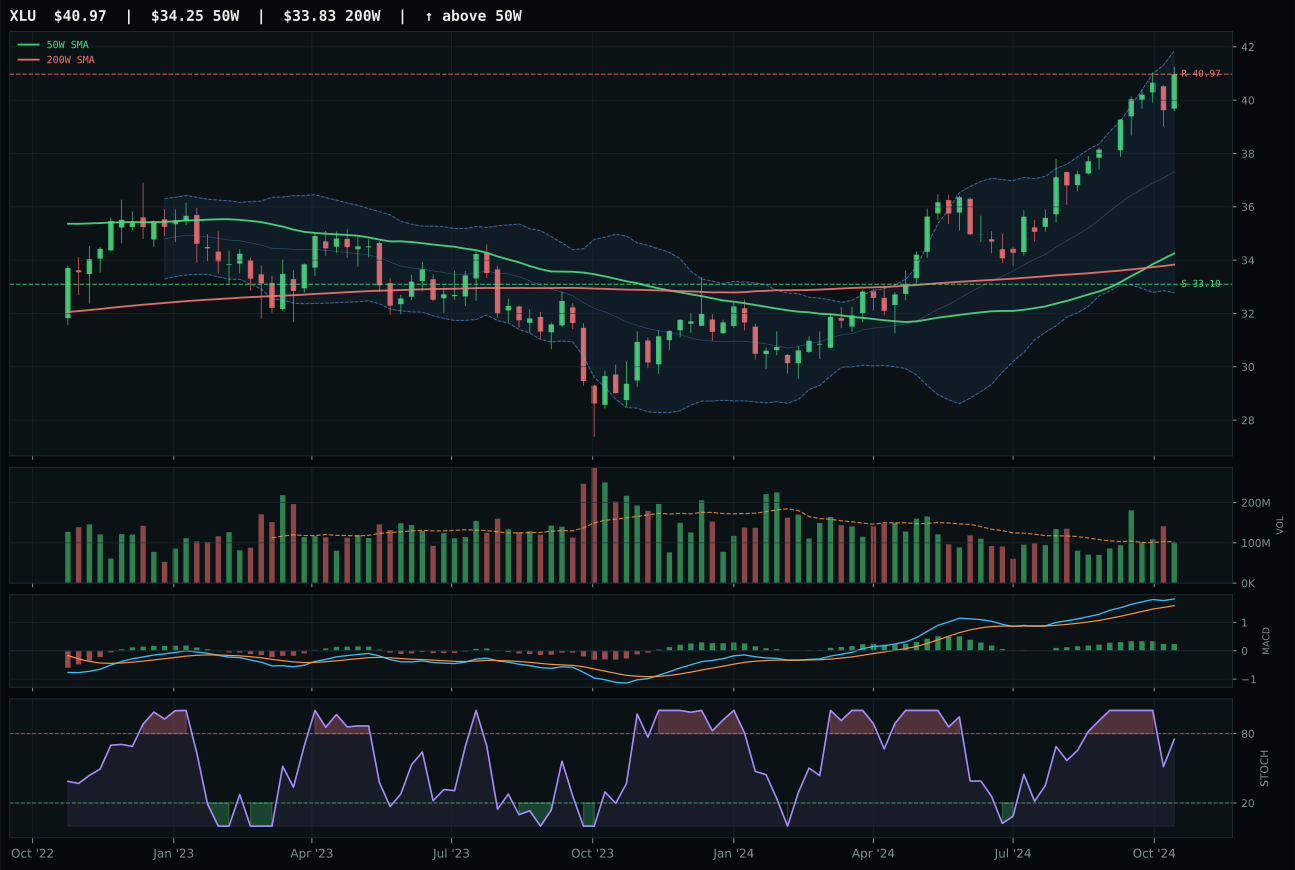
XLU has a vertical extension profile with 10.4% 13-week relative strength versus SPY.
A failed hold above support would weaken the setup.
Actionable but governed by invalidation levels.
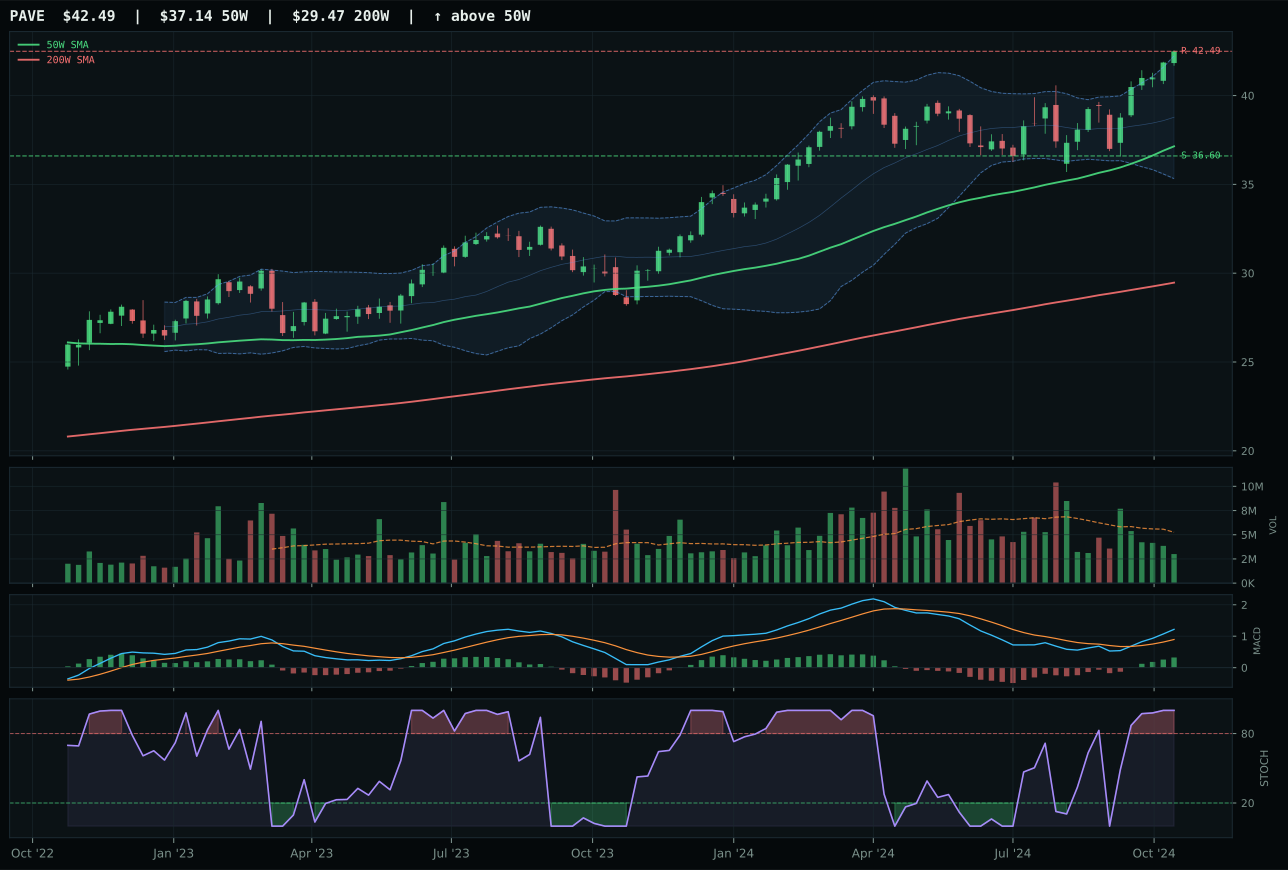
PAVE has a neutral structure profile with 4.1% 13-week relative strength versus SPY.
A failed hold above support would weaken the setup.
Actionable but governed by invalidation levels.
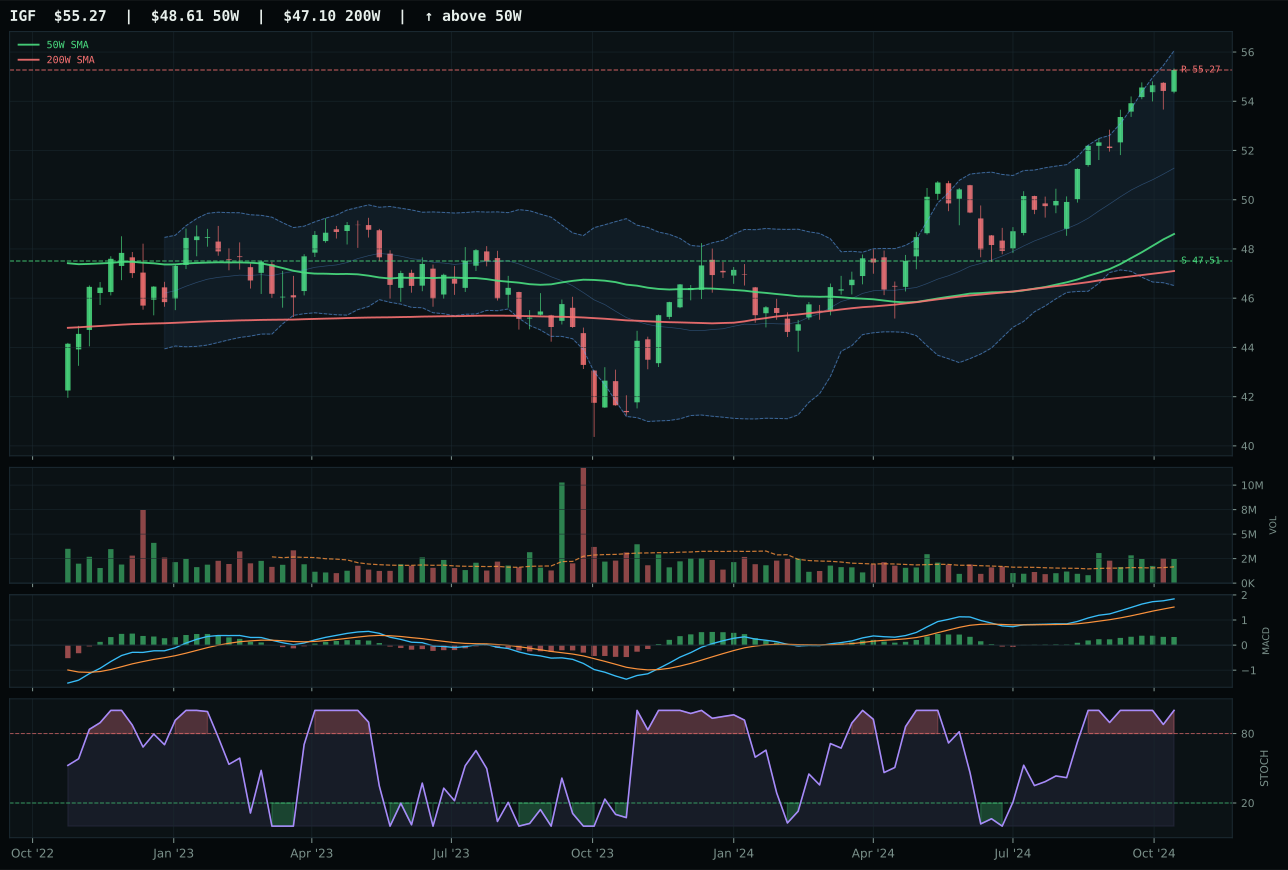
IGF has a neutral structure profile with 5.0% 13-week relative strength versus SPY.
A failed hold above support would weaken the setup.
Actionable but governed by invalidation levels.
PAVE captured the top-2 slot at 78.2 with superior setup geometry despite lower momentum than XLU. At 14.4% from the 50W with neutral structure, PAVE avoided XLU's 19.7% extension while maintaining perfect 100.0 trend; the timing score gap (59.0 versus XLU's 55.0) reflected PAVE's closer proximity to the trigger point. XLU's bullish-but-flattening MACD versus PAVE's bullish-and-improving created the decisive momentum edge (81.2 versus 100.0 for XLU's overbought stochastic, but PAVE's falling stochastic on thin participation suggested accumulation without exhaustion). Risk-reward favored PAVE at 46.0 versus 36.0; infrastructure offered better downside cushion relative to upside potential.
Utilities & Infrastructure earned 10% as the second overweight alongside Precious Metals at 78.2 category score. The category's macro fit is exceptional at 80.0, driven by defensive rotation (+12), disinflation pressure (+6), and broad market bear (+4)—a combined 22 points of structural support before technical evidence. PAVE's domestic infrastructure and capex beta align perfectly with a regime favoring real-capital deployment over financial engineering; the thin participation (0.57x) is a feature, not a bug, suggesting conviction players are accumulating while retail remains absent. However, PAVE's 14.4% extension and 59.0 timing score mean this overweight is a structural macro call, not a technical entry. New buyers face timing risk; hold this position for regime persistence, but recognize that any near-term pullback would provide superior entry points. The 10% allocation reflects the portfolio's commitment to disinflation hedges and defensives; it is sized appropriately for the macro case but not for aggressive tactical accumulation at current levels.
Nuclear Energy — URA
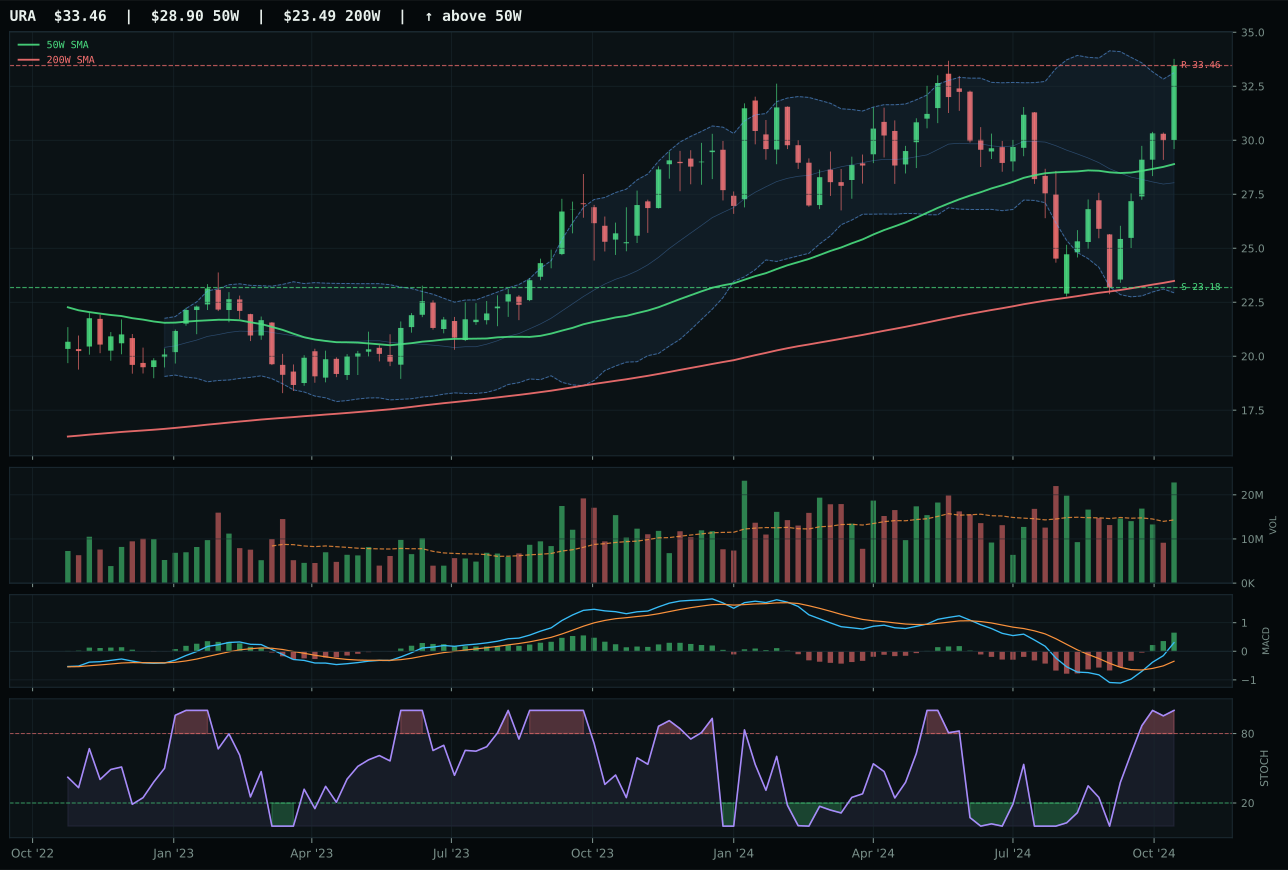
URA has a vertical extension profile with 12.2% 13-week relative strength versus SPY.
A failed hold above support would weaken the setup.
Actionable but governed by invalidation levels.
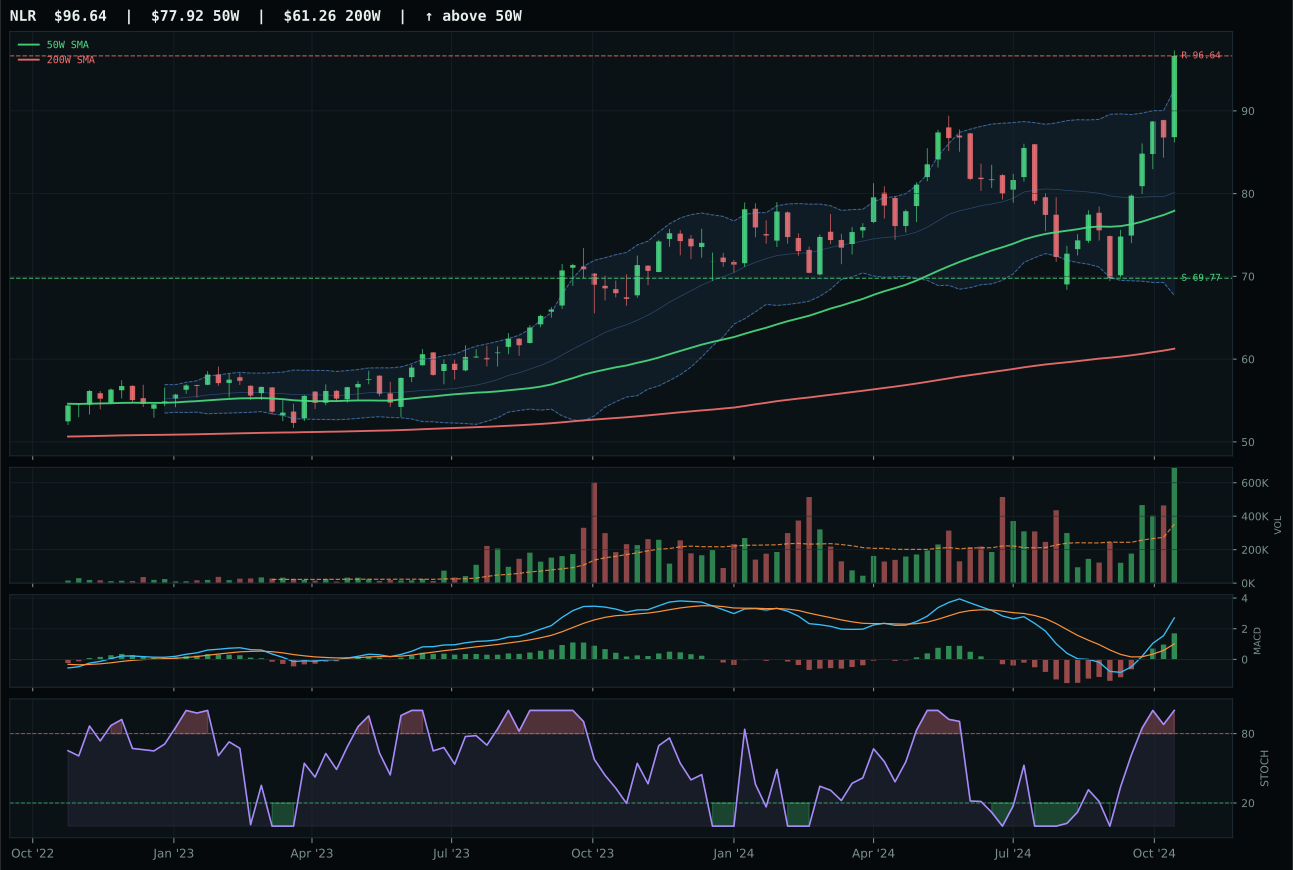
NLR has a vertical extension profile with 15.6% 13-week relative strength versus SPY.
A failed hold above support would weaken the setup.
Actionable but governed by invalidation levels.
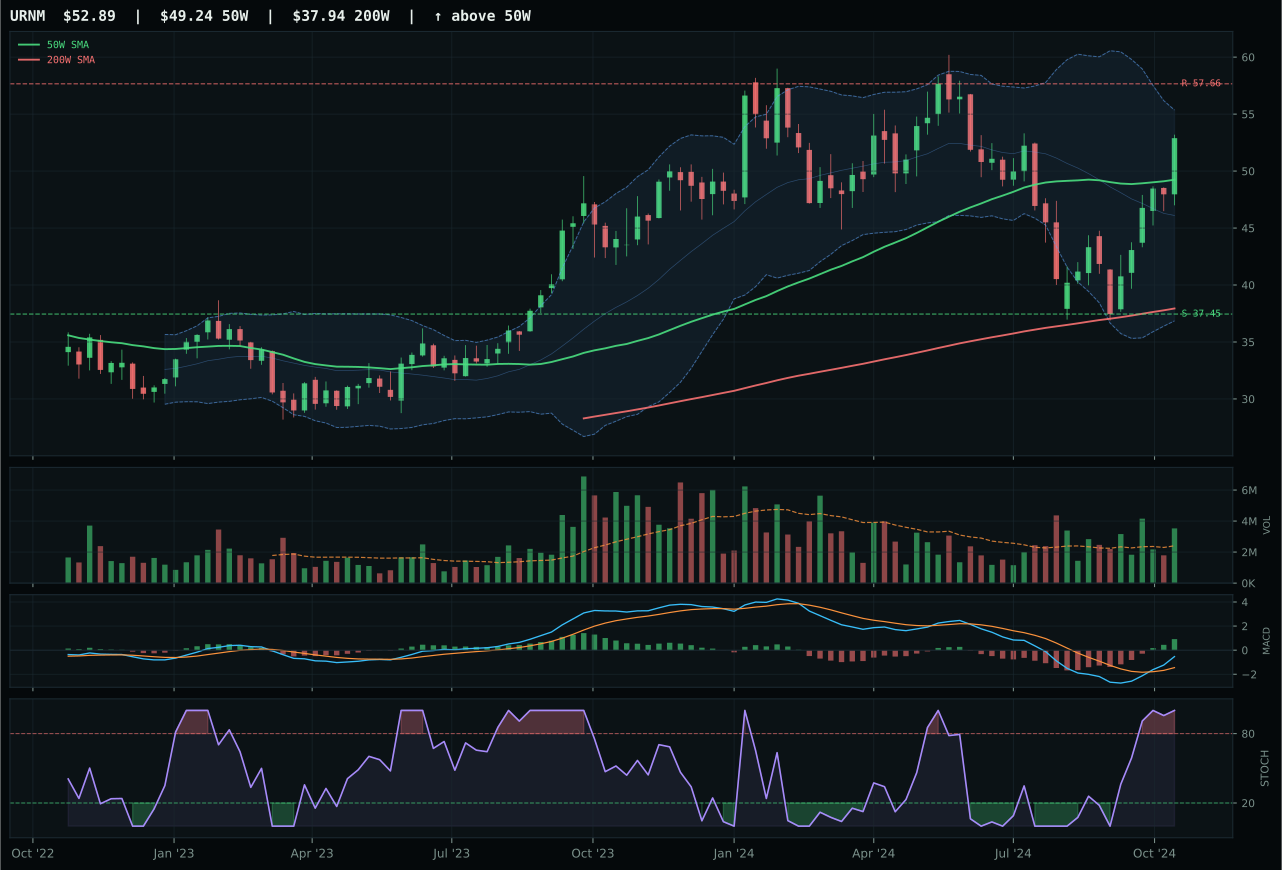
URNM has a neutral structure profile with 6.2% 13-week relative strength versus SPY.
A failed hold above support would weaken the setup.
Actionable but governed by invalidation levels.
URA won despite a razor-thin 0.4-point margin over NLR by avoiding excessive extension. At 15.8% above the 50W, URA sat cleaner than NLR's 24.0% stretch; both scored perfect 100.0 momentum and 100.0 volume-price confirmation due to accumulation participation and 13-week returns in the 18-22% range. The category-relative parity at 0.0% for URA versus NLR's 3.5% edge meant the tiebreaker was positioning risk: URA's shallower distance to the 50W offered better mean-reversion insurance if sentiment shifted. MACD and stochastic RSI were identical; the victory hinged on risk-reward at 45.2 versus NLR's 46.0, nearly a draw that exposed the decision's marginal nature.
Nuclear Energy received 5% allocation at 67.2, a tier-3 ranking above exclusion but below the two overweights. The category benefits from real asset sponsorship (+7) and sits on neutral macro footing (41.0 macro fit) without the tailwinds of metals or defense. URA's 12.2% RS versus SPY and perfect momentum confirmation justify the allocation, yet extended positioning (both URA and NLR near 52-week highs) limits upside and increases reversion risk. This is a core-portfolio real-asset diversifier rather than a conviction trade. The allocation persists because nuclear energy narratives around power demand and decarbonization remain structurally sound, and URA's accumulation volume suggests institutional participation despite price extension. However, the tight spread to resistance (0.0% upside) means this position has reached its entry-point limit; new capital should await either a pullback or sustained breakout above Fib 0.236.
Defense & Aerospace — XAR
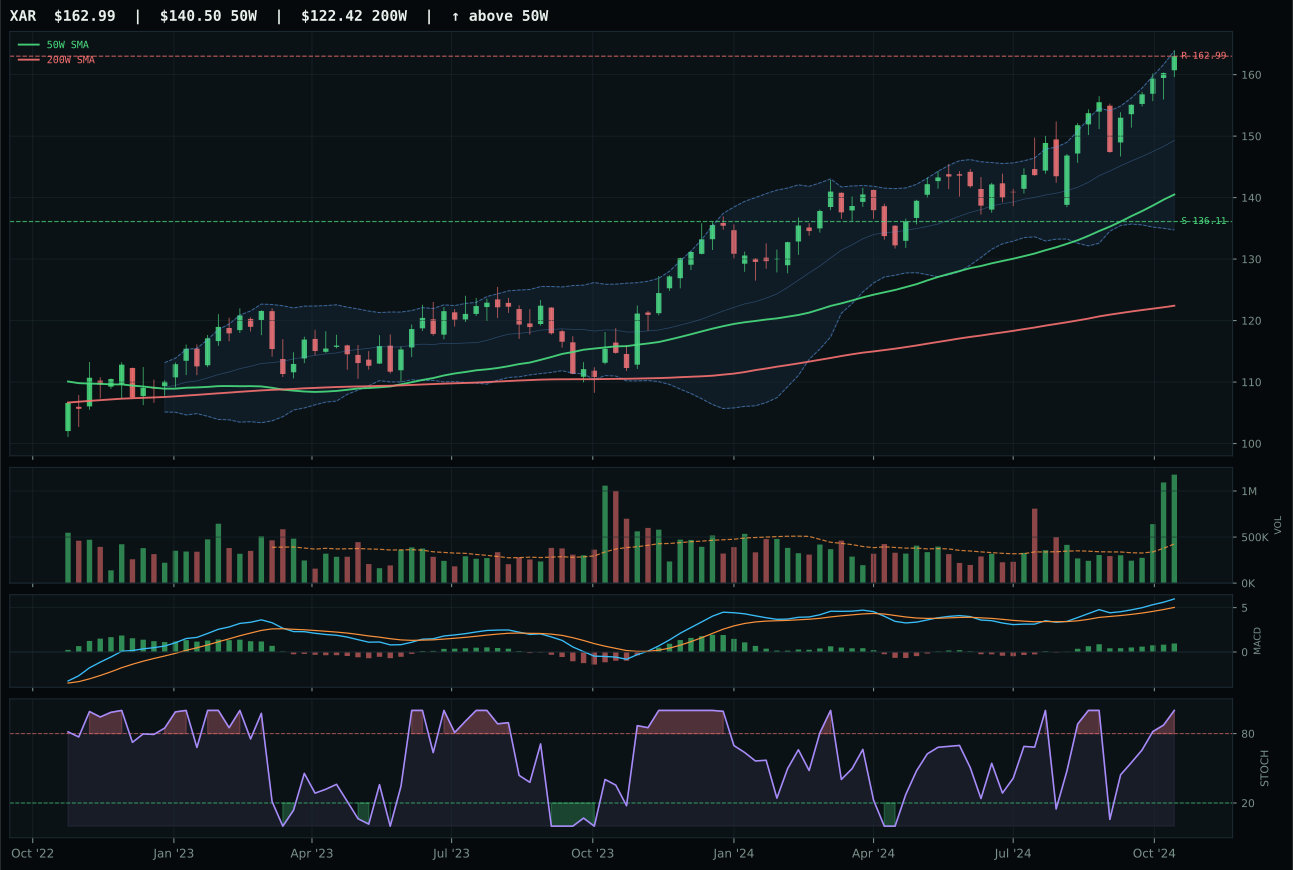
XAR has a vertical extension profile with 7.0% 13-week relative strength versus SPY.
A failed hold above support would weaken the setup.
Actionable but governed by invalidation levels.
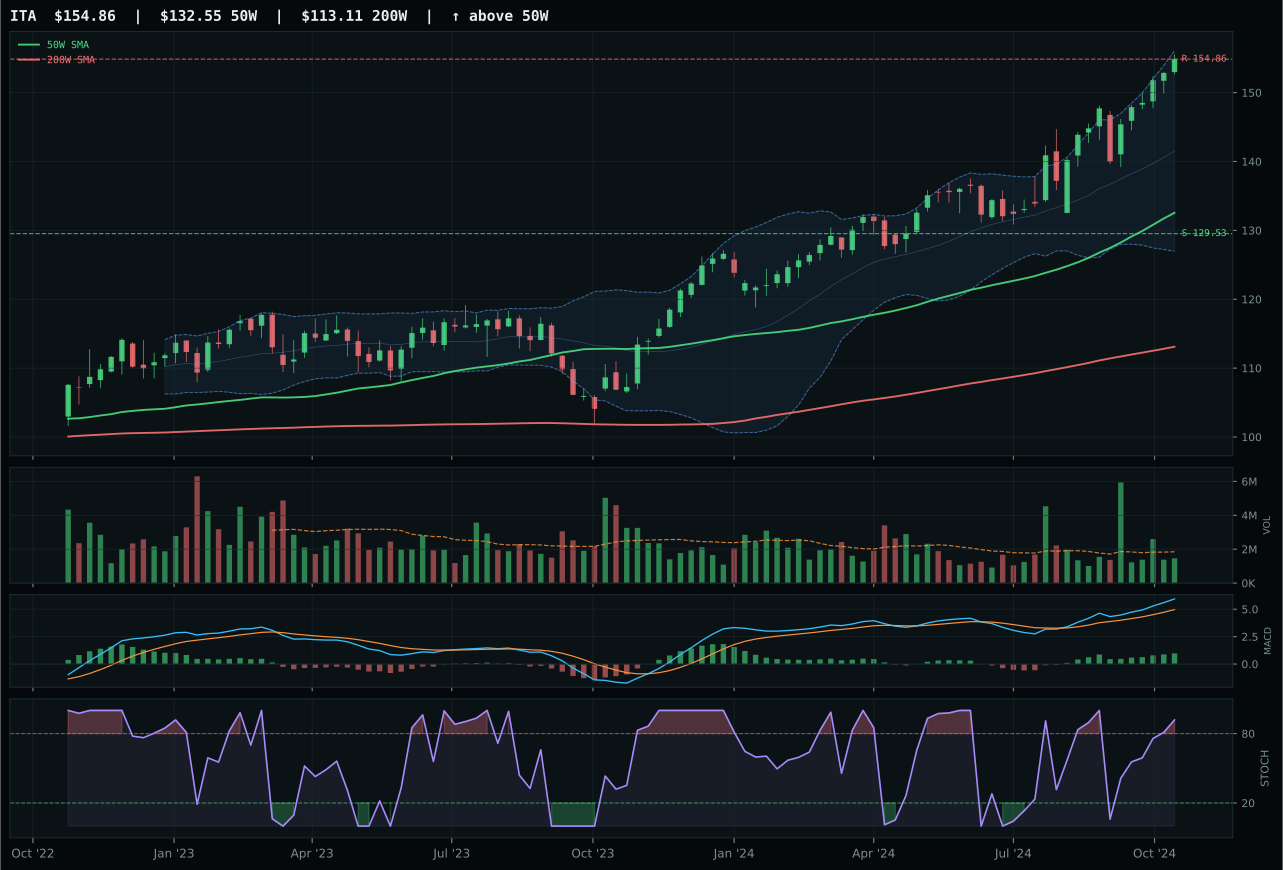
ITA has a vertical extension profile with 9.2% 13-week relative strength versus SPY.
A failed hold above support would weaken the setup.
Actionable but governed by invalidation levels.
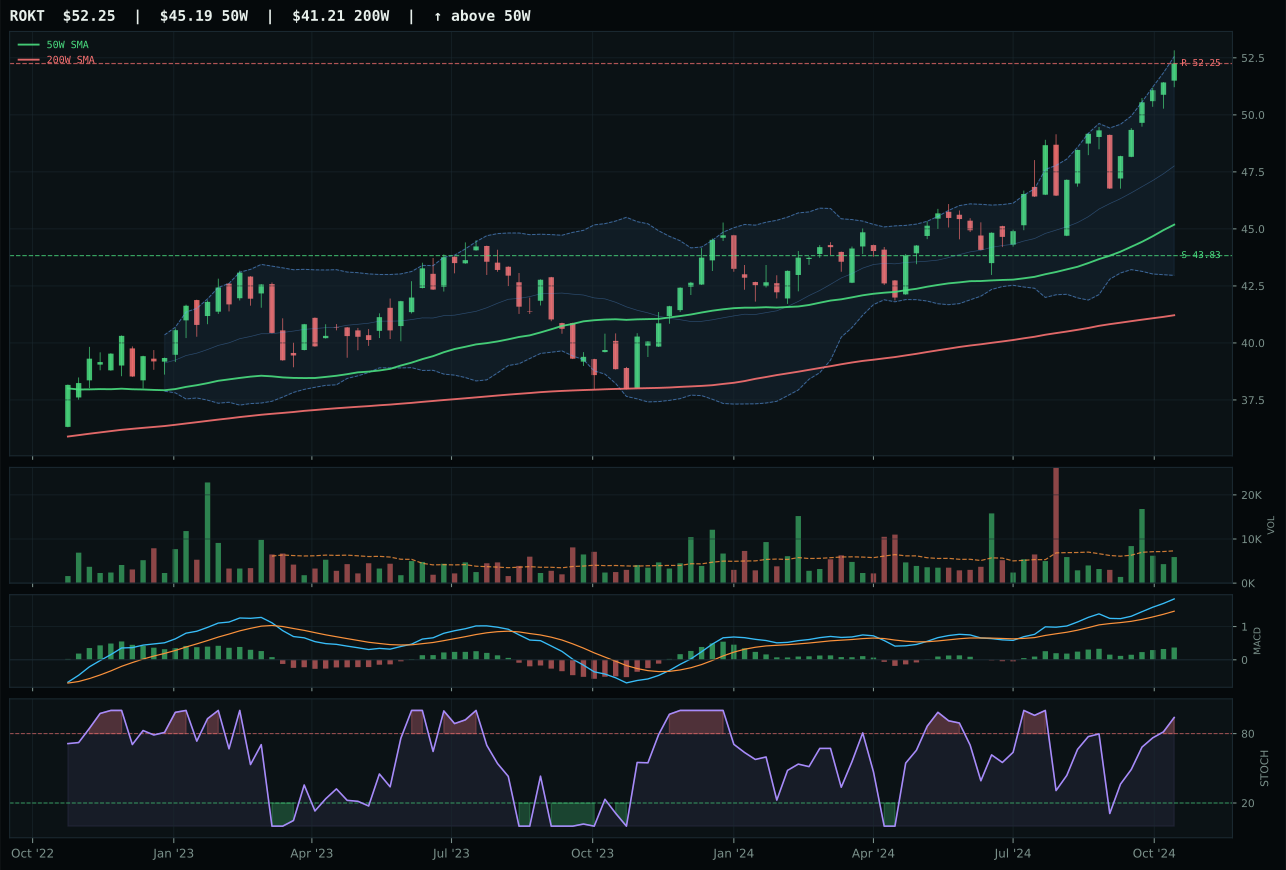
ROKT has a vertical extension profile with 6.1% 13-week relative strength versus SPY.
A failed hold above support would weaken the setup.
Tracked, but not top-2 eligible because: .
XAR edged ITA by 1.8 points in a decision driven by sponsorship and participation rather than price action alone. Both sit extended near 52-week highs with 100.0 trend scores and overbought stochastics, but XAR's 2.77x volume accumulation versus ITA's neutral participation tipped the scales decisively. The 7.0% RS versus SPY and stronger structure cleanliness (83.3 versus ITA's 82.3) confirmed buying interest in XAR's broad defense expression; ITA's 9.2% SPY-relative gain was an illusion without volume confirmation. Risk-reward favored XAR at 49.3 versus 44.4, reflecting its tighter path to resistance relative to downside cushion.
Defense & Aerospace earned 5% allocation as a tier-3 category at a score of 65.8, well-positioned but subordinate to the two overweights. The category benefits from active defensive rotation (+8) and broad market bear (+6) descriptors that align with disinflation regime positioning; macro fit scored 63.0, meaningfully above the portfolio average. Yet technical leadership is shared—all three options are extended, and the macro case is cyclical, not structural. This is a tactical conviction holding: XAR's volume sponsorship and cleaner setup justify committed capital, but the risk is that if equity risk appetite stabilizes quickly, extended aerospace hardware will mean-revert faster than defensives. The allocation functions as a market-structure hedge, not a structural beta.
Technology — CIBR
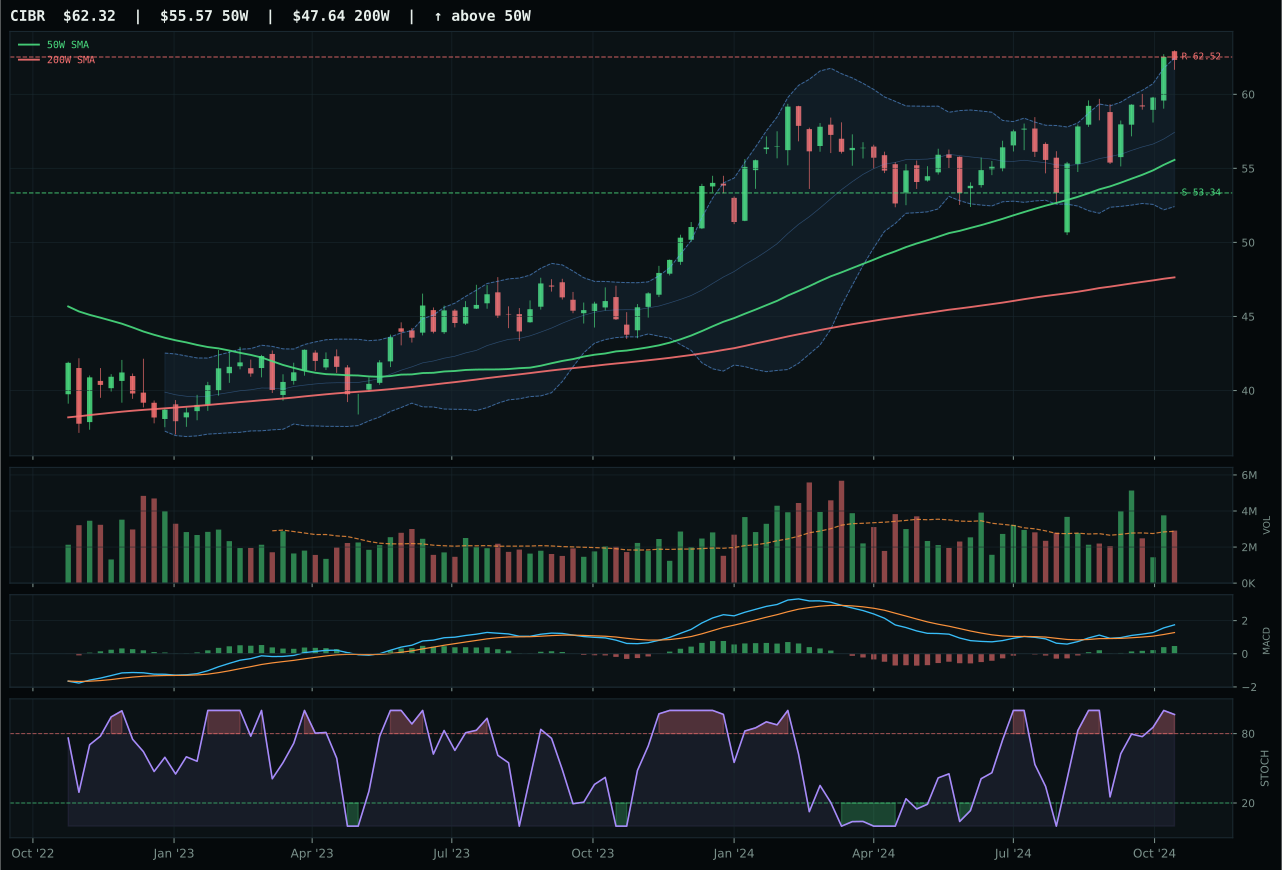
CIBR has a neutral structure profile with 4.6% 13-week relative strength versus SPY.
A failed hold above support would weaken the setup.
Actionable but governed by invalidation levels.
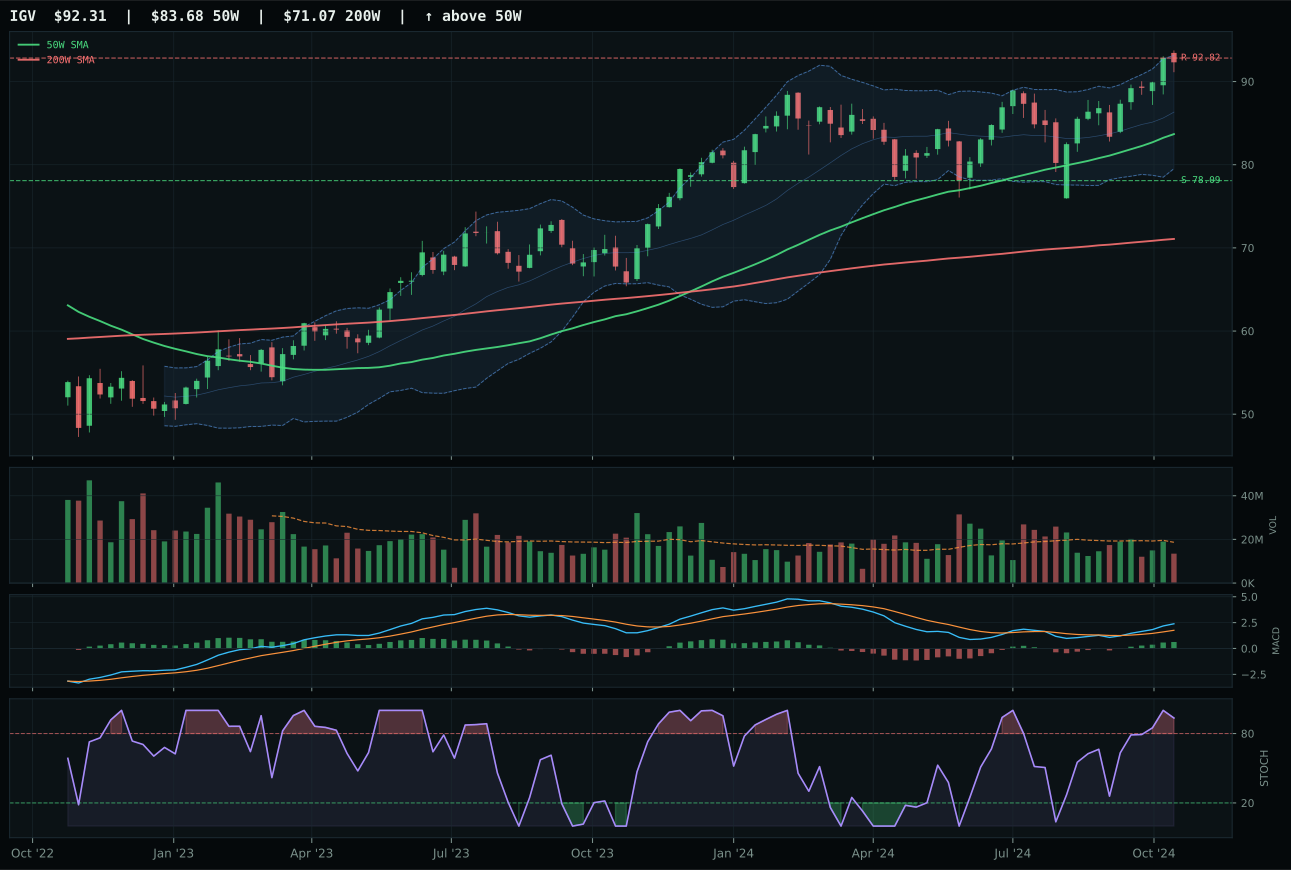
IGV has a neutral structure profile with 2.3% 13-week relative strength versus SPY.
A failed hold above support would weaken the setup.
Actionable but governed by invalidation levels.
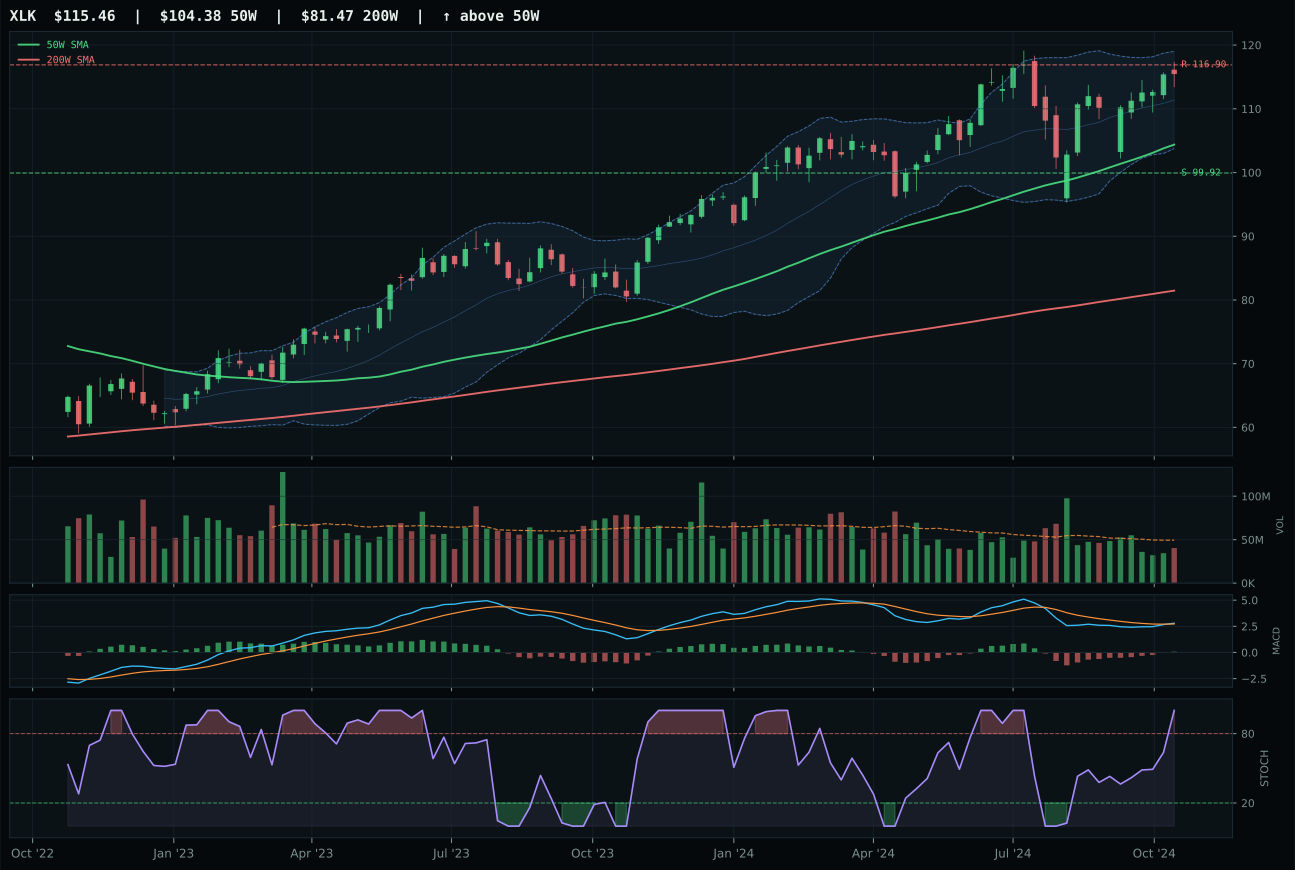
XLK has a neutral structure profile with -1.9% 13-week relative strength versus SPY.
A failed hold above support would weaken the setup.
Actionable but governed by invalidation levels.
CIBR prevailed because its relative strength versus the category median at 2.3% outpaced IGV's flat 0.0%, signaling genuine internal sponsorship rather than coattailing. The 4.6% edge over SPY combined with a neutral 50W slope and bullish, improving MACD gave CIBR cleaner technical confirmation. IGV stumbled on volume—thin participation versus CIBR's neutral participation—which undermined the conviction of its 8.8% 13-week return; breadth matters more when momentum is slowing. Price extension of 12.1% above the 50W for CIBR versus deeper structure in competitors positioned it as the cleanest near-term setup despite the modest gap.
Technology earned 5% allocation as a tier-2 category, ranking below the two overweight sleeves but above exclusion. The 57.4 composite score reflects technical strength (trend 100, momentum 92) heavily offset by macro headwinds: liquidity stress and credit stress each penalized the category while disinflation offered only modest lift. The regime favors real assets and defensive rotation, both structural headwinds for growth-sensitive tech. CIBR's cybersecurity subtheme provides some defensive coloring, but the category as a whole lacks the macro tailwind to earn a top-2 spot. Holding this position caps downside risk to the portfolio if risk appetite stabilizes, but conviction remains muted until either credit stress releases or disinflation reverses.
Industrial Metals — COPX
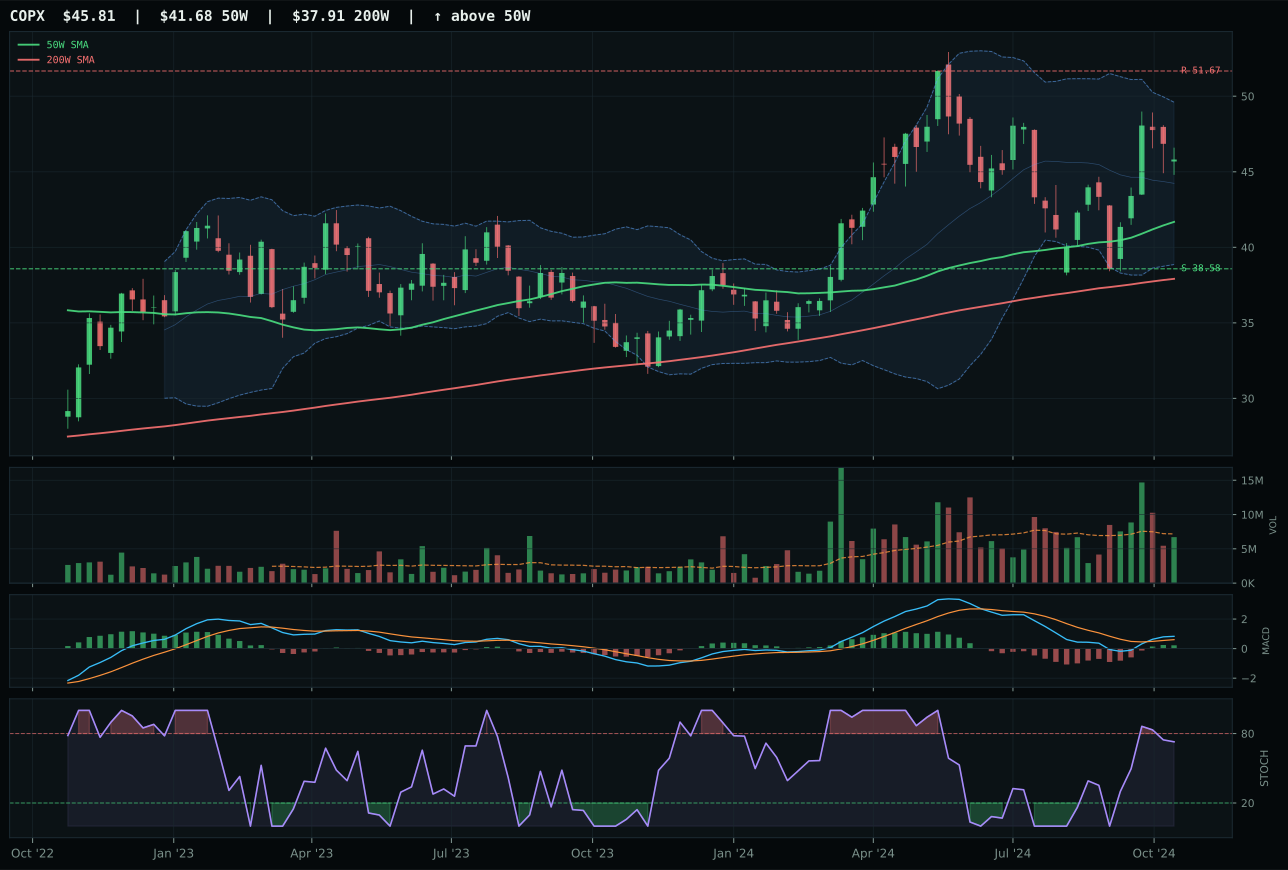
COPX has a neutral structure profile with -0.7% 13-week relative strength versus SPY.
A failed hold above support would weaken the setup.
Actionable but governed by invalidation levels.
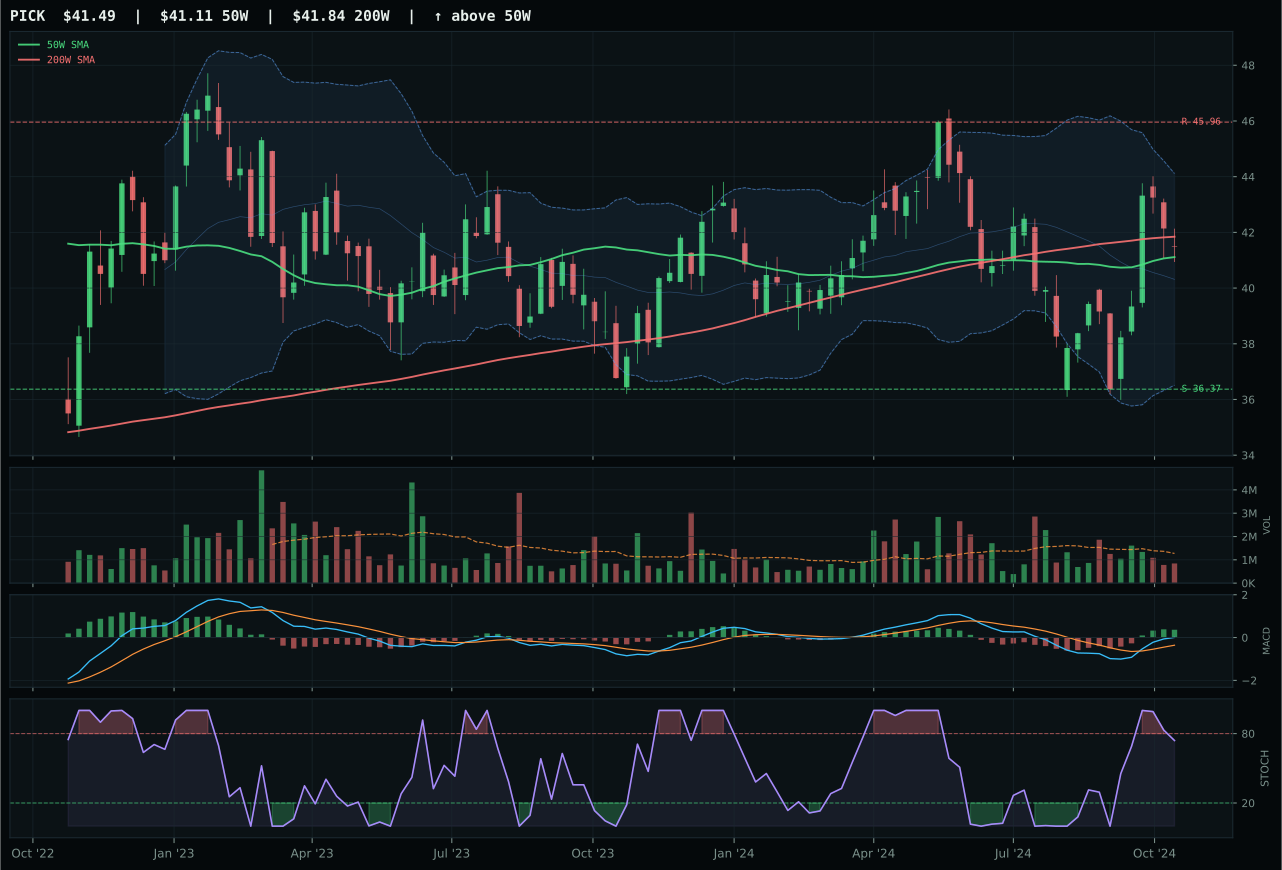
PICK has a compression near 50W profile with -2.5% 13-week relative strength versus SPY.
A failed hold above support would weaken the setup.
Actionable but governed by invalidation levels.
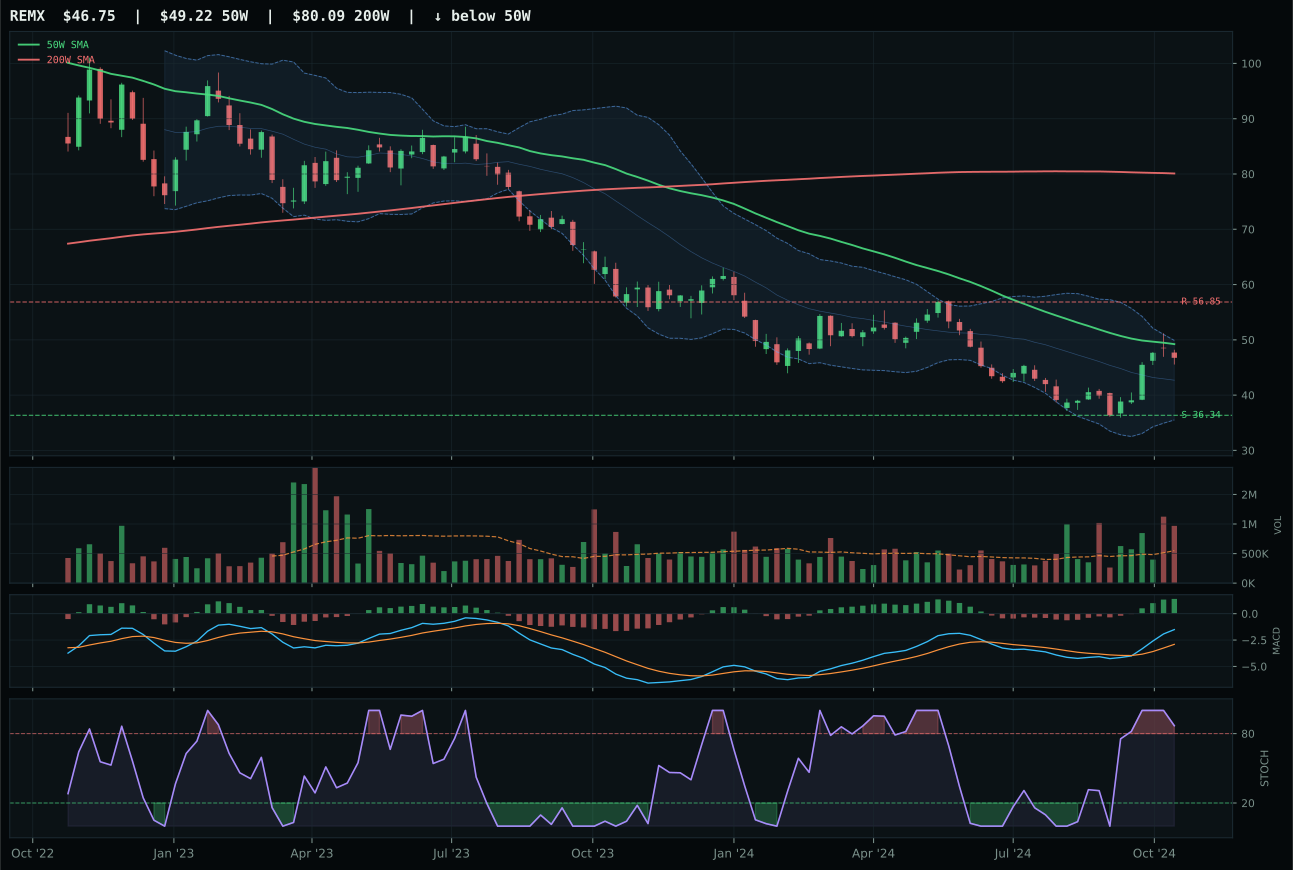
REMX has a neutral structure profile with 2.3% 13-week relative strength versus SPY.
Extension and support failure are the main tactical risks.
Tracked, but not top-2 eligible because: structurally broken.
COPX won with a 9-point edge over PICK, defended by trend purity (98.9 versus PICK's 86.0) and neutral volume versus thin participation. At 9.9% from the 50W with MACD bullish and improving, COPX occupies the least-extended position while retaining full trend structure. PICK's compression near the 50W would normally favor timing, but thin participation and -1.8% category-relative weakness revealed that accumulation was occurring in COPX, not PICK. The 73.0 reasoned ETF score for COPX reflects copper's scarcity narrative (+12) and commodity breadth (+7) overriding the modest -0.7% SPY-relative drag; PICK's diversified mining exposure could not generate parallel sponsorship.
Industrial Metals received 5% as a tier-3 category with a 56.7 score, benefiting from metals scarcity (+14) and commodity breadth (+7) but constrained by liquidity stress (-8). The 65.0 macro fit demonstrates constructive alignment with real asset sponsorship and commodity structuralism, yet the category ranked below Precious Metals and Defense. COPX's neutral structure and 5.8% 13-week return offer steady exposure without the timing risk of PICK or the extension risk of silver. This allocation is workmanlike: it fills the copper-demand beta slot without claiming macro leadership. The position persists because scarcity narratives remain valid and industrial demand linked to infrastructure spending should stabilize; however, the absence of volume sponsorship suggests this is grinding higher, not breaking out, and new money should watch for a cleaner setup before adding conviction.
AI — SMH
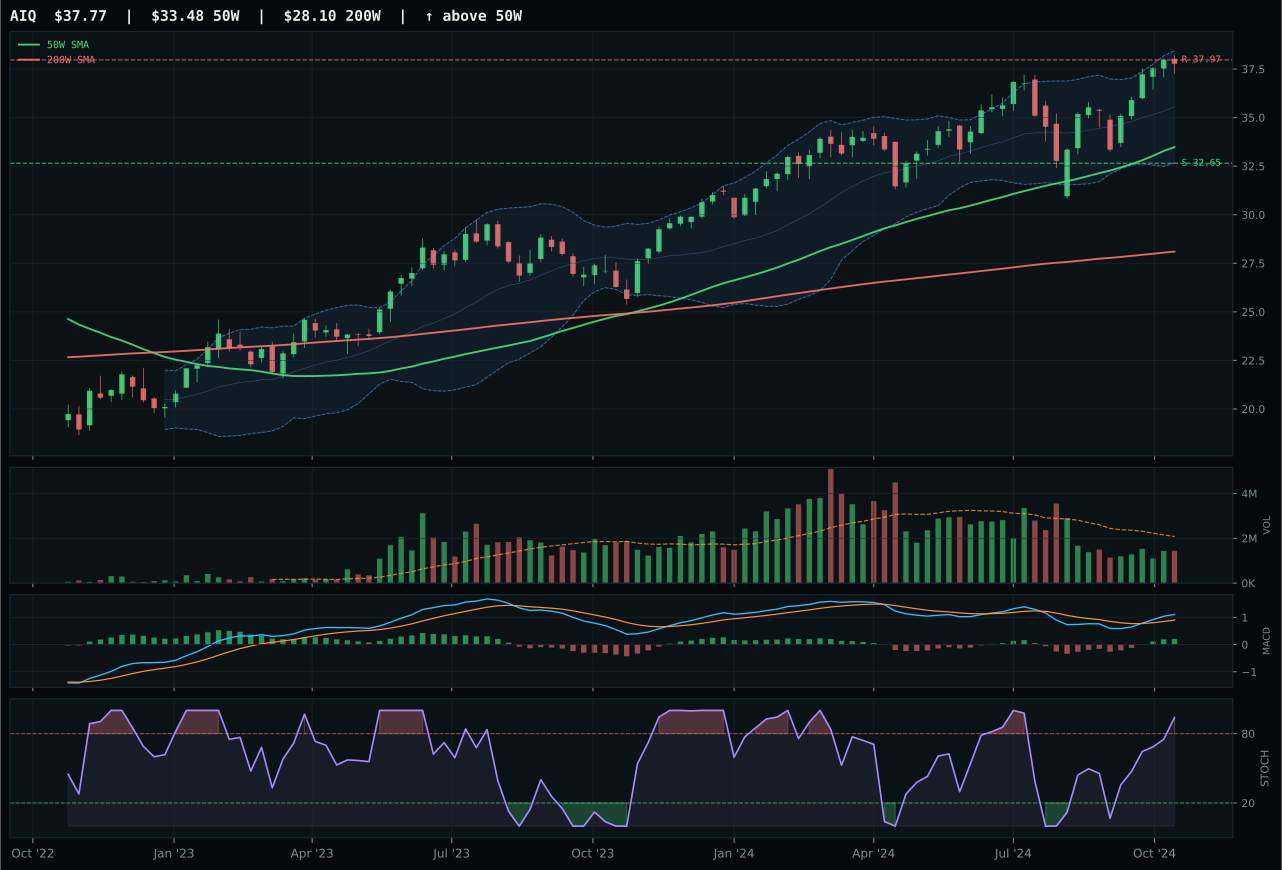
AIQ has a neutral structure profile with 1.1% 13-week relative strength versus SPY.
A failed hold above support would weaken the setup.
Actionable but governed by invalidation levels.
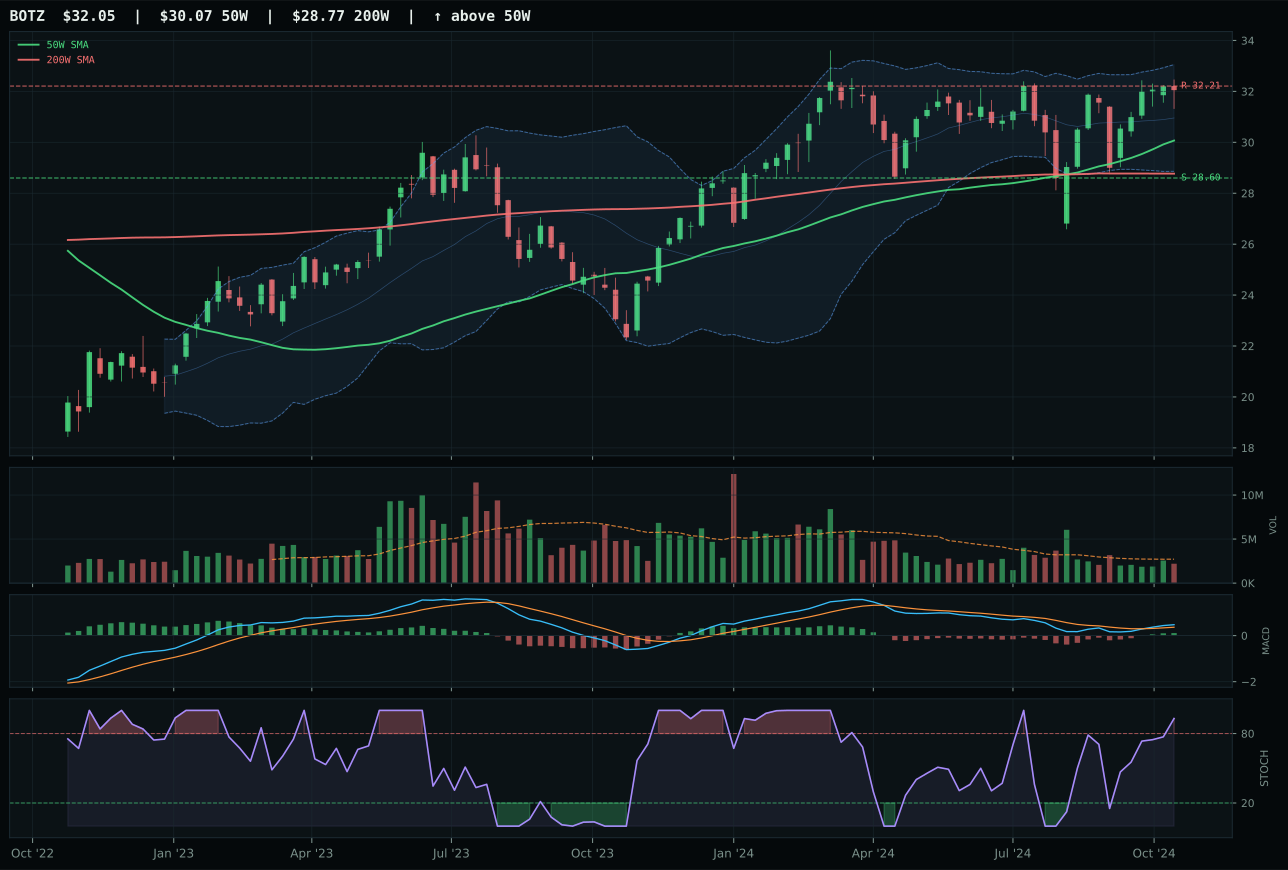
BOTZ has a neutral structure profile with -2.6% 13-week relative strength versus SPY.
A failed hold above support would weaken the setup.
Actionable but governed by invalidation levels.
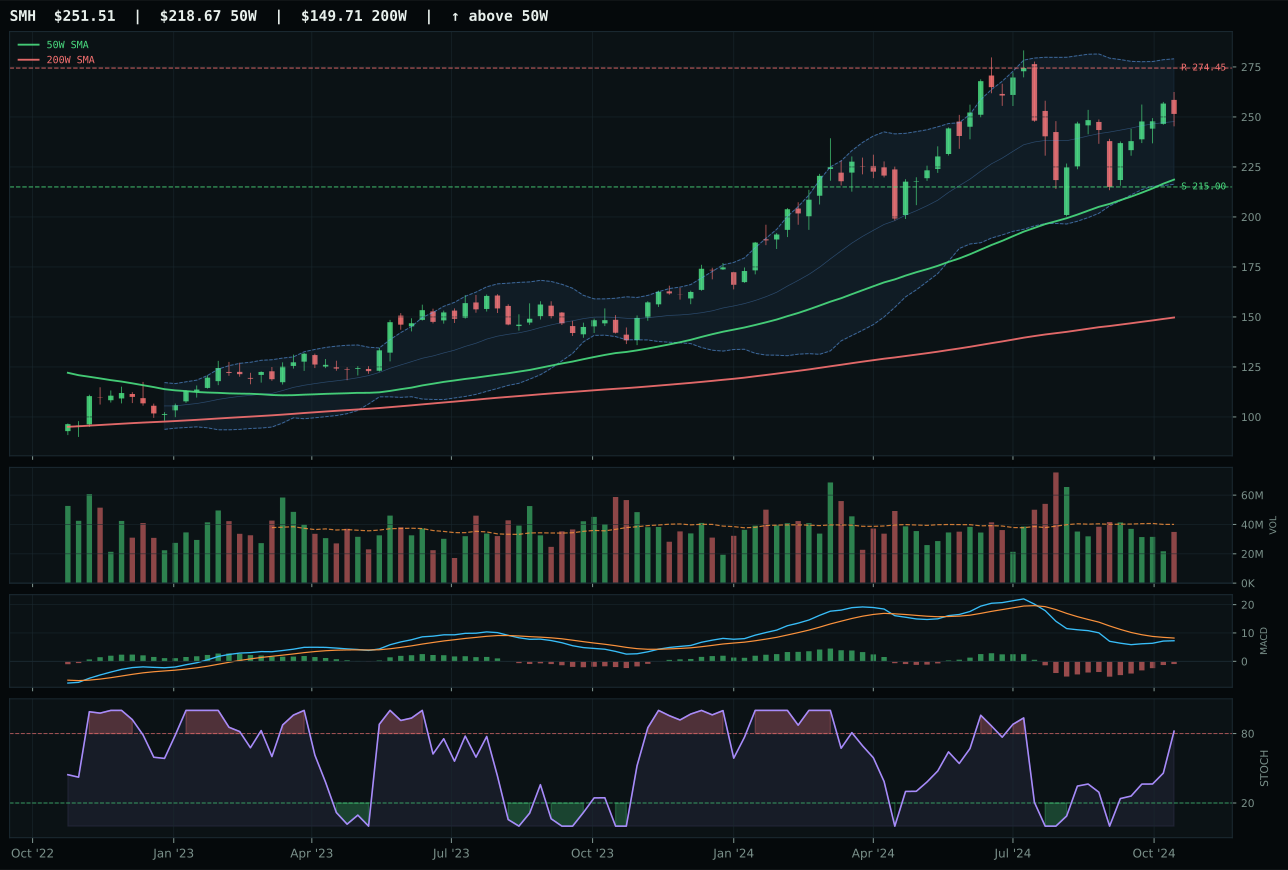
SMH has a vertical extension profile with -5.1% 13-week relative strength versus SPY.
A failed hold above support would weaken the setup.
Actionable but governed by invalidation levels.
SMH won a close category despite its weakness—a 19-point margin behind the runner-up AIQ exposes how damaged the entire AI space has become. The semiconductor leader's -5.1% RS versus SPY and -2.5% category-relative strength drove a 51.0 momentum score, yet vertical extension at 15.0% and bearish-but-improving MACD kept timing penalized at 45.0. AIQ's superior technical evidence (70.5 versus SMH's 47.7) was negated by thinner volume participation and marginally worse risk-reward, leaving the allocator with a category so weak that even the winner feels defensive. The gap reveals no internal leadership in AI hardware or software; macro stress is simply crushing both theta and duration sensitivity.
AI received 5% as a tier-2 holding, not because of strength but because exclusion would abandon exposure if sentiment shifts. The 44.6 category score is the weakest among allocated categories, driven by liquidity stress (-12), credit stress (-8), and broad market bear (-8) overwhelming any disinflation benefit. Technical evidence in the basket ranks well at 62%, but macro/narrative fit collapsed to 27.0, the worst of any category. This is a core-portfolio hedge against a sharp mean reversion in risk appetite, not a conviction bet. The allocation persists because a complete clearing of AI would leave the portfolio overexposed to rate-sensitive, capital-light sectors; keeping 5% preserves optionality while the regime remains hostile to growth leverage.
Agriculture & Livestock — MOO
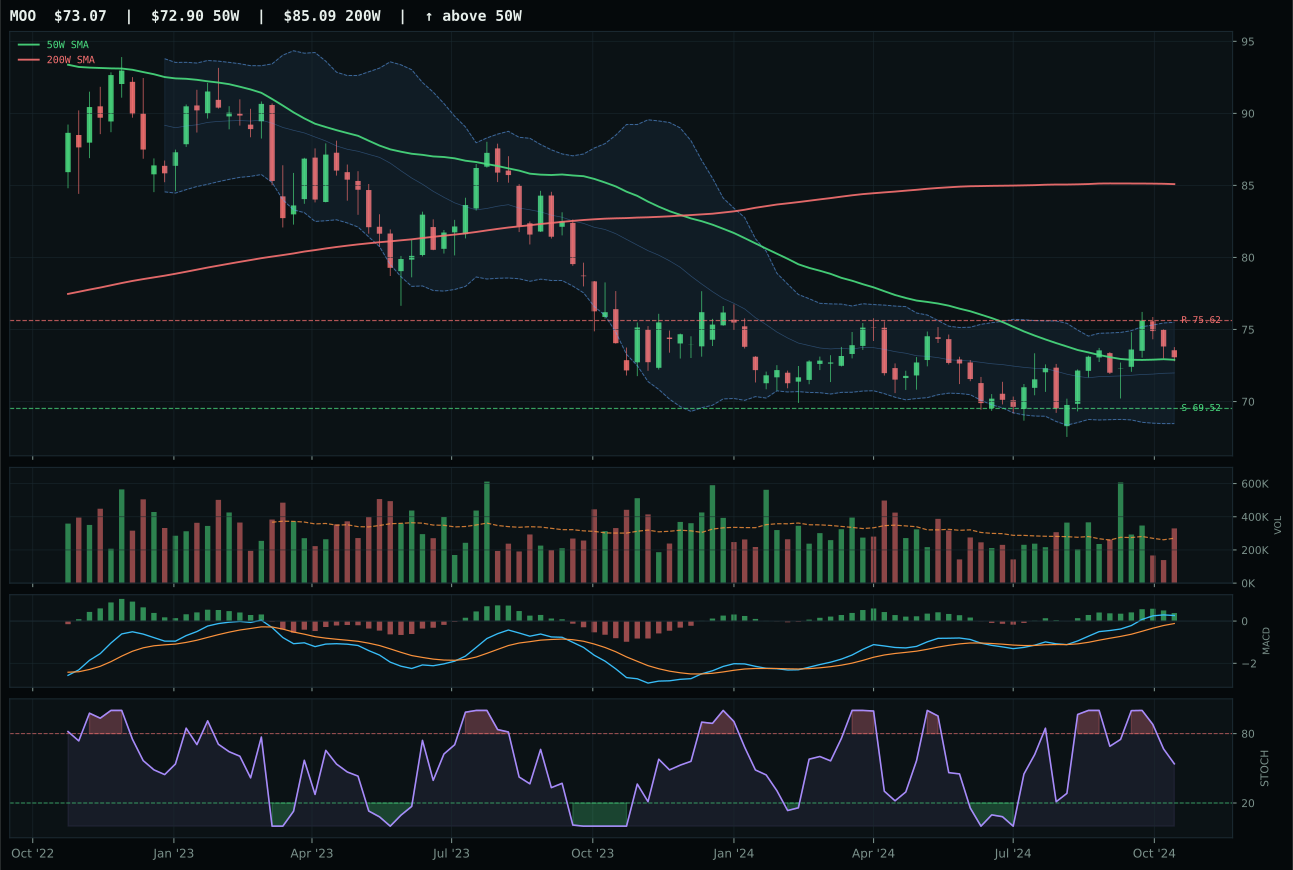
MOO has a compression near 50W profile with -4.3% 13-week relative strength versus SPY.
A failed hold above support would weaken the setup.
Actionable but governed by invalidation levels.
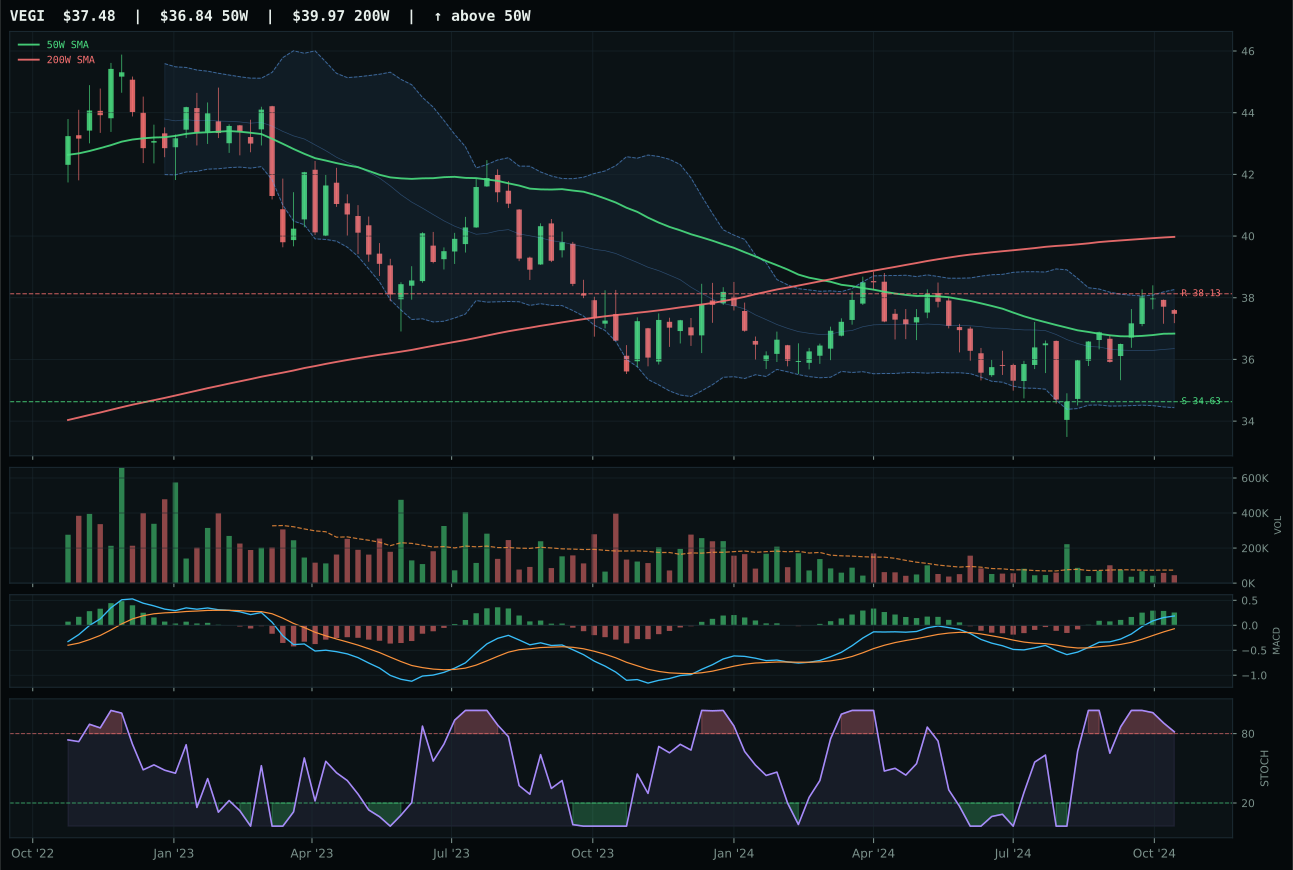
VEGI has a compression near 50W profile with -3.5% 13-week relative strength versus SPY.
A failed hold above support would weaken the setup.
Tracked, but not top-2 eligible because: .
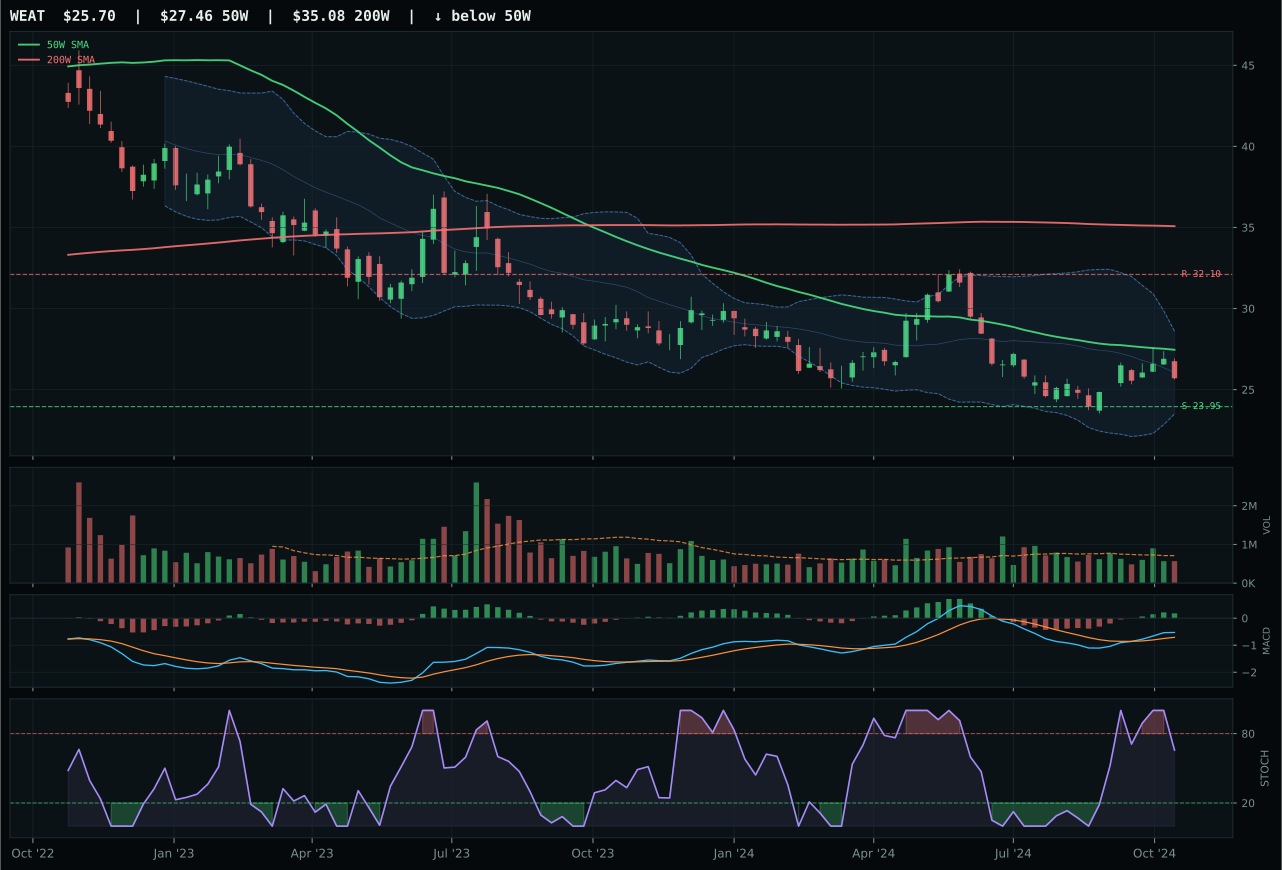
WEAT has a neutral structure profile with -5.5% 13-week relative strength versus SPY.
Extension and support failure are the main tactical risks.
Tracked, but not top-2 eligible because: structurally broken.
MOO won decisively with an 18.4-point margin over VEGI on timing and risk-reward structure alone. Compressing at the 50W with a 0.2% distance and stochastic RSI falling neutral at 0.54, MOO presented a textbook coil pattern where support at 69.52 anchors downside risk to 5.1% while resistance at 75.62 offers asymmetric upside if buyers defend. VEGI's superior trend and MACD did not compensate for overbought stochastic rolling over, upper retracement zone positioning, and thin participation that suggested exhaustion. MOO's 95.0 timing score reflects a setup ready to trigger, not one already extended; the category-relative parity at 0.0% for MOO meant no internal momentum was driving the choice, only structural attractiveness.
Agriculture & Livestock holds 5% allocation despite a dismal 22.6 category score, the second-lowest of any funded position. Commodity breadth positive (+5) and real asset sponsorship (+8) offer offset to disinflation pressure (-8), but the net macro fit is negative at 45.0. The category's technical evidence is only middling at 57.2, and category-level momentum shows near-zero conviction. This allocation is portfolio infrastructure, not a tactical call: holding real asset exposure in a disinflationary regime requires positions even when they underperform. MOO's compression setup and neutral market structure provide optionality if commodity breadth strengthens or disinflation accelerates; otherwise, this capital is warehoused. The sector will not lead, but excluding it entirely would overweight duration and financial assets at precisely the wrong point in the cycle.
Emerging Markets — IEMG
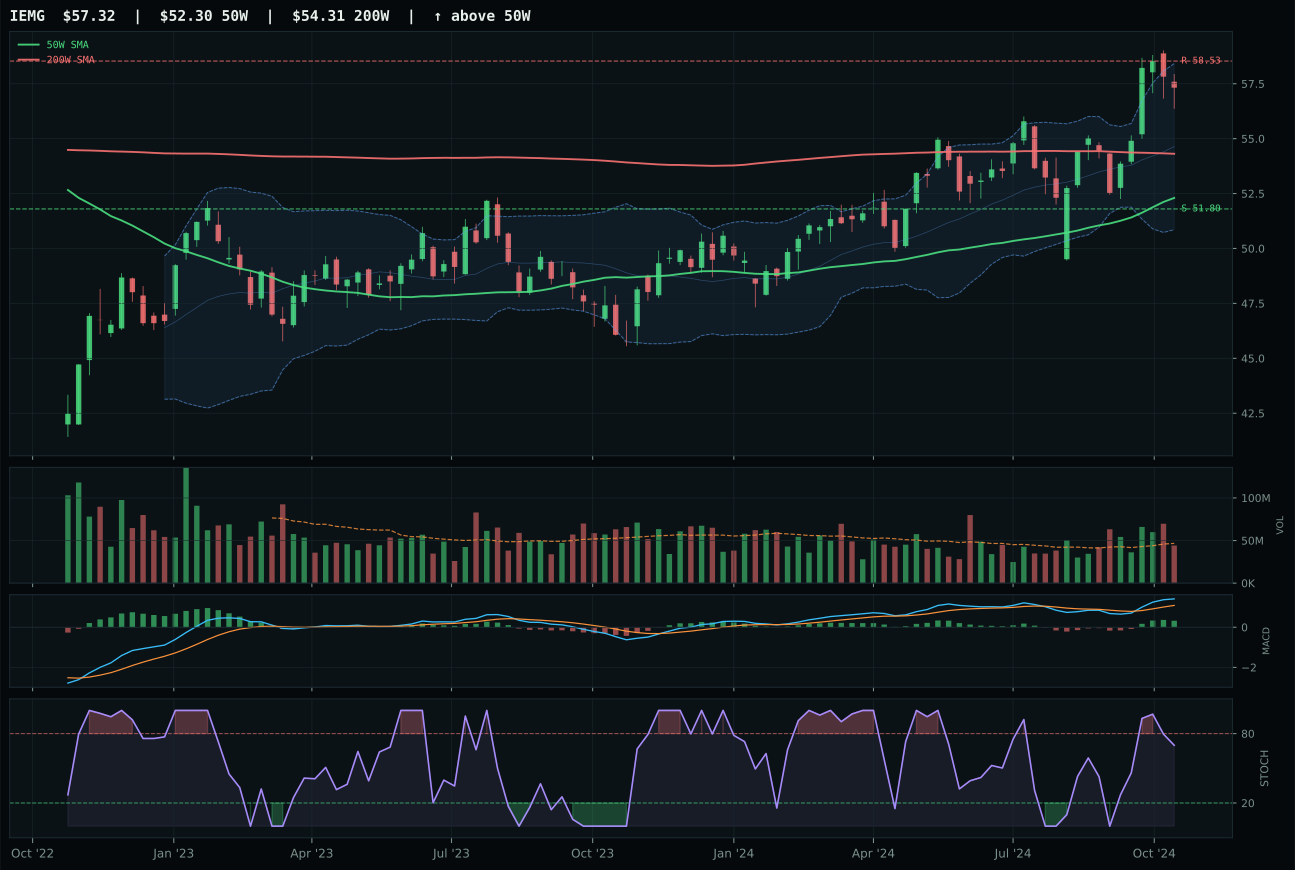
IEMG has a neutral structure profile with 0.4% 13-week relative strength versus SPY.
A failed hold above support would weaken the setup.
Actionable but governed by invalidation levels.
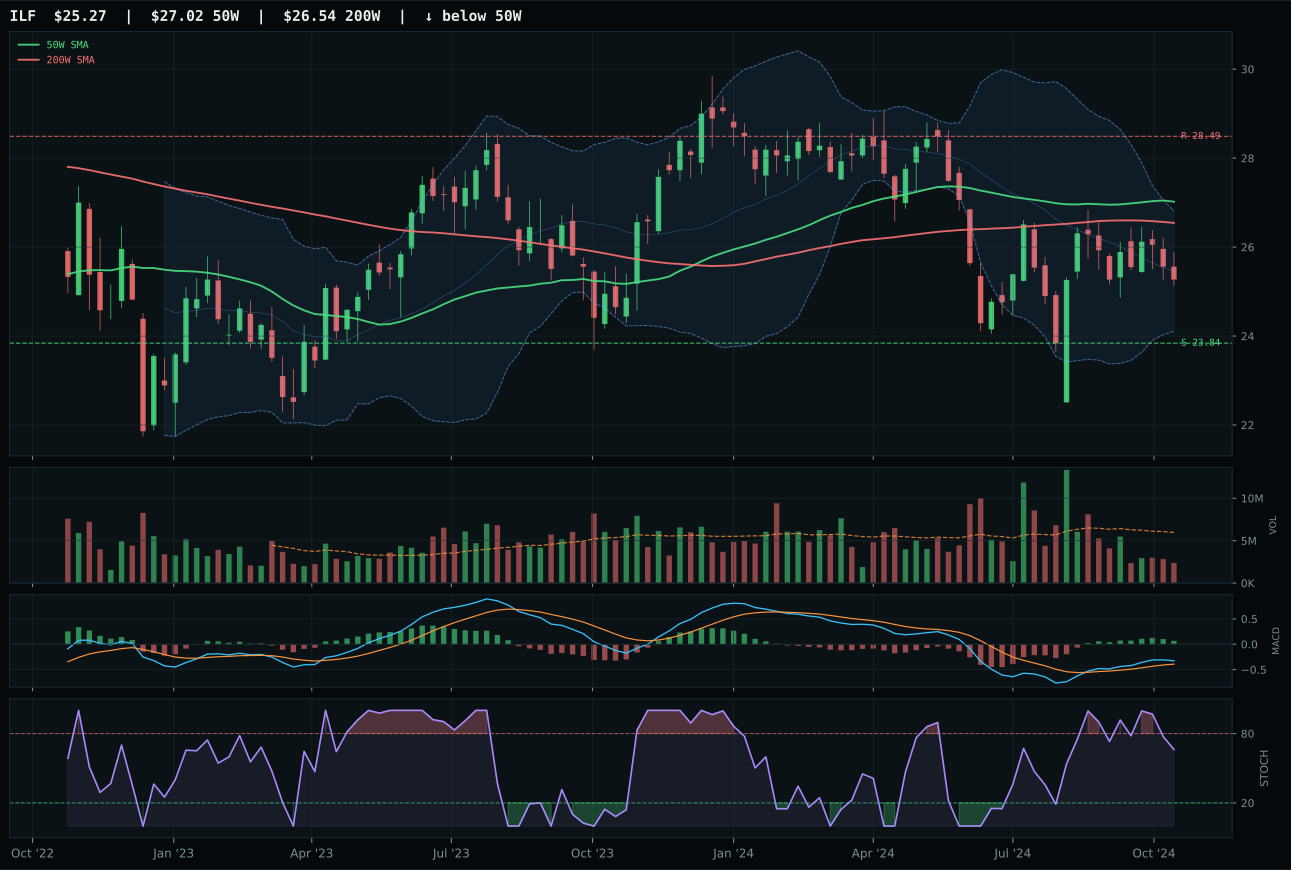
ILF has a neutral structure profile with -7.5% 13-week relative strength versus SPY.
A failed hold above support would weaken the setup.
Actionable but governed by invalidation levels.
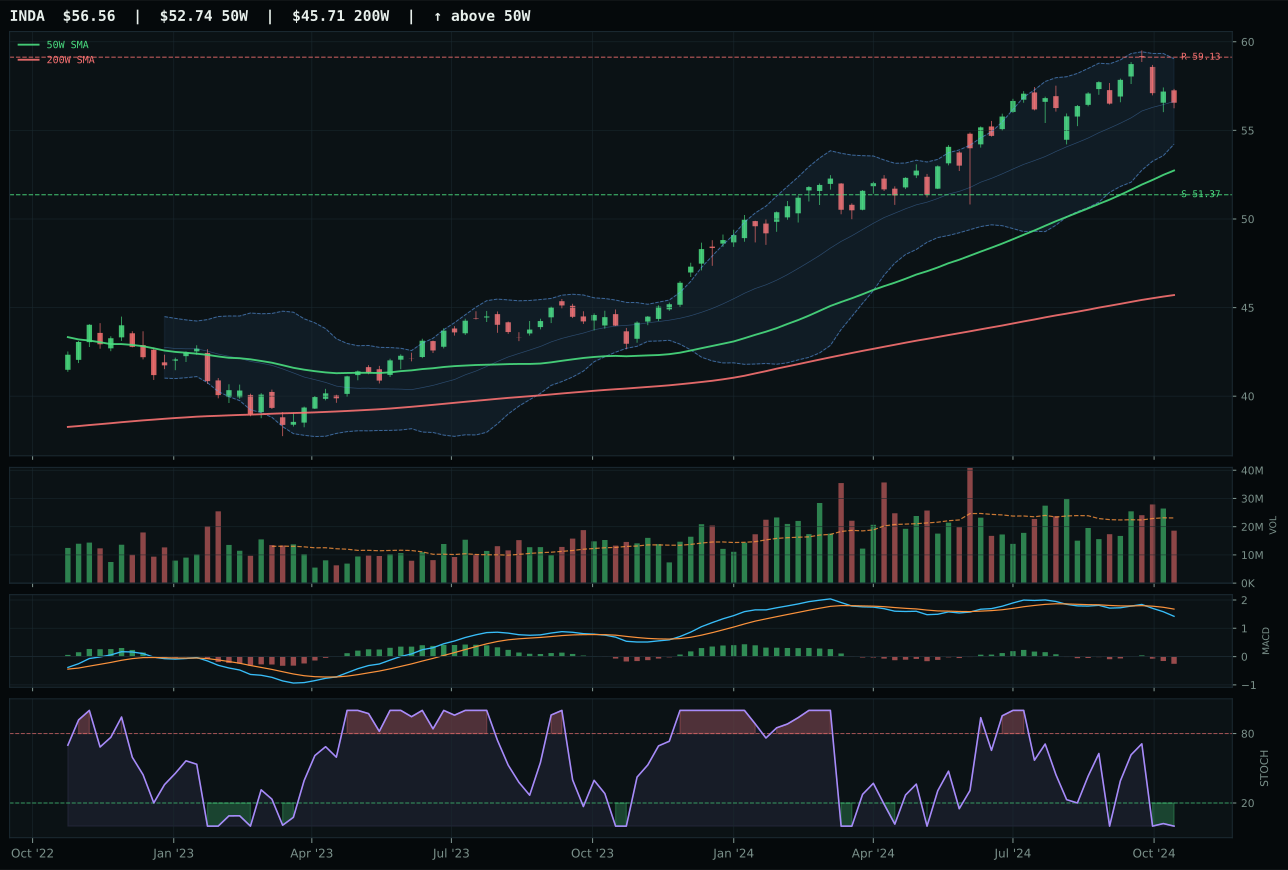
INDA has a neutral structure profile with -5.8% 13-week relative strength versus SPY.
A failed hold above support would weaken the setup.
Actionable but governed by invalidation levels.
IEMG dominated with a 34.2-point lead over ILF in a category so weak that the winner merely avoids catastrophe. IEMG's 90.5 trend score, neutral structure, and 85.9 momentum confirmation reflect a broad-based steadiness despite 0.4% SPY-relative flatness and 6.8% 13-week returns. ILF stumbled on all fronts: 30.0 trend score from price below the 200W, thin participation, bullish-but-flattening MACD, and -7.5% SPY-relative drag created a narrative of unraveling. IEMG's clean structure and category-relative outperformance (+6.2%) revealed that any internal strength flowed to broad exposure, not Latin America commodity bets.
Emerging Markets earned 0% allocation at 12.5 category score, ranked ninth or tenth and excluded entirely from the portfolio. Credit stress (-10) and liquidity stress (-10) attack emerging-market dependencies with full force in a disinflation regime; broad market bear (-9) adds structural headwinds. The 21.0 macro fit is catastrophically low, nearly as bad as energy, and IEMG's technical strength (80.7) cannot overcome regime incompatibility. This exclusion reflects portfolio structure, not chart weakness: emerging-market beta requires either currency stabilization, emerging-market central bank easing, or risk-appetite rebound—none of which are imminent. The opportunity exists if credit stress releases or if commodity breadth accelerates alongside metals scarcity narratives; however, until those conditions materialize, capital allocated to emerging markets is competing against higher-conviction real assets and defensives with superior regime alignment.
Traditional Energy — XLE
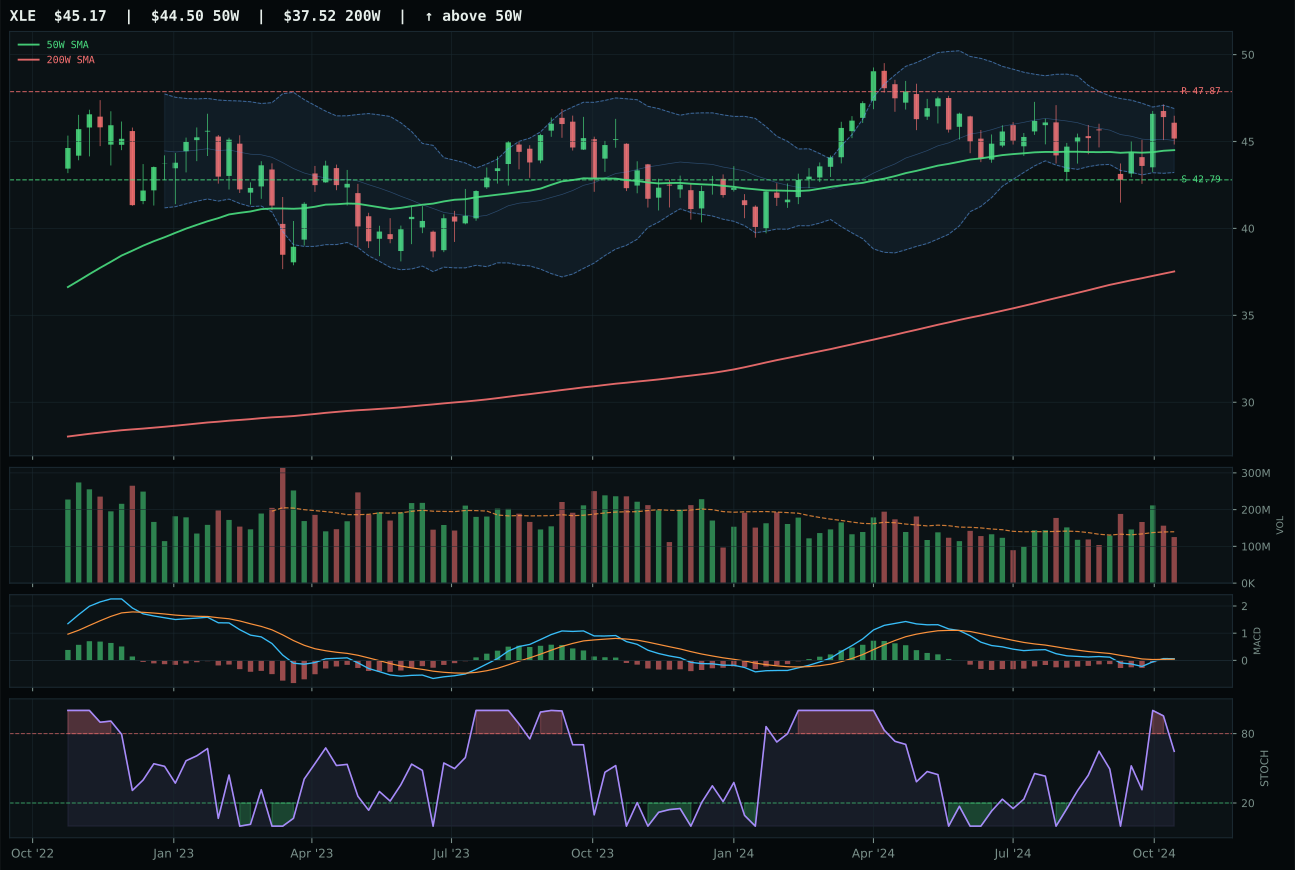
XLE has a compression near 50W profile with -8.7% 13-week relative strength versus SPY.
A failed hold above support would weaken the setup.
Actionable but governed by invalidation levels.
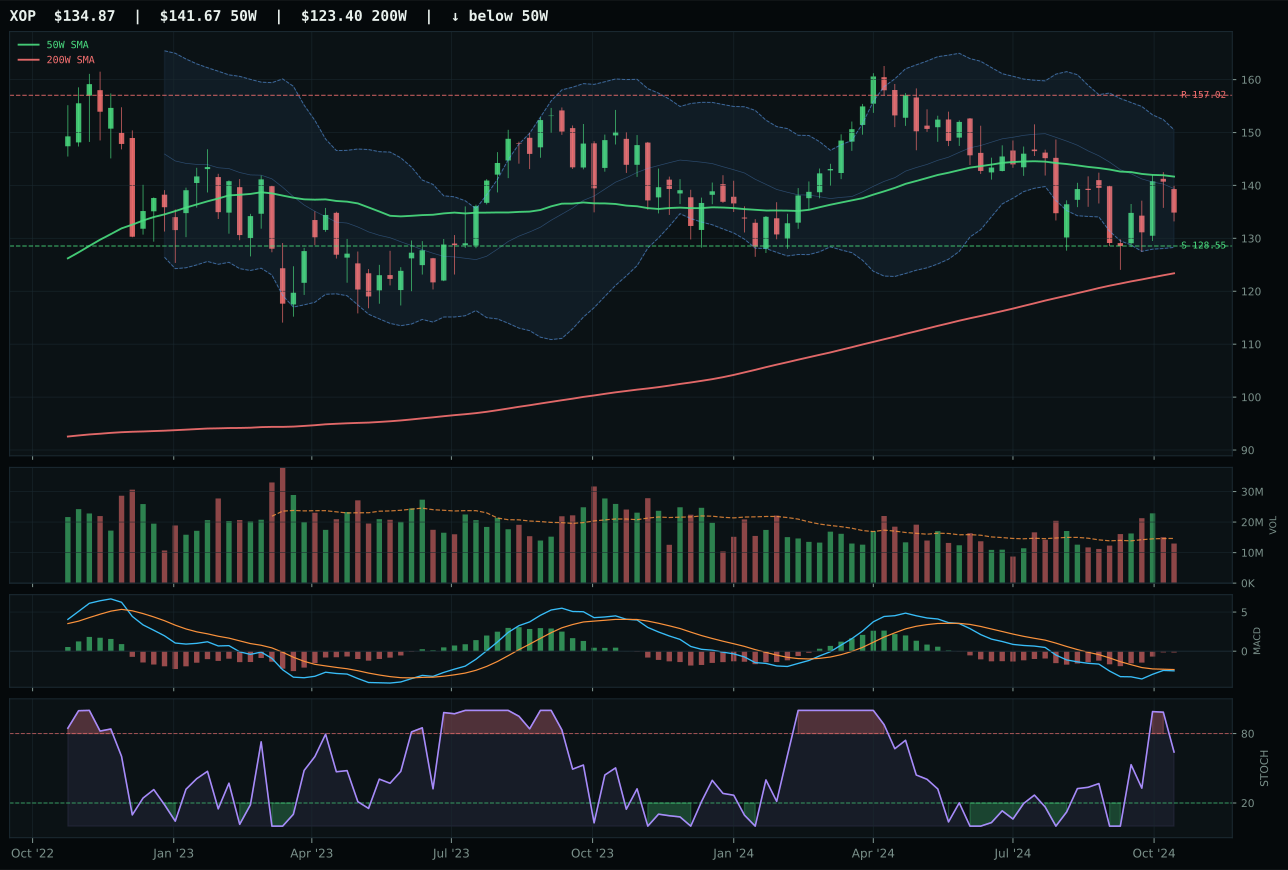
XOP has a pullback into support profile with -14.4% 13-week relative strength versus SPY.
A failed hold above support would weaken the setup.
Actionable but governed by invalidation levels.
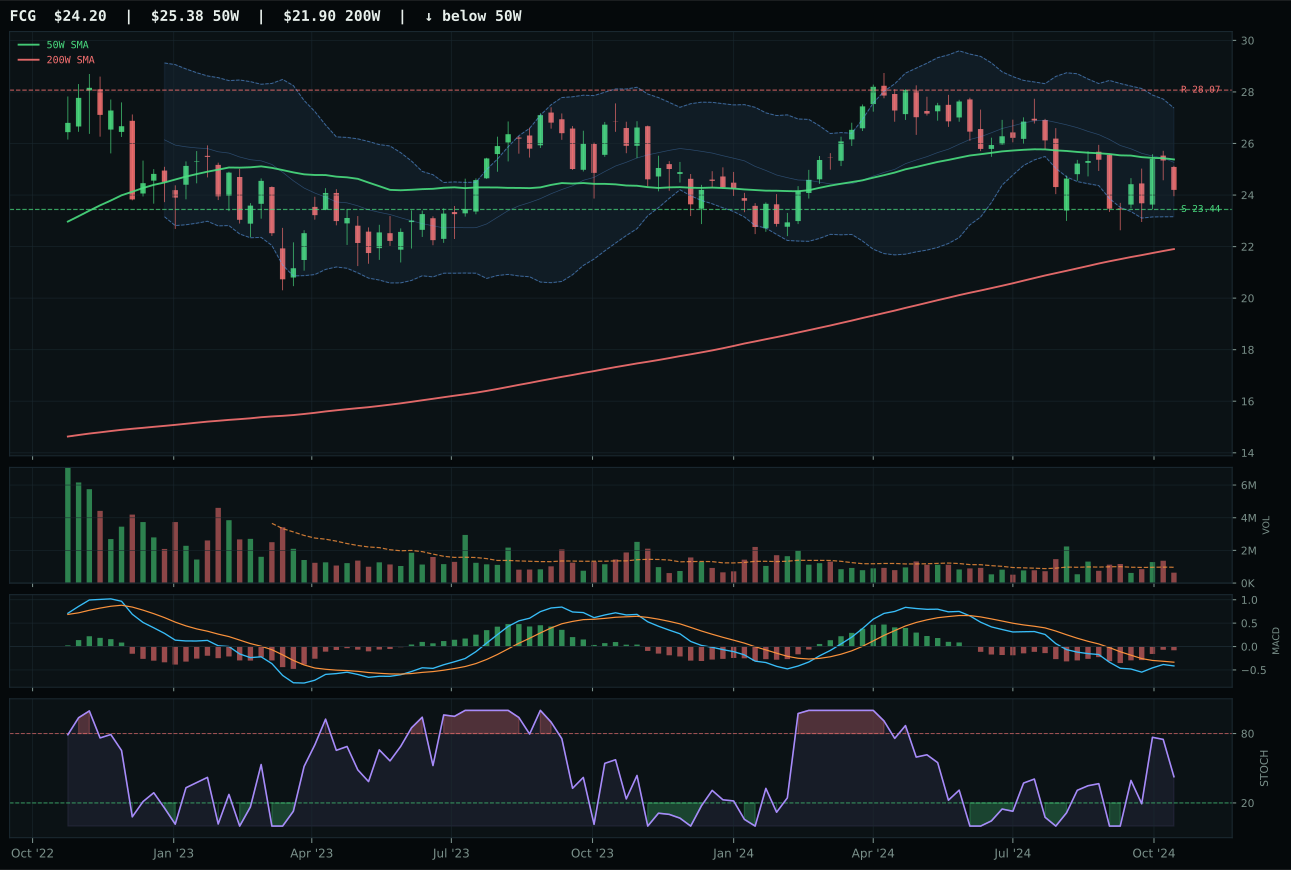
FCG has a pullback into support profile with -16.5% 13-week relative strength versus SPY.
A failed hold above support would weaken the setup.
Actionable but governed by invalidation levels.
XLE won by 9.9 points over XOP despite carrying -8.7% SPY-relative weakness, a margin that reveals how badly the entire energy complex has deteriorated. XLE's strength came from compression near the 50W (1.6% distance) with a 100.0 timing score and rising-mid-zone stochastic, creating a support-defense setup rather than a leadership pattern. Its trend score of 87.0 and neutral volume participation outpaced XOP's bearish MACD and pullback-into-support mechanics. This is not a win based on bullish conviction but on relative cleanliness in an excluded category; XLE simply offers the tightest setup for a potential reversal, should macro stress ease.
Traditional Energy earned 0% allocation, ranked outside the funded portfolio entirely at 9.3 category score—the lowest or tied-lowest ranking. Disinflation hurts energy structurally (-10), with disinflation pressure active (-10), credit stress active (-7), and liquidity stress active (-7) stacking headwinds despite real asset sponsorship (+7). The 23.0 macro fit is catastrophically low, reflecting the regime's incompatibility with fossil-fuel narratives. Even XLE's compression setup and 100.0 timing score cannot justify allocation when macro conditions are this adverse. This exclusion is deliberate and regime-justified: until either disinflation reverses or energy scarcity overrides price signals, capital remains locked in metals, defense, and infrastructure. Monitor for XLE approaching 50W support and RSI oversold conditions as a potential tactical entry point if broad market bear momentum exhausts.