
2024-10-11
Informational purposes only. The content in this report, including allocations, analysis, and commentary, is provided solely for informational and educational purposes. It does not constitute financial advice, investment advice, trading advice, or any other type of advice. Past performance does not guarantee future results. Always conduct your own research and consult a qualified financial professional before making investment decisions.
Weekly Allocation
| Ticker | Category | Weight | Role |
|---|---|---|---|
| FBTC | 50% | Overlay | |
| GLD | Precious Metals | 10% | Top-2 (10%) |
| PAVE | Utilities & Infrastructure | 10% | Top-2 (10%) |
| ITA | Defense & Aerospace | 5% | Tier-2 (5%) |
| COPX | Industrial Metals | 5% | Tier-2 (5%) |
| CIBR | Technology | 5% | Tier-2 (5%) |
| AIQ | AI | 5% | Tier-2 (5%) |
| URA | Nuclear Energy | 5% | Tier-2 (5%) |
| MOO | Agriculture & Livestock | 5% | Tier-2 (5%) |
Trade Instructions — Monday Open
Sell the tranche from 2024-09-13 (completing its 4-week hold). Buy the new tranche. Instructions show net portfolio changes — same-asset positions cancel, weight changes show the delta.
| Action | Ticker | Instruction |
|---|---|---|
| SELL | XLU | Sell 33% of XLU position (reduce 7.50% → 5.00%) |
| SELL | IGV | Sell 33% of IGV position (reduce 3.75% → 2.50%) |
| SELL | WEAT | Sell entire WEAT position (1.25% of portfolio) |
| SELL | NLR | Sell 33% of NLR position (reduce 3.75% → 2.50%) |
| SELL | BOTZ | Sell entire BOTZ position (1.25% of portfolio) |
| SELL | XLE | Sell entire XLE position (1.25% of portfolio) |
| BUY | COPX | Buy COPX — 14.29% of freed cash (adds 1.25% to portfolio) |
| BUY | AIQ | Buy AIQ — 14.29% of freed cash (adds 1.25% to portfolio) |
| BUY | PAVE | Buy PAVE — 28.57% of freed cash (adds 2.50% to portfolio) |
| BUY | URA | Buy URA — 14.29% of freed cash (adds 1.25% to portfolio) |
| BUY | MOO | Buy MOO — 14.29% of freed cash (adds 1.25% to portfolio) |
| BUY | CIBR | Buy CIBR — 14.29% of freed cash (adds 1.25% to portfolio) |
Current Portfolio After Trade
Combined holdings across all 4 active tranches. Each tranche is 25% of the portfolio.
| Ticker | % of Portfolio | Weight Bar |
|---|---|---|
| FBTC | 50.00% | |
| GLD | 10.00% | |
| XLU | 5.00% | |
| COPX | 5.00% | |
| PAVE | 5.00% | |
| ITA | 3.75% | |
| AIQ | 3.75% | |
| IGV | 2.50% | |
| NLR | 2.50% | |
| URA | 2.50% | |
| MOO | 2.50% | |
| INDA | 1.25% | |
| XAR | 1.25% | |
| IEMG | 1.25% | |
| XLK | 1.25% | |
| SMH | 1.25% | |
| CIBR | 1.25% |
Macro Regime — Disinflation
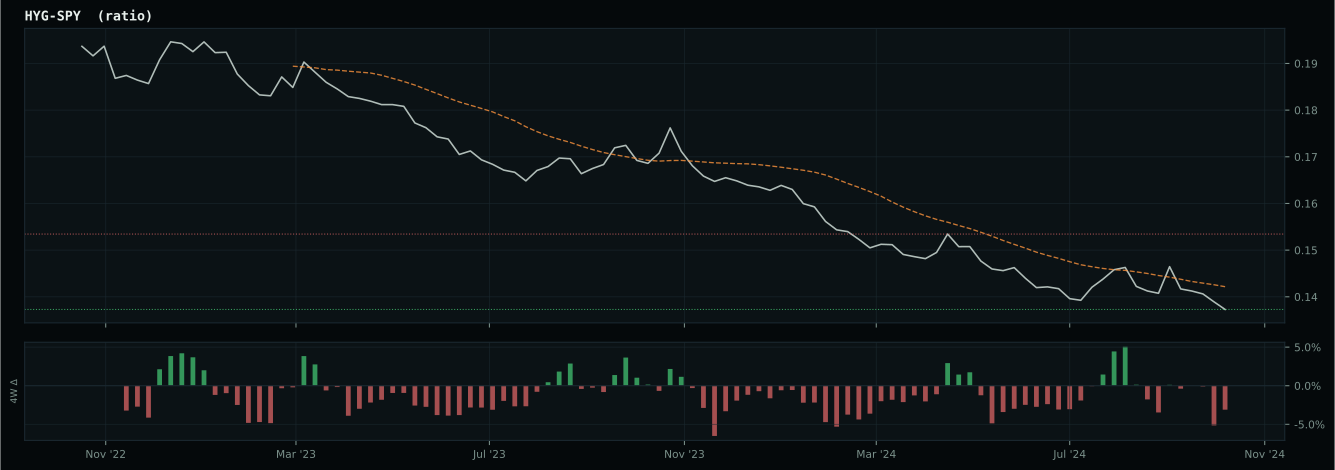
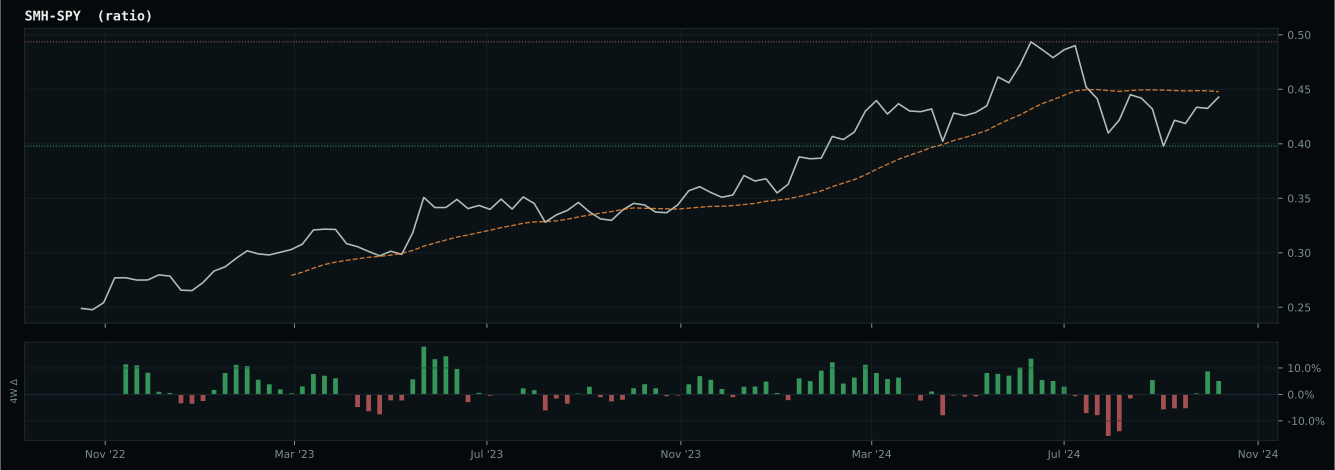
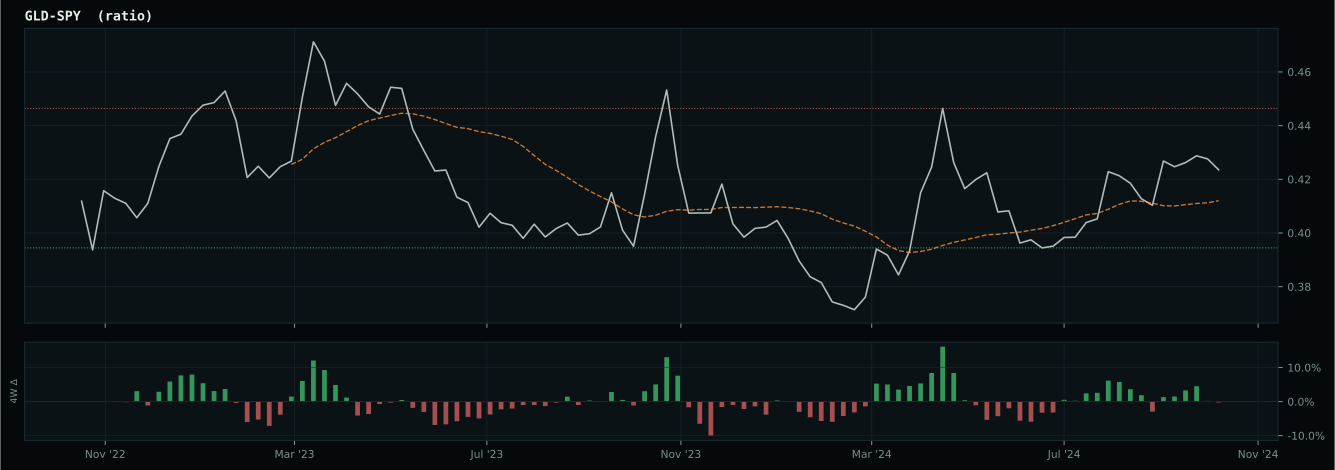
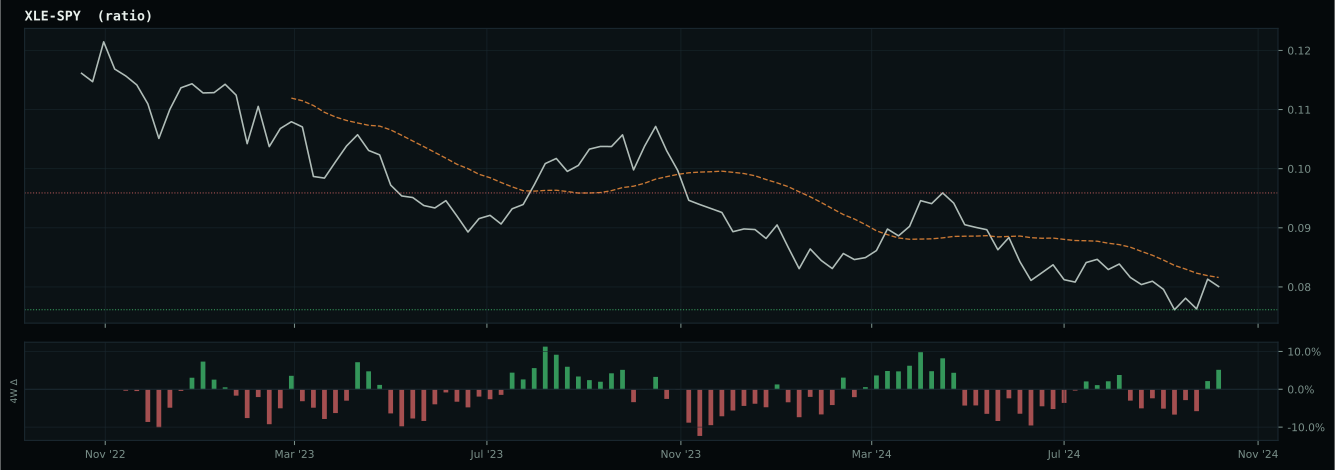
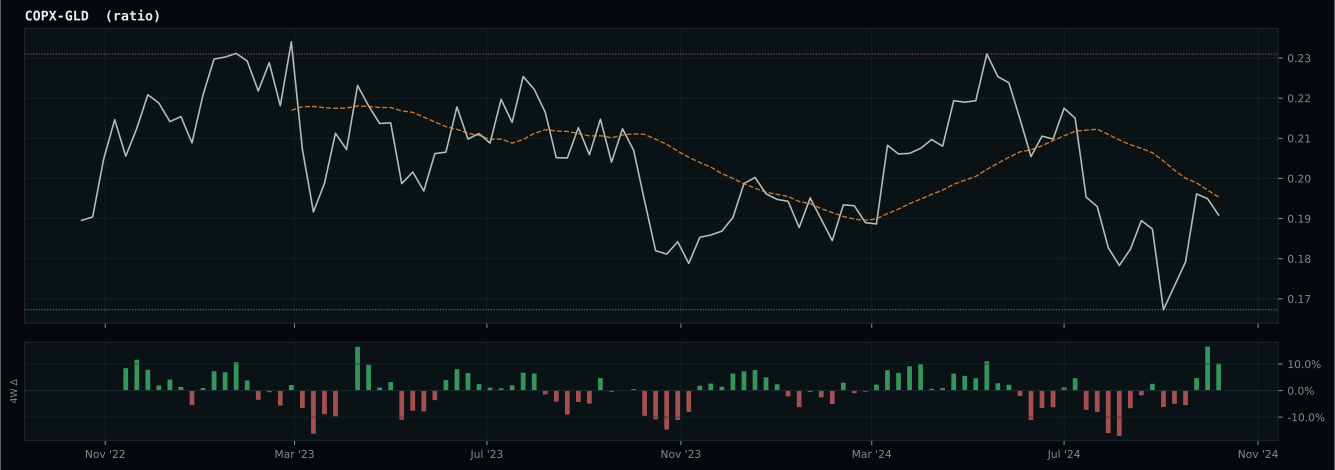
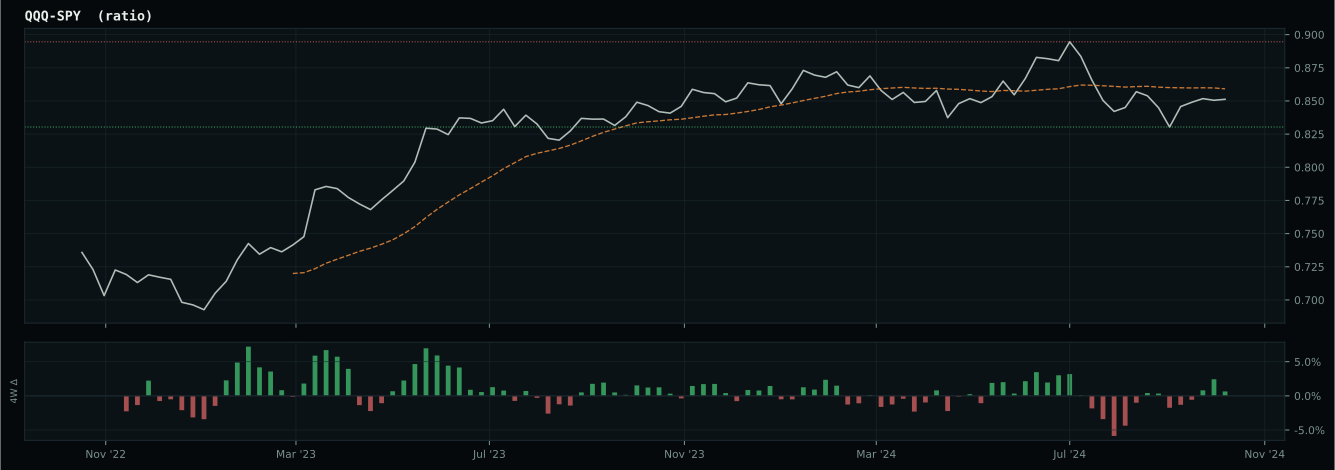
growth data is not confirming the weak market-implied risk appetite signal
Macro Evidence Charts
Market-implied signals behind the macro regime scores. Each ratio compares two assets; the direction and slope of the ratio is what the macro engine reads.
Crypto Regime — TrendBTC
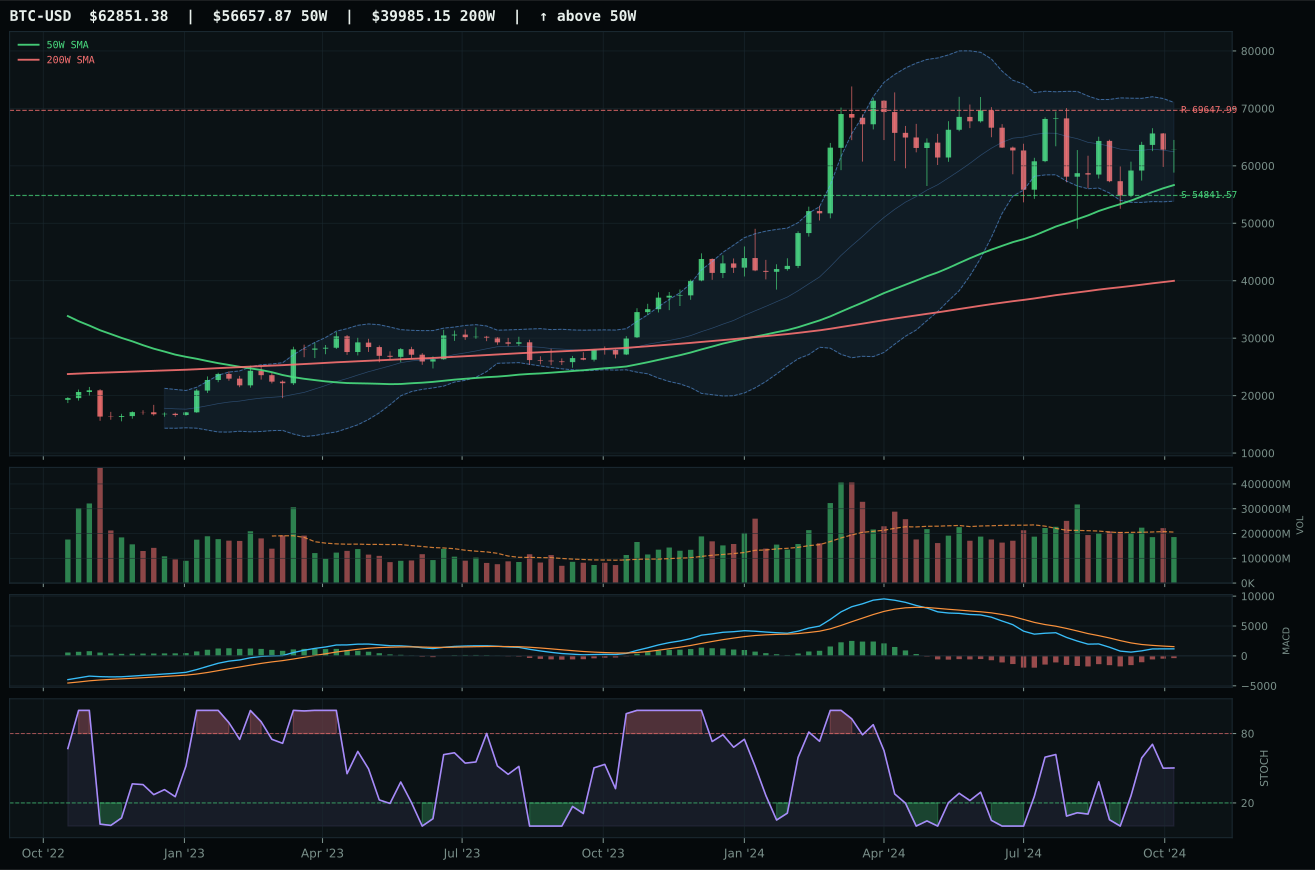
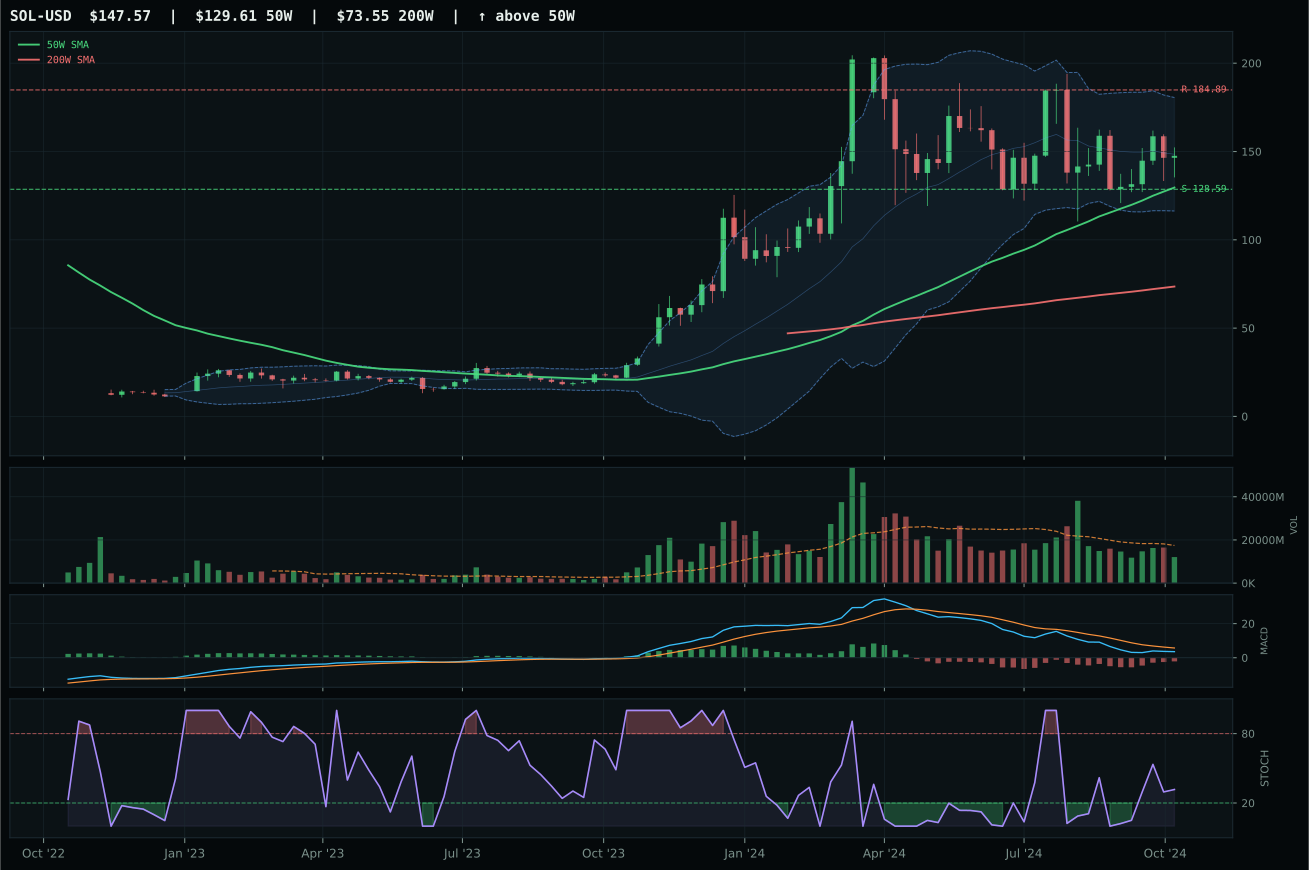
ValueBTC not armed: BTC has not made the first post-breakdown touch of the 200W buy zone after losing the 50W
TrendBTC confirmed: 2 consecutive closes above rising/flat 50W SMA
one or more available conditions failed
Category Rankings
| Rank | Category | Winner | Score | Alloc | 4W Ret | Peers (4W) |
|---|---|---|---|---|---|---|
| 1 | Precious Metals | GLD | 77.7 | 20% | -0.99% | SLV -1.8% · GDX -6.3% |
| 2 | Utilities & Infrastructure | PAVE | 73.3 | 20% | +8.73% | XLU -0.2% · IGF -0.2% |
| 3 | Defense & Aerospace | ITA | 66.5 | 10% | +2.74% | XAR +6.3% · ROKT +8.4% |
| 4 | Industrial Metals | COPX | 61.4 | 10% | -4.60% | PICK -2.2% · REMX +1.1% |
| 5 | Technology | CIBR | 57.2 | 10% | +1.83% | IGV +9.6% · XLK +2.1% |
| 6 | AI | AIQ | 43.2 | 10% | +2.37% | BOTZ +4.9% · SMH -0.2% |
| 7 | Nuclear Energy | URA | 36.2 | 10% | +3.33% | NLR +5.4% · URNM -2.5% |
| 8 | Agriculture & Livestock | MOO | 32.6 | 10% | -3.60% | VEGI -2.3% · WEAT -6.0% |
| 9 | Traditional Energy | XLE | 22.5 | 0% | +1.75% | FCG -0.1% · XOP +0.6% |
| 10 | Emerging Markets | IEMG | 15.1 | 0% | -3.40% | ILF -4.3% · INDA -4.9% |
Precious Metals — GLD
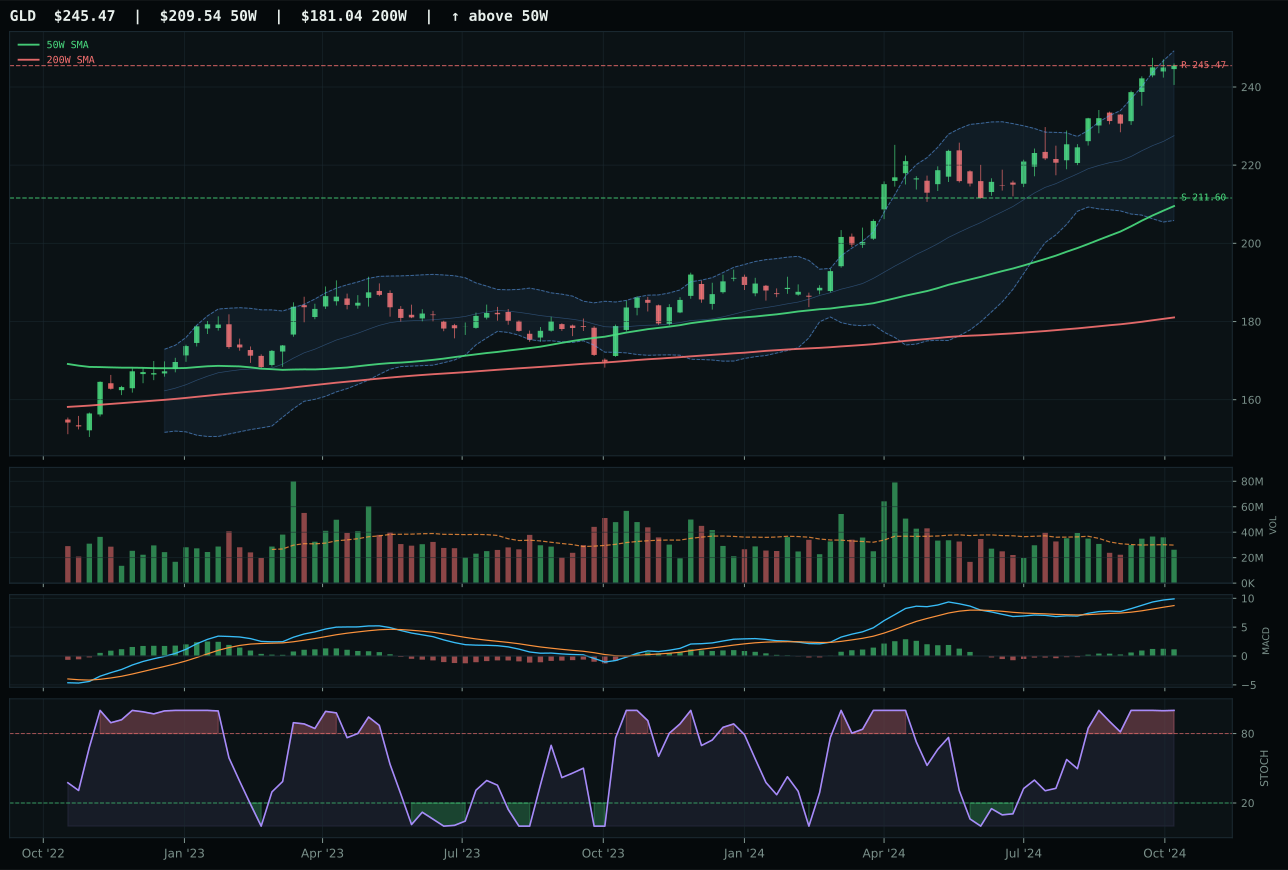
GLD has a vertical extension profile with 6.5% 13-week relative strength versus SPY.
A failed hold above support would weaken the setup.
Actionable but governed by invalidation levels.
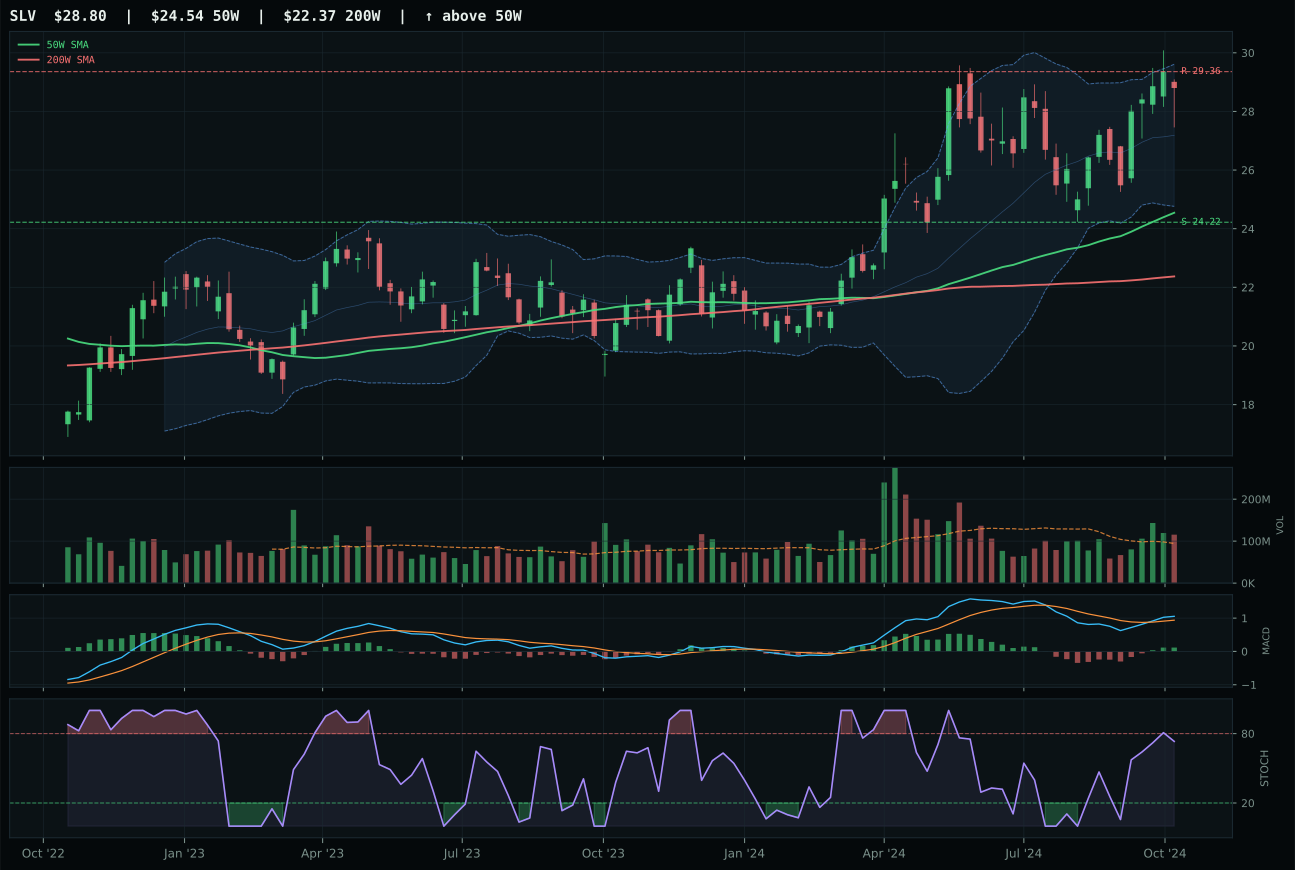
SLV has a vertical extension profile with -1.1% 13-week relative strength versus SPY.
A failed hold above support would weaken the setup.
Actionable but governed by invalidation levels.
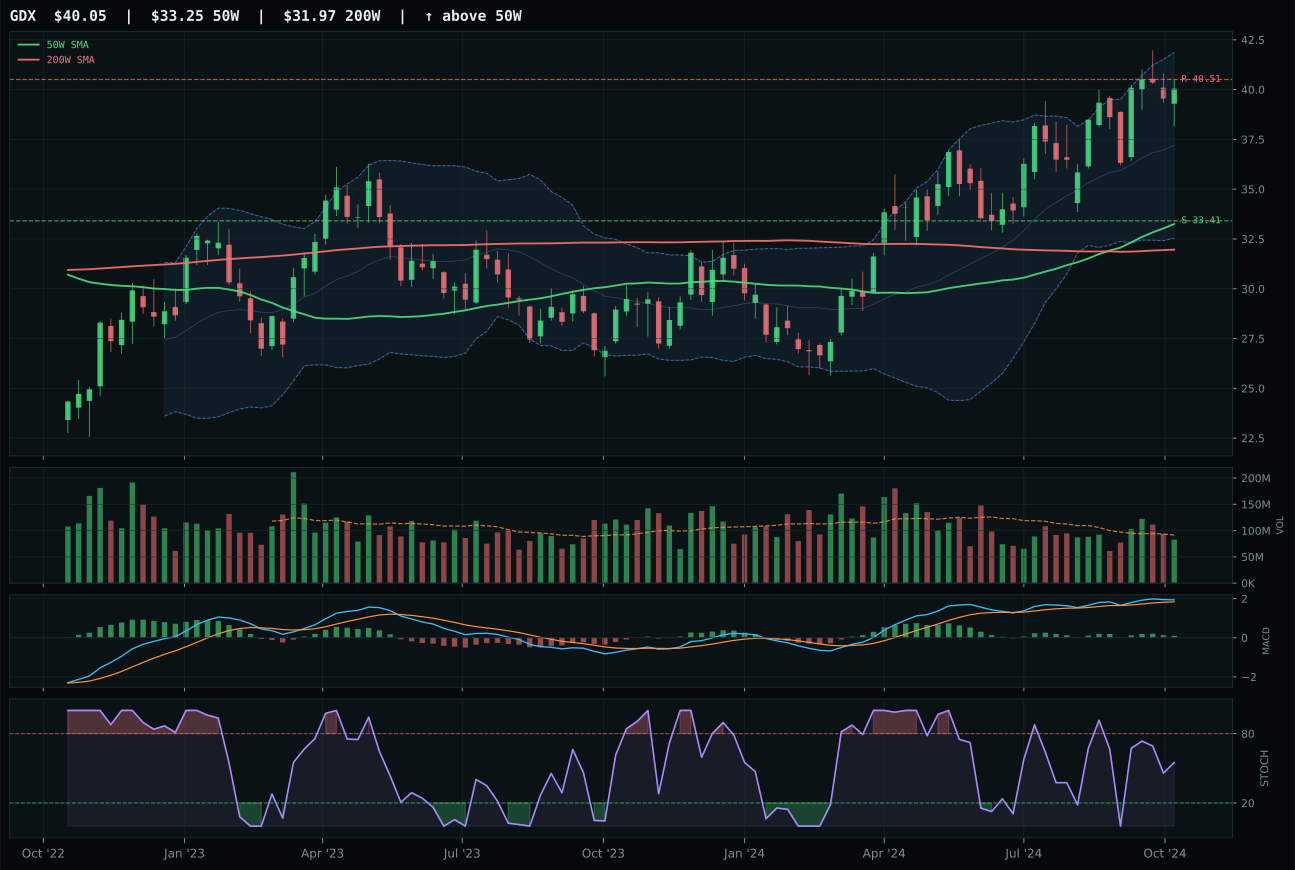
GDX has a vertical extension profile with 1.4% 13-week relative strength versus SPY.
A failed hold above support would weaken the setup.
Actionable but governed by invalidation levels.
GLD claims the top-2 position with 77.7 category score by delivering perfect 100/100 trend and 94.9/100 momentum confirmation despite the punitive 37.0/100 timing score that reflects 17.1% extension above the 50-week moving average. The 10.0% 13-week return and 6.5% RS versus SPY are institutional-grade outperformance, and the 5.1% category-relative strength advantage over SLV is decisive. SLV shows superior technical evidence (80.6 vs 73.3) with above-average volume participation and rising mid-zone stochastic RSI, but it contributes -2.5% category-relative strength, meaning gold is winning the fight for emerging-market money flows and central bank allocation. The monetary hedge bid is the critical macro driver here: +14 points of active descriptor strength specifically benefit gold's purity narrative over silver's industrial beta. Entry risk at 17.1% extension is genuine, but momentum confirmation and category dominance make GLD the category representative.
Precious Metals earn 10% as a top-2 overweight because the 85.0/100 macro fit is exceptional in this disinflation regime. Monetary hedge bid alone contributes +14, defensive rotation contributes +7, and disinflation pressure contributes +6, creating a +27 macro buffer that overwhelms any negative from credit stress or liquidity pressure. The 77.7 category score ranks directly behind Utilities & Infrastructure at 73.3 (which benefits from explicit capex and rate-hedging macro), placing gold second among all portfolio categories. GLD at 17.1% extension trades entry risk for maximum conviction in what the system views as the best macro-adjusted opportunity outside utilities. The 10% weight reflects the portfolio's positioning that central bank purchases, real rates, and flight-to-safety dynamics are more powerful macro drivers than disinflation concerns. This is the single largest category conviction after the 50% crypto overlay dominance.
Utilities & Infrastructure — PAVE
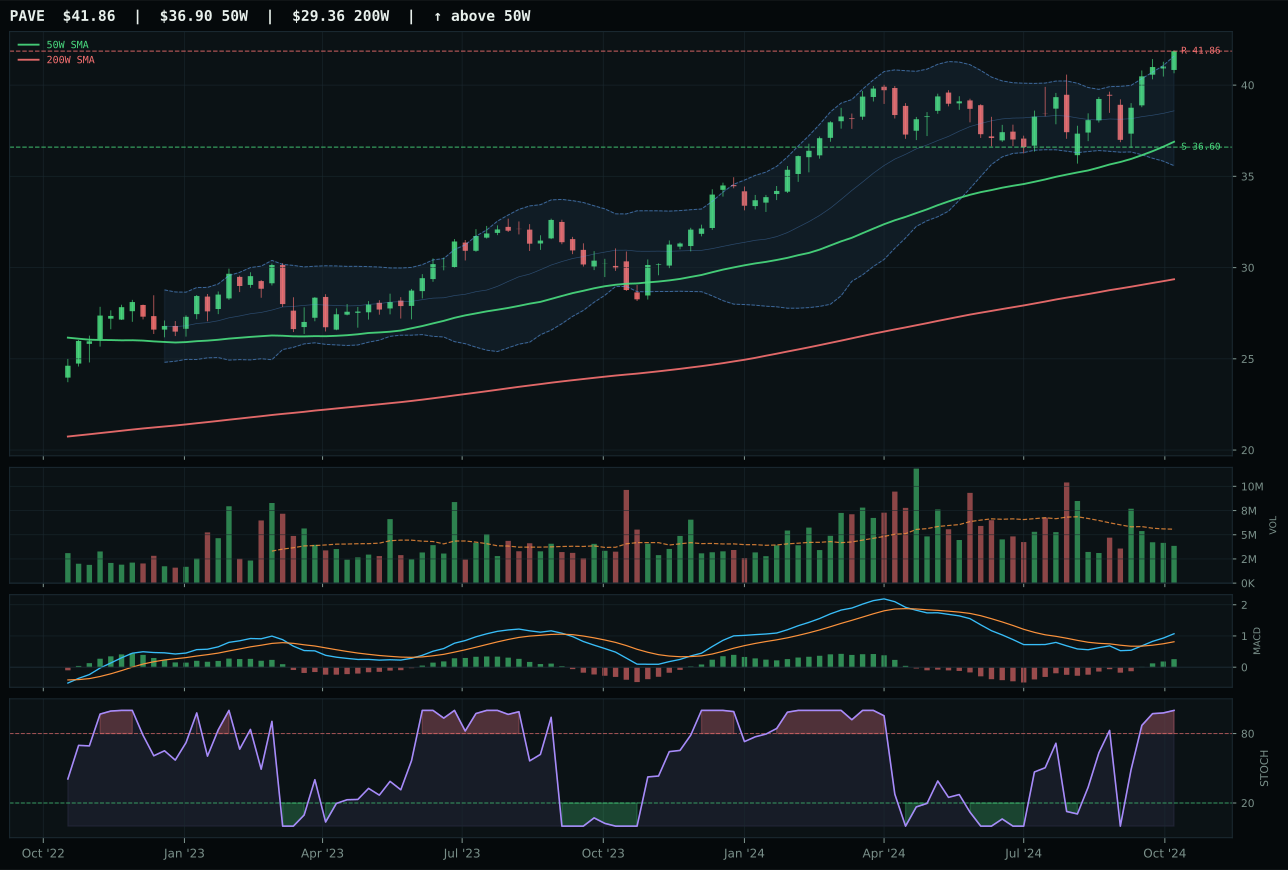
PAVE has a neutral structure profile with 5.9% 13-week relative strength versus SPY.
A failed hold above support would weaken the setup.
Actionable but governed by invalidation levels.
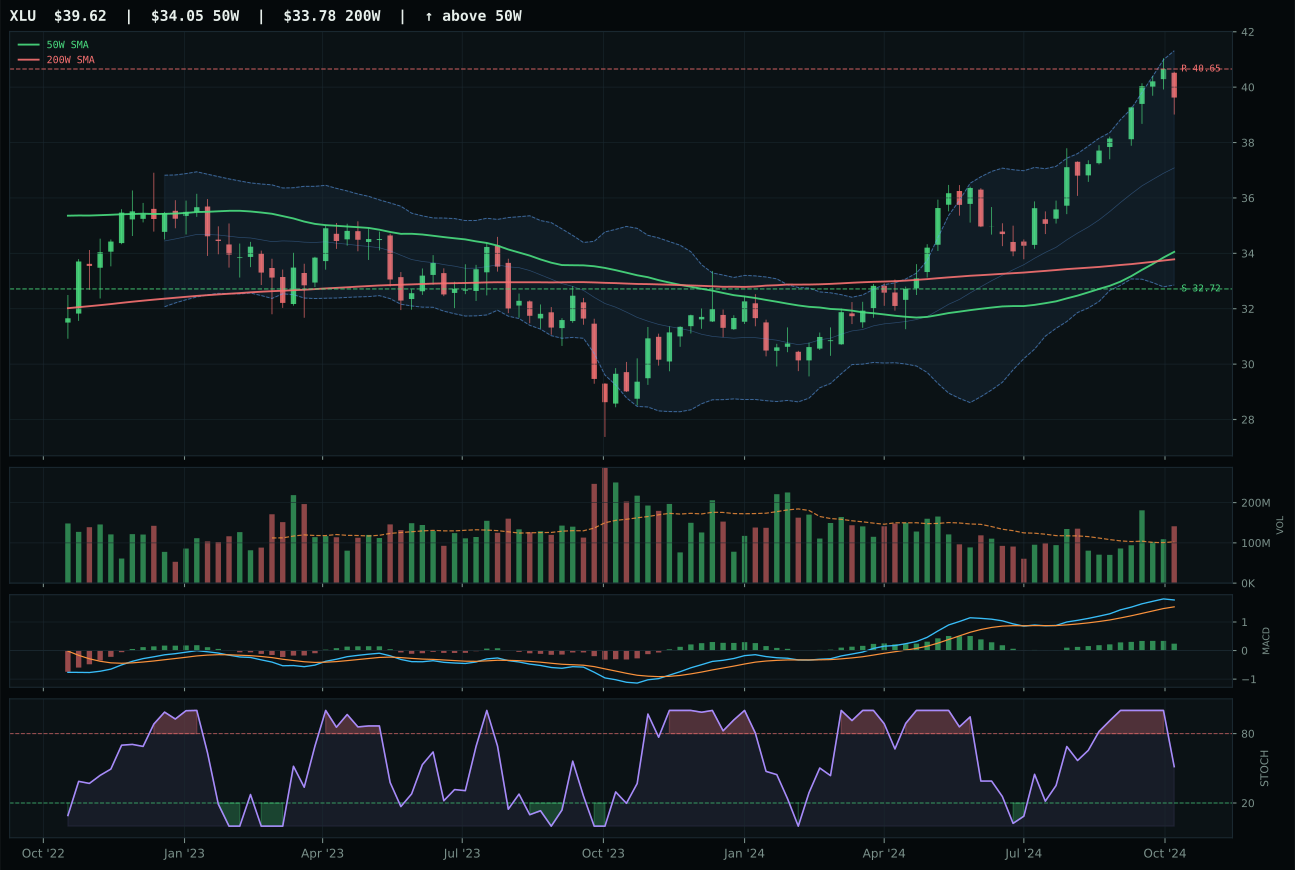
XLU has a vertical extension profile with 7.7% 13-week relative strength versus SPY.
A failed hold above support would weaken the setup.
Actionable but governed by invalidation levels.
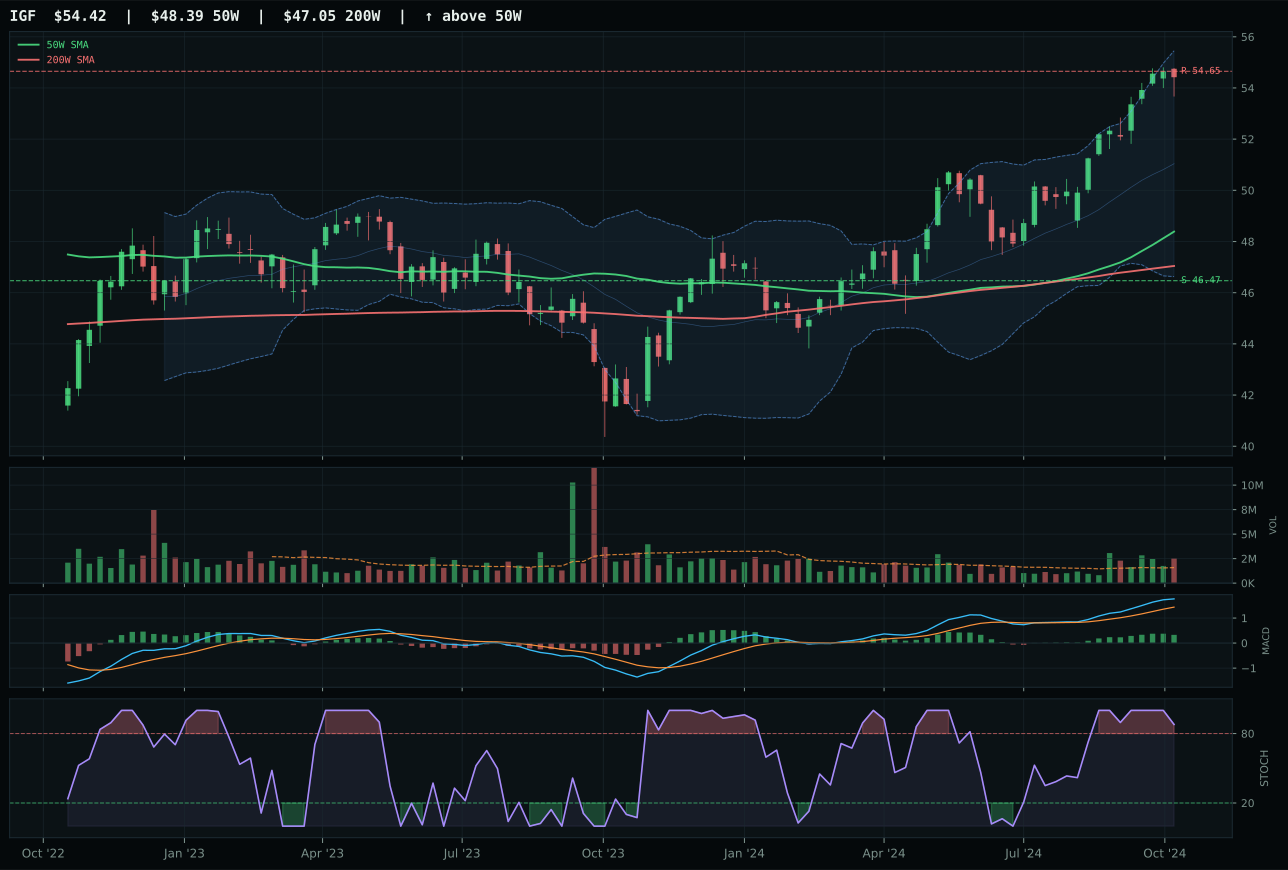
IGF has a neutral structure profile with 5.0% 13-week relative strength versus SPY.
A failed hold above support would weaken the setup.
Actionable but governed by invalidation levels.
PAVE claims the top-2 position with 73.3 category score by delivering perfect 100/100 trend and 89.8/100 momentum confirmation despite a weak 59.0/100 timing score that reflects 13.5% extension above the 50-week moving average. The 9.4% 13-week return and 5.9% RS versus SPY demonstrate genuine institutional sponsorship, and price sits in the sweet Fibonacci 0.236 extension zone near resistance but with room to run if buyers defend the level. XLU shows superior technical evidence (72.7 vs 71.7) and stronger macro fit (72.0 vs 43.0) with explicit defensive rotation (+12) and disinflation tailwinds (+6), but it suffers from vertical extension setup, bullish but flattening MACD, and falling/neutral stochastic RSI—all signs of momentum exhaustion despite the best-in-category macro story. PAVE's 0.0% category-relative strength versus XLU's 1.8% should favor XLU, but the neutral structure and bullish improving MACD give PAVE the momentum edge, and the representative decision rule reflects that infrastructure capex participation is winning over regulated utility dividend defense.
Utilities & Infrastructure earn 10% as a top-2 overweight because the 80.0/100 macro fit is exceptional and second only to Precious Metals in category-level macro support. Defensive rotation contributes +12, disinflation helps the category +7, and disinflation pressure adds another +6, creating a +25 macro tailwind that is specific to hard-asset rate hedges and inflation-protected capex. The 73.3 final category score ranks it second among all categories, behind only Precious Metals, and reflects the portfolio's positioning that infrastructure capex demand driven by energy transition, climate adaptation, and geopolitical decoupling will outperform in a disinflation regime. PAVE's thin 0.69x volume is the only material technical concern, but the perfect trend score and strong momentum confirmation override it. The 10% allocation places utilities as the second-largest category conviction after Precious Metals, signaling that the system expects rate cuts to benefit long-duration assets while capex stimulus sustains growth.
Defense & Aerospace — ITA
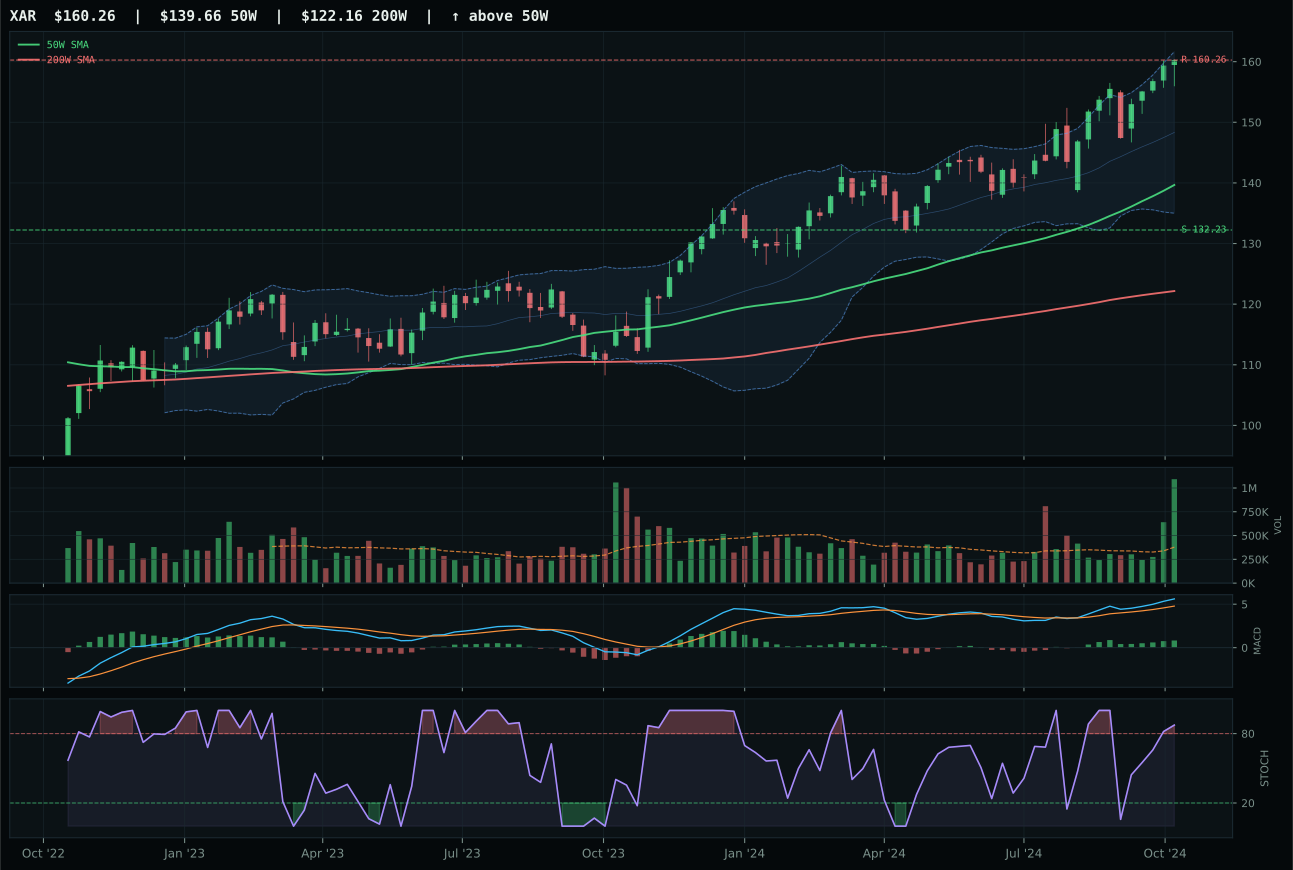
XAR has a neutral structure profile with 8.0% 13-week relative strength versus SPY.
A failed hold above support would weaken the setup.
Actionable but governed by invalidation levels.
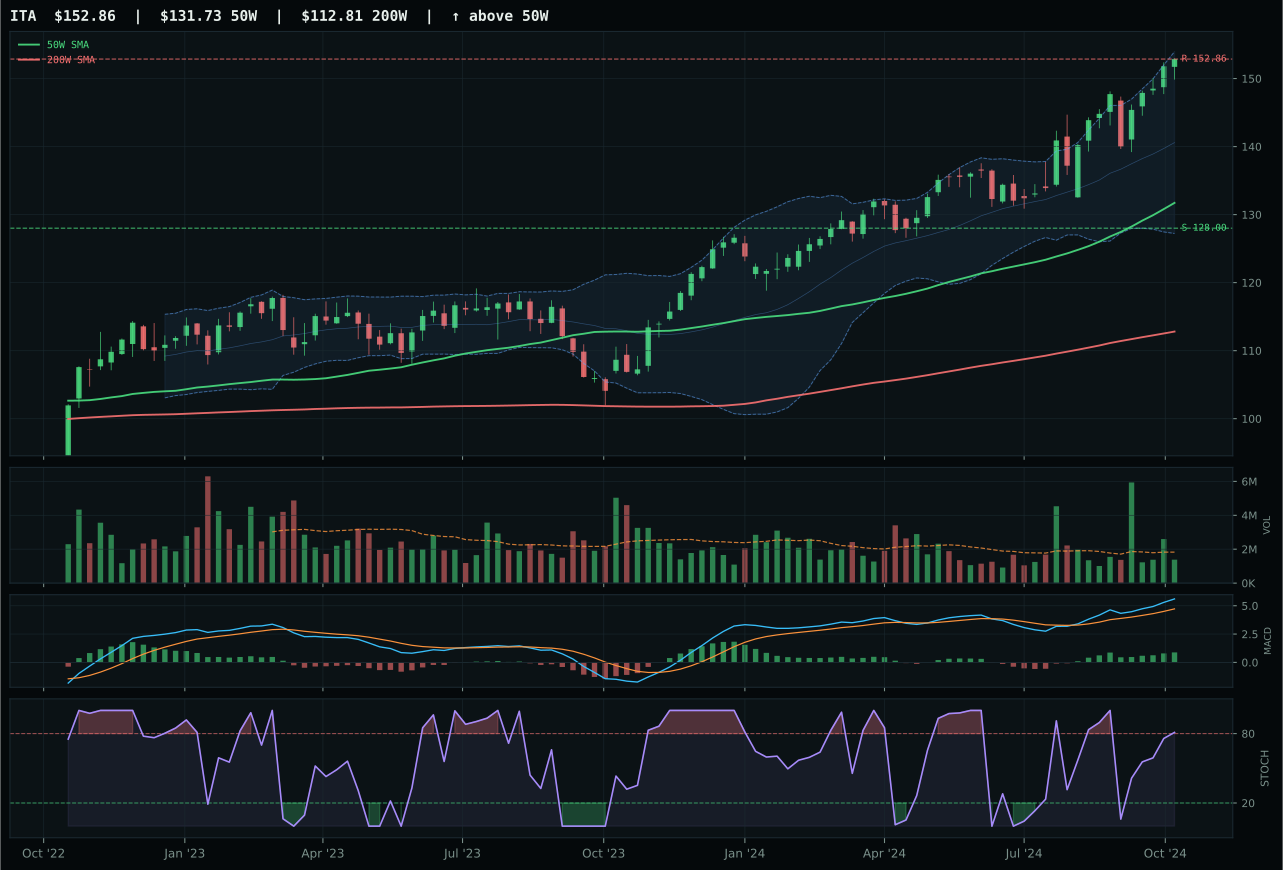
ITA has a vertical extension profile with 11.3% 13-week relative strength versus SPY.
A failed hold above support would weaken the setup.
Actionable but governed by invalidation levels.
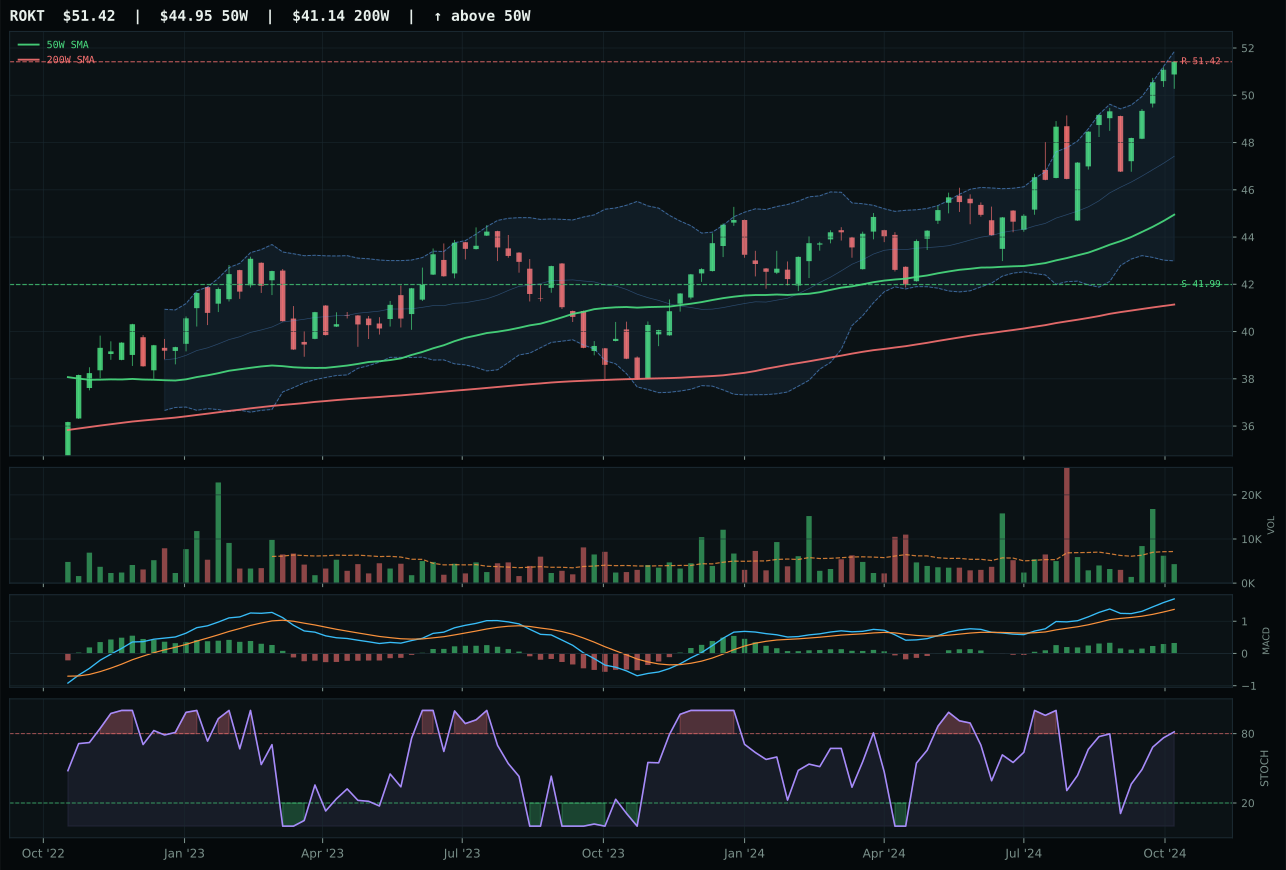
ROKT has a neutral structure profile with 7.0% 13-week relative strength versus SPY.
A failed hold above support would weaken the setup.
Tracked, but not top-2 eligible because: .
ITA wins the category with 100/100 trend and 100/100 momentum confirmation despite a punishing 37.0/100 timing score that reflects its 16.0% extension above the 50-week moving average. The 14.8% 13-week return and 11.3% RS versus SPY are genuine outperformance metrics, but entry risk is real: with price at resistance and upside to further gains now 0.0%, the risk-reward sits at 44.4/100. XAR offers superior technical evidence (98.5 vs 75.4) with better structure and neutral setup versus ITA's vertical extension, yet XAR loses because it contributes 0.0% category-relative strength while ITA shows 3.3% intra-basket outperformance. Neutral volume (0.76x) on ITA versus strong accumulation/confirmation on XAR should favor XAR, but the representative decision rule prioritizes category-relative strength as the tiebreaker when trend and momentum are both strong. This is a case where the best setup loses to better relative positioning.
Defense & Aerospace earns 5% as a tier-2 position, held steady by a robust 63.0/100 macro fit in a disinflation regime where defensive rotation and broad market bear are both active. Defensive rotation alone adds +8, broad market bear adds +6, and credit stress adds +2, creating a +16 macro buffer that keeps the category eligible despite disinflation pressure's typical headwind (-6). The 66.5 category score ranks it below the top two (GLD at 77.7 and PAVE at 73.3) because Precious Metals offers both stronger technicals and equally strong macro tailwinds, while Utilities & Infrastructure combines excellent technicals with explicit inflation/rate protection. Defense is a quality beneficiary of risk-off conditions, but it offers less duration hedge value than gold and less direct growth correlation than infrastructure capex. The 5% allocation reflects the portfolio's recognition that defensive equity matters in mixed macro, just not as much as monetary hedges and hard-asset infrastructure.
Industrial Metals — COPX
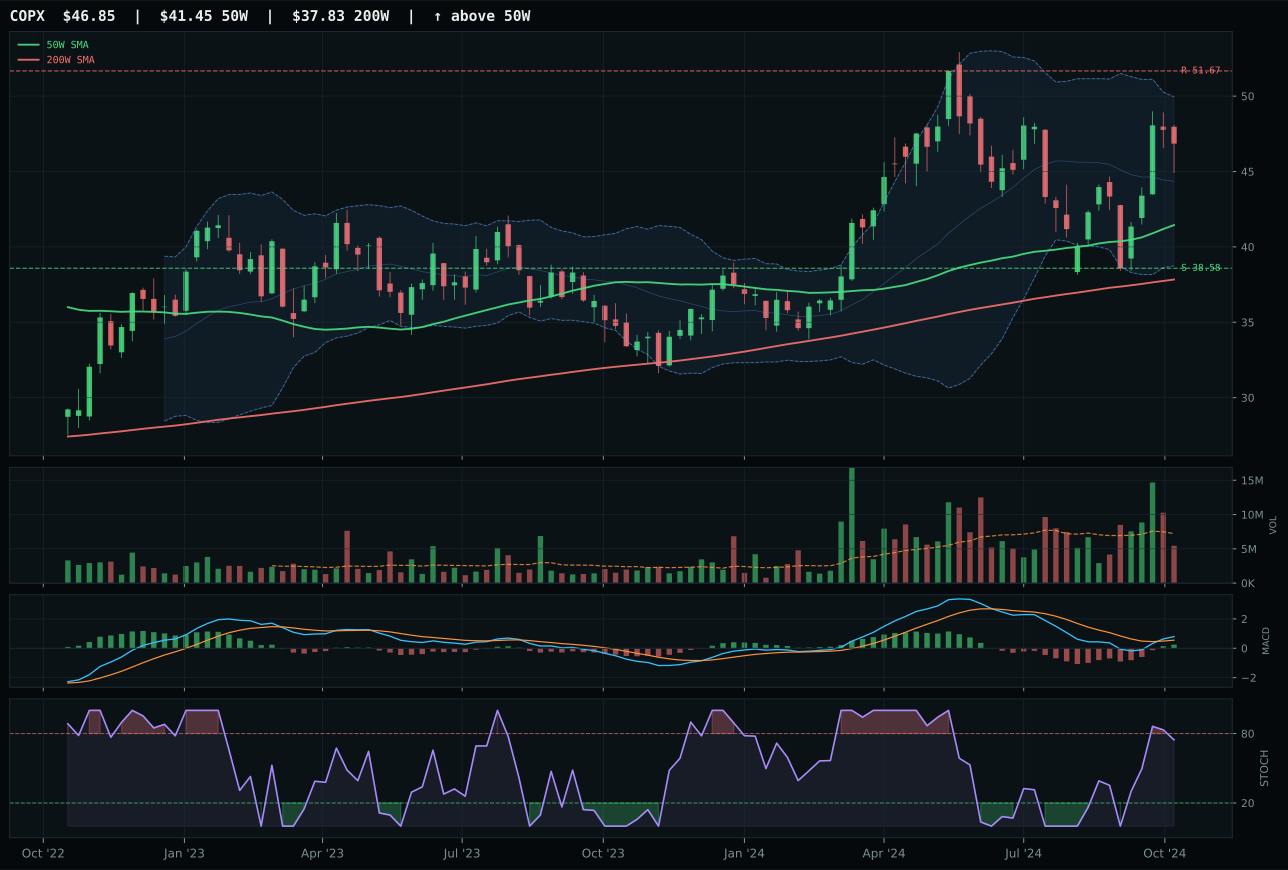
COPX has a neutral structure profile with -5.8% 13-week relative strength versus SPY.
A failed hold above support would weaken the setup.
Actionable but governed by invalidation levels.
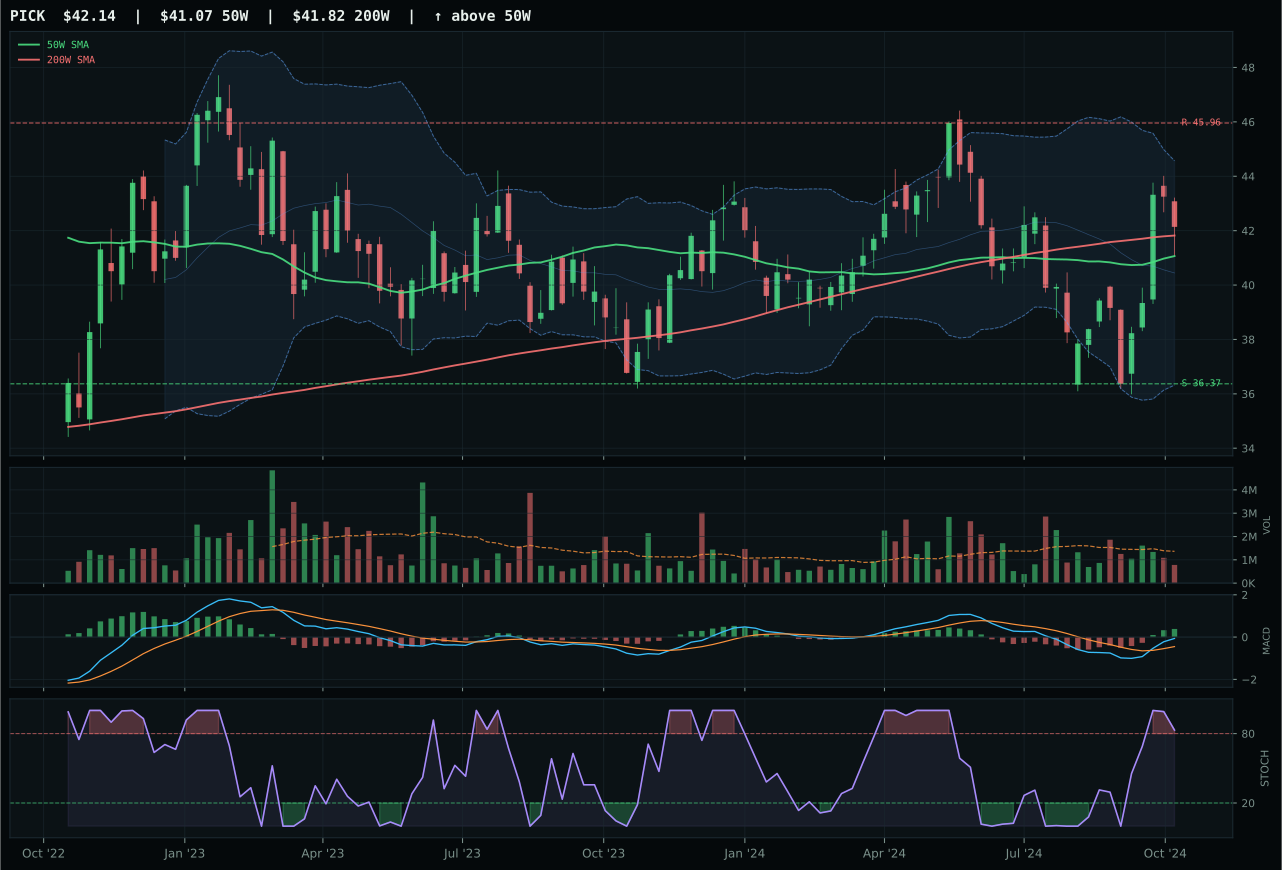
PICK has a compression near 50W profile with -4.3% 13-week relative strength versus SPY.
A failed hold above support would weaken the setup.
Actionable but governed by invalidation levels.
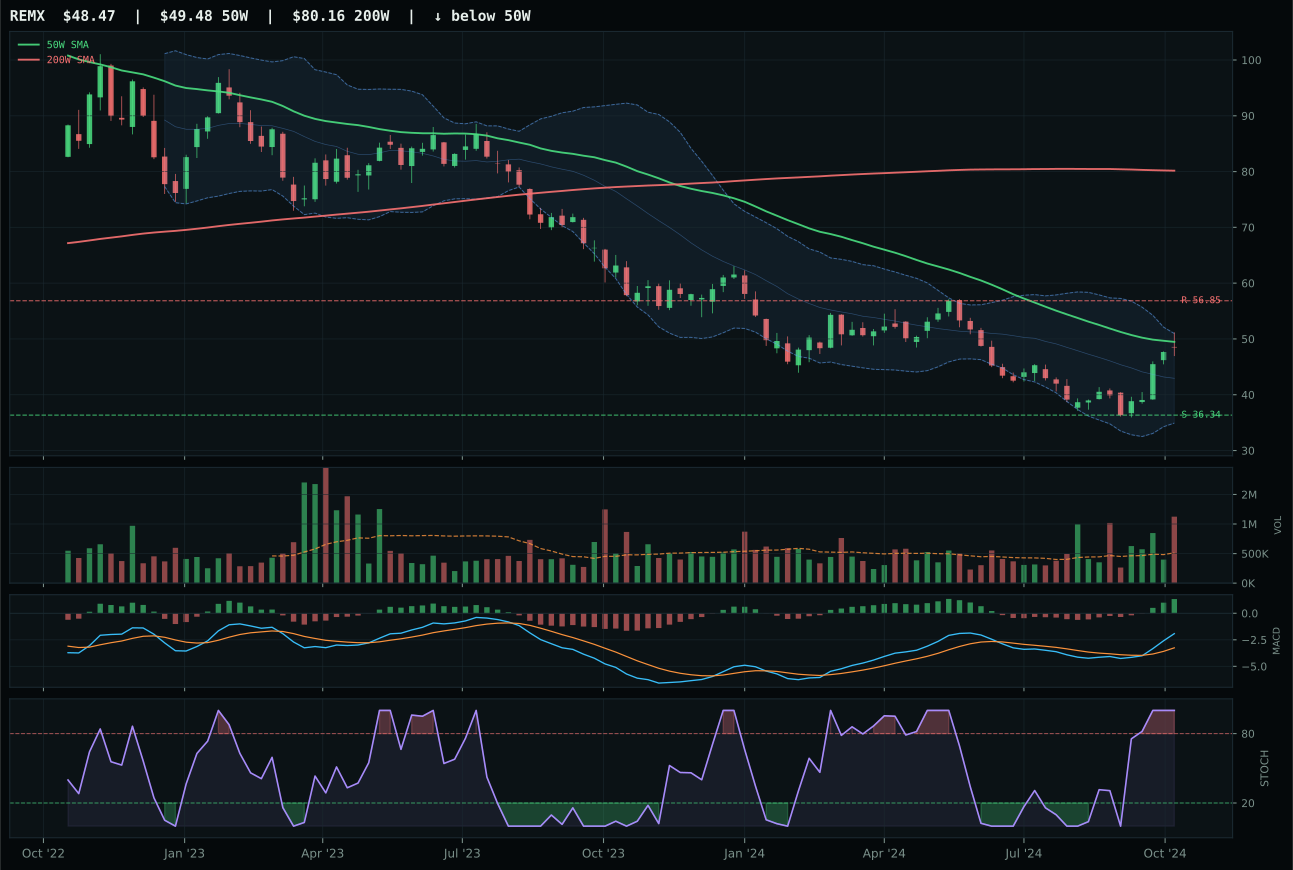
REMX has a compression near 50W profile with 3.5% 13-week relative strength versus SPY.
Extension and support failure are the main tactical risks.
Tracked, but not top-2 eligible because: structurally broken.
COPX wins narrowly over PICK despite PICK's superior composite score (85 vs 75) because COPX delivers 83.0/100 timing with rising mid-zone stochastic RSI while PICK sits overbought at 1.00, and COPX's neutral volume profile beats PICK's thin participation. The 13.0% distance from the 50-week moving average positions COPX in the sweet spot of the Fibonacci upper retracement zone, offering expansion potential without the exhaustion risk of PICK's overbought setup. PICK shows cleaner structure and better risk-reward (62 vs 53), but when both MACD confirms bullish, relative strength becomes the tie-breaker: COPX's -1.5% category-relative strength edges PICK's 0.0%. The -2.3% 13-week return on COPX is concerning, but the 13.3% 4-week return shows recent accumulation has reversed the short-term weakness. This is a timing-driven narrow win, not a conviction statement.
Industrial Metals receive 5% allocation as a tier-2 position, supported by the strongest macro fit (65.0/100) outside the top two categories thanks to +14 metals scarcity, +10 commodity breadth positive, and +6 real asset sponsorship active descriptors. These macro tailwinds offset -8 liquidity stress and -7 credit stress, netting a +15 tailwind specific to industrial metals scarcity narratives. The 61.4 final category score trails both Precious Metals and Utilities & Infrastructure, placing it tier-2, but the macro case is material: copper scarcity, EV battery demand, and energy transition capex are structural. COPX's -5.8% SPY underperformance is the core issue; the category struggles to attract new buyers despite favorable macro conditions. The 5% allocation is macro-driven insurance on metals scarcity, not technicals-driven conviction. Upgrades to relative strength or volume confirmation would elevate this to higher tiers.
Technology — CIBR
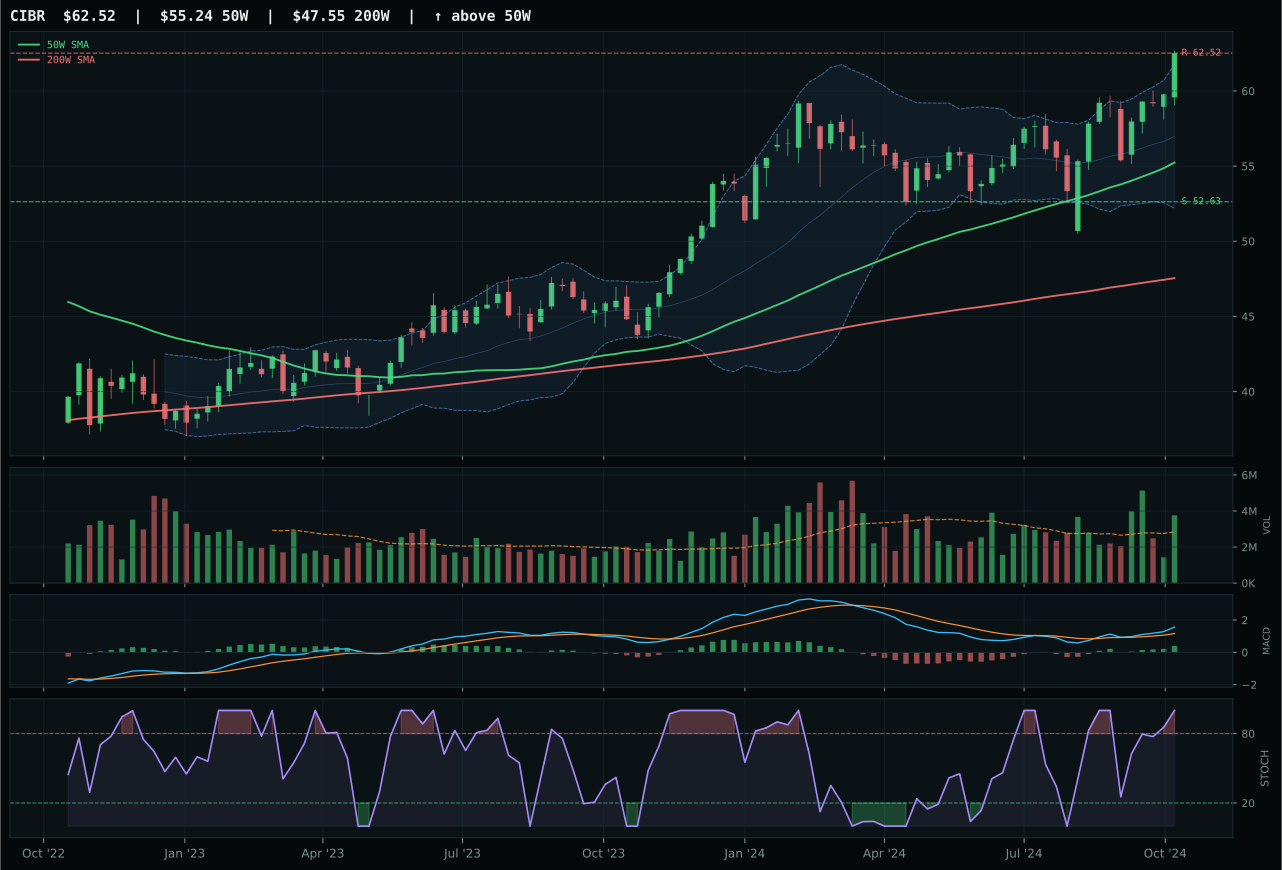
CIBR has a neutral structure profile with 4.9% 13-week relative strength versus SPY.
A failed hold above support would weaken the setup.
Actionable but governed by invalidation levels.
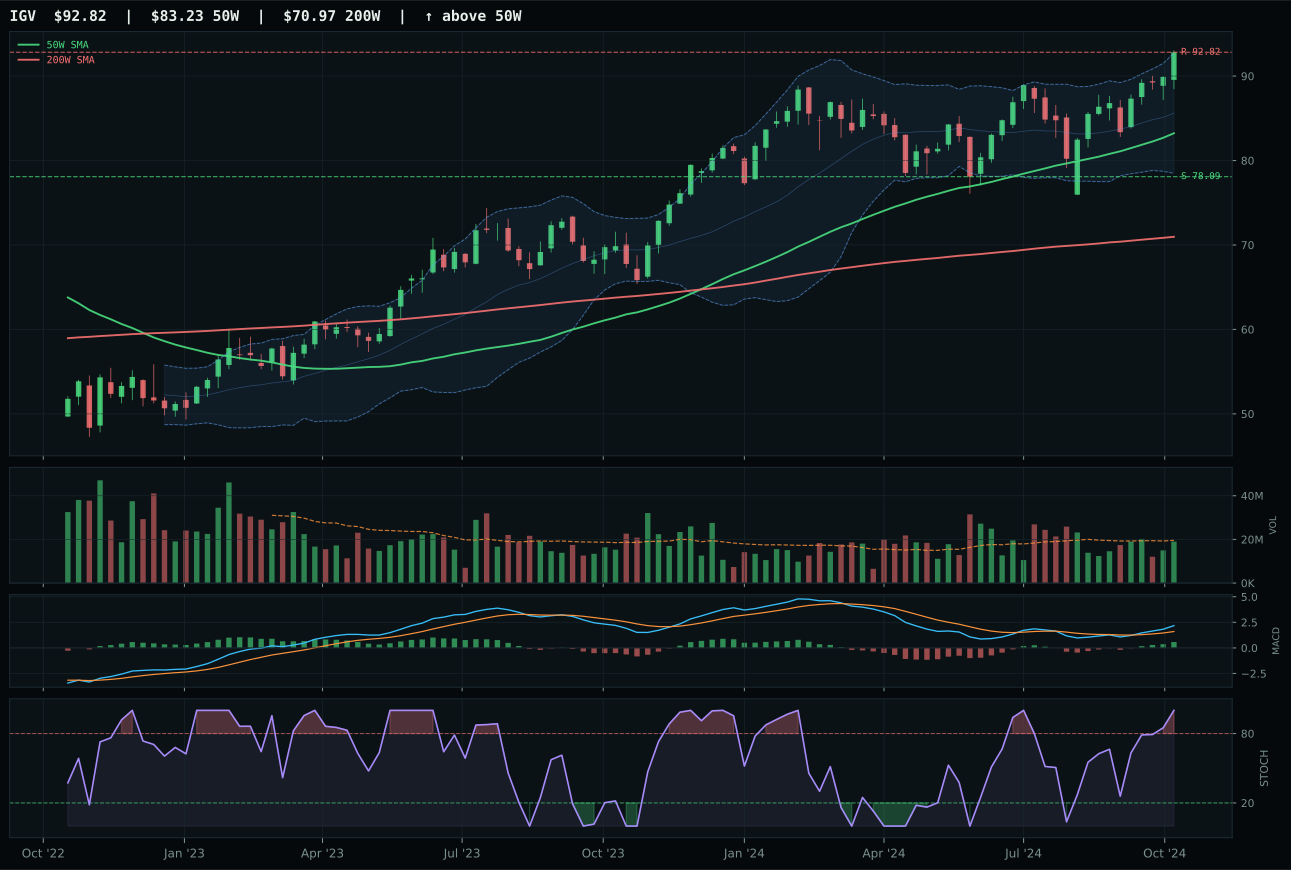
IGV has a neutral structure profile with 2.8% 13-week relative strength versus SPY.
A failed hold above support would weaken the setup.
Actionable but governed by invalidation levels.
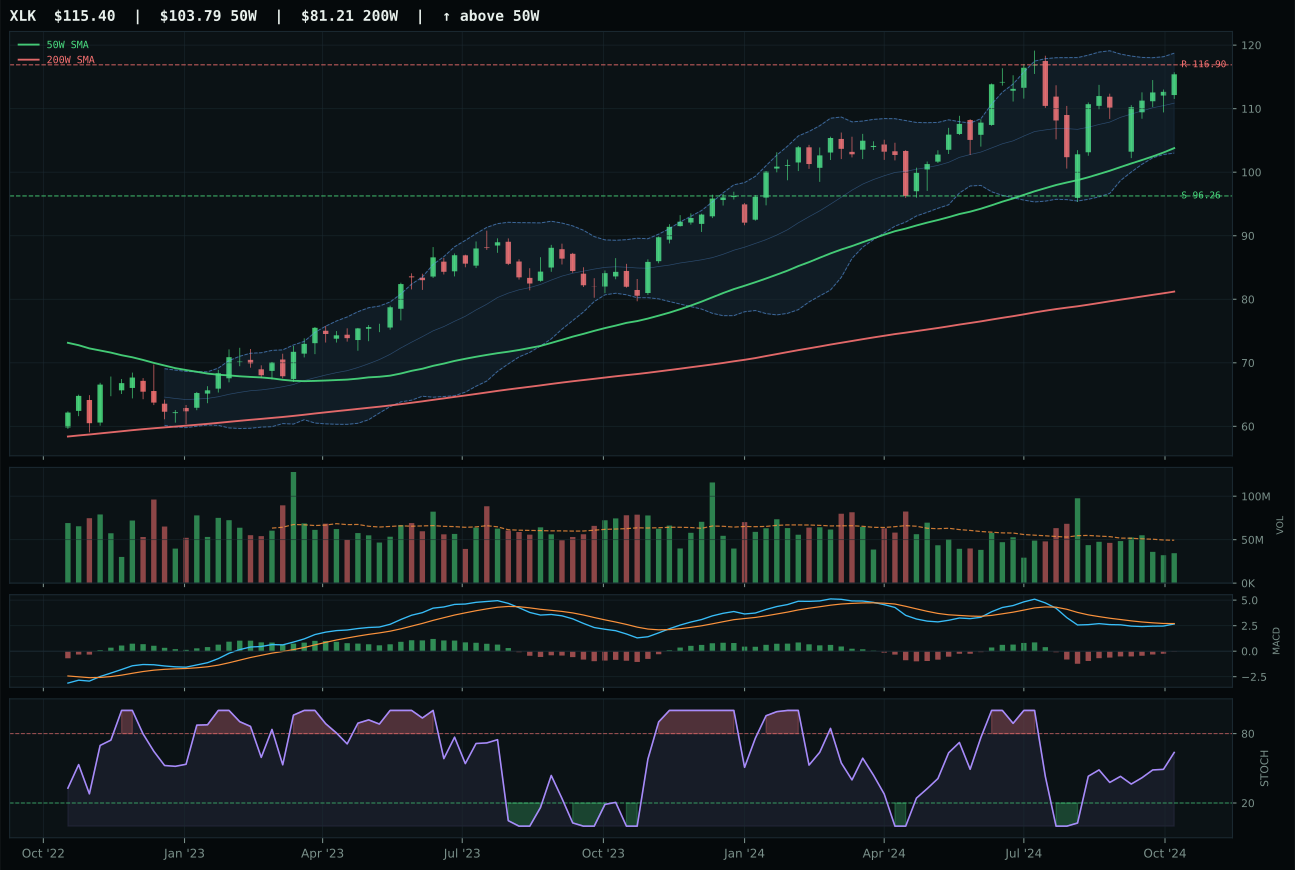
XLK has a neutral structure profile with -4.8% 13-week relative strength versus SPY.
A failed hold above support would weaken the setup.
Actionable but governed by invalidation levels.
CIBR wins because cybersecurity holds price above both the 50-week and 200-week moving averages with a steady 0.7% slope, giving it a 100/100 trend score that IGV matches but cannot leverage as effectively. The 4.9% relative strength versus SPY and 2.1% edge inside the category basket establish that new money is rotating into defensive IT rather than broad software. Volume participation at 1.32x the 20-week average confirms buyers are accumulating through the move, not merely bouncing off support; MACD is bullish and improving while stochastic RSI sits at overbought 1.00, a signal of exhaustion but still valid when paired with active accumulation. IGV's 2.8% RS versus SPY and 0.0% category-relative strength reveal that enterprise software is getting no sponsorship inside its own basket despite identical trend and timing scores, making CIBR's 3.4-point category edge decisive.
Technology holds 5% allocation as a tier-2 position, reflecting its rank outside the top two overweights but still deserving capital in a disinflation regime. The 45.0/100 macro fit score explains why: liquidity stress and credit stress are both active headwinds totaling -17 points, but disinflation itself contributes +7 and the category's technical evidence (62/38 weighting) lifts the final 57.2 score above the macro noise. The tension here is real—CIBR's perfect trend setup and above-average volume are high-quality technical signals, yet the category ranks below Precious Metals and Utilities & Infrastructure because those two have both stronger technicals and better macro alignment in a flight-to-safety environment. For Technology to earn a top-2 slot, either credit conditions would need to stabilize or relative strength would need to push past 5% versus SPY, neither of which has happened this week.
AI — AIQ
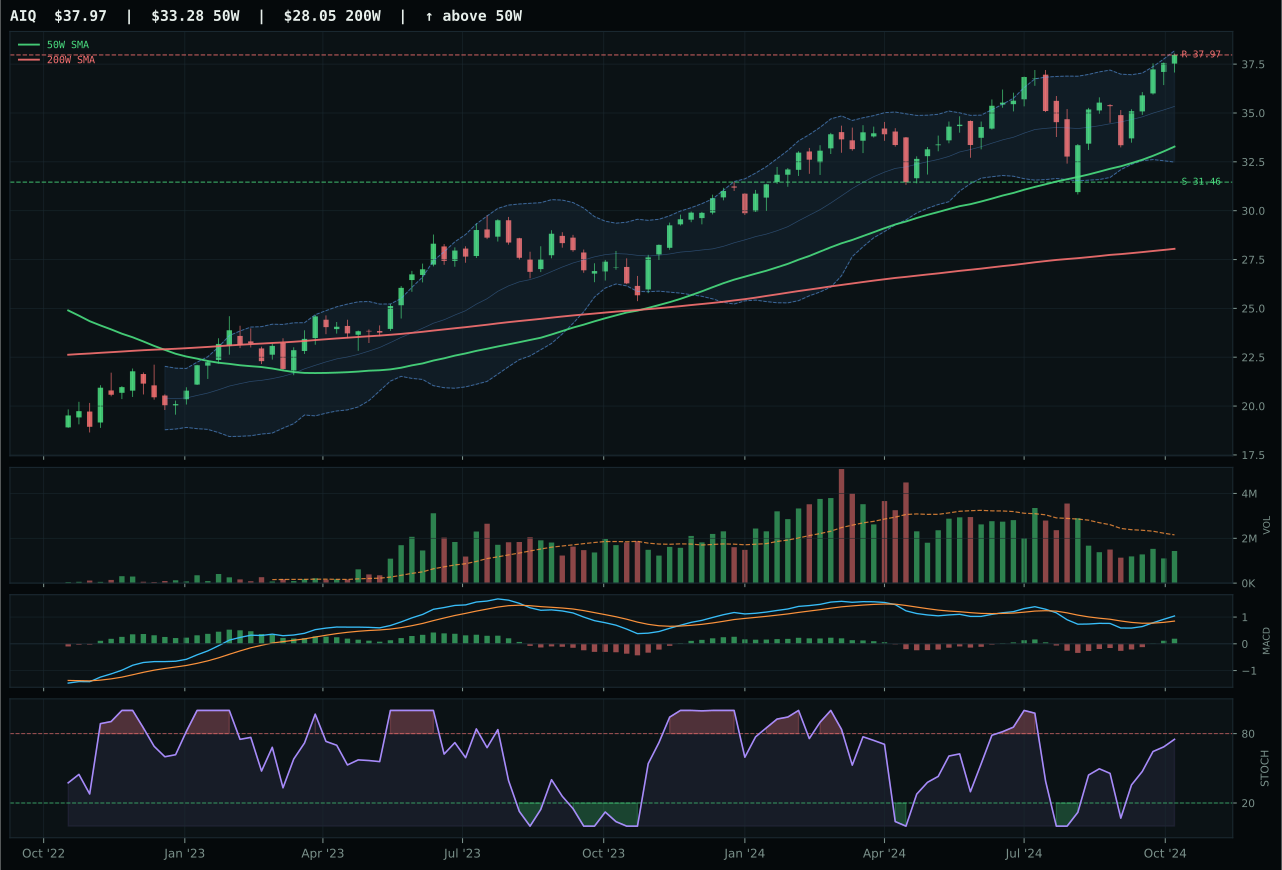
AIQ has a neutral structure profile with -0.3% 13-week relative strength versus SPY.
A failed hold above support would weaken the setup.
Actionable but governed by invalidation levels.
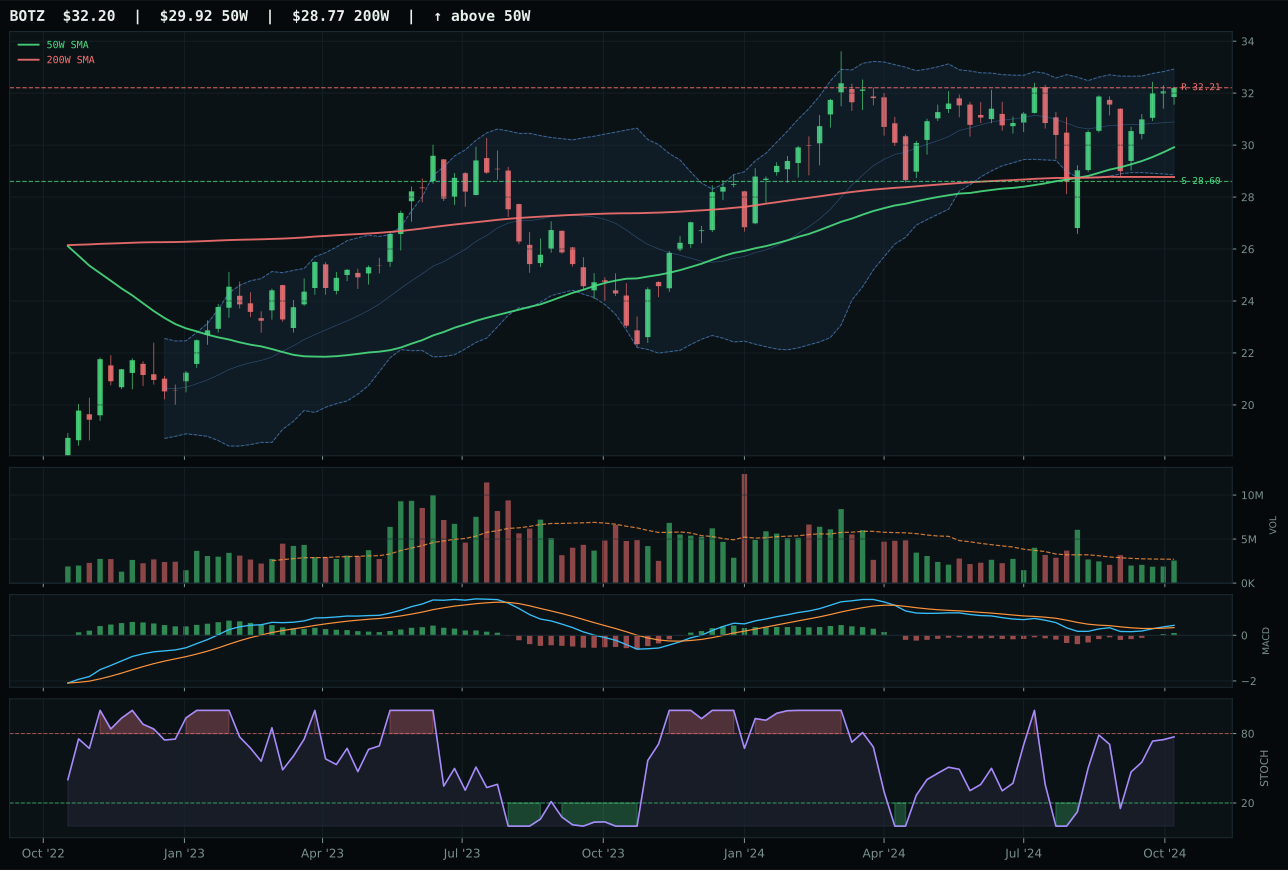
BOTZ has a neutral structure profile with -3.5% 13-week relative strength versus SPY.
A failed hold above support would weaken the setup.
Actionable but governed by invalidation levels.
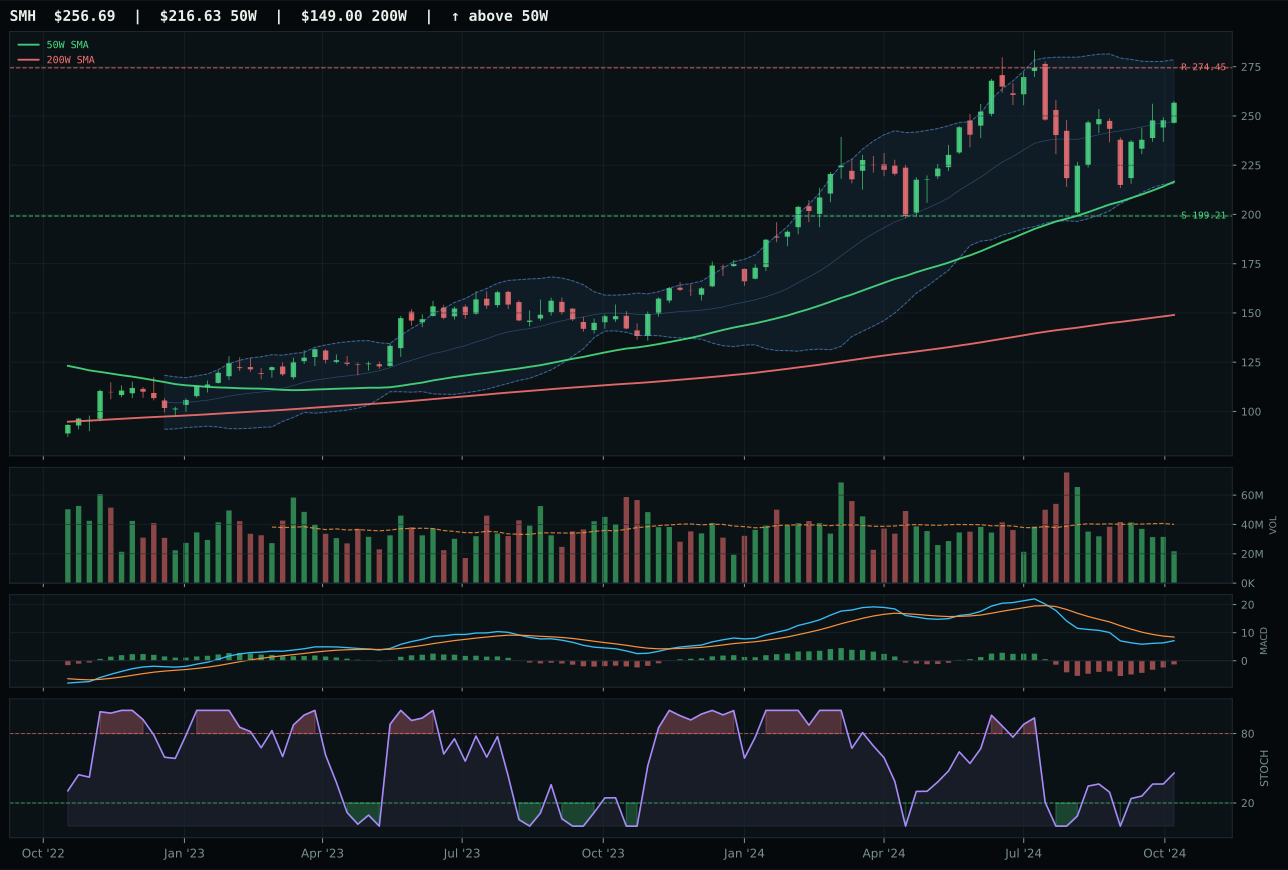
SMH has a vertical extension profile with -10.0% 13-week relative strength versus SPY.
A failed hold above support would weaken the setup.
Actionable but governed by invalidation levels.
AIQ edges BOTZ by 2.0 points despite trailing on technical evidence (73.9 vs 78.0) because its 3.3% category-relative strength advantage overcomes BOTZ's -3.5% SPY underperformance and forces the allocator to favor relative outperformance inside the basket. Price sits 14.1% above the 50-week moving average with MACD bullish and improving and stochastic RSI at rising mid-zone 0.75, a setup that suggests room to run without the exhaustion signal of overbought momentum. The 0.67x volume participation is thin, which limits conviction on pure accumulation, but AIQ's 3.2% 13-week return paired with rising category strength tells the story of a name that is being rotated into on relative grounds. BOTZ, despite near-identical 13-week return and superior technical evidence, fails to generate category intra-basket outperformance and suffers from -3.5% SPY underperformance that signals structural underweight from broad portfolio managers.
AI receives 5% allocation despite a weak 43.2 final category score, placing it tier-2 but not in jeopardy of exclusion this week. The 27.0/100 macro fit is the principal drag: liquidity stress and credit stress each cost -8 to -12 points, and broad market bear conditions add another -8, creating a hostile macro environment for growth and innovation trades. Disinflation alone contributes only +5, which is insufficient to offset the bearish descriptors. The technical evidence (62/38 weighting) carries 73.9 at the representative level but cannot overcome macro headwinds deep enough to push the category below eligible status. For AIQ and the AI sleeve to reach top-2, either credit stress must ease or liquidity must stabilize; neither appears imminent in this regime. The allocation remains as a hedge on the possibility of mean reversion in rate expectations, not as a conviction long.
Nuclear Energy — URA
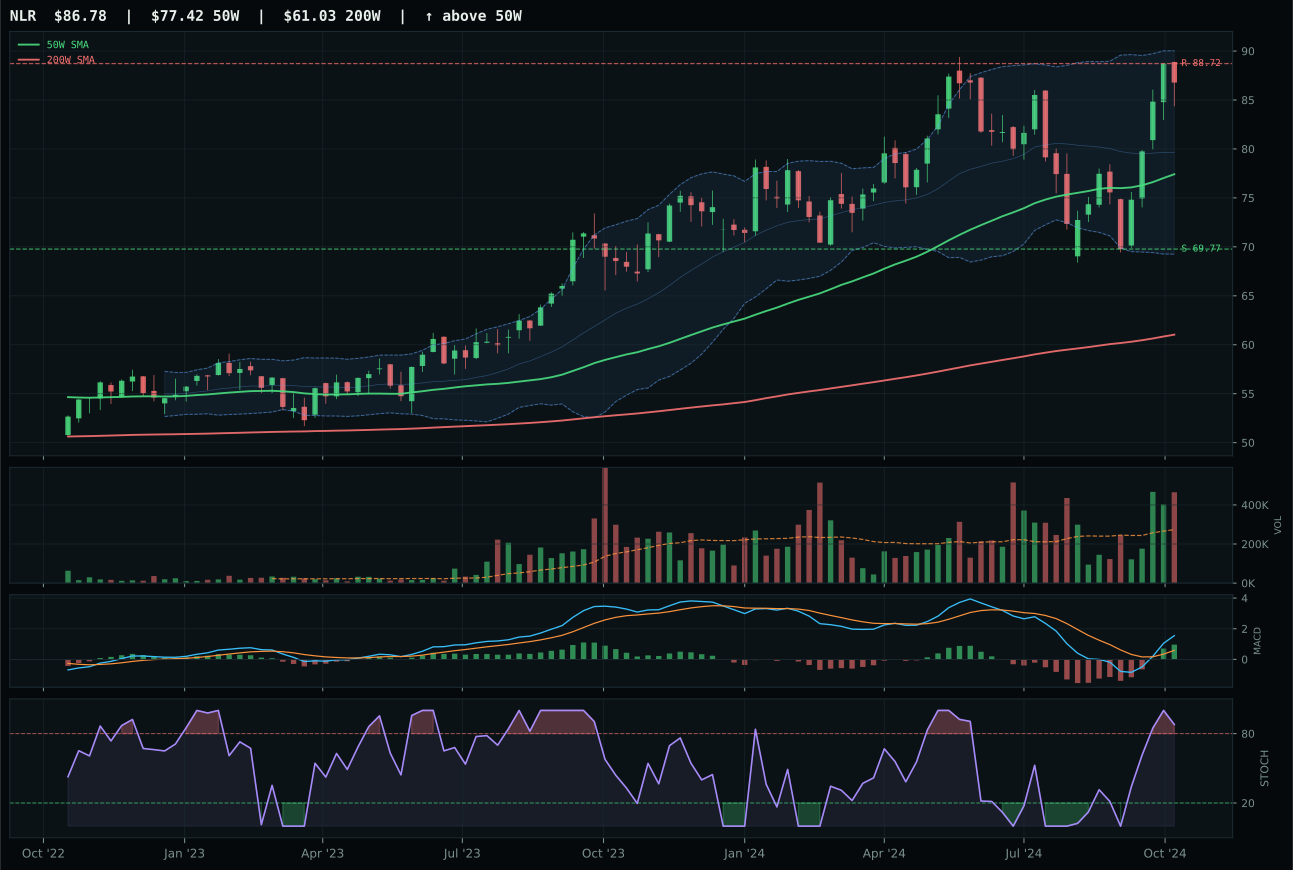
NLR has a neutral structure profile with -2.0% 13-week relative strength versus SPY.
A failed hold above support would weaken the setup.
Actionable but governed by invalidation levels.
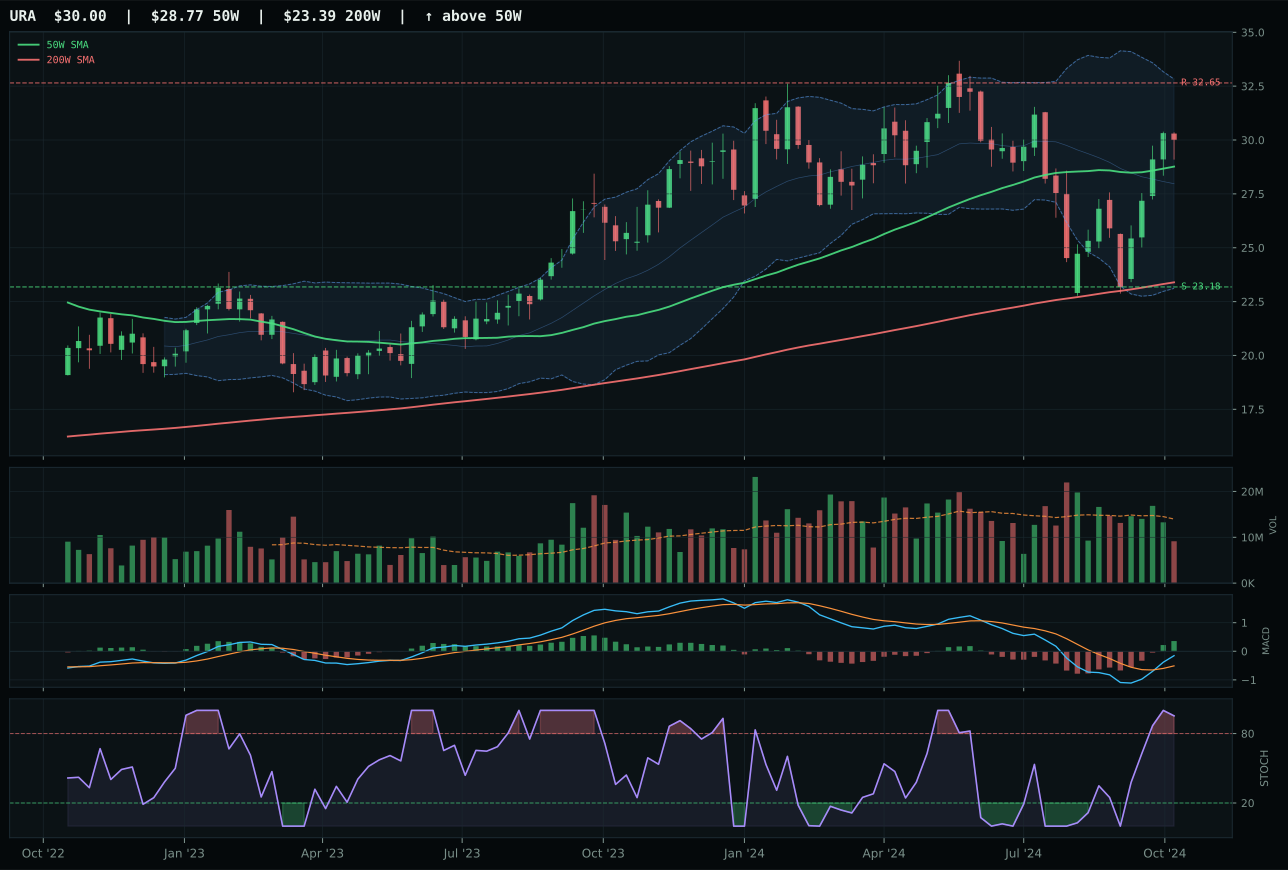
URA has a neutral structure profile with -7.3% 13-week relative strength versus SPY.
A failed hold above support would weaken the setup.
Actionable but governed by invalidation levels.
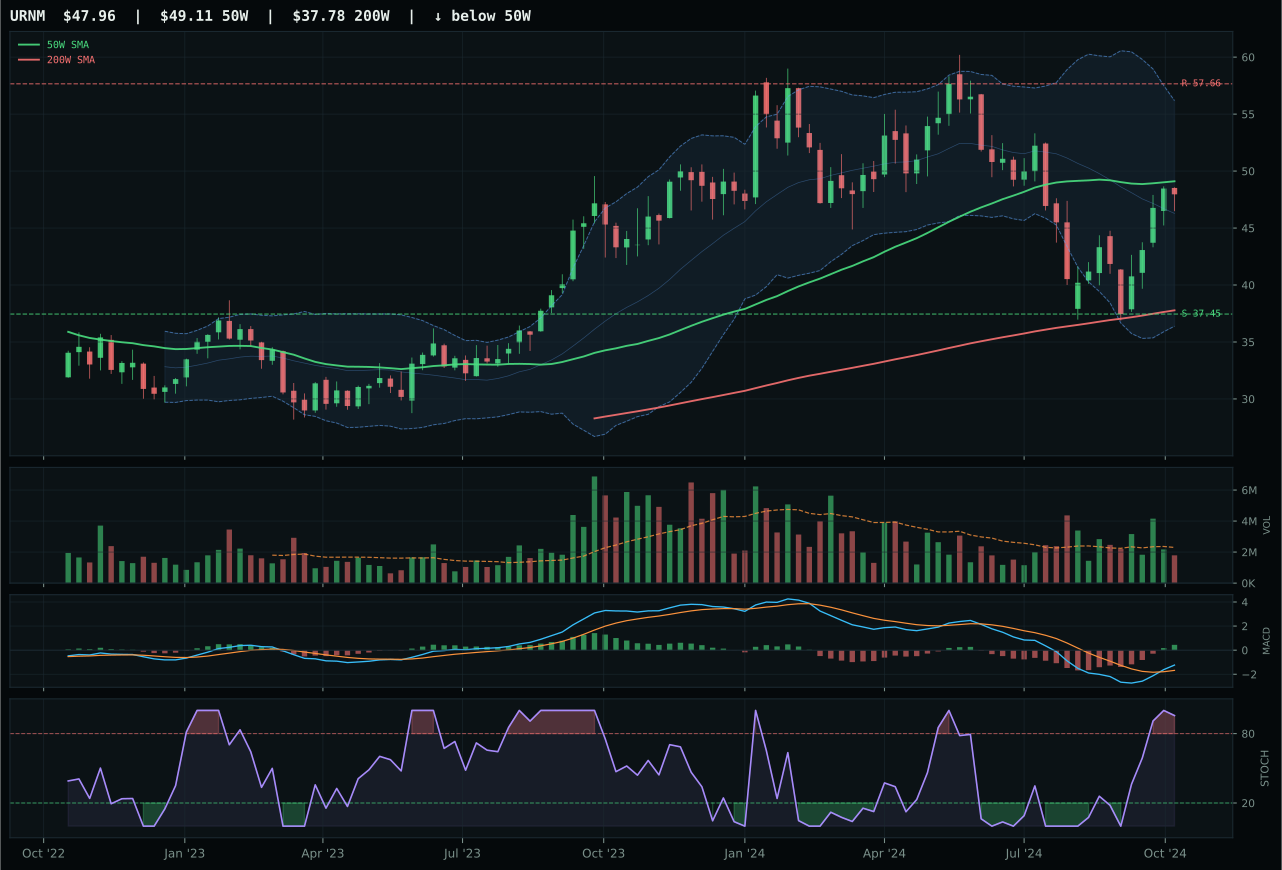
URNM has a compression near 50W profile with -11.7% 13-week relative strength versus SPY.
A failed hold above support would weaken the setup.
Actionable but governed by invalidation levels.
URA wins narrowly over NLR despite NLR's superior composite score (75 vs 73) because URA delivers perfect 90.0/100 timing at just 4.3% above the 50-week moving average versus NLR's stretched 12.1% extension and distribution pressure volume signal. The 18.0% 4-week return on URA shows recent violent mean reversion, while -3.8% 13-week return reflects the brutal selloff that precedes such bounces. NLR's bullish but flattening MACD versus URA's bullish and improving creates a tone divergence that favors URA's recency, and stochastic RSI sitting at overbought 0.95 on both names gives URA the timing advantage on sheer proximity to support. The -1.5-point score gap is narrow enough to indicate this is a fragile category decision; either name could serve as the representative with slight shifts in momentum. Category relative strength is 0.0% for both, meaning neither is winning flows inside its own basket.
Nuclear Energy receives 5% allocation as a tier-2 position supported by neutral macro conditions rather than tailwinds. Real asset sponsorship contributes +7, but liquidity stress (-7), credit stress (-5), and risk appetite broken (-4) combine for a -9 net deficit, yielding a 41.0/100 macro fit that is neither helpful nor harmful. The 36.2 final category score ranks it tier-2 because representative technical evidence (62.5/100) and neutral macro neutralize each other, leaving the portfolio with a break-even allocation rationale. The -7.3% SPY underperformance on URA and thin 0.65x volume participation suggest this is a speculative energy transition play, not a core holding. The 5% allocation reflects the possibility that uranium demand from AI data centers and net-zero capex will drive long-term scarcity, but near-term technicals and macro offer no conviction. This is a position that could easily shrink to 0% if the timing score deteriorates further.
Agriculture & Livestock — MOO
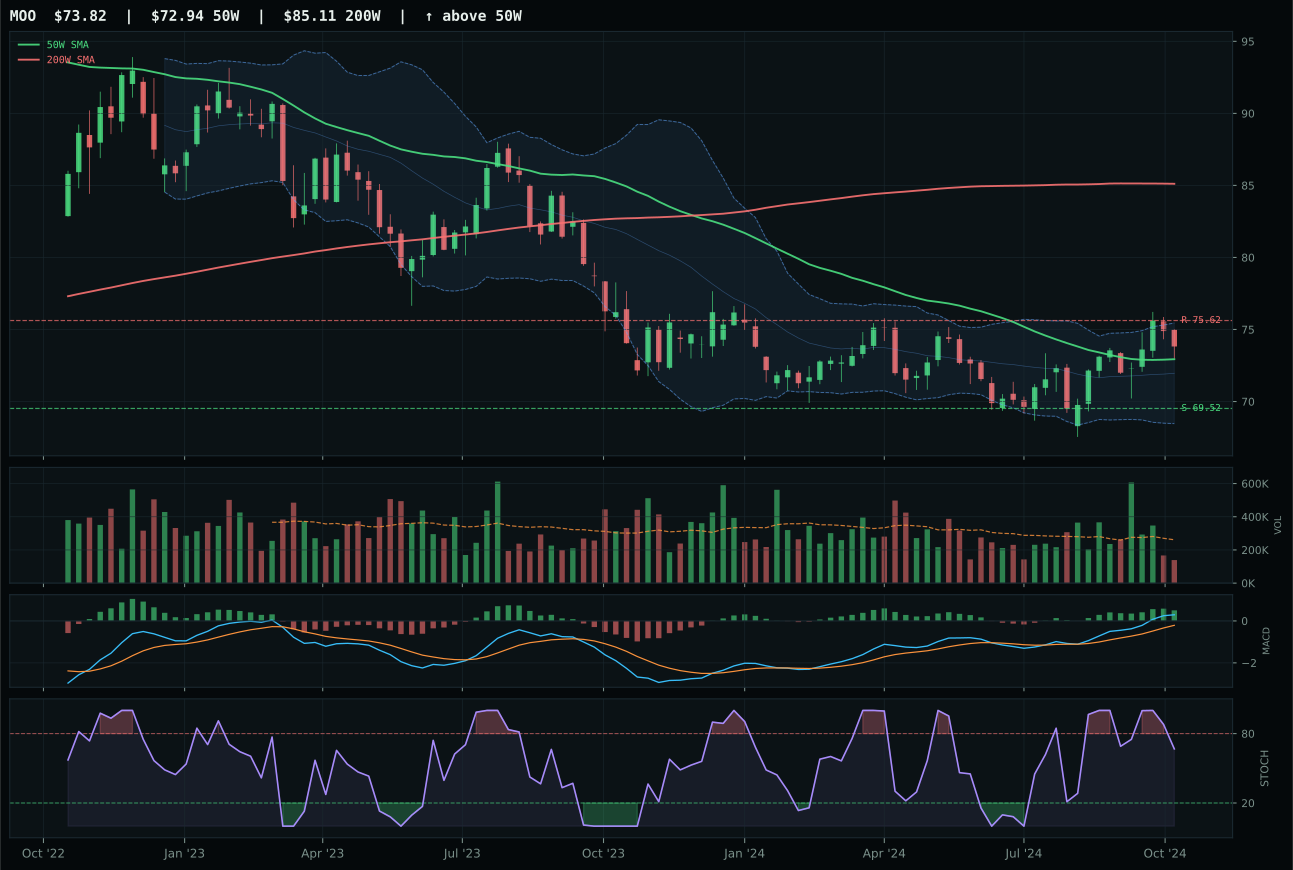
MOO has a compression near 50W profile with 0.5% 13-week relative strength versus SPY.
A failed hold above support would weaken the setup.
Actionable but governed by invalidation levels.
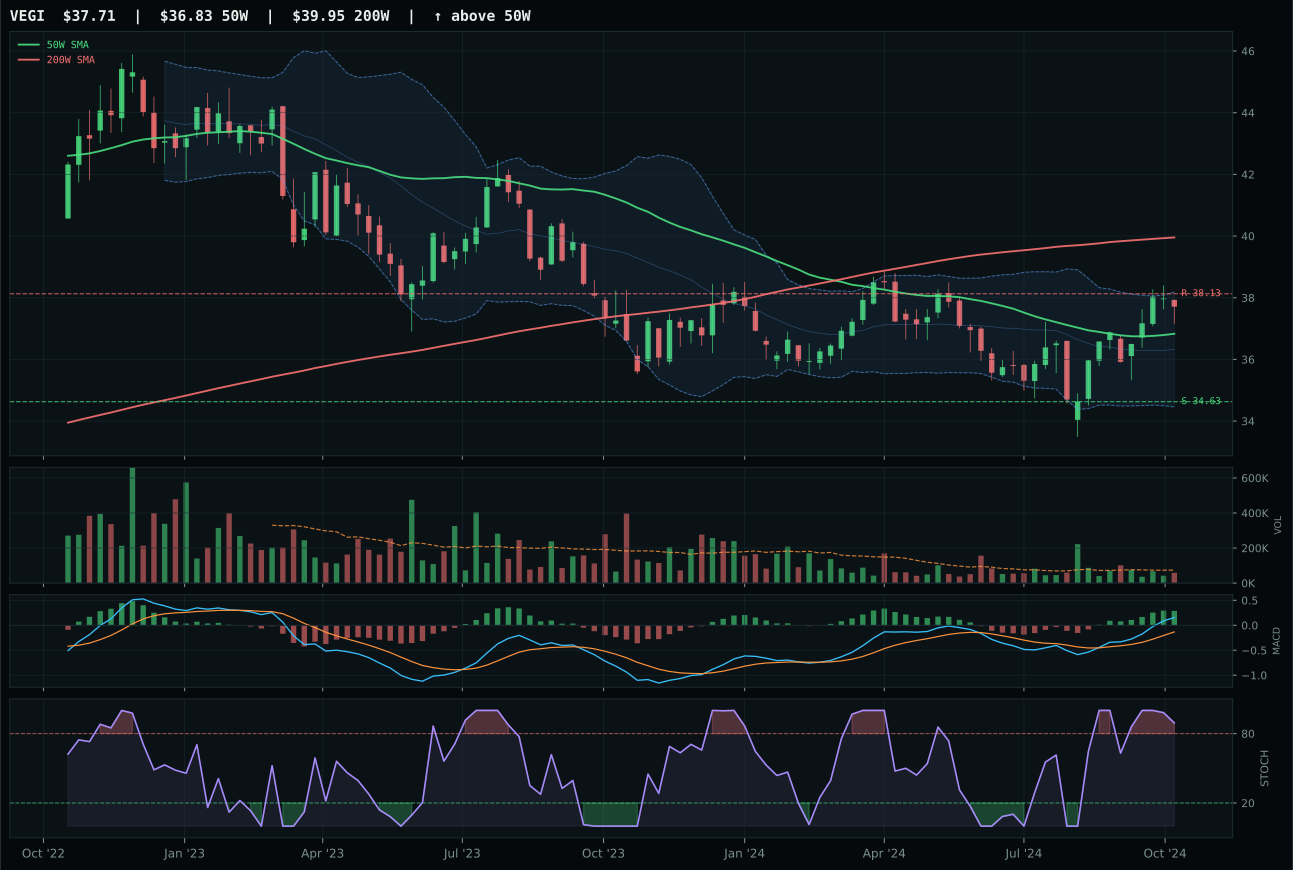
VEGI has a compression near 50W profile with 1.7% 13-week relative strength versus SPY.
A failed hold above support would weaken the setup.
Tracked, but not top-2 eligible because: .
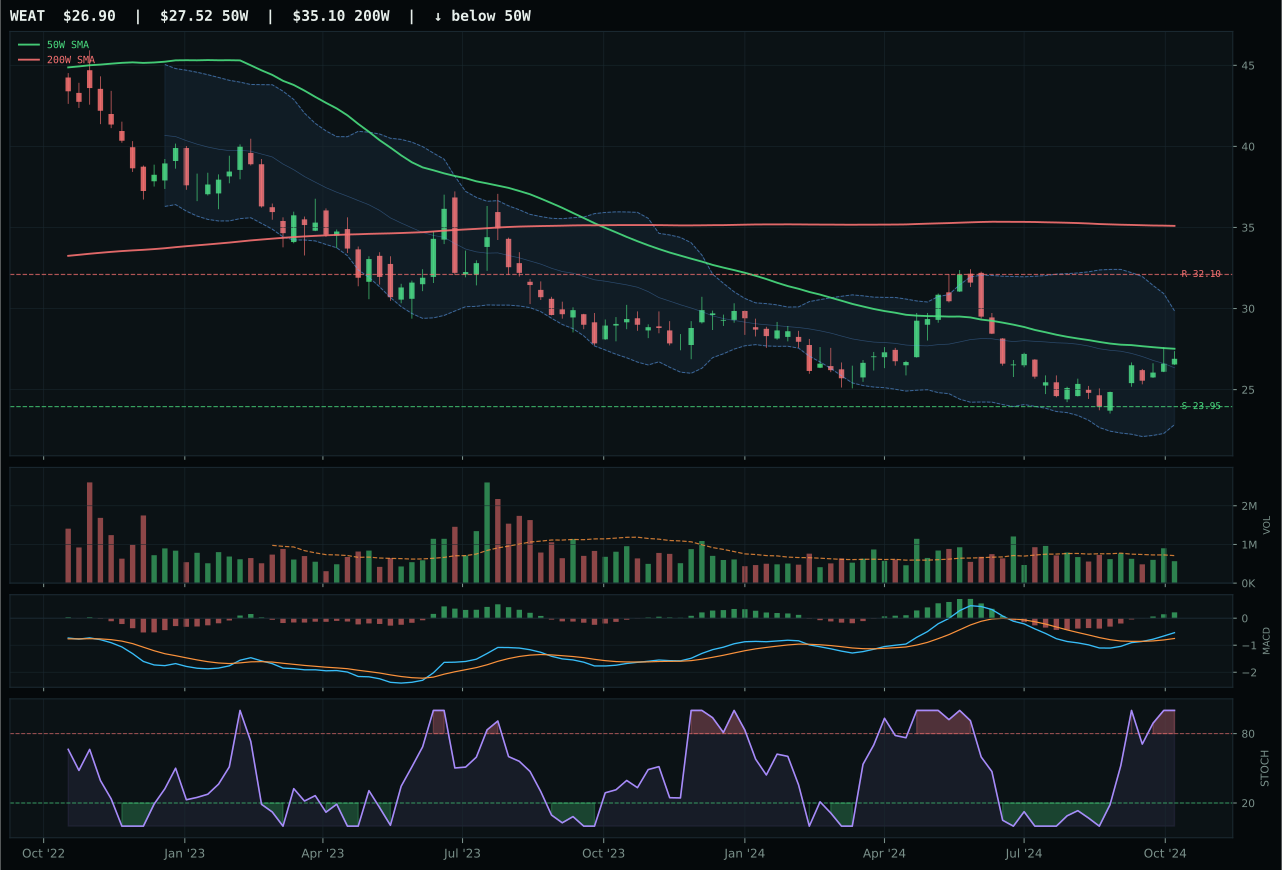
WEAT has a compression near 50W profile with 0.8% 13-week relative strength versus SPY.
Extension and support failure are the main tactical risks.
Tracked, but not top-2 eligible because: structurally broken.
MOO wins with a perfect 100/100 timing score because price compresses at just 1.2% above the 50-week moving average, positioning it for expansion if support holds, and stochastic RSI sits at falling/neutral 0.67, avoiding the exhaustion of overbought momentum. The 51.9/100 risk-reward is the best in its basket because upside is limited to -2.4% to resistance but downside to support spans only 6.2%, creating favorable asymmetry for a coil setup. MACD bullish and improving confirms accumulation intent despite thin participation at 0.53x the 20-week average, and the 4.0% 13-week return shows that agribusiness has quietly outperformed expectations. VEGI loses because its 82.0/100 timing score and -2.4% negative skew to resistance force buyers into a compressed range at the top, while MOO's near-support compression offers a better entry framework for the next leg. The 19.1-point score gap is decisive.
Agriculture & Livestock receives 5% allocation despite a depressed 32.6 final category score, the lowest among tier-2 selections, because disinflation directly opposes real-asset inflation hedges with -6 in the category macro fit, compounded by -8 from disinflation pressure itself. Real asset sponsorship (+8), commodity breadth positive (+5), and metals scarcity create a competing narrative, resulting in a neutral 45.0/100 macro fit that is simply inadequate in a deflationary environment. The 71.0/100 technical evidence on MOO is respectable but thin-volume participation (0.53x) and weak category-relative strength (-0.3%) suggest this is not a high-conviction setup. The 5% allocation is held primarily as portfolio insurance against the tail scenario of unexpected supply shocks or geopolitical commodity disruption, not as core macro positioning. Any further deterioration in momentum or widening of the timing discount would pressure this to exclusion.
Traditional Energy — XLE
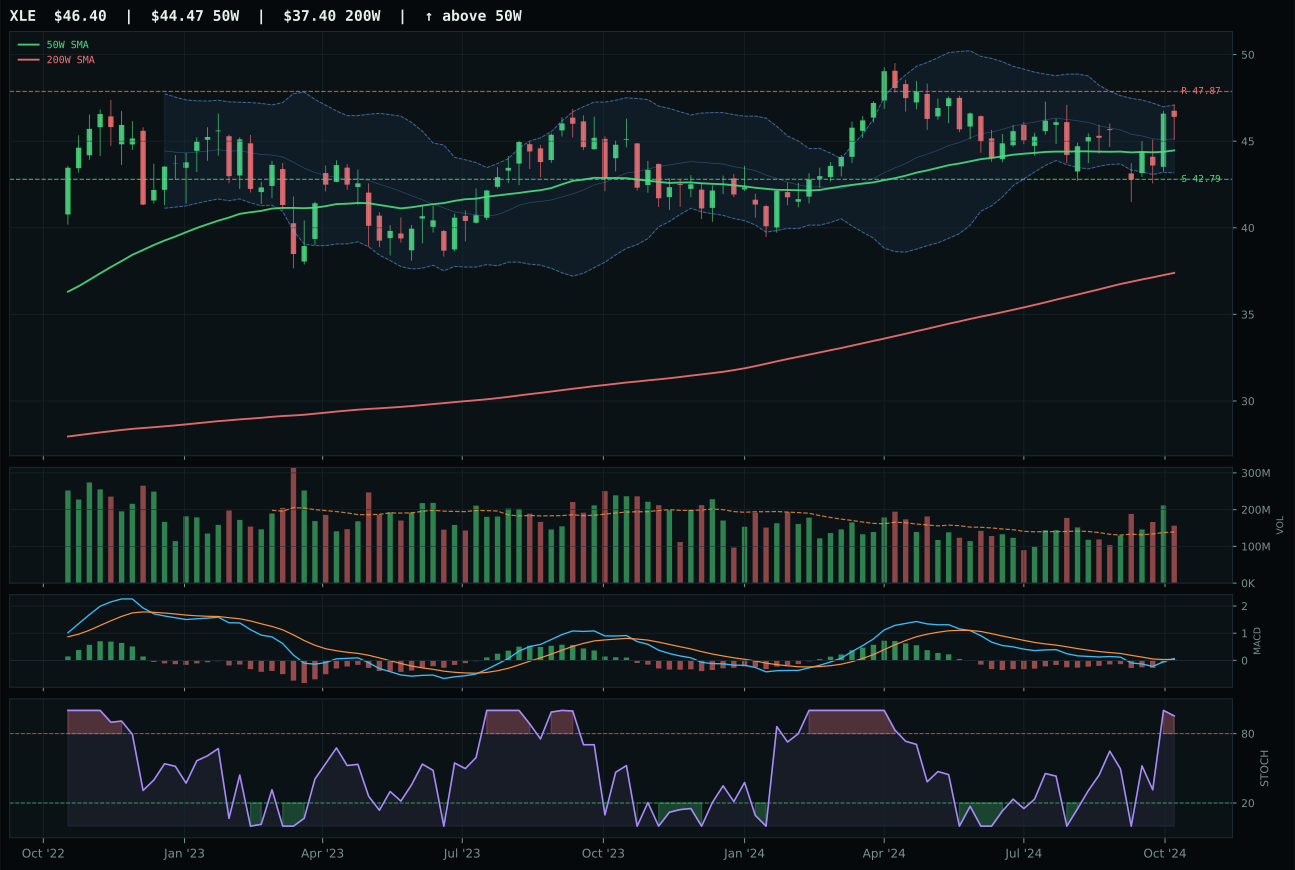
XLE has a neutral structure profile with -1.0% 13-week relative strength versus SPY.
A failed hold above support would weaken the setup.
Actionable but governed by invalidation levels.
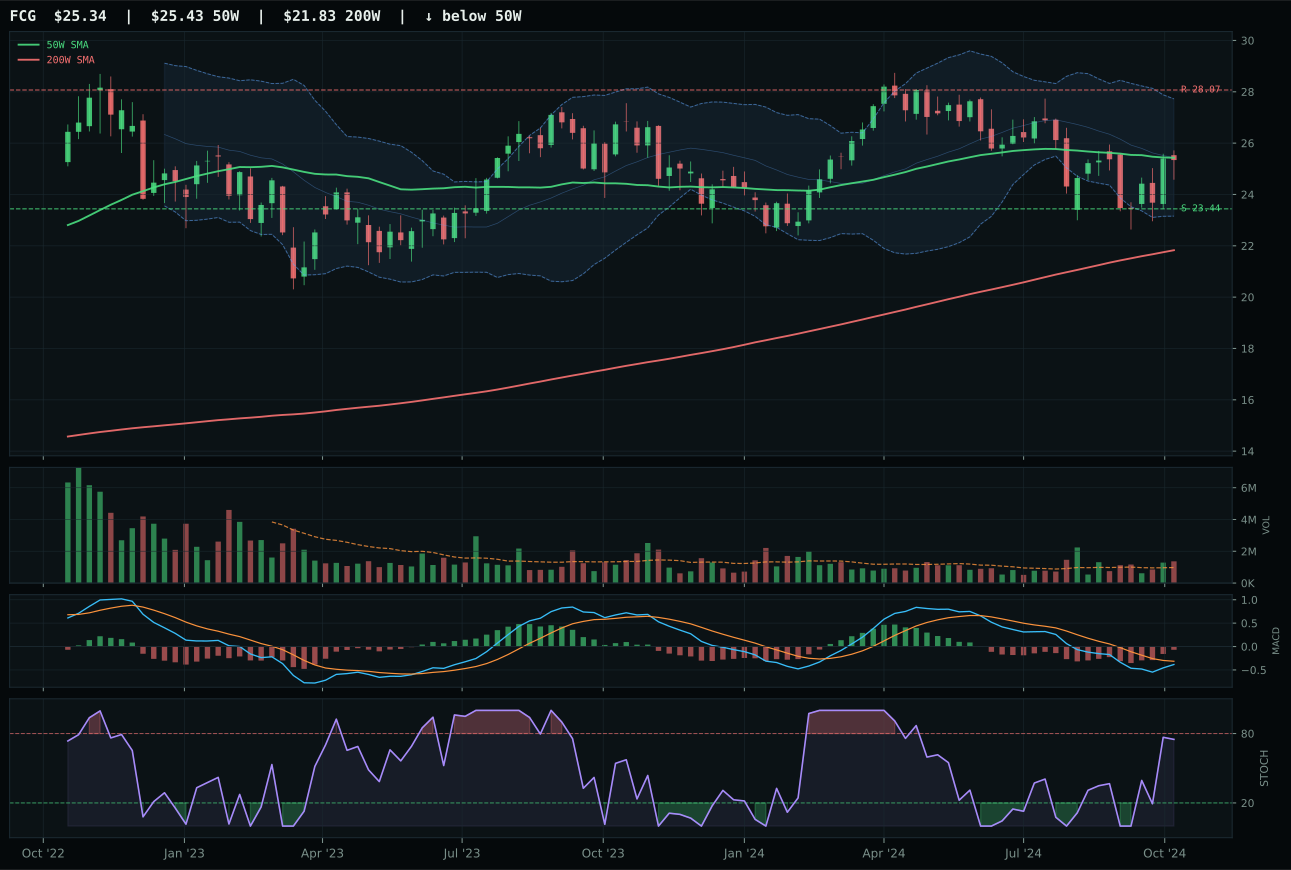
FCG has a compression near 50W profile with -9.1% 13-week relative strength versus SPY.
A failed hold above support would weaken the setup.
Actionable but governed by invalidation levels.
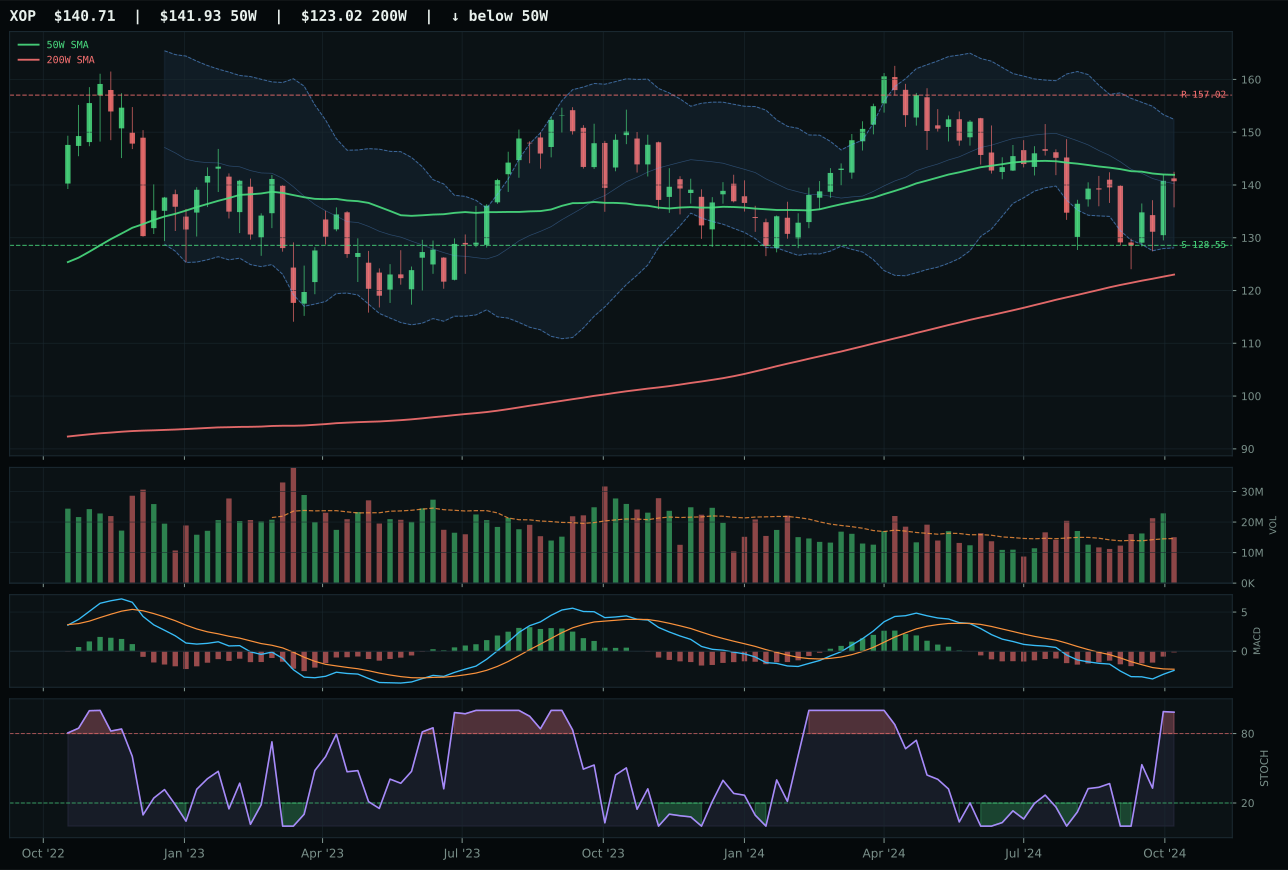
XOP has a compression near 50W profile with -7.1% 13-week relative strength versus SPY.
A failed hold above support would weaken the setup.
Actionable but governed by invalidation levels.
XLE wins because price sits 4.5% above the 50-week moving average in the near 52W low repair zone with MACD bullish and improving and stochastic RSI at overbought 0.95, positioning it for late-stage accumulation on pullbacks rather than new buyers at resistance. The 2.5% 13-week return and 6.2% category-relative strength (its only competitive advantage) mask the core problem: -1.0% SPY underperformance signals systematic selling from portfolio managers despite 1.12x volume participation and 91.0/100 momentum confirmation. FCG shows weaker technical evidence (43.6 vs 78.2) with bearish but improving MACD and -9.1% SPY underperformance, making XLE the clear category winner by default rather than by setup quality. This is a category where the best choice remains structurally challenged.
Traditional Energy receives 0% allocation, excluded from the portfolio entirely this week, ranking 9th or 10th among categories with a depressed 22.5 final score. Disinflation is an active -10 headwind, disinflation pressure is another -10, and credit stress contributes -7, creating a -27 macro deficit that overwhelms any real asset sponsorship (+5 or +7) tailwinds. The 47.0/100 macro fit and weak 78.2/100 representative technical evidence combine to produce a score that cannot clear the tier-2 threshold of approximately 40+. XLE's 1.12x volume and bullish MACD look superficially constructive, but they are simply too weak in absolute terms to justify capital allocation when metals, utilities, and defense offer superior risk-adjusted returns. For Traditional Energy to earn re-entry, either disinflation pressure must ease (implying Fed rate-cut velocity slows) or commodity breadth must sharply improve, neither of which appears likely in the near term.
Emerging Markets — IEMG
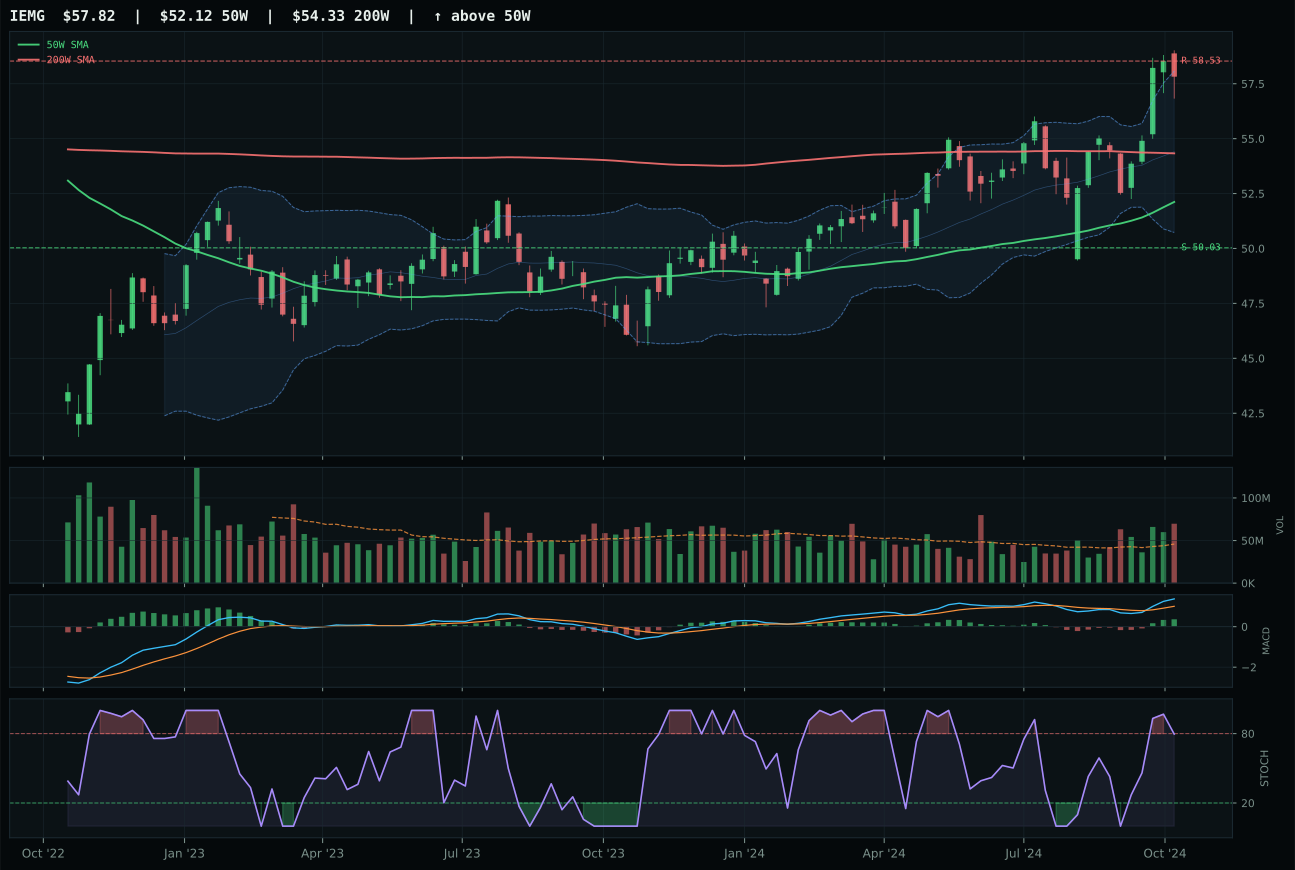
IEMG has a neutral structure profile with 0.1% 13-week relative strength versus SPY.
A failed hold above support would weaken the setup.
Actionable but governed by invalidation levels.
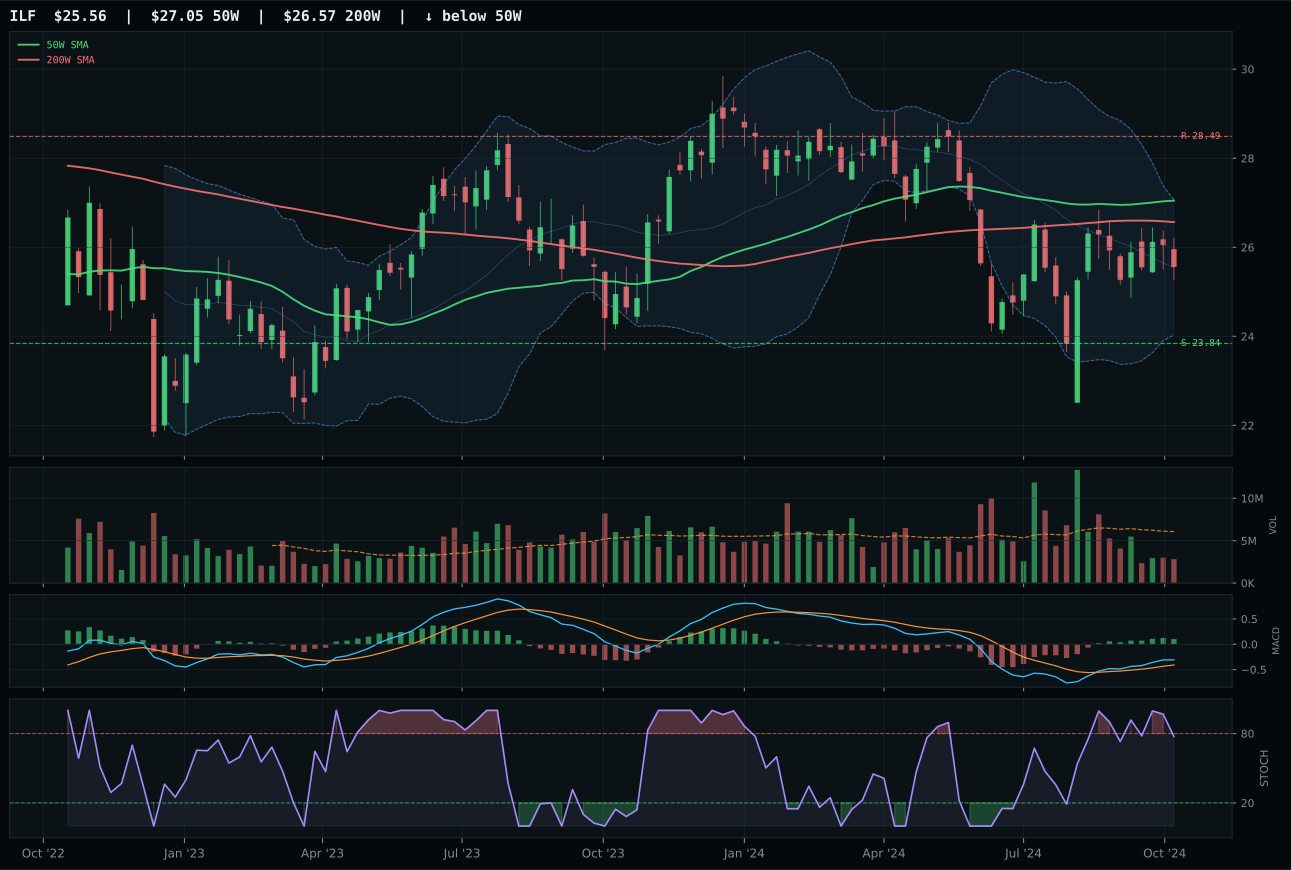
ILF has a neutral structure profile with -7.1% 13-week relative strength versus SPY.
A failed hold above support would weaken the setup.
Actionable but governed by invalidation levels.
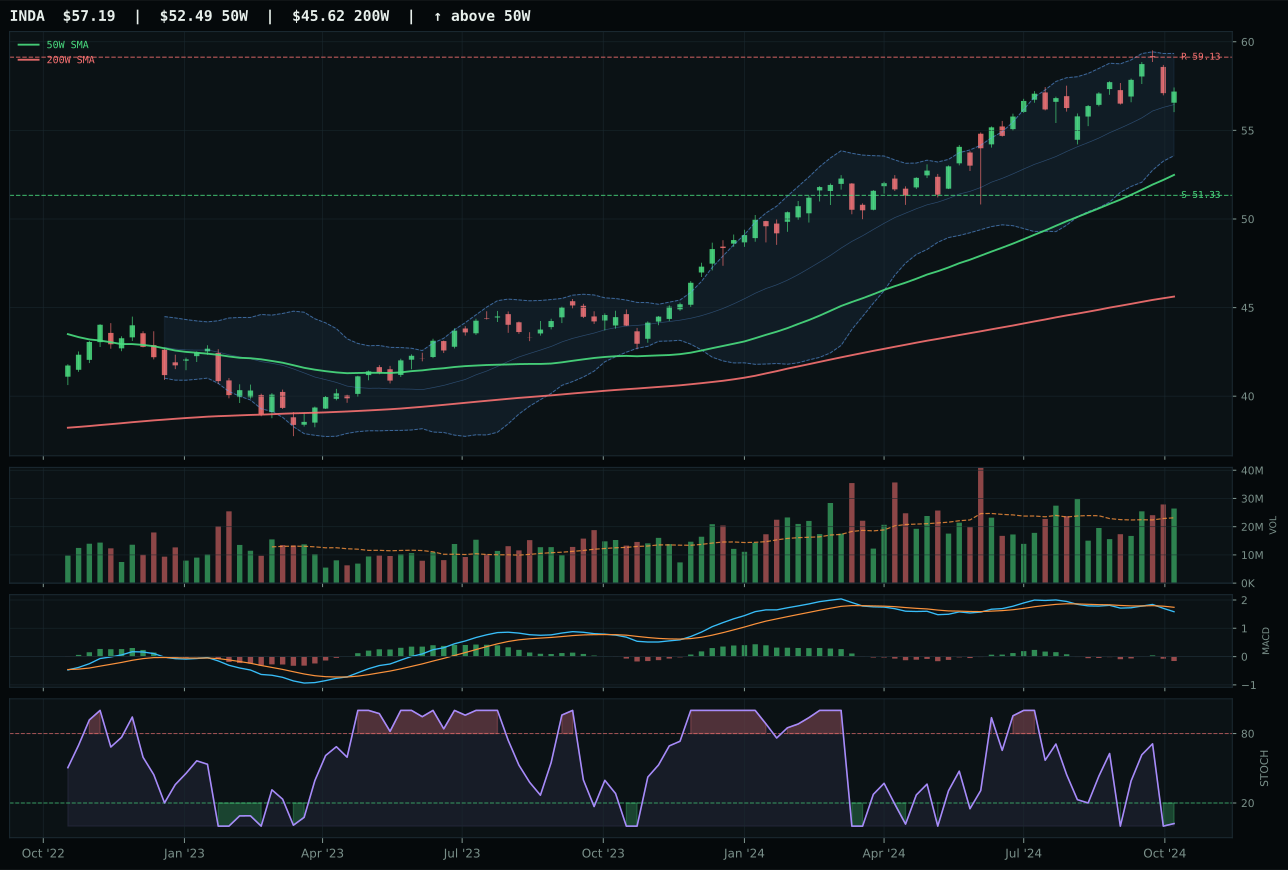
INDA has a neutral structure profile with -3.3% 13-week relative strength versus SPY.
A failed hold above support would weaken the setup.
Actionable but governed by invalidation levels.
IEMG wins because it delivers 90.2/100 trend strength with rising mid-zone stochastic RSI at 0.80 and MACD bullish and improving, but the 30.4/100 risk-reward is the category's fatal flaw. Price sits 10.9% above the 50-week moving average in the near 52W high / extension zone with upside to resistance capped at -1.2%, meaning further buyers are stepping in front of a wall. Volume at 1.52x the 20W average reads as distribution pressure, not accumulation, and the 0.1% SPY relative strength is essentially flat despite strong 13-week absolute return of 3.6%. ILF loses because structure is weaker (64.1 vs 72.2), stochastic RSI is falling/neutral versus rising, and -3.8% category-relative strength versus IEMG's 3.4% creates a 7.2-point swing in relative merit. This is still a weak category decision because both names show poor risk-reward.
Emerging Markets receive 0% allocation, excluded entirely with a weak 15.1 final category score that ranks it 9th or 10th in the portfolio. The macro environment is actively hostile: credit stress (-10), liquidity stress (-10), and broad market bear (-9) combine for a -29 total headwind, resulting in a 21.0/100 macro fit that is among the worst in the system. The 51.6/100 representative technical evidence on IEMG cannot overcome such structural macro headwinds. IEMG's distribution pressure volume signal at 1.52x participation, rising mid-zone stochastic RSI exhaustion, and -1.2% upside against -1.5% downside skew all point toward late-stage liquidation rather than fresh capital rotation into emerging-market beta. For EM to earn a position, either credit stress would need to ease materially or the system would need to shift to an explicit risk-on regime; neither condition exists in the current disinflation environment where US assets and hard hedges dominate capital flows.