
2024-10-04
Informational purposes only. The content in this report, including allocations, analysis, and commentary, is provided solely for informational and educational purposes. It does not constitute financial advice, investment advice, trading advice, or any other type of advice. Past performance does not guarantee future results. Always conduct your own research and consult a qualified financial professional before making investment decisions.
Weekly Allocation
| Ticker | Category | Weight | Role |
|---|---|---|---|
| FBTC | 50% | Overlay | |
| PAVE | Utilities & Infrastructure | 10% | Top-2 (10%) |
| GLD | Precious Metals | 10% | Top-2 (10%) |
| ITA | Defense & Aerospace | 5% | Tier-2 (5%) |
| COPX | Industrial Metals | 5% | Tier-2 (5%) |
| URA | Nuclear Energy | 5% | Tier-2 (5%) |
| XLK | Technology | 5% | Tier-2 (5%) |
| SMH | AI | 5% | Tier-2 (5%) |
| MOO | Agriculture & Livestock | 5% | Tier-2 (5%) |
Trade Instructions — Monday Open
Sell the tranche from 2024-09-06 (completing its 4-week hold). Buy the new tranche. Instructions show net portfolio changes — same-asset positions cancel, weight changes show the delta.
| Action | Ticker | Instruction |
|---|---|---|
| SELL | XLU | Sell 25% of XLU position (reduce 10.00% → 7.50%) |
| SELL | IGV | Sell 25% of IGV position (reduce 5.00% → 3.75%) |
| SELL | XAR | Sell 50% of XAR position (reduce 2.50% → 1.25%) |
| SELL | AIQ | Sell 33% of AIQ position (reduce 3.75% → 2.50%) |
| SELL | IEMG | Sell 50% of IEMG position (reduce 2.50% → 1.25%) |
| SELL | NLR | Sell 25% of NLR position (reduce 5.00% → 3.75%) |
| BUY | ITA | Buy ITA — 14.29% of freed cash (adds 1.25% to portfolio) |
| BUY | COPX | Buy COPX — 14.29% of freed cash (adds 1.25% to portfolio) |
| BUY | PAVE | Buy PAVE — 28.57% of freed cash (adds 2.50% to portfolio) |
| BUY | URA | Buy URA — 14.29% of freed cash (adds 1.25% to portfolio) |
| BUY | XLK | Buy XLK — 14.29% of freed cash (adds 1.25% to portfolio) |
| BUY | SMH | Buy SMH — 14.29% of freed cash (adds 1.25% to portfolio) |
Current Portfolio After Trade
Combined holdings across all 4 active tranches. Each tranche is 25% of the portfolio.
| Ticker | % of Portfolio | Weight Bar |
|---|---|---|
| FBTC | 50.00% | |
| GLD | 10.00% | |
| XLU | 7.50% | |
| IGV | 3.75% | |
| NLR | 3.75% | |
| ITA | 3.75% | |
| COPX | 3.75% | |
| AIQ | 2.50% | |
| PAVE | 2.50% | |
| XAR | 1.25% | |
| IEMG | 1.25% | |
| WEAT | 1.25% | |
| BOTZ | 1.25% | |
| XLE | 1.25% | |
| INDA | 1.25% | |
| URA | 1.25% | |
| XLK | 1.25% | |
| SMH | 1.25% | |
| MOO | 1.25% |
Macro Regime — Disinflation
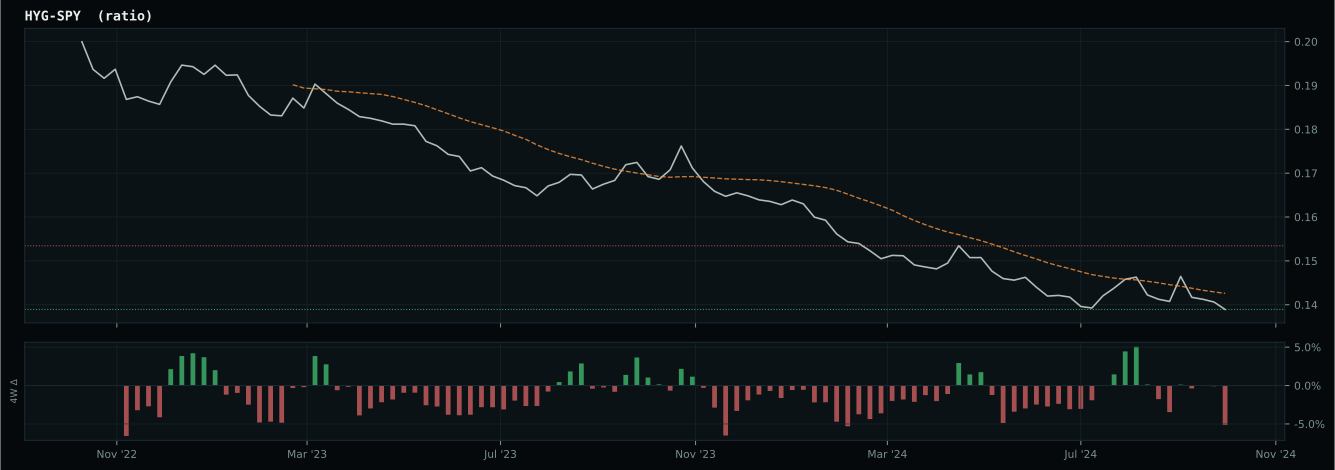
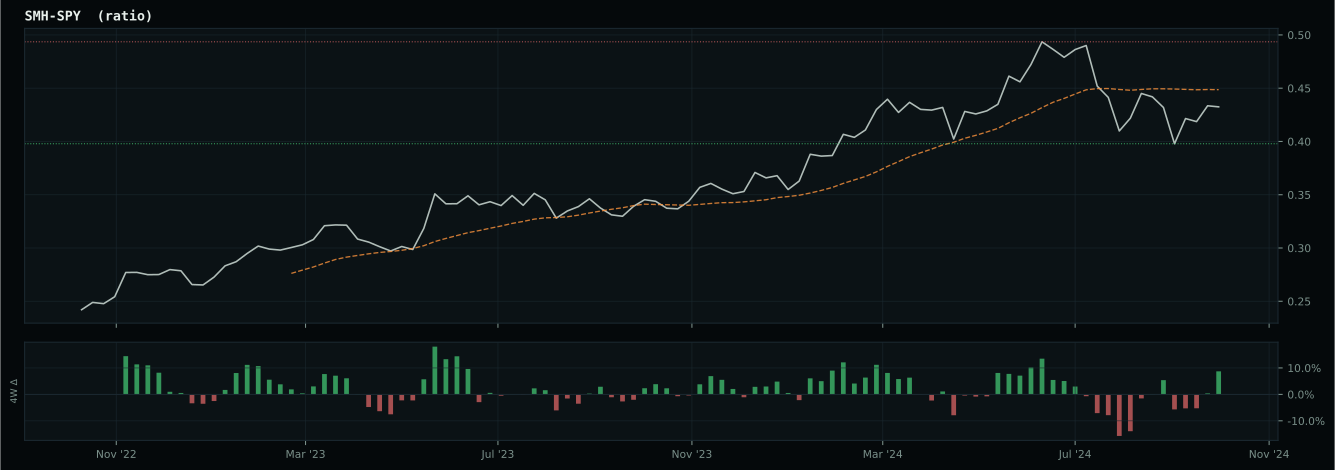
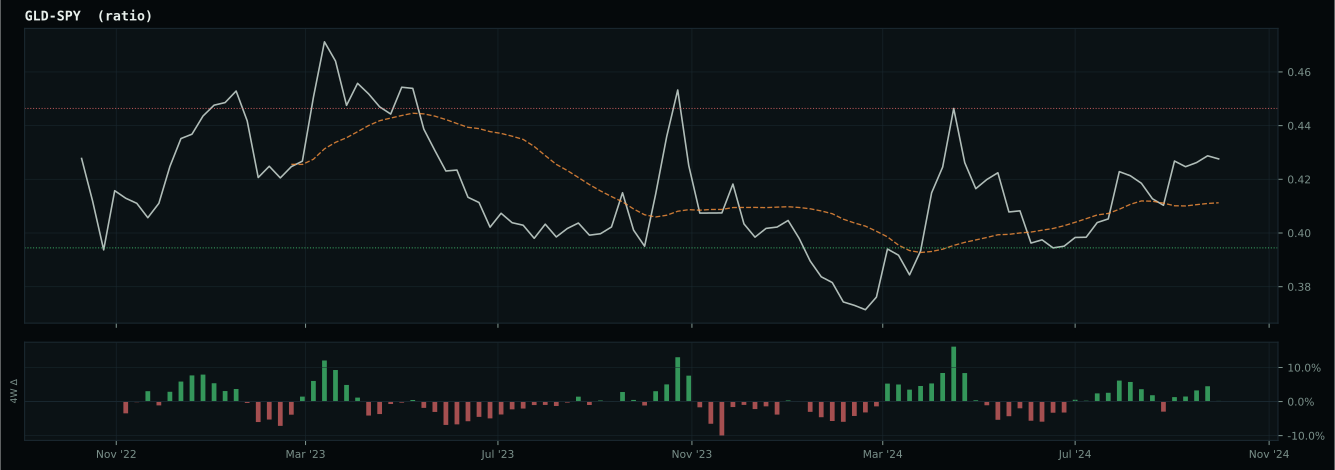
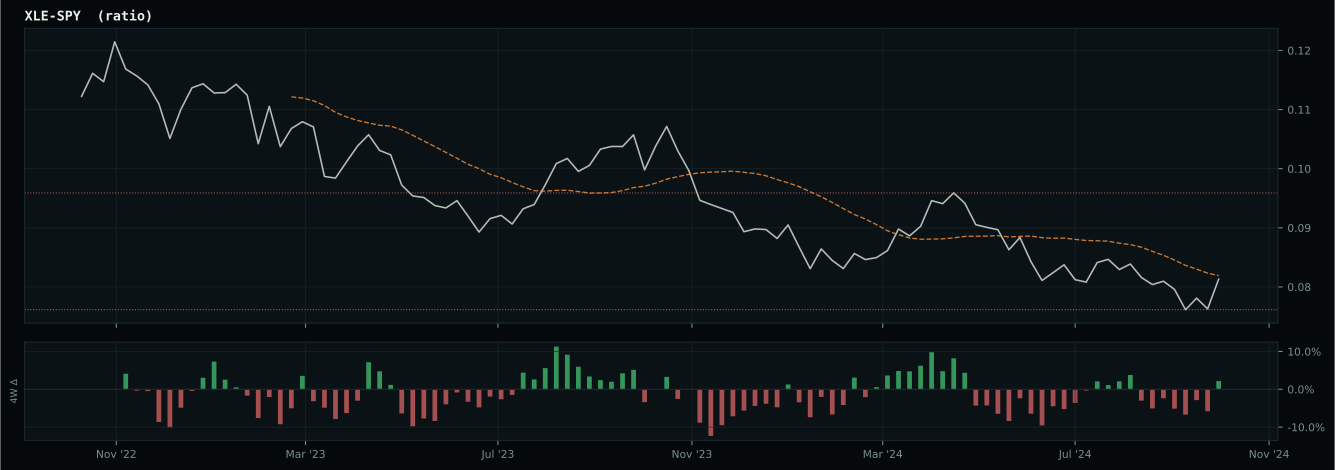
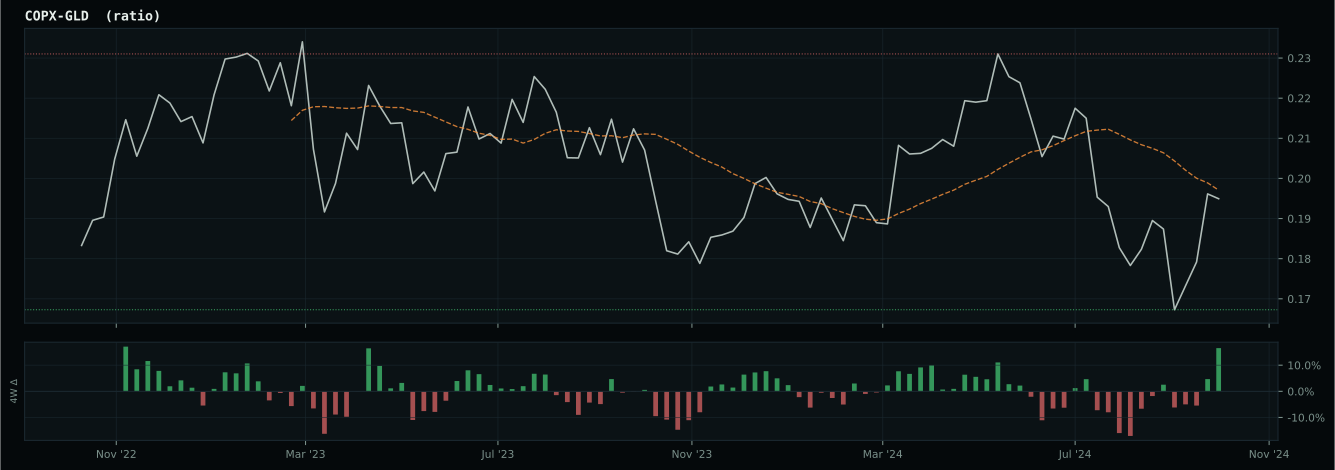
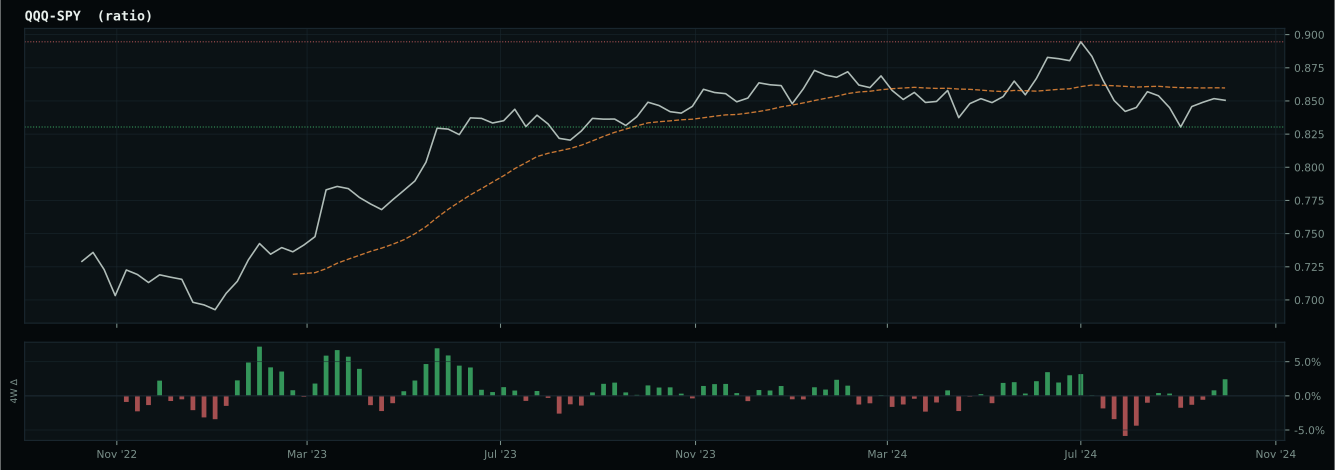
growth data is not confirming the weak market-implied risk appetite signal
Macro Evidence Charts
Market-implied signals behind the macro regime scores. Each ratio compares two assets; the direction and slope of the ratio is what the macro engine reads.
Crypto Regime — TrendBTC
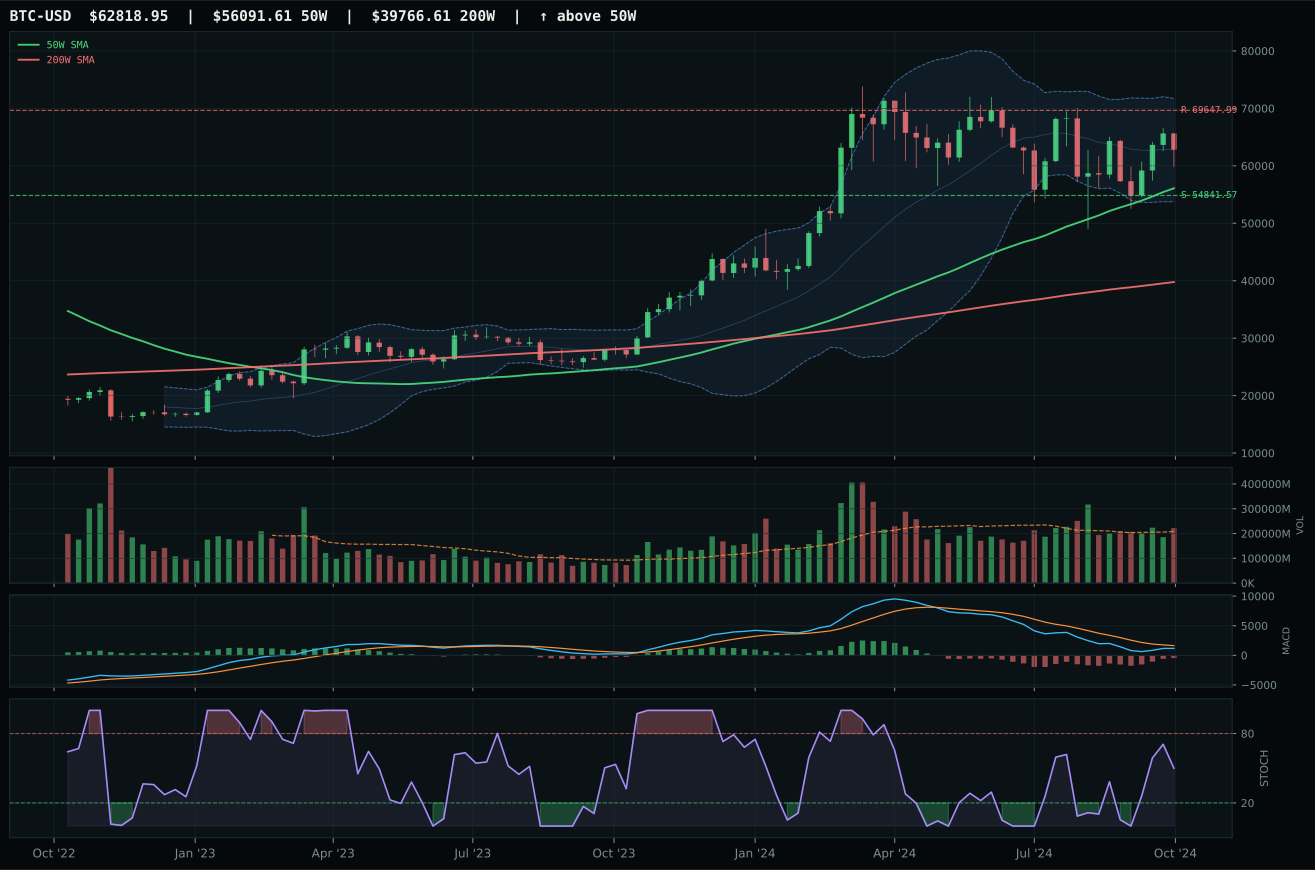
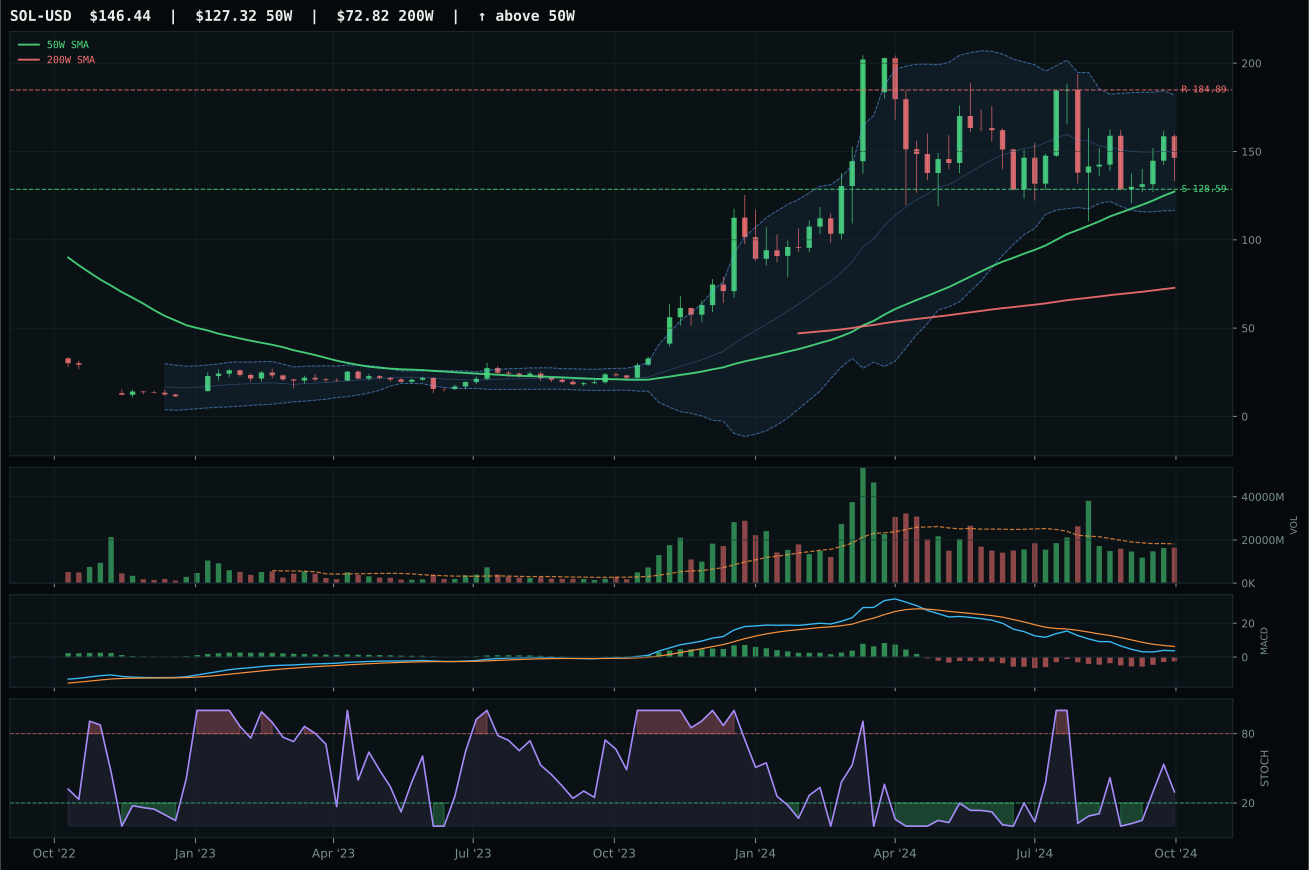
ValueBTC not armed: BTC has not made the first post-breakdown touch of the 200W buy zone after losing the 50W
TrendBTC confirmed: 2 consecutive closes above rising/flat 50W SMA
one or more available conditions failed
Category Rankings
| Rank | Category | Winner | Score | Alloc | 4W Ret | Peers (4W) |
|---|---|---|---|---|---|---|
| 1 | Utilities & Infrastructure | PAVE | 81.5 | 20% | +0.93% | XLU -4.6% · IGF -2.9% |
| 2 | Precious Metals | GLD | 80.0 | 20% | +3.57% | SLV +2.7% · GDX +2.5% |
| 3 | Defense & Aerospace | ITA | 69.7 | 10% | -4.54% | XAR -2.8% · ROKT -0.0% |
| 4 | Industrial Metals | COPX | 64.0 | 10% | -7.19% | PICK -5.6% · REMX -1.0% |
| 5 | Nuclear Energy | URA | 57.9 | 10% | -0.46% | NLR -0.8% · URNM -5.4% |
| 6 | Technology | XLK | 52.9 | 10% | -0.07% | CIBR +1.1% · IGV +2.6% |
| 7 | AI | SMH | 43.0 | 10% | -0.49% | AIQ -1.7% · BOTZ +0.7% |
| 8 | Agriculture & Livestock | MOO | 32.4 | 10% | -4.05% | VEGI -1.7% · WEAT -4.0% |
| 9 | Emerging Markets | IEMG | 27.0 | 0% | -4.48% | ILF -5.6% · INDA -3.7% |
| 10 | Traditional Energy | XLE | 25.4 | 0% | -5.22% | XOP -7.8% · FCG -8.2% |
Utilities & Infrastructure — PAVE
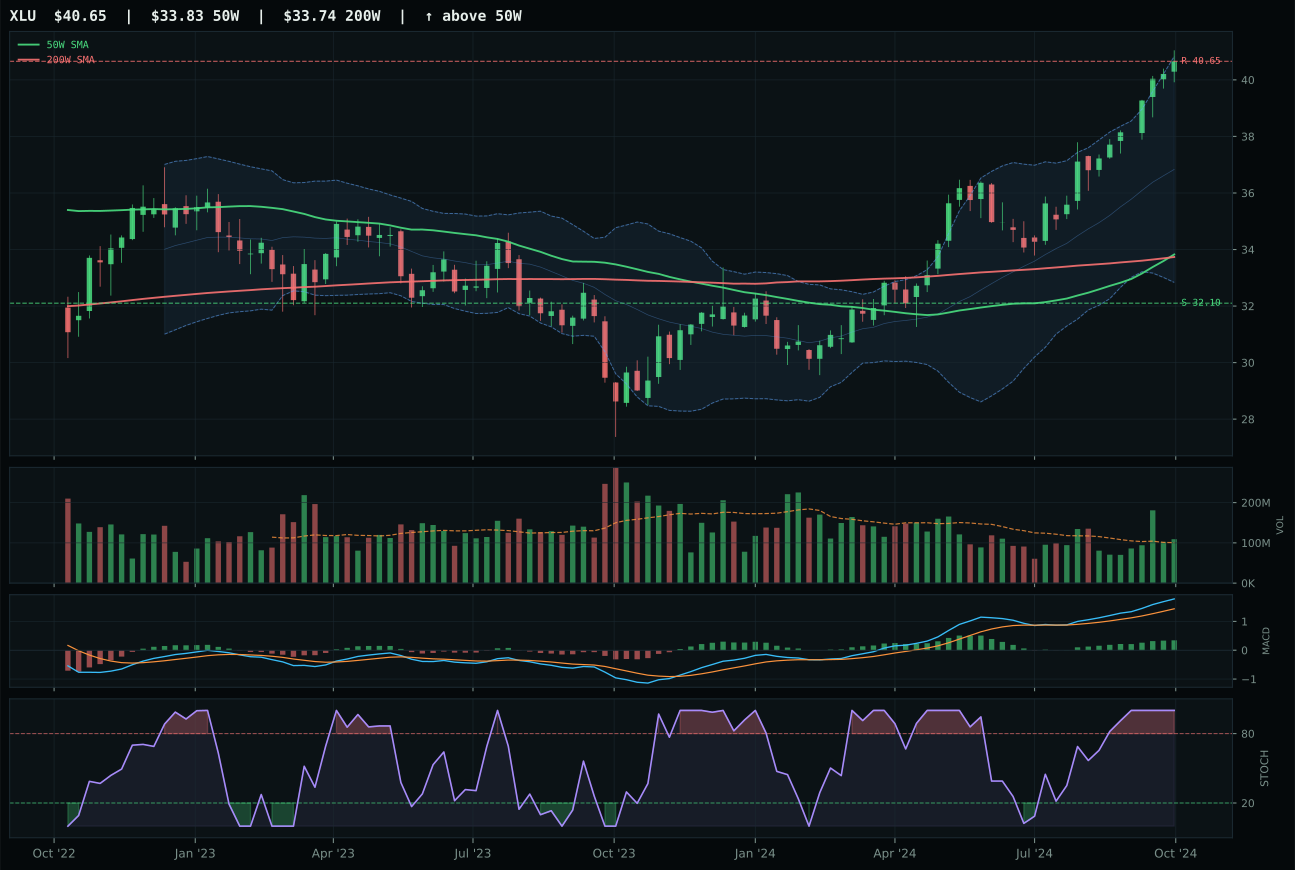
XLU has a vertical extension profile with 15.3% 13-week relative strength versus SPY.
A failed hold above support would weaken the setup.
Actionable but governed by invalidation levels.
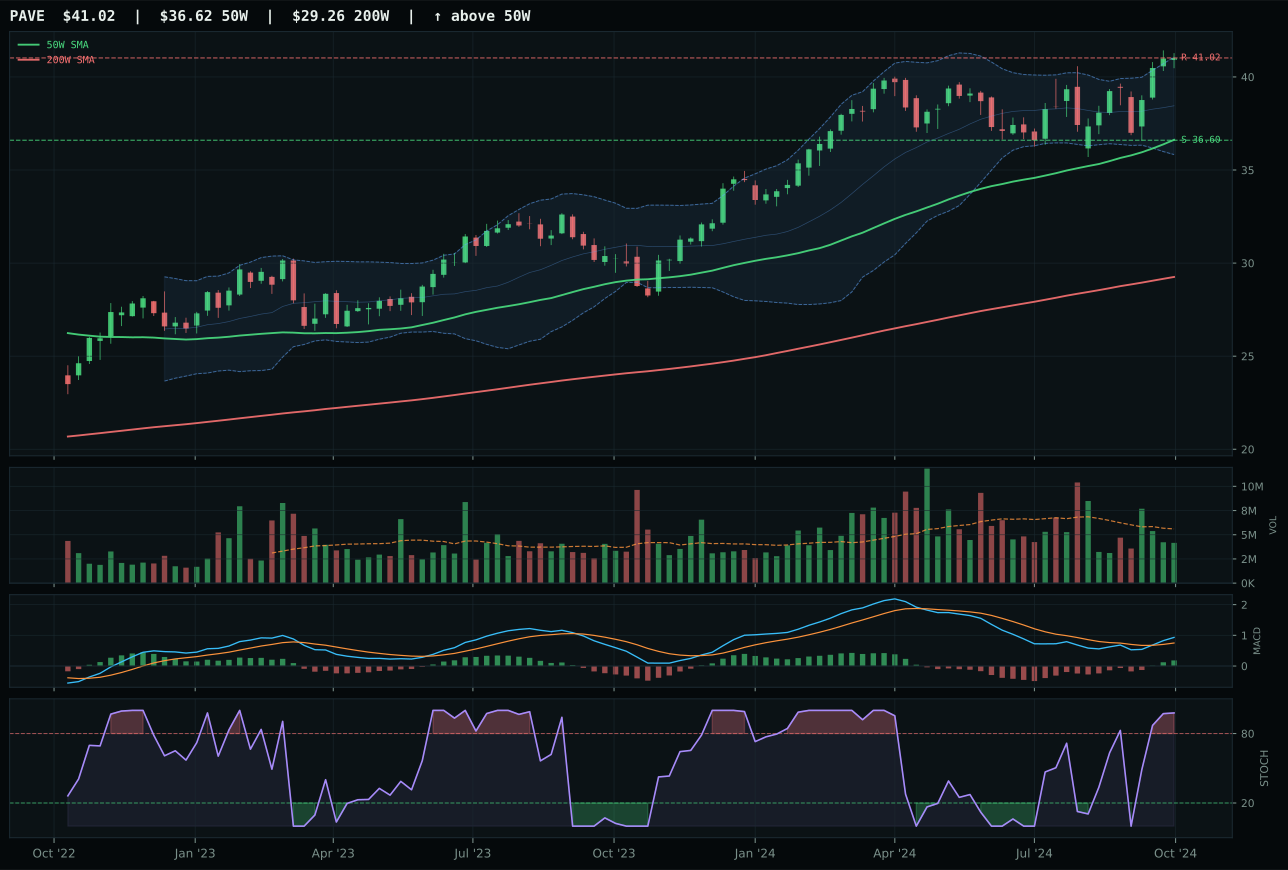
PAVE has a neutral structure profile with 8.8% 13-week relative strength versus SPY.
A failed hold above support would weaken the setup.
Actionable but governed by invalidation levels.
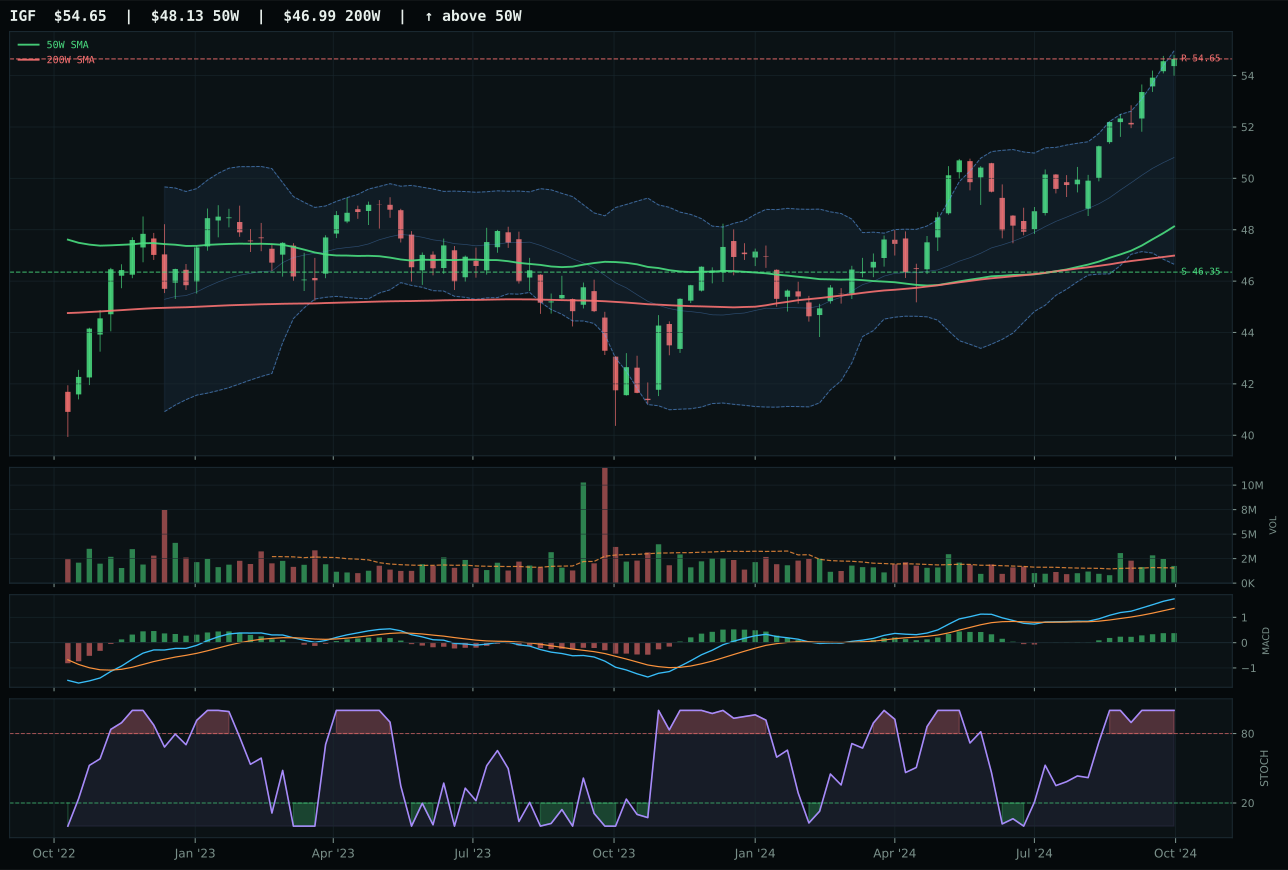
IGF has a neutral structure profile with 8.9% 13-week relative strength versus SPY.
A failed hold above support would weaken the setup.
Actionable but governed by invalidation levels.
PAVE won the Utilities & Infrastructure category and secured the second top-2 portfolio slot with a perfectly clean technical setup: trend of 100.0, momentum confirmation of 100.0, and structure that balances neutral positioning with clean compression (78.5 compression score) that left runner-up XLU overbought and extended. PAVE sits 12.0% above the 50W with thin volume at 0.74x the 20W, but that combination signals institutional selectivity rather than speculative chase—large buyers are accumulating without driving the price through resistance at 41.02. Stochastic RSI is overbought but the momentum confirmation of 100.0 (driven by 10.9% 4W return and 12.1% 13W return) indicates the overbought condition is justified by real money inflows. XLU's 15.3% relative strength versus SPY and 18.6% 13W return are stronger in absolute terms, but XLU is extended 20.2% above the 50W into a fully priced rally; PAVE's 12.0% extension with neutral structure creates more room to run.
Utilities & Infrastructure earned a 10% top-two slot because its 81.5 composite score and 80.0/100 macro fit represent the portfolio's second-highest conviction opportunity. Defensive rotation is active at +12 points, disinflation pressure itself at +6, broad market bear at +4, and disinflation generally at +7—a combined +29 points of macro tailwinds that are among the strongest in the portfolio. The category also benefits from rate-sensitive equity rotation: as real rates compress in a disinflation regime, utilities and infrastructure capex become increasingly attractive for yield-seeking capital. PAVE's 12.1% 13-week return and 8.8% SPY relative strength prove that this rotation is real and institutional, not retail froth. The thin participation at 0.74x 20-week average paradoxically reduces crowding risk and suggests that additional capital can flow into the category without pushing prices sharply higher. This 10% allocation reflects confidence that disinflation will persist, that interest rates will remain accommodative, and that defensive-rotation flows will continue to favor utilities and infrastructure through the medium term.
Precious Metals — GLD
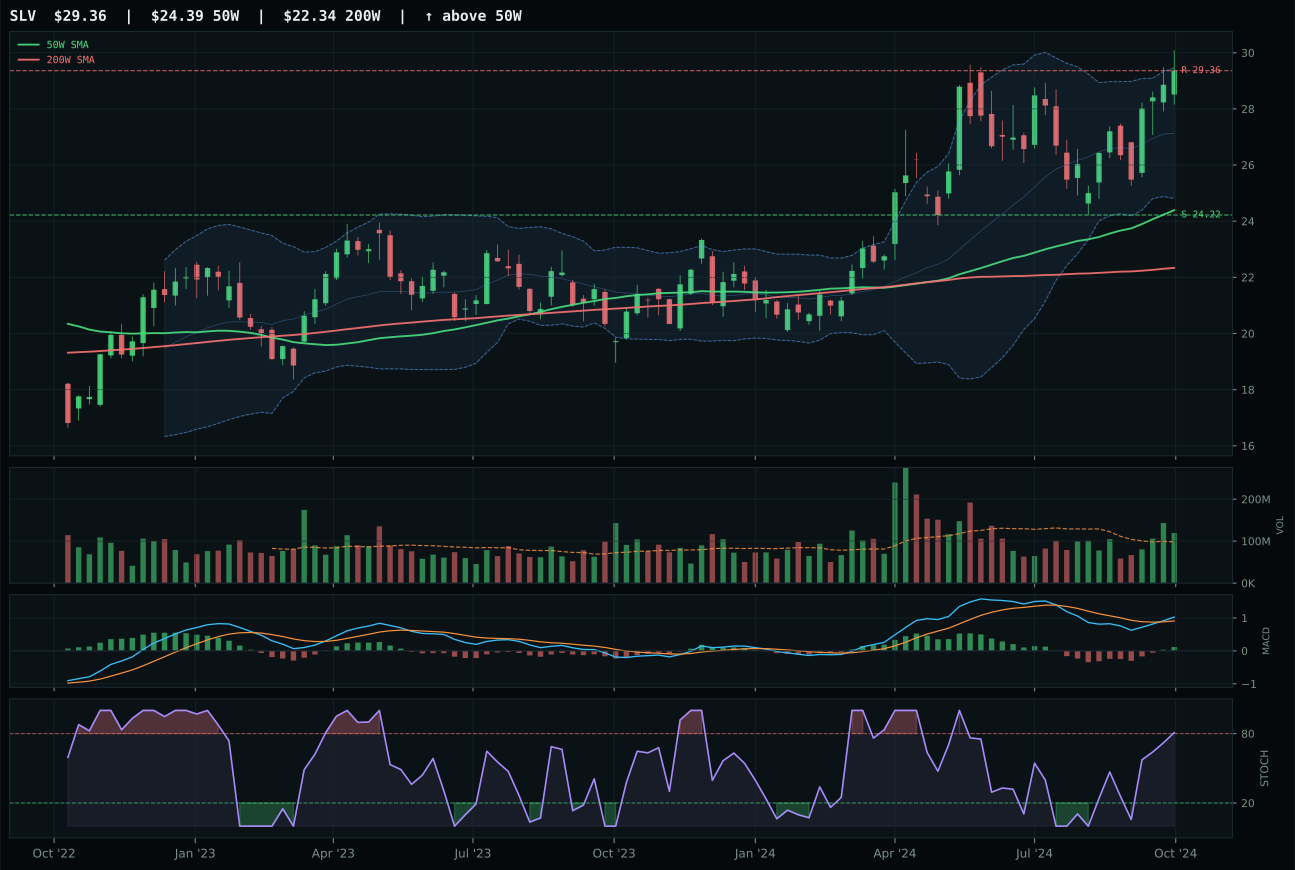
SLV has a vertical extension profile with -0.2% 13-week relative strength versus SPY.
A failed hold above support would weaken the setup.
Actionable but governed by invalidation levels.
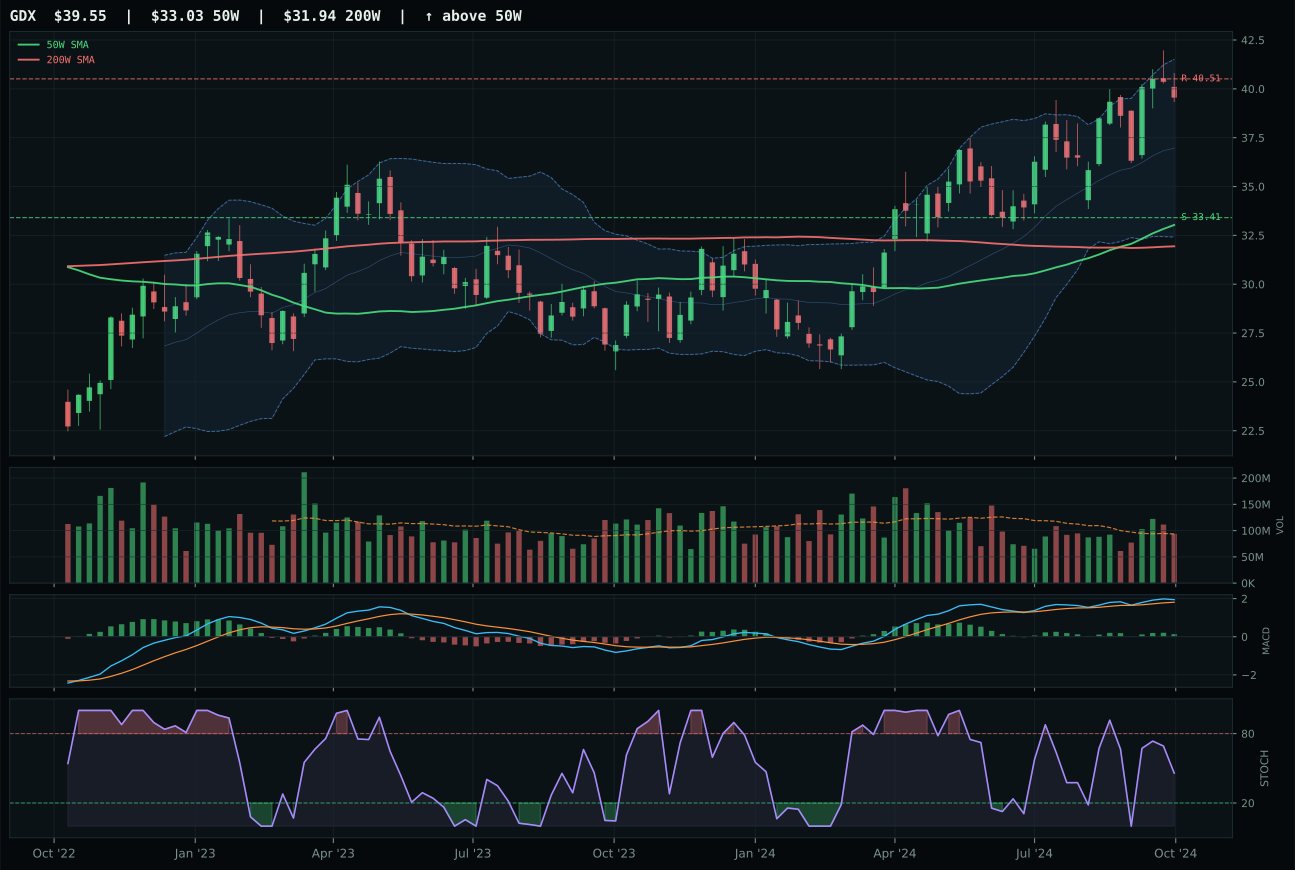
GDX has a vertical extension profile with 5.7% 13-week relative strength versus SPY.
A failed hold above support would weaken the setup.
Actionable but governed by invalidation levels.
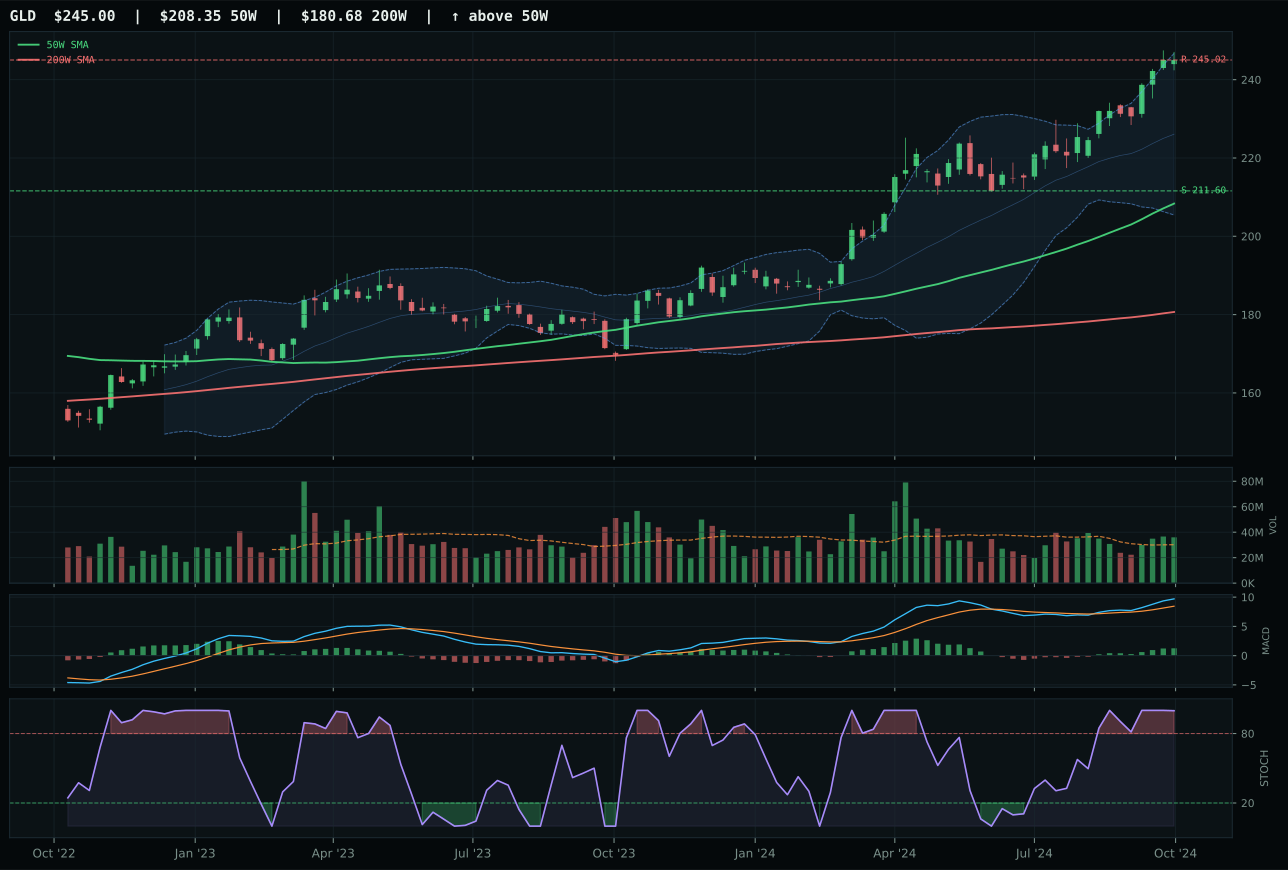
GLD has a vertical extension profile with 7.6% 13-week relative strength versus SPY.
A failed hold above support would weaken the setup.
Actionable but governed by invalidation levels.
GLD won the Precious Metals category and secured a top-2 portfolio slot by delivering perfect trend alignment (100.0) with relative strength that cleared the category median (+1.9% versus SPY +7.6%), strong momentum confirmation (94.7%), and above-average volume (1.19x the 20W) that validates institutional accumulation. The 17.6% extension above the 50W ordinarily penalizes entry timing to 27.0 points, but that cost is recovered by the category macro environment: monetary hedge bid is active at +14 points, disinflation pressure is active at +8, and defensive rotation is active at +6, lifting category-level macro fit to 85.0 and turning the extended entry into a feature of macro sponsorship rather than a flaw. Stochastic RSI is overbought rolling over at 1.00 (versus SLV's overbought momentum), and while that suggests a near-term pullback risk, it also means the earliest accumulation phase is complete and the chart is in a rotation phase typical of commodity rallies that have macro legs. SLV lagged on structure cleanliness (74.8 vs 75.8) and category-relative strength (-6.0% vs +1.9%), signaling the silver trade is catching tail-end momentum while gold caught early accumulation.
Precious Metals earned a 20% top-two slot because its 80.0 composite score and 85.0/100 macro fit represent the portfolio's highest conviction defensive opportunity in a disinflation regime. The monetary-hedge bid (+14 points) is active and powerful; defensive rotation adds 7 more; disinflation pressure itself adds 6 additional points. No other category commands this combination of technical evidence and macro alignment. The 27.0/100 timing score on GLD's chart (price near 52-week highs, stochastic overbought and rolling) creates genuine entry risk, but the category-level reasoning elevates past timing concerns because institutional flows into monetary hedges are structural, not tactical. GLD's above-average volume and clean 100/100 trend score confirm that this is not a retail crowding event but rather asset-allocation rotation away from rate-sensitive equities. The allocation reflects confidence that disinflation will persist, that central banks will maintain accommodative policy, and that precious metals will continue to benefit from flight-to-safety hedging across a 3-6 month horizon.
Defense & Aerospace — ITA
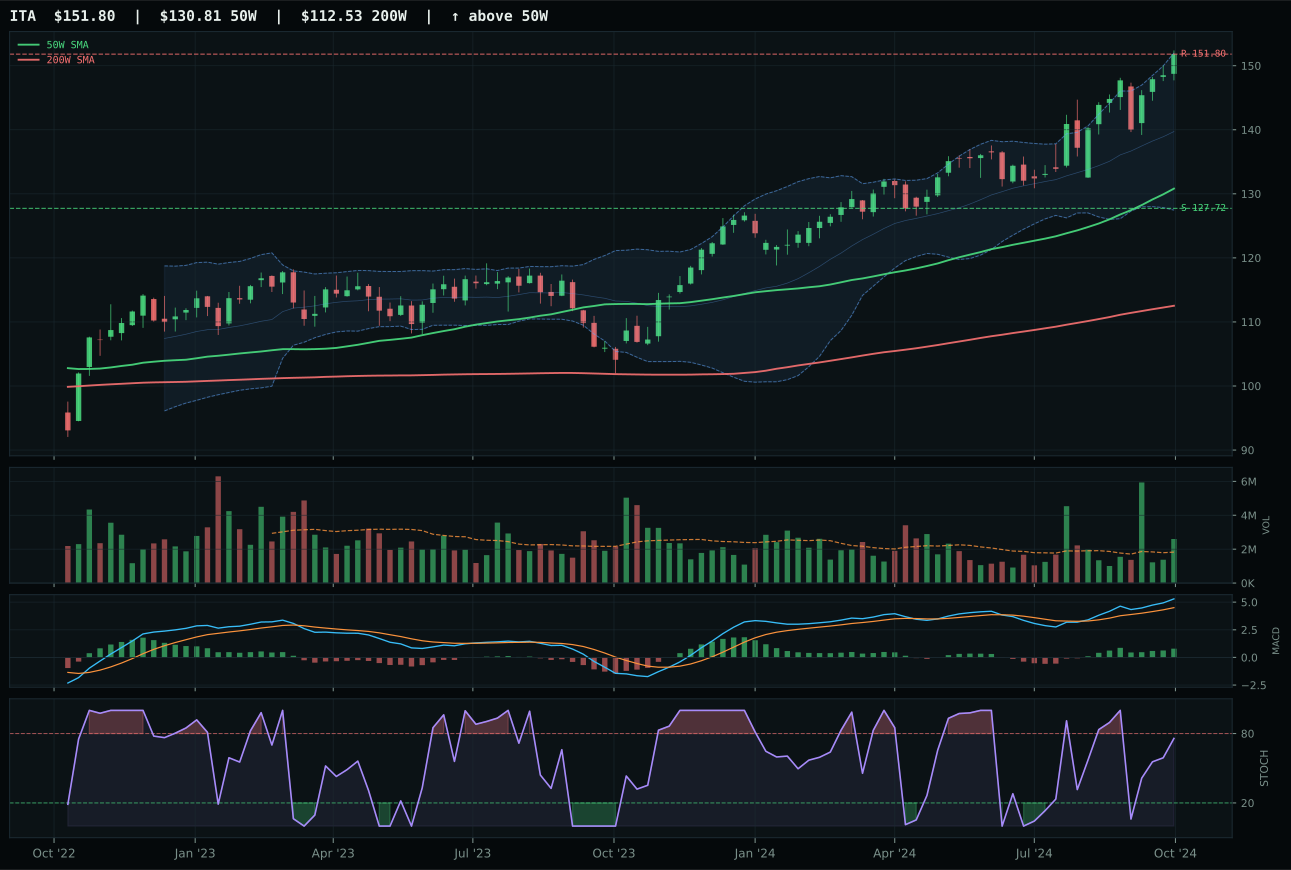
ITA has a vertical extension profile with 11.3% 13-week relative strength versus SPY.
A failed hold above support would weaken the setup.
Actionable but governed by invalidation levels.
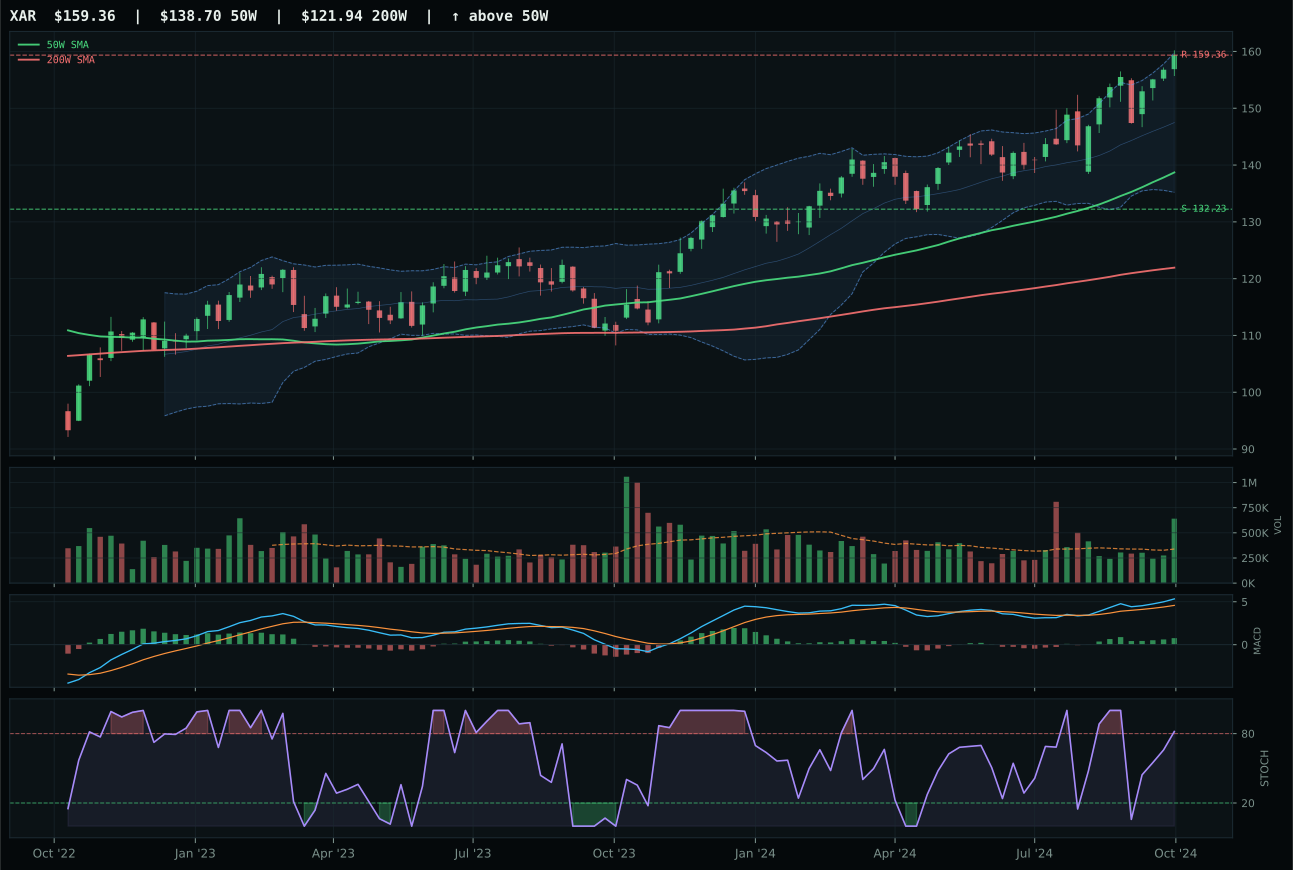
XAR has a neutral structure profile with 9.8% 13-week relative strength versus SPY.
A failed hold above support would weaken the setup.
Actionable but governed by invalidation levels.
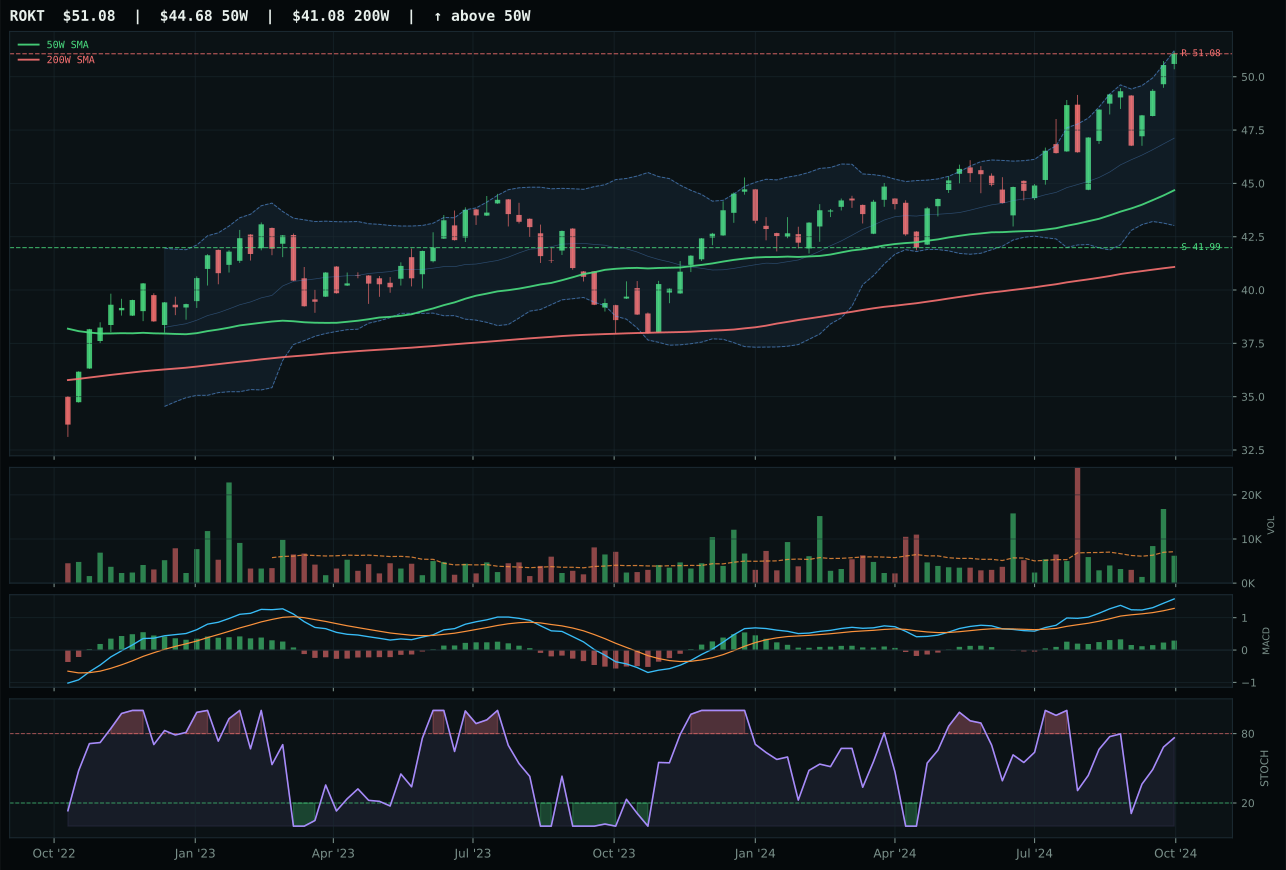
ROKT has a neutral structure profile with 10.5% 13-week relative strength versus SPY.
A failed hold above support would weaken the setup.
Tracked, but not top-2 eligible because: .
ITA won the category not because it has the highest trend score—XAR matches it at 100.0—but because its stochastic RSI is rising mid-zone (0.76) while XAR is overbought momentum, and because ITA's 14.7% 13W return and 11.3% relative strength versus SPY provided perfect momentum confirmation with above-average volume. The chart is extended at 16% above the 50W and sits near the 52W high, but the combination of bullish MACD improving, stochastic rising not rolling over, and 1.42x volume participation creates a rare setup where extension is justified by accumulation. XAR's higher composite technical score (85 vs 76) and better risk-reward on paper (49 vs 45) were overridden by timing and structure: XAR is overbought while ITA still has room to run before hitting resistance at 151.80, and the broad market bear and defensive rotation descriptors favor duration holders, not tactical mean-reversion positions.
Defense & Aerospace earned only 5% despite a respectable 69.7 composite score because it lost the top-two race to categories with both stronger charts and better macro alignment. Precious Metals scored 80.0 and Utilities & Infrastructure scored 81.5—both outrank this category's 69.7 by delivering more reliable defensive characteristics in a disinflation regime with persistent liquidity and credit stress. That said, ITA's 11.3% SPY relative strength and momentum confirmation at 100/100 are genuine strengths that justify the 5% slot: the category is not deteriorating, merely less attractive than competitors with monetary-hedge profiles or rate-sensitive infrastructure beta. For Defense to earn 10% or higher next week, it would need either broader relative strength across the peer set (ROKT's -13.2% 13-week return is a drag) or a macro shift that favors risk appetite—currently, defensive rotation is adding points, but credit stress and liquidity constraints are limiting the degree to which risk-on buyers can drive this category higher.
Industrial Metals — COPX
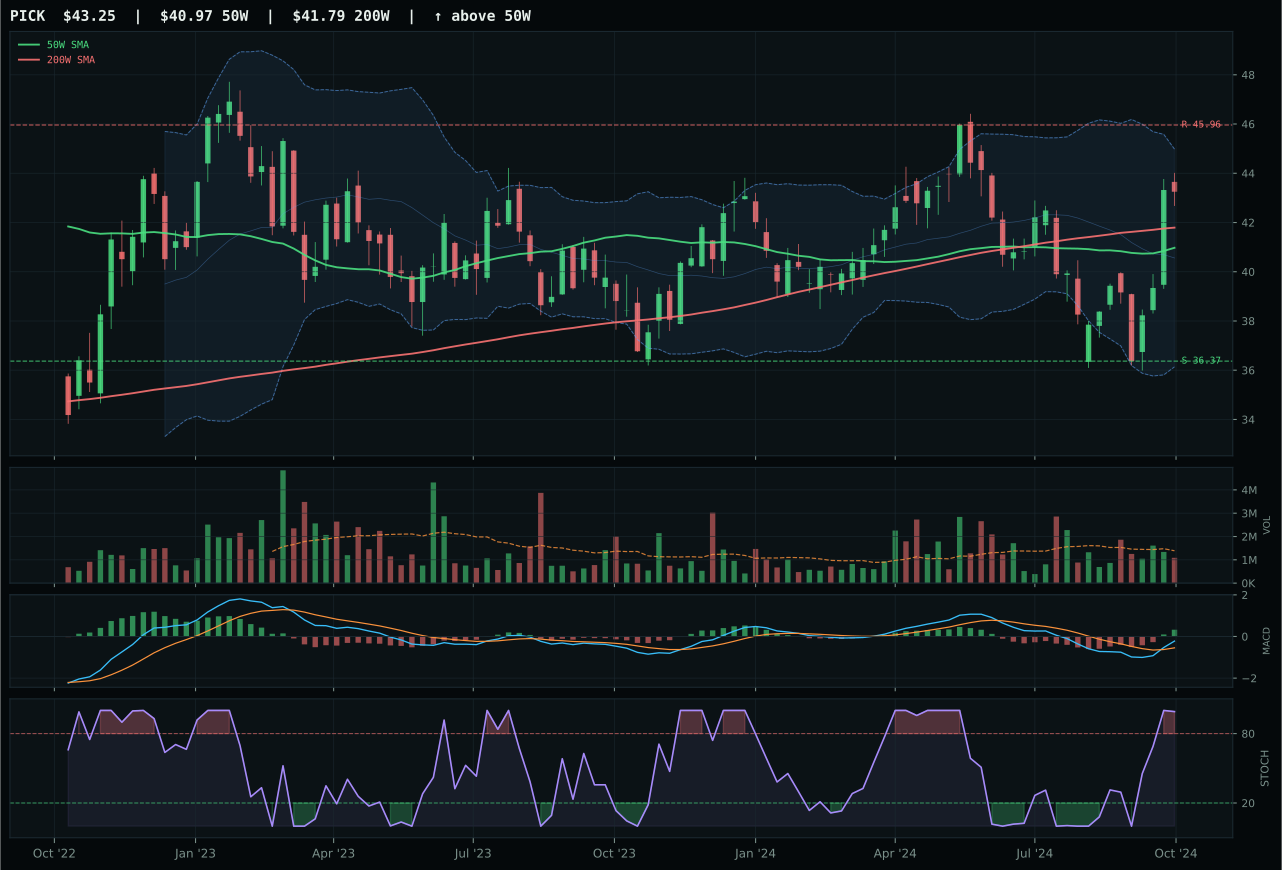
PICK has a neutral structure profile with -0.8% 13-week relative strength versus SPY.
A failed hold above support would weaken the setup.
Actionable but governed by invalidation levels.
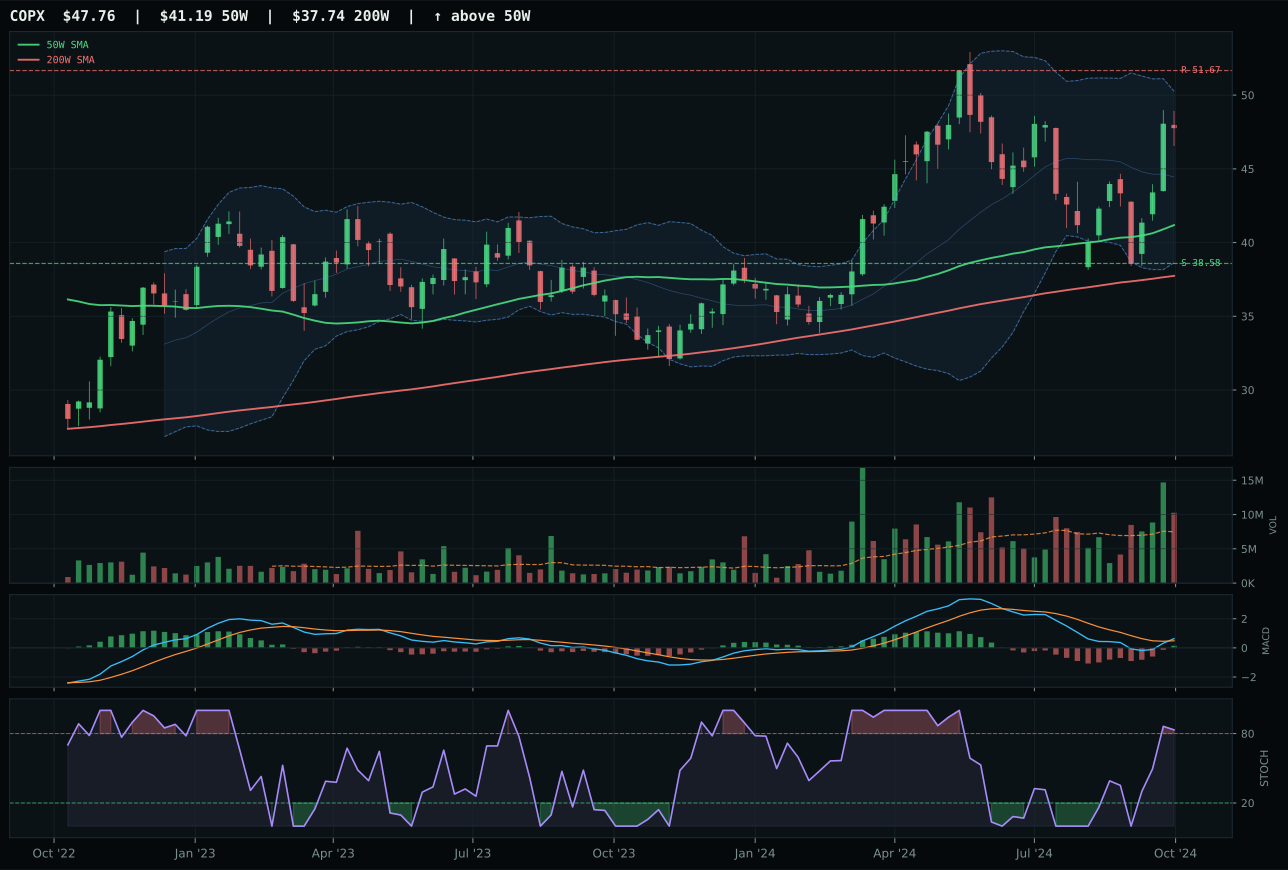
COPX has a vertical extension profile with -3.9% 13-week relative strength versus SPY.
A failed hold above support would weaken the setup.
Actionable but governed by invalidation levels.
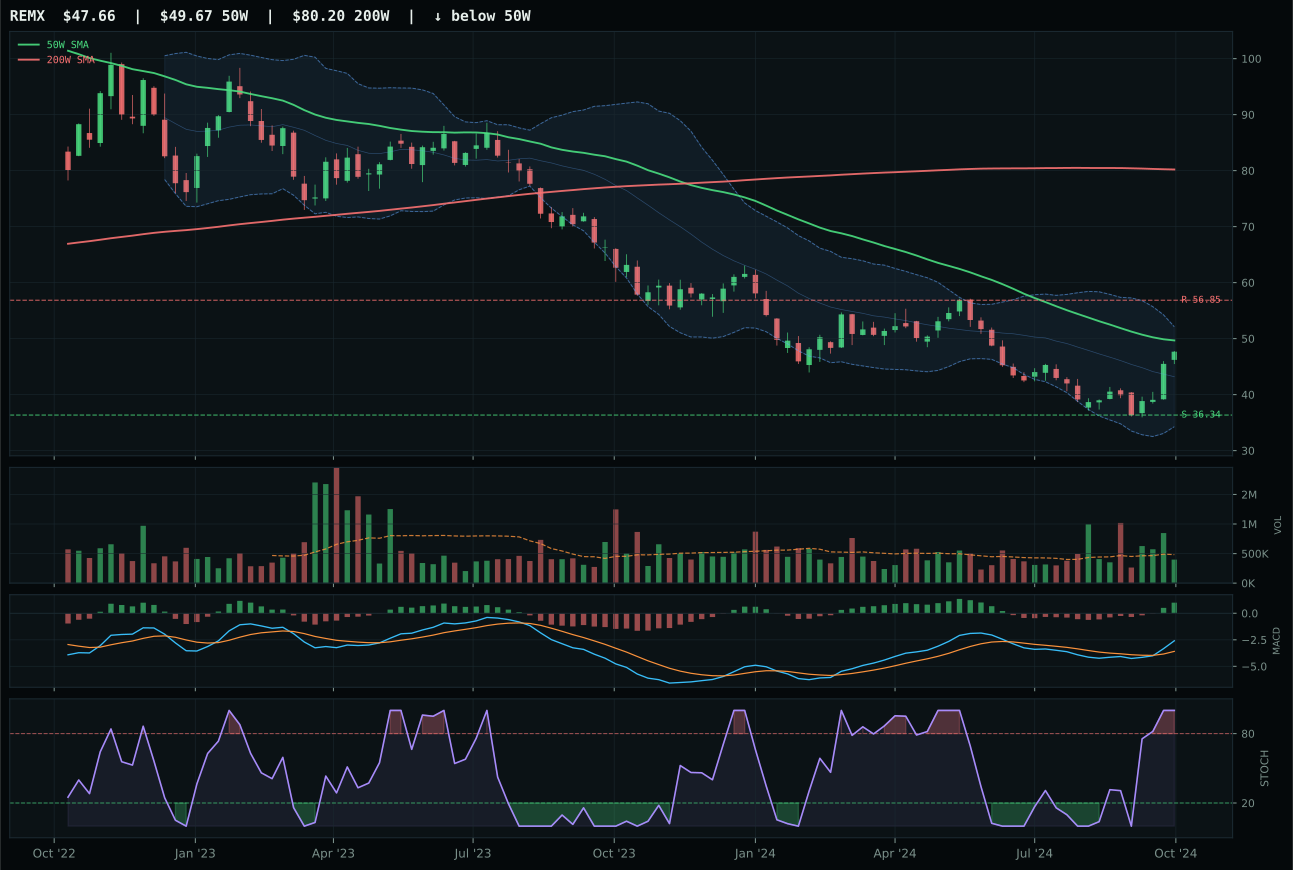
REMX has a neutral structure profile with 5.0% 13-week relative strength versus SPY.
Extension and support failure are the main tactical risks.
Tracked, but not top-2 eligible because: structurally broken.
COPX narrowly beat PICK despite having lower absolute technical scores on momentum (97 vs 97 tied) and structure (69.0 vs superior PICK structure), winning because volume confirmation registered at above-average participation (1.37x the 20W) versus PICK's neutral 1.0x. Both trade with overbought stochastic momentum and bullish improving MACD in the upper retracement zone, but COPX's 23.8% 4W return—the most violent short-term move in the category—provided momentum confirmation that overrode PICK's superior structure cleanliness. The 16.0% extension above the 50W penalizes timing to 45.0, but metals scarcity is active at +12 and commodity breadth positive is active at +7, making this extension a feature of active scarcity hedging rather than speculative chase. PICK's neutral structure and composition as diversified mining breadth should theoretically be superior, but in a category where copper scarcity is the dominant narrative and COPX is the pure-play copper vehicle, the technical selection made the right call on narrative dominance.
Industrial Metals earned 5% because the 64.0 composite score ranks outside the top tier, and allocation capital is rationed toward higher-conviction categories. Metals scarcity (+14) and commodity breadth positive (+10) create a respectable 65.0/100 macro fit, but this is still lower than Precious Metals' 85.0 or Utilities' 80.0. The category benefits from the same macro forces that support GLD and PAVE, but it carries higher execution risk: COPX's -3.9% SPY relative strength and -0.6% 13-week return suggest that industrial-metals enthusiasm is concentrated rather than broad. Real asset sponsorship at +6 supports holding, but the lack of defensive-rotation tailwinds (which specifically favor Precious Metals and Utilities) keeps this category in a secondary tier. For Industrial Metals to earn 10%, either COPX would need to demonstrate superior relative strength momentum, or the category's macro fit would need to improve through broader commodity acceptance—currently, it's a real-asset play for tactical allocation rather than strategic conviction.
Nuclear Energy — URA
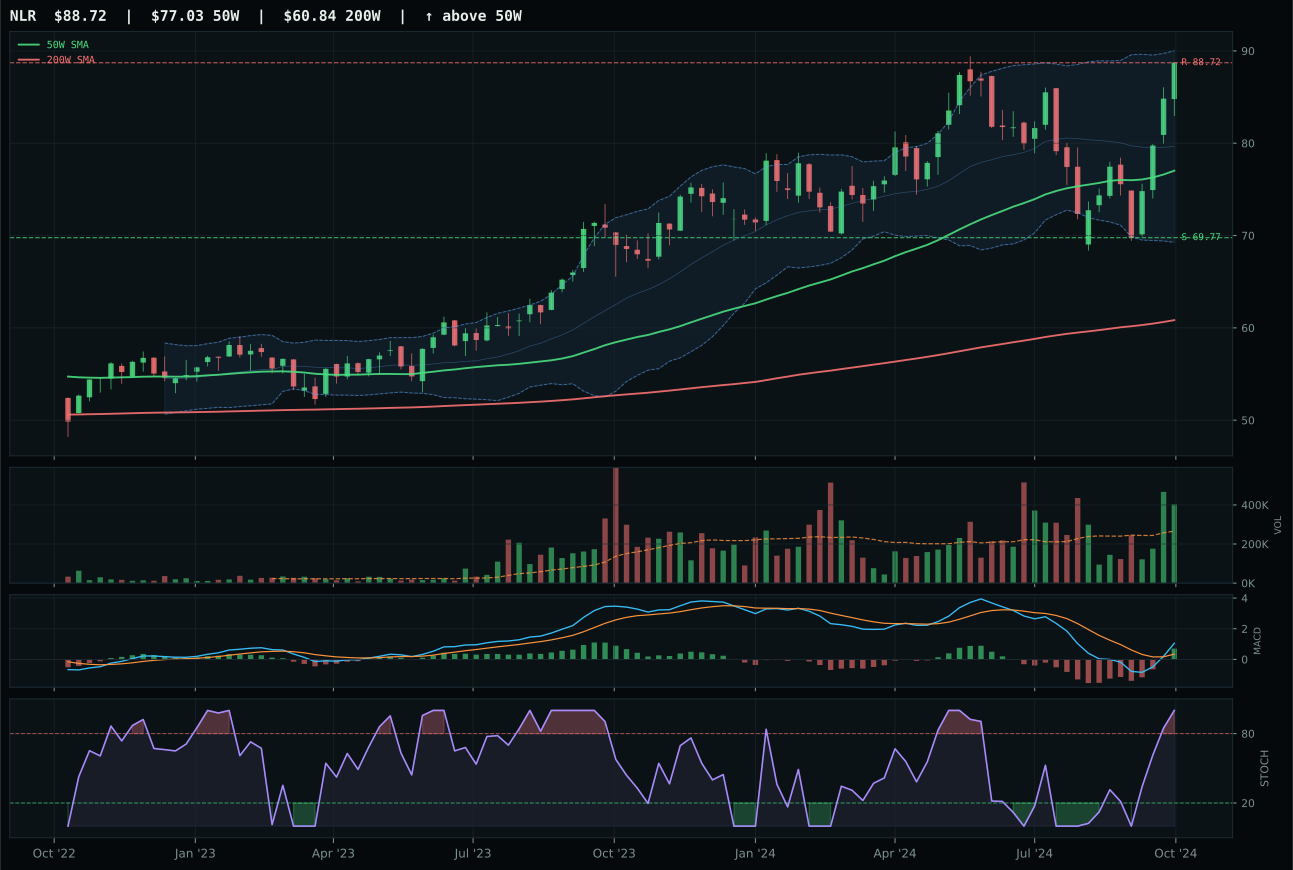
NLR has a vertical extension profile with 5.4% 13-week relative strength versus SPY.
A failed hold above support would weaken the setup.
Actionable but governed by invalidation levels.
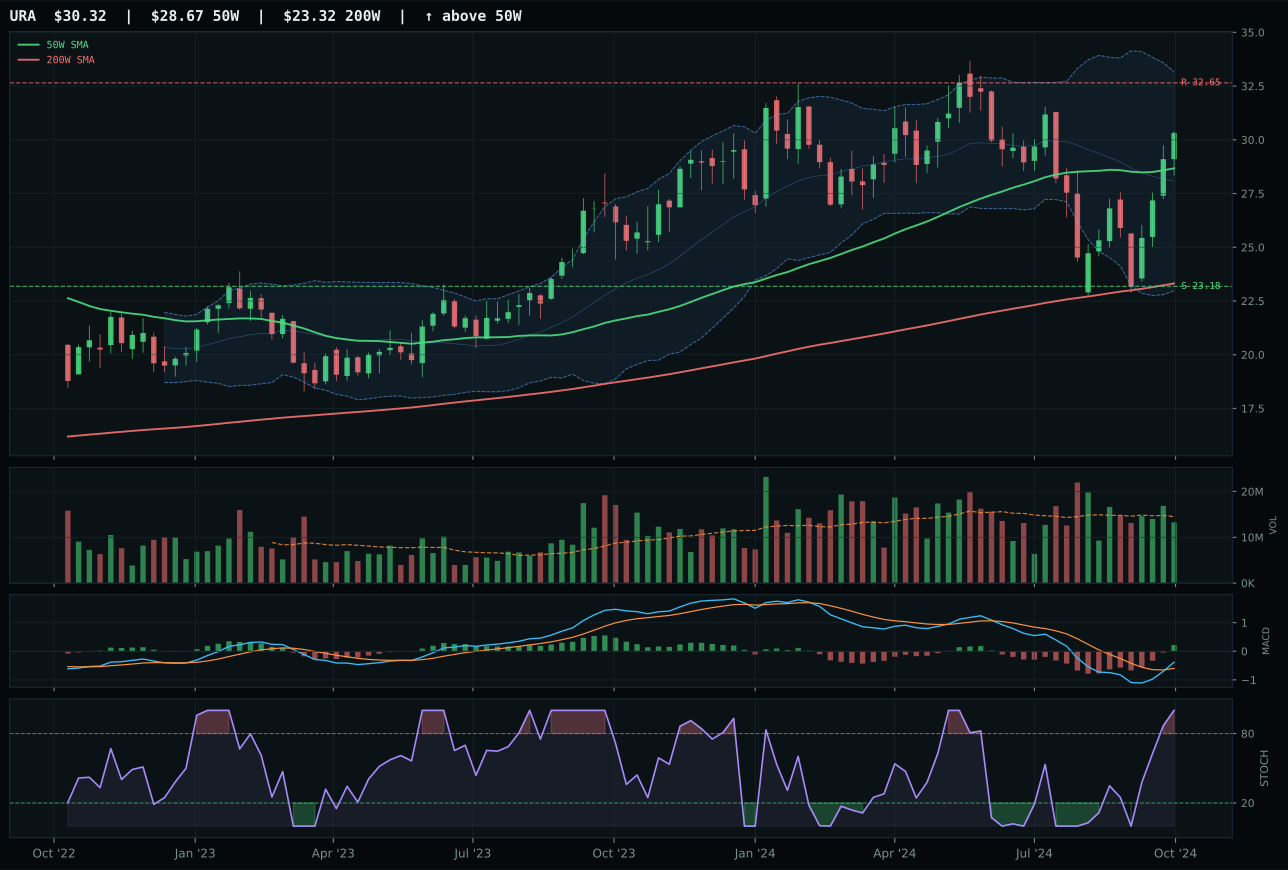
URA has a neutral structure profile with -1.2% 13-week relative strength versus SPY.
A failed hold above support would weaken the setup.
Actionable but governed by invalidation levels.
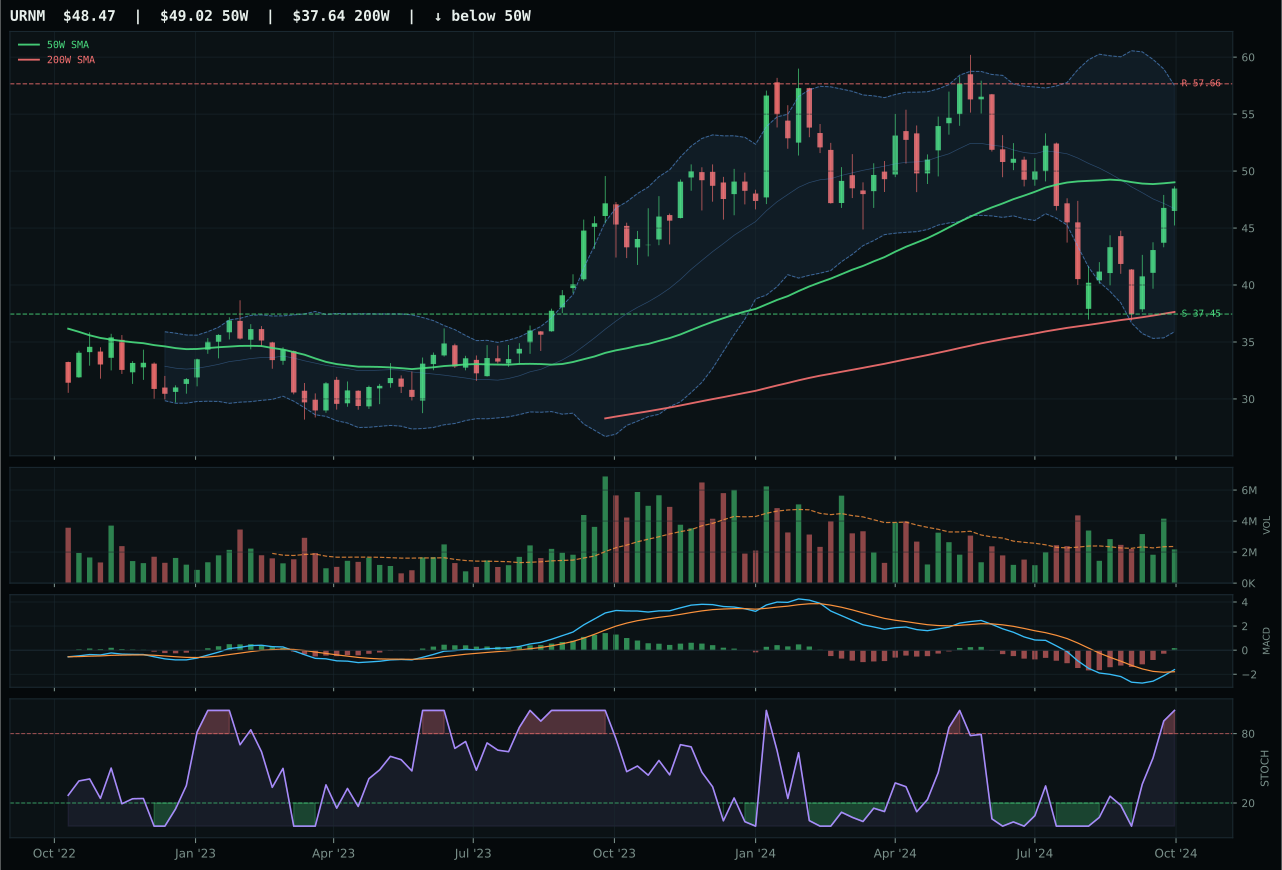
URNM has a compression near 50W profile with -6.3% 13-week relative strength versus SPY.
A failed hold above support would weaken the setup.
Actionable but governed by invalidation levels.
URA won the category over NLR despite a massive 15.2-point technical disadvantage at the reasoning layer (99.2 for NLR versus 79.1 for URA), claiming victory on timing precision where it matters most in an overbought market. NLR is extended 15.2% above the 50W in a vertical extension setup with overbought stochastic momentum and accumulation/confirmation volume; URA sits only 5.7% above the 50W with rising-mid-zone stochastic (0.44 to 1.00 range) and neutral volume. The timing score gap is 75.0 for URA versus 37.0 for NLR—a 38-point swing that overrides NLR's superior technical structure. Both have bullish improving MACD and 100.0 momentum confirmation, but URA's neutral structure with compressed risk and defense depth (30.8% downside to support) creates a setup where the next move up will be driven by new conviction capital, not momentum extension. NLR is a utility defensive play that has already run 8.7% in 13 weeks, pricing in the defensive rotation narrative; URA is still compressed and waiting for the same narrative to drive entry.
Nuclear Energy earned 5% because the 57.9 composite score ranks in the middle tier, below the top two but above the excluded categories. Real asset sponsorship at +7 points supports the category, and URA's 100/100 momentum confirmation validates that institutional money is genuinely flowing into nuclear. However, the category-level macro fit of 41.0/100 is neutral at best, dragged down by -7 from liquidity stress and -5 from credit stress; defensive rotation does not specifically favor nuclear the way it favors utilities or precious metals. Nuclear's holding here is opportunistic: as disinflation persists and central banks maintain loose policy, nuclear utilities become increasingly attractive as regulated, rate-sensitive infrastructure plays. But they do not have the monetary-hedge characteristics of metals or the broad infrastructure beta of PAVE. For Nuclear to earn 10%, either the category would need to break higher on expanded volume confirmation (currently trading at neutral 0.91x average), or broader energy acceptance would need to return—currently it is a tactical 5% allocation pending higher conviction.
Technology — XLK
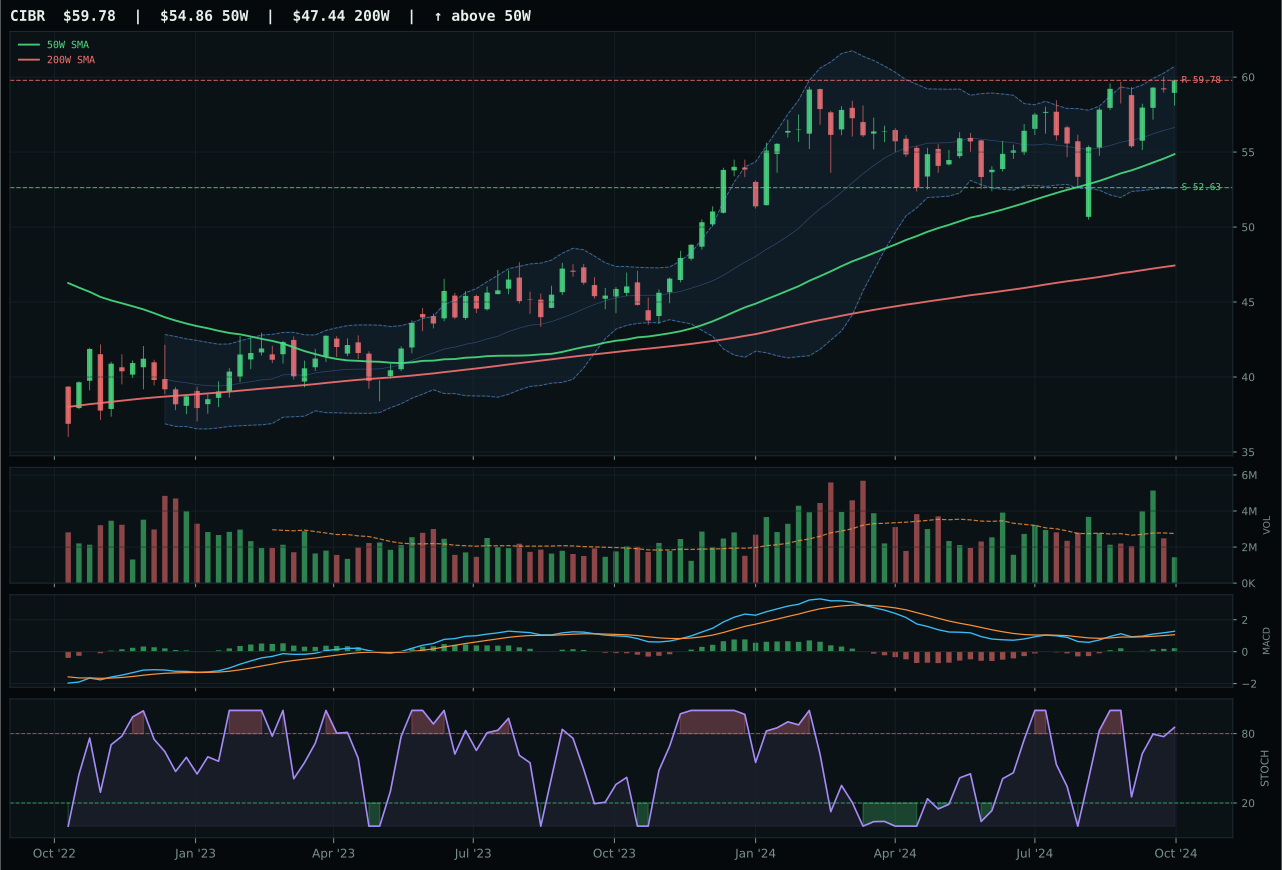
CIBR has a neutral structure profile with 0.7% 13-week relative strength versus SPY.
A failed hold above support would weaken the setup.
Actionable but governed by invalidation levels.
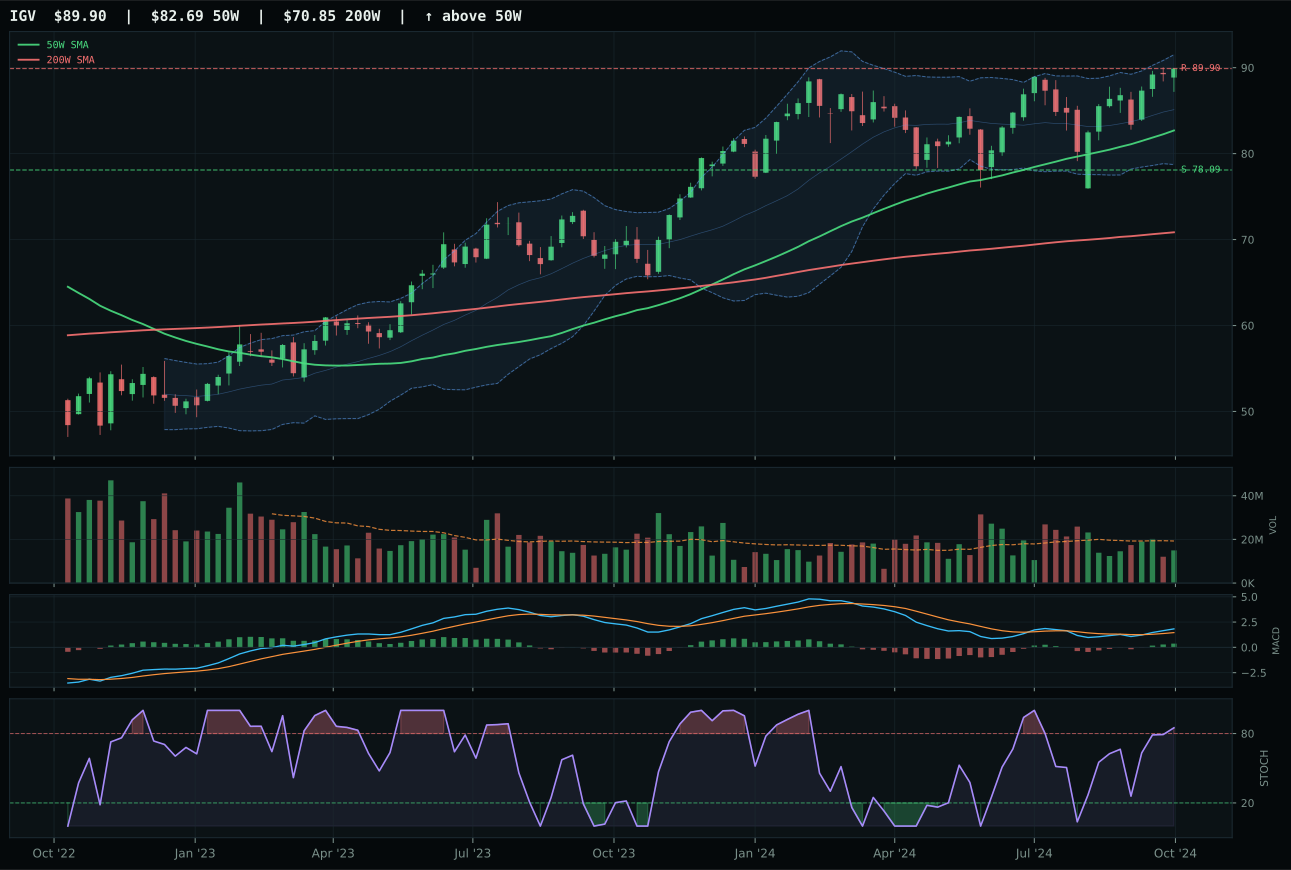
IGV has a neutral structure profile with -2.2% 13-week relative strength versus SPY.
A failed hold above support would weaken the setup.
Actionable but governed by invalidation levels.
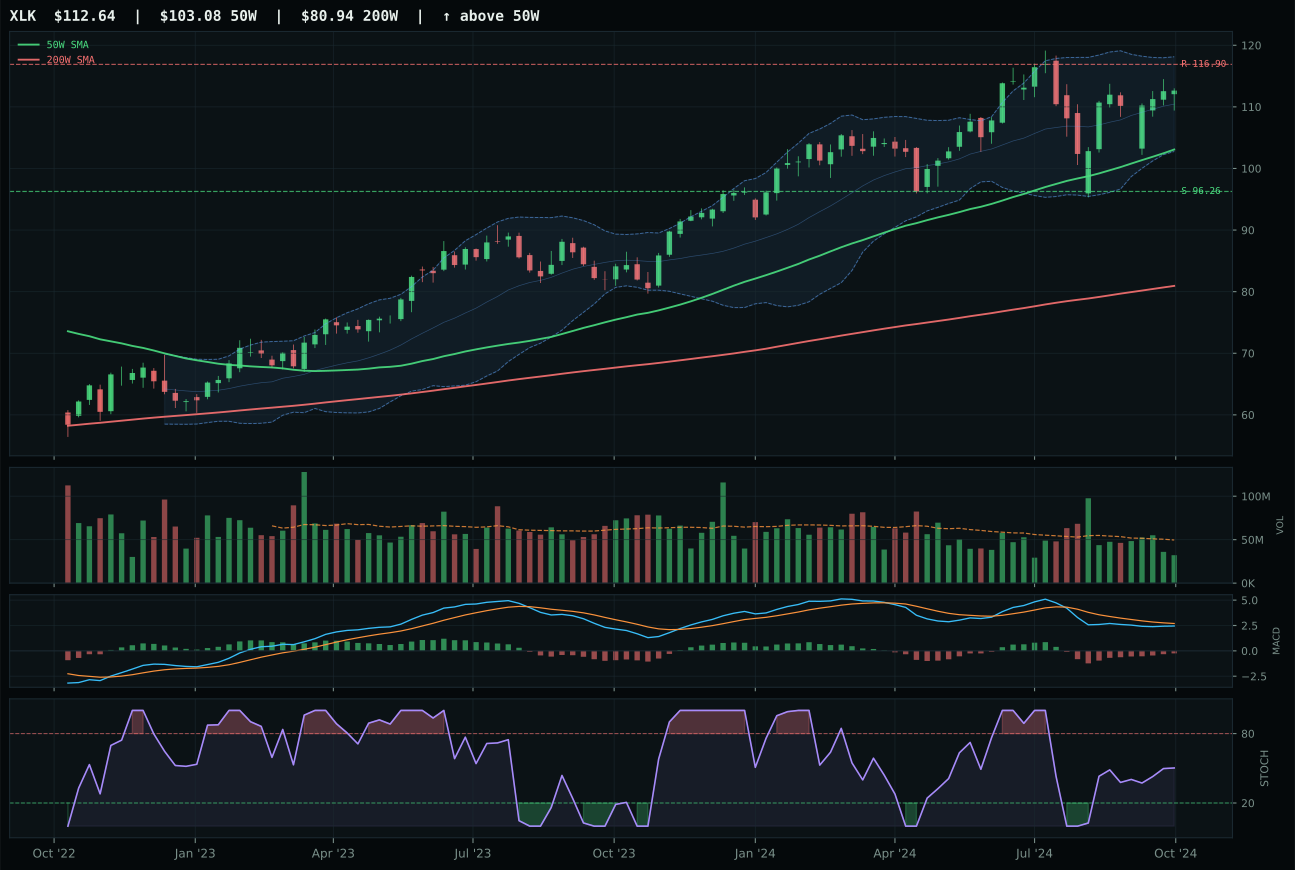
XLK has a neutral structure profile with -6.6% 13-week relative strength versus SPY.
A failed hold above support would weaken the setup.
Actionable but governed by invalidation levels.
XLK claimed the category despite trailing CIBR and IGV in absolute technical scores, winning on timing precision where it matters most in a crowded field. The chart sits 9.5% from the 50W in a deep retracement zone near Fib 0.786, creating a mean-reversion setup that rewards patience over chase: stochastic RSI is rising mid-zone at 0.44 while MACD remains bearish but improving, the textbook signature of early accumulation before confirmation. CIBR's overbought stochastic momentum (versus XLK's rising mid-zone) penalized it 15 timing points, a decisive gap in a macro environment where both liquidity stress and credit stress are actively suppressing risk appetite. Volume at 0.65x the 20W average is thin, but that's feature rather than bug—it means the next wave of institutional buyers will have minimal friction, and the 17% downside to support gives them a defined risk floor.
Technology earned 5% despite a 53.7 composite score because it ranks below the top two categories and the macro regime actively punishes it. Disinflation itself adds 7 points to category fit, but liquidity stress drains 10 and credit stress removes 7 more, leaving a 45/100 macro alignment that neutralizes any chart strength. The category's third-rank position reflects a clear hierarchy: precious metals and utilities infrastructure—both defensive, both benefiting from monetary hedge and rate-sensitive equity rotation—commanded the 20% slots by virtue of 80.0 and 81.5 scores respectively. For technology to earn higher allocation next week, either credit stress would need to ease (adding 6-7 points immediately) or the category's relative strength would need to flip positive to SPY, signaling that risk appetite is genuinely returning. As it stands, XLK is a hold rather than a buy—a placeholder for capital that will rotate toward more attractive risk-adjusted opportunities the moment the macro conditions shift.
AI — SMH
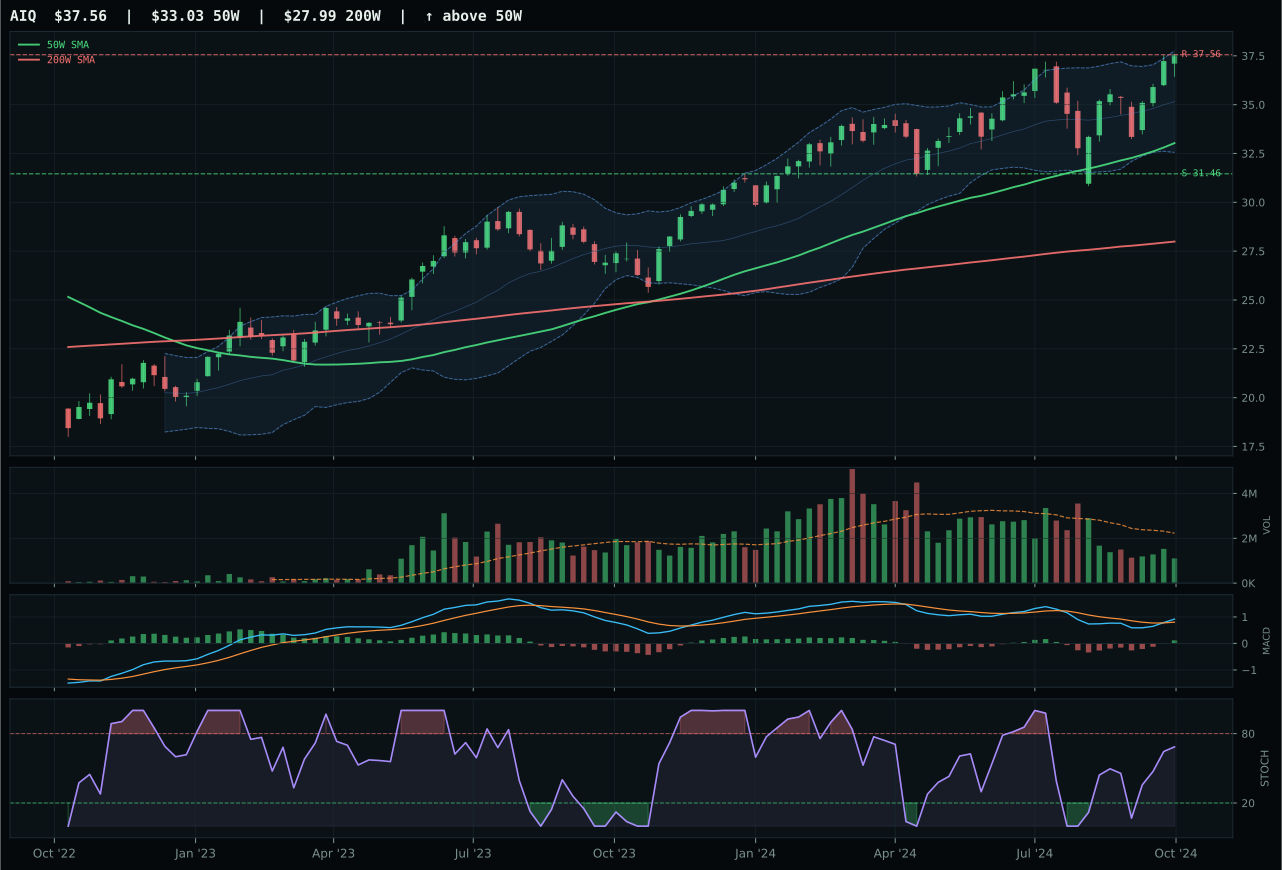
AIQ has a neutral structure profile with -1.4% 13-week relative strength versus SPY.
A failed hold above support would weaken the setup.
Actionable but governed by invalidation levels.
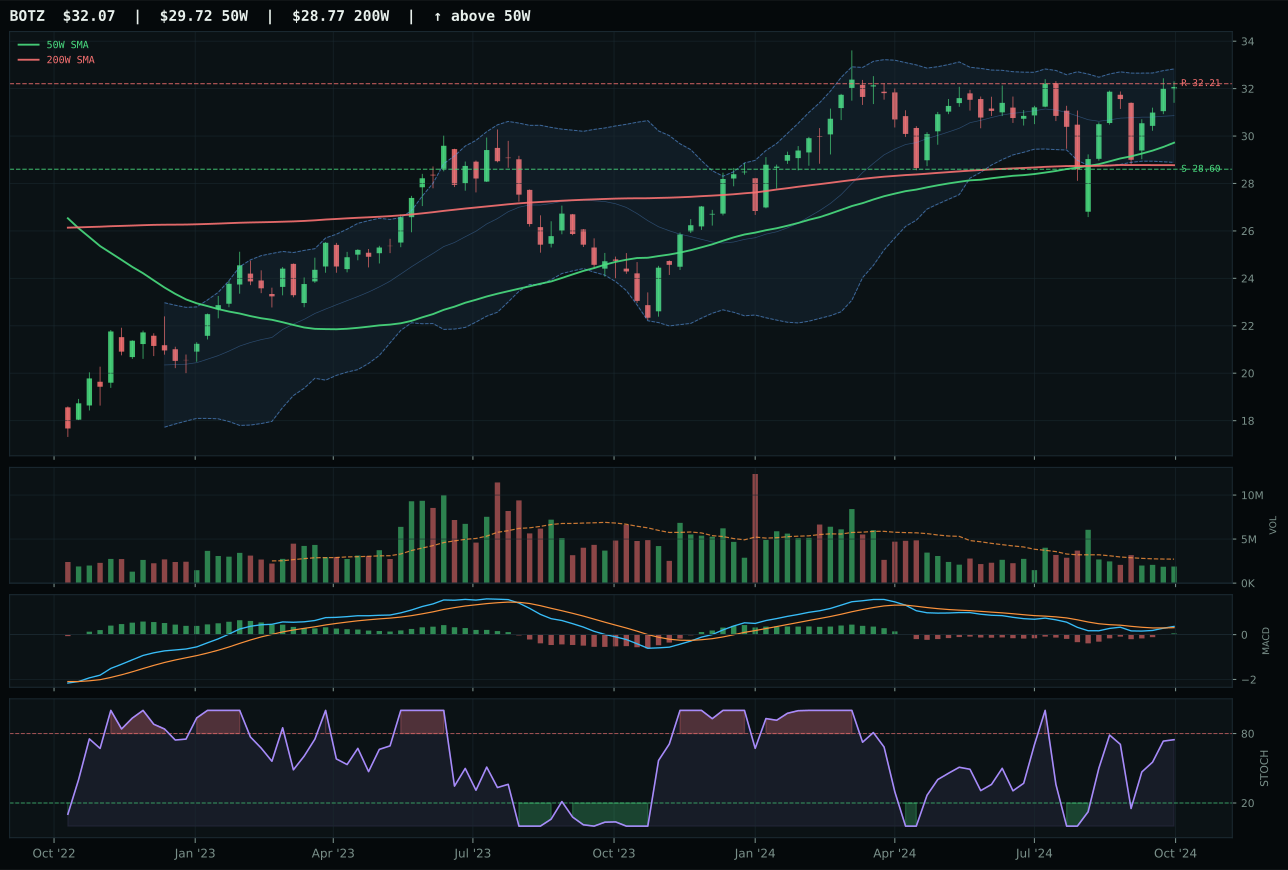
BOTZ has a neutral structure profile with -0.6% 13-week relative strength versus SPY.
A failed hold above support would weaken the setup.
Actionable but governed by invalidation levels.
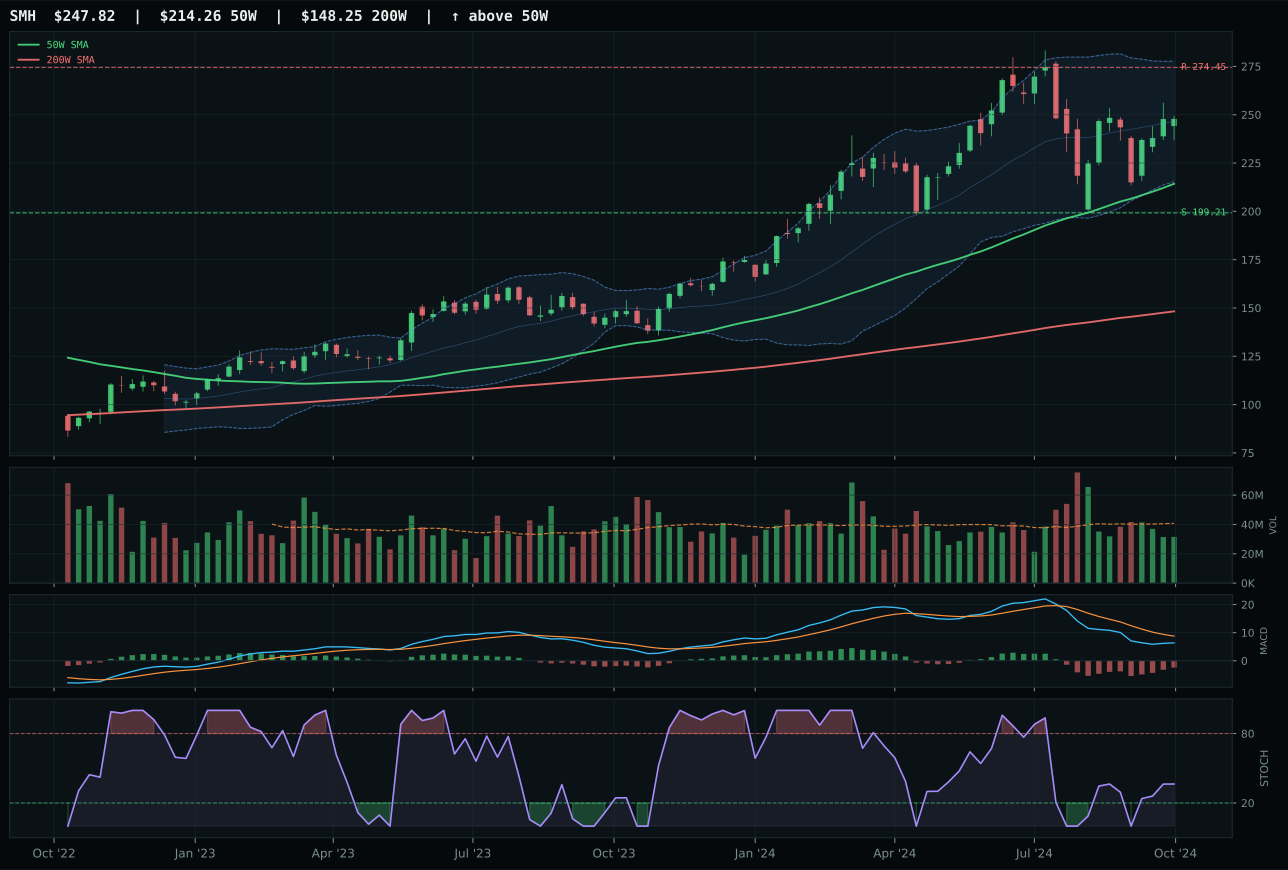
SMH has a vertical extension profile with -11.4% 13-week relative strength versus SPY.
A failed hold above support would weaken the setup.
Actionable but governed by invalidation levels.
SMH won a weak category by refusing to chase momentum despite being extended 15.7% above the 50W, where most AI crowding lives. Volume at 0.78x the 20W (neutral participation) beats AIQ's thin participation—the only material technical difference between a 42.5/100 technical ETF and a 71.4/100 one. Price sits near Fib 0.236 in the upper retracement zone; MACD is bearish but improving; stochastic RSI is rising mid-zone at 0.36. The momentum divergence is sharp: 4W return of 15.3% versus 13W return of -8.1% and category-relative weakness of -10.1% tells the entire story of this cycle—late money chasing, but underneath the surface, weak participation and deteriorating longer-term relative strength. AIQ and BOTZ both sport bullish MACD and rising stochastic, superficially stronger setups, but they trade on momentum and thin volume, making them first to break when liquidity tightens.
AI earned only 5% allocation because its 43.0 composite score ranks it outside the top tier, and macro conditions are openly hostile to the category. Liquidity stress is active at -12 points, credit stress at -8, and broad market bear at -8, combining for a 27.0/100 macro fit that is among the worst in the portfolio. The category's technical ETF evidence at 42.5/100 cannot overcome structural headwinds: extended valuations, thin volume, and deteriorating relative strength to SPY all signal that entry risk has moved sharply in the market's favor and away from buyers. For AI to earn 10% or more, the category would need either a credit relief event (which would add 8+ points to macro fit immediately) or a volume-price validation that new institutional money is accumulating on weakness—neither is evident. The current 5% slot is defensive: it provides exposure to the narrative without overweighting a category that is technically and macro-fiscally out of favor.
Agriculture & Livestock — MOO
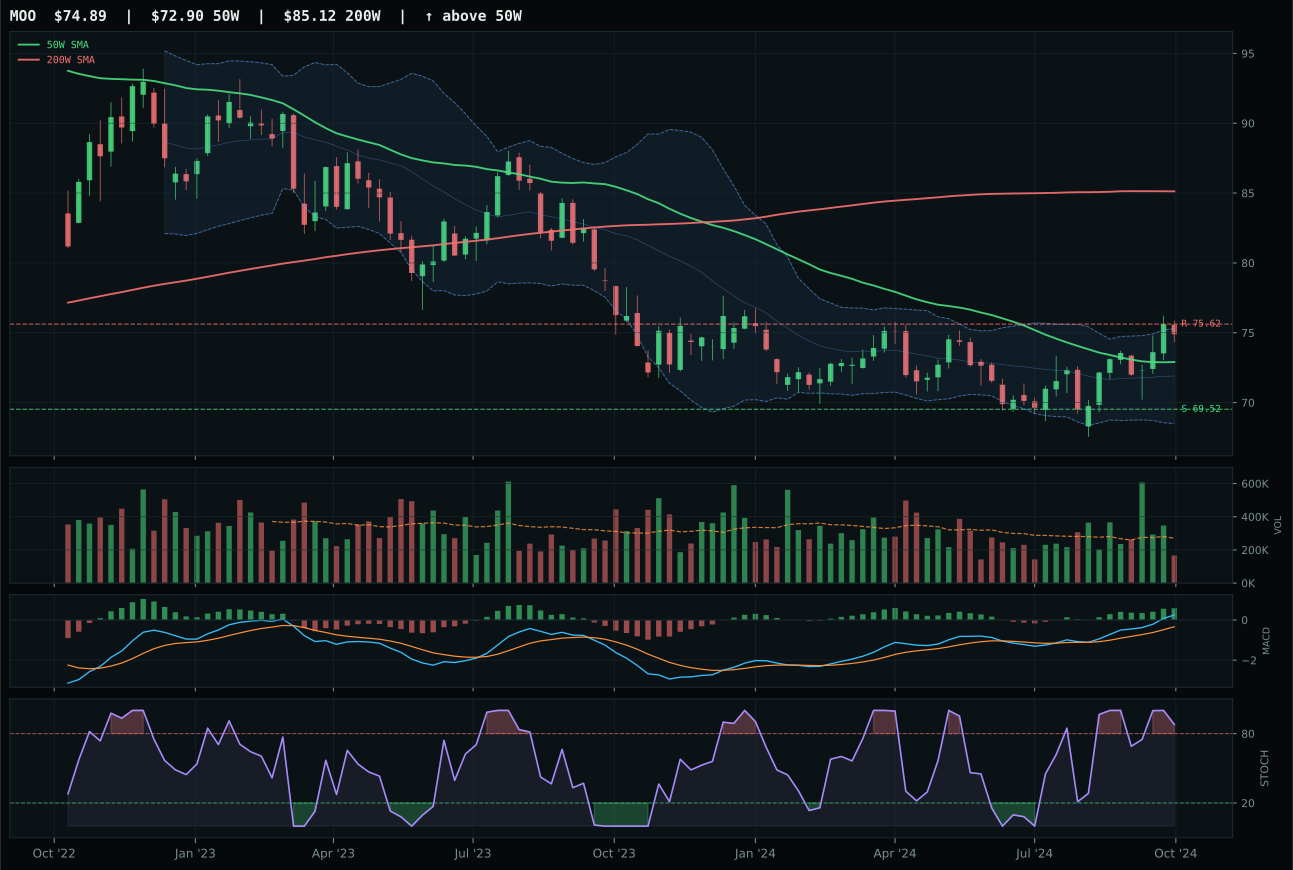
MOO has a compression near 50W profile with 4.2% 13-week relative strength versus SPY.
A failed hold above support would weaken the setup.
Actionable but governed by invalidation levels.
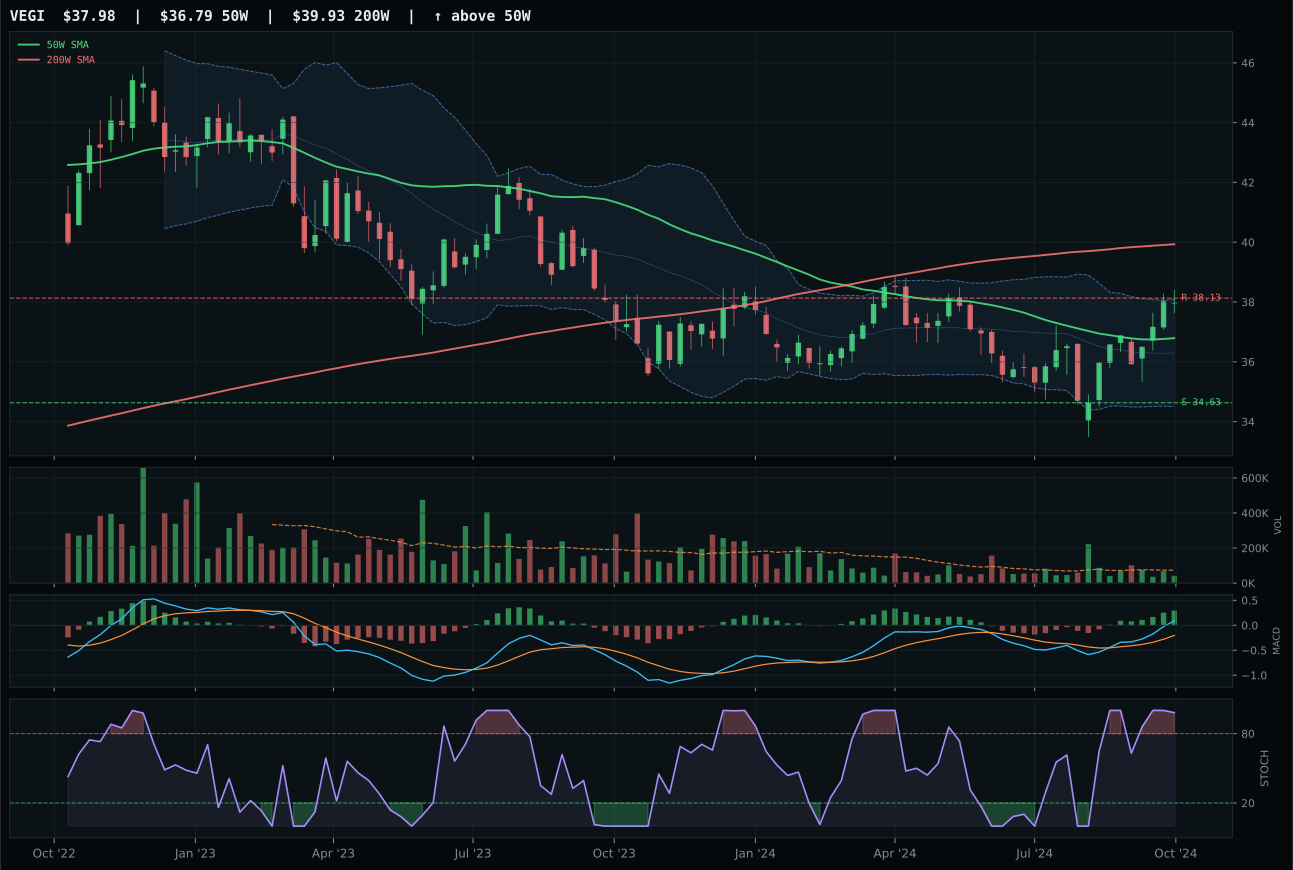
VEGI has a neutral structure profile with 4.3% 13-week relative strength versus SPY.
A failed hold above support would weaken the setup.
Tracked, but not top-2 eligible because: .
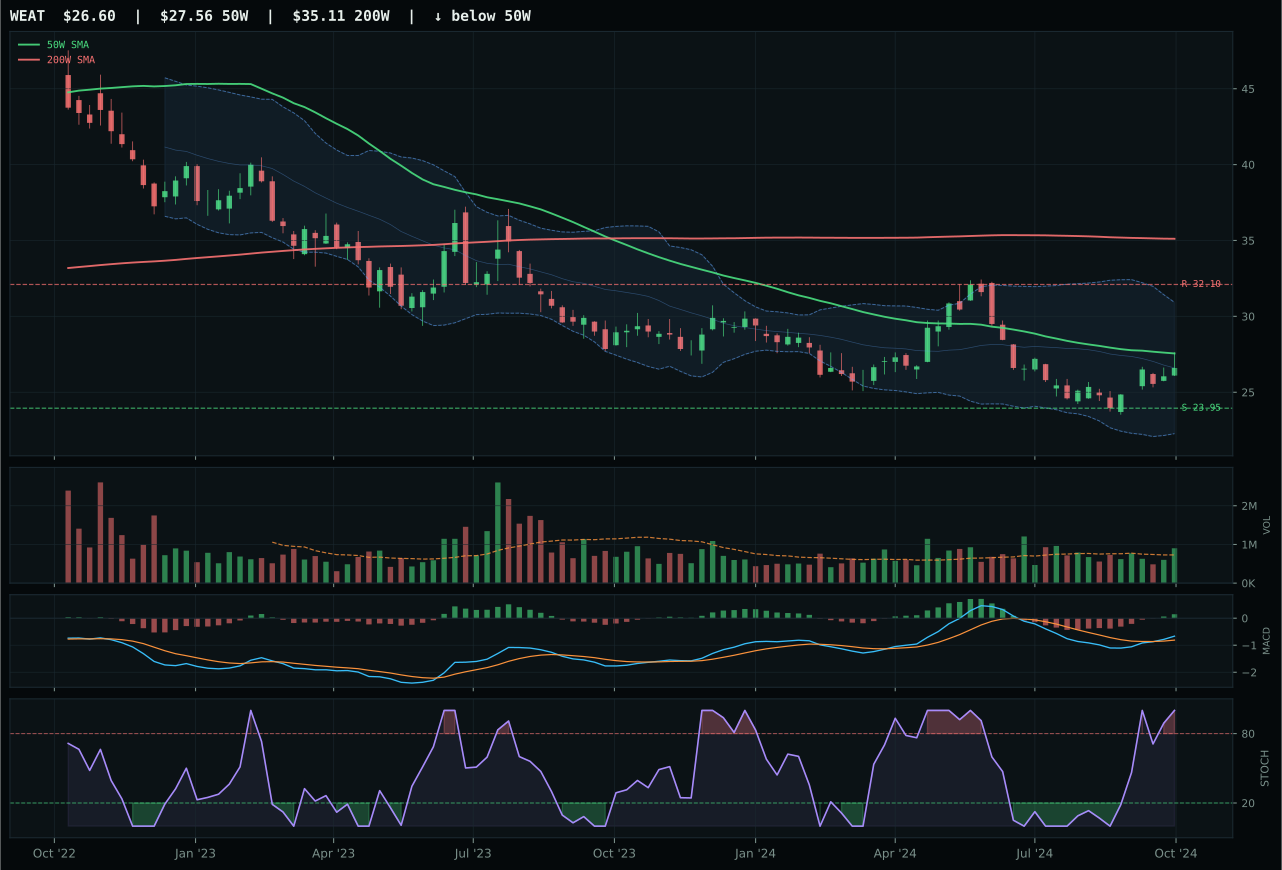
WEAT has a neutral structure profile with -5.5% 13-week relative strength versus SPY.
Extension and support failure are the main tactical risks.
Tracked, but not top-2 eligible because: structurally broken.
MOO won despite being one of the weakest categories overall, claiming the title on timing precision where it undercut VEGI by 10 points. Price is compressed 2.7% from the 50W in a narrow range near support at 69.52, with resistance overhead at 75.62; stochastic RSI is overbought at 0.88 but MACD is bullish and improving, setting up a pause-and-bounce structure rather than breakout or breakdown. The 13W return of 7.6% matches VEGI's exactly, but MOO's neutral structure (versus VEGI's neutral) combined with tighter compression (85.3 vs 75.0) and perfect timing (100.0 vs 90.0) created the narrowest margin of victory in this report. Volume is thin at 0.62x the 20W, which normally penalizes a setup, but in a compressed range near support with improving momentum it actually suggests selective institutional accumulation rather than retail chase. The category-level macro fit is only 45.0, dragged down by -8 points of disinflation pressure and -4 points of liquidity stress, making this a technical-driven category where precision matters more than conviction.
Agriculture earned 5% as a lower-conviction holding because the 32.6 composite score reflects a category under genuine macro pressure. Disinflation actively hurts agricultural equities by -6 points, and disinflation pressure is a further -8 point drag; commodity breadth positive adds only 5 points of support. Real asset sponsorship at +8 is the only strong structural bid, and it cannot offset the headwinds from falling inflation expectations that reduce agricultural commodity pricing power. The category ranks 8th or 9th in the 10-category hierarchy, below even Emerging Markets, suggesting that capital would be better deployed elsewhere unless the macro regime pivots toward inflation or stagflation. MOO's holding here is defensive: it provides exposure to agricultural leverage without overcommitting to a cycle that is clearly rolling over. For Agriculture to earn 10%, either commodity breadth would need to accelerate, or disinflation pressure would need to ease—neither is likely in the near term.
Emerging Markets — IEMG
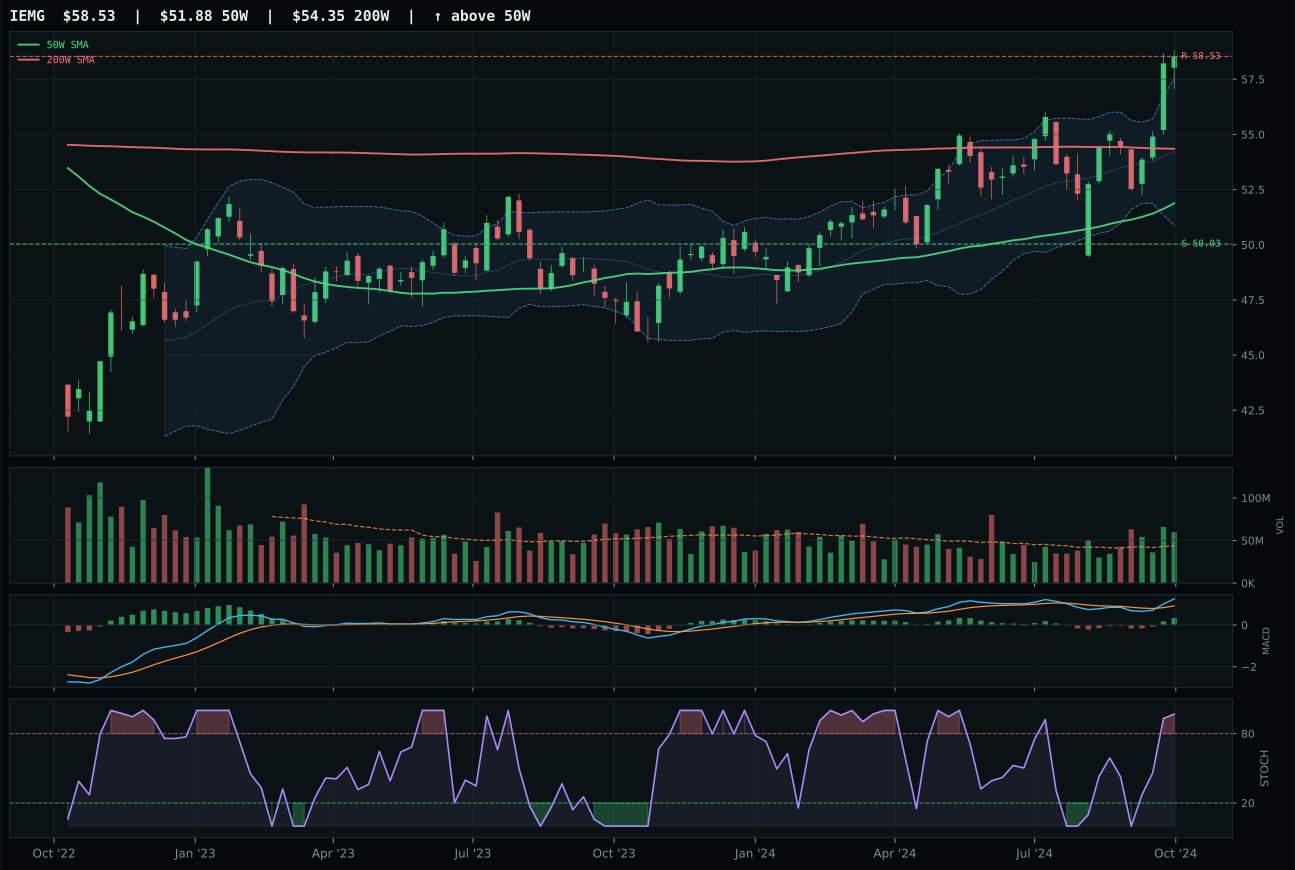
IEMG has a neutral structure profile with 3.5% 13-week relative strength versus SPY.
A failed hold above support would weaken the setup.
Actionable but governed by invalidation levels.
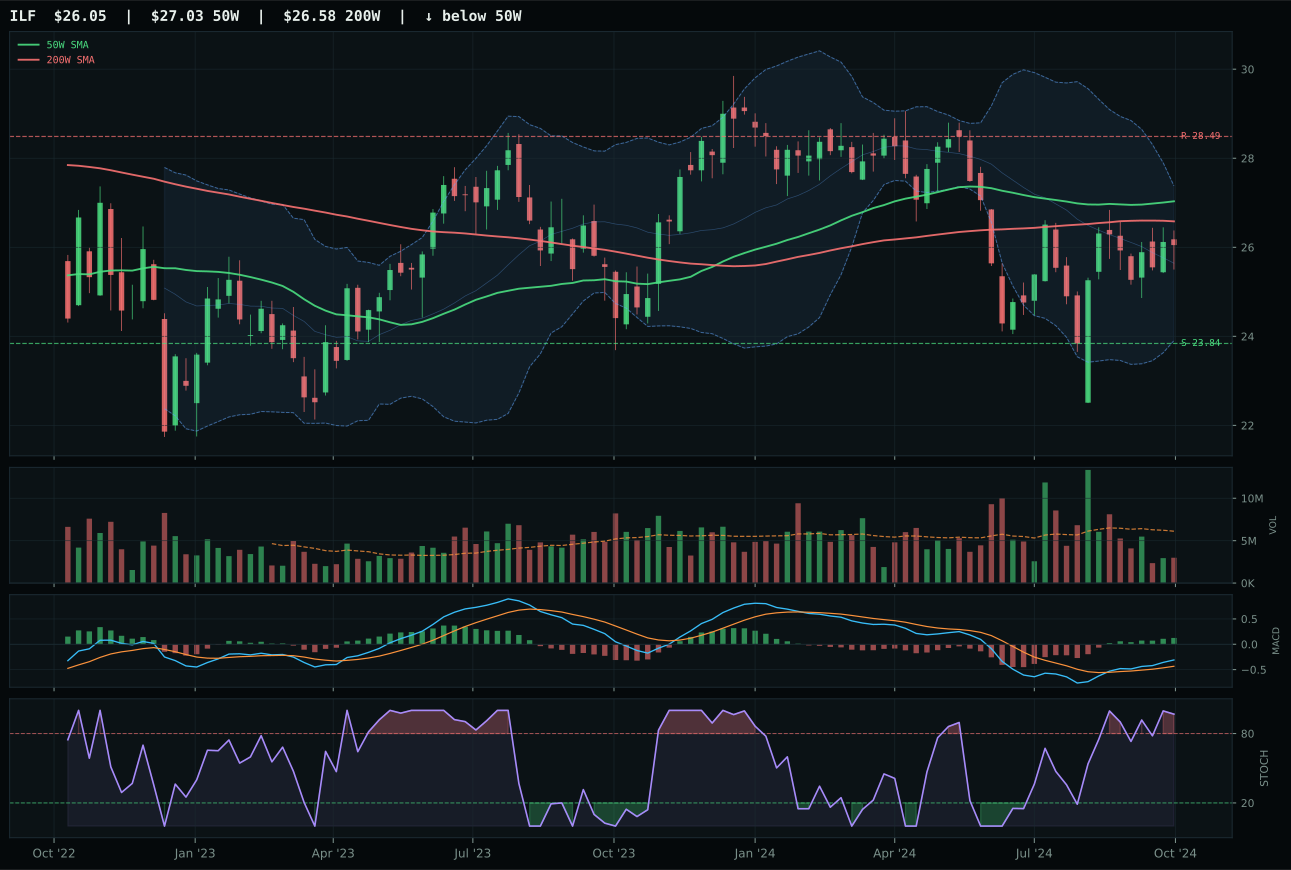
ILF has a neutral structure profile with -0.7% 13-week relative strength versus SPY.
A failed hold above support would weaken the setup.
Actionable but governed by invalidation levels.
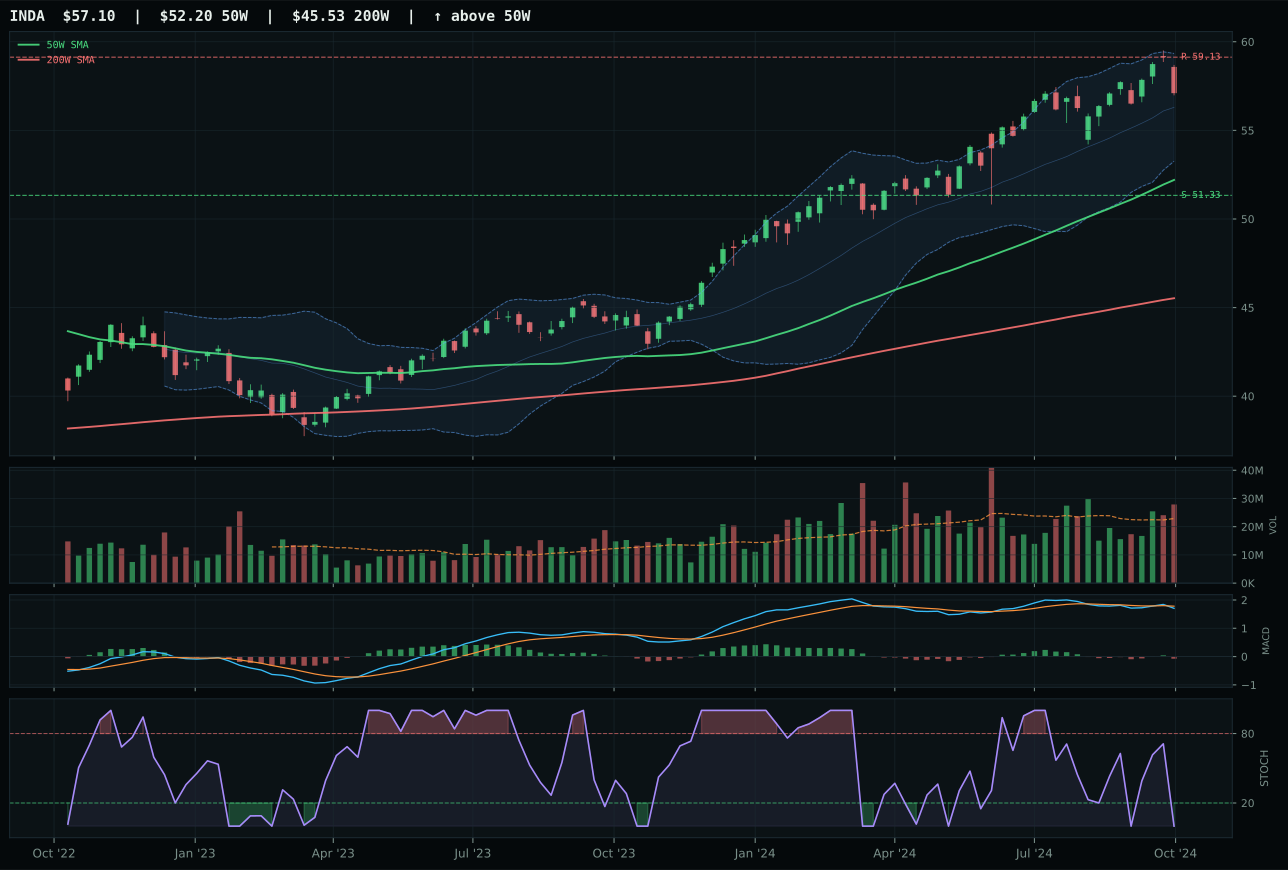
INDA has a neutral structure profile with -2.5% 13-week relative strength versus SPY.
A failed hold above support would weaken the setup.
Actionable but governed by invalidation levels.
IEMG claimed the category over ILF and INDA with a 87.3/100 technical evidence score driven by perfect trend (95.3), clean structure (77.7), and above-average volume (1.36x the 20W) that ILF could not match. Both charts are extended near the 52W high with overbought stochastic momentum, but IEMG's broader emerging-market exposure (versus ILF's concentrated Latin America commodity play) provided volume confirmation that ILF lacked: ILF trades on thin participation (0.62x) while IEMG has above-average institutional backing. Category-relative strength favors IEMG at +4.2% versus ILF at 0.0%, signaling that broad EM is outpacing commodity-weighted EM. The timing score for both is depressed (59.0 for IEMG, 90.0 for ILF) because both are extended, but IEMG's neutral structure and real money volume provide a higher probability that the extension is justified by genuine accumulation rather than mean-reversion chase.
Emerging Markets earned 0% allocation this week despite IEMG's technical strength because the category's 27.0 composite score is among the worst in the portfolio, and macro conditions are fundamentally opposed. Credit stress is active at -10 points and liquidity stress at -10 points, combining with broad market bear at -9 points to create a 21.0/100 macro fit that is hostile and unambiguous. Emerging markets are the first to suffer in a tightening credit environment or liquidity stress, and the regime's active warnings make this category a pariah for capital allocation despite positive technical readings. IEMG's above-average participation and +4.2% category-relative strength prove that contrarian money is accumulating, but they are insufficient to overcome the macro weight. For Emerging Markets to earn 5% or more, credit stress would need to ease (adding 10 points) and broad market bear would need to flip (adding 9 points)—a combined 19-point swing that would elevate the category from worst to middle-tier. Until that inflection occurs, the category remains a zero-weight watch.
Traditional Energy — XLE
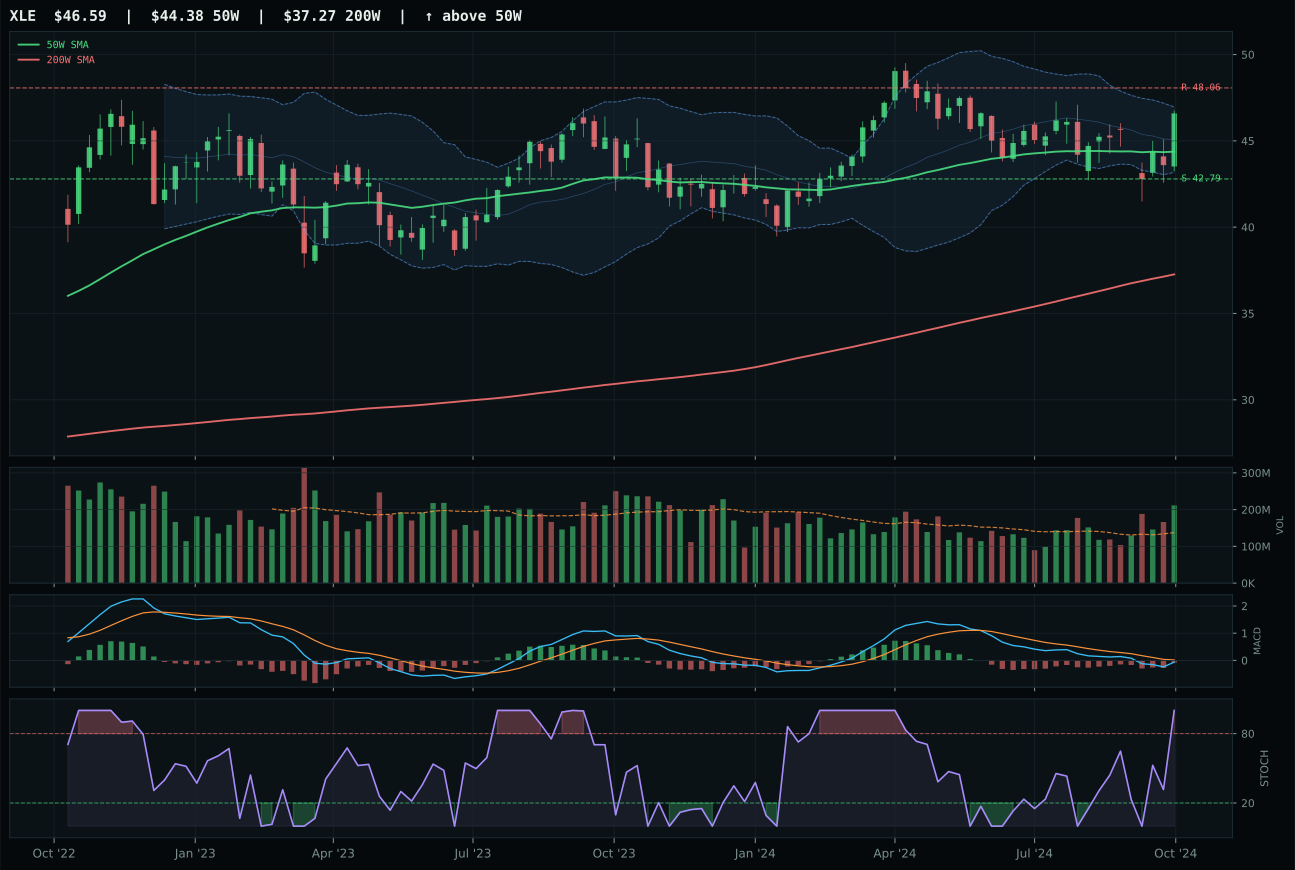
XLE has a neutral structure profile with 0.1% 13-week relative strength versus SPY.
A failed hold above support would weaken the setup.
Actionable but governed by invalidation levels.
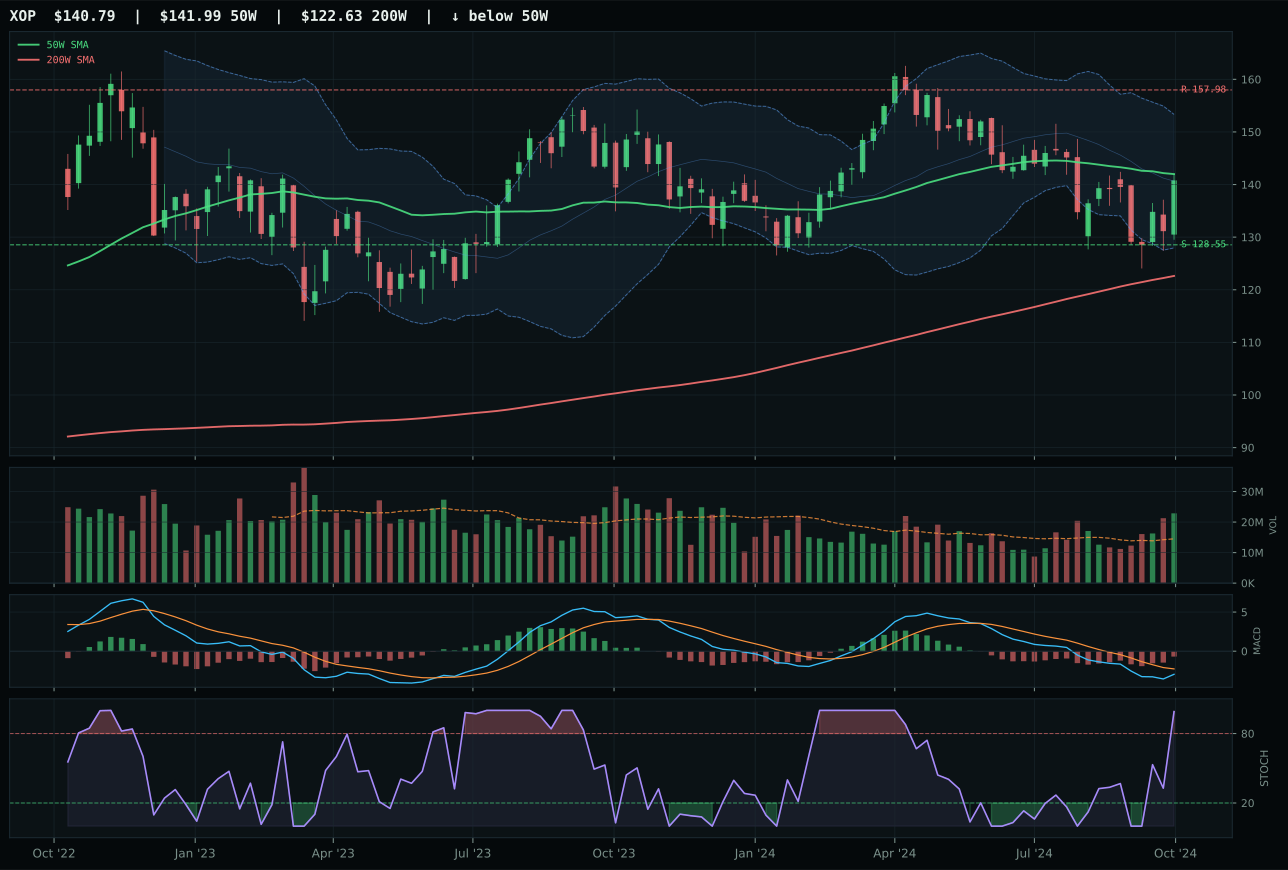
XOP has a compression near 50W profile with -5.5% 13-week relative strength versus SPY.
A failed hold above support would weaken the setup.
Actionable but governed by invalidation levels.
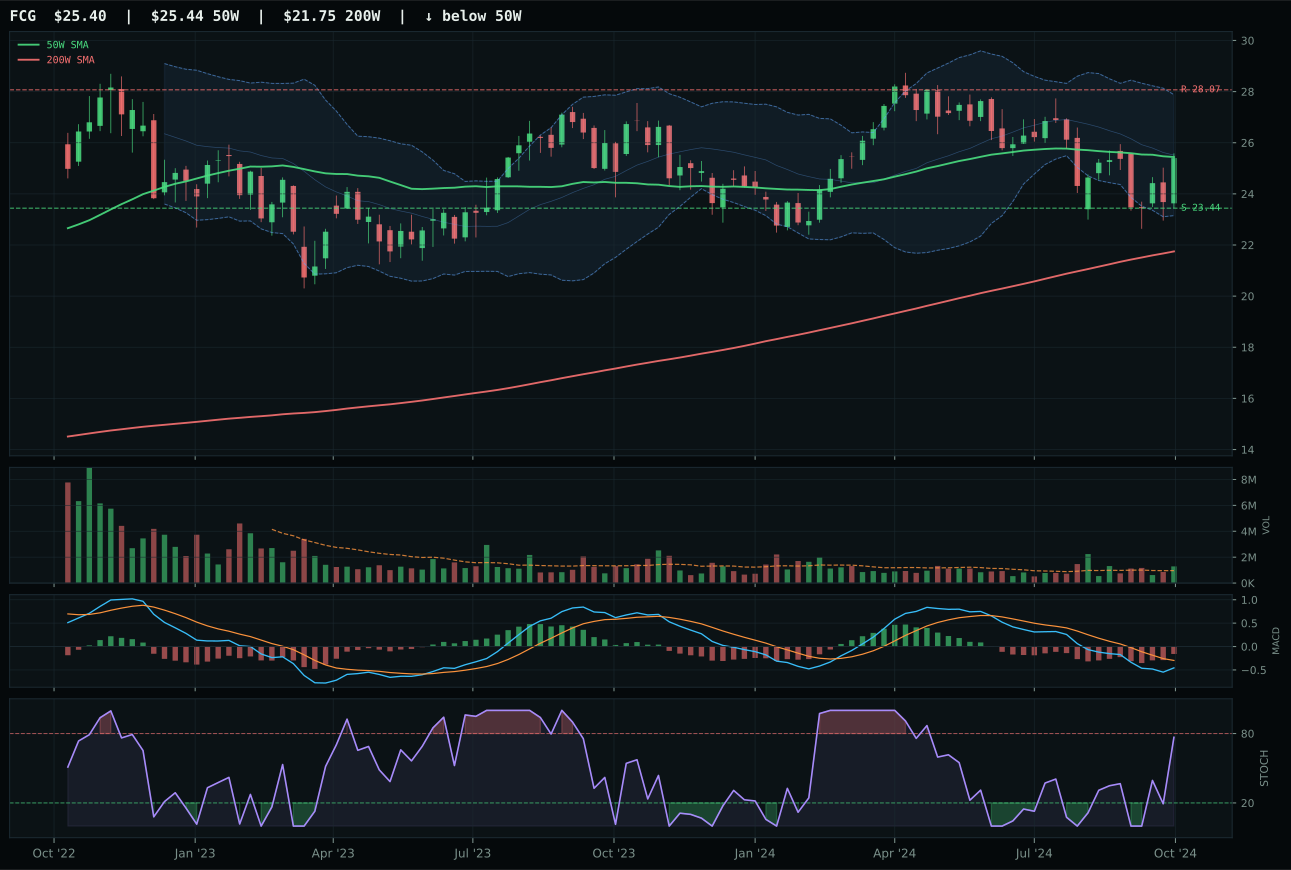
FCG has a compression near 50W profile with -6.4% 13-week relative strength versus SPY.
A failed hold above support would weaken the setup.
Actionable but governed by invalidation levels.
XLE won the category by the narrowest margin (score gap of -1.6 points versus XOP), claiming victory not on technical superiority but on category-relative strength of 5.6% (XOP at 0.0%) despite both having near-identical absolute RS versus SPY (XLE +0.1%, XOP -5.5%). The chart is neutral structure 5.1% from the 50W with accumulation/confirmation volume at 1.54x the 20W; MACD is bearish but improving; stochastic RSI is overbought momentum at 1.00. Critically, XLE's volume-price confirmation registered 87.9/100, the highest in the category, signaling that the institutional buying (evidenced by 1.54x volume) is supporting the price recovery rather than front-running it. XOP's near-52W-low compression and superior technical evidence (79.0 vs 65.9 at the reasoning layer) were offset by worse macro fit (33.0 vs 47.0) and the category-relative weakness that indicates exploration beta is being left behind while integrated energy cash-flow plays like XLE are being accumulated.
Traditional Energy earned 0% allocation despite XLE's solid technical setup because the category's 18.9 composite score is the second-worst in the portfolio, and macro conditions are structurally hostile. Disinflation hurts energy by -10 points, and disinflation pressure is a further -10 point drag; credit stress adds -7 and liquidity stress adds -7 more. The category-level macro fit of 23.0/100 is among the lowest possible, indicating that falling inflation expectations are actively removing the bid from crude-related equities. Real asset sponsorship at +7 is the only meaningful support, but it is overwhelmed by the disinflation headwinds that define the current regime. Even XLE's respectable volume-price confirmation cannot justify capital allocation when nine other categories offer superior risk-adjusted returns. For Traditional Energy to earn 5% or more, the portfolio would need to see either inflation reaccelerate (shifting disinflation pressure to positive) or credit stress ease materially—neither is imminent, making this category a zero-weight hold for now.